2020 - Equinor
66
Sustainability Report 20 20
Transcript of 2020 - Equinor
Sustainability Report 2020
Equinor Sustainability Report 2020 2
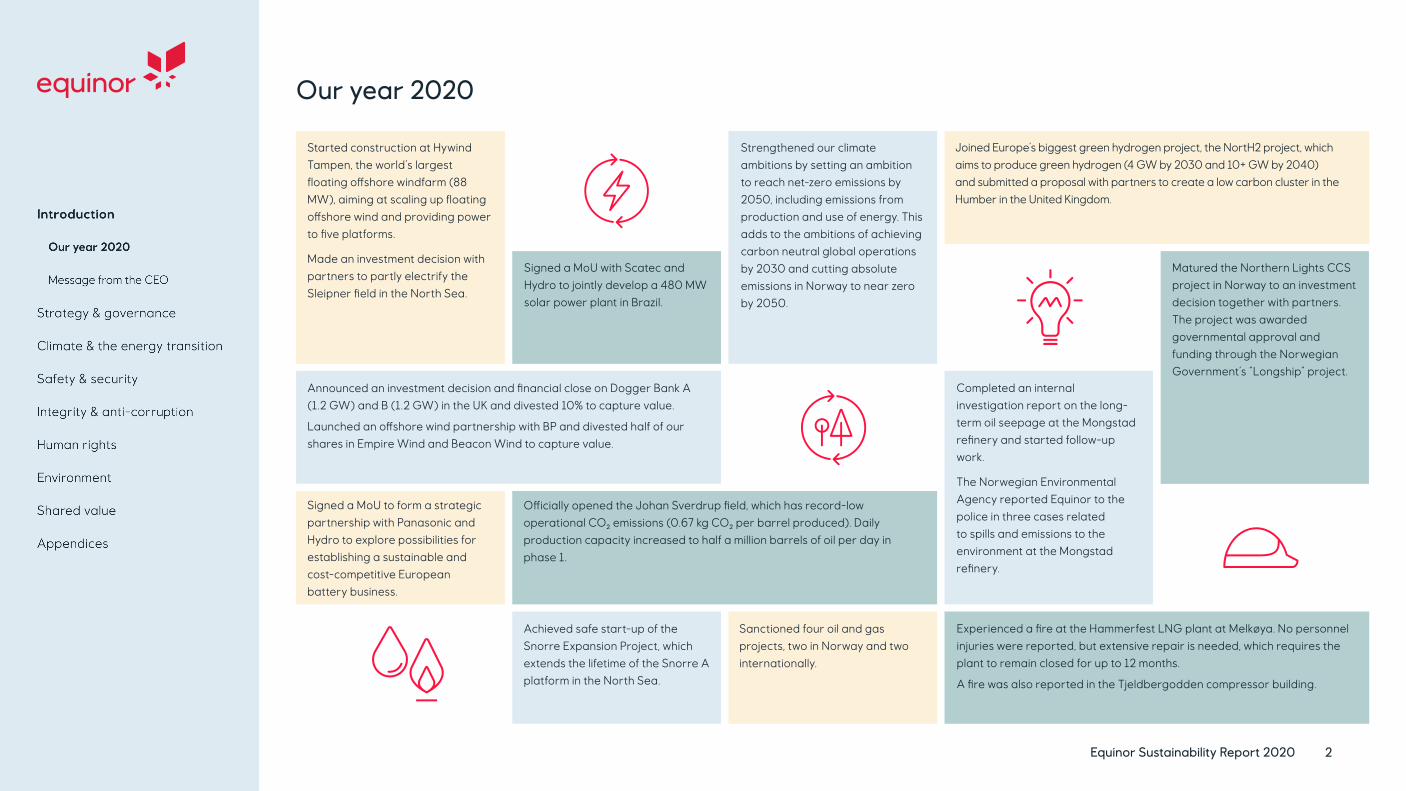
Our year 2020
Achieved safe start-up of the Snorre Expansion Project, which extends the lifetime of the Snorre A platform in the North Sea.
Officially opened the Johan Sverdrup field, which has record-low operational CO₂ emissions (0.67 kg CO₂ per barrel produced). Daily production capacity increased to half a million barrels of oil per day in phase 1.
Signed a MoU with Scatec and Hydro to jointly develop a 480 MW solar power plant in Brazil.
Sanctioned four oil and gas projects, two in Norway and two internationally.
Matured the Northern Lights CCS project in Norway to an investment decision together with partners. The project was awarded governmental approval and funding through the Norwegian Government’s “Longship” project.
Announced an investment decision and financial close on Dogger Bank A (1.2 GW) and B (1.2 GW) in the UK and divested 10% to capture value.
Launched an offshore wind partnership with BP and divested half of our shares in Empire Wind and Beacon Wind to capture value.
Strengthened our climate ambitions by setting an ambition to reach net-zero emissions by 2050, including emissions from production and use of energy. This adds to the ambitions of achieving carbon neutral global operations by 2030 and cutting absolute emissions in Norway to near zero by 2050.
Experienced a fire at the Hammerfest LNG plant at Melkøya. No personnel injuries were reported, but extensive repair is needed, which requires the plant to remain closed for up to 12 months.
A fire was also reported in the Tjeldbergodden compressor building.
Started construction at Hywind Tampen, the world’s largest floating offshore windfarm (88 MW), aiming at scaling up floating offshore wind and providing power to five platforms.
Made an investment decision with partners to partly electrify the Sleipner field in the North Sea.
Signed a MoU to form a strategic partnership with Panasonic and Hydro to explore possibilities for establishing a sustainable and cost-competitive European battery business.
Completed an internal investigation report on the long-term oil seepage at the Mongstad refinery and started follow-up work.
The Norwegian Environmental Agency reported Equinor to the police in three cases related to spills and emissions to the environment at the Mongstad refinery.
Joined Europe’s biggest green hydrogen project, the NortH2 project, which aims to produce green hydrogen (4 GW by 2030 and 10+ GW by 2040) and submitted a proposal with partners to create a low carbon cluster in the Humber in the United Kingdom.

Equinor Sustainability Report 2020 3
Message from the CEO
Dear stakeholder.
Equinor has set clear ambitions for the future. We aim to be a leader in the energy transition by building the energy industry of tomorrow and becoming a net-zero company. We are developing as a broad energy company founded on a strong commitment to sustainability and by delivering on our strategy – always safe, high value and low carbon.
Society has to move faster towards net-zero emissions, and we aim to be a committed partner on that journey. Early last year, we outlined our climate roadmap and set new ambitions. We are on track to achieve carbon neutral global operations by 2030, and in line with the Paris Agreement we have worked our ambitions further. By 2050, Equinor aims to be a net-zero company – including emissions from the use of the energy we provide.
We will reduce emissions from our own oil and gas production, accelerate growth within renewables and develop markets for hydrogen, carbon capture and storage. This is good for the climate and a solid business strategy that ensures competitiveness and drives change towards a future that will have to be net zero. It sets a clear strategic direction and demonstrates Equinor’s continued commitment to long-term value creation in line with the Paris Agreement. Equinor wants to be a leading company in the energy transition, and these ambitions set us at the forefront.
Ensuring safety and security of everyone working in and for Equinor, is a prerequisite for everything we do. We have seen improvements in important areas, especially
the reduced number of personnel injuries. However, we still have challenges. During the second half of 2020, we experienced serious oil and gas leakages and fires at some of our onshore plants. We take these incidents very seriously and are investigating them and implementing mitigating actions. They are stark reminders of the need to further improve safety, and the continuous and necessary work required to prevent major accidents.
2020 was an extraordinary year. It was a challenging and tough time for us all, for some more than others. The Covid-19 pandemic overshadowed everything in our societies and influenced much of our work. This is why we took, and continue to take, measures to reduce the spread of the virus to keep our people safe. Moreover, the pandemic had, and still has, a significant impact on our markets. The demand for oil and gas decreased and we saw unprecedented market conditions and uncertainties in the first half of 2020.
Despite the pandemic, we have managed to conduct our business – at sea and on land. The organisation is adapting to new routines both on our installations and while working from home. I am impressed by the way our employees, leaders and suppliers continue to manage the current circumstances.
Our actions will continue to be inspired and guided by the United Nations Sustainable Development Goals. We have also integrated human rights more concretely into the way we work by strengthening our corporate policy, delivering
more rigorous training for our employees, suppliers and partners and by further integrating human rights due diligence in our work processes.
We are preparing for a future that will be different. Where the need for energy will be as high as ever, but with far lower emissions. Equinor aims to stand out as one of the companies that shaped that future. Guided by our purpose: To turn natural resources into energy for people and progress for society, we want to be a leader in the energy transition developing the energy industry of tomorrow.
Anders OpedalPresident and Chief Executive Officer

Equinor Sustainability Report 2020 4
Strategy & governance Both the content and structure of this report reflects our most material sustainability impacts across the value
chain, and the sustainability topics that were most significant to us and our stakeholders in 2020.
When assessing materiality, we consider the global sustainability context, transparency and relevant reporting standards. We have evaluated our impacts across our own activities and business relationships. These include actual and potential, positive and negative impacts on people, including human rights, the environment and the economy. These are described on page 5 and illustrated on page 7.
Relevant sustainability standards and reporting frameworks have informed our assessment, such as the GRI Standards (including the draft Oil and Gas Sector Standard), the Recommendations of the Task Force on Climate-related Financial Disclosures and the UN Global Compact. The Paris Agreement and the United Nations Sustainable Development Goals are key external frameworks which we respond to.
We engage stakeholders in continuous dialogue throughout the year to help inform our content selection process. Stakeholders are consulted both directly and indirectly, and we strive to remove potential barriers (language, social and geographical) when interacting. The Chair of the Board of Directors, the CEO and other senior managers, amongst others, engage in stakeholder dialogue. Key stakeholder groups include employees, shareholders, governments, regulators, business partners and suppliers, customers, local communities, academia, non-governmental organisations and society at large. Regular dialogue, media analysis, investor meetings and other outreach to key stakeholders on sustainability topics, have helped capture the stakeholder views and concerns most relevant for this report. Throughout 2020, we have engaged in dialogue with the investor group Climate Action 100+ on Equinor’s climate ambitions and strategy. Our policy expectations and a joint statement with Climate Action 100+ can be found on our website.
To give independent perspectives on our activities, we have invited some stakeholders to share their views on our activities as “External voices” which feature throughout this report. These individuals represent a variety of backgrounds, disciplines and geographical areas. The views expressed are those of the individual and do not represent views by Equinor. The contributors are not remunerated.
This year, we present our material topics in a slightly more detailed way, however the most material topics remain the same. Some of the topics are overlapping, but the totality of our 18 material topics represent Equinor’s most important sustainability impacts and focus areas.
Material topics and stakeholder dialogue

Equinor Sustainability Report 2020 5
Material topic Impact Related quantitative figure 2020Selected SDGs
Impact on SDGs
Ensuring responsible operations
Health and safety, incl. emergency response Total recordable injury frequency (TRIF): 2,3
SDG 8
• Providing good work places with safety as our priority
• Potential safety incidentsSecurityPercentage of security personnel who have received formal training in the organisations human rights policies: 85
Integrity and anti-corruption Cases reported to public ethics helpline: 183 SDG 17
• Supporting initiatitves to promote transparency and anti-corruption, e.g. UN Global Compact and the EITI
• Transparent reporting of payments to governments
• Exposure to integrity risks
Human rights in the supply chain Supplier human rights (HR) verifications conducted: 37
SDG 8
• Promoting respect for human rights related to our operations and in our supply chain
• Exposure to human rights risks related to our activities and supply chain
Human rights in communitiesCountries in which supplier HR verifications undertaken: 9Investment agreements and contracts including human rights clauses or screening (no.): 33
Protecting the environment
Biodiversity, oceans & sensitive areasOperations inside and adjacent to protected areas: 0 and 12
Regular discharges of oil to water: 1,300 tonnes SDG 14
• Managing environmental impacts and promoting sustainable ocean management
• Risk of potential spills and pollution of air or water
• Potential noise impacts on marine lifeAir emissions, water and waste
Nitrogen oxides emissions (NOx): 36,000 tonnes; Hazardous waste generated: 318,000 tonnes; Total freshwater withdrawal: 8 million m³; Share of production in areas of high water stress: 0%
Creating shared value
Economic impact (direct and indirect) Purchase of goods and services: 16.1 billion USD
SDG 8
• Provide energy
• Economic impact through taxes, jobs, supply chain and local content
• Supporting STEM education
• Promoting diversity and inclusion in our workforce
Local community impact Share of procurement spend locally: 89%
Diversity and inclusionEarnings ratio (women:men): 98%; Women in Corporate Executive Committee, Business Areas and Business Clusters (share of total): 47%
Employment and skills developmentEmployee hours worked: 38.9 million hours; Contractor hours worked: 84.9 million hours; Average hours of training for employees: 17.4
SDG 4 and SDG 8
Building a low-carbon
advantage
Climate risk and resilience NPV effect of IEA Sustainable Development Scenario: -22% SDG 13 • Providing energy with significantly lower operational emissions than the industry average
• Investing in renewable energy and low carbon solutions such as CCS and hydrogen, to lower the GHG intensity of energy provided (scope 1, 2 and 3)
• GHG emissions from operations, supply chain and use of our products
• Working with suppliers to reduce emissions from supply chain, and maritime operations in particular
• Policy engagement to support the goals of the Paris Agreement
GHG emissions scope 1 & 2 GHG emissions scope 1 & 2 (million tonnes CO₂e, scope 2 location based): 13.5
SDG 7
GHG emissions scope 3 250 million tonnes CO₂e (cat. 11, equity basis)
Supply chain emissionsCO₂ emissions from Equinor’s maritime activities (oil tankers, supply vessels, drilling rigs, construction vessels etc.): 4.8 million tonnes
Renewable energy1,662 GWh renewables production (equity basis) 749 MW Renewables installed capacity (operational control)
Low carbon technologies and nature-based solutions
CO₂ emissions captured and stored in reporting year: 1.1 million tonnes
Climate policy engagementNumber of energy and climate associations, where Equinor holds membership, screened for alignment with Equinor’s climate stance: >80
SDG 13
High impact Medium impact Low impact
Our material topics and impact on the Sustainable Development Goals (SDGs)

Equinor Sustainability Report 2020 6
Equinor has activities in more than 30 countries. However, most of our operations take place in our core countries Norway, the United Kingdom, Brazil and the United States.
Our value chain spans from exploration and accessing acreage, through development and production or electricity generation, to transportation, processing and refining. Our products, oil, gas and electricity, are offered to the market through our marketing and trading activities. Globally, we engage with almost 9,000 suppliers. We have around 21,000 employees, of which 85% are based in Norway.
Our operated oil and gas volumes are around 40% larger than our equity-based production. Thus, our Scope 1 CO₂ emissions based on operational control (100%) are larger than our equity-based CO₂ emissions.Midstream emissions equal approximately 32% of our total scope 1 emissions (operational control), while upstream activities make up nearly all remaining emissions. Approximately 87% of Equinor’s scope 1 emissions (operational control) occur in Norway. Our scope 3 emissions reflect our equity-based production volumes, and they do not include scope 3 emissions from volumes owned by the Norwegian State and other third-party volumes. Details are provided in “Sales volumes” in our Annual Report and Form 20-F.
Our value chain and key sustainability impacts
Reporting boundariesAligned with industry practice and regulatory requirements, we report safety and environmental data on operational control (100%) basis, including operations where Equinor is a technical service provider. GHG data is reported both on equity and operational control basis. Economic data are reported based on equity share, and workforce data covers employees in our direct employment. Human rights data is collected from operated and non-operated assets.
For more information about reporting boundaries, see “About the report” in appendices.
Production volumes oil and gas (operated)
1,106 million barrels of oil equivalents (mmboe)
Production volumes oil and gas (equity)
758 million barrels of oil equivalents (mmboe)
Liquid/gas split (equity)
54/46
Renewable energy production (equity)
1,662 GWh
Number of employees
21,245
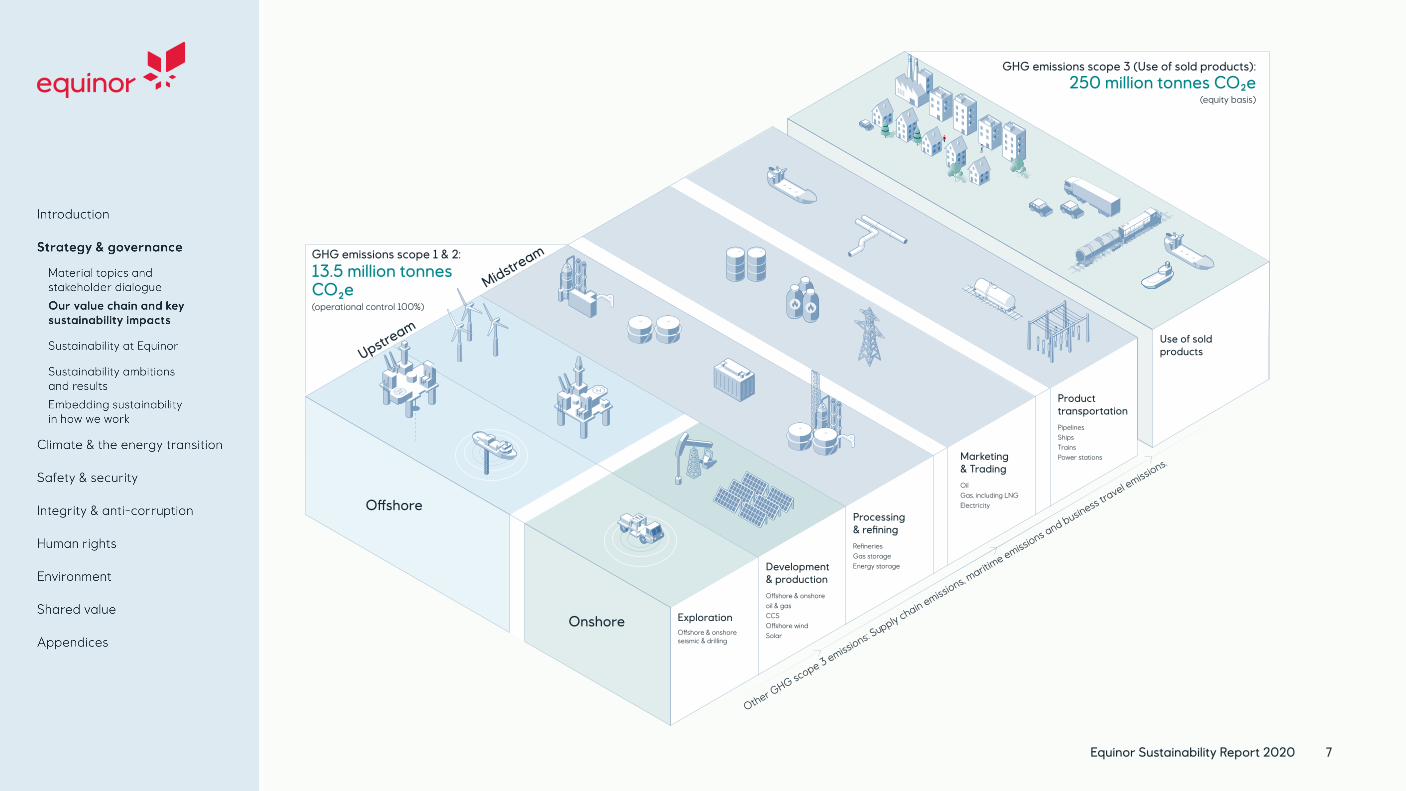
Onshore
O�shore
ExplorationO�shore & onshore seismic & drilling
Development & productionO�shore & onshore oil & gasCCSO�shore windSolar
Processing & refiningRefineriesGas storageEnergy storage
Product transportationPipelinesShipsTrainsPower stations
Marketing & TradingOil Gas, including LNGElectricity
Use of sold products
GHG emissions scope 1 & 2:
13.5 million tonnes CO₂e(operational control 100%)
GHG emissions scope 3 (Use of sold products):250 million tonnes CO₂e
(equity basis)
Other GHG scope 3 emissions: Supply chain emissions, m
aritime emissions and business tra
vel emissions.
Upstream
Midstream
Equinor Sustainability Report 2020 7
Equinor Sustainability Report 2020 8
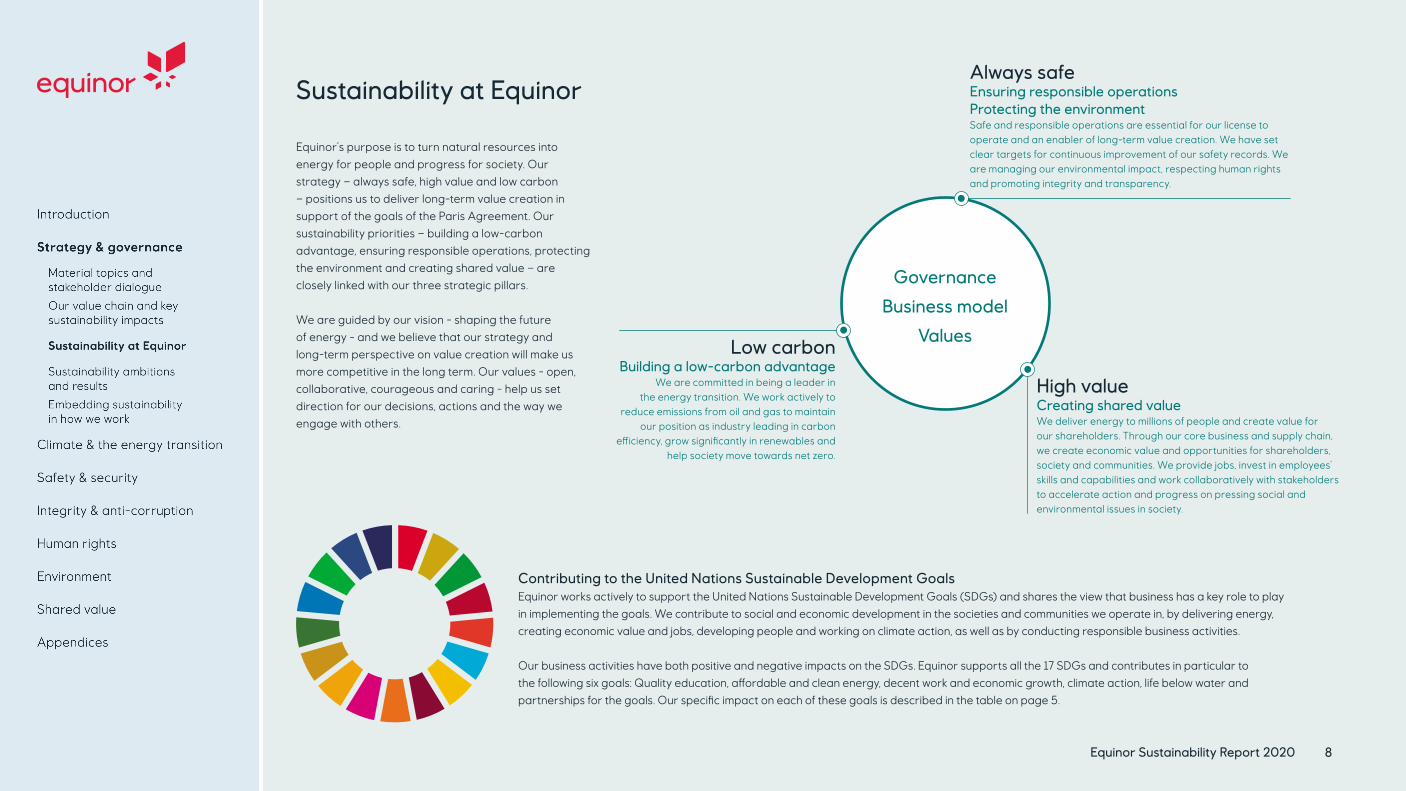
Sustainability at Equinor
Equinor’s purpose is to turn natural resources into energy for people and progress for society. Our strategy – always safe, high value and low carbon – positions us to deliver long-term value creation in support of the goals of the Paris Agreement. Our sustainability priorities – building a low-carbon advantage, ensuring responsible operations, protecting the environment and creating shared value – are closely linked with our three strategic pillars.
We are guided by our vision - shaping the future of energy - and we believe that our strategy and long-term perspective on value creation will make us more competitive in the long term. Our values - open, collaborative, courageous and caring - help us set direction for our decisions, actions and the way we engage with others.
Governance
Business model
Values
High valueCreating shared valueWe deliver energy to millions of people and create value for our shareholders. Through our core business and supply chain, we create economic value and opportunities for shareholders, society and communities. We provide jobs, invest in employees’ skills and capabilities and work collaboratively with stakeholders to accelerate action and progress on pressing social and environmental issues in society.
Always safeEnsuring responsible operationsProtecting the environment Safe and responsible operations are essential for our license to operate and an enabler of long-term value creation. We have set clear targets for continuous improvement of our safety records. We are managing our environmental impact, respecting human rights and promoting integrity and transparency.
Low carbonBuilding a low-carbon advantage
We are committed in being a leader in the energy transition. We work actively to
reduce emissions from oil and gas to maintain our position as industry leading in carbon
efficiency, grow significantly in renewables and help society move towards net zero.
Contributing to the United Nations Sustainable Development Goals Equinor works actively to support the United Nations Sustainable Development Goals (SDGs) and shares the view that business has a key role to play in implementing the goals. We contribute to social and economic development in the societies and communities we operate in, by delivering energy, creating economic value and jobs, developing people and working on climate action, as well as by conducting responsible business activities.
Our business activities have both positive and negative impacts on the SDGs. Equinor supports all the 17 SDGs and contributes in particular to the following six goals: Quality education, affordable and clean energy, decent work and economic growth, climate action, life below water and partnerships for the goals. Our specific impact on each of these goals is described in the table on page 5.

Equinor Sustainability Report 2020 9
Sustainability agenda Material topics Indicators 2020 2019 Ambition*
Ensuring responsible operations
Health and safety, incl. emergency response
SIF (number per million hours worked) 0.5 0.6 0.4
TRIF (number per million hours worked) 2.3 2.5 2.2
Oil and gas leakages (No.) 11 10 9
SecuritySecurity personnel who have received formal training on human rights policies (%)
85 - -
Integrity and anti-corruption Employees who completed the Code of Conduct course (%) 87 93 95
Human rights in the supply chain Supplier human rights verifications conducted (No.) 37 50 Integrate human rights practices, improve risk management and evolve ambitionsHuman rights in communities
Significant investment agreements and contracts including human rights clauses or screening (No.)
33 -
Protecting the environment
Biodiversity, oceans & sensitive areas Operations inside and adjacent to protected areas (No.) 0 & 12 0 & 8Develop a corporate position on biodiversity
Air emissions, water, waste and discharge Share of production in areas of water scarcity (%) 0 0 -
Creating shared value
Economic impact (direct and indirect) Tax contribution (billion USD) 3.1 8.8 -
Local community impact Share of procurement spend locally (%) 89 85 -
Employment and skills development Average hours of training for employees (No.) 17.4 28.6 -
Diversity and inclusion Diversity and inclusion index (work environment survey score) 37 & 78 35 & 77 55 & 80 by 2025
Building a low-carbon advantage
Climate risk and resilienceImpact of IEA Sustainable Development Scenario vs. EPA 3Q20, on Equinor’s portfolio (NPV impact, %)
-22 -14 -
GHG emissions scope 1 & 2
Upstream CO₂ intensity (kg CO₂/boe) 8.0 9.5 8.0
GHG emissions scope 1 & 2 (million tonnes CO₂e, location based) 13.5 14.9 40% reduction by 2030 in Norway
CH4 intensity (%) 0.03 0.03 Near zero
Flaring intensity (%) 1.7 2.5 0 routine flaring by 2030
GHG emissions scope 3Net carbon intensity (g CO₂e per MJ energy produced) 68 68 0 in 2050
GHG emissions scope 3 (million tonnes CO₂e, cat.11, equity basis) 250 247 Part of net-zero amibition in 2050
Supply chain emissions Maritime emissions (million tonnes CO₂) 4.8 - -50% by 2030 (Norway)
Renewable energy Installed capacity (GW) 0.75 0.75 4-6 by 2026
Low carbon technologies and nature-based solutions
Low carbon and energy efficiency R&D, share of total R&D expenditure (%)
32 20 25
Climate policy engagement Review of industry associations performed Yes Yes Annually
* 2020 ambitions unless stated otherwise. Definitions and boundaries are listed in Appendix.
Sustainability ambitions and results

Equinor Sustainability Report 2020 10
Embedding sustainability in how we work
Our management approachAt Equinor, our approach to sustainability is embedded in how we work. This includes our corporate governance principles, performance and reward framework, risk and impact management and how we work with suppliers and partners. This approach is embedded in our management system.
Governance The Equinor ASA Board of Directors (BoD) and Corporate Executive Committee review, monitor and discuss safety, security and sustainability issues and risks. Sustainability includes climate change, energy transition, human rights, integrity, environmental and social issues. The Chief Executive Officer (CEO) is day-to-day responsible for Equinor’s management actions related to sustainability, including actions related to climate change and the energy transition.
Climate change and the energy transition are discussed in most of the ordinary BoD meetings either as integral parts of strategy and investment discussions or as separate topics. In 2020, as part of establishing a new climate roadmap for Equinor, the BoD participated in a half-day workshop which included climate risk training. In the BoD’s annual evaluation of its own work and competence, climate change capabilities and knowledge were highlighted as key competencies for the BoD going forward.
The BoD members are elected by the corporate assembly. In addition, there are employee-elected representatives as required by Norwegian company law. The board’s composition is diverse in terms of expertise, background and geography
enabling the board to address the company’s strategy, goals and challenges. The BoD members have experience from oil, gas, renewables, shipping, telecom, politics and climate policy.
The BoD has three sub-committees which act as preparatory bodies; the safety, sustainability and ethics committee (SSEC), the compensation and executive development committee (BCC), and the audit committee (BAC).
The SSEC assists the BoD in its supervision of the company’s safety, security, sustainability and ethics policies, systems and principles. This includes quarterly reviews of risk issues and performance (including climate-related risks and performance) and an annual review of the Sustainability report.
The role of the BCC is to assist the BoD in its work on terms and conditions of employment for the CEO, and on the philosophy, principles and strategy for the compensation of leading executives in Equinor. In order to better reflect Equinor’s strategy and the energy transition, the instructions for the BCC were updated in 2020 to include climate and energy transition related goals as part of the remuneration policies.
The BAC’s role is to assist in the exercise of the BoD’s management and control responsibilities and to ensure that the group has an independent and effective external and internal auditing system. As part of this, the committee also supervises the implementation of and compliance with the group’s expectations, commitments and requirements for ethical conduct concerning financial reporting.
Equinor has a separate corporate risk committee chaired by the Chief Financial Officer. The committee meets at least four times per year to give advice and make recommendations on Equinor’s enterprise risk management and risk reporting to the Corporate Executive Committee and the BoD, including on sustainability and climate-related risks.
Group level functions relevant for sustainability include safety and security, sustainability, finance and control, people and leadership and legal. These functions are responsible for setting strategic direction, give advice and report on risk and performance within these topics to the Corporate Executive Committee and the BoD, including relevant committees. The corporate sustainability function is responsible for overseeing climate change (including climate-related risk), environment, social performance and human rights. The corporate safety and security function is responsible for safety, health, work environment and security. The Chief Ethics and Compliance Officer is responsible for business ethics and compliance. The people and leadership function is responsible for our efforts to promote diversity and inclusion.
The business line is accountable for executing the company’s sustainability ambitions and for managing relevant risks and performance. Dedicated safety, security and sustainability staff in the business line is part of company-wide functional networks and provide advice and support to the business line.

Equinor Sustainability Report 2020 11
Performance and reward framework Management of sustainability performance is integrated in strategy, business planning, risk management, decision-making and management follow-up processes.
Safety, security and sustainability management is an integrated part of our management system, which includes our policies, requirements and guidelines for all material topics. Together with our corporate governance principles and performance framework, this forms the basis for how we are embedding these topics in our business activities. The principles and framework are described in the publicly available Equinor book, which is approved by the CEO.
Safety, security and sustainability are embedded into our performance and reward framework. Our performance framework translates our vision, values and strategy into actions and results. We measure progress and results in a holistic way, using key performance indicators when relevant. Performance is evaluated in two dimensions, both by “what” we deliver and “how” we deliver. Business delivery (“what”) and behavior (“how”) are equally weighted when recognising and rewarding individual performance.
For the business delivery dimension, the CEO, his direct reports and Equinor’s broader leadership are assessed based on results within a broad range of topics, including safety, security and sustainability with main focus on our operated portfolio. Climate-related performance is part of the sustainability dimension. In addition, the leaders’ ability to be role models for sustainable development and the energy transition forms part of the holistic evaluation. Within safety, serious incident frequency (SIF), total recordable injury frequency and oil/gas leakages are companywide KPIs. Within sustainability, CO₂ intensity (upstream) is used as the KPI to measure performance related to climate change. The annual bonus for employees is based on
the same holistic assessment of company performance which includes the results within safety, security and sustainability, among other areas. The performance framework is under development to reflect our transition to a broad energy company. A comprehensive set of performance indicators and monitoring reports are made available to all employees in Equinor’s Management Information System.
The effectiveness of our management approach within sustainability is regularly evaluated through performance reviews at several management levels, including the Corporate Executive Committee, the BoD and the BoD’s safety, sustainability and ethics committee, and by corporate and business area staff. The frequency and granularity of the performance reviews varies with materiality, frequency of reporting and management level. Internal and external audits, verifications and self-assessments constitute key assurance elements of our management approach. We conduct internal and external benchmarking and participate in external performance ratings for the same purpose. Concerns related to misconduct can be reported to relevant internal entities or to Equinor’s Ethics Helpline which is available to any individual. Equinor has developed internal requirements for establishing and running effective operational-level community grievance mechanisms. More information is available on Equinor.com.
Risk and impact management Management of sustainability-related risks, including climate-related risks, is embedded in our enterprise risk management process. Risk management in Equinor follows a common, company-wide process based on ISO31000 “Risk management”. This includes requirements, a specific work process and a common reporting tool. We regularly identify, evaluate and manage risks according to this process to create sustainable value and avoid incidents. Our enterprise risk assessment and related actions are reviewed biannually by the Corporate Executive Committee and the BoD.
The impact assessment process informs the overall risk management process in projects and is based on national requirements in the countries we operate, and guidance as set out in international standards such as the International Finance Corporation (IFC) Standards. Disclosure of information and an open dialogue with relevant authorities, potentially affected communities and other stakeholders are key elements in the impact assessment process.
Impact assessment documents and more information about corporate governance are available on our website.
Working with partners and suppliersEquinor has ownership shares in many assets operated by other companies, in the same way as other companies have ownerships in assets we are operating. In our work with and follow up of partner-operated assets we aim to ensure that governance and risk and performance management is compatible with our own requirements and practices. Through the applicable committee structures in the partnerships, we follow up and support the management of risks and performance related to safety, security, ethics, integrity and sustainability including climate- and human rights-related issues.
A significant part of our value chain consists of activities carried out by suppliers working under contracts awarded by Equinor. We require our suppliers to maintain high standards for health, safety, security, anti-corruption and environmental performance, and to have an approach to human rights consistent with the goals of the United Nations Guiding Principles on Business and Human Rights.
For more information see the compensation section in our Annual Report available in the ESG Reporting centre on equinor.com.
Explore more

Climate risk and resilience
GHG emissions scope 1 & 2
GHG emissions scope 3
Supply chain emissions
Renewable energy
Low carbon technologies and nature-based solutions
Climate policy engagement
Equinor Sustainability Report 2020 12
Climate & the energy
transition
The climate challenge
Urgent need for actionClimate change is one of the main challenges of our time and a clear call for action. To avoid an irreversible climate crisis, urgent actions are needed to reduce greenhouse gas emissions from all sectors to help society move towards net zero.
Equinor acknowledges scientific consensus on climate change and supports the goals of the Paris Agreement. We recognise that the world’s energy systems must be transformed in a profound way to drive decarbonisation. At the same time universal access to affordable and clean energy must be ensured, while supporting the United Nations Sustainable Development Goals.
In 2020, Equinor launched a set of new climate ambitions to address the material topics most relevant for us as a broad energy company. Our climate roadmap summarises our ambitions and action plan. It also sets a clear strategic direction and demonstrates Equinor’s commitment to long-term value creation in support of the Paris Agreement.
Material topics | Impact
Equinor Sustainability Report 2020 13
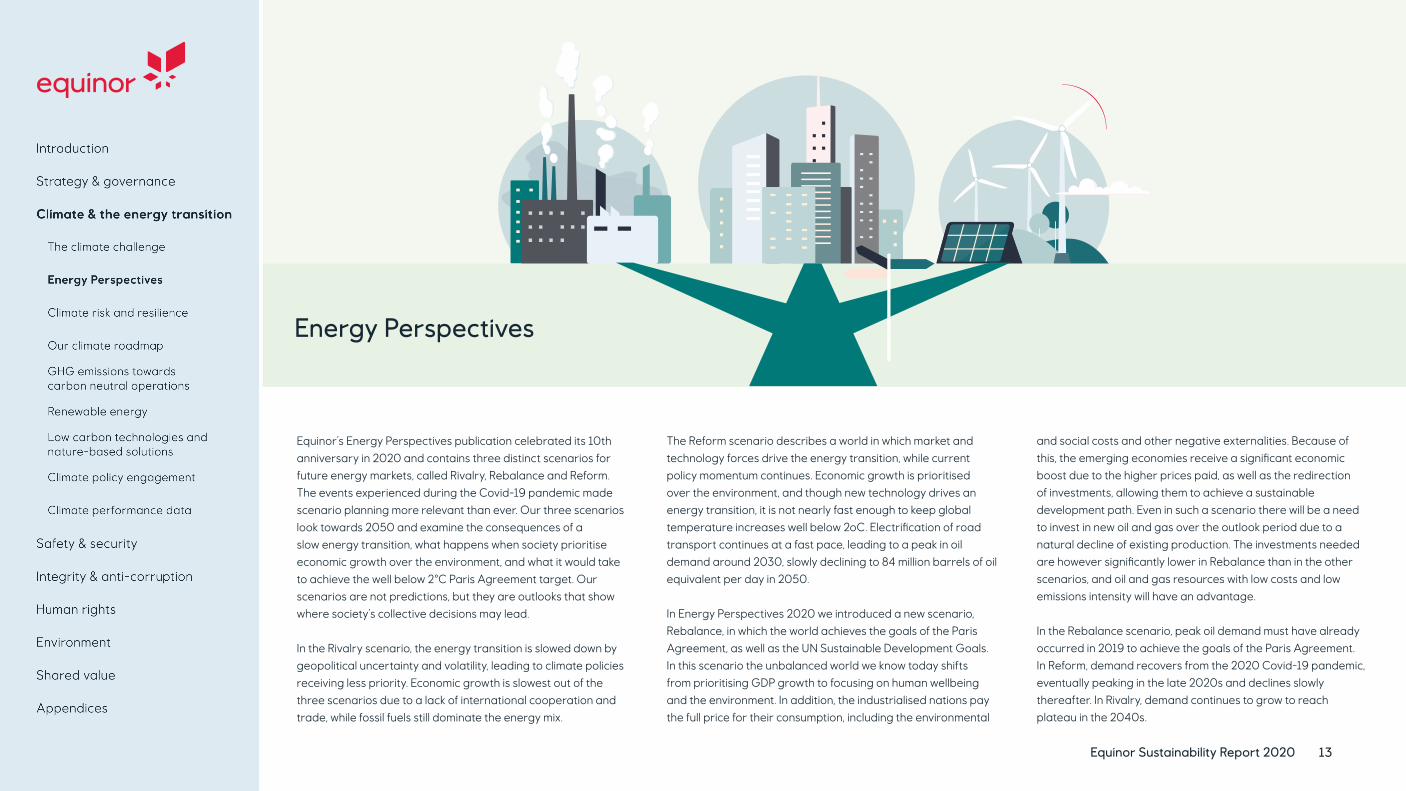
Equinor’s Energy Perspectives publication celebrated its 10th anniversary in 2020 and contains three distinct scenarios for future energy markets, called Rivalry, Rebalance and Reform. The events experienced during the Covid-19 pandemic made scenario planning more relevant than ever. Our three scenarios look towards 2050 and examine the consequences of a slow energy transition, what happens when society prioritise economic growth over the environment, and what it would take to achieve the well below 2°C Paris Agreement target. Our scenarios are not predictions, but they are outlooks that show where society’s collective decisions may lead.
In the Rivalry scenario, the energy transition is slowed down by geopolitical uncertainty and volatility, leading to climate policies receiving less priority. Economic growth is slowest out of the three scenarios due to a lack of international cooperation and trade, while fossil fuels still dominate the energy mix.
The Reform scenario describes a world in which market and technology forces drive the energy transition, while current policy momentum continues. Economic growth is prioritised over the environment, and though new technology drives an energy transition, it is not nearly fast enough to keep global temperature increases well below 2oC. Electrification of road transport continues at a fast pace, leading to a peak in oil demand around 2030, slowly declining to 84 million barrels of oil equivalent per day in 2050.
In Energy Perspectives 2020 we introduced a new scenario, Rebalance, in which the world achieves the goals of the Paris Agreement, as well as the UN Sustainable Development Goals. In this scenario the unbalanced world we know today shifts from prioritising GDP growth to focusing on human wellbeing and the environment. In addition, the industrialised nations pay the full price for their consumption, including the environmental
and social costs and other negative externalities. Because of this, the emerging economies receive a significant economic boost due to the higher prices paid, as well as the redirection of investments, allowing them to achieve a sustainable development path. Even in such a scenario there will be a need to invest in new oil and gas over the outlook period due to a natural decline of existing production. The investments needed are however significantly lower in Rebalance than in the other scenarios, and oil and gas resources with low costs and low emissions intensity will have an advantage.
In the Rebalance scenario, peak oil demand must have already occurred in 2019 to achieve the goals of the Paris Agreement. In Reform, demand recovers from the 2020 Covid-19 pandemic, eventually peaking in the late 2020s and declines slowly thereafter. In Rivalry, demand continues to grow to reach plateau in the 2040s.
Energy Perspectives

Equinor Sustainability Report 2020 14
Climate risk and resilience
Our business needs to be resilient to multiple risks including those posed by climate change. These risks are related to both the energy transition and the physical effects of changes in climate. Equinor assesses both the upside and downside risks and determine how these can influence the company.
The direct effects of climate-related risks are primarily through changes in the demand for our oil, natural gas and electricity production. The impact could be on both volume and price. Another potential effect is increased costs related to mitigating physical changes of climate change. Other elements influencing costs could for example be changes in carbon prices or new specific taxes & fees. More indirect effects are for example, new technologies that could disrupt energy markets over time, or lost business opportunities due to political decisions.
As shown in the International Energy Agency’s (IEA) World Energy Outlook 2020, the range of possible outcomes for future demand of oil, natural gas and electricity is large. In IEA’s Stated Policies scenario, the oil and natural gas demand in 2040 is approximately at the current level while in the Sustainable Development scenario, which is in line with the goals of the Paris Agreement, demand could be reduced by 30% in 2040. The latter scenario and a corresponding price path are main elements when assessing economic impacts of climate-related risks.
Prudent risk management is about being prepared for the future. To do so, a range of possible outcomes including a series of corresponding likelihood must be considered. To assess and manage climate-related risks we use internal carbon pricing, scenario analysis, and sensitivity analysis. These risks are embedded into Equinor’s enterprise risk management process. We monitor technology developments and changes in policies and regulations, and we assess how these might impact the demand for oil, gas and renewable energy, as well as the cost of developing new assets and opportunities for low carbon technologies.Climate risk adjusting actions are evaluated, decided on, and implemented where relevant. Some of the actions, such as break-even requirements, will be important if a Sustainable Development scenario materialises. Diversifying our portfolio so that we see an increased share in electricity production through wind and solar investments, and further development of opportunities in hydrogen and CCS are examples of relevant actions we are taking. An overview of relevant risk factors and how we manage these, is provided below.
Sources of change
Climate related risks and risk factors (upside and downside potential)
Management actions
Market
• Oil and gas demand
• Renewable energy demand
• Scenario analysis and sensitivity testing
• Climate-related principles in investment decisions and break-even hurdle rates
• Scaling up investments in profitable renewables and low carbon solutions
• Cost reduction initiatives
Policy and regulatory
• Carbon costs and taxes
• Specific regulations (e.g. air quality, emission standards and fuel directives)
• The EU Taxonomy
• Monitor policy and regulatory development
• Internal carbon price applied
• Portfolio sensitivity test
• Emission reduction measures
Technology
• Electrification of transport and heating/cooking
• Decarbonisation of industries
• Renewable energy and battery technology
• CCS, hydrogen and other low carbon technologies
• Digitalisation
• Energy efficiency
• Scaling up investments in profitable renewables and low carbon solutions
• Strengthening low carbon R&D
• Venture funds
• Digitalisation roadmap
• Emission reduction measures
Physical• Chronical effects (e.g. sea water rise, increased
scarcity of water)
• Acute effects (e.g. more frequent extreme weather events)
• Regular updates of meteorology and oceanography data used in project and operational planning
Reputational
• Talent attraction and retention
• Investors’ perception of oil, gas and renewables investments
• Climate-related litigations
• License to operate
• Transparency and disclosures of performance, governance and ambitions
• External engagement and communication
Equinor Sustainability Report 2020 15
Investment criteria and capital allocation To ensure that we have a robust portfolio, we address climate-related risk in our decision making. Scenario analysis informs our economic planning assumptions and break-even targets, and an internal CO₂ price helps us assess the robustness of investment proposals.
Evaluation processDespite the significant uncertainty of future oil and gas demand, supply and prices, our financial framework aims to ensure that projects and assets continue to generate cash flow in low-price scenarios.
When a project is sanctioned, it is assessed on multiple criteria:
• Net present value: We assess value creation for the company and our shareholders.
• Break-even price: We use a break-even target at the time of investment decision for all oil and gas projects. If the project has a break-even higher than the target, it will normally not be sanctioned. In fact, we have several examples of not sanctioning projects with a break-even price higher than the target. In 2020, this break-even target was even lower for projects with a shorter time horizon, as a response to lower short-term future price expectations.
• CO₂ intensity: All oil and gas projects are measured on scope 1 CO₂ intensity (upstream). Our focus on CO₂ intensity means that we are one of the companies with the lowest CO₂ intensities on scope 1 emissions in the industry.
• Carbon pricing: In areas with no or low carbon price, we apply an internal carbon price of at least USD 56 per tonne CO₂ to provide an additional layer of robustness.
The break-even price and the CO₂ intensity metrics are only applicable for upstream oil and gas projects. The carbon pricing metric is applicable for both upstream and downstream oil and gas projects as well as electrification projects.
Additional criteria evaluated in an investment decision include safety, security and sustainability, optionality, strategic value, country risk, operational capacity and capability.
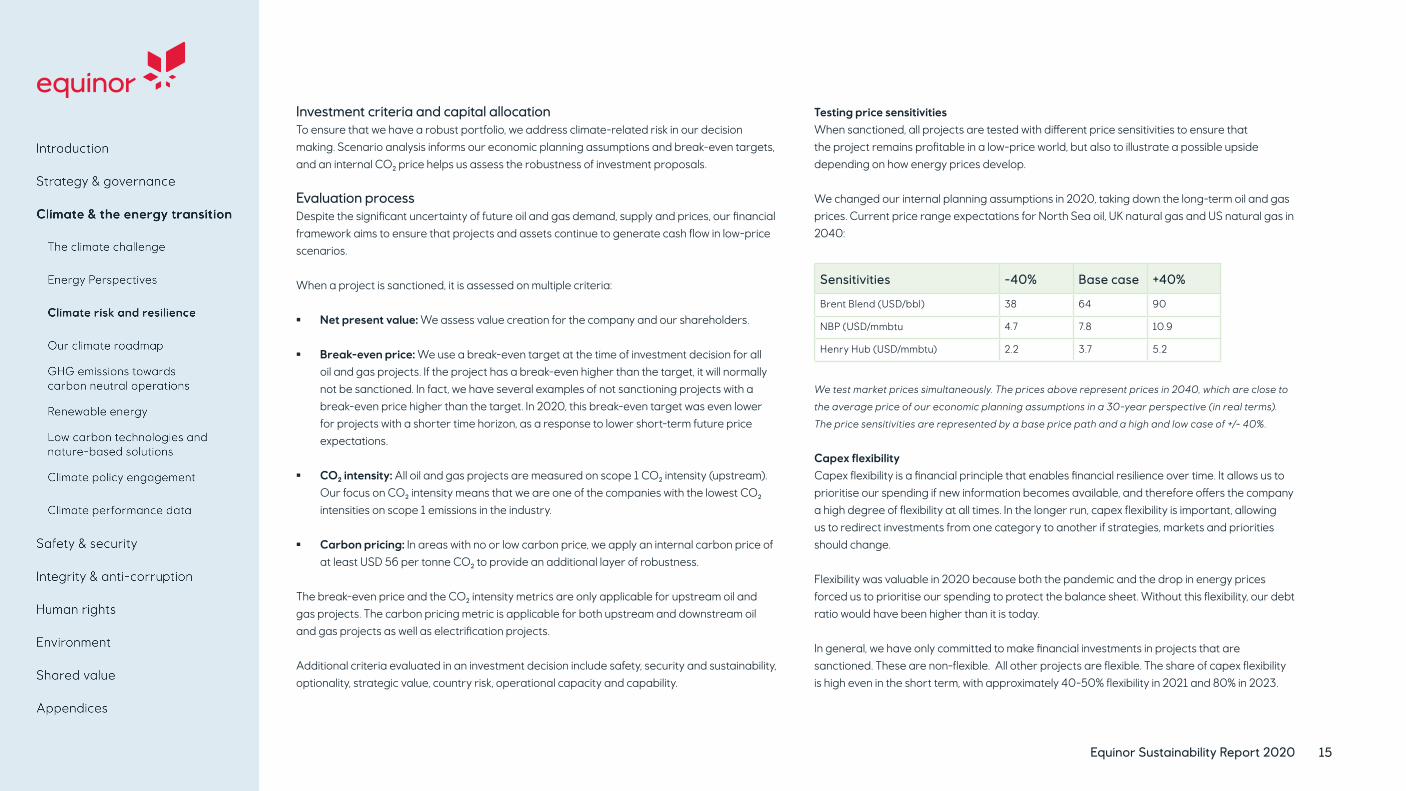
Testing price sensitivitiesWhen sanctioned, all projects are tested with different price sensitivities to ensure that the project remains profitable in a low-price world, but also to illustrate a possible upside depending on how energy prices develop.
We changed our internal planning assumptions in 2020, taking down the long-term oil and gas prices. Current price range expectations for North Sea oil, UK natural gas and US natural gas in 2040:
Sensitivities -40% Base case +40%
Brent Blend (USD/bbl) 38 64 90
NBP (USD/mmbtu 4.7 7.8 10.9
Henry Hub (USD/mmbtu) 2.2 3.7 5.2
We test market prices simultaneously. The prices above represent prices in 2040, which are close to
the average price of our economic planning assumptions in a 30-year perspective (in real terms).
The price sensitivities are represented by a base price path and a high and low case of +/- 40%.
Capex flexibilityCapex flexibility is a financial principle that enables financial resilience over time. It allows us to prioritise our spending if new information becomes available, and therefore offers the company a high degree of flexibility at all times. In the longer run, capex flexibility is important, allowing us to redirect investments from one category to another if strategies, markets and priorities should change.
Flexibility was valuable in 2020 because both the pandemic and the drop in energy prices forced us to prioritise our spending to protect the balance sheet. Without this flexibility, our debt ratio would have been higher than it is today.
In general, we have only committed to make financial investments in projects that are sanctioned. These are non-flexible. All other projects are flexible. The share of capex flexibility is high even in the short term, with approximately 40-50% flexibility in 2021 and 80% in 2023.

Equinor Sustainability Report 2020 16
Projects sanctioned in 2020 In 2020, Equinor sanctioned two organic oil and gas projects, two oil and gas acquisitions, two phases of an offshore wind project, two electrification projects and one CCS project. The relatively low number of projects sanctioned compared to previous years was due to capital discipline and prioritisation of financial flexibility during market uncertainty.
Capex-weighted break-even for the two organic oil and gas projects sanctioned was 21 USD/bbl, well below our break-even target. The production-weighted average CO₂ intensity of these two projects in 2020 was 5.3 kg CO₂/boe, which is well below our 2025 ambition of 8 kg CO₂/boe for the operated upstream portfolio. In addition, we had two acquisitions including exploration acreage, representing capex not yet committed. This will be further matured, and an investment decision will be taken in the future.
A more diverse portfolio At the Capital Markets Update in 2020, we announced the ambition to grow in renewables from 0,5 GW in equity capacity in 2019 to 4-6 GW in 2026.
The increase to 4% of renewable energy share in 2026 is on top of an increase in the oil and gas portfolio of 3% compound annual growth rate (CAGR) in the period 2020-2026, which illustrates the relative importance of the future renewable share of production.
Our renewable production is converted from GW to barrels of oil equivalents and combined with oil and gas production. Since there are challenges of comparing energy from renewables directly with energy from oil and gas, we show the share of energy production (equity) from renewables based on the partial substitution method. This method implies applying a factor to the energy from renewable electricity production to address the conversion losses associated with producing the same amount of electricity in a fossil power plant. This method is also used in our net carbon intensity calculations. Using the alternative “primary energy method” would result in a share of renewable energy production of 1% in 2026. For more information, see the net zero and net carbon methodology note on our web page.
This graph illustrates the investments committed in 2020. This represents the total
capex for the projects. The renewable share of the projects sanctioned, and capex
committed (including project finance) in 2020, was 60% of the total.
Project decisions and acquisitions in 2020
Wind, electrification and CCSConventional oil and gas
Share of energy production from oil, gas and renewables (%)Partial substitution method
20262020
100%
80%
60%
40%
20%
0%
54% 55%
46% 41%
4%
Renewable
Gas
Oil
0%

Equinor Sustainability Report 2020 17
Testing resilience Since 2016 we have been testing the resilience of our portfolio against the scenarios from the IEAs World Energy Outlook (WEO) report. Resilience in this context is defined as financial robustness and the ability to generate positive cash flow in a low-price environment. Other definitions of resilience are not considered here.
The use of the IEA scenarios enables standardisation of the stress testing and allows for comparison between companies. The IEA scenarios change slightly from year to year, and in the 2020 WEO report these are: Stated Policies Scenario (STEPS), Delayed Recovery Scenario (DRS), and the Sustainable Development Scenario (SDS). The SDS has moved from being consistent with a 1.7-1.8°C to 1.65°C, represented by lower energy prices compared to 2019. Our own economic planning prices for oil and gas were also lowered in 2020, thereby reducing our overall portfolio value compared to last year.
We apply the IEA price scenarios to our portfolio, in addition to our own planning assumptions, and compare the results in terms of impact on net present value (NPV). Our portfolio consists of producing assets and sanctioned and non-sanctioned projects. Exploration activities are not included due to the uncertainties related to potential discoveries and development solutions.
In the analysis, we assume a gradual increase between the price points given by the IEA and that the price in 2040 is kept unchanged for the rest of the century in real terms. To allow for comparison with Brent Blend, we add a USD 2 per boe transportation cost for oil production. We use our internal carbon price assumptions for Norway, as these prices are higher than the carbon prices in the SDS.
Carbon pricingWe apply a USD 56 per tonne CO₂ price to all assets and projects, except for projects in countries where the actual cost of carbon is higher, such as in Norway. This carbon price is included in all investment decisions and is part of our break-even calculations. Sensitivities against other potential levels of carbon costs, including a hypothetical global USD 100 per tonne CO₂ price, and the newly proposed CO₂ tax in Norway of NOK 2000 in 2030 (including EU ETS quotas), are illustrated in the chart below.
The sensitivity test described in this report uses a higher discount rate than an SDS sensitivity test on impairment in the Annual report and Form 20-F. This is because resources which are expected, but are less certain, together with real options, are included in the analysis.
The WEO report does not include a 1.5°C price set. To cater for this uncertainty, we test our portfolio with SDS as a basis and an oil price which gradually decreases to USD 50 in 2040 (compared to USD 53 in SDS). When applying these lower prices, the net present value of the portfolio is reduced but remains positive. A few assets might have an earlier economic cut-off in the low-price scenarios, but the total cash flow remains positive. The sensitivities are illustrated in the chart below.
WEO Sustainable Development Scenario vs. Equinor’s Economic
Planning Assumptions (EPA) 3Q20 gives portfolio NPV effect of
-22%. Main difference vs. 2019 is that the SDS represents a more
conservative climate scenario with lower prices.
The net present values of the carbon costs are divided by the total
net present value of the portfolio to illustrate magnitude across
scenarios and enable comparison. Exploration activities are excluded
from the sensitivity analysis due to high uncertainty. Furthermore,
electrification projects and CCS will reduce CO₂ emissions and
carbon costs and are also excluded from this sensitivity.
Percent carbon costs before tax relative to value of portfolio after tax
EPA
STEPS/DRS
SDS
USD 100 CO₂ price
NOK 2,000 CO₂ price in 2030
6%
7%
9%
10%
4%
20%
10%
0%
-10%
-20%
-30%
21%
-22%
0%
-23%
Statedpolicies
Delayed recovery
NPV change
Sustainable development
USD 50in 2040

Climate is embedded in our decision-making
We use our voice to drive
change Net-zero company
Equinor Sustainability Report 2020 18
In early 2020, Equinor announced its plans to achieve carbon neutral global operations by 2030 and to reduce absolute green-house gas (GHG) emissions in Norway to near zero by 2050. At the same time, we outlined a value-driven strategy for significant growth within renewables, as well as a new net carbon intensity ambition.
In November 2020, we further strengthened our climate roadmap with the ambition of becoming a net-zero energy company by 2050. The ambition includes emissions from production and final use of energy.
In June 2020, Equinor announced its maritime ambitions illustrating how it plans to reduce own emissions from ships and how the company will contribute to decarbonising shipping. Our ambitions for maritime activity are in line with both the goals of the International Maritime Organisation (IMO) for global shipping and the goals set by Norwegian authorities.
Our climate roadmap
Equinor’s climate ambitions aim to ensure a competitive and resilient business model during the energy transition and contribute to the dual societal challenge of providing energy and reducing emissions. Continuing to deliver on the short and mid-term ambitions will be key to achieving net-zero emissions. To achieve this, we need to strengthen our collaboration with governments, customers, and industry sectors to speed up the pace of the transition and deliver solutions at scale.
Industry leading in carbon efficiency Carbon neutral global operations by 2030
Upstream CO₂ intensity below 8 kg CO₂/boe by 2025
Absolute GHG reductions in Norway
• 40% by 2030
• 70% by 2040
• Near zero by 2050
No routine flaring by 2030 and near zero methane emissions intensity
Profitable growth in renewables
Develop a high value renewable business
• 4-6 GW installed capacity 2026 • 12-16 GW installed capacity 2035
Accelerate decarbonisation
Net-zero emissions for scope 1, 2 and 3 by 2050
100% net carbon intensity reduction by 2050
Reduce maritime emissions by 50% in Norway by 2030 and globally by 2050
A detailed overview of ambitions, including scopes and boundaries, is provided on the next page.

Equinor Sustainability Report 2020 19
Ambitions overviewAmbitions Boundary Scope
Reference year
Ambition year
Reduce absolute emissions in Norway • 40% reduction by 2030; • 70% reduction by 2040; • Near zero by 2050
Operational control 100% (including TSP role), Norway
Scope 1 and 2 CO₂ & CH4
2005 2030 2040 2050
Upstream CO₂ intensity <8kg CO₂/ boe by 2025 Operational control 100%, upstream Scope 1 CO₂ NA 2025
Carbon neutral global operations by 2030 Operational control 100% Scope 1 and 2 CO₂ & CH4
NA 2030
Net-zero emissions by 2050*
100% net carbon intensity reduction by 2050*
• Scope 1 and 2 GHG emissions (100% operator basis)
• Scope 3 GHG emissions from use of sold products (equity production)
• Energy production (equity)
Scope 1, 2 and 3 CO₂ & CH4
NA 2050
Eliminate routine flaring by 2030 Operational control 100% Flared hydrocarbons NA 2030
Keep methane intensity near zero by 2030 Operational control 100% CH4 2016 2030
Increase renewable energy capacity to 4-6GW by 2026 and 12-16GW by 2035**
Equity basis Installed capacity (GW) 2019 2026/2035
Reduce maritime emissions• 50% reduction in Norway by 2030 • 50% reduction globally by 2050
All vessels contracted by Equinor Scope 1 and 3 20052008
20302050
Develop low-carbon fuels for shipping • Towards 2030: escalate production and use of lower
carbon fuels • Towards 2050: strongly increase production and use
of zero carbon fuels
Operational control Scope 3 NA 2030 2050
* For more details, please see the Net-GHG emissions and net carbon intensity methodology note on equinor.com
** Including Equinor’s equity share of Scatec ASA.

Equinor Sustainability Report 2020 20
Climate Initiative NorwayEquinor aims to reduce the absolute greenhouse gas emissions from its operated offshore fields and onshore plants in Norway by 40% by 2030, 70% by 2040 and to near zero by 2050. By 2030 this implies annual cuts of more than 5 million tonnes, corresponding to around 10% of Norway’s total CO₂ emissions. The Norwegian Government has requested Equinor and the industry to further strengthen the ambition level for 2030 from 40% to 50%, which is currently being assessed.
The 2030 ambition is planned to be realised through large scale industrial measures, including electrification, energy efficiency and digitalisation. This is expected to require USD 5-6 billion (NOK 50 billion) of investment from Equinor and its partners. Further reduction towards 70% in 2040 and near zero in 2050 will entail additional measures, fur-ther electrification projects, consolidation of infrastructure as well as opportunities to develop new technologies and value chains.
Electrification of offshore assets Electrification is a key component in reducing emissions from our operations. It involves replacing a fossil fuel-based power supply with Norwegian grid mix, or power from floating wind turbines.
In 2020, we advanced several electrification initiatives:• Awarded a front-end engineering and design contract to accommodate power from shore at Troll B and C as
part of the plan to fully electrify Troll C and partly electrify Troll B, with a possibility for later full electrification of Troll B.
• Equinor and partners made an investment decision to partly electrify the Sleipner field.
The plan for development and operation for the Sleipner field centre will entail laying a new power cable from Sleipner to the Gina Krog platform, which will be tied into the area solution for power from shore on the Utsira High. During periods when the power need is greater than the capacity in the area solution, Sleipner will use gas turbines, like they do today, to cover the power need.
Emissions savings from all the fields connected to the area solution on the Utsira High are estimated at around 1.15 million tonnes of CO₂ on average per year, equal to around 8% of all of Equinor’s scope 1 CO₂ emissions. Sleipner’s share of this reduction is expected to be more than 150,000 tonnes of CO₂ annually. The Business Sector’s NOx Fund will contribute up to NOK 430 million to achieve partial electrification of the Sleipner field center and the associated fields.
Energy efficiency Targeted energy efficiency measures and management have reduced Equinor’s scope 1 emissions by almost 0.3 million tons in 2020. A wide range of measures, large and small, have been implemented both onshore and offshore, and within logistics. The largest contributors to emission reduction are modification measures at several mobile drill-ing rigs, new inlet filters on turbines, revamping of compressor trains and other compressor modifications at offshore platforms, efforts to minimize flaring, new monitoring software and improved operational routines.
GHG emissions towards carbon neutral operationsIndustry leading carbon efficiency We aim to remain an industry leader in carbon efficiency by emitting as little CO₂ as possible, from each barrel of oil equivalent produced. To achieve this, we assess carbon intensity when we shape our portfolio and implement emission reduction measures in our operations.
Equinor aims to reduce the upstream CO₂ intensity of our globally operated oil and gas production to below 8 kg CO₂/barrel of oil equivalent (boe) by 2025. The current global industry average is 17 kg CO₂/boe.
In 2020, our upstream operated CO₂ intensity improved from 9.5 to 8.0 kg CO₂/boe. This positive development in our carbon intensity is largely a result of increased production levels from Johan Sverdrup, which is electrified and therefore has minimal emissions, and also increased gas export from the Troll field. In addition, Peregrino, our heavy oil field in Brazil, was shut down for most of the year, resulting in a further reduction in our overall upstream carbon intensity. We expect Peregrino to start production again in 2021. The equity-based intensity improved from 11 to 9.2 kg CO₂/boe.
Upstream CO₂ intensity [KPI](kg CO₂ per boe, 100% operated basis)
Equinor [1] Equinor target IOGP average [2]
0
5
10
15
20
9.8 8.8 9.0 9.58.0 <8.0
17 18 18 17
2016 2017 2018 2019 2020 2025
[2] IOGP Annual Environmental Performance Indicators report; IOGP members´ annual survey of upstream oil and gas activities. The results are lagging by one year.
[1] Upstream: All operations from exploration to production, excluding onshore gas processing and LNG facilities. Midstream: Onshore gas processing and LNG facilities, chemical plants, refineries and oil terminals. Other: O�ices and renewables operations.
Equinor Sustainability Report 2020 21
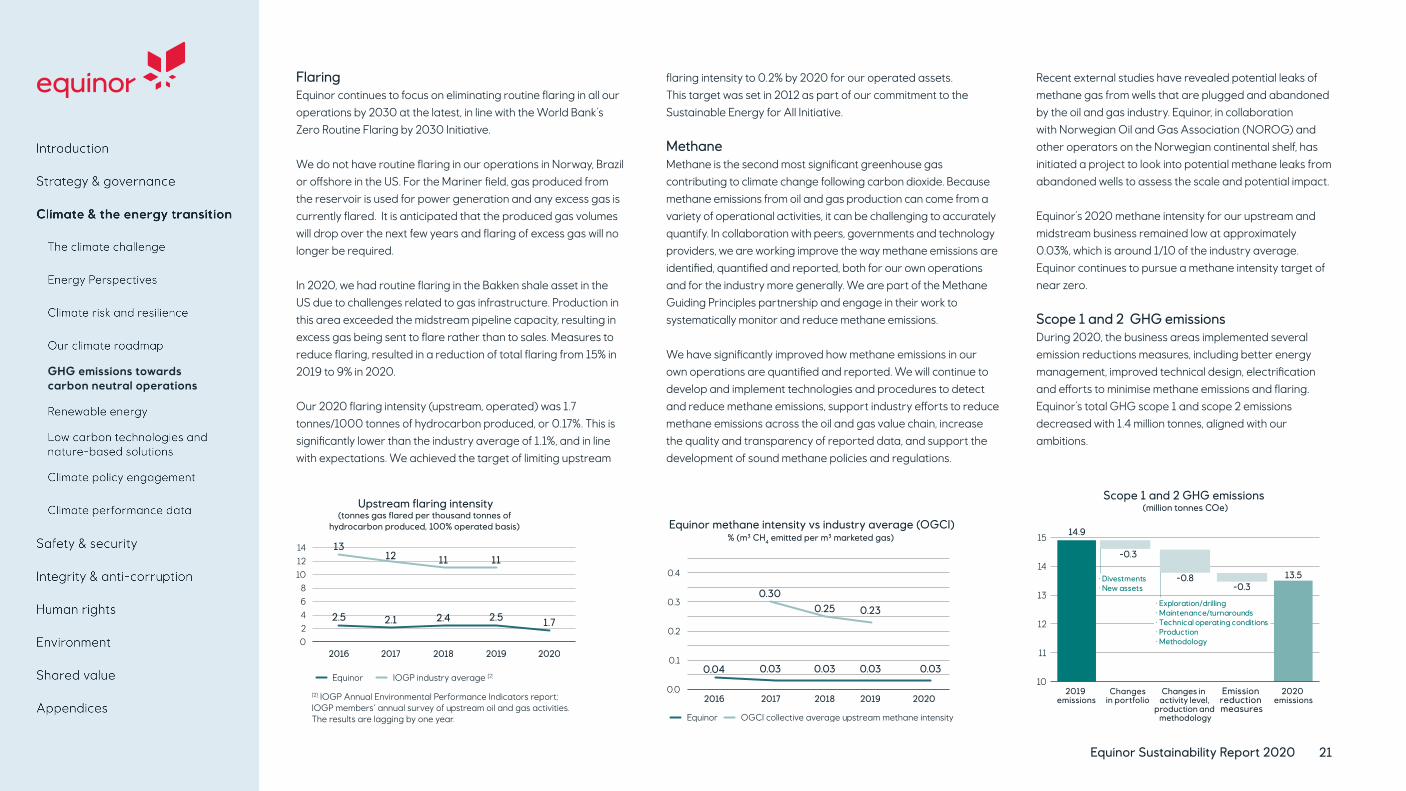
Flaring Equinor continues to focus on eliminating routine flaring in all our operations by 2030 at the latest, in line with the World Bank’s Zero Routine Flaring by 2030 Initiative.
We do not have routine flaring in our operations in Norway, Brazil or offshore in the US. For the Mariner field, gas produced from the reservoir is used for power generation and any excess gas is currently flared. It is anticipated that the produced gas volumes will drop over the next few years and flaring of excess gas will no longer be required.
In 2020, we had routine flaring in the Bakken shale asset in the US due to challenges related to gas infrastructure. Production in this area exceeded the midstream pipeline capacity, resulting in excess gas being sent to flare rather than to sales. Measures to reduce flaring, resulted in a reduction of total flaring from 15% in 2019 to 9% in 2020.
Our 2020 flaring intensity (upstream, operated) was 1.7 tonnes/1000 tonnes of hydrocarbon produced, or 0.17%. This is significantly lower than the industry average of 1.1%, and in line with expectations. We achieved the target of limiting upstream
Scope 1 and 2 GHG emissionsDuring 2020, the business areas implemented several emission reductions measures, including better energy management, improved technical design, electrification and efforts to minimise methane emissions and flaring. Equinor’s total GHG scope 1 and scope 2 emissions decreased with 1.4 million tonnes, aligned with our ambitions.
Methane Methane is the second most significant greenhouse gas contributing to climate change following carbon dioxide. Because methane emissions from oil and gas production can come from a variety of operational activities, it can be challenging to accurately quantify. In collaboration with peers, governments and technology providers, we are working improve the way methane emissions are identified, quantified and reported, both for our own operations and for the industry more generally. We are part of the Methane Guiding Principles partnership and engage in their work to systematically monitor and reduce methane emissions.
We have significantly improved how methane emissions in our own operations are quantified and reported. We will continue to develop and implement technologies and procedures to detect and reduce methane emissions, support industry efforts to reduce methane emissions across the oil and gas value chain, increase the quality and transparency of reported data, and support the development of sound methane policies and regulations.
flaring intensity to 0.2% by 2020 for our operated assets. This target was set in 2012 as part of our commitment to the Sustainable Energy for All Initiative.
Recent external studies have revealed potential leaks of methane gas from wells that are plugged and abandoned by the oil and gas industry. Equinor, in collaboration with Norwegian Oil and Gas Association (NOROG) and other operators on the Norwegian continental shelf, has initiated a project to look into potential methane leaks from abandoned wells to assess the scale and potential impact.
Equinor’s 2020 methane intensity for our upstream and midstream business remained low at approximately 0.03%, which is around 1/10 of the industry average. Equinor continues to pursue a methane intensity target of near zero.
GHG emissions towards carbon neutral operations
Equinor methane intensity vs industry average (OGCI)% (m³ CH4 emitted per m³ marketed gas)
Equinor OGCI collective average upstream methane intensity
0.0
0.1
0.2
0.3
0.4
0.04 0.03 0.03 0.03 0.03
0.300.25 0.23
2016 2017 2018 2019 2020
Scope 1 and 2 GHG emissions (million tonnes COe)
10
11
12
13
14
1514.9
-0.3
-0.8-0.3
13.5
2019 emissions
Changesin portfolio
Changes in activity level,
production and methodology
Emission reduction measures
2020 emissions
· Exploration/drilling· Maintenance/turnarounds· Technical operating conditions· Production· Methodology
· Divestments· New assets
Upstream flaring intensity(tonnes gas flared per thousand tonnes of
hydrocarbon produced, 100% operated basis)
Equinor IOGP industry average [2]
[2] IOGP Annual Environmental Performance Indicators report; IOGP members´ annual survey of upstream oil and gas activities. The results are lagging by one year.
02468
101214
2.5 2.1 2.4 2.5 1.7
1312 11 11
2016 2017 2018 2019 2020
Equinor Sustainability Report 2020 22
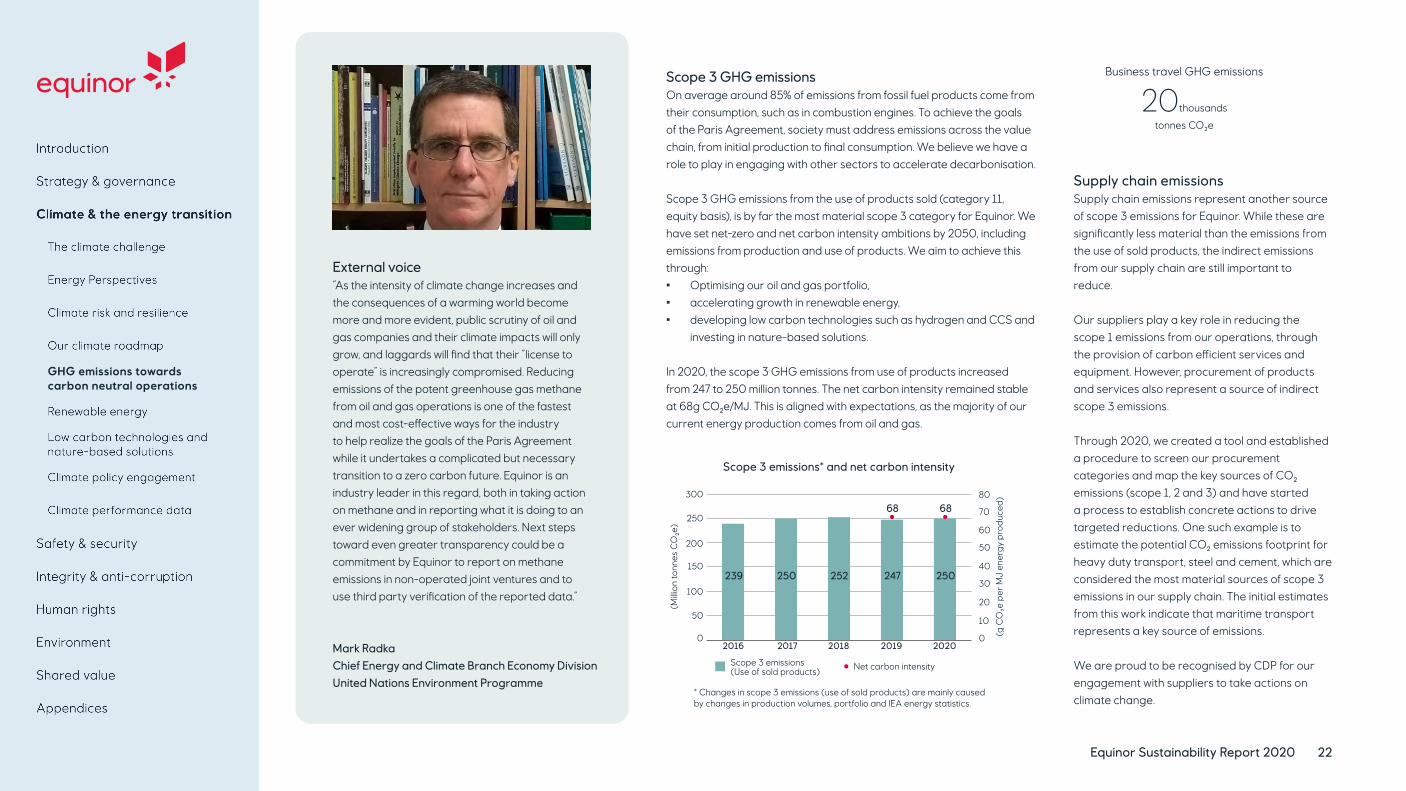
External voice“As the intensity of climate change increases and the consequences of a warming world become more and more evident, public scrutiny of oil and gas companies and their climate impacts will only grow, and laggards will find that their “license to operate” is increasingly compromised. Reducing emissions of the potent greenhouse gas methane from oil and gas operations is one of the fastest and most cost-effective ways for the industry to help realize the goals of the Paris Agreement while it undertakes a complicated but necessary transition to a zero carbon future. Equinor is an industry leader in this regard, both in taking action on methane and in reporting what it is doing to an ever widening group of stakeholders. Next steps toward even greater transparency could be a commitment by Equinor to report on methane emissions in non-operated joint ventures and to use third party verification of the reported data.”
Mark Radka Chief Energy and Climate Branch Economy Division United Nations Environment Programme
Scope 3 GHG emissions On average around 85% of emissions from fossil fuel products come from their consumption, such as in combustion engines. To achieve the goals of the Paris Agreement, society must address emissions across the value chain, from initial production to final consumption. We believe we have a role to play in engaging with other sectors to accelerate decarbonisation.
Scope 3 GHG emissions from the use of products sold (category 11, equity basis), is by far the most material scope 3 category for Equinor. We have set net-zero and net carbon intensity ambitions by 2050, including emissions from production and use of products. We aim to achieve this through: • Optimising our oil and gas portfolio, • accelerating growth in renewable energy,• developing low carbon technologies such as hydrogen and CCS and
investing in nature-based solutions.
In 2020, the scope 3 GHG emissions from use of products increased from 247 to 250 million tonnes. The net carbon intensity remained stable at 68g CO₂e/MJ. This is aligned with expectations, as the majority of our current energy production comes from oil and gas.
Supply chain emissionsSupply chain emissions represent another source of scope 3 emissions for Equinor. While these are significantly less material than the emissions from the use of sold products, the indirect emissions from our supply chain are still important to reduce.
Our suppliers play a key role in reducing the scope 1 emissions from our operations, through the provision of carbon efficient services and equipment. However, procurement of products and services also represent a source of indirect scope 3 emissions.
Through 2020, we created a tool and established a procedure to screen our procurement categories and map the key sources of CO₂ emissions (scope 1, 2 and 3) and have started a process to establish concrete actions to drive targeted reductions. One such example is to estimate the potential CO₂ emissions footprint for heavy duty transport, steel and cement, which are considered the most material sources of scope 3 emissions in our supply chain. The initial estimates from this work indicate that maritime transport represents a key source of emissions.
We are proud to be recognised by CDP for our engagement with suppliers to take actions on climate change.
Business travel GHG emissions
20thousands
tonnes CO₂e
GHG emissions towards carbon neutral operations
Scope 3 emissions* and net carbon intensity
0
50
100
150
200
250
300
0
10
20
30
40
50
60
70
80
2016 2017 2018 2019 2020
250247
68 68
252250239
Scope 3 emissions (Use of sold products) Net carbon intensity
* Changes in scope 3 emissions (use of sold products) are mainly caused by changes in production volumes, portfolio and IEA energy statistics.
(Milli
on to
nnes
CO
₂e)
(g C
O₂e
per
MJ
ener
gy
pro
duc
ed)

Equinor Sustainability Report 2020 23
vessels (PSV) on long term contracts have been required to use onshore power supply and installation of batteries for hybrid operation, to reduce the fuel consumptions and emissions (CO₂, NOx, etc.). Other general examples include optimising sailing routes and planning for green speed.
Equinor is also working with suppliers and partners in several other projects. The ShipFC project aims to install the world’s first ammonia-powered fuel cell on a vessel, namely Viking Energy by 2024. The flexible Solid Oxide fuel cell will be run on green ammonia (produced from renewable energy sources). This project could be a game-changer in zero-emission vessels. The LH2 for maritime/Topeka is an initiative under development aiming to demonstrate the full value chain of Liquid H2 as a maritime fuel in addition to moving Equinor container logistics from trucks to zero emission seaborne transport.
Reducing maritime emissionsEquinor is a buyer, producer and seller of marine fuels, and is committed to utilising its unique position to contribute to the decarbonisation of the maritime sector.
In 2020, Equinor reached the following milestones:• Announced a reduction ambition for the maritime
services we purchase, aligned with the ambitions set out by the Norwegian government and the International Maritime Organisation (IMO): • By 2030: 50% reduction of Equinor’s maritime
emissions in Norway compared to 2005 • By 2050: 50% reduction of Equinor’s maritime
emissions globally compared to 2008 (IMO baseline)
• Announced ambitions to support the development of lower and zero carbon fuels for shipping: • Towards 2030: Escalate production and use of
lower carbon fuels • Towards 2050: Strongly increase production and
use of zero carbon fuels
In the maritime sector, we work with suppliers to find operational, logistic and fuel-related measures to achieve emission reductions. We focus on fuel efficiency when entering new vessel contracts; incentive schemes further encourage suppliers to ensure fuel-efficient operations. For the tanker fleet, Equinor has long term contacts with 30 state-of-the-art energy-efficient ships and has entered into agreements for long-term use of an additional ten ships coming into operation between 2020 and 2022. Several shuttle tankers are operated on LNG in combination with volatile organic compound (VOC) captured from cargo loading and using LPG as fuel for LPG carriers. Since 2019, nearly all platform supply
Maritime GHG emissions
4.8 million tonnes CO₂e
GHG emissions towards carbon neutral operations

Equinor Sustainability Report 2020 24
Renewable energy Bottom-fixed offshore wind Leveraging our strengths and experience offshore, we are developing as a global offshore wind major. We are building material clusters in the North Sea, the US East coast and in the Baltic Sea. In parallel, we are accessing new markets.
Creating value from scale within established clusters and developing growth options in selected markets constitute the core of Equinor’s renewable strategy. Throughout 2020, Equinor’s offshore wind portfolio has been strengthened through the following milestones:
• US: strategic partnership with BP for joint pursuit of future opportunities in the US for bottom-fixed and floating offshore wind, leveraging relevant expertise to jointly grow scale. • Capturing significant value from divesting half of our share of offshore wind projects Empire Wind and Beacon Wind
• UK: Investment decision and financial close on Dogger Bank A and B – the world’s largest offshore wind project, leading the way in terms of technology and scale. • Announcing O&M base and contractual awards• Financial close announced and farm down of a 10 percent equity share to ENI• Signed agreement for lease with the Crown Estate for two existing offshore wind farm extensions to the existing offshore wind farms
Sheringham Shoal and Dudgeon• Poland: Equinor signed Letter of Intent with Polish government regarding cooperation to develop offshore wind energy in Poland.
• Maturing three offshore wind projects, Bałtyk I, II and III.• Japan: Partnered with Jera and J-Power and entered a joint bid agreement prior to Japan’s upcoming Round 1 offshore wind auction.
Profitable growth in renewable energy Driven by the energy transition and an increasing demand for electricity from renewable energy sources, Equinor continues to build its renewable business.
We primarily focus on offshore wind, both bottom-fixed and floating, but we also explore opportunities within onshore renewables.
We are on track to deliver profitable growth in renewable energy. Renewables and low carbon solutions projects accounted for 4% of our gross capex in 2020. However, the renewable share of all projects sanctioned and investments committed in 2020 was 60%. Throughout 2020, Equinor’s offshore wind portfolio has been strengthened through the following milestones, demonstrating a successful management approach.

[1] Ownership structure to be concluded.
Equinor Sustainability Report 2020 25
Onshore renewables Equinor is gradually growing our presence onshore in selected power markets with increasing demand for solar, wind energy and energy storage solutions as integrated parts of the energy system. We believe in diversifying our renewables business and pursuing additional growth options. Having a flexible portfolio gives us the ability to provide power from numerous renewable energy sources.
• In December 2020, Equinor signed a Memorandum of Understanding (MoU) with Scatec and Hydro to jointly develop a 480 MW solar power plant in Brazil.
• Equinor currently holds a minority equity share (13%) of Scatec ASA.
Floating offshore windEquinor sees a potential for floating offshore wind projects in Norway, Europe, the US and Asia and is accelerating the development of this technology to uphold our leading position. Floating wind is still at an early development phase compared to other renewable energy sources. However, through technology improvements, increased scale and industrialisation, it represents the next wave of scalable renewables. Floating wind farms can capture higher winds therefore are more flexible than bottom-fixed wind farms with regards to location. They can be built in areas where there are few alternatives due to limited onshore or nearshore acreage, such as outside large coastal cities. Our ambition is to bring floating wind towards commerciality by 2030.
Equinor operates the world’s first floating wind farm with five turbines outside Scotland.
In 2020, Equinor reached the following milestones:
• Started development of the Hywind Tampen project in Norway. The project was approved by Norwegian government in April and has been supported by Enova with around half of the capital expenditure for the project. It will have a total capacity of 88 MW and is expected to cover about 35% of the annual power needs of the Snorre Gullfaks fields. This will result in a reduction of total CO₂ emissions from the Gullfaks and Snorre fields by more than 200,000 tonnes per year.
• Entered South Korea with the ambition to further expand within floating offshore wind. We are currently conducting wind measurements for a potential 800 MW project off the coast of Ulsan. In addition, we continue our collaboration with Korean National Oil Company (KNOC) and Eastern West Power (EWP) with the aim to develop a 200 MW offshore wind farm in the same area.
Equinor’s offshore wind portfolio
In production or under construction
Bottom fixed Floating
Sheringham Shoal, UK
317 MW
Dudgeon, UK
402 MW
Arkona, Germany 385 MW
Dogger Bank A&B, UK
2,400 MW
Hywind Scotland, UK
30 MW
Hywind Tampen, Norway 88 MW
Equinor (40%) Equinor (35%)RWE operator Equinor (25%)
SSE operator Equinor (40%)
Equinor (75%) Equinor (41%)
Project pipeline
Bottom fixed
Dogger Bank C, UK
1,200 MW
Empire Wind 1&2, US
~2,000 MW
Bałtyk I, II, & III, Poland
~3,000 MW
Beacon Wind 1&2, US
~2,400 MW
Sheringham Shoal and Dudgeon Extension, UK
719 MW
Equinor (50%) Equinor (50%) Equinor (50%) Equinor (50%) Equinor[1]
Installed capacity Equinor share* by phase (MW)
7,000
6,000
5,000
4,000
3,000
2,000
1,000
In operation
TotalSanctioned Contract awarded
Acreage secured
0
457 94
2,208
3,300 6,060
* Including Equinor's equity share in Scatec ASA.
Equinor Sustainability Report 2020 26
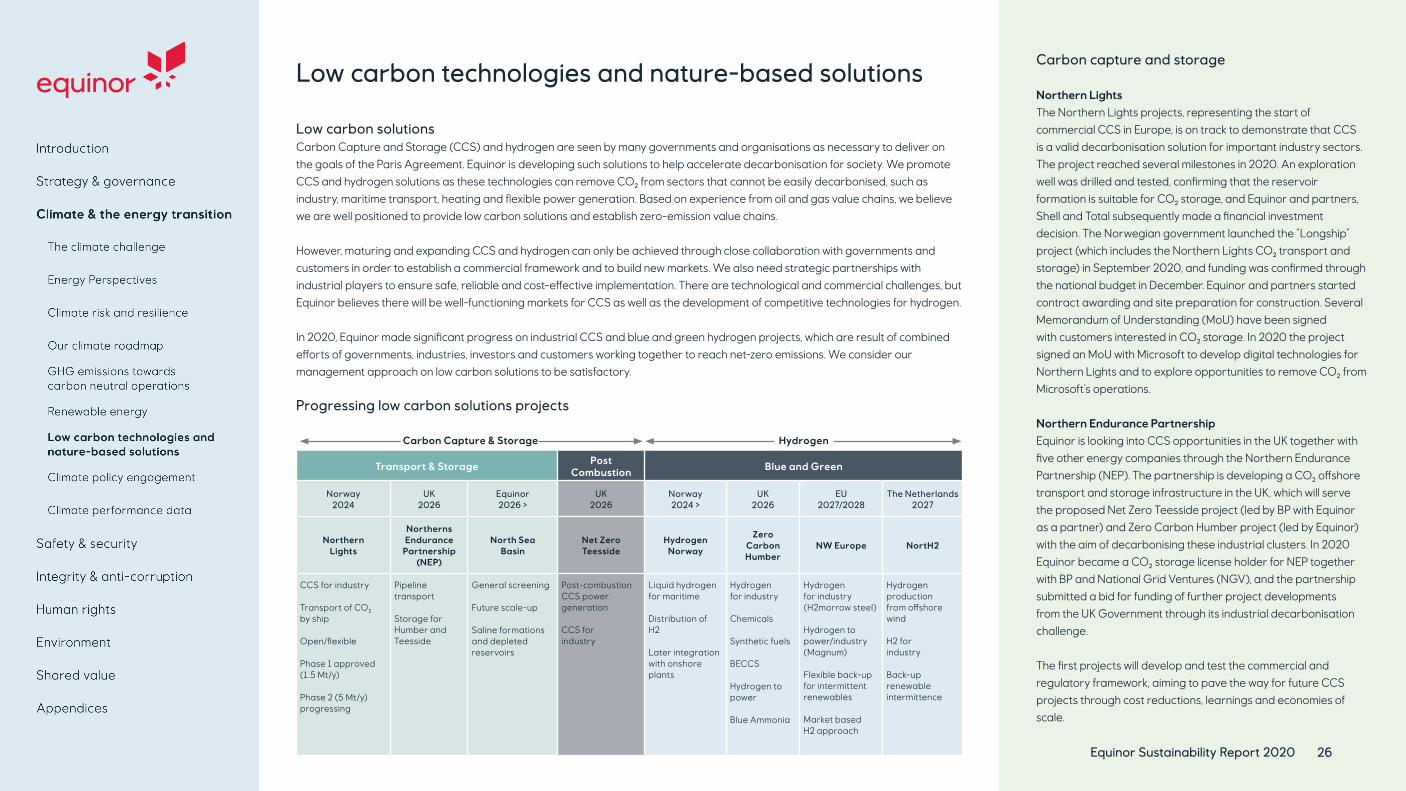
Carbon Capture & Storage Hydrogen
Transport & Storage Post Combustion Blue and Green
Norway 2024
UK 2026
Equinor 2026 >
UK 2026
Norway 2024 >
UK 2026
EU 2027/2028
The Netherlands 2027
Northern Lights
Northerns Endurance
Partnership (NEP)
North Sea Basin
Net Zero Teesside
Hydrogen Norway
Zero Carbon Humber
NW Europe NortH2
CCS for industry
Transport of CO₂ by ship
Open/flexible
Phase 1 approved (1.5 Mt/y)
Phase 2 (5 Mt/y) progressing
Pipeline transport
Storage for Humber and Teesside
General screening
Future scale-up
Saline formations and depleted reservoirs
Post-combustion CCS power generation
CCS for industry
Liquid hydrogen for maritime
Distribution of H2
Later integration with onshore plants
Hydrogen for industry
Chemicals
Synthetic fuels
BECCS
Hydrogen to power
Blue Ammonia
Hydrogen for industry (H2morrow steel)
Hydrogen to power/industry (Magnum)
Flexible back-up for intermittent renewables
Market based H2 approach
Hydrogen production from offshore wind
H2 for industry
Back-up renewable intermittence
Low carbon solutionsCarbon Capture and Storage (CCS) and hydrogen are seen by many governments and organisations as necessary to deliver on the goals of the Paris Agreement. Equinor is developing such solutions to help accelerate decarbonisation for society. We promote CCS and hydrogen solutions as these technologies can remove CO₂ from sectors that cannot be easily decarbonised, such as industry, maritime transport, heating and flexible power generation. Based on experience from oil and gas value chains, we believe we are well positioned to provide low carbon solutions and establish zero-emission value chains.
However, maturing and expanding CCS and hydrogen can only be achieved through close collaboration with governments and customers in order to establish a commercial framework and to build new markets. We also need strategic partnerships with industrial players to ensure safe, reliable and cost-effective implementation. There are technological and commercial challenges, but Equinor believes there will be well-functioning markets for CCS as well as the development of competitive technologies for hydrogen.
In 2020, Equinor made significant progress on industrial CCS and blue and green hydrogen projects, which are result of combined efforts of governments, industries, investors and customers working together to reach net-zero emissions. We consider our management approach on low carbon solutions to be satisfactory.
Carbon capture and storage
Northern Lights The Northern Lights projects, representing the start of commercial CCS in Europe, is on track to demonstrate that CCS is a valid decarbonisation solution for important industry sectors. The project reached several milestones in 2020. An exploration well was drilled and tested, confirming that the reservoir formation is suitable for CO₂ storage, and Equinor and partners, Shell and Total subsequently made a financial investment decision. The Norwegian government launched the “Longship” project (which includes the Northern Lights CO₂ transport and storage) in September 2020, and funding was confirmed through the national budget in December. Equinor and partners started contract awarding and site preparation for construction. Several Memorandum of Understanding (MoU) have been signed with customers interested in CO₂ storage. In 2020 the project signed an MoU with Microsoft to develop digital technologies for Northern Lights and to explore opportunities to remove CO₂ from Microsoft’s operations.
Northern Endurance Partnership Equinor is looking into CCS opportunities in the UK together with five other energy companies through the Northern Endurance Partnership (NEP). The partnership is developing a CO₂ offshore transport and storage infrastructure in the UK, which will serve the proposed Net Zero Teesside project (led by BP with Equinor as a partner) and Zero Carbon Humber project (led by Equinor) with the aim of decarbonising these industrial clusters. In 2020 Equinor became a CO₂ storage license holder for NEP together with BP and National Grid Ventures (NGV), and the partnership submitted a bid for funding of further project developments from the UK Government through its industrial decarbonisation challenge.
The first projects will develop and test the commercial and regulatory framework, aiming to pave the way for future CCS projects through cost reductions, learnings and economies of scale.
Low carbon technologies and nature-based solutions
Progressing low carbon solutions projects

Equinor Sustainability Report 2020 27
External voice“To achieve net-zero emissions while creating a sustainable economy for all, we need all the tools at hand, including CCS. Equinor has 25 years of experience with CO₂ storage and CO₂ capture technology development. With Norway’s decision to finance the first full scale CCS infrastructure, Equinor is well positioned to assume European leadership in this market. To convert its competences into green economy currency, Equinor should divest from the riskiest oil reserves, and take a larger risk in developing blue hydrogen and CCS.”
Marius Holm General Manager Zero Emissions Resource Organisation (ZERO)
Hydrogen
Zero Carbon HumberThe Zero Carbon Humber project aims to kick-start the decarbonisation of industry and power sectors in the UK’s largest and most carbon intensive industrial cluster. Equinor is a partner in this project, which reached important milestones in 2020: • Equinor launched the Hydrogen to Humber Saltend project (part of Zero Carbon Humber) which aims to establish
hydrogen production infrastructure and enable a fuel switch in the Saltend chemical park.
• Together with 11 partners, Equinor submitted a joint project proposal to the UK government to secure funding for pre-FEED and FEED cost (Industrial Strategy Challenge Fund).
Liquid hydrogen to maritime (LH2 Maritime)Together with partners Air Liquide and BKK, we are developing a liquid hydrogen project in south-western Norway with the aim of establishing a full value chain for decarbonising parts of the maritime sector.
In May 2020 the consortium with representatives from the whole value chain was established. Mongstad Industripark was chosen as the location for liquid hydrogen production due to infrastructure synergies between existing and future plants in the area. The project is part of Equinor’s maritime strategic climate ambition and aligned with the strategy set out by the Norwegian government for maritime sector decarbonisation.
NortH2 The NortH2 is Europe’s largest green hydrogen project and aims to kick start a green hydrogen value chain in North West Europe by taking a full value chain approach from offshore wind to hydrogen production utilising electrolyzers and securing agreements with off takers. The project aims to produce green hydrogen from dedicated offshore wind farms off the coast of the Netherlands with a stated ambition to reach about 4 GW by 2030 and 10+ GW by 2040.
In 2020, Equinor joined the NortH2 consortium alongside RWE expanding the existing consortium with investment partners Shell and Gasunie, and supporting partners Groningen Seaports and the province of Groningen. The partners are working on a feasibility phase planned by Q3 2021 to demonstrate the technical and commercial case and what this will require including regulatory frameworks and public-private partnerships.
Low carbon technologies and nature-based solutions
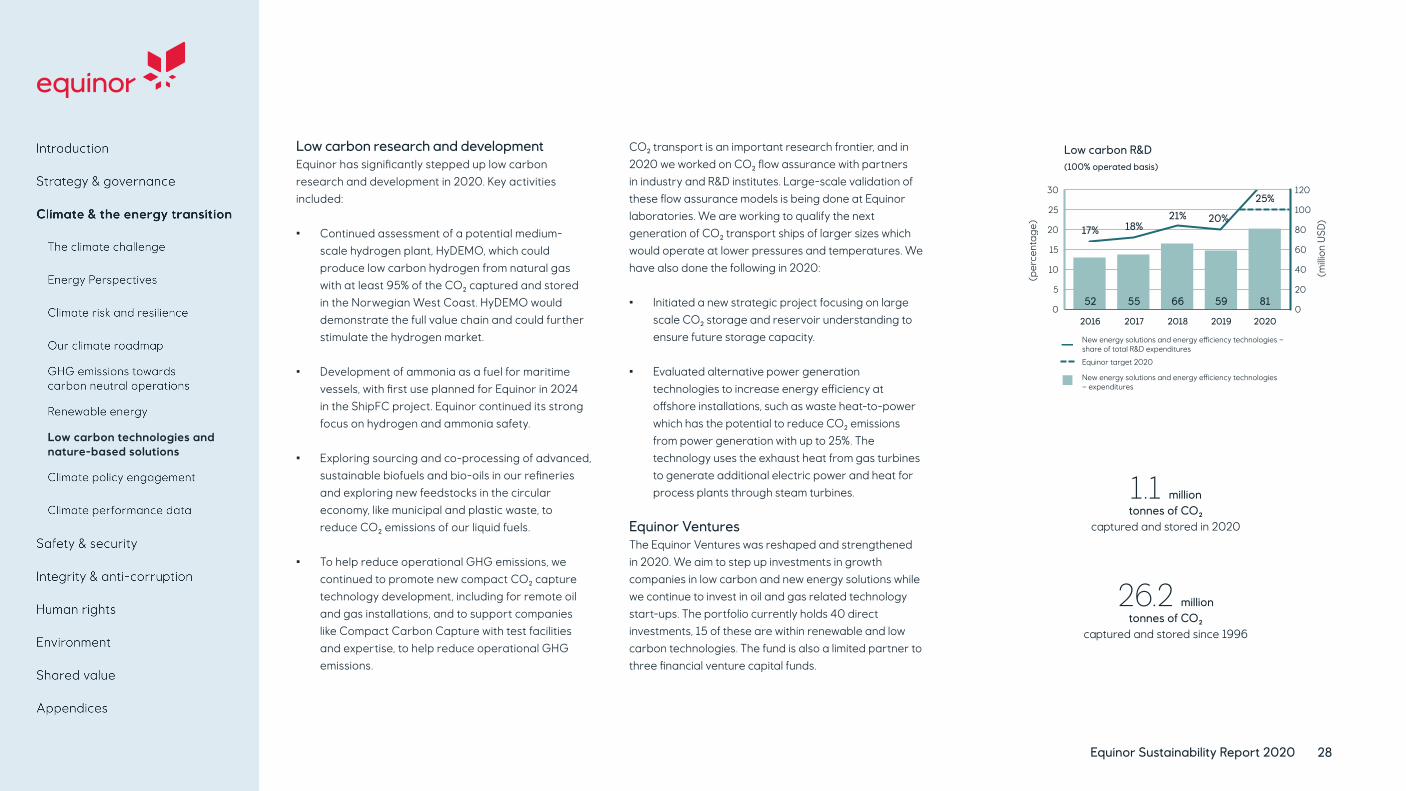
Equinor Sustainability Report 2020 28
Low carbon research and developmentEquinor has significantly stepped up low carbon research and development in 2020. Key activities included:
• Continued assessment of a potential medium-scale hydrogen plant, HyDEMO, which could produce low carbon hydrogen from natural gas with at least 95% of the CO₂ captured and stored in the Norwegian West Coast. HyDEMO would demonstrate the full value chain and could further stimulate the hydrogen market.
• Development of ammonia as a fuel for maritime vessels, with first use planned for Equinor in 2024 in the ShipFC project. Equinor continued its strong focus on hydrogen and ammonia safety.
• Exploring sourcing and co-processing of advanced, sustainable biofuels and bio-oils in our refineries and exploring new feedstocks in the circular economy, like municipal and plastic waste, to reduce CO₂ emissions of our liquid fuels.
• To help reduce operational GHG emissions, we continued to promote new compact CO₂ capture technology development, including for remote oil and gas installations, and to support companies like Compact Carbon Capture with test facilities and expertise, to help reduce operational GHG emissions.
CO₂ transport is an important research frontier, and in 2020 we worked on CO₂ flow assurance with partners in industry and R&D institutes. Large-scale validation of these flow assurance models is being done at Equinor laboratories. We are working to qualify the next generation of CO₂ transport ships of larger sizes which would operate at lower pressures and temperatures. We have also done the following in 2020:
• Initiated a new strategic project focusing on large scale CO₂ storage and reservoir understanding to ensure future storage capacity.
• Evaluated alternative power generation technologies to increase energy efficiency at offshore installations, such as waste heat-to-power which has the potential to reduce CO₂ emissions from power generation with up to 25%. The technology uses the exhaust heat from gas turbines to generate additional electric power and heat for process plants through steam turbines.
Equinor VenturesThe Equinor Ventures was reshaped and strengthened in 2020. We aim to step up investments in growth companies in low carbon and new energy solutions while we continue to invest in oil and gas related technology start-ups. The portfolio currently holds 40 direct investments, 15 of these are within renewable and low carbon technologies. The fund is also a limited partner to three financial venture capital funds.
26.2 million tonnes of CO₂
captured and stored since 1996
1.1 million tonnes of CO₂
captured and stored in 2020
Low carbon technologies and nature-based solutions
Low carbon R&D(100% operated basis)
(per
cent
ag
e)
0
5
10
15
20
25
30
(milli
on U
SD)
0
20
40
60
80
100
120
17% 18%21% 20%
32%
25%
52 55 66 59 81
2016 2017 2018 2019 2020
New energy solutions and energy e�iciency technologies – share of total R&D expenditures
Equinor target 2020
New energy solutions and energy e�iciency technologies – expenditures
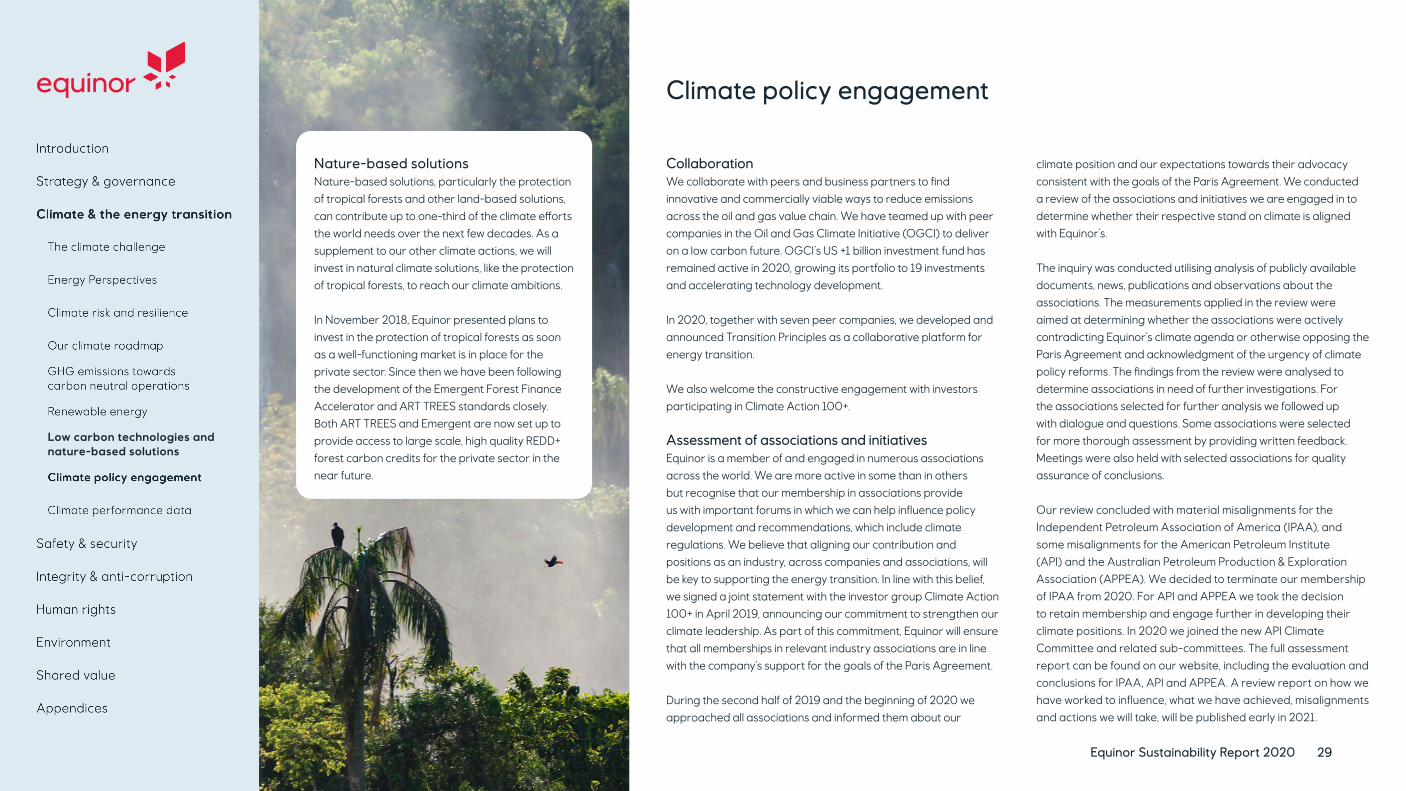
Equinor Sustainability Report 2020 29
Nature-based solutionsNature-based solutions, particularly the protection of tropical forests and other land-based solutions, can contribute up to one-third of the climate efforts the world needs over the next few decades. As a supplement to our other climate actions, we will invest in natural climate solutions, like the protection of tropical forests, to reach our climate ambitions.
In November 2018, Equinor presented plans to invest in the protection of tropical forests as soon as a well-functioning market is in place for the private sector. Since then we have been following the development of the Emergent Forest Finance Accelerator and ART TREES standards closely. Both ART TREES and Emergent are now set up to provide access to large scale, high quality REDD+ forest carbon credits for the private sector in the near future.
Climate policy engagement
CollaborationWe collaborate with peers and business partners to find innovative and commercially viable ways to reduce emissions across the oil and gas value chain. We have teamed up with peer companies in the Oil and Gas Climate Initiative (OGCI) to deliver on a low carbon future. OGCI’s US +1 billion investment fund has remained active in 2020, growing its portfolio to 19 investments and accelerating technology development.
In 2020, together with seven peer companies, we developed and announced Transition Principles as a collaborative platform for energy transition.
We also welcome the constructive engagement with investors participating in Climate Action 100+.
Assessment of associations and initiativesEquinor is a member of and engaged in numerous associations across the world. We are more active in some than in others but recognise that our membership in associations provide us with important forums in which we can help influence policy development and recommendations, which include climate regulations. We believe that aligning our contribution and positions as an industry, across companies and associations, will be key to supporting the energy transition. In line with this belief, we signed a joint statement with the investor group Climate Action 100+ in April 2019, announcing our commitment to strengthen our climate leadership. As part of this commitment, Equinor will ensure that all memberships in relevant industry associations are in line with the company’s support for the goals of the Paris Agreement.
During the second half of 2019 and the beginning of 2020 we approached all associations and informed them about our
climate position and our expectations towards their advocacy consistent with the goals of the Paris Agreement. We conducted a review of the associations and initiatives we are engaged in to determine whether their respective stand on climate is aligned with Equinor’s.
The inquiry was conducted utilising analysis of publicly available documents, news, publications and observations about the associations. The measurements applied in the review were aimed at determining whether the associations were actively contradicting Equinor’s climate agenda or otherwise opposing the Paris Agreement and acknowledgment of the urgency of climate policy reforms. The findings from the review were analysed to determine associations in need of further investigations. For the associations selected for further analysis we followed up with dialogue and questions. Some associations were selected for more thorough assessment by providing written feedback. Meetings were also held with selected associations for quality assurance of conclusions. Our review concluded with material misalignments for the Independent Petroleum Association of America (IPAA), and some misalignments for the American Petroleum Institute (API) and the Australian Petroleum Production & Exploration Association (APPEA). We decided to terminate our membership of IPAA from 2020. For API and APPEA we took the decision to retain membership and engage further in developing their climate positions. In 2020 we joined the new API Climate Committee and related sub-committees. The full assessment report can be found on our website, including the evaluation and conclusions for IPAA, API and APPEA. A review report on how we have worked to influence, what we have achieved, misalignments and actions we will take, will be published early in 2021.
Low carbon technologies and nature-based solutions

Equinor Sustainability Report 2020 30
Indicators Boundary Units 2020 2019 2018 2017 2016
Oil and gas production Operational control mmboe 1,106 1,055 1,077 1,099 1,030
Oil and gas production Equity basis mmboe 758 757 770 759 723
Renewable energy production Equity basis GWh 1,662 1,754 1,251 830 423
Energy consumption Operational control TWh 65 70 71 70 73
Scope 1 GHG emissions Operational control million tonnes CO2e 13.3 14.7 14.9 15 15
CO2 emissions (Scope 1) Operational control million tonnes 12.9 14.2 14.4 14.9 14.8
CO2 emissions Equity basis million tonnes 10.1 11.5 11.6 12.0 12.7
Scope 2 GHG emissions (location based) Operational control million tonnes CO2e 0.2 0.2 0.2 0.2 0.3
Scope 2 GHG emissions (market based) Operational control million tonnes CO₂e 2.5 2.9 3.0 2.8 2.6
Scope 3 GHG emissions (use of sold products) Equity basis million tonnes CO₂e 250 247 252 (a) 250 (a) 239 (a)
Upstream CO2 emissions intensity [1] Operational control kg CO2/boe 8.0 9.5 9.0 8.8 9.8
Upstream CO2 emissions intensity [1] Equity basis kg CO2/boe 9.2 11 10 10 13
Net carbon intensityOperational control/Equity basis
g CO₂e per MJ energy produced 68 68 NR NR NR
CH4 emissions Operational control thousand tonnes 17.7 19.0 20.0 19.3 24.2
Methane intensity Operational control % 0.03 0.03 0.03 0.03 0.04
Hydrocarbons flared Operational control thousand tonnes 339 414 396 406 443
Upstream flaring intensity Operational controltonnes of gas flared per 1,000 tonnes of hydrocarbon produced
1.7 2.5 2.4 2.1 2.5
[1] Upstream: All operations from exploration to production, excluding onshore gas processing and LNG facilities. (a) Scope 3 figures have been updated to reflect a change in methodology. The change has resulted in a decrease in emissions levels, mainly due to the introduction of a non-energy fraction of sold products.
Climate performance data

Health and safety, incl. emergency response
Security
Equinor Sustainability Report 2020 31
Safety & security
Business context and our approach
2020 was an extraordinary year for us as a company, for our employees and for our contractors. The Covid-19 pandemic affected our business activities and operations, making it more difficult to conduct our business in accordance with our plans. From the outset, we formed a task force of medical professionals which focused on minimizing the risk of transmission to people in our offices and our offshore and onshore operations. The task force worked closely with business leaders to ensure business continuity while avoiding transmission of the virus by proactively identifying and mitigating risk at a strategic, tactical and operational level. We adjusted manning based on location-specific risk exposure, and for some periods, a significant part of the workforce worked from home.
One of our strategic pillars, “Always safe” is guided by our commitment to prevent harm to people’s health, safety and security, and to the environment. We are an international operator of exploration activities, oil and gas installations, refineries, gas plants and wind farms, and therefore face a range of potential risks. These include well blowouts, ignited hydrocarbon leaks, structural collapses, oil spills, crime, terror attacks, cyber-attacks, occupational incidents and work-related illness. In Equinor, we aim to continuously develop a proactive safety culture where safe and secure operations are incorporated into everything we do. A key component to this work is having a long-term commitment to some key priorities which include safety visibility, leadership and behavior, learning and follow up and safety indicators. We have defined these priorities across the whole company to ensure an aligned approach. In 2019 we started implementing improvements within these four areas and in 2020 we developed an “I am safety” roadmap to ensure the continuation of this work and to set a clear direction towards 2025.
We achieved a reduction in the number of serious incidents in 2020 compared to 2019, but regrettably we experienced fires at two of our onshore plants in Norway. We consider our management framework as suitable to guide our ambition to achieve zero harm to people and the environment, but we remain dissatisfied with our overall safety performance. This remains a key focus area for management and lessons learned from the ongoing investigations of the fires may affect where we step up our efforts.
Material topics | Impact

Equinor Sustainability Report 2020 32
External voice“Equinor and Aibel’s relationship dates back decades and in 2020, Equinor’s projects onshore, offshore and in our yards created over 9,000 work-years for Aibel. We fully share the “Always safe” strategy and the vision of zero harm to people and the environment. I am impressed to see how Equinor drive their ambitious improvement agenda in close collaboration with the Norwegian supplier industry. However, we need to continue to drive our joint efforts, so our performance mirrors our ambition: Always home safely!”
Mads AndersenCEO Aibel
Actions to improve health, safety and security
Our I am safety roadmap specifies key measures which are designed to support forceful and continuous improvement of priority areas throughout the company. In 2020, we implemented four of these key measures. They included a companywide annual wheel, strengthened implementation of our “Lifesaving rules”, enhanced learning and follow up, and collaboration with key contractors.
The annual wheel has a defined focus area for each quarter based on priority topics and accompanied actions, which are assessed by the entire company, thus ensuring a stronger common focus. In 2020, we prioritized the prevention of major accidents, personnel injuries, “line-of-fire¹ “ events, and negative health effects.
Implementation of the “Life Saving rules” defined by the Association of International Oil and Gas Producers (IOGP) started in 2019. In 2020, we focused on operationalizing these rules by integrating them in daily risk assessments. In addition, the corporate requirements for road safety were updated and aligned with the industry best practice to reflect the fact that driving-related accidents are historically the single largest cause of fatalities in our industry.
Learning and follow up after incidents is key to improving safety culture. To facilitate the institutionalisation of closed loop learning across the company, a learning panel was established in 2019. In 2020, one of the most important learning packages issued by the panel was related to a serious injury caused by a bottle that exploded during pressurisation at the Heimdal platform in Norway. This provides solutions for how similar incidents can be avoided and is available at alwayssafe.no, a web platform open for all operators and suppliers on the Norwegian continental shelf.
Two thirds of our activities are carried out by contractors, so working closely with them is crucial to our overall performance. An arena was established in 2020 to enable sharing and learning from safety incidents and to facilitate stronger collaboration. We also signed a collaboration charter with four of our largest suppliers in Norway, agreeing to follow the same annual wheel, to implement the “Lifesaving rules”, and to prioritize the same measures to avoid “line-of-fire” events and other frequent incidents such as arm, hand and finger injuries. The charter includes common Key Performance Indicators and targets.
Health and working environmentWe systematically monitor work-related illness caused by psychosocial aspects, chemicals, noise, and ergonomics at the workplace. In addition to monthly reviews of registered cases, we capture information from employees through our annual people survey, which includes questions related to psychosocial and mental health risk factors.
In the Covid-19 situation in 2020, it was particularly important to monitor risks related to working from home, especially ergonomic and psychosocial risk. Several measures were implemented such as the training of leaders in how to manage such risks including follow-up of employees when working from home over a longer period. More than 1600 leaders attended webinars or leadership-team trainings in this respect. This was further strengthened by learning packages, videos and toolboxes that were launched through our annual wheel. In addition, personnel with specific requirements were given access to the offices or special equipment to facilitate a healthy and efficient working day. Help and support services were also made available to give employees and leaders access to health professionals when needed.¹ Injuries that occur when the path of a moving object
or the release of energy crosses an individuals’ body.
Major accidents
“Line of fire” Personal inju
ries
(TRIF
)
Hea
lth a
nd working
envir
onment
OC
T
N
OV
D E C J A N F E B
MA
R
SE
P A
UG
J U L J U N
M
AY
A
PR
Always safeHigh value
Low carbon
Equinor Sustainability Report 2020 33
Adequate preparation and appropriate response measures are prerequisites for being able to limit the consequences of an incident. Equinor is working closely with peers, suppliers and stakeholders to ensure we are robust at all levels across the company. Training is a key enabler and our people who are assigned tasks, including the CEO, routinely train and exercise on their roles and responsibilities in emergency response situations, to be sufficiently prepared if, and when, incidents occur.
In 2020, we activated our corporate emergency response protocols in relation to the Covid-19 pandemic and global operations and special business continuity protocols helped enable the management and navigation of our response locally. Although we did not experience any major interruptions, the business continuity planning process strengthened the company by preparing for major business disruptions and by equipping employees with skills and knowledge needed to protect our people, our operations and our assets in a more efficient way. The pandemic also increased our knowledge and skills in the use of digital collaboration tools. We gained experience in virtual response training and handling of incidents and our response plans were updated to enable mustering of teams virtually.
In 2020, Equinor experienced fires both at the Melkøya LNG plant in Hammerfest, and at our methanol plant at Tjeldbergodden. Both incidents led to mobilisation of our emergency response organisation and the local emergency services. A full evacuation of the plants was accomplished, and the plants were shut down in accordance with emergency routines. No one was injured during the incidents.
Emergency response
Equinor continues to face a range of security threats which are continuously monitored, assessed and communicated across the company. 2020 was challenging with uncertainty caused by the pandemic which in some cases exacerbated existing threats and in others temporarily reduced them. In some countries certain threats were reduced due to a combination of lockdowns and almost complete halt in international business travel.
The inability to travel required rapid and agile methods to deliver security including new remote processes aimed at gauging the impact of the pandemic on security risk management at site level. Competence development for all staff has mostly been done virtually through e-learning courses and video conferences.
The pandemic has accelerated change to our ways of working, with an increased use of remote IT solutions while working from home. This increased information security risk as private devices were used to a larger degree. Because of this, our security month campaign had a special focus on employee IT security awareness and private cyber resilience and a series of cyber-security awareness courses were made available. As part of the awareness training the company tested user’s ability to identify phishing e-mails, distributing around 900,000 tests last year.
Security and human rightsDespite the challenges caused by the pandemic, we continued to deliver on our commitment towards human rights by conducting our activities in line with the Voluntary Principles on Security and Human Rights. Although it was not possible to train all security staff due to lockdowns and restrictions, we provided human rights and security training to 85% of guard forces in relevant locations¹.
The restrictions on international travel meant that training was provided through local resources with guidance from subject matter experts. We also shared experience with our peers from the extractive industry and focused on promoting human rights and security in a non-operated context.
Security
¹ Locations where we employ security personnel, where we contract services in countries without strong regulatory control
of the industry and where third-party suppliers are required or given a mandate to carry weapons by the authorities.
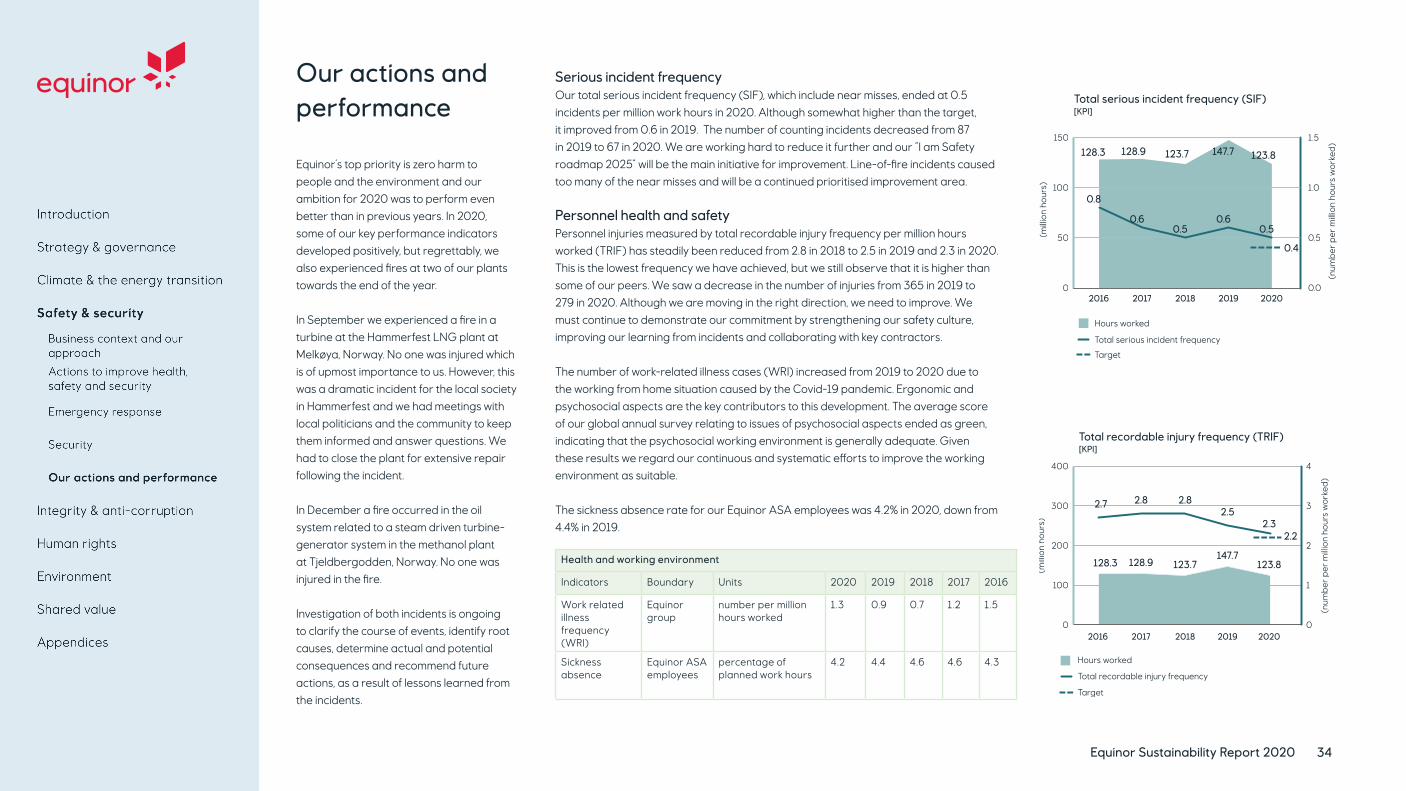
Equinor Sustainability Report 2020 34
Our actions and performance
Equinor’s top priority is zero harm to people and the environment and our ambition for 2020 was to perform even better than in previous years. In 2020, some of our key performance indicators developed positively, but regrettably, we also experienced fires at two of our plants towards the end of the year.
In September we experienced a fire in a turbine at the Hammerfest LNG plant at Melkøya, Norway. No one was injured which is of upmost importance to us. However, this was a dramatic incident for the local society in Hammerfest and we had meetings with local politicians and the community to keep them informed and answer questions. We had to close the plant for extensive repair following the incident.
In December a fire occurred in the oil system related to a steam driven turbine-generator system in the methanol plant at Tjeldbergodden, Norway. No one was injured in the fire.
Investigation of both incidents is ongoing to clarify the course of events, identify root causes, determine actual and potential consequences and recommend future actions, as a result of lessons learned from the incidents.
Serious incident frequencyOur total serious incident frequency (SIF), which include near misses, ended at 0.5 incidents per million work hours in 2020. Although somewhat higher than the target, it improved from 0.6 in 2019. The number of counting incidents decreased from 87 in 2019 to 67 in 2020. We are working hard to reduce it further and our “I am Safety roadmap 2025” will be the main initiative for improvement. Line-of-fire incidents caused too many of the near misses and will be a continued prioritised improvement area.
Personnel health and safetyPersonnel injuries measured by total recordable injury frequency per million hours worked (TRIF) has steadily been reduced from 2.8 in 2018 to 2.5 in 2019 and 2.3 in 2020. This is the lowest frequency we have achieved, but we still observe that it is higher than some of our peers. We saw a decrease in the number of injuries from 365 in 2019 to 279 in 2020. Although we are moving in the right direction, we need to improve. We must continue to demonstrate our commitment by strengthening our safety culture, improving our learning from incidents and collaborating with key contractors.
The number of work-related illness cases (WRI) increased from 2019 to 2020 due to the working from home situation caused by the Covid-19 pandemic. Ergonomic and psychosocial aspects are the key contributors to this development. The average score of our global annual survey relating to issues of psychosocial aspects ended as green, indicating that the psychosocial working environment is generally adequate. Given these results we regard our continuous and systematic efforts to improve the working environment as suitable.
The sickness absence rate for our Equinor ASA employees was 4.2% in 2020, down from 4.4% in 2019.
Health and working environment
Indicators Boundary Units 2020 2019 2018 2017 2016
Work related illness frequency (WRI)
Equinor group
number per million hours worked
1.3 0.9 0.7 1.2 1.5
Sickness absence
Equinor ASA employees
percentage of planned work hours
4.2 4.4 4.6 4.6 4.3
Total serious incident frequency (SIF) [KPI]
Hours worked
Total serious incident frequency
Target
(milli
on h
ours
)
0
50
100
150
(num
ber
per
milli
on h
ours
wor
ked
)
0.0
0.5
1.0
1.5
2016 2017 2018 2019 2020
0.8
0.60.5
0.60.5
0.4
128.3 128.9 123.7 147.7 123.8
128.3 128.9 123.7147.7
123.8
Hours worked
Total recordable injury frequency
Target
(milli
on h
ours
)
0
100
200
300
400
(num
ber
per
milli
on h
ours
wor
ked
)
0
1
2
3
4
2.7 2.8 2.82.5
2.3
2016 2017 2018 2019 2020
Total recordable injury frequency (TRIF) [KPI]
2.2
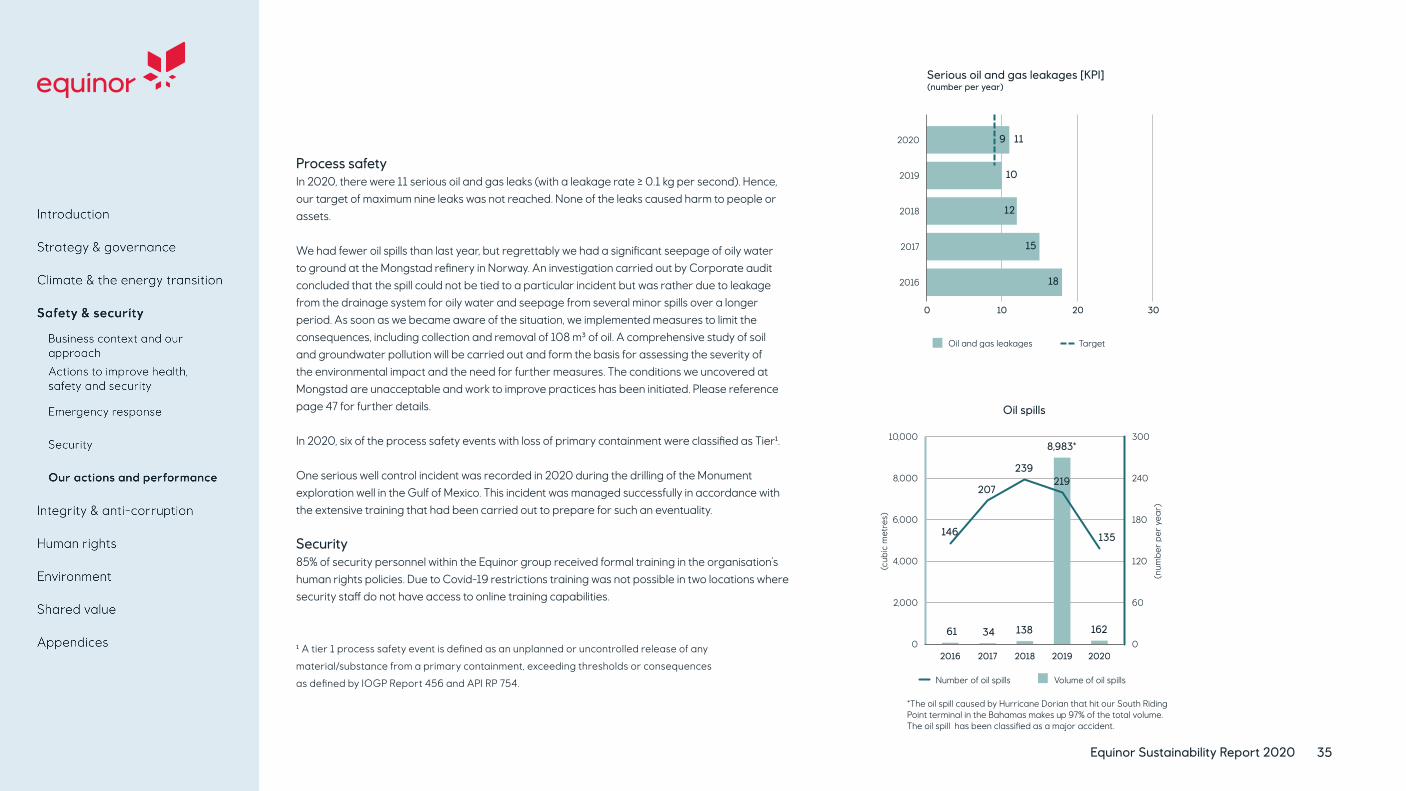
Equinor Sustainability Report 2020 35
Process safetyIn 2020, there were 11 serious oil and gas leaks (with a leakage rate ≥ 0.1 kg per second). Hence, our target of maximum nine leaks was not reached. None of the leaks caused harm to people or assets.
We had fewer oil spills than last year, but regrettably we had a significant seepage of oily water to ground at the Mongstad refinery in Norway. An investigation carried out by Corporate audit concluded that the spill could not be tied to a particular incident but was rather due to leakage from the drainage system for oily water and seepage from several minor spills over a longer period. As soon as we became aware of the situation, we implemented measures to limit the consequences, including collection and removal of 108 m³ of oil. A comprehensive study of soil and groundwater pollution will be carried out and form the basis for assessing the severity of the environmental impact and the need for further measures. The conditions we uncovered at Mongstad are unacceptable and work to improve practices has been initiated. Please reference page 47 for further details.
In 2020, six of the process safety events with loss of primary containment were classified as Tier¹.
One serious well control incident was recorded in 2020 during the drilling of the Monument exploration well in the Gulf of Mexico. This incident was managed successfully in accordance with the extensive training that had been carried out to prepare for such an eventuality.
Security85% of security personnel within the Equinor group received formal training in the organisation’s human rights policies. Due to Covid-19 restrictions training was not possible in two locations where security staff do not have access to online training capabilities.
¹ A tier 1 process safety event is defined as an unplanned or uncontrolled release of any
material/substance from a primary containment, exceeding thresholds or consequences
as defined by IOGP Report 456 and API RP 754.
Serious oil and gas leakages [KPI](number per year)
Oil and gas leakages Target
10 20 30
18
15
12
11
10
9
2016
2017
2018
2019
2020
0
Oil spills
Number of oil spills Volume of oil spills
(cub
ic m
etre
s)
0
2,000
4,000
6,000
8,000
10,000
(num
ber
per
yea
r)
0
60
120
180
240
300
61 34 138
8,983*
162
146
207
239219
135
2016 2017 2018 2019 2020
*The oil spill caused by Hurricane Dorian that hit our South Riding Point terminal in the Bahamas makes up 97% of the total volume. The oil spill has been classified as a major accident.

Integrity and anti-corruption
Equinor Sustainability Report 2020 36
Integrity & anti-corruption
Equinor is a global company and we are present in parts of the world where corruption is a high risk. Our strategy is to increase investments in new energy markets, so we have continued our work on ethics and compliance throughout 2020. We experienced renewed focus on certain aspects of our activities in Angola, in particular in relation to Equinor’s past contributions towards the establishment of an Angolan Research and Technology Centre (RTC) as part of the 2011 Kwanza license obligations. Equinor continues to follow-up the payments made towards the centre, which has not yet been built. Our commitment to conduct business in an ethical, socially responsible and transparent manner has during the Covid-19 pandemic remained the same. We have maintained an open dialogue on ethical issues, both internally and externally.
Code of Conduct The Code of Conduct sets out our commitment and requirements for how we do business at Equinor. It applies to our employees, board members and hired contractors. We train our employees on how to apply the Code of Conduct in their daily work and require all employees to confirm annually that they understand and will comply with the Code of Conduct. We expect our suppliers to act in a way that is consistent with our Code of Conduct and engage with them to help them understand our ethical requirements and how we do business. If the expectations are not met, we take appropriate actions.
Business context and our approach Material topic | Impact

Equinor Sustainability Report 2020 37
Tax transparency and payments to governments reporting We believe that through disclosure of payments to governments we promote accountability and build trust in the soci-eties where we operate. We have reported our payments to governments on a country-by-country basis for more than a decade. Since 2014, we have reported such payments on a project-by-project and legal entities basis, in our Annual Report and Form 20F. This reporting represents a core element of transparent corporate tax disclosure. Since 2018, we have published our global tax strategy, available online. In 2021 we will for the first time publish our “Tax Contribution Re-port”. This will provide further insight into our approach to tax, including use of low-tax jurisdictions, incentives and transfer pricing, and explaining why and where we pay the taxes we pay. These disclosures and explanations are in line with our commitment to conduct our business activities in a transparent way.
Anti-corruption Our Code of Conduct explicitly prohibits engaging in bribery and corruption in any form. Equinor’s Anti-Corruption Compliance Program summarises the standards, requirements and procedures implemented to comply with applicable laws and regulations and maintaining our high ethical standards. The Program lays down the foundation for ensuring that anti-bribery and corruption risks are identified, concerns are reported, and measures are taken to mitigate risk in all parts of the organisation. We have a global network of compliance officers who support the business in identifying and handling business integrity risks, and ensure that ethical and anti-corruption considerations are integrated into our activities no matter where they take place. Equinor provides regular training across the organisation to build awareness and understanding of the Anti-Corruption Compliance Program. Our workshops are designed to facilitate meaningful in-depth discussions on specific issues tailored to the nature or location of their work.
Competition and antitrust compliance Equinor’s Code of Conduct also addresses the requirement to comply with applicable competition and antitrust laws. Our Competition and Antitrust Program consists of governing documents and manuals, training of employees in high-risk positions as well as risk assessments and assurance activities.
Reporting and handling of concerns The Code of Conduct imposes a duty to report possible violations of the Code or other unethical conduct. We require leaders to take their control responsibilities seriously to prevent, detect and respond to ethical issues. Employees are encouraged to discuss concerns with their leader or the leader’s superior or use available internal channels to provide support. Concerns may also be reported through our Ethics Helpline which allows for anonymous reporting and is open to employees, business partners and the general public. Equinor has a strict non-retaliation policy.

Equinor Sustainability Report 2020 38
Our actions and performance
Code of Conduct An updated version of the Code of Conduct was released in 2020, ensuring that the Code incorporates the latest legal developments, internal requirements and that our expectations are made clear. An important change was to underscore the importance of our human rights commitment throughout our activities. To enhance accessibility, the Code was translated into more languages, and a Code of Conduct app was developed.
Our training efforts included general and targeted training and awareness sessions both in relation to new risks arising as a result of the Covid-19 pandemic and more generally. New e-learning programmes on Competition and anti-trust compliance and Trade controls were made available to all employees. Due to an increase in requests for donations following Covid-19, we also improved the process for handling donations.
Equinor marked the UN Anti-corruption day focusing on human costs of corruption.
Working with suppliers and partnersDuring 2020 we continued our interaction with suppliers and partners on ethics and anti-corruption regarding the risks we jointly face and actions that can be taken to address them. In order to address and mitigate corruption and fraud risk within the supply chain, new awareness and control activities were established during 2020. In Brazil, we provided comprehensive anti-corruption training for 322 people, representing more than 90 suppliers and service providers.
Collaboration and stakeholder engagementEquinor believes in the value of collective action to actively promote anti-corruption and revenue transparency. We have long standing relationships with the UN Global Compact, the World Economic Forum’s Partnering Against Corruption Initiative (PACI) and Transparency International (TI).
As a long-standing supporting company of the Extractive Industries Transparency Initiative (EITI), Equinor continued to participate in EITI multi-stakeholder groups at national level and held an EITI board position throughout 2020. Through this involvement we exchange knowledge and demonstrate continued commitment to good governance and increased transparency in the extractive sector.
Our performance The number of cases received through the Ethics Helpline was 183 in 2020, of which 113 were actual cases reported. This was a decrease from 2019. The cases included 55 reported concerns relating to harassment, discrimination and other conduct affecting the working environment. We experienced a decrease in the number of cases related to our suppliers.
The actions taken in order to mitigate the risks that arise from Covid-19 were in our opinion tailored and efficient. We recognise the importance of learning from previous experiences, inter alia as outlined in the review of Equinor’s US business. Looking ahead, and at a time when Equinor has an ambition to be a leader in the energy transition, we maintain our commitment to ethical, socially responsible and transparent business conduct.
Anti-corruption, Competition and antitrust complianceCovid-19 represented a global crisis that affected Equinor, our suppliers, partners, governments and society in 2020. During the crisis we focused on upholding our standards and the effectiveness of our programmes. Several measures have been taken to adapt to the situation, such as developing and conducting trainings digitally. We also held internal awareness sessions and contacted suppliers to emphasise our commitment to ethical business practice and zero tolerance for corruption, fraud or breaches of law, during the crisis.
87%of employees has completed the Code of Conduct course
30% (55)
10% (18)
12% (22)
38% (70)
1% (1)
9% (17)
Ethics helpline cases
People and workplace
Partners and supply chain
Asset and business integrity
Questions and tests
Environment and communities
Safety and security

Material topics | Impact
Equinor Sustainability Report 2020 39
Human rights
Business context and our approach
Our responsibility and commitment to ensuring the safety of our employees and those affected by our business, remain core to our strategic commitment “always safe”. Understanding and managing our risks to avoid harm to people, related to all our activities, stand firm and are consistent with the United Nations Guiding Principles (UNGPs) on Business and Human Rights, the ten principles of the Global Compact and the Voluntary Principles on Security and Human Rights. In 2020, we worked to further integrate human rights into our management system, build capacity to address and manage risks, and continued to embed human rights due diligence into our processes. The Covid-19 pandemic introduced a need for new ways of engaging with potentially affected stakeholders in a time where risks of human rights impacts were exacerbated.
Human rights in the supply chain
Human rights in communities

Equinor Sustainability Report 2020 40
Policy and positionsSince the adoption of our first Human rights policy in 2015, we have significantly improved our capabilities and integration of necessary processes and tools. In 2020, the Board of Directors approved an updated version of the policy. It addresses the most relevant human rights issues to Equinor, strengthens our expectations towards business partners and suppliers, and sets out clearer commitments regarding rights at particular risk, workers’ rights as well as access to remedy. The policy is available in 11 languages on our website. An internal information campaign which promoted the renewed policy achieved almost 11.000 views, and a webinar and updated material were made available as part of this effort.
In 2020, our CEO joined the World Business Council for Sustainable Development (WBCSD) Call to Action for Business Leadership on Human Rights. We also joined the Coalition for Responsible Business in Norway, a multi-stakeholder group requesting legislation on business and human rights. Additionally, we submitted a response to the formal hearing process concerning a potential new Norwegian law on human rights and supply chain transparency, including a general statement of support for legislation on human rights in alignment with the UNGPs.
Capability building Throughout 2020, we continued to build awareness of Equinor’s responsibility to respect human rights and invested in more specific training for prioritised teams and individuals. We have seen an increase in requests from the business areas for training and support to manage challenges. Stronger actions are being implemented as a result of better understanding.
Two new learning programs were offered as on-demand courses: • Human Rights in Practice: five modules of virtual training targeting operational level personnel working with
suppliers.
• Introduction to Human Rights: a three-hour course targeting all employees with a role where management of human rights risks is relevant.
Relevant management teams received targeted awareness sessions throughout 2020, and business development leaders and professionals were trained in a new framework for human rights due diligence in business development projects. Onboarding programmes for existing and new human rights practitioners were provided, and safety and sustainability leaders received training on how human rights due diligence requirements are embedded in the enterprise risk management system. In addition, we added a community liaison officer to our South Korean team to ensure effective and sustained dialogue with local communities.
External voice “The UN Guiding Principles on Business and Human Rights(UNGPs) make clear that doing business with respect for human rights is a societal expectation of all companies everywhere. It is also critical for any business that wants to get ahead of risks to its own reputation, operations and sustainability, which is why we see ever more investors scrutinizing this area of companies’ performance as well. Equinor’s leadership has embraced this reality. Further success will require top-level acceptance that not everything is a comfortable ‘win-win’ scenario: when respect for human rights is really part of corporate culture, it shows up in the tough situations where dilemmas arise and short-term financial interests may need to come second to larger and longer-term objectives. It takes time to build a strong culture of respect for people in any company, and it takes effort and commitment to maintain it. Equinor is well-placed to model how this can be done, recognizing the value of this investment in the company’s future.” Caroline ReesPresident Shift

Equinor Sustainability Report 2020 41
Our actions and performance
significant findings were found across nine companies. These findings are seen as possible markers of forced labour. In addition, suppliers have performed their own verifications. In 2020, based on our follow-up work, two assets have registered forced labour risks of significance, requiring mitigating actions or further investigation (one risk of significance was registered before 2020). Actions implemented related to forced labour risks have included the implementation of the employer pays principle and the reimbursement of recruitment fees, both for direct suppliers and sub-suppliers. In addition, further verifications to assess risks and verify implemented actions are planned for 2021.
Human rights during Covid-19 During the pandemic, there was an increased risk of impacts on vulnerable workers, employees and business partners, particularly in high risk contexts. We continued to track and adapt to the situation as it developed throughout the year.
We developed specific guidelines on the implications of the Covid-19 pandemic for supply chain workers to aid conversations with suppliers and to help inform risk assessments throughout the business. A letter to Equinor’s suppliers was issued in May, addressing the increased risk of compromising the human rights of workers due to Covid-19, reiterating our human rights commitment and supplier expectations and encouraging an open dialogue on dilemmas. Discussions of the implications of the pandemic on vulnerable supply chain workers took place with the
Human rights risk assessments The requirement for performing human rights risk assessments is an integrated part of the corporate risk management system and framework.
During 2020, risk assessments that include human rights risks have been conducted for 32 projects and assets (including operated and non-operated) in 24 countries.
Equinor and partners, through a third-party expert, are closely monitoring the government-led compensation and resettlement process (to release an area for a possible future LNG plant) in Tanzania that took place during 2020. Actions to address the impact to affected households are in process.
Third-party experts were engaged to perform human rights impact assessments and to develop action plans related to our offshore wind projects in South Korea. Forced and compulsory labour is defined as one of our salient issues and identified as a risk at construction sites in countries where use of migrant labour is common. Through 2020, Equinor used external experts to identify gaps through focused worker dialogues, and to support suppliers in defining and following through improvement measures. Targeted training has been provided to resources managing activities where those risks are prevalent.
Through Equinor’s human rights assessments of suppliers and sub-suppliers in 2020, a total of 27
Corporate Executive Committee and a human rights risk report related to Covid-19 was presented to the CEO and to the BoD.
The pandemic limited the access to construction sites and triggered the need for new ways of conducting onsite assessments and engaging with supply chain workers. A new protocol was developed to this end. Further examples of how we dealt with this challenge is available on our website.
Embedding human rights due diligence in how we work We continued to embed human rights due diligence in the internal supply chain management process, to enable more effective risk management in new procurements. Our requirements seek to focus our efforts on the most severe risks, including making sure our commercial requirements do not drive salaries below living wage. We also established a practical guide to support an effective dialogue with suppliers on how to meet the expectations.
A new framework for human rights due diligence in Business Development projects was developed and implemented through targeted training sessions and communication.
The Human Rights Steering Committee met on five occasions during 2020 and reported our efforts to the BoD SSEC twice. Equinor’s main human rights risks, discussions on specific dilemmas, as well as training on human rights risk assessments, policy, ambitions and human rights in light of Covid-19, were addressed.
In 2020 we established an internal human rights network, aiming to ensure consistent internal information, share good practices and discuss dilemmas. The network met five times.

Equinor Sustainability Report 2020 42
Collaborating to have greater impact In 2020, we continued engagement with Norwegian industrial companies to discuss expectations towards business and common challenges in implementing the UNGPs. We also continued supporting the Joint Industry initiative on human rights in the supply chain, where Norwegian Oil and Gas facilitates the sharing of human rights assessments performed by third parties. We shared and promoted the use of our Human Rights Expectations of Suppliers and supporting Guidance and contributed towards embedding the UNGPs in a common “supply chain qualification standard” for the Norwegian oil and gas industry.
We collaborated with peers and partners in specific projects to jointly address human rights risks and continued our membership and active participation in the Shift Business Learning Program and IPECA. We interacted with FOKUS addressing women’s rights and promoted the SheDil tool to aid human rights due diligence related to women. We presented our approach to human rights and the conduct of security providers to the Voluntary Principles on Security and Human Rights members.
Evaluating our own performance and looking ahead Through 2020, we saw more active and specific engagement on human rights internally, exemplified by broader and earlier involvement of corporate human rights experts by project teams and business lines. We evolved our internal leadership dialogue from policy and expectations towards issues and issue management, and increased our engagement with suppliers, peers and associations, offering insights and experiences to enable a more open discussion on challenges and how to manage them. Through our investments in utilising the enterprise risk management system to assess and address risks, discussion about actual risks and their mitigations was brought to executive management and board level. This, in turn, strengthens accountability and urgency in taking action to minimise, mitigate or remedy.
The 2020 performance numbers for human rights verifications, show a lower total number of findings compared to 2019 and 2018. The Covid-19 pandemic led to a lower number of Human Rights assessments in 2020. The identified number of findings in the various categories show that working hours and wages, as well as preventing modern slavery are still issues that need particular focus.
Our journey continues in 2021, focusing on more consistently performing human rights assessments in existing high-risk assets and new projects. We will also initiate an assessment of our policy by engaging external and internal stakeholders and experts. We aim to further focus and deepen our supply chain work around prioritised areas, including more targeted efforts to build capabilities with key suppliers and finding effective ways to address risks in lower tier suppliers.
Labour rights and working conditions in the supply chain
Indicators Boundary Units 2020 2019 2018 2017 2016
Supplier human rights (HR) verifications conducted
Equinor group number 37 50 75 41 65
Workers interviewed Equinor group number 343 650 1,000 n/r n/r
Countries in which supplier HR
verifications undertakenEquinor group number 9 16 20 16 21
Employees working with our suppliers trained (class room course)
Equinor group, operational control
number per year
190 409 514 260 800
In 2020, we engaged Shift to assist in developing leading indicators to assess our human rights performance in terms of leadership. We have defined six monitoring indicators in support of the improvement agenda for 2021. The longer-term goal is to develop a balanced scorecard of leading and lagging indicators to measure both investments in and outcomes of our human rights efforts.
Human rights verificationsManagement system
Ensuring fair treatment and non-discrimination
Providing safe, healthy and secure workplace and accomodation
Providing fair wages and reasonable working hours
Respecting freedom of assembly, association and the right to collective bargaining
Preventing modern slavery
Preventing child labour and protecting young workers
Respecting a�ected community members
Providing access to remedy
Subcontracting
31
15
37
20
10
75
35
15
58

Material topics | Impact
Equinor Sustainability Report 2020 43
Environment Biodiversity, oceans and sensitive areas
Business context and our approach We value the importance of our planet’s natural environment and strive to adhere to high standards to responsibly manage our environmental impact. Being a large offshore oil and gas operator and a growing offshore wind power provider, biodiversity and sensitive areas in the marine environment are of particular importance. In this respect, significant environmental aspects to manage include discharges of produced and processed water to sea, spills, drilling waste, use of areas and emissions of sound from our operations.
Additional important environmental aspects include NOx emissions from power and heat generation at many installations, plants and drilling rigs, and SOx emissions from our refineries, drilling rigs and some of our offshore installations. In our onshore US operations, water sourcing and usage for the hydraulic fracturing process and waste management of produced and flowback water are additional important aspects.
Our environmental management approach entails environmental risk and impact assessments in planning phases before operations or development activities. It also includes environmental baseline studies, surveys, monitoring programmes and collaborative research projects to build knowledge. Our approach includes establishing measures tailored to local conditions aiming at avoiding, minimising, mitigating or offsetting negative effects. We regularly assess our performance through reviews and assurance activities and set actions to improve when needed. Our environmental work is guided by our commitments to prevent harm to the environment, to apply the precautionary principle and to comply with all applicable environmental laws and regulations.
Biodiversity, oceans & sensitive areas
Air emissions, water and waste

performed showing depth-dependent colonisation on the hard substrates.
In 2020, we have continued to develop methodologies and improve our understanding of potential impacts from our operations on marine mammals. We have monitored the presence, abundance, diversity and migration of marine mammals in the south western area of the Barents Sea, through deployment of passive acoustic monitoring stations over the Johan Castberg field development area. Because of the limited anthropogenic activity recorded in the study area, the results provided a good baseline against which to assess the occurrence of marine mammals in the study area in the future. Species diversity and call activity was found to be low, but marine mammals were present throughout the 9 months monitoring period.
As part of our continued effort to protect the critically endangered North Atlantic right whale, we have continued our collaboration with Wildlife Conservation Society and Woods Hole Oceanographic Institute to monitor, in real-time, the presence of whales in the Empire Wind lease area in the US by use of two real-time passive acoustic buoys. Our Beacon Wind project is collaborating with Woods Hole Oceanographic Institute on a study to evaluate the effectiveness of thermal imaging technology for monitoring the presence of large whales and sea turtles in periods of poor visibility. This technology has the potential to digitalize marine mammal monitoring and reduce the number of people needed offshore compared to traditional human observations.
Equinor Sustainability Report 2020 44
Our environmental performance varies over time in line with variations in the operational activity level and type. Turnarounds, start-ups, the number of drilling and well operations, temporary operational irregularities and production curtailments imposed by the authorities are main factors influencing positive and negative changes in performance data. In light of these variations, our environmental performance is considered to be in line with our aim to prevent harm to the environment.
Our actions and performanceIn response to the growing concerns related to loss of biodiversity, we have in 2020 started to further develop our management approach to biodiversity. A corporate project has been established to better understand our most material impacts and to develop a new corporate position and an improvement plan for how biodiversity aspects can be better managed in our projects and operations. Equinor is supporting a strong post-2020 global biodiversity framework and in September 2020, signed the Business for Nature coalition’s Call to Action “Nature is everyone’s business” launched during the United Nations General Assembly. In parallel with the above improvement project, many biodiversity-related activities have continued or were started in 2020. Some highlights are given below.
The UN Environment Programme World Conservation Monitoring Centre has, together with industry and conservation partners, developed a methodology for biodiversity indicators for site-based impacts. Equinor has successfully piloted this methodology on Sheringham Shoal Offshore Wind Farm. To better understand how relevant and applicable the methodology is to document biodiversity performance of assets across the portfolio, Equinor is currently undertaking a more
comprehensive test of the methodology including assets of different types, activities and geographic locations, including the onshore Bakken asset in the USA.
Equinor together with the Institute of Marine Research, took the initiative to install the first measurement instrument on the seabed off Vesterålen, northern Norway, seven years ago. An expanded ocean observatory was opened in 2020. There are seven instrument platforms that extend from shore and out to a depth of 2,500 meters. Real-time data from the ocean environment provides important knowledge and contributes toward better insights into marine processes and the understanding of marine ecosystems. As an example, there has been research activity on analysing images of cold-water corals to better understand natural variations and behaviour as a result of changes in physical and chemical parameters. Results from such projects provide important input for the authorities’ work on the management plans for the northernmost ocean areas.
The invasive sun coral continues to be a challenge offshore Brazil. To control the presence of this invasive species in the Peregrino field, the risk tool developed to assess the potential of spreading from vessels operating in the field, has been applied to vessels deployed in the installation of the wellhead platform C. This has enabled good risk management towards this invasive species.
Floating wind installations are in greater water depths and in many cases further away from shore than conventional bottom-fixed turbines. Through field studies in our Hywind Scotland floating wind park, valuable knowledge on the potential influence of floating wind installations on biodiversity has been gained. In 2020, a study on marine growth on the substructures was

45Equinor Sustainability Report 2020
Sound measurement equipment has been deployed in the Hywind Scotland floating wind park to measure sound from the wind park operations and to achieve input to modelling of possible implications of underwater sound on marine mammals and fish, using scientifically acknowledged thresholds for impacts.
In 2020, Equinor launched geophysical surveys for its Beacon Wind lease area offshore US east coast using a survey remotely operated vehicle (SROV). This is the first time this technology has been applied in the US offshore wind industry. MMT (a marine survey company) and Reach Subsea, under contract with Equinor, have implemented this innovative technology that will help mitigate potential impacts to protected species like marine mammals and sea turtles. Using the SROV, MMT is able to substantially reduce the potential effect zone by moving the sound sources close to the seabed and improve operational efficiency and data quality. With the growth in the offshore wind industry and the resulting increasing drive to map the seafloor, innovations like this contribute to our efforts towards responsible offshore wind development and operations.
The Spissa exploration well was drilled in 2020 in the production licence 960 in the Norwegian Barents Sea. The well was located 53km from the coastline, within the particularly valuable and sensitive area called Tromsøflaket and close to the Sotbakken coral area. A very strong focus was placed on understanding and mitigating the environmental risks associated with drilling in this environment, and on setting in place a robust emergency response plan and organisation that could act rapidly in the unlikely event that an incident
occurred. Preparations included the drilling of a ‘pilot hole’ a short distance away from the expected oil and gas accumulation, to collect detailed information on the drilling conditions that would be encountered in the well. Before drilling the well, meetings with local municipalities and fishermen were important to inform about the activity and receive feedback from other users of the area. The drilling operation, which did not discover hydrocarbons of commercial interest, was carried out successfully with no environmental incidents.
In line with our collaborative core value, we want to leverage our effort related to biodiversity through collaboration and partnerships with others. Examples where we already do this include the joint industry working group on biodiversity and ecosystem services in IPIECA and IOGP, the Proteus partnership with the UNEP World Conservation Monitoring Centre, MARAMBS (Marine Animal Ranging Assessment Model Barents Sea) and SEATRACK, a seabird tracking programme covering the North-East Atlantic.
Collaboration with others is also needed to take full advantage of the global offshore wind potential. Together with Ørsted, Equinor has spearheaded a global energy initiative to help governments around the world increase their offshore wind capacity. The Ocean Renewable Energy Action Coalition (OREAC) was formed in support of the High Level Panel for a Sustainable Ocean Economy. Working together with industry partners and NGOs OREAC has produced a vision and roadmap to support the sustainable scale-up of ocean-based renewable energy and to achieve 1,400 GW of offshore wind by 2030.
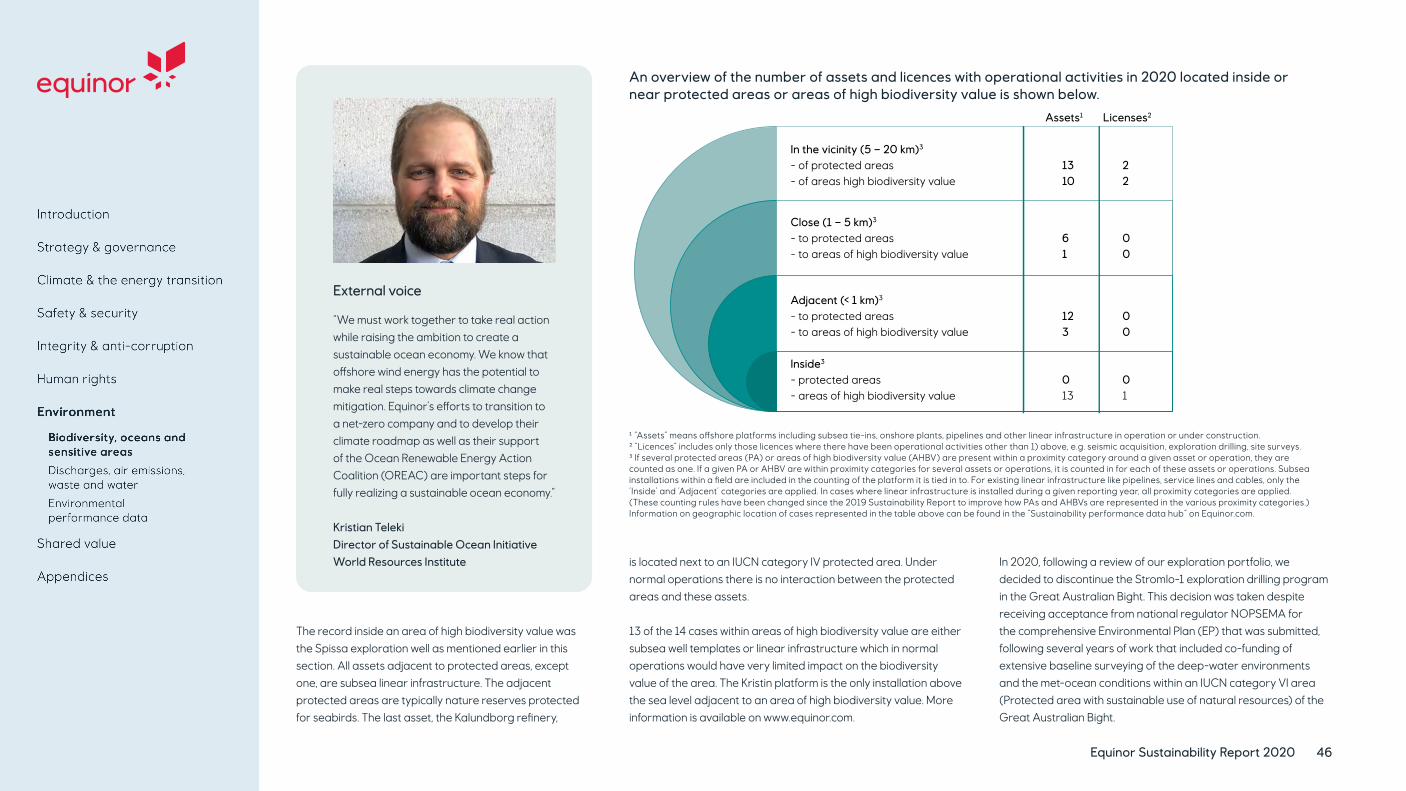
Assets1 Licenses2
In the vicinity (5 – 20 km)3
- of protected areas 13 2- of areas high biodiversity value 10 2
Close (1 – 5 km)3
- to protected areas 6 0- to areas of high biodiversity value 1 0
Adjacent (< 1 km)3
- to protected areas 12 0- to areas of high biodiversity value 3 0
Inside3
- protected areas 0 0- areas of high biodiversity value 13 1
Equinor Sustainability Report 2020 46
An overview of the number of assets and licences with operational activities in 2020 located inside or near protected areas or areas of high biodiversity value is shown below.
External voice
“We must work together to take real action while raising the ambition to create a sustainable ocean economy. We know that offshore wind energy has the potential to make real steps towards climate change mitigation. Equinor’s efforts to transition to a net-zero company and to develop their climate roadmap as well as their support of the Ocean Renewable Energy Action Coalition (OREAC) are important steps for fully realizing a sustainable ocean economy.”
Kristian TelekiDirector of Sustainable Ocean InitiativeWorld Resources Institute
¹ “Assets” means offshore platforms including subsea tie-ins, onshore plants, pipelines and other linear infrastructure in operation or under construction. ² “Licences” includes only those licences where there have been operational activities other than 1) above, e.g. seismic acquisition, exploration drilling, site surveys. ³ If several protected areas (PA) or areas of high biodiversity value (AHBV) are present within a proximity category around a given asset or operation, they are counted as one. If a given PA or AHBV are within proximity categories for several assets or operations, it is counted in for each of these assets or operations. Subsea installations within a field are included in the counting of the platform it is tied in to. For existing linear infrastructure like pipelines, service lines and cables, only the ‘Inside’ and ‘Adjacent’ categories are applied. In cases where linear infrastructure is installed during a given reporting year, all proximity categories are applied. (These counting rules have been changed since the 2019 Sustainability Report to improve how PAs and AHBVs are represented in the various proximity categories.) Information on geographic location of cases represented in the table above can be found in the “Sustainability performance data hub” on Equinor.com.
The record inside an area of high biodiversity value was the Spissa exploration well as mentioned earlier in this section. All assets adjacent to protected areas, except one, are subsea linear infrastructure. The adjacent protected areas are typically nature reserves protected for seabirds. The last asset, the Kalundborg refinery,
is located next to an IUCN category IV protected area. Under normal operations there is no interaction between the protected areas and these assets.
13 of the 14 cases within areas of high biodiversity value are either subsea well templates or linear infrastructure which in normal operations would have very limited impact on the biodiversity value of the area. The Kristin platform is the only installation above the sea level adjacent to an area of high biodiversity value. More information is available on www.equinor.com.
In 2020, following a review of our exploration portfolio, we decided to discontinue the Stromlo-1 exploration drilling program in the Great Australian Bight. This decision was taken despite receiving acceptance from national regulator NOPSEMA for the comprehensive Environmental Plan (EP) that was submitted, following several years of work that included co-funding of extensive baseline surveying of the deep-water environments and the met-ocean conditions within an IUCN category VI area (Protected area with sustainable use of natural resources) of the Great Australian Bight.
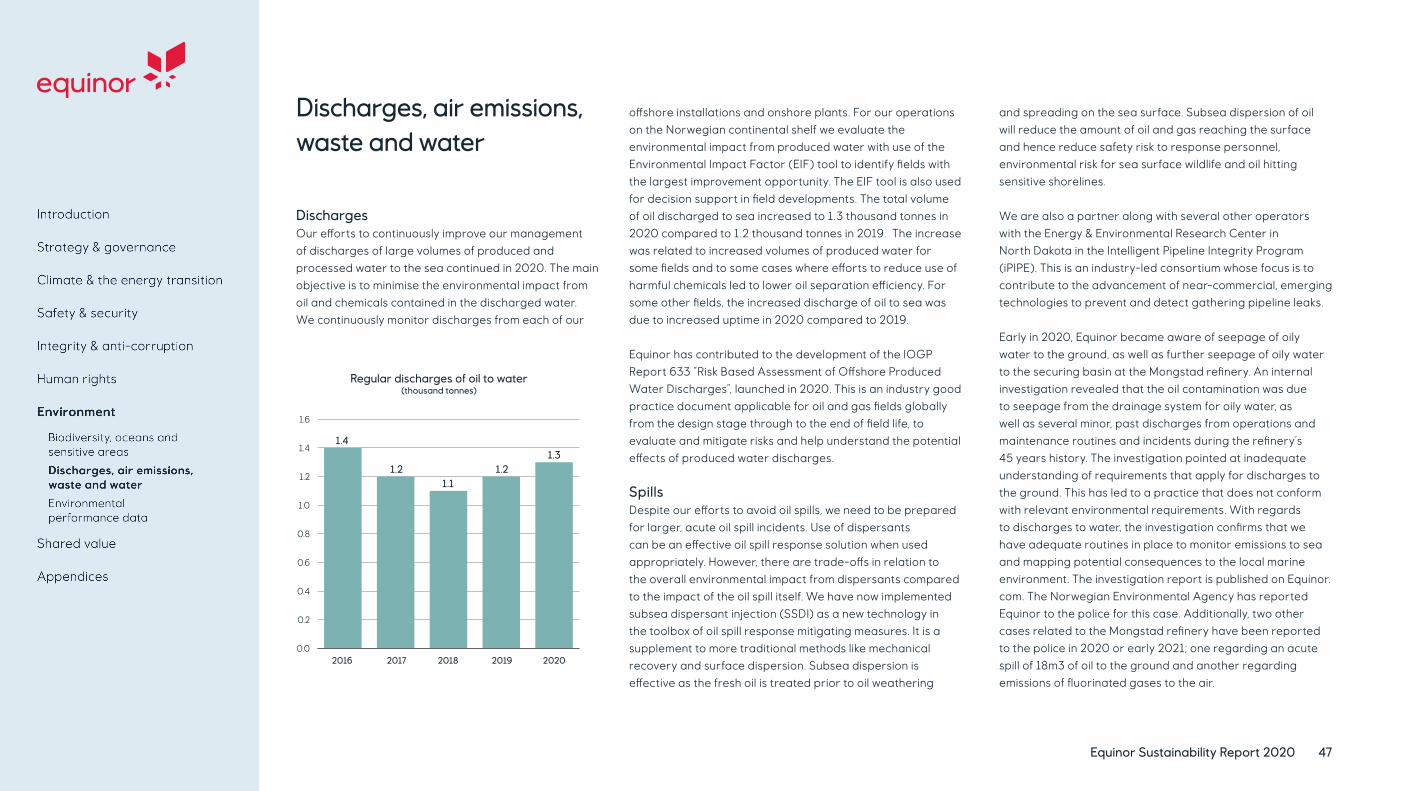
Equinor Sustainability Report 2020 47
Discharges, air emissions, waste and water
DischargesOur efforts to continuously improve our management of discharges of large volumes of produced and processed water to the sea continued in 2020. The main objective is to minimise the environmental impact from oil and chemicals contained in the discharged water. We continuously monitor discharges from each of our
offshore installations and onshore plants. For our operations on the Norwegian continental shelf we evaluate the environmental impact from produced water with use of the Environmental Impact Factor (EIF) tool to identify fields with the largest improvement opportunity. The EIF tool is also used for decision support in field developments. The total volume of oil discharged to sea increased to 1.3 thousand tonnes in 2020 compared to 1.2 thousand tonnes in 2019. The increase was related to increased volumes of produced water for some fields and to some cases where efforts to reduce use of harmful chemicals led to lower oil separation efficiency. For some other fields, the increased discharge of oil to sea was due to increased uptime in 2020 compared to 2019. Equinor has contributed to the development of the IOGP Report 633 “Risk Based Assessment of Offshore Produced Water Discharges”, launched in 2020. This is an industry good practice document applicable for oil and gas fields globally from the design stage through to the end of field life, to evaluate and mitigate risks and help understand the potential effects of produced water discharges.
SpillsDespite our efforts to avoid oil spills, we need to be prepared for larger, acute oil spill incidents. Use of dispersants can be an effective oil spill response solution when used appropriately. However, there are trade-offs in relation to the overall environmental impact from dispersants compared to the impact of the oil spill itself. We have now implemented subsea dispersant injection (SSDI) as a new technology in the toolbox of oil spill response mitigating measures. It is a supplement to more traditional methods like mechanical recovery and surface dispersion. Subsea dispersion is effective as the fresh oil is treated prior to oil weathering
and spreading on the sea surface. Subsea dispersion of oil will reduce the amount of oil and gas reaching the surface and hence reduce safety risk to response personnel, environmental risk for sea surface wildlife and oil hitting sensitive shorelines.
We are also a partner along with several other operators with the Energy & Environmental Research Center in North Dakota in the Intelligent Pipeline Integrity Program (iPIPE). This is an industry-led consortium whose focus is to contribute to the advancement of near-commercial, emerging technologies to prevent and detect gathering pipeline leaks.
Early in 2020, Equinor became aware of seepage of oily water to the ground, as well as further seepage of oily water to the securing basin at the Mongstad refinery. An internal investigation revealed that the oil contamination was due to seepage from the drainage system for oily water, as well as several minor, past discharges from operations and maintenance routines and incidents during the refinery’s 45 years history. The investigation pointed at inadequate understanding of requirements that apply for discharges to the ground. This has led to a practice that does not conform with relevant environmental requirements. With regards to discharges to water, the investigation confirms that we have adequate routines in place to monitor emissions to sea and mapping potential consequences to the local marine environment. The investigation report is published on Equinor.com. The Norwegian Environmental Agency has reported Equinor to the police for this case. Additionally, two other cases related to the Mongstad refinery have been reported to the police in 2020 or early 2021; one regarding an acute spill of 18m3 of oil to the ground and another regarding emissions of fluorinated gases to the air.
Regular discharges of oil to water (thousand tonnes)
0.0
0.2
0.4
0.6
0.8
1.0
1.2
1.4
1.6
1.4
1.21.1
1.21.3
2016 2017 2018 2019 2020

Equinor Sustainability Report 2020 48
Emissions to airEmissions of NOx are mainly related to combustion of hydrocarbon fuels for generation of electric power needed at our platforms and drilling rigs. Reductions of NOx emissions can be achieved through energy optimisation measures, fuel substitution or most significantly if hydrocarbon-fuelled power generation is replaced with renewable electric power. At the Mariner A platform, a new fuel gas system installed late 2019 has allowed power generation in 2020 to be based on produced gas instead of diesel. As a consequence, the diesel consumption and NOx emissions from Mariner were reduced by 90% and 73%, respectively, compared to 2019. Other causes to the 12% reduction in our total NOx emissions from 2019 to 2020 were the divestment of Eagle Ford, less power demand as a consequence of government-induced production cuts in Norway and less drilling activity. The sanctioned electrification projects for the Gullfaks and Snorre fields through the offshore wind farm Hywind Tampen and the electrification of the Sleipner field with power from shore are planned to reduce annual NOx emissions from these fields by around 1,600 tonnes.
Emissions of SOx were 40% lower in 2020 compared to last year, mainly because the sulphur treatment unit at the Mongstad refinery has been back in normal operations after the turnaround in 2019 and due to the shut-in of Peregrino for almost three quarters of 2020.
WasteOur activities involve handling large volumes of different types of waste, among which drill cuttings and contaminated water constitute the largest volumes. Our approach to waste management follows the mitigation hierarchy and waste handling systems are set up in close collaboration with waste contractors, which also handle the downstream part of our waste chain. Our reporting of waste quantities has from 2020 been adjusted to be in accordance with the new GRI reporting standard. This implies an increased granularity and that waste incinerated with energy recovery is no longer defined as a recovery method, but a
disposal method. Compared to the previous year there is a slight increase in hazardous waste volume to 318 thousand tonnes. The non-hazardous waste volume was reduced from 40 to 29 thousand tonnes mainly due to decrease in polluted soil and less tank washes at the Kalundborg refinery. Exempt waste volumes decreased significantly due to divestment from Eagle Ford and less drilling and well operations onshore US. Waste recovery rates were 70% and 49% for hazardous and non-hazardous waste, respectively.
In 2020, Equinor gathered valuable experiences from thermomechanical cuttings cleaning (TCC) for oiled drill cuttings on the Johan Sverdrup and Mariner fields. In the TCC process, oil is removed from the drill cuttings through mechanical friction and heating. The cleaning process reduces the oil content on the cuttings to meet offshore discharge regulations. The discharge option has lower safety risk and costs compared with the transport to shore option, due to reduced need for lift operations, transport of waste to shore and further handling of the waste to onshore storage.
We did not decommission any facilities in 2020. We are currently planning for decommissioning of the Heimdal and Veslefrikk fields and will strive for energy-efficient and sound environmental solutions when choosing removal methods for the installations that will be taken to shore for dismantling and disposal.
Freshwater useGiven the abundant availability of freshwater for our Norwegian and Danish onshore plants, and the limited use of freshwater in our offshore operations, the use of freshwater in our US onshore shale operations is the most material freshwater issue to us. The dominant freshwater use in our US onshore operations is for hydraulic fracturing operations of production wells in the Bakken tight oil asset and Appalachian basin shale gas asset. The withdrawn volume of freshwater for these two assets decreased by 71% to 1.2 million cubic meters in 2020 compared to the previous year mainly caused by divestment of Eagle Ford and
less hydraulic fracturing operations. The water is mainly withdrawn from the Missouri and Ohio rivers which are considered robust water sources with throughputs several orders of magnitude larger than our withdrawal. The environmental impacts from our water withdrawals are therefore considered low. Flowback and produced water from our US onshore operations is disposed of by deep well injection in disposal facilities operated by Equinor or third-parties, both permitted and regulated by the applicable state.
In 2020 Equinor has not had production from or withdrawn water from areas of high or extremely high baseline water stress as described by the Aqueduct® tool (owned by World Resources Institute).
In our US onshore shale operations, we follow standards for the types and volumes of chemicals used in drilling and hydraulic fracturing fluids and disclose the chemicals used in hydraulic fracturing through FracFocus¹.
Performance evaluationThe results on discharges of oil to sea show that there is a need for continuing our efforts to minimise the environmental impact from produced water. Regarding the seepage of oil to the ground at the Mongstad refinery, we find the conditions unacceptable. In addition to operative measures on site, we have commenced work to improve knowledge and ensure compliance with all requirements for discharges to the ground. The reductions in generated waste, NOx and SOx emissions and our US onshore freshwater withdrawal are, as described above, mainly caused by changes in operational conditions, activity level and our asset portfolio. Although these changes have been unusually large for 2020 compared to earlier years, we consider our performance in these areas to be satisfactory.
¹ The US national hydraulic fracturing chemical registry

Equinor Sustainability Report 2020 49
Indicators Boundary Units 2020 2019 2018 2017 2016
Acid gases and non-methane volatile organic compounds
Sulphur oxides (SOx) Operational control thousand tonnes 1.3 2.2 1.8 1.7 1.8
Nitrogen oxides (NOx) Operational control thousand tonnes 36 41 42 40 39
Non-methane volatile organic compounds (nmVOC) Operational control thousand tonnes 35 40 46 49 49
Regular discharges of oil to water Operational control thousand tonnes 1.3 1.2 1.1 1.2 1.4
Waste and discharges to water
Hazardous waste generated [1] Operational control thousand tonnes 318 313 244 296 438
Hazardous waste recovery rate [2] Operational control % 70 n/r n/r n/r n/r
Exempt waste generated: cuttings and solids [1] Operational control thousand tonnes 17 84 55 105 81
Exempt waste generated: produced water and flowback [1] Operational control million m³ 5 7 6 5 4
Non-hazardous waste generated Operational control thousand tonnes 29 40 31 34 50
Non-hazardous waste recovery rate [2] Operational control % 49 n/r n/r n/r n/r
Chemicals use
Hydraulic fracking chemicals use [3] Operational control thousand tonnes 7 35 41 47 17
Freshwater use
Total freshwater withdrawal [4] Operational control million m³ 8 12 13 12 11
Share of production in areas of high water stress [5] Operational control % 0 0 2.1 1.6 NR
[1] Drill cuttings and produced and flow-back water from our US onshore operations
are exempt from regulation as hazardous waste. These are therefore not included in the
hazardous waste and waste recovery figures.
[2] Our reporting of waste quantities has from 2020 been adjusted to be in accordance
with the new GRI reporting standard. This implies an increased granularity and that waste
incinerated with energy recovery is no longer defined as a recovery method, but a disposal
method.
[3] Related to our US Onshore operations.
[4] Total freshwater withdrawal is for Equinor activities equal to total freshwater consumption, since no
water is returned to source. All our freshwater withdrawals are from sources not located in areas of high or
extremely high baseline water stress (ref. Aqueduct ®)
[5] The hydrological model in the Aqueduct® tool was updated in 2019. This change had as impact that our
US onshore assets were no longer within the categories high and extremely high baseline water stress.
Environmental performance data
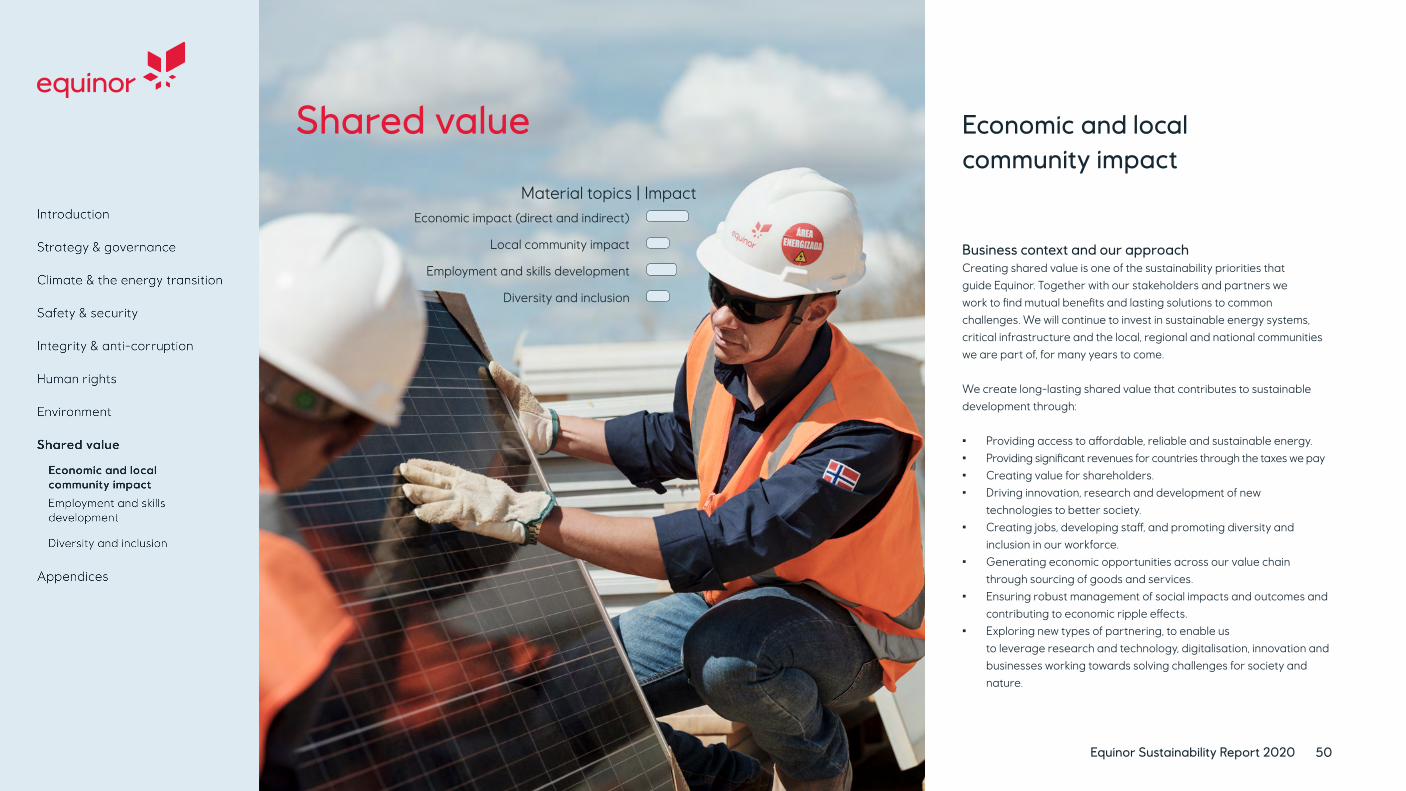
Material topics | Impact
Equinor Sustainability Report 2020 50
Shared value
Economic impact (direct and indirect)
Local community impact
Employment and skills development
Diversity and inclusion
Economic and local community impact
Business context and our approachCreating shared value is one of the sustainability priorities that guide Equinor. Together with our stakeholders and partners we work to find mutual benefits and lasting solutions to common challenges. We will continue to invest in sustainable energy systems, critical infrastructure and the local, regional and national communities we are part of, for many years to come. We create long-lasting shared value that contributes to sustainable development through: • Providing access to affordable, reliable and sustainable energy. • Providing significant revenues for countries through the taxes we pay• Creating value for shareholders. • Driving innovation, research and development of new
technologies to better society. • Creating jobs, developing staff, and promoting diversity and
inclusion in our workforce. • Generating economic opportunities across our value chain
through sourcing of goods and services. • Ensuring robust management of social impacts and outcomes and
contributing to economic ripple effects. • Exploring new types of partnering, to enable us
to leverage research and technology, digitalisation, innovation and businesses working towards solving challenges for society and nature.

Equinor Sustainability Report 2020 51
Economic value creation and distribution Equinor operates primarily in OECD countries. Hence, our economic contributions to society are primarily in the form of taxes and other payments to governments, purchases of goods and services, wages and employee benefits and dividends to shareholders, rather than social investments.
Equinor is one of the ten largest contributors of taxes amongst the publicly listed companies in the world. We pay taxes according to our legal obligations, while also benefitting from available reliefs and incentives, such as those offered to us by the Norwegian temporary tax package.
Promoting partnership to rebuild the economy The devastating effects of the Covid 19-pandemic have been felt across the world in 2020. A just energy transition has been at the centre of many European government’s economic recovery plans to ‘build back better’ and governments are increasingly looking for sustainable solutions to rebuild the economy.
We believe the transition to more sustainable energy systems will offer unprecedented opportunities to both address climate change and contribute to tackling global systemic economic and social challenges.
With Equinor’s broad and international energy portfolio we can shape the energy transition to become an engine for growth and prosperity.
The challenge is too big to tackle on our own. Strong collaboration is required cross-sector, cross- industry and cross-country. We need to work with governments, suppliers, the research community and entrepreneurs, investors and consumers, to find common solutions along the whole value chain. Governments play an important role as a catalyst for collaboration, as demonstrated through initiatives for which significant milestones were reached in 2020:
• “Longship” is the largest climate project ever in the Norwegian industry and will contribute substantially to the development of carbon capture and storage (CCS) as an efficient mitigation measure. Equinor’s Northern Lights CO₂ transport and storage project, a partnership with Shell and Total, receives funding through this project.
• The UK’s Industrial Strategy Challenge Fund (ISCF) combines public and private funding to invest in projects that tackle big societal and industrial challenges. The Zero Carbon Humber consortium, that Equinor is a leading partner in, won funding from ISCF to drive forward a vision of the UK’s first net-zero carbon cluster.
• Equinor engaged in a range of activities to maintain project activity and support suppliers through the Covid 19-pandemic.
45.8 bn USDRevenues
-5.5 bn USDNet income
Purchase of goods and services
16.1 bn USD
Payments to governments
4.4 bn USD
Employee wages and benefits
3.7 bn USD
Dividends
2.3 bn USD
Social investments sponsorships and donations
21 million USD

Equinor Sustainability Report 2020 52
Supporting our suppliersEquinor worked closely with suppliers during the pandemic to reduce cost in a sustainable way, focusing on scope optimisation and efficiencies and sustainable operations for all parties.
Engaging local supply chains and work forceThriving local supply chains are important for regional economies, and for us as we invest in creating long-term infrastructure that will be operational for decades.
• In the US over 92% of contracts supporting operations have been awarded to US-based suppliers.
• To date over 80% of contracts supporting the Mariner operations have been awarded to UK-based suppliers. Continued support from the UK supply chain will be needed over the 30-year Mariner field-life.
• For Dogger Bank Wind Farm in the UK, we held nine online ‘Meet the Buyer’ supply chain webinars, enabling UK businesses across a wide range of disciplines to meet with the Dogger Bank project Team and Tier 1 contractors to understand how they could get involved.
• The Operations and Maintenance Base for the Dogger Bank Wind farm will be based in Port of Tyne. This is expected to generate over 200 operational jobs in the North East of England. The Port of Tyne’s vision to become one of the most environmentally sustainable ports in the UK by 2030 is aligned with the Dogger Bank ambitions.
• Increased activity in the Northern Area led to additional jobs at the Polar base.
Supporting supply chain innovation We supported our suppliers in developing new technology that can be used not only by Equinor but across the industry.
• In collaboration with supply base services provider, Asco, we developed a new initiative, Track and Trace, that has improved visibility of the full life cycle warehouse management system for our Mariner operations.
• In the UK, we have now confirmed that Dogger Bank will be the first project in the world to demonstrate GE’s 13 MW turbines, the largest and most powerful in operation.
Supporting startups through Equinor Ventures Through our corporate venture arm, Equinor Ventures, we invest in ambitious early phase and growth phase companies, providing venture capital, project-based funding of early phase ideas and an accelerator programme.
• Investments made in 2020 included companies pursuing energy from fusion, affordable carbon capture technology and underwater communication and positioning.
Sharing data to support innovation We believe our open source sharing of datasets could unlock value and innovation potential in the renewables and decarbonisation industry sectors which progressed during 2020.
• We continued to share data from Hywind Scotland, the world’s first floating offshore wind farm to enable accelerated development of floating offshore wind.
• We have committed to sharing data from the Northern Lights project which will support progression of other CCS projects.
Economic value created and distributed
Indicators Boundary Unit 2020 2019 2018 2017 2016
Tax contribution Equinor group billion USD 3.1 8.8 9.6 6.1 4.6
Total procurement spend Equinor group billion USD 16.1 18.4 17.4 17.5 18.0
Total share of spend locally Equinor group % 89 85 n/r n/r n/r
Equinor Sustainability Report 2020 53
Engaging with the community through the Covid-19 pandemic Equinor is proposing to extend its two existing offshore wind farms off the UK Norfolk Coast, Dudgeon and Sheringham Shoal. As part of the UK development process for new offshore wind farms, developers must consult with local communities and key stakeholders to seek feedback and gain local insight. When Covid-19 stopped all public information events, Equinor set up the first ever online offshore wind consultation; a virtual exhibition space and online platform where members of the public could find out about the projects and leave feedback. During the consultation over 1,600 people visited the site, more than would have been expected at face-to-face events. The platform continues to be used as a live information hub. Consultation information was also provided in hard copy to local libraries and sent via post to households, with paid return envelopes for providing feedback, so that those unable to use digital media still had the opportunity to have a say in the project.
Donations in response to the Covid-19 pandemicFurther to our planned annual donations, Equinor made additional contributions to support the global response to the pandemic. We donated USD 500,000 each to the Covid-19 Solidarity Response Fund for the WHO, hosted by the Swiss Philanthropy Foundation and the Norwegian Refugee Council for their Covid-19 related activities. Local donations were made to support efforts in our international locations. Further information on these donations can be found on our website.
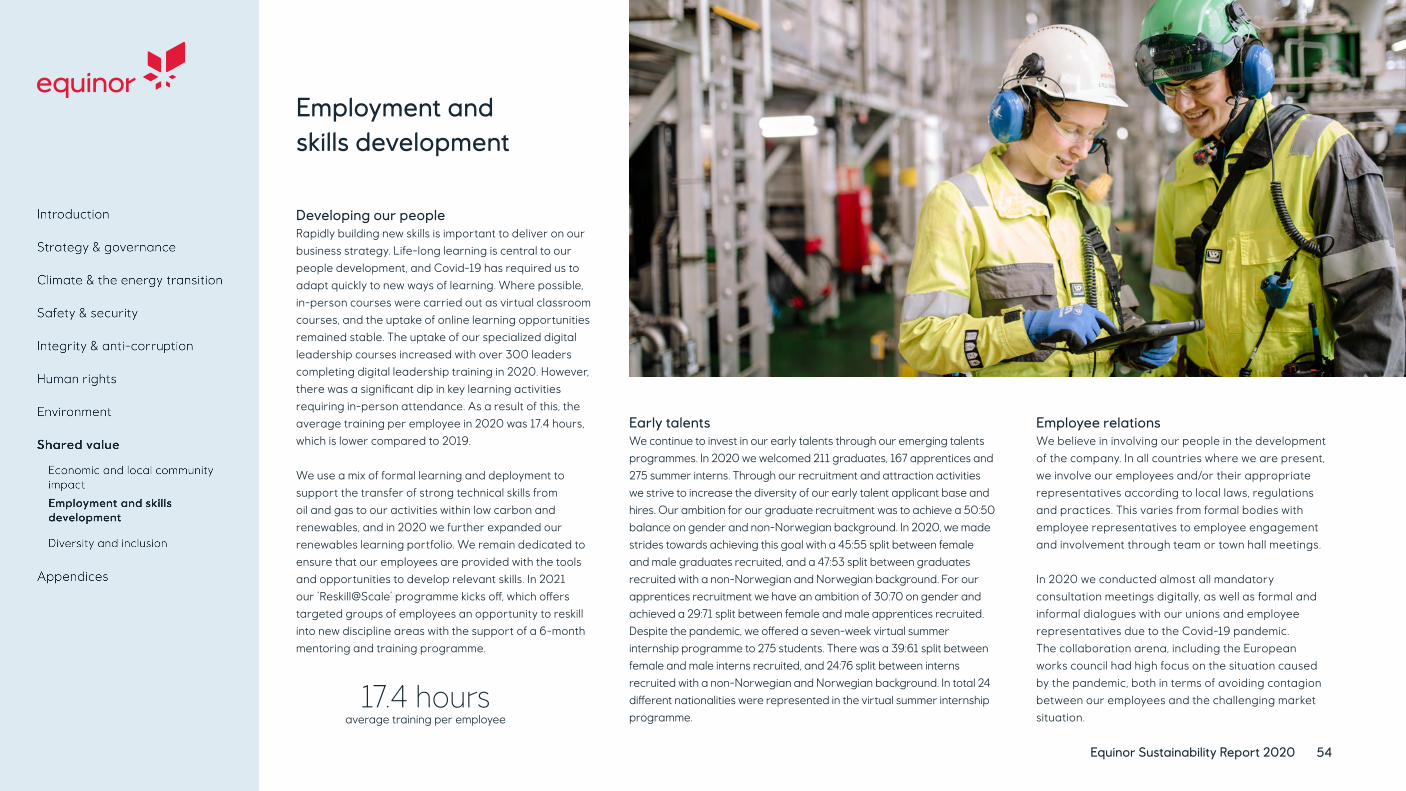
Equinor Sustainability Report 2020 54
Employment and skills development
Developing our peopleRapidly building new skills is important to deliver on our business strategy. Life-long learning is central to our people development, and Covid-19 has required us to adapt quickly to new ways of learning. Where possible, in-person courses were carried out as virtual classroom courses, and the uptake of online learning opportunities remained stable. The uptake of our specialized digital leadership courses increased with over 300 leaders completing digital leadership training in 2020. However, there was a significant dip in key learning activities requiring in-person attendance. As a result of this, the average training per employee in 2020 was 17.4 hours, which is lower compared to 2019.
We use a mix of formal learning and deployment to support the transfer of strong technical skills from oil and gas to our activities within low carbon and renewables, and in 2020 we further expanded our renewables learning portfolio. We remain dedicated to ensure that our employees are provided with the tools and opportunities to develop relevant skills. In 2021 our ‘Reskill@Scale’ programme kicks off, which offers targeted groups of employees an opportunity to reskill into new discipline areas with the support of a 6-month mentoring and training programme.
Early talentsWe continue to invest in our early talents through our emerging talents programmes. In 2020 we welcomed 211 graduates, 167 apprentices and 275 summer interns. Through our recruitment and attraction activities we strive to increase the diversity of our early talent applicant base and hires. Our ambition for our graduate recruitment was to achieve a 50:50 balance on gender and non-Norwegian background. In 2020, we made strides towards achieving this goal with a 45:55 split between female and male graduates recruited, and a 47:53 split between graduates recruited with a non-Norwegian and Norwegian background. For our apprentices recruitment we have an ambition of 30:70 on gender and achieved a 29:71 split between female and male apprentices recruited. Despite the pandemic, we offered a seven-week virtual summer internship programme to 275 students. There was a 39:61 split between female and male interns recruited, and 24:76 split between interns recruited with a non-Norwegian and Norwegian background. In total 24 different nationalities were represented in the virtual summer internship programme.
Employee relationsWe believe in involving our people in the development of the company. In all countries where we are present, we involve our employees and/or their appropriate representatives according to local laws, regulations and practices. This varies from formal bodies with employee representatives to employee engagement and involvement through team or town hall meetings.
In 2020 we conducted almost all mandatory consultation meetings digitally, as well as formal and informal dialogues with our unions and employee representatives due to the Covid-19 pandemic.The collaboration arena, including the European works council had high focus on the situation caused by the pandemic, both in terms of avoiding contagion between our employees and the challenging market situation.
17.4 hoursaverage training per employee

Equinor Sustainability Report 2020 55
Diversity and inclusion level. Our diversity index is flexible and holistic, meaning teams may focus on different dimensions of diversity to achieve the balance that adds most value to them. The dimensions currently monitored are experience, gender, nationality and age. The diversity KPI monitors each business area’s progression on team diversity. The Inclusion Index is measured in our Global People Survey, and measures employees’ perception of inclusion in their teams. Our ambition is for all teams in Equinor to be diverse and inclusive by 2025. Diversity index target is set at 55 for 2025 (baseline 2018 is 33), while the inclusion index target is set at 80 for 2025 (baseline 2018 is 76). The trend of the KPI has been positive since the establishment, with 2020 figures of 37 and 78.
In 2020 we focused on building capability and understanding of the business value of D&I. We continued to deliver and embed mitigating unconscious bias training and support our employee resource groups, including Women in Equinor, Differently Abled and LGBTQ+ groups. Due to the Covid-19 pandemic, focus was placed on strengthening an open and inclusive culture. Efforts centred on employee engagement after the pandemic outbreak in March. In line with local Covid-19 restrictions and guidelines, we introduced flexible work as an opportunity to combine work from the office with work done outside the office in a virtual way. We also established corporate principles for flexible work agreements, which will guide our future efforts for teams that can safely and securely perform their tasks outside an Equinor office or asset. In the last quarter, particular focus was placed on mental health, with the aim to lower the threshold for talking about mental health, increase awareness and communicate support and benefits available.
To show our commitment to equal and inclusive workplaces, Equinor participated in several Gender Equality Indexes that aim to give more visibility into reporting e.g. in the Bloomberg Gender-Equality Index, and the Norwegian SHE Index where Equinor was ranked number 1 out of 92 participating companies in Norway. We received the SHE Index award for our progress towards gender equality.
In all our leadership activities, including talent and succession reviews, leadership assessments, leadership development courses and top-tier leadership deployment, we aim for gender balance and diversity. We pay close attention to positions and discipline areas dominated by employees of one gender. A new CEO was appointed in August 2020. Anders Opedal announced during December several changes to the Corporate Executive Committee. These changes will take effect from 1 June 2021, and the new Corporate Executive Committee will be 50% female. Also, since 2017, we have focused on improving gender balance on leaders reporting to the Corporate Executive Committee. This group has increased from 36% female in 2017 to 41% in 2019. In 2020, this group was 46% female.
Consistent with our values and to strengthen our brand and attractiveness as an employer, we continue to offer a global parental leave policy in all Equinor companies and health insurance in Equinor ASA. A minimum of 16 weeks paid leave is offered to all employees in the group becoming parents through birth or adoption. The health insurance scheme, supplementing public health services, offers access to private specialists, medical examinations and treatments, and is similar to local health insurance already provided in our subsidiaries. During the Covid-19 pandemic, we have highlighted access to online appointments, and mental health support.
We have evaluated our management approach within diversity and inclusion, employment and skills development. The company has had activity related workforce reductions globally and a challenging Covid-19 pandemic, which also negatively impacted our learning numbers, but our management approach related to diversity and inclusion, skills development and employment of our people continuous to remain firm.
Embracing diversity and driving inclusion is a fundamental part of our values - open, collaborative, courageous and caring - and an integral part of our leadership expectations.
We provide an environment recognised for its equality and diversity, and we treat everyone with fairness, respect and dignity. We do not tolerate any discrimination or harassment of colleagues or others affected by our operations, and this is stated in our code of conduct. Our commitments and requirements are in line with the Norwegian equality and anti-discrimination act. We follow its four-step model to examine the risk of discrimination and obstacles to equality, analyse causes, identify and implement measures and evaluate results, which are within the board of directors’ responsibility to follow up.
Inclusion to us means that everyone in Equinor feels like that they are part of one team, are able to bring their whole self to work, and have their voices heard and respected. We believe we can only leverage the value of diversity if we have an inclusive culture where everyone feels safe to contribute.
We work systematically with diversity and inclusion (D&I) through our key human resources processes, such as recruitment, succession planning, performance management and leadership development. In 2019 we built a strong foundation to strengthen D&I by setting targets and capturing data to measure our progress. This included setting recruitment targets and the implementation of a corporate diversity and inclusion KPI. The KPI is based on a diversity index and an inclusion index, measured on team
Diversity and inclusion
Indicator Boundary Unit 2020 2019 2018 2017 2016
Leadership positions (women share of total)
Equinor group
% 32 30 29 28 29
Earnings ratio (women:men)
Equinor ASA
% 98 98 97 98 98
Non-Norwegians in leadership positions
Equinor group
% 24 25 24 23 23

Equinor Sustainability Report 2020 56
AppendicesOther reportsThe following Equinor reports provide additional information about our business activities and impacts: • Annual report and Form 20-F, including
Payments to governments report• CDP 2019 response • Global Reporting Initiative (GRI) index 2020• Energy Perspectives 2020
ESG performance data Performance data in this report and supplementary data can be found at our ESG Reporting centre
Equinor.comFor further information about sustainability at Equinor, visit our web pages and follow us on social media.
FeedbackWe welcome your feedback. Please use the e-mail and social media channels linked below for comments and questions.
Explore more
Equinor Sustainability Report 2020 56
Equinor Sustainability Report 2020 57
Report approvalThis report has been approved by the CEO of Equinor.
Reporting standardsThis report has been prepared in accordance with the Global Reporting Initiative (GRI) Standards: Core option. A GRI Index is available at equinor.com. The sustainability report should be read in conjunction with the GRI index, to get an overview of the full extent of the report. We view this report to be our Communication on Progress to the UN Global Compact (advanced reporting level).
We also use reporting guidance from IPIECA, the global oil and gas industry association for environmental and social issues, and recommendations from the Task Force on Climate-related Financial Disclosures.
AssuranceThis report has been externally assured by EY, with reasonable level of assurance for selected climate, environment and safety indicators, and a limited level of assurance for the rest of the report, excluding forward looking information. The independent assurance statement, as listed in appendix, concludes that the report is presented in all material respects, in accordance with the GRI Standards: Core option.
About the report
Reporting boundariesDefining consistent boundaries for sustainability reporting is challenging due to the complexity of ownership and operational arrangements, such as joint operating agreements. We strive to be consistent and transparent about variations in boundaries and provide a complete report in line with industry practice.
• Environmental data is, unless otherwise stated, reported on a 100% basis for our operated assets, facilities and vessels, including subsidiaries and operations where we are the technical service provider, and for contracted drilling rigs and flotels (“operational control basis”).
• Scope 1 CO₂ emissions are reported both on an operational control basis and on equity basis (financial ownership interest).
• Scope 3 greenhouse gas emissions are reported on the basis of equity (products sold). Maritime emissions are reported from maritime vessels under Equinor contract, including project and supply vessels, drilling rigs, and tankers transporting both Equinor and third-party volumes.
• Scope 3 emissions related to business travel is for Equinor employees only.
• Health and safety incident data is reported for our operated assets, facilities and vessels, including subsidiaries and operations where we are the technical service provider. These include contracted drilling rigs, floatels, vessels, projects and modifications, and transportation of personnel and products, using a risk-based approach.
• Economic data is reported on an equity basis, unless otherwise stated.
• Workforce data covers employees in our direct employment. Temporary employees are not included.
• Human rights data is collected from operated and non-operated assets.
Operations acquired or disposed of during the year are included for the period in which we owned them, unless otherwise stated. Entities that we do not control, but have significant influence over, are included in the form of disclosures of management approach. The report does not include data from equity interest fields/projects, such as joint ventures, where we are not operator. Exceptions are for climate data or where specified.
RestatementsHistoric numbers are sometimes adjusted due to for example changes in reporting principles, changes of calculation factors used by authorities, or re-classification of incidents after investigations. We restate historic numbers and explain the changes if the adjustment represents a change of minimum 5% for indicators with reasonable level of assurance, and 10% for indicators with limited level of assurance.
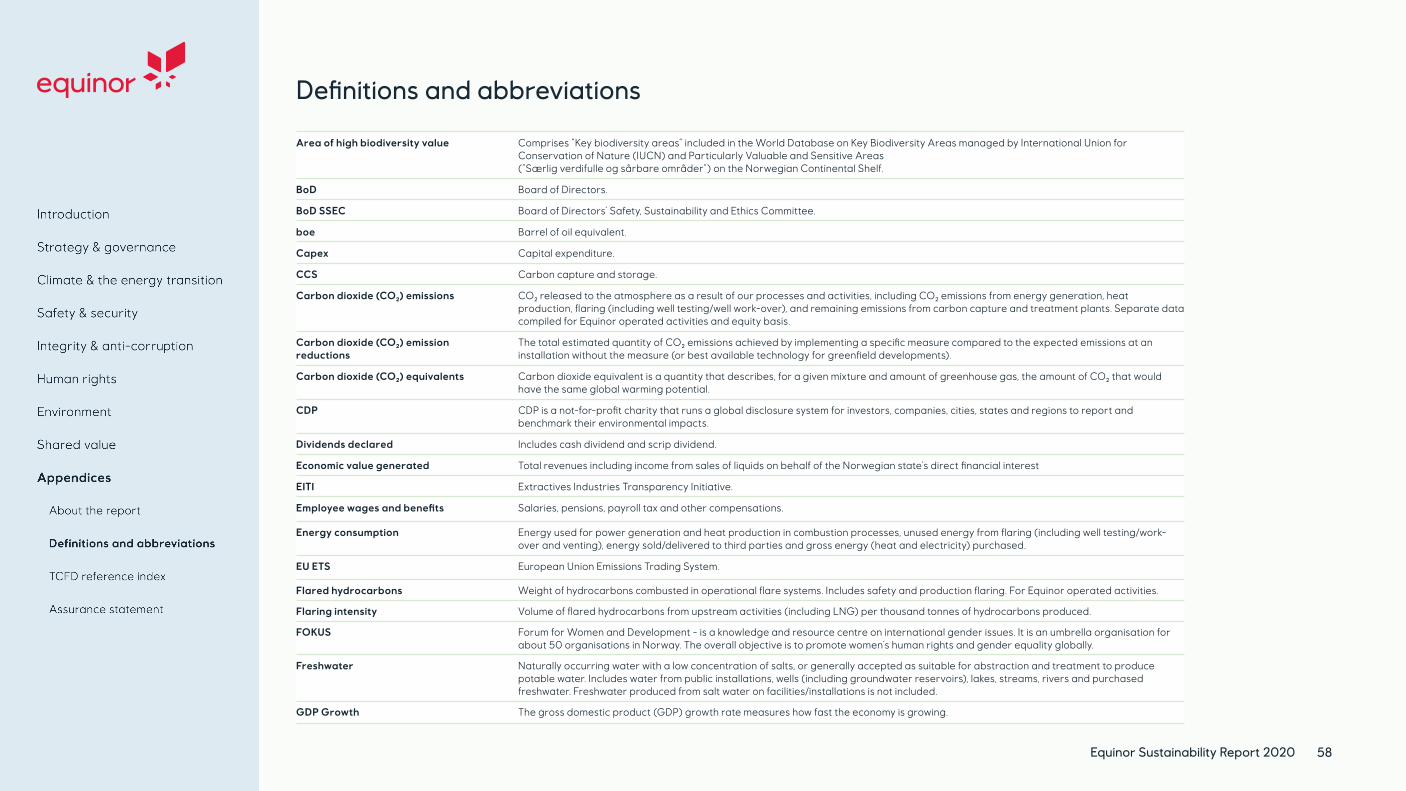
Equinor Sustainability Report 2020 58
Area of high biodiversity value Comprises “Key biodiversity areas” included in the World Database on Key Biodiversity Areas managed by International Union for Conservation of Nature (IUCN) and Particularly Valuable and Sensitive Areas (“Særlig verdifulle og sårbare områder”) on the Norwegian Continental Shelf.
BoD Board of Directors.
BoD SSEC Board of Directors’ Safety, Sustainability and Ethics Committee.
boe Barrel of oil equivalent.
Capex Capital expenditure.
CCS Carbon capture and storage.
Carbon dioxide (CO₂) emissions CO₂ released to the atmosphere as a result of our processes and activities, including CO₂ emissions from energy generation, heat production, flaring (including well testing/well work-over), and remaining emissions from carbon capture and treatment plants. Separate data compiled for Equinor operated activities and equity basis.
Carbon dioxide (CO₂) emission reductions
The total estimated quantity of CO₂ emissions achieved by implementing a specific measure compared to the expected emissions at an installation without the measure (or best available technology for greenfield developments).
Carbon dioxide (CO₂) equivalents Carbon dioxide equivalent is a quantity that describes, for a given mixture and amount of greenhouse gas, the amount of CO₂ that would have the same global warming potential.
CDP CDP is a not-for-profit charity that runs a global disclosure system for investors, companies, cities, states and regions to report and benchmark their environmental impacts.
Dividends declared Includes cash dividend and scrip dividend.
Economic value generated Total revenues including income from sales of liquids on behalf of the Norwegian state’s direct financial interest
EITI Extractives Industries Transparency Initiative.
Employee wages and benefits Salaries, pensions, payroll tax and other compensations.
Energy consumption Energy used for power generation and heat production in combustion processes, unused energy from flaring (including well testing/work-over and venting), energy sold/delivered to third parties and gross energy (heat and electricity) purchased.
EU ETS European Union Emissions Trading System.
Flared hydrocarbons Weight of hydrocarbons combusted in operational flare systems. Includes safety and production flaring. For Equinor operated activities.
Flaring intensity Volume of flared hydrocarbons from upstream activities (including LNG) per thousand tonnes of hydrocarbons produced.
FOKUS Forum for Women and Development - is a knowledge and resource centre on international gender issues. It is an umbrella organisation for about 50 organisations in Norway. The overall objective is to promote women’s human rights and gender equality globally.
Freshwater Naturally occurring water with a low concentration of salts, or generally accepted as suitable for abstraction and treatment to produce potable water. Includes water from public installations, wells (including groundwater reservoirs), lakes, streams, rivers and purchased freshwater. Freshwater produced from salt water on facilities/installations is not included.
GDP Growth The gross domestic product (GDP) growth rate measures how fast the economy is growing.
Definitions and abbreviations
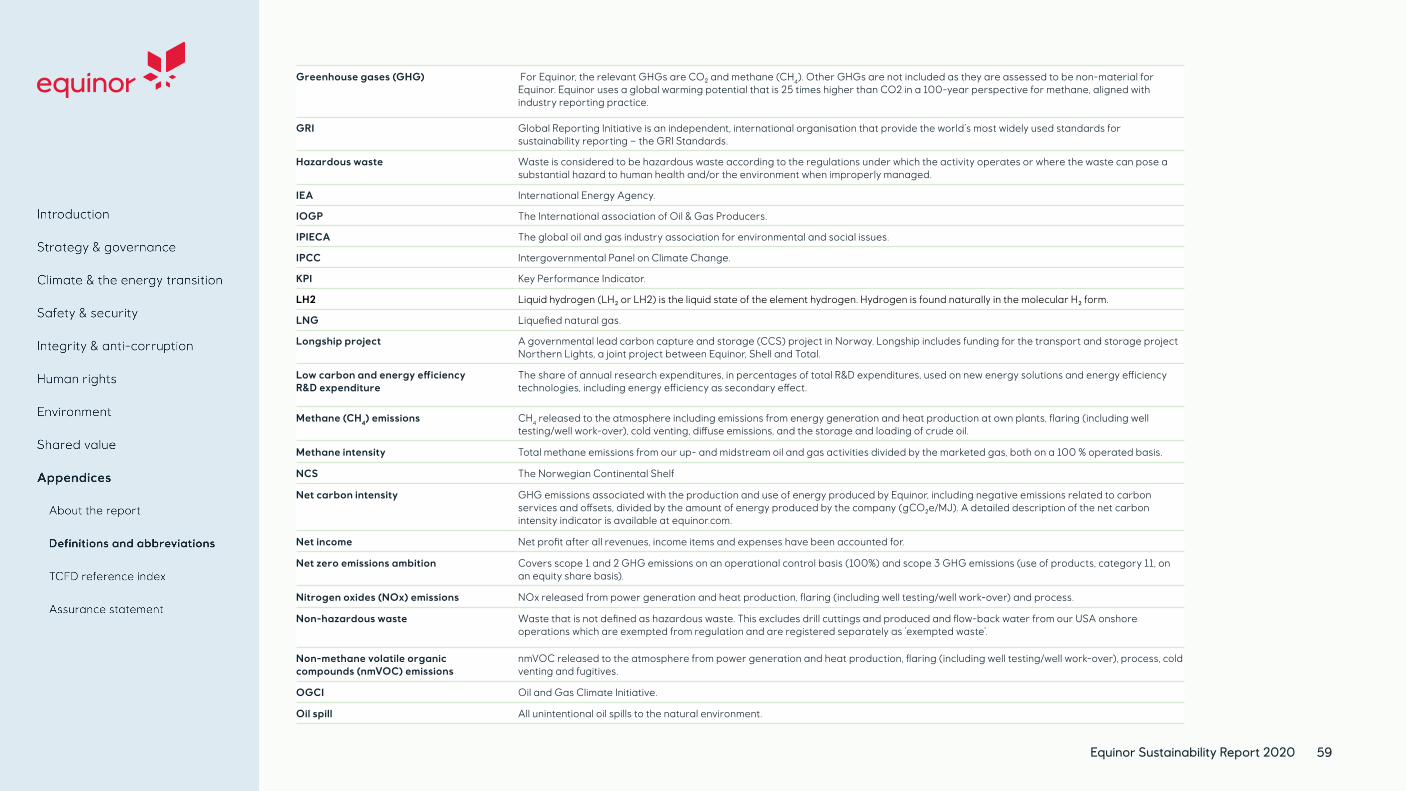
Equinor Sustainability Report 2020 59
Greenhouse gases (GHG) For Equinor, the relevant GHGs are CO₂ and methane (CH4). Other GHGs are not included as they are assessed to be non-material for Equinor. Equinor uses a global warming potential that is 25 times higher than CO2 in a 100-year perspective for methane, aligned with industry reporting practice.
GRI Global Reporting Initiative is an independent, international organisation that provide the world’s most widely used standards for sustainability reporting – the GRI Standards.
Hazardous waste Waste is considered to be hazardous waste according to the regulations under which the activity operates or where the waste can pose a substantial hazard to human health and/or the environment when improperly managed.
IEA International Energy Agency.
IOGP The International association of Oil & Gas Producers.
IPIECA The global oil and gas industry association for environmental and social issues.
IPCC Intergovernmental Panel on Climate Change.
KPI Key Performance Indicator.
LH2 Liquid hydrogen (LH₂ or LH2) is the liquid state of the element hydrogen. Hydrogen is found naturally in the molecular H₂ form.
LNG Liquefied natural gas.
Longship project A governmental lead carbon capture and storage (CCS) project in Norway. Longship includes funding for the transport and storage project Northern Lights, a joint project between Equinor, Shell and Total.
Low carbon and energy efficiency R&D expenditure
The share of annual research expenditures, in percentages of total R&D expenditures, used on new energy solutions and energy efficiency technologies, including energy efficiency as secondary effect.
Methane (CH4) emissions CH4 released to the atmosphere including emissions from energy generation and heat production at own plants, flaring (including well testing/well work-over), cold venting, diffuse emissions, and the storage and loading of crude oil.
Methane intensity Total methane emissions from our up- and midstream oil and gas activities divided by the marketed gas, both on a 100 % operated basis.
NCS The Norwegian Continental Shelf
Net carbon intensity GHG emissions associated with the production and use of energy produced by Equinor, including negative emissions related to carbon services and offsets, divided by the amount of energy produced by the company (gCO₂e/MJ). A detailed description of the net carbon intensity indicator is available at equinor.com.
Net income Net profit after all revenues, income items and expenses have been accounted for.
Net zero emissions ambition Covers scope 1 and 2 GHG emissions on an operational control basis (100%) and scope 3 GHG emissions (use of products, category 11, on an equity share basis).
Nitrogen oxides (NOx) emissions NOx released from power generation and heat production, flaring (including well testing/well work-over) and process.
Non-hazardous waste Waste that is not defined as hazardous waste. This excludes drill cuttings and produced and flow-back water from our USA onshore operations which are exempted from regulation and are registered separately as ‘exempted waste’.
Non-methane volatile organic compounds (nmVOC) emissions
nmVOC released to the atmosphere from power generation and heat production, flaring (including well testing/well work-over), process, cold venting and fugitives.
OGCI Oil and Gas Climate Initiative.
Oil spill All unintentional oil spills to the natural environment.

Equinor Sustainability Report 2020 60
Operations Temporary or permanent sites, activities and assets used for exploration, extraction, refining, transporting, distributing, and marketing petroleum products.
OREAC Ocean Renewable Energy Action Coalition
Payments to governments Payments made directly by Equinor to governments, such as income tax, host government entitlements (value), bonuses, royalties and fees, related to exploration and production activities. Includes environmental fees and taxes. Payments made on behalf of other license partners, e.g. area fees, are included.
Produced water Water that is brought to the surface during operations which extract hydrocarbons from oil and gas reservoirs.
Protected area A protected area is a clearly defined geographical space, recognised, dedicated and managed, through legal or other effective means, to achieve the long-term conservation of nature with associated ecosystem services and cultural values. (IUCN Definition 2008)
Purchase of goods and services Part of the cost is charged to partners in activities we operate.
Psychosocial work environment The psychosocial work environment concerns aspects of the design and management of work and its social and organisational context that could have an impact on the employee’s health and well-being.
REDD+ Reducing emissions from deforestation and forest degradation (REDD+) is a mechanism developed by Parties to the United Nations Framework Convention on Climate Change (UNFCCC). It creates a financial value for the carbon stored in forests by offering incentives for developing countries to reduce emissions from forested lands.
Recovered waste Waste from Equinor operated activities that has been delivered for reuse, recycling or incineration with energy recovery.
Regular discharges of oil to water Oil in regulated or controlled discharges to the sea from Equinor operated activities. This includes produced water, process water, displacement water, ballast water, jetting water, drainage water and water discharged from treatment plants.
Scope 1 GHG emissions Direct GHG emissions from operations that are owned and/or controlled by the organisation (Source: Greenhouse gas protocol). The global warming potential (GWP) of CH4 is, in accordance with the Intergovernmental Panel on Climate Change (IPCC) Fourth Assessment Report (AR4) (2007), considered to be 25 times the GWP of CO₂.
Scope 2 GHG emissions Indirect GHG emissions from energy imported from third parties, heating, cooling, and steam consumed within the organisation. We use IEA (physical) and RE-DISS (market-based) as sources of scope 2 emissions factor, expressed as kg CO₂/kWh. A location-based calculation method reflects the average emissions intensity of grids (using mostly grid-average emission factor data). A market-based calculation method reflects emissions from electricity that companies have purposefully chosen (or their lack of choice). It derives emission factors from contracts between two parties for the sale and purchase of energy bundled with attributes about the energy generation, or for unbundled attribute claims. (Source: Greenhouse gas protocol).
Scope 3 GHG emissions All GHG emissions that occur as a consequence of the operations of the organisation but are not directly controlled or owned by the company, such as use of sold products (equity basis). Emissions from use of sold products is calculated from IPCC emission factors, combined with IEA statistics on regional energy consumption.
SDG The United Nations’ Sustainable Development Goals.
SDS The International Energy Agency’s (IEA) Sustainable Development Scenario.
Serious incident frequency (SIF) The number of serious incidents (including near misses) per million hours worked. An incident is an event or chain of events that has caused or could have caused injury, illness and/or damage to/loss of property, the environment or a third party. All undesirable incidents are categorised according to degree of seriousness, based on established categorisation matrices.
SheDil tool SheDil is a practical tool helping business to safeguard women and girls’ human rights in their operations, developed by FOKUS. The tool is based on the UN Guiding Principles on Business and Human Rights and OECDs guidance for human rights due diligence.
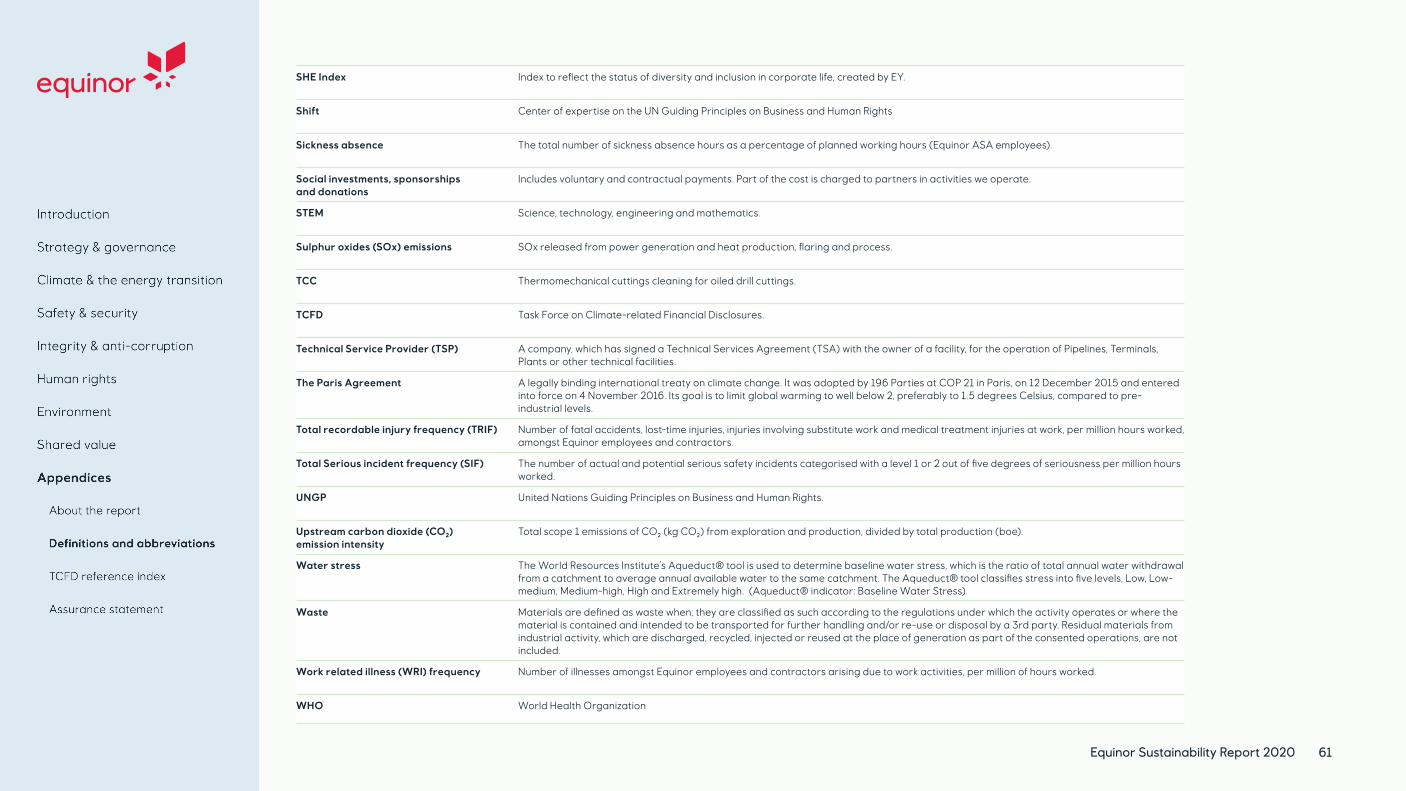
Equinor Sustainability Report 2020 61
SHE Index Index to reflect the status of diversity and inclusion in corporate life, created by EY.
Shift Center of expertise on the UN Guiding Principles on Business and Human Rights
Sickness absence The total number of sickness absence hours as a percentage of planned working hours (Equinor ASA employees).
Social investments, sponsorships and donations
Includes voluntary and contractual payments. Part of the cost is charged to partners in activities we operate.
STEM Science, technology, engineering and mathematics.
Sulphur oxides (SOx) emissions SOx released from power generation and heat production, flaring and process.
TCC Thermomechanical cuttings cleaning for oiled drill cuttings.
TCFD Task Force on Climate-related Financial Disclosures.
Technical Service Provider (TSP) A company, which has signed a Technical Services Agreement (TSA) with the owner of a facility, for the operation of Pipelines, Terminals, Plants or other technical facilities.
The Paris Agreement A legally binding international treaty on climate change. It was adopted by 196 Parties at COP 21 in Paris, on 12 December 2015 and entered into force on 4 November 2016. Its goal is to limit global warming to well below 2, preferably to 1.5 degrees Celsius, compared to pre-industrial levels.
Total recordable injury frequency (TRIF) Number of fatal accidents, lost-time injuries, injuries involving substitute work and medical treatment injuries at work, per million hours worked, amongst Equinor employees and contractors.
Total Serious incident frequency (SIF) The number of actual and potential serious safety incidents categorised with a level 1 or 2 out of five degrees of seriousness per million hours worked.
UNGP United Nations Guiding Principles on Business and Human Rights.
Upstream carbon dioxide (CO₂) emission intensity
Total scope 1 emissions of CO₂ (kg CO₂) from exploration and production, divided by total production (boe).
Water stress The World Resources Institute’s Aqueduct® tool is used to determine baseline water stress, which is the ratio of total annual water withdrawal from a catchment to average annual available water to the same catchment. The Aqueduct® tool classifies stress into five levels, Low, Low-medium, Medium-high, High and Extremely high. (Aqueduct® indicator: Baseline Water Stress).
Waste Materials are defined as waste when; they are classified as such according to the regulations under which the activity operates or where the material is contained and intended to be transported for further handling and/or re-use or disposal by a 3rd party. Residual materials from industrial activity, which are discharged, recycled, injected or reused at the place of generation as part of the consented operations, are not included.
Work related illness (WRI) frequency Number of illnesses amongst Equinor employees and contractors arising due to work activities, per million of hours worked.
WHO World Health Organization

Equinor Sustainability Report 2020 62
TCFD recommendation Reference to Equinor disclosure
Governance – Disclose the organisation’s governance around climate-related risks and opportunities
a) Describe the board’s oversight of climate-related risks and opportunities. AR 3.9 – The work of the Board of Directors SR – Embedding sustainability in how we work
b) Describe management’s role in assessing and managing climate-related risks and opportunities.
AR 3.10 – Risk management and internal control SR – Embedding sustainability in how we workSR – Climate-related risk and resilience
Strategy – Disclose the actual and potential impacts of climate-related risks and opportunities on the organisation’s businesses, strategy, and financial planning where such information is material
a) Describe the climate-related risks and opportunities the organisation has identified over the short, medium, and long term.
AR 2.12 – Risk review SR – Climate-related risk and resilience Equinor’s CDP 2020 response
b) Describe the impact of climate-related risks and opportunities on the organisation’s businesses, strategy, and financial planning.
AR 2.13 – Safety, security and sustainability – Portfolio sensitivity test SR – Climate-related risk and resilience Equinor’s 2020 CDP response
c) Describe the resilience of the organisation’s strategy, taking into consideration different climate-related scenarios, including a 2°C or lower scenario.
AR 2.13 – Safety, security and sustainability – Portfolio sensitivity test SR – Climate-related risk and resilience Equinor’s Energy Perspectives 2020
Risk management – Disclose how the organisation identifies, assesses, and manages climate-related risks
a) Describe the organisation’s processes for identifying and assessing climate-related risks.
AR 2.12 – Risk review – Risk management
SR – Embedding sustainability in how we work
SR – Climate-related risk and resilience
Equinor’s 2020 CDP response
b) Describe the organisation’s processes for managing climate-related risks As above.
c) Describe how processes for identifying, assessing, and managing climate-related risks are integrated into the organisation’s overall risk management.
As above.
Metrics and targets – Disclose the metrics and targets used to assess and manage relevant climate-related risks and opportunities where such information is material
a) Disclose the metrics used by the organisation to assess climate-related risks and opportunities in line with its strategy and risk management process.
AR 2.13 – Safety, security and sustainability SR – Climate-related risk and resilience SR – Our climate roadmap SR – GHG emissions towards carbon neutral operationsSR – Renewable energySustainability performance datahub at equinor.com.
b) Disclose Scope 1, Scope 2, and, if appropriate, Scope 3 greenhouse gas (GHG) emissions, and the related risks.
AR 2.13 – Safety, security and sustainability SR – Climate-related risk and resilience SR – GHG emissions towards carbon neutral operationsSustainability performance datahub at equinor.com.
c) Describe the targets used by the organisation to manage climate-related risks and opportunities and performance against targets.
AR 2.1 – Strategy and market review SR – Climate-related risk and resilience SR – Our climate roadmap SR – GHG emissions towards carbon neutral operations
AR = Annual Report 2020 SR = Sustainability Report 2020
Task Force on Climate-related Financial Disclosures (TCFD) reference index

Equinor Sustainability Report 2020 64

Equinor Sustainability Report 2020 65
This report contains certain forward-looking statements that involve risks
and uncertainties. In some cases, we use words such as “aim”, “ambition”,
“continue”, “expect”, “may”, “strategy”, “will”, “in line with”, and similar
expressions to identify forward-looking statements. Forward-looking
statements include all statements other than statements of historical
fact, including, among others, statements regarding Equinor’s ambitions,
plans, intentions, aims and expectations with respect to Equinor’s climate
ambitions, including but not limited to: its net zero and net carbon
intensity ambitions, carbon efficiency, methane emissions and flaring
reductions, growth in renewable energy capacity, carbon-neutral global
operations, internal carbon price on investment decisions, break-even
considerations and targets, financial metrics for investment decisions,
future competitiveness, future levels of, and expected value creation from,
oil and gas production, scale and composition of the oil and gas portfolio,
development of CCUS and hydrogen businesses, use of offset mechanisms
and natural sinks and support of TCFD recommendations.
These forward-looking statements reflect current views about
future events and are, by their nature, subject to significant risks and
uncertainties because they relate to events and depend on circumstances
that will occur in the future and are beyond Equinor’s control and are
difficult to predict. There are a number of factors that could cause actual
results and developments to differ materially from those expressed
or implied by these forward-looking statements, including societal
shifts in consumer demand and technological advancements, levels
Cautionary statement
of industry product supply, demand and pricing in particular in light of
recent significant oil price volatility triggered, among other things, by the
changing dynamic among OPEC+ members and the uncertainty regarding
demand created by the Covid-19 pandemic; the impact of Covid-19 or
other pandemic outbreakes; health, safety and environmental risks; price
and availability of alternative fuels; the political and economic policies of
Norway and other jurisdictions where we have assets; general economic
conditions; political and social stability and economic growth in relevant
areas of the world; global political events and actions; changes in, or
non-compliance with, laws and governmental regulations; the timing of
bringing new projects on stream; an inability to meet strategic objectives
or exploit growth or investment opportunities; adverse changes in tax
regimes; the development and use of new technology; geological or
technical difficulties; operational problems; the difficulties involving
transportation infrastructure; the actions of competitors; the actions of
counterparties and competitors; the actions of governments (including
the Norwegian state as majority shareholder); natural disasters, adverse
weather conditions; climate change and other changes to business
conditions; the effects of climate change; an inability to attract and retain
skilled personnel; relevant governmental approvals; labour relations and
industrial actions by workers and other factors discussed elsewhere in
Equinor’s publications, any of which could impair Equinor’s ability to meet
its climate ambitions. Although we believe that the expectations reflected
in such forward-looking statements are reasonable, we cannot assure you
that future results will meet these expectations. Additional information,
including information on factors that may affect Equinor’s business,
is contained in Equinor’s latest Annual Report and Form 20-F, filed
with the U.S. Securities and Exchange Commission (and section
Risk review – Risk factors thereof), which is available at Equinor’s
website (www.equinor.com).
You should not place undue reliance on these forward-looking
statements. Actual results could differ materially from those
anticipated in these forward-looking statements for many reasons.
Equinor does not assume any responsibility for the accuracy and
completeness of any forward-looking statements. Any forward-
looking statement speaks only as of the date on which such
statement is made. Unless required by law, we will not necessarily
update any of these statements.
Equinor is including an estimate of emissions from the use of
sold products (GHG protocol category 11) in the calculation
of its net zero ambition and net carbon intensity ambition as a
means to more accurately evaluate the emission lifecycle of what
we produce to respond to the energy transition and potential
business opportunities arising from shifting consumer demands.
Including these emissions in the calculations should in no way be
construed as an acceptance by Equinor of responsibility for the
emissions caused by such use.

PhotographyOle Jørgen Bratland/Equinor ASAØystein Johannessen/Equinor ASAØyvind Gravås/WoldcamEinar AslaksenØivind Haug
External voices: Aibel, Shift, UNEP, WRI and Miljøstiftelsen ZERO
Illustrations and designEquinor ASA
Equinor ASABox 8500NO-4035 StavangerNorwayTelephone: +47 51 99 00 00
www.equinor.com