Plutonium, Tritium, and Highly Enriched Uranium Production at the ...

2020 Domestic Uranium Production Report
May 2021
Independent Statistics & Analysis www.eia.gov
U.S. Department of Energy
Washington, DC 20585

This report was prepared by the U.S. Energy Information Administration (EIA), the statistical and analytical agency within the U.S. Department of Energy. By law, EIA’s data, analyses, and forecasts are independent of approval by any other officer or employee of the United States Government. The views in this report therefore should not be construed as representing those of the U.S. Department of Energy or other federal agencies.

U.S. Energy Information Administration | 2020 Domestic Uranium Production Report ii
Contacts EIA’s Electricity Supply & Uranium Statistics & Product Innovation Team prepared this report. If you have questions about this report, email us.

U.S. Energy Information Administration | 2020 Domestic Uranium Production Report iii
Contents Contacts ........................................................................................................................................................ ii
Introduction .................................................................................................................................................. 1
Facility status (mills, heap leach plants, and in-situ recovery plants) ..................................................... 2
Employment and Expenditures ............................................................................................................... 2

U.S. Energy Information Administration | 2020 Domestic Uranium Production Report iv
Tables Table 1. U.S. uranium drilling activities, 2006–20................................................................................................. 3 Table 2. U.S. uranium mine production and number of mines and sources, 2006–20 ........................................ 5 Table 3. U.S. uranium concentrate production, shipments, and sales, 2006–20 ................................................. 5 Table 4. U.S. uranium mills and heap leach facilities by owner, location, capacity, and operating status at end of the year, 2016–20 ............................................................................................................................................. 6 Table 5. U.S. uranium in-situ recovery plants by owner, location, capacity, and operating status at end of the year, 2016–20 ....................................................................................................................................................... 7 Table 6. Employment in the U.S. uranium production industry by category, 2006–20 ....................................... 8 Table 7. Employment in the U.S. uranium production industry by state, 2006–20 ............................................. 9 Table 8. U.S. uranium expenditures, 2006–20 ...................................................................................................... 9 Table 9. Summary production statistics of the U.S. uranium industry, 2006–20 ............................................... 11 Table 10. Uranium reserve estimates at the end of 2019 and 2020 .................................................................. 14

U.S. Energy Information Administration | 2020 Domestic Uranium Production Report v
Figures Figure 1. U.S. uranium drilling by number of holes, 2006–20 .............................................................................. 3 Figure 2. U.S. uranium drilling, 2006–20............................................................................................................... 4 Figure 3. Employment in the U.S. uranium production industry by category, 2006–20 ...................................... 8 Figure 4. U.S. uranium expenditures, 2006–20 .................................................................................................. 10 Figure 5. U.S. mine production of uranium, 2006–20 ........................................................................................ 12 Figure 6. U.S. uranium concentrate production and shipments, 2006–20......................................................... 12 Figure 7. Employment in the U.S. uranium production industry, 2006–20 ........................................................ 13

U.S. Energy Information Administration | 2020 Domestic Uranium Production Report 1
Introduction In this report, EIA provides detailed data on U.S. uranium production activities from 2006 through 2020.
Data in this report are based primarily on information reported on Form EIA-851A, Domestic Uranium Production Report (Annual), and some information reported on Form EIA-858, Uranium Marketing Annual Survey. The Form EIA-851A survey collects data on uranium milling and in-situ recovery processing, feed sources, mining, employment, drilling, expenditures, and reserve estimates. The Form EIA-858 survey includes data collected on uranium contracts and deliveries.
Previous editions of this report are available on our website.
Definitions for terms in this report are available in our Energy Glossary.

U.S. Energy Information Administration | 2020 Domestic Uranium Production Report 2
Facility status (mills, heap leach plants, and in-situ recovery plants)
At the end of 2020, Shootaring Canyon Uranium Mill in Utah and Sweetwater Uranium Project in Wyoming were on standby with a total capacity of 3,750 short tons of material per day. The White Mesa Mill in Utah is currently listed as operating and has a capacity of 2,000 short tons of material per day. In Wyoming, one heap leach plant was in the planning stages (Sheep Mountain).
At the end of 2020, the Lost Creek Project and the Smith Ranch-Highland Operation in Wyoming were operating with a combined capacity of 7.5 million pounds U3O8 per year. Nine in-situ recovery plants were on standby as of the end of 2020, and eight in-situ recovery plants were planned for four states: New Mexico, South Dakota, Texas, and Wyoming.
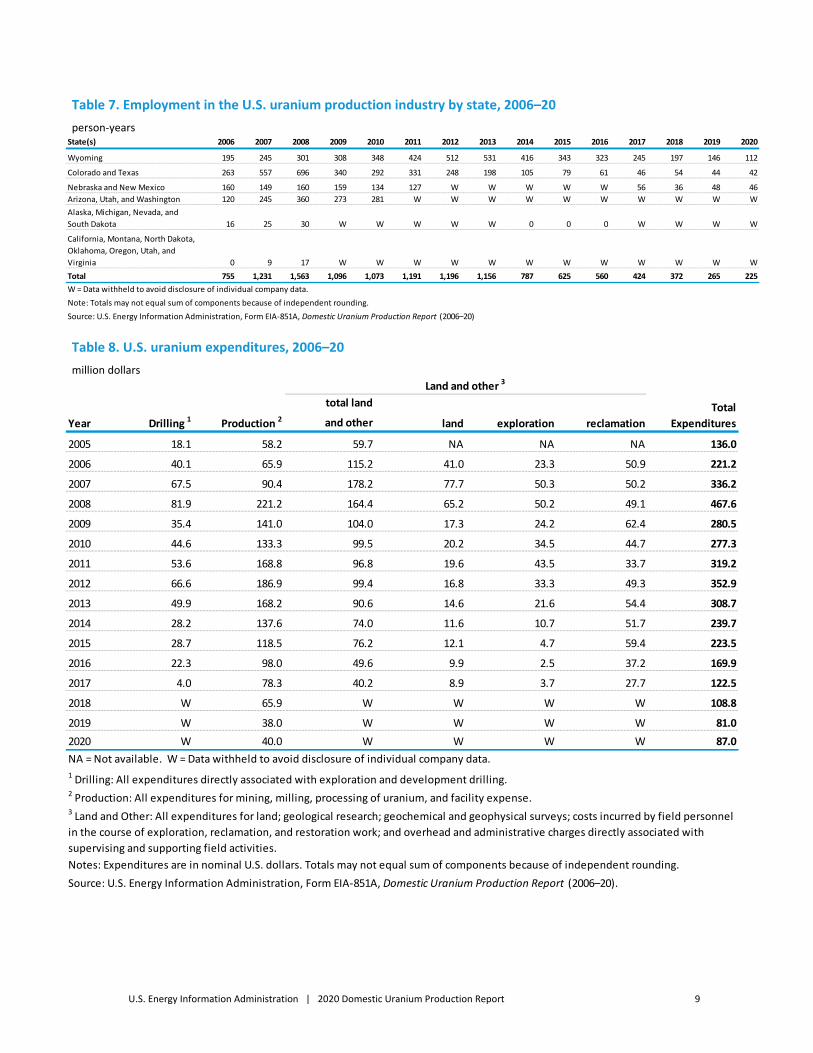
Employment and expenditures Total employment in the U.S. uranium production industry was 225 full-time person-years (one person year is equal to full-time employment for one person) in 2020, a decrease of 15% from the 2019 total. Total expenditures for land, exploration, drilling, production, and reclamation were $87 million in 2020, 7% more than in 2019.

U.S. Energy Information Administration | 2020 Domestic Uranium Production Report 3
Table 1. U.S. uranium drilling activities, 2006–20
Year
Exploration drilling Development drilling Exploration and
development drilling
number of holes
feet (thousand)
number of holes
feet (thousand)
number of holes
feet (thousand)
2006 1,473 821 3,430 1,892 4,903 2,713
2007 4,351 2,200 4,996 2,946 9,347 5,146
2008 5,198 2,543 4,157 2,551 9,355 5,093
2009 1,790 1,051 3,889 2,691 5,679 3,742
2010 2,439 1,460 4,770 3,444 7,209 4,904
2011 5,441 3,322 5,156 3,003 10,597 6,325
2012 5,112 3,447 5,970 3,709 11,082 7,156
2013 1,231 919 4,013 2,926 5,244 3,845
2014 W W W W 1,752 1,299
2015 W W W W 1,518 878
2016 W W W W 1,158 757
2017 W W W W 420 196
2018 W W W W W W
2019 W W W W W W
2020 W W W W W W NA = Not available. W = Data withheld to avoid disclosure of individual company data. Note: Totals may not equal sum of components because of independent rounding. Source: U.S. Energy Information Administration, Form EIA-851A, Domestic Uranium Production Report (2006–20)
Figure 1. U.S. uranium drilling by number of holes, 2006–20 number of holes

U.S. Energy Information Administration | 2020 Domestic Uranium Production Report 4
Figure 2. U.S. uranium drilling, 2006–20
thousand feet

U.S. Energy Information Administration | 2020 Domestic Uranium Production Report 5
Table 2. U.S. uranium mine production and number of mines and sources, 2006–20
Table 3. U.S. uranium concentrate production, shipments, and sales, 2006–20
Production / mining method 2006 2007 2008 2009 2010 2011 2012 2013 2014 2015 2016 2017 2018 2019 2020
(estimated contained thousand pounds U3O8) W W W W W W W W W W W W W W W
(estimated contained thousand pounds U3O8) 0 0 0 0 0 0 0 0 0 0 0 0 0 0 0
(thousand pounds U3O8) 4,259 W W W W W W W W W W W W W W
(thousand pounds U3O8) W W W W W W W W W W W W W W W
(thousand pounds U3O8) 4,692 4,541 3,879 4,145 4,237 4,114 4,335 4,577 4,912 3,711 2,545 1,150 721 174 W
Underground 5 6 10 14 4 5 6 3 2 1 0 0 0 1 1
Open pit 0 0 0 0 0 0 0 0 0 0 0 0 0 0 0
In-Situ leaching 5 5 6 4 4 5 5 7 8 7 8 6 6 5 5
Other sources1 1 1 1 2 1 1 1 2 1 1 1 1 1 0 0Total mines and sources 11 12 17 20 9 11 12 12 11 9 9 7 7 6 6
Number of operating mines
Source: U.S. Energy Information Administration, Form EIA-851A, Domestic Uranium Production Report (2006–20)
Total mine production
W = Data withheld to avoid disclosure of individual company data.
Notes: Totals may not equal sum of components because of independent rounding. Table does not include byproduct production and sources.
1 Other includes, in various years, mine water, mill site cleanup and mill tailings, and well field restoration as sources of uranium.
Other1
Underground
Open pit
In-situ recovery
Activity at U.S. mills and in-situ-leach plants 2006 2007 2008 2009 2010 2011 2012 2013 2014 2015 2016 2017 2018 2019 2020
Ore from underground mines and stockpiles fed to mills 1 W 0 W W W W W W W 0 0 0 0 W W
Other feed materials 2 W W W W W W W W W W W W W W W
Total mill feed W W W W W W W W W W W W W W W
(thousand pounds U3O8) W W W W W W W W W W W W W W W
(thousand pounds U3O8) W W W W W W W W W W W W W W W
(thousand pounds U3O8) 4,106 4,534 3,902 3,708 4,228 3,991 4,146 4,659 4,891 3,343 2,916 2,443 1,647 174 W
(thousand pounds U3O8) 3,838 4,050 4,130 3,620 5,137 4,000 3,911 4,655 4,593 4,023 3,018 2,277 1,489 190 W
Deliveries (thousand pounds U3O8) 3,786 3,602 3,656 2,044 2,684 2,870 3,630 4,447 4,746 3,634 2,691 1,254 1,541 W W
Weighted-average price (dollars per pound U3O8) 28.98 42.11 43.81 36.61 37.59 52.36 49.63 44.65 39.17 42.86 38.22 41.34 32.51 W W
Total uranium concentrate shipped from U.S. mills and in-situ-leach plants
Estimated contained U3O8 (thousand pounds)
Uranium concentrate produced at U.S. mills
Uranium concentrate produced at U.S. in-situ-leach plants
Total uranium concentrate production
Notes: Totals may not equal sum of components because of independent rounding.Source: U.S. Energy Information Administration, Form EIA-851A, Domestic Uranium Production Report (2006–20), and Form EIA-858, Uranium Marketing Annual Survey (2006–20)
Total uranium concentrate sales by U.S. producers 3
W = Data withheld to avoid disclosure of individual company data.1 Uranium ore fed to mills in any year can include ore mined and shipped to a mill during the same year, ore that was mined during a previous year and later shipped from mine-site stockpiles, ore obtained from drawdowns of stockpiles maintained at a mill site, or a combination of these options.2 Includes for various years uranium from mill cleanup, mine water, tailings water, and other materials.3 Sales of U.S-origin uranium only.

U.S. Energy Information Administration | 2020 Domestic Uranium Production Report 6
Table 4. U.S. uranium mills and heap leach facilities by owner, location, capacity, and operating status at end of the year, 2016–20
Capacity(short tons of
ore per day) 2016 2017 2018 2019 2020
Anfield ResourcesShootaring Canyon Uranium Mill Garfield, Utah 750 standby standby standby standby standby
EFR White Mesa LLC White Mesa Mill San Juan, Utah 2,000
operating-processing
alternate feed
operating-processing
alternate feed
operating-processing
alternate feed standby
operating-processing
alternate feed
Energy Fuels Wyoming Inc Sheep Mountain Fremont, Wyoming 725 undeveloped undeveloped undeveloped undeveloped undeveloped
Kennecott Uranium Company/Wyoming Coal Resource Company
Sweetwater Uranium Project
Sweetwater, Wyoming 3,000 standby standby standby standby standby
Total Capacity: 6,475
Notes: Capacity for 2020. An operating status of Operating indicates the mill usually was producing uranium concentrate at the end of the period.
Source: U.S. Energy Information Administration, Form EIA-851A, Domestic Uranium Production Report (2016–20)
1 Heap leach solutions: The separation, or dissolving-out from mined rock, of the soluble uranium constituents by the natural action of percolating a prepared chemical solution through mounded (heaped) rock material. The mounded material usually contains low grade mineralized material and waste rock, which are produced from open pit or underground mines. The solutions are collected after percolation is completed and processed to recover the valued components.
OwnerMill and heap leach1 facility name
County, State (existing and planned locations)

U.S. Energy Information Administration | 2020 Domestic Uranium Production Report 7
Table 5. U.S. uranium in-situ recovery plants by owner, location, capacity, and operating status at end of the year, 2016–20
2016 2017 2018 2019 2020
Uranium Energy Corporation Reno Creek Campbell, Wyoming 2,000,000
partially permitted and
l icensed
partially permitted and
l icensed
partially permitted and
l icensed
partially permitted and
l icensed
partially permitted and
l icensed
Azarga Uranium Corp Dewey Burdock ProjectFall River and Custer, South Dakota 1,000,000
partially permitted and
l icensed
partially permitted and
l icensed
partially permitted and
l icensed
partially permitted and
l icensed
partially permitted and
l icensed
Cameco Crow Butte Operation Dawes, Nebraska 1,000,000 operating operating operating standby standby
Hydro Resources, Inc. Church Rock McKinley, New Mexico 1,000,000
partially permitted and
l icensed
partially permitted and
l icensed
partially permitted and
l icensed
partially permitted and
l icensed
partially permitted and
l icensed
Hydro Resources, Inc. Crownpoint McKinley, New Mexico 1,000,000
partially permitted and
l icensed
partially permitted and
l icensed
partially permitted and
l icensed
partially permitted and
l icensed
partially permitted and
l icensed
Lost Creek ISR LLC Lost Creek Project Sweetwater, Wyoming 2,000,000 operating operating operating operating operating
Mestena Uranium LLC Alta Mesa Project Brooks, Texas 1,500,000 standby standby standby standby standbyPathfinder Mines Corporation Pathfinder Shirley Basin
Carbon County, Wyoming 1,400,000 developing developing developing developing developing
Power Resources Inc., dba Cameco Resources
Smith Ranch-Highland Operation Converse, Wyoming 5,500,000 operating operating operating operating operating
Uranium Energy Corporation Hobson ISR Plant Karnes, Texas 1,000,000 standby standby standby standby standby
Uranium Energy Corporation La Palangana Duval, Texas 1,000,000 standby standby standby standby standby
Strata Energy Inc Ross CPP Crook, Wyoming 375,000 operating operating operating standby standby
URI, Inc. (an enCore Energy company) Kingsvil le Dome Kleberg, Texas 1,000,000 restoration restoration restoration restoration standby
URI, Inc. (an enCore Energy company) Rosita Duval, Texas 1,000,000 reclamation reclamation reclamation reclamation standby
URI, Inc. (an enCore Energy company) Vasquez Duval, Texas 800,000 restoration restoration restoration restoration reclamation
Uranerz Energy Corporation Nichols Ranch ISR ProjectJohnson and Campbell, Wyoming 2,000,000 operating operating operating operating standby
Uranium Energy Corporation Burke Hollow Bee County, Texas 1,000,000
partially permitted and
l icensed
partially permitted and
l icensed
partially permitted and
l icensed
partially permitted and
l icensed
partially permitted and
l icensed
Uranium Energy CorporationGoliad ISR Uranium Project Goliad, Texas 1,000,000
permitted and l icensed
permitted and l icensed
permitted and l icensed
permitted and l icensed
permitted and l icensed
Uranium One Americas, Inc. Jab and Antelope Sweetwater, Wyoming 2,000,000 developing developing developing developing developing
Uranium One Americas, Inc. Moore Ranch Campbell, Wyoming 500,000permitted and
l icensedpermitted and
l icensedpermitted and
l icensedpermitted and
l icensedpermitted and
l icensed
Uranium One USA, Inc.
Willow Creek Project (Christensen Ranch and Irigaray)
Campbell and Johnson, Wyoming 1,300,000 standby operating operating standby standby
Total Production Capacity: 29,375,000
- = No data reported.
Notes: Production capacity for 2020. An operating status of Operating indicates the in-situ recovery plant usually was producing uranium concentrate at the end of the period. Hobson ISR Plant processes uranium concentrate that came from La Palangana. Hobson and La Palangana are part of the same project. ISR stands for in-situ recovery. Christensen Ranch and Irigaray are part of the Willow Creek Project. Uranerz Energy has a toll ing arrangement with Cameco Resources. Uranium is first processed at the Nichols Ranch plant and then transported to the Smith Ranch-Highland Operation plant for final processing into Uranerz’s uranium concentrate. CPP = central processing plant.
Source: U.S. Energy Information Administration, Form EIA-851A, Domestic Uranium Production Report (2016–20)
In-situ recovery plant ownerIn-situ recovery plant name
County, State (existing and planned locations)
Production capacity (pounds
U3O8 per year)

U.S. Energy Information Administration | 2020 Domestic Uranium Production Report 8
Table 6. Employment in the U.S. uranium production industry by category, 2006–20 person-years
Year Exploration Mining Milling Processing Reclamation Total
2006 188 121 W W 155 755
2007 375 378 107 216 155 1,231
2008 457 558 W W 154 1,563
2009 175 441 W W 162 1,096
2010 211 400 W W 125 1,073
2011 208 462 W W 102 1,191
2012 161 462 W W 179 1,196
2013 149 392 W W 199 1,156
2014 86 246 W W 161 787
2015 58 251 W W 116 625
2016 38 255 W W 98 560
2017 50 136 W W 100 424
2018 27 110 W W 138 372
2019 40 48 W W 110 265
2020 W W W W W 225 W = Data withheld to avoid disclosure of individual company data. Note: Totals may not equal sum of components because of independent rounding. A large, one-time reclamation project needed to be withheld and was not included in 2016 data. Source: U.S. Energy Information Administration, Form EIA-851A, Domestic Uranium Production Report (2006–20)
Figure 3. Employment in the U.S. uranium production industry by category, 2006–20 person-years
U.S. Energy Information Administration | 2020 Domestic Uranium Production Report 9
Table 7. Employment in the U.S. uranium production industry by state, 2006–20 person-years
Table 8. U.S. uranium expenditures, 2006–20 million dollars
State(s) 2006 2007 2008 2009 2010 2011 2012 2013 2014 2015 2016 2017 2018 2019 2020
Wyoming 195 245 301 308 348 424 512 531 416 343 323 245 197 146 112
Colorado and Texas 263 557 696 340 292 331 248 198 105 79 61 46 54 44 42
Nebraska and New Mexico 160 149 160 159 134 127 W W W W W 56 36 48 46Arizona, Utah, and Washington 120 245 360 273 281 W W W W W W W W W WAlaska, Michigan, Nevada, and South Dakota 16 25 30 W W W W W 0 0 0 W W W W
California, Montana, North Dakota, Oklahoma, Oregon, Utah, and Virginia 0 9 17 W W W W W W W W W W W WTotal 755 1,231 1,563 1,096 1,073 1,191 1,196 1,156 787 625 560 424 372 265 225
Source: U.S. Energy Information Administration, Form EIA-851A, Domestic Uranium Production Report (2006–20)
W = Data withheld to avoid disclosure of individual company data.Note: Totals may not equal sum of components because of independent rounding.
total land
and other
2005 18.1 58.2 59.7 NA NA NA 136.0
2006 40.1 65.9 115.2 41.0 23.3 50.9 221.2
2007 67.5 90.4 178.2 77.7 50.3 50.2 336.2
2008 81.9 221.2 164.4 65.2 50.2 49.1 467.6
2009 35.4 141.0 104.0 17.3 24.2 62.4 280.5
2010 44.6 133.3 99.5 20.2 34.5 44.7 277.3
2011 53.6 168.8 96.8 19.6 43.5 33.7 319.2
2012 66.6 186.9 99.4 16.8 33.3 49.3 352.9
2013 49.9 168.2 90.6 14.6 21.6 54.4 308.7
2014 28.2 137.6 74.0 11.6 10.7 51.7 239.7
2015 28.7 118.5 76.2 12.1 4.7 59.4 223.5
2016 22.3 98.0 49.6 9.9 2.5 37.2 169.9
2017 4.0 78.3 40.2 8.9 3.7 27.7 122.5
2018 W 65.9 W W W W 108.8
2019 W 38.0 W W W W 81.02020 W 40.0 W W W W 87.0
Year Drilling 1 Production 2
Land and other 3
Total Expendituresland exploration
Notes: Expenditures are in nominal U.S. dollars. Totals may not equal sum of components because of independent rounding.Source: U.S. Energy Information Administration, Form EIA-851A, Domestic Uranium Production Report (2006–20).
reclamation
NA = Not available. W = Data withheld to avoid disclosure of individual company data.1 Drilling: All expenditures directly associated with exploration and development drilling.2 Production: All expenditures for mining, milling, processing of uranium, and facility expense.3 Land and Other: All expenditures for land; geological research; geochemical and geophysical surveys; costs incurred by field personnel in the course of exploration, reclamation, and restoration work; and overhead and administrative charges directly associated with supervising and supporting field activities.

U.S. Energy Information Administration | 2020 Domestic Uranium Production Report 10
Figure 4. U.S. uranium expenditures, 2006–20 million dollars

U.S. Energy Information Administration | 2020 Domestic Uranium Production Report 11
Table 9. Summary production statistics of the U.S. uranium industry, 2006–20
Exploration and development
surface drililng
Exploration and development
drilling expenditures 1
Mine production of uranium
Uranium concentrate production
Uranium concentrate shipments Employment
Year million feet million dollars million pounds U3O8 million pounds U3O8 million pounds U3O8 person-years
2006 2.7 40.1 4.7 4.1 3.8 755
2007 5.1 67.5 4.5 4.5 4.0 1,231
2008 5.1 81.9 3.9 3.9 4.1 1,563
2009 3.7 35.4 4.1 3.7 3.6 1,096
2010 4.9 44.6 4.2 4.2 5.1 1,073
2011 6.3 53.6 4.1 4.0 4.0 1,191
2012 7.2 66.6 4.3 4.1 3.9 1,196
2013 3.8 49.9 4.6 4.7 4.7 1,156
2014 1.3 28.2 4.9 4.9 4.6 787
2015 0.9 28.7 3.7 3.3 4.0 625
2016 0.8 22.3 2.5 2.9 3.0 560
2017 0.2 4.0 1.2 2.4 2.3 424
2018 W W 0.7 1.6 1.5 372
2019 W W 0.2 0.2 0.2 265 2020 W W W W W 225 W = Data withheld to avoid disclosure of individual company data.1 Expenditures are in nominal U.S. dollars.Note: A large, one-time reclamation project needed to be withheld and was not included in 2016 data.
Source: U.S. Energy Information Administration, 2006-2020 data from Form EIA-851A, Domestic Uranium Production Report (2006–20)

U.S. Energy Information Administration | 2020 Domestic Uranium Production Report 12
Figure 5. U.S. mine production of uranium, 2006–20 million pounds U3O8
Figure 6. U.S. uranium concentrate production and shipments, 2006–20 million pounds U3O8
U.S. Energy Information Administration | 2020 Domestic Uranium Production Report 13
Figure 7. Employment in the U.S. uranium production industry, 2006–20 person-years

U.S. Energy Information Administration | 2020 Domestic Uranium Production Report 14
Table 10. Uranium reserve estimates at the end of 2019 and 2020 million pounds U3O8
$0 to $30 per pound
$0 to $50 per pound
$0 to $100 per pound
$0 to $30 per pound
$0 to $50 per pound
$0 to $100 per pound
Properties with exploration completed, exploration continuing, and only assessment work W W W W W W
Properties under development for production and development drilling W W W W W W
Mines in production W W W W W WMines closed temporarily, closed permanently, and mined out W W W W W W
Total 31.2 206.0 388.8 W W W
In-situ leach mining W 159.1 W W W W
Underground and open pit mining W 46.8 W W W W
Total 31.2 206.0 388.8 W W W
Arizona, New Mexico, and Utah W W W W W W
Colorado, Nebraska, and Texas W W W W W W
Wyoming W W W W W WTotal 31.2 206.0 388.8 W W W
2 Forward Cost: The operating and capital costs still to be incurred in the production of uranium from in-place reserves. By using forward costing, estimates for reserves for ore deposits in differing geological settings and status of development can be aggregated and reported for selected cost categories. Included are costs for labor, materials, power and fuel, royalties, payroll taxes, insurance, and applicable general and administrative costs. Excluded from forward cost estimates are prior expenditures, if any, incurred for property acquisition, exploration, mine development, and mill construction, as well as income taxes, profit, and the cost of money. Forward costs are neither the full costs of production nor the market price at which the uranium, when produced, might be sold.Note: Totals may not equal sum of components because of independent rounding.
Uranium reserve estimates1 by mine and property status, mining method, and State(s)
Source: U.S. Energy Information Administration, Form EIA-851A, Domestic Uranium Production Report (2019–20)
End of 2019 End of 2020
Forward Cost 2
1 These uranium reserve estimates cannot be compared with the much larger historical data set of uranium reserves that were published in the July 2010 report U.S. Uranium Reserves Estimates . Reserves, as reported here, do not necessarily imply compliance with U.S. or international government definitions for purposes of investment disclosure.
W = Data withheld to avoid disclosure of individual company data.