2020 Cost of Insider Threats Global report
31
2020 COST OF INSIDER THREATS GLOBAL REPORT Independently conducted by: Sponsored by:
Transcript of 2020 Cost of Insider Threats Global report

2020 COST OF INSIDER THREATS GLOBAL REPORT
Independently conducted by:
Sponsored by:

TABLE OF CONTENTS
INTRODUCTION 3
Executive Summary 3
ABOUT THE STUDY 6
BENCHMARKED SAMPLE 8
ANALYSIS OF INSIDER INCIDENTS 10
COST ANALYSIS 15
CONCLUSIONS 25
FRAMEWORK 27
BENCHMARKING 29
RESEARCH LIMITATIONS 30
2020 Cost of Insider Threats Global Report
2Ponemon Institute© Research Report

Total number of benchmarked organisations
204Total number of insider incidents
4,716Total average cost
$11.45M Incidents relating to negligence
62%
Incidents relating to criminal insider
23%
Incidents relating to user credential theft
14%
Annualised cost for negligence
$4.58MAnnualised cost for criminal insider
$4.08MAnnualised cost for credential theft
$2.79M
The following are
some key statistics
on the cost of insider-
related incidents over
a 12-month period:
INTRODUCTIONPonemon Institute is pleased to present the findings of the 2020 Cost of Insider
Threats Global Report study. Sponsored by ObserveIT and IBM, this is the
third benchmark study conducted to understand the direct and indirect costs
that result from insider threats. The first study was conducted in 2016 and
focused exclusively on companies in the United States. Represented in this
study are companies located in North America, Europe, the Middle East and
the Asia‑Pacific region.
In the context of this research, insider threats are defined as:
• A careless or negligent employee or contractor
• A criminal or malicious insider or
• A credential thief
Executive SummaryThe key takeaway is that, across all three insider threat types outlined above, both the frequency and cost of insider threats have increased dramatically over the course of two years. For example, the overall cost of insider threats is rising, with a 31% increase from $8.76 million in 2018 (Ponemon) to $11.45 million in 2020. In addition, the number of incidents has increased by a staggering 47% in just two years, from 3,200 in 2018 (Ponemon) to 4,716 in 2020. This data shows that insider threats are still a lingering and often under-addressed cybersecurity threat within organisations, compared with external threats.
We interviewed 964 IT and IT security practitioners in 204 organisations in North America (United States and Canada), Europe, Middle East & Africa and Asia‑Pacific. Interviews were completed in September 2019. Each organisation experienced one or more material events caused by an insider. Our targeted organisations were business organisations with a global head count of 1,000 or more employees. These organisations experienced a total of 4,716 insider incidents over the past 12 months.
2020 Cost of Insider Threats Global ReportIntroduction
3Ponemon Institute© Research Report
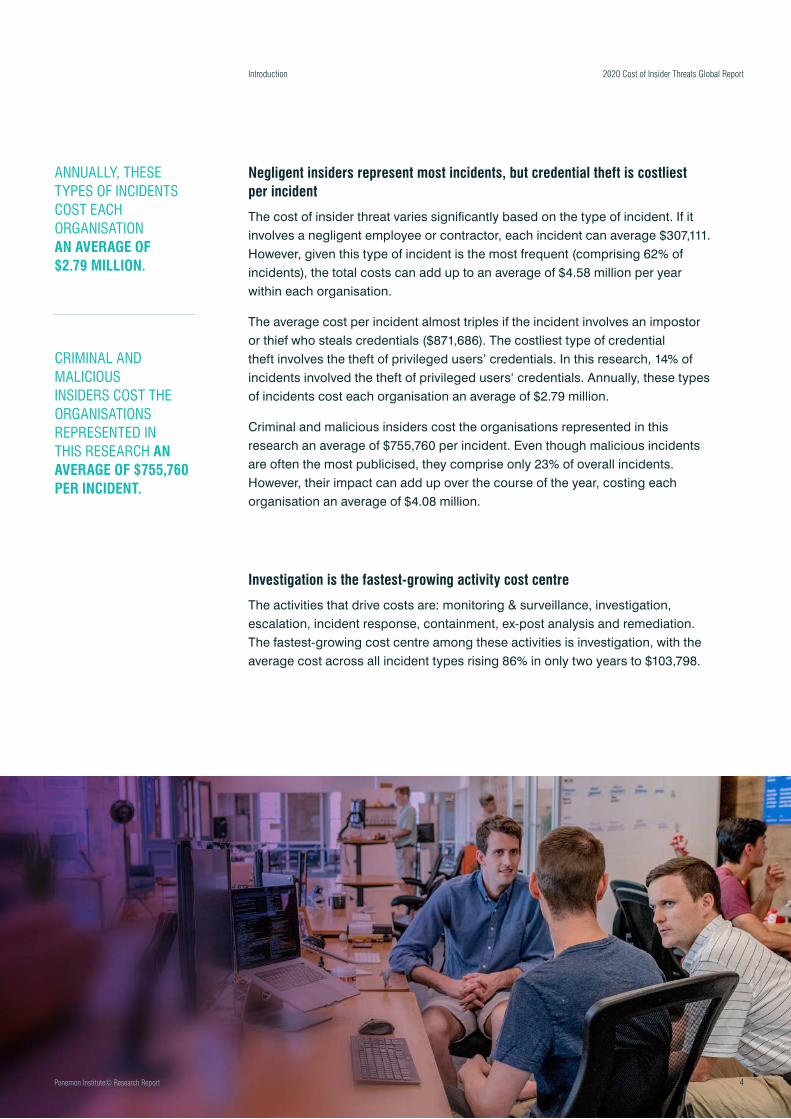
Negligent insiders represent most incidents, but credential theft is costliest per incident
The cost of insider threat varies significantly based on the type of incident. If it involves a negligent employee or contractor, each incident can average $307,111. However, given this type of incident is the most frequent (comprising 62% of incidents), the total costs can add up to an average of $4.58 million per year within each organisation.
The average cost per incident almost triples if the incident involves an impostor or thief who steals credentials ($871,686). The costliest type of credential theft involves the theft of privileged users’ credentials. In this research, 14% of incidents involved the theft of privileged users‘ credentials. Annually, these types of incidents cost each organisation an average of $2.79 million.
Criminal and malicious insiders cost the organisations represented in this research an average of $755,760 per incident. Even though malicious incidents are often the most publicised, they comprise only 23% of overall incidents. However, their impact can add up over the course of the year, costing each organisation an average of $4.08 million.
Investigation is the fastest-growing activity cost centre
The activities that drive costs are: monitoring & surveillance, investigation, escalation, incident response, containment, ex-post analysis and remediation. The fastest-growing cost centre among these activities is investigation, with the average cost across all incident types rising 86% in only two years to $103,798.
2020 Cost of Insider Threats Global ReportIntroduction
ANNUALLY, THESE TYPES OF INCIDENTS COST EACH ORGANISATION AN AVERAGE OF $2.79 MILLION.
CRIMINAL AND MALICIOUS INSIDERS COST THE ORGANISATIONS REPRESENTED IN THIS RESEARCH AN AVERAGE OF $755,760 PER INCIDENT.
4Ponemon Institute© Research Report

Introduction 2020 Cost of Insider Threats Global Report
It takes an average of more than two months to contain an insider incident
It takes an average of 77 days to contain each insider threat incident. Only 13 per cent of incidents were contained in less than 30 days.
Organisational size and industry affect the cost per incident
The cost of incidents varies according to organisational size. Large organisations (with a head count between 25,001 and 75,000) spent an average of $17.92 million over the past year to resolve insider-related incidents. To deal with the consequences of an insider incident, smaller‑sized organisations (those with a head count below 500) spent an average of $7.68 million. The fastest‑growing industries for insider threat were retail (38.2% two‑year increase) and financial services (20.3% two‑year increase).
All types of threat of insider risks are increasing
Since 2018, the average number of incidents involving employee or contractor negligence has increased from 13.2 to 14.5 per organisation. The average number of credential theft incidents has almost tripled over the past two years, from 1.0 to 2.7 per organisation. That said, sixty per cent of organisations had more than 30 incidents per year.
Five signs that your organisation is at risk
1. Employees are not trained to fully understand and apply laws, mandates or regulatory requirements related to their work and that affect the organisation’s security.
2. Employees are unaware of the steps they should take at all times to ensure that the devices they use—both company issued and BYOD—are secured at all times.
3. Employees are sending highly confidential data to an unsecured location in the cloud, exposing the organisation to risk.
4. Employees break your organisation’s security policies to simplify tasks.
5. Employees expose your organisation to risk if they do not keep devices and services patched and upgraded to the latest versions at all time.
to contain each insider threat incident
of incidents were contained in less than
of organisations had more than 30 incidents per year.
77 DAYS
30 DAYS
5Ponemon Institute© Research Report

ABOUT THE STUDYOur research focuses on actual insider-related events or incidents that impact
organisational costs over the past 12 months. Our methods attempt to capture
both direct and indirect costs, including, but not limited to, the following
business threats:
• Theft or loss of mission critical data or intellectual property
• Impact of downtime on organisational productivity
• Damages to equipment and other assets
• Cost to detect and remediate systems and core business processes
• Legal and regulatory impact, including litigation defence cost
• Lost confidence and trust among key stakeholders
• Diminishment of marketplace brand and reputation
2020 Cost of Insider Threats Global ReportAbout the Study
This research utilises an activity‑based costing (ABC) framework. Our fieldwork was conducted over a two‑month period concluding in September 2019. Our final benchmark sample consisted of 204 separate organisations. A total of 964 interviews were conducted with key personnel in these organisations. Activity costs for the present study were derived from actual meetings or site visits for all participants conducted under strict confidentiality. Targeted organisations were:
• Commercial and public sector organisations
• Global head count of 1,000 or more employees
• Locations throughout the following regions: North America, Europe, Middle East & Africa and Asia‑Pacific
• Central IT function with control over on‑premise and/or cloud environment
• Experienced one or more material incidents caused by careless, malicious or criminal insiders
6Ponemon Institute© Research Report

Introduction 2020 Cost of Insider Threats Global Report
In this report, we present an objective framework that measures the full cost impact of events or incidents caused by insiders. Following are the three case profiles that were used to categorise and analyse insider‑related cost for 204 organisations:
• Careless or negligent employee or contractor
• Criminal insider including employee or contractor malice
• Employee/user credential theft (a.k.a. impostor risk)
Our first step in this research was the recruitment of global organisations. The researchers utilised diagnostic interviews and activity-based costing to capture and extrapolate cost data. Ponemon Institute executed all phases of this research project, which included the following steps:
• Working sessions with ObserveIT and IBM to establish areas of inquiry
• Recruitment of benchmark companies
• Development of an activity-based costing framework
• Administration of research programme
• Analysis of all results with appropriate reliability checks
• Preparation of a report that summarises all salient research findings
THE RESEARCHERS UTILISED DIAGNOSTIC INTERVIEWS AND ACTIVITY-BASED COSTING TO CAPTURE AND EXTRAPOLATE COST DATA.
7Ponemon Institute© Research Report

BENCHMARKED SAMPLEIn benchmark research, the unit of analysis is the organisation. The following
pie chart shows the percentage distribution of companies across 13 industry
segments. The three largest segments are financial services, services and
industrial & manufacturing. Financial service organisations include banking,
insurance, investment management and brokerage. Service organisations
represent a wide range of companies, including professional service firms.
2020 Cost of Insider Threats Global ReportBenchmarked Sample
15%
2%3%4%
4%
4%
5%
7%
8%
10% 10%
12%
13%
Financial Services
Services
Industrial & Manufacturing
Energy & Utilities
Technology & Software
Retail
Health & Pharmaceuticals
Consumer Products
Hospitality
Communications
Education & Research
Entertainment & Media
Transportation
Figure 1.
Industry sectors of participating organisationsn=204 companies
8Ponemon Institute© Research Report

47%
24%
8%
22%
Benchmarked Sample
Less than 500
501 to 1,000
1,001 to 5,000
5,001 to 10,000
10,001 to 25,000
25,001 to 75,000
More than 75,000
Figure 2.
Head count size for participating organisationsn=204 companies
Figure 3.
Interviewees by position level or functionn=964 individuals
Figure 4.
Regional distribution of global organisationsn=204 companies
IT operations
CISO
ITS technician
CIO
IR team
Finance & accounting
CSO
SOC management
CTO
Risk management
Analysts
Compliance
North America
Europe
Middle East & Africa
Asia-Pacific
2020 Cost of Insider Threats Global Report
14%
15%
21%18%
16%
10%
6%
15%
14%
14%
10%8%
8%
7%
7%
5%
5%
3%4%
Figure 2 shows the
percentage distribution
of companies according
to global head count,
which is a surrogate
for organisational size.
As can be seen, 50 per
cent of the sample
includes larger-sized
companies with more
than 5,000 full‑time
equivalent employees.
According to Figure 3,
964 individuals
participated in field‑
based interviews. Each
case study involved an
average of 4.7 individuals.
The three largest
segments include: IT
operations (15 per cent),
CISOs (14 per cent) and IT
technicians (14 per cent).
Figure 4 shows
the global regions
participating in this
research. North America
represents the largest
segment (47 per cent
of companies) and
the Middle East is
the smallest segment
(8 per cent of companies).
Because of small sample
size, we combined Europe
and the Middle East to
form the EMEA segment.
9Ponemon Institute© Research Report

ANALYSIS OF INSIDER INCIDENTSFigure 5 shows the distribution of 4,716 reported attacks analysed in our sample.
A total of 2,962 attacks (or 62 per cent) pertained to employee or contractor
negligence. Criminal or malicious insiders caused another 1,105 attacks
(or 23 per cent).
There were 649 attacks (or 14 per cent) that involved credential theft
(a.k.a. impostor risk). Of these, 191 involved privileged user credential theft.
The largest number of reported incidents for a given company is 45 and the
smallest number of incidents is one per participating company.
2020 Cost of Insider Threats Global ReportAnalysis of Insider Incidents
Employee or contractor
negligence
Criminal & malicious insider
Credential thief (impostor risk)
Figure 5.
Frequency of 4,716 incidents for three insider profiles
2,962
1,105
649
10Ponemon Institute© Research Report

Analysis of Insider Incidents
Figure 6.
Percentage frequency of insider-related incidents per companyConsolidated for three profiles
Figure 7.
Frequency for three profiles of insider incidents
All types of insider threats are steadily increasing
As shown in Figure 7, since 2016 the average number of incidents involving employee or contractor negligence has increased from 10.5 to 14.5 in 2020. The average number of credential theft incidents per company have increased from 1 in 2016 to 3.2 in 2020.1
1 The 2016 data only pertains to US companies. The 2020 data includes North America, Europe, Middle East & Africa and Asia‑Pacific. We believe the data is comparable because US companies represented in the 2016 report are multinationals.
Figure 6 provides a graph that shows a histogram of insider incidents for our sample of 204 companies over the past 12 months. As shown, 60 per cent of companies experienced an average of more than 30 incidents per year.
FY2018
FY2020
Average FY2016
Average FY2018
Average FY2020
2020 Cost of Insider Threats Global Report
1 to 10
Employee or contractor negligence Criminal & malicious insider Credential thief (impostor risk)
28%
11
3
1
18%
26%
19%
8%
25%
13.2
4.6
2.7
14.51
5.42
3.18
16%
29%
19%
12%
30%
23%
15%
8%
0%
16.0
12.0
8.0
4.0
0.0
11 to 20 21 to 30 31 to 40 More than 40
11Ponemon Institute© Research Report

Figure 8.
Average incident frequency for three profiles
Figure 9.
Frequency for three profiles of insider incidents by global region
The frequency of insider threats varies across global regions
As shown in Figure 9, North American and Middle Eastern companies experienced the highest number of insider‑related incidents over the past 12 months. In contrast, APAC companies had the lowest number of insider-related incidents.
Companies in the Middle East experience the most insider incidents and Asia-Pacific had the fewest incidents
Figure 8 presents the frequency of insider incidents in the four regions represented in the research. In all regions, employee or contractor negligence occur most frequently. North America and the Middle East are most likely to experience credential theft.
Analysis of Insider Incidents
North America
Europe
Middle East
Asia-Pacific
Employee or contractor
negligence
Criminal &
malicious insider
Credential thief
(impostor risk)
2020 Cost of Insider Threats Global Report
16
16
13.4
16.7
13
5.7
3.9
13.4
5.75.1
6.8
4.5
5.1
3.1
16.7
3.93.1 3.6
1.4
6.8
3.6
13
4.5
1.4
18.0
13.5
9.0
4.5
0.0
18.0
13.5
9.0
4.5
0.0
Employee or contractor negligence
North America Europe Middle East Asia-Pacific
Criminal & malicious insider Credential thief (impostor risk)
12Ponemon Institute© Research Report

Figure 10.
Average activity cost by global regionMean=$11.45 (US$ millions)
Figure 11.
Insider incidents in ascending order by head count (size)Mean=$11.45 (US$ millions)
The larger the organisation, the more insider incidents
Figure 11 shows the distribution of insider incidents in ascending order by head count or size of the participating companies. As can be seen, the upward slope suggests that the frequency of insider incidents is positively correlated with organisational size. The correlation is most salient for larger-sized companies.
North American companies had an average annual cost higher than the average cost
Total annualised cost for four global regions is reported in Figure 10. Companies in North America experienced the highest total cost at $13.3 million. Middle East companies had the next highest cost at $11.65 million. Europe and Asia‑Pacific had an average cost much lower than average total cost for all 204 companies.
Analysis of Insider Incidents
Total incidents by company
Regression
2020 Cost of Insider Threats Global Report
13.3
11.65
9.82
7.89
$14.00
$10.50
$7.00
$3.50
$0.00
70
53
35
18
0
North America
Ascending order by head count (size)
Num
ber o
f inc
iden
ts
EuropeMiddle East Asia-Pacific
13Ponemon Institute© Research Report

Figure 12.
Average activity cost by head countMean=$11.45 (US$ millions)
Analysis of Insider Incidents 2020 Cost of Insider Threats Global Report
Total annualised cost adjusted for companies’ worldwide head count is reported in Figure 12. Companies with between 25,001 and 75,000 employees experienced the highest total cost at $17.92 million, while those with 500 to 1,000 employees had the lowest annualised cost at $6.92 million.
7.686.92
9.65
12.6413.95
17.92
16.65
$18.00
$13.50
$9.00
$4.50
$0.00
Less than 500
1,001 to 5,000
10,001 to 25,000
More than 75,000
501 to 1,000
5,001 to 10,000
25,001 to 75,000
14Ponemon Institute© Research Report

COST ANALYSISThis study addresses the core process-related activities that drive a range of
expenditures associated with a company’s response to insider-related incidents.
The seven internal cost activity centres in our framework are defined as follows:2
2020 Cost of Insider Threats Global ReportCost Analysis
Monitoring and surveillance: Activities that enable an organisation to reasonably detect and possibly deter insider incidents or attacks. This includes allocated (overhead) costs of certain enabling technologies that enhance mitigation or early detection.
Investigation:Activities necessary to thoroughly uncover the source, scope and magnitude of one or more incidents.
Escalation: Activities taken to raise awareness about actual incidents among key stakeholders within the company. The escalation activity also includes the steps taken to organise an initial management response.
Incident response: Activities relating to the formation and engagement of the incident response team including the steps taken to formulate a final management response.
Containment: Activities that focus on stopping or lessening the severity of insider incidents or attacks. These include shutting down vulnerable applications and endpoints.
Ex-post response: Activities to help the organisation minimise potential future insider-related incidents and attacks. It also includes steps taken to communicate with key stakeholders both within and outside the company, including the preparation of recommendations to minimise potential harm.
Remediation: Activities associated with repairing and remediating the organisation’s systems and core business processes. These include the restoration of damaged information assets and IT infrastructure.
2 Internal costs are extrapolated using labour (time) as a surrogate for direct and indirect costs. This is also used to allocate an overhead component for fixed costs such as multiyear investments in technologies.
15Ponemon Institute© Research Report

Companies spend an average of $644,852 on each incident
Table 1 summarises the average cost of insider-related incidents for the three types of incidents and seven activity centres. As reported, containment and remediation represent the most expensive activity centres. Least expensive are ex-post analysis and escalation.
Companies are spending more on investigations and escalation. Table 2 shows the percentage increase in cost for each activity. The cost of remediation has not increased as sharply as the other activities.
Analysis of Insider Incidents 2020 Cost of Insider Threats Global Report
Table 1. Cost Activity Centres (per incident)
Employee or contractor negligence
Criminal & malicious insider
Credential theft Average cost
Monitoring & surveillance $21,538 $21,857 $22,977 $22,124
Investigation $49,441 $114,524 $147,429 $103,798
Escalation $9,282 $29,513 $26,619 $21,805
Incident response $62,877 $159,398 $132,677 $118,317
Containment $75,903 $175,962 $382,794 $211,553
Ex-post analysis $21,035 $19,282 $18,121 $19,480
Remediation $67,036 $235,223 $141,069 $147,776
Total $307,111 $755,760 $871,686 $644,852
Table 2. Activity Cost Centres
FY 2016 FY 2018 FY 2020Net increase over 3 years
Monitoring & surveillance $9,610 $12,634 $22,124 79%
Investigation $41,461 $78,398 $103,798 86%
Escalation $8,919 $12,542 $21,805 84%
Incident response $66,370 $91,263 $118,317 56%
Containment $122,796 $173,060 $211,553 53%
Ex-post analysis $8,498 $11,491 $19,480 78%
Remediation $91,397 $138,532 $147,776 47%
Total $349,052 $517,920 $644,852 60%
16Ponemon Institute© Research Report

Figure 13.
Average cost per incident for three profilesUS$ millions
Figure 14.
Average annualised cost for three profiles US$ millions
On an annual basis, employee or contractor negligence costs companies the most
Figure 14 reports the extrapolated annualised insider‑related costs for three profiles. In terms of total annual costs, it is clear that employee or contractor negligence represents the most expensive insider profile. While credential theft is the most expensive on a unit cost basis, it represents the least expensive profile on an annualised basis.
As shown in Figure 13, the costliest insider incidents involve credential theft – which is more than 2.5 times as expensive for incidents involving employee or contractor negligence.
Cost Analysis 2020 Cost of Insider Threats Global Report
0.2069
2.1728
1.0414 0.9862
0.3471
0.4931
0.2776
3.6638
2.7788
1.8147
0.60410.6721
0.3071
4.576
4.0811
2.7984
0.7558
0.8717$0.90
$0.68
$0.45
$0.23
$0.00
$5.00
$3.75
$2.50
$1.25
$0.00
Employee or contractor negligence
Employee or contractor negligence
Credential thief (impostor risk)
Credential thief (impostor risk)
FY2016
FY2018
FY2020
FY2016
FY2018
FY2020
Criminal & malicious insider
Criminal & malicious insider
17Ponemon Institute© Research Report

Figure 15.
Sample statistics on the cost of insider incidents over the past 12 months Consolidated for three profiles | US$ millions
Figure 16.
Percentage cost of insider incidents by activity centre n=204 companies
Containment accounts for one-third of all costs
The following pie chart shows the percentage cost for seven activity centres. According to Figure 16, containment represents 33 per cent of total annualised insider-related costs. Activities relating to remediation and incident response represent 23 per cent and 18 per cent of total cost, respectively.
Figure 15 reports the median, mean, minimum and maximum values for insider cost (combining three profiles) over the past 12 months. The mean and median are $11.45 and $10.80 million, respectively. The minimum cost value is $.43 million and the maximum cost value is $26.99 million.
Cost Analysis 2020 Cost of Insider Threats Global Report
Containment
Remediation
Incident response
Investigation
Monitoring & surveillance
Escalation
Ex-post analysis
33%
23%
18%
16%
4%3% 3%
0.4335
11.4465 10.8
26.99$30.00
$22.50
$15.00
$7.50
$0.00
Minimum Mean Median Maximum
18Ponemon Institute© Research Report

Figure 17.
Percentage of insider cost by standard categories
Companies are spending the most on personnel and technology to resolve insider incidents
Figure 17 reports the percentage of insider cost for careless or negligent employees, criminal insiders and credential theft according to seven cost categories. The largest cost category (direct & indirect labour) includes both direct and indirect costs associated with in-house personnel and temporary and contract workers. This is followed by technology, which includes the amortised value and the licensing for software and hardware that are deployed in response to insider-related incidents (21%).
Process costs include governance and control system activities in response to threats and attacks. The cost of disruption includes diminished employee/user productivity as a result of insider incidents. overhead includes a wide array of miscellaneous costs incurred to support personnel as well as the IT security infrastructure.
Cost Analysis 2020 Cost of Insider Threats Global Report
Direct & indirect labour
Technology (amortised value)
Disruption cost (down time)
Process / workflow changes
Cash outlays
Revenue losses
Overhead
Companies were asked to estimate the direct costs spent to accomplish a given activity and the amount of time, effort and other resources spent, but not as a direct cash outlay (i.e. indirect costs). Figure 18 shows the proportion of direct and indirect costs for seven internal activity cost centres. As can be seen, the cost relating to monitoring and surveillance has the highest direct cost percentage. In contrast, escalation has the highest percentage of indirect cost.
25%
21%
18%
15%
10%
6%4%
19Ponemon Institute© Research Report
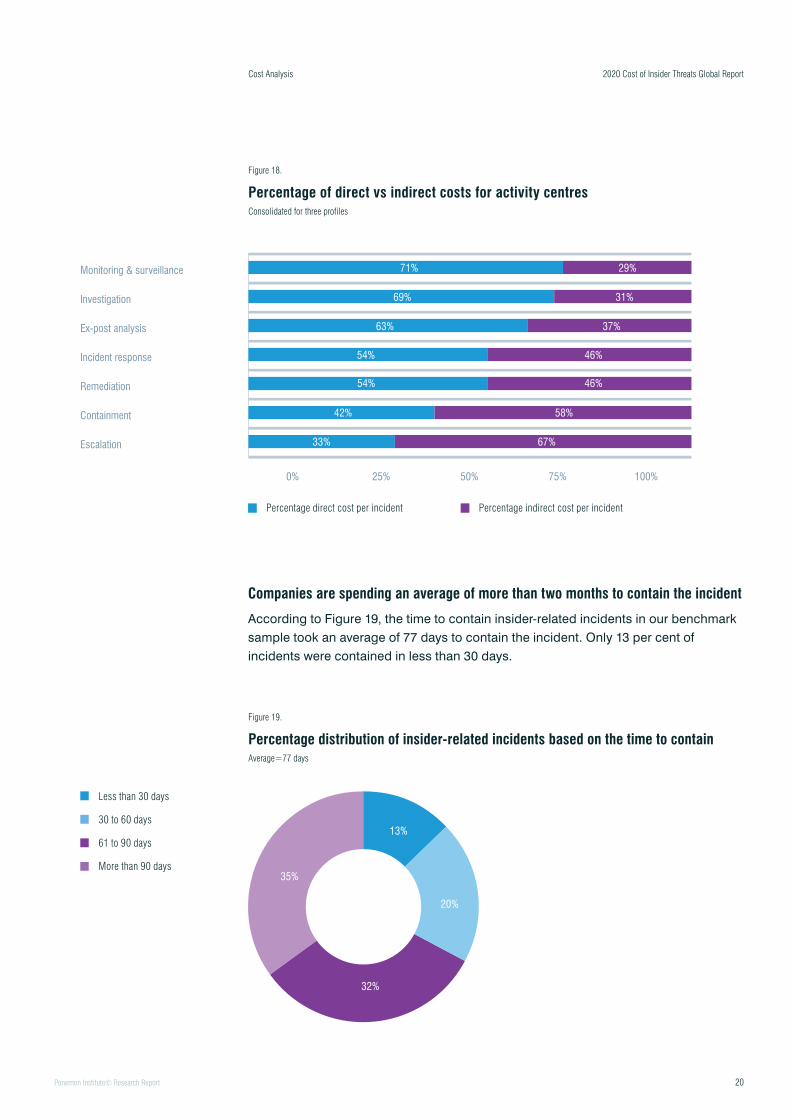
Figure 18.
Percentage of direct vs indirect costs for activity centres Consolidated for three profiles
Cost Analysis 2020 Cost of Insider Threats Global Report
Companies are spending an average of more than two months to contain the incident
According to Figure 19, the time to contain insider-related incidents in our benchmark sample took an average of 77 days to contain the incident. Only 13 per cent of incidents were contained in less than 30 days.
Figure 19.
Percentage distribution of insider-related incidents based on the time to contain Average=77 days
Less than 30 days
30 to 60 days
61 to 90 days
More than 90 days
Percentage direct cost per incident Percentage indirect cost per incident
13%
20%
32%
35%
Monitoring & surveillance
Investigation
Ex-post analysis
Incident response
Remediation
Containment
Escalation
0% 25% 50% 75% 100%
71%
69%
63%
54%
54%
42%
33%
29%
31%
37%
46%
46%
58%
67%
20Ponemon Institute© Research Report

Figure 20.
Average activity cost by days to contain the incidentsMean=$11.45 (US$ millions)
Total annualised cost for 13 industry sectors is reported in Figure 213. At $14.50 million, companies in financial services experienced the highest total cost. Services and technology & software had the next highest costs at $12.31 million and $12.30 million, respectively. In contrast, companies in education and research had the lowest total annualised cost at $8.85 million.
3 Care should be taken when reviewing industry sector differences because of small subsample sizes.
The faster containment occurs, the lower the cost
Total annualised cost appears to be positively correlated with the time to contain insider‑related incidents. As shown in Figure 20, incidents that took more than 90 days to contain had the highest average total cost per year ($13.71 million). In contrast, incidents that took less than 30 days to contain had the lowest total cost. ($7.12 million). The average annual cost is $11.45 million.
Cost Analysis 2020 Cost of Insider Threats Global Report
7.12
8.85
12.36
13.71$14.00
$10.50
$7.00
$3.50
$0.00
Less than 30 days 30 to 60 days 61 to 90 days More than 90 days
21Ponemon Institute© Research Report

Figure 21.
Annualised activity cost by industrial sectorMean=$11.45 (US$ millions)
Figure 22.
Scattergram of insider-related incidents by companyMean=$11.45 (US$ millions)
Figure 22 shows a scattergram on the total annualised cost of insider incidents per company. Of the 204 participating companies, 124 companies (61 per cent) of companies had an average total cost at or below the mean of $11.45 million over the past 12 months. The remaining 80 companies (39 per cent) are above the average of $11.45 million. This finding suggests that the distribution is skewed.
Cost Analysis 2020 Cost of Insider Threats Global Report
Financial services
Services
Technology & software
Energy & utilities
Communications
Health & pharmaceuticals
Industrial & manufacturing
Hospitality
Retail
Consumer products
Transportation
Entertainment & media
Education & research
$0.00 $3.75 $7.50 $11.25 $15.00
14.5
10.25
12.31
10.24
12.3
10.24
11.54
9.76
11.43
9.23
10.81
9.06
8.85
50
38
25
13
00 80 16040 120 20020 100 18060 140 220
22Ponemon Institute© Research Report
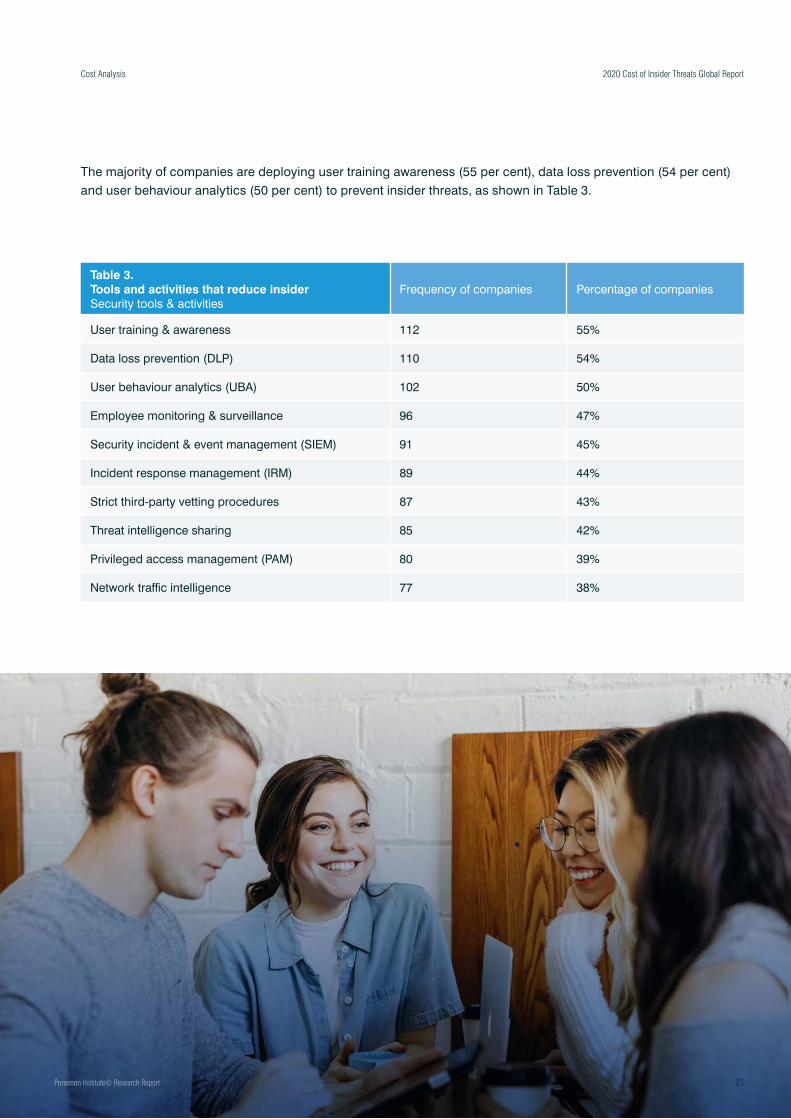
The majority of companies are deploying user training awareness (55 per cent), data loss prevention (54 per cent) and user behaviour analytics (50 per cent) to prevent insider threats, as shown in Table 3.
Cost Analysis
Table 3. Tools and activities that reduce insider Security tools & activities
Frequency of companies Percentage of companies
User training & awareness 112 55%
Data loss prevention (DLP) 110 54%
User behaviour analytics (UBA) 102 50%
Employee monitoring & surveillance 96 47%
Security incident & event management (SIEM) 91 45%
Incident response management (IRM) 89 44%
Strict third-party vetting procedures 87 43%
Threat intelligence sharing 85 42%
Privileged access management (PAM) 80 39%
Network traffic intelligence 77 38%
2020 Cost of Insider Threats Global Report
23Ponemon Institute© Research Report

Figure 23.
Cost savings resulting in the deployment of cyber risk reducing tools and activities Mean = $11.45 (US$ millions)
UBA, PAM and user training awareness are the most cost effective tools and activities
According to Figure 23, companies can save an average of $3.4 million and $3.1 million when deploying UBA and a privileged access management (PAM) solution. The most frequently deployed tools and activities are shown in Figure 23. Accordingly, 112 companies conduct training programmes to raise employee awareness about insider threats. The number of companies that utilise data loss prevention is 110 and 102 companies deploy user behaviour analytics (UBA) to spot suspicious network activities.
Cost Analysis
User behaviour anaytics (UBA)
Privileged access management (PAM)
User training & awareness
Security incident & event management (SIEM)
Threat intelligence sharing
Strict third-party vetting procedures
Incident response management (IRM)
Employee monitoring & survelliance
Network traffic intelligence
Data loss prevention (DLP)
$ – $0.9 $1.8 $2.7 $3.6
3.42
3.02
2.84
2.67
1.95
3.1
2.91
2.74
2.6
1.88
2020 Cost of Insider Threats Global Report
24Ponemon Institute© Research Report

CONCLUSIONS – INSIDER THREAT MANAGEMENTWith insider threats on the rise, an increase in the average cost per incident from
$8.76 million in 2018 (Ponemon) to $11.45 million in 2020, and an increase from
73 to 77 days (Ponemon) to contain an incident, organisations need to build an
effective Insider Threat Management programme. Such a programme would
ensure that the organisation can respond quickly if an incident happens and
minimise the overall impact to the business.
Whether they are caused accidentally or maliciously, insider threat incidents
cannot be mitigated with technology alone. Organisations need an Insider Threat
Management programme that combines people, processes and technology to
identify and prevent incidents within the organisation.
2020 Cost of Insider Threats Global ReportConclusions - Insider Threat Management
25Ponemon Institute© Research Report

People
• Insider threat detection and prevention is a team sport. Ensure the right groups and stakeholders are involved in the organisation’s secure operations centre.
• Limit user access to non-essential data or attempt to limit the duration of time privileged users can access the information needed to complete a task.
• Look for leading behavioural indicators to uncover a potentially malicious insider threat.
Process
• Evaluate the organisation’s risk and develop a dedicated insider threat function in the organisation, especially if data is particularly sensitive or valuable.
• Establish consistent, repeatable processes that are fair to all employees, using technology to enable and support these processes.
• Invest in training for users, empowering them in areas such as secure data handling, security awareness and vigilance.
Technology
• Consider the performance impact, as well as ease of management, deployment, stability and flexibility of any insider threat solution.
• Choose a solution that can scale with the organisation as it grows.
• Keep in mind a vendor’s expertise on insider threat vs external detection and prevention.
• Determine if the solution gives visibility into what users are doing, particularly privileged users.
Conclusions - Insider Threat Management 2020 Cost of Insider Threats Global Report
26Ponemon Institute© Research Report

FRAMEWORKThe purpose of this research is to provide guidance on what an insider threat can cost an organisation. This cost study is unique in addressing the core systems and business process-related activities that drive a range of expenditures associated with a company’s response to insider negligence and criminal behaviours. In this study, we define an insider‑related incident as one that results in the diminishment of a company’s core data, networks or enterprise systems. It also includes attacks perpetrated by external actors who steal the credentials of legitimate employees/users (i.e., impostor risk).
Our benchmark methods attempt to elicit the actual experiences and consequences of insider-related incidents. Based on interviews with a variety of senior-level individuals in each organisation we classify the costs according to two different cost streams:
• The costs related to minimising insider threats or what we refer to as the internal cost activity centres.
• The costs related to the consequences of incidents, or what we refer to as the external effect of the event or attack.
We analyse the internal cost centres sequentially—starting with monitoring and surveillance of the insider threat landscape and ending with remediation activities. Also included are the costs due to lost business opportunities and business disruption. In each of the cost activity centres we asked respondents to estimate the direct costs, indirect costs and, when applicable, opportunity costs. These are defined as follows:
• Direct cost – the direct expense outlay to accomplish a given activity.
• Indirect cost – the amount of time, effort and other organisational resources spent, but not as a direct cash outlay.
• Opportunity cost – the cost resulting from lost business opportunities as a consequence of reputation diminishment after the incident.
External costs such as the loss of information assets, business disruption, equipment damage and revenue loss, were captured using shadow-costing methods. Total costs were allocated to seven discernible cost vectors.4
Framework
4 We acknowledge that these seven cost categories are not mutually independent and they do not represent an exhaustive list of all cost activity centres.
THIS COST STUDY IS UNIQUE IN ADDRESSING THE CORE SYSTEMS AND BUSINESS PROCESS-RELATED ACTIVITIES THAT DRIVE A RANGE OF EXPENDITURES.
2020 Cost of Insider Threats Global Report
27Ponemon Institute© Research Report

This study addresses the core process-related activities that drive a range of expenditures associated with a company’s response to insider-related incidents.
The seven internal cost activity centres in our framework include:5
• Monitoring and surveillance: Activities that enable an organisation to reasonably detect and possibly deter insider incidents or attacks. This includes allocated (overhead) costs of certain enabling technologies that enhance mitigation or early detection.
• Investigation: Activities necessary to thoroughly uncover the source, scope and magnitude of one or more incidents.
• Escalation: Activities taken to raise awareness about actual incidents among key stakeholders within the company. The escalation activity also includes the steps taken to organise an initial management response.
• Incident response: Activities relating to the formation and engagement of the incident response team including the steps taken to formulate a final management response.
• Containment: Activities that focus on stopping or lessening the severity of insider incidents or attacks. These include shutting down vulnerable applications and endpoints.
• Ex-post response: Activities to help the organisation minimise potential future insider-related incidents and attacks. It also includes steps taken to communicate with key stakeholders both within and outside the company, including the preparation of recommendations to minimise potential harm.
• Remediation: Activities associated with repairing and remediating the organisation’s systems and core business processes. These include the restoration of damaged information assets and IT infrastructure.
In addition to the above process-related activities, organisations often experience external consequences or costs associated with the aftermath of incidents. Our research shows that four general cost activities associated with these external consequences are as follows:
• Cost of information loss or theft: Loss or theft of sensitive and confidential information as a result of an insider attack. Such information includes trade secrets, intellectual properties (including source code), customer information and employee records. This cost category also includes the cost of data breach notification in the event that personal information is wrongfully acquired.
• Cost of business disruption: The economic impact of downtime or unplanned outages that prevent the organisation from meeting its data processing requirements.
• Cost of equipment damage: The cost to remediate equipment and other IT assets as a result of insider attacks to information resources and critical infrastructure.
• Lost revenue: The loss of customers (churn) and other stakeholders because of system delays or shutdowns as a result of an insider attack. To extrapolate this cost, we use a shadow costing method that relies on the “lifetime value” of an average customer as defined for each participating organisation.
Framework 2020 Cost of Insider Threats Global Report
5 Internal costs are extrapolated using labour (time) as a surrogate for direct and indirect costs. This is also used to allocate an overhead component for fixed costs such as a multiyear investment in technologies.
28Ponemon Institute© Research Report

BENCHMARKINGOur benchmark instrument is designed to collect descriptive information from IT, information security and other key individuals about the actual costs incurred either directly or indirectly as a result of insider-related incidents or attacks actually detected. Our cost method does not require subjects to provide actual accounting results, but instead relies on estimation and extrapolation from interview data over a four-week period.
Cost estimation is based on confidential diagnostic interviews with key respondents within each benchmarked organisation. Data collection methods did not include actual accounting information, but instead relied upon numerical estimation based on the knowledge and experience of each participant. Within each category, cost estimation was a two-stage process. First, the benchmark instrument required individuals to rate direct cost estimates for each cost category by marking a range variable defined in the following number line format.
How to use the number line
The number line provided under each data breach cost category is one way to obtain your best estimate for the sum of cash outlays, labour and overhead incurred. Please mark only one point somewhere between the lower and upper limits set above. You can reset the lower and upper limits of the number line at any time during the interview process.
LL
UL
Benchmarking
OUR BENCHMARK INSTRUMENT IS DESIGNED TO COLLECT DESCRIPTIVE INFORMATION FROM IT.
2020 Cost of Insider Threats Global Report
Post your estimate of direct costs here for [presented cost category]
The numerical value obtained from the number line rather than a point estimate for each presented cost category preserved confidentiality and ensured a higher response rate. The benchmark instrument also required practitioners to provide a second estimate for indirect and opportunity costs, separately.
Cost estimates were then compiled for each organisation based on the relative magnitude of these costs in comparison to a direct cost within a given category. Finally, we administered general interview questions to obtain additional facts, including estimated revenue losses as a result of the insider-related incident or attack.
The size and scope of survey items was limited to known cost categories that cut across different industry sectors. In our experience, a survey focusing on process yields a higher response rate and better quality of results. We also used a paper instrument, rather than an electronic survey, to provide greater assurances of confidentiality.
To maintain complete confidentiality, the survey instrument did not capture company‑specific information of any kind. Subject materials contained no tracking codes or other methods that could link responses to participating companies.
We carefully limited items to only those cost activities considered crucial to the measurement of cost to keep the benchmark instrument to a manageable size. Based on discussions with learned experts, the final set of items focused on a finite set of direct or indirect cost activities. After collecting benchmark information, each instrument was examined carefully for consistency and completeness. In this study, a few companies were rejected because of incomplete, inconsistent or blank responses.
Field research was launched in March 2019. To maintain consistency for all benchmark companies, information was collected about the organisations’ experience was limited to four consecutive weeks. This time frame was not necessarily the same time period as other organisations in this study. The extrapolated direct and indirect costs were annualised by dividing the total cost collected over four weeks (ratio = 4/52 weeks).
29Ponemon Institute© Research Report
RESEARCH LIMITATIONSOur study utilises a confidential and proprietary benchmark method that has been successfully deployed in earlier research. However, there are inherent limitations with this benchmark research that need to be carefully considered before drawing conclusions from findings.
• Non-statistical results: Our study draws upon a representative, non-statistical sample of organisations experiencing one or more insider-related incidents during the past 12 months. Statistical inferences, margins of error and confidence intervals cannot be applied to these data given that our sampling methods are not scientific.
• Non-response: The current findings are based on a small representative sample of benchmarks. In this study, 159 companies completed the benchmark process. Non‑response bias was not tested so it is always possible companies that did not participate are substantially different in terms of underlying data breach cost.
• Sampling-frame bias: Because our sampling frame is judgmental, the quality of results is influenced by the degree to which the frame is representative of the population of companies being studied. It is our belief that the current sampling frame is biased toward companies with more mature privacy or information security programmes.
• Company-specific information: The benchmark information is sensitive and confidential. Thus, the current instrument does not capture company-identifying information. It also allows individuals to use categorical response variables to disclose demographic information about the company and industry category.
• Unmeasured factors: To keep the interview script concise and focused, we decided to omit other important variables from our analyses such as leading trends and organisational characteristics. The extent to which omitted variables might explain benchmark results cannot be determined.
• Extrapolated cost results: The quality of benchmark research is based on the integrity of confidential responses provided by respondents in participating companies. While certain checks and balances can be incorporated into the benchmark process, there is always the possibility that respondents did not provide accurate or truthful responses. In addition, the use of cost extrapolation methods rather than actual cost data may inadvertently introduce bias and inaccuracies.
2020 Cost of Insider Threats Global ReportResearch Limitations
30Ponemon Institute© Research Report

ABOUT OBSERVEITAs the leading Insider Threat Management solution, Proofpoint | ObserveIT
protects against data loss, malicious acts and brand damage involving insiders
acting maliciously, negligently or unknowingly. ObserveIT correlates activity and
data movement, empowering security teams to identify user risk, detect and
respond to insider-led data breaches, and accelerate security incident response.
For more information visit: www.observeIT.com
ABOUT PONEMON INSTITUTEPonemon Institute is dedicated to independent research and education that
advances responsible information and privacy management practices within
business and government. Our mission is to conduct high quality, empirical
studies on critical issues affecting the management and security of sensitive
information about people and organisations.
We uphold strict data confidentiality, privacy and ethical research standards.
We do not collect any personally identifiable information from individuals
(or company identifiable information in our business research). Furthermore,
we have strict quality standards to ensure that subjects are not asked extraneous,
irrelevant or improper questions.
2020 Cost of Insider Threats Global Report
Ponemon Institute© Research Report 31