2020 BART Customer Satisfaction Study
74
2020 BART Customer Satisfaction Study Issued Mar. 22, 2021 BART Marketing & Research Dept.
Transcript of 2020 BART Customer Satisfaction Study

2020 BART Customer Satisfaction Study Issued Mar. 22, 2021 BART Marketing & Research Dept.

This page intentionally left blank.

2020 BART CUSTOMER SATISFACTION STUDY
BART Marketing and Research Department 1
CONTENTS
INTRODUCTION ........................................................................................ 2
EXECUTIVE SUMMARY ............................................................................. 4
DETAILED RESULTS ................................................................................... 8 Overall Satisfaction ........................................................................................ 9 Willingness to Recommend BART ................................................................11 Perception of Value ......................................................................................13 Specific Service Attributes ............................................................................15 Quadrant Analysis ........................................................................................19 Ethnicity Compared to Region .....................................................................23
APPENDICES A. Questionnaire...........................................................................................24 B. Complete Tabulations ..............................................................................31 C. Service Attribute Ratings – Percentages ..................................................58 D. Description of Methodology ....................................................................60 E. Coding of Respondent Comments ............................................................68 F. 2018 Quadrant Chart ................................................................................71

2020 BART CUSTOMER SATISFACTION STUDY
2 BART Marketing and Research Department
INTRODUCTION BART’s Customer Satisfaction Study is a tool to help BART prioritize efforts to achieve higher levels of customer satisfaction. The study involves surveying BART customers onboard randomly selected train cars every two years to determine how well BART is meeting customers’ needs and expectations. These surveys, initiated in 1996, are conducted by an independent research firm. This report presents the results of BART’s 13th Customer Satisfaction Study, conducted in October 2020. Conditions at the time of the survey were very different from any past survey that BART has conducted due to the COVID-19 pandemic. Bay Area residents were being encouraged to avoid non-essential travel, and many employers were allowing employees to work from home if feasible. For those making essential trips, wearing face coverings and social distancing were required in order to control the spread of the virus. BART ridership was at 12% of typical levels, with average weekday ridership of 53,300 in October 2020, as compared to approximately 433,000 at the time of the last survey in September 2018. Operationally, BART implemented many changes due to the pandemic. Due to lower ridership, service hours and frequency were reduced. However, BART continued to run long trains despite the dramatic drop in ridership in order to facilitate social distancing onboard. BART implemented numerous other initiatives to provide riders with a safe and clean environment including:
• Fogging train cars with disinfectant every 24 hours; • Disinfecting touchpoints inside trains at end-of-line stations; • Disinfecting touchpoints inside stations and elevators several times a day; • Installing hand sanitizer dispensers at all stations; • Installing signage communicating face covering requirements at all station entrances; • Providing masks to those who needed them (via Station Agents, BART Police, and ambassadors).
Since it was clear that this would not be a typical Customer Satisfaction Survey, postponing the survey was considered. However, it may be quite a while until BART ridership returns to “normal,” and BART relies on customer data to evaluate how well it’s doing and to inform the prioritization of potential new initiatives. Additionally, proceeding with the survey would enable BART to get feedback on its COVID-related initiatives and learn more about its current riders, including their trip purposes and demographics. Conducting an onboard survey during a pandemic required some additional precautions and some slight changes to the methodology. Survey staff were required to wear masks and maintain as much distance as possible from others on the train. They were advised to not approach any passenger who was not wearing a face covering. Flexible questionnaire return options were available to riders – in addition to completing the paper questionnaire onboard, riders could choose to instead fold and mail it back later (postage-paid), take the survey online using the URL or QR code printed on the questionnaire, or scan a

2020 BART CUSTOMER SATISFACTION STUDY
BART Marketing and Research Department 3
QR code on a clipboard if they preferred a contactless option. (Additional details about methodological changes are in Appendix D.)
Note that due to the very different context in which this survey was conducted, as well as other factors (changes in ridership – both in terms of number of riders and demographic composition – and minor changes to survey methodology), it is not advisable to directly track satisfaction-related questions and attribute ratings against prior surveys. However, key statistics from the 2018 survey are noted where relevant throughout this report for reference. The 2020 survey was conducted over a two-week period in October, including both weekdays and weekends, and resulted in 2,969 completed questionnaires. (For reference, 5,294 questionnaires were completed in 2018.) The Executive Summary in the next section highlights key findings from the survey. Subsequent sections present detailed analyses of the factors that influence customer satisfaction and a description of the survey methodology, including a copy of the questionnaire. The initial survey questions ask customers about the trip they are making when intercepted (entry station, trip purpose, etc.). Customers are then asked three key opinion questions focusing on:
• Overall satisfaction; • Willingness to recommend BART; and • Perceptions of BART’s value for the money.
In addition, the survey probes for ratings of 22 specific service attributes, ranging from on-time performance to station cleanliness. BART uses the service attribute ratings to set priorities for customer satisfaction initiatives. It should be noted that a number of changes have occurred since the previous study in fall of 2018, including the following:
• The COVID-19 pandemic which dramatically altered people’s daily lives and reduced BART’s ridership, starting with the first Bay Area “shelter-in-place” order on March 17, 2020
• Regional homelessness and opioid crises, exacerbated by the pandemic • The opening of two new BART stations, Milpitas and Berryessa / North San José, in June 2020 • More Fleet of the Future trains in service (17 were in service in 2020, as compared to only one
during the 2018 survey) • New discounted fares for eligible low-income riders through MTC’s Clipper Start program (20%
discount) • Ambassador program to increase the presence of uniformed personnel on trains, which was
launched as a pilot program in February 2020 and made permanent in October 2020.

2020 BART CUSTOMER SATISFACTION STUDY
4 BART Marketing and Research Department
EXECUTIVE SUMMARY Overall, riders gave BART relatively high ratings on the three key satisfaction questions. While prior years’ satisfaction data are not shown graphically in the charts in this report due to the very different context for this year’s survey, key results from the last two surveys are noted in the text for reference.
• 72% say they are very or somewhat satisfied with BART. This is up 16 percentage points from 56% in 2018.
• 81% would definitely or probably recommend BART to a friend or out-of-town guest. This is up eight percentage points from 74% in 2018.
• 66% agree strongly or somewhat that “BART is a good value for the money.” This is up 11 percentage points from 55% in 2018.
Given the different context for this year’s survey, as well as the changes in ridership (both in terms of number of riders and demographic composition), it is difficult to pinpoint precise reasons for the relatively strong ratings, at least compared to the last two surveys. However, the survey data and open- ended comments point to the following factors:
• A review of open-ended comments revealed that many riders were grateful and relieved that BART was still running during the pandemic, providing reliable and much needed service, despite all the uncertainty in other aspects of current life.
• The quadrant chart (see page 19) revealed that COVID-related attributes were of high importance to riders, and BART was rated above average on all of these (BART’s COVID-related response efforts, ability to social distance on the BART system, and face covering compliance). BART implemented many COVID-related initiatives, including fogging trains with disinfectant every 24 hours, more frequent disinfecting of touchpoints within stations and on trains, providing hand sanitizer dispensers at all stations, running ten-car trains as much as possible to facilitate social distancing, and installing signage to remind riders that face coverings are required.
• On-time performance, also of high importance to riders, was the highest-rated attribute in this year’s survey.
• In past surveys, crowded trains contributed to lower satisfaction scores. With BART ridership at 12% of typical levels due to the pandemic, and with long trains being maintained to allow for social distancing, most riders were able to have sufficient space on trains. It is also noteworthy that those who were able to social distance for their entire BART ride were much more likely to be satisfied with BART than those who were not able to do so.
Demographic differences could also have impacted results. Compared to 2018 riders, current riders are

2020 BART CUSTOMER SATISFACTION STUDY
BART Marketing and Research Department 5
more likely to have lower household incomes, to not have a car, and to identify as non-white. Additionally, riders ages 55+ comprised a higher percentage of riders than in 2018. In this survey and in past years’ surveys, older riders have tended to rate BART more positively than younger riders. (Note that in a few past surveys, riders with lower incomes also tended to rate BART more positively than those with higher incomes. However, there did not appear to be a strong correlation between income and satisfaction in this year’s survey.)
In terms of where BART should focus its efforts to improve customer satisfaction, the quadrant chart prioritization exercise showed that the target issues of cleanliness, particularly train cleanliness, and personal security were of high importance, but were rated below average by customers. The lowest rated attribute, addressing homelessness on the BART system, was also of above-average importance to customers and is often inter-related with cleanliness and personal security, based on open-ended comments. If BART is able to invest in improvements in these areas, customer satisfaction is likely to increase.
With regard to train interior cleanliness, riders commented on dirty and/or damaged seats, specifically on legacy cars, as well as food and trash left on trains. Some expressed a desire for trains to be cleaned more frequently throughout the day, with a few noting that they expected cleaner trains due to the pandemic. The comments about station cleanliness were typically more general, with a few noting that cleanliness varied by station, calling out specific stations they felt needed more attention (such as downtown San Francisco stations). Ratings of these cleanliness attributes were likely impacted by changes to cleaning protocols necessitated by the COVID-19 pandemic. Many employees responsible for cleaning trains and stations have been redeployed to duties focusing on disinfection. Twenty-seven percent of active “Utility Workers” (responsible for cleaning trains, performing preventive maintenance on train cars in shops, and maintaining shops and transportation facilities) were re-deployed to COVID-related cleaning, such as nightly disinfecting of the fleet, end-of-line disinfecting of high touchpoints on train cars, and deep cleaning of facilities with positive COVID cases. While these changes were necessary due to the pandemic, there are currently fewer staff available to pick up food and garbage left on trains at ends of lines and to respond to biohazard issues while the trains are in service. Similarly, duties for many “System Service Workers” (responsible for cleaning stations and employee facilities) have changed to emphasize disinfection. Twelve of 127 active System Service Workers were pulled from their normal duties to form a new team tasked with disinfecting high touchpoints at high

2020 BART CUSTOMER SATISFACTION STUDY
6 BART Marketing and Research Department
volume stations. Overall, a substantial amount of resources has been redirected from standard station cleaning / trash removal duties to disinfection. For example, 25% of all System Service Worker hours are currently spent on disinfection. Increasing train and station cleaning, while maintaining current disinfecting protocols, would require a substantial increase in funding. Comments about personal security referenced the need for more police, the presence of homeless riders, individuals not wearing masks, fare evasion, drug use / smoking on BART, and disruptive passengers. Some specifically mentioned that riding BART at night was a concern.
Looking at data from the BART Police Department from 2020, the most common type of call was for “well-being and medical assistance.” This supports the Police Department’s recent initiative to launch its Progressive Policing and Community Engagement Bureau, which includes “non-sworn” unarmed personnel, such as the Transit Ambassadors. The Transit Ambassador program, consisting of 10 unarmed, uniformed personnel trained in de-escalation, was launched as a pilot program in February 2020 and made permanent in October 2020. By summer 2021, BART Police plans to hire 20 Crisis Intervention Specialists to join the Bureau. These employees, who will be trained to handle mental health emergencies and homeless outreach, will serve as case managers, communicating with county and non-profit agencies as needed. BART will also be deploying additional officers dedicated to patrolling trains during swing shift (late morning through evening), starting in late March 2021. (This is in addition to the “Train Teams” currently working earlier hours.) If riders have a non-emergency situation to report, they are now able to text the BART Police to report the issue. The text line was launched in August 2020 to provide riders with another discreet means of notifying BART Police of an issue, in addition to the BART Watch app. With regard to addressing homelessness, this is an incredibly complex issue that requires a coordinated regional response. While the issue is not unique to BART, it has a big impact on the system, and BART has already developed successful outreach programs in partnership with San Francisco and Contra Costa counties. As the pandemic has exacerbated the Bay Area homelessness crisis due to the accompanying economic downturn, along with housing instability and shelter closures, it is not surprising that many continue to seek shelter on BART property. In response, BART is participating in the newly formed Regional Impact Council (RIC), which consists of leaders across various Bay Area sectors, to develop

2020 BART CUSTOMER SATISFACTION STUDY
BART Marketing and Research Department 7
coordinated strategies to address the unsheltered homeless crisis. BART has also created a new position, “Senior Manager of Social Services Partnerships” to implement a Strategic Homeless Action Plan for BART. The plan will involve public/private partnerships, advocacy at all levels of government, and collecting and tracking key metrics to evaluate the success of the plan. Additionally, addressing homelessness will be a primary focus of the new Crisis Intervention Specialists (part of the BART Police Department’s Progressive Policing and Community Engagement Bureau, as mentioned above).

2020 BART CUSTOMER SATISFACTION STUDY
8 BART Marketing and Research Department
DETAILED RESULTS

2020 BART CUSTOMER SATISFACTION STUDY
BART Marketing and Research Department 9
OVERALL SATISFACTION
Overall, 72% of BART riders are very or somewhat satisfied with BART. For reference, this is substantially higher than satisfaction ratings in the 2018 survey, and somewhat higher than ratings in the 2016 survey. (In 2018, 56% were very or somewhat satisfied, and in 2016, 69% were very or somewhat satisfied. Thus far, the highest rating was achieved in 2004, when 87% of customers were satisfied with BART.)*
39%
34%
18%
7%
3%
Very Satisfied Somewhat Satisfied Neutral SomewhatDissatisfied
Very Dissatisfied
Overall, how satisfied are you with the services provided by BART?
2020: 72% satisfied; 9% dissatisfied 2018: 56% satisfied; 21% dissatisfied
n: 2,959 Note that Top 2 Box score of 72% and Bottom 2 Box score of 9% are impacted by rounding.
*In this year’s report, missing responses have been excluded from the percentages, which differs from prior years’ reports. As such, the satisfaction percentage for 2004 was previously reported as 86%.

2020 BART CUSTOMER SATISFACTION STUDY
10 BART Marketing and Research Department
OVERALL SATISFACTION (Peak / Off-Peak / Weekend Comparison)
As in past years’ surveys, there are some differences among customers who ride at during different time periods, most notably that weekend riders are more likely to be “very satisfied” than weekday peak riders.
39%
34%
18%
7%
3%
34%
37%
19%
7%
3%
42%
32%
17%
7%
2%
44%
29%
19%
5%3%
Very Satisfied Somewhat Satisfied Neutral SomewhatDissatisfied
Very Dissatisfied
Total
Weekday Peak
Weekday Offpeak
Weekend
Overall, how satisfied are you with the services provided by BART?
Total n: 2,959 Peak n: 972 Off-peak n: 1,215 Weekend n: 772

2020 BART CUSTOMER SATISFACTION STUDY
BART Marketing and Research Department 11
WILLINGNESS TO RECOMMEND BART
About eight out of ten riders (81%) would recommend BART. This is up from 74% in the 2018 survey.
53%
29%
13%
4%2%
Definitely Probably Might or Might Not Probably Not Definitely Not
Would you recommend using BART to a friend or out-of-town guest?
2020: 81% would recommend; 6% would not2018: 74% would recommend; 9% would not
n: 2,952 Note that Top 2 Box score of 81% is impacted by rounding.

2020 BART CUSTOMER SATISFACTION STUDY
12 BART Marketing and Research Department
WILLINGNESS TO RECOMMEND BART (Peak / Off-Peak / Weekend Comparison)
Weekend riders are more likely to “definitely recommend BART” than weekday riders.
53%
29%
13%
4%2%
49%
30%
15%
5%2%
54%
29%
12%
3%2%
59%
26%
10%
3%2%
Definitely Probably Might or Might Not Probably Not Definitely Not
Total
Weekday Peak
Weekday Off-Peak
Weekend
Would you recommend using BART to a friend or out-of-town guest?
Total n: 2,952 Peak n: 969 Off-peak n: 1,210 Weekend n: 773

2020 BART CUSTOMER SATISFACTION STUDY
BART Marketing and Research Department 13
PERCEPTION OF BART AS GOOD VALUE
About two out of three (66%) see BART as a good value. This is up 11 percentage points from 55% in 2018.
35%
31%
20%
9%
5%
Agree strongly Agree somewhat Neutral Disagree somewhat Disagree strongly
To what extent do you agree with the following statement: "BART is a good value for the money."
2020: 66% agree; 14% disagree2018: 55% agree; 23% disagree
n: 2,920

2020 BART CUSTOMER SATISFACTION STUDY
14 BART Marketing and Research Department
PERCEPTION OF BART AS GOOD VALUE (Peak / Off-Peak / Weekend Comparison)
Weekday off-peak and weekend customers are more likely to agree strongly that BART is a good value, as compared to weekday peak customers. Peak period customers are more likely to ride BART five or more days per week, so the aggregate fares they pay exceed fares paid by off-peak and weekend customers. While off-peak and weekend customers generally ride BART less frequently, they are a much larger group of people overall and are an important part of public support for the BART system.
35%
31%
20%
9%
5%
32%
31%
21%
10%
6%
38%
32%
18%
8%
4%
38%
29%
20%
9%
5%
Agree Strongly Agree Somewhat Neutral Disagree Somewhat Disagree Strongly
Total
Weekday Peak
Weekday Off-Peak
Weekend
To what extent do you agree with the following statement: "BART is a good value for the money."
Total n: 2,920 Peak n: 963 Off-peak n: 1,192 Weekend n: 765

2020 BART CUSTOMER SATISFACTION STUDY
BART Marketing and Research Department 15
SPECIFIC SERVICE ATTRIBUTES In the 2020 survey, customers rated BART on 22 specific service attributes. (Note that the number of attributes was greatly reduced from 46 in 2018 in order to streamline the questionnaire, making it faster and easier for riders to complete, as well as to allow space for a postage-paid mail-back panel on the questionnaire.) These attributes included four new items and one modified item.
New attributes on the 2020 survey • BART (official) mobile app • Ability to social distance (stay 3 to 6 feet away from others) on the BART system • BART’s COVID-related response efforts • Compliance with face covering policy on the BART system
Modified attribute
• Presence of BART Police (The 2018 survey included three police-related attributes: Presence of BART Police on trains, Presence of BART Police in stations, and Presence of BART Police outside stations)
The chart on page 18 shows mean ratings for each of these 22 service attributes. Items appearing towards the top of the chart are rated highest, while items appearing at the bottom are rated lowest. The average rating (on a scale from 1 = Poor to 7 = Excellent) is shown next to the bar for each item. BART received the highest ratings for:
• On-time performance of trains • The bart.gov website • Access for people with disabilities
BART received the lowest ratings for: • Addressing homelessness on the BART system • Enforcement against fare evasion • Presence of BART Police
Looking at BART’s internal tracking data for on-time performance (reported in BART’s “Quarterly Performance Reports”), the “Customers On Time” metric was up nearly one percentage point vs. the survey period in 2018 (94.4% vs. 93.6%). On-time performance has historically been correlated with high levels of customer satisfaction, so BART’s strong performance here likely contributed to the relatively strong customer satisfaction ratings this year.

2020 BART CUSTOMER SATISFACTION STUDY
16 BART Marketing and Research Department
The lowest rated attribute, “Addressing homelessness on the BART system,” was also the lowest-rated attribute in 2018. Among those who provided comments about this issue, many also mentioned issues of cleanliness, drug use, fare evasion, personal security, and some riders who appeared to be homeless not wearing face coverings. While most commenters felt that the number of homeless riders on BART was an issue, specifically those causing disturbances, some noted that they did not want to see aggressive means being used to address homelessness. As this attribute is also a “target issue,” it is discussed further in the Quadrant Analysis section of this report. With regard to enforcement against fare evasion, BART began testing a new style of fare gate at the Richmond station in June 2020. These fare gates use swing style barriers that discourage users from pushing through, jumping over, or maneuvering under the gates. While the estimated $90 million project to replace fare gates system wide is not yet fully funded, it is expected to greatly reduce fare evasion once implemented. Regarding “Presence of BART Police,” among those who provided open-ended comments, most wanted to see increased police presence / security on BART, specifically onboard trains and especially at night. The specific issues that commenters mentioned were crime and disturbances on BART, specifically in the evening, homelessness, fare evasion, and drug use.
Starting in late March 2021, the BART Police Department will be adding officers dedicated to patrolling trains during swing shift (late morning through evening). This swing shift “Train Team” consisting of four officers and a sergeant will join the existing early dayshift team (nine officers and a sergeant) in increasing police presence on trains, along with the Critical Asset Protection (CAP) team officers, Fare Inspection Officers (FIOs), Community Service Officers (CSOs), and Ambassadors. For issues that don’t necessarily require a sworn officer, such as addressing homelessness on BART, the BART Police Department has launched a new Bureau, the Progressive Policing and Community Engagement Bureau. The BART Police Department is currently in the process of hiring 20 Crisis Intervention Specialists, who will focus on connecting those experiencing homelessness, mental illness and substance abuse with services. Riders are also now able to report non-emergency situations to the BART Police Department via text message. The text line was launched in August 2020 to provide riders with another discreet means of notifying Police of an issue, in addition to the BART Watch app.
Comparison vs. prior survey Compared to attribute ratings in 2018, almost every attribute was rated higher in 2020. The two notable

2020 BART CUSTOMER SATISFACTION STUDY
BART Marketing and Research Department 17
exceptions were “Hours of operation” and “Frequency of train service.” The average rating for “Hours of operation” declined from 5.15 in 2018 to 4.82, and the average rating for “Frequency of train service” declined from 4.96 to 4.69. These declines are not surprising given the service changes that BART implemented due to the pandemic. In late March 2020, BART changed its weekday hours to 5 am – 9 pm and its weekend hours to 8 am – 9 pm. (Previously, weekday hours were 5 am to midnight, Saturday hours were 6 am to midnight, and Sunday hours were 8 am to midnight.) Weekday service frequency changed to approximately every 30 minutes in April 2020, instead of approximately every 15 minutes. (Note however that some trains were added during peak hours to provide 15-minute service during the busiest times.) Weekend service frequency also changed to approximately every 30 minutes in September. (It had been every 20 minutes on Saturdays and every 24 minutes on Sundays). These changes were necessary due to reduced demand due to the pandemic. For a chart showing the percentage results, please see Appendix C.

2020 BART CUSTOMER SATISFACTION STUDY
18 BART Marketing and Research Department
2020 RATINGS OF SPECIFIC SERVICE ATTRIBUTES Average (Mean) Rating (7-point scale)
Notes: • Given the relatively large sample sizes, mean ratings are generally accurate to within ±0.09 at a 95% confidence level. • The average rating on this survey was 4.67 (between “Frequency of train service” and “Elevator availability and reliability.”)
5.50
5.31
5.30
5.28
5.20
5.02
4.99
4.94
4.87
4.82
4.70
4.69
4.61
4.53
4.52
4.29
4.28
4.20
4.17
3.99
3.95
3.61
On-time performance of trains
bart.gov website
Access for people with disabilities
BART (official) mobile app*
Timely information about service disruptions
Ability to social distance (stay 3-6 feet away from others) on BART system*
Comfortable temperature aboard trains
BART's COVID-related response efforts*
Compliance with face covering policy on the BART system*
Hours of operation
Escalator availability and reliability
Frequency of train service
Elevator availability and reliability
Clarity of public address announcements
Availability of Station Agents
Noise level on trains
Station cleanliness
Train interior cleanliness
Personal security in the BART system
Presence of BART Police
Enforcement against fare evasion
Addressing homelessness on the BART system
*Indicates a new attribute on the 2020 questionnaire

2020 BART CUSTOMER SATISFACTION STUDY
BART Marketing and Research Department 19
QUADRANT ANALYSIS
The chart below is designed to help set priorities for future initiatives to improve customer satisfaction. This chart shows each attribute’s “derived importance” to BART customers, as well as its average rating on a 1 to 7 scale, where 1 = Poor and 7 = Excellent.
Average ratings are shown on the horizontal axis. Attributes on the left side received lower ratings, while attributes on the right side received higher ratings. Derived importance is shown on the vertical axis. Derived importance is based on how strongly each attribute is correlated with overall satisfaction. Attributes in the top half of the chart are deemed to be more important than attributes in the bottom half of the chart. For a more detailed explanation about how this chart was developed, please refer to Appendix D. Target Issues Quadrant The "Target Issues" quadrant identifies those service attributes which appear to be most important, but which receive relatively low ratings from BART riders.
2020 Quadrant Chart

2020 BART CUSTOMER SATISFACTION STUDY
20 BART Marketing and Research Department
In 2020, these target issues are: • Train interior cleanliness • Personal security in the BART system • Station cleanliness • Addressing homelessness on the BART system • Availability of Station Agents • Elevator availability and reliability
Five of these six attributes also appeared within the 2018 Target Issues quadrant. “Availability of Station Agents” moved into Target Issues this year due to a slight increase in derived importance. (In the 2018 quadrant chart, it was on the border with an average importance score.) One factor that could have contributed to the movement of this attribute is that Station Agents have been directed to stay in their booths with the door closed due to the pandemic. If they must leave their booths, they need to maintain social distancing. These new safety-related procedures may have had an impact on ratings. Other changes include: “Train temperature” moved out of the Target Issues quadrant due to an increase in ratings and a decrease in derived importance. “Escalator availability and reliability” moved out of Target Issues due to an increase in ratings and a slight decrease in derived importance. Factors impacting the movement of “Train temperature” could include the lack of crowding on most current trains. (Packed, standing-room only trains contributed to uncomfortable onboard temperatures in the past.) Another factor could be the increased usage of Fleet of the Future trains on the system, which have better cooling systems. (In the 2020 survey, approximately 29% of completed surveys were distributed on Fleet of the Future cars; this compares to approximately 1% of surveys in 2018, when only one ten-car Fleet of the Future train was running on the system.) With regard to escalators, BART’s internal metrics show that escalator reliability improved as compared to the survey period two years ago. Those issues deepest in the “Target Issues” quadrant (rated lowest and/or of highest importance) concern cleanliness (particularly train cleanliness), personal security and addressing homelessness. If BART is able to invest in initiatives to make a noticeable impact in these areas, it is likely that customer satisfaction will improve. With regard to train interior cleanliness, riders commented on dirty and/or damaged seats, specifically on legacy cars, as well as food and trash left on trains. Some expressed a desire for trains to be cleaned more frequently throughout the day, with a few noting that they expected cleaner trains due to the

2020 BART CUSTOMER SATISFACTION STUDY
BART Marketing and Research Department 21
pandemic. The comments about station cleanliness were typically more general, with a few noting that cleanliness varied by station, calling out specific stations they felt needed more attention (such as downtown San Francisco stations). Ratings of these cleanliness attributes were likely impacted by changes to cleaning protocols necessitated by the COVID-19 pandemic. Many employees responsible for cleaning trains and stations have been redeployed to duties focusing on disinfection. Twenty-seven percent of active “Utility Workers” (responsible for cleaning trains, performing preventive maintenance on train cars in shops, and maintaining shops and transportation facilities) were re-deployed to COVID-related cleaning, such as nightly disinfecting of the fleet, end-of-line disinfecting of high touchpoints on train cars, and deep cleaning of facilities with positive COVID cases. While these changes were necessary due to the pandemic, there are currently fewer staff available to pick up food and garbage left on trains at ends of lines and to respond to biohazard issues while the trains are in service. Similarly, duties for many “System Service Workers” (responsible for cleaning stations and employee facilities) have changed to emphasize disinfection. Twelve of 127 active System Service Workers were pulled from their normal duties to form a new team tasked with disinfecting high touchpoints at high volume stations. Overall, a substantial amount of resources has been redirected from standard station cleaning / trash removal duties to disinfection. For example, 25% of all System Service Worker hours are currently spent on disinfection. Increasing train and station cleaning, while maintaining current disinfecting protocols, would require a substantial increase in funding. Comments about personal security referenced the need for more police, the presence of homeless riders, individuals not wearing masks, fare evasion, drug use / smoking on BART, and disruptive passengers. Some specifically mentioned that riding BART at night was a concern. Looking at data from the BART Police Department from 2020, the most common type of call was for “well-being and medical assistance.” This supports the Police Department’s recent initiative to launch its Progressive Policing and Community Engagement Bureau, which includes “non-sworn” unarmed personnel, such as the Transit Ambassadors. The Transit Ambassador program, consisting of 10 unarmed, uniformed personnel trained in de-escalation, was launched as a pilot program in February 2020 and made permanent in October. By summer 2021, BART Police plans to hire 20 Crisis Intervention Specialists to join the Bureau. These employees, who will be trained to handle mental health emergencies and homeless outreach, will serve as case managers, communicating with county and non-profit agencies as needed. BART will also be deploying additional officers dedicated to patrolling trains during swing shift (late

2020 BART CUSTOMER SATISFACTION STUDY
22 BART Marketing and Research Department
morning through evening), starting in late March. (This is in addition to the “Train Teams” currently working earlier hours.) With regard to addressing homelessness, this is an incredibly complex issue that requires a coordinated regional response. While the issue is not unique to BART, it has a big impact on the system, so BART has devoted resources to addressing it in conjunction with regional partners. BART has already developed successful outreach programs in partnership with San Francisco and Contra Costa County, and has recently created a new position to implement a homeless action plan for BART. In San Francisco, BART partnered with the San Francisco Municipal Transportation Agency (SFMTA) and San Francisco’s Department of Homelessness to fund two full-time Homelessness Outreach Team employees focusing on specific San Francisco stations in 2017. Recent data show that from March to November 2020, the team had a high success rate in connecting homeless individuals with services. Out of 2,809 outreach attempts, 2,345 resulted in the acceptance of services. (Note that this partnership was recently paused due to financial constraints, but can be re-instated when new external sources of funding are available.) BART partnered with Contra Costa County in 2019 on a similar program where two full-time employees are tasked with connecting unhoused individuals on BART property with available services in that county. These two programs could serve as models for potential future partnerships with other counties in the service area. In 2020, BART joined the newly formed Regional Impact Council (RIC), which consists of leaders across various Bay Area sectors, to develop coordinated strategies to address the unsheltered homeless crisis. This group has a goal of working to house 75% of the Bay Area’s unsheltered homeless by 2024. BART has also created a new position, “Senior Manager of Social Services Partnerships” to implement a Strategic Homeless Action Plan for BART. The plan will involve public/private partnerships, advocacy at all levels of government, and collecting and tracking key metrics to evaluate the success of the plan. Additionally, addressing homelessness will be a primary focus of the new Crisis Intervention Specialists (part of the BART Police Department’s Progressive Policing and Community Engagement Bureau, as mentioned above). Upper Right-hand Quadrant Next, moving to a different section of the quadrant chart, the upper right-hand side contains those attributes that are both very important to customer satisfaction and highly rated. It is noteworthy that the new COVID-related attributes, BART’s COVID-related response efforts, ability to social distance on the BART system, and face-covering compliance, are all in this quadrant. Additionally, the high ratings for on-time performance likely contributed to the relatively strong ratings for overall satisfaction this year. For reference, the 2018 Quadrant Chart is shown in Appendix F.

2020 BART CUSTOMER SATISFACTION STUDY
BART Marketing and Research Department 23
BART CUSTOMER ETHNICITY COMPARED TO REGIONAL DATA Compared to regional data, current BART riders are more likely to identify as African American, and less likely to identify as White or Asian/Pacific Islander. In aggregate, BART riders who identify as non-white comprise 75% of current riders, as compared to 63% of four-county residents and 65% of five-county residents.
Sources: • U.S. Census Bureau, 2019 American Community Survey 1-Year Estimates: Table B03002 “Hispanic or Latino Origin by Race.” • BART 2020 Customer Satisfaction Survey Notes: 1) The categories shown in this table classify respondents based on single vs. two-plus race and Hispanic vs. non-Hispanic. The categories “White,”
“African American,” “Asian/Pacific Islander,” and “American Indian/Alaska Native” only include respondents who reported a single race and are non-Hispanic. All two-plus race, non-Hispanic responses are included within “Other.” All Hispanic responses are included within Hispanic, regardless of race.
2) The four-county total includes Alameda, Contra Costa, San Francisco, and San Mateo counties. The five-county total adds Santa Clara County. 3) The BART data distribution is based on 2,852 unweighted responses and excludes 4% non-response. 4) Totals may not add to 100% due to rounding.
37%
22%
7%
29%
<1%
5%
35%
23%
6%
31%
<1%
4%
25% 25%
21% 21%
1%
7%
White, non-Hispanic Hispanic (any race) African American,non-Hispanic
Asian/Pac. Islander,non-Hispanic
American Indian,non-Hispanic
Other or Mult. race,non-Hispanic
Bay Area: 4-county residents
Bay Area: 5-county residents
BART Customers (2020 Customer Satisfaction Survey)

2020 BART CUSTOMER SATISFACTION STUDY
24 BART Marketing and Research Department
Questionnaires in: English Spanish Chinese
Appendix A: QUESTIONNAIRE

2020 BART CUSTOMER SATISFACTION STUDY
BART Marketing and Research Department 25

2020 BART CUSTOMER SATISFACTION STUDY
26 BART Marketing and Research Department

2020 BART CUSTOMER SATISFACTION STUDY
BART Marketing and Research Department 27

2020 BART CUSTOMER SATISFACTION STUDY
28 BART Marketing and Research Department

2020 BART CUSTOMER SATISFACTION STUDY
BART Marketing and Research Department 29

2020 BART CUSTOMER SATISFACTION STUDY
30 BART Marketing and Research Department

2020 BART CUSTOMER SATISFACTION STUDY
BART Marketing and Research Department 31
Notes: • Percentages are weighted, while bases are unweighted unless otherwise noted. • Missing responses and multiple responses have been excluded from percentages. Note that this is
different from past years’ reports, where missing/multiple responses were included in the totals. • Columns may not add to 100% due to rounding.
Appendix B: COMPLETE TABULATIONS

2020 BART CUSTOMER SATISFACTION STUDY
32 BART Marketing and Research Department
TIME BOARDED TRAIN
The following time distribution includes both weekday and weekend survey periods and is based on the respondents’ self-reported responses to the question. (Open-ended responses were categorized into the time periods shown below.)
Base 2,780
Before 7 am 5%
7:00 am – 8:59 am 18%
9:00 am – 9:59 am 6%
10:00 am – 3:29 pm 39%
3:30 pm – 4:59 pm 14%
5:00 pm – 6:59 pm 15%
7 pm or later 2%
Total 100%
2. About what time did you get on this train?

2020 BART CUSTOMER SATISFACTION STUDY
BART Marketing and Research Department 33
BART STATION ENTERED AND EXITED
The following table shows BART stations entered by survey participants and BART stations at which they planned to exit (self-reported).
Entry Station Exit Station
Base 2,882 2,760
EAST BAY 63% 59%
12th St / Oakland City Center 3% 4%
19th St / Oakland 2% 3%
Antioch 2% 1%
Ashby 1% 1%
Bay Fair 3% 2%
Berryessa / North San José 1% 1%
Castro Valley 1% 1%
Coliseum 3% 2%
Concord 3% 1%
Downtown Berkeley 3% 3%
Dublin / Pleasanton 2% 2%
El Cerrito del Norte 4% 3%
El Cerrito Plaza 2% 1%
Fremont 1% 2%
Fruitvale 4% 3%
Hayward 2% 2%
Lafayette 1% 1%
Lake Merritt 2% 3%
MacArthur 3% 3%
Milpitas <1% <1%
North Berkeley 1% 1%
North Concord / Martinez 1% <1%
Oakland International Airport <1% <1%
Orinda 1% <1%
Pittsburg / Bay Point 2% 1%
Pittsburg Center <1% <1%
Pleasant Hill / Contra Costa Centre 1% 1%
Richmond 3% 3%
1. Which BART station did you enter before boarding this train? 3. At which BART station will you exit the system?

2020 BART CUSTOMER SATISFACTION STUDY
34 BART Marketing and Research Department
Entry Station Exit Station
EAST BAY (cont.)
Rockridge 1% 1%
San Leandro 2% 4%
South Hayward 1% 1%
Union City 2% 2%
Walnut Creek 1% 1%
Warm Springs / South Fremont 1% 1%
West Dublin / Pleasanton <1% <1%
West Oakland 2% 2%
El Cerrito (unspecified) 1% <1%
Oakland (unspecified) <1% <1%
Pittsburg (unspecified) 1% <1%
WEST BAY 37% 41%
16th St Mission 3% 3%
24th St Mission 3% 2%
Balboa Park 3% 2%
Civic Center / UN Plaza 6% 6%
Colma 1% 1%
Daly City 2% 2%
Embarcadero 4% 7%
Glen Park 1% 1%
Millbrae 1% <1%
Montgomery St 4% 6%
Powell St 7% 8%
San Bruno 1% <1%
San Francisco International Airport 1% 2%
South San Francisco 1% <1%
San Francisco (unspecified) <1% <1%
Airport (unspecified) <1% 0%
Total 100% 100%

2020 BART CUSTOMER SATISFACTION STUDY
BART Marketing and Research Department 35
TRIP PURPOSE
Overall, 64% of BART riders are commuting to or from work. During the weekday peak period, most (79%) are commuting. On weekends, the most common trip purposes are commuting to/from work (35%), visiting friends / family (30%), and shopping (16%). In comparing overall trip purposes vs. the 2018 survey, commuting decreased slightly from 70% to 64%, while visiting friends / family increased from 7% to 13%. Shopping and Medical / Dental also increased (from 2% to 6% and from 1% to 4%, respectively). One factor in these changes may be that current riders are less likely to have a car (see page 50), resulting in a higher percentage of non-work trips taken on BART than in the past. On weekends, the percentages commuting, visiting friends / family, and shopping were all higher than in 2018.* This is likely due to the pandemic-related closures of many leisure activities that were common BART weekend destinations in the past (e.g., theater, sports events, public events, etc.).
Total
Weekday Peak
Weekday Off-peak
Weekday Subtotal
Weekend
Base 2,776 931 1,145 2,076 700
Commute to / from work 64% 79% 60% 70% 35%
Visit friends / family 13% 9% 11% 10% 30%
Shopping 6% 3% 6% 4% 16%
Medical / dental 4% 2% 7% 4% 3%
Airplane trip 2% 2% 3% 3% 2%
Personal business 2% 1% 3% 2% 1%
School 2% 2% 2% 2% 1%
Restaurant 1% <1% 1% 1% 3%
Fitness / recreation 1% <1% 1% 1% 2%
Other 5% 3% 6% 4% 7%
Total 100% 100% 100% 100% 100%
*Weekend comparison from 2018: Commuting: 24%; Visiting friends / family: 24%; Shopping: 8%
4. What is the primary purpose of this trip? (Check only one.)

2020 BART CUSTOMER SATISFACTION STUDY
36 BART Marketing and Research Department
OTHER OPTIONS
If BART service were not available, nearly one in four (23%) would not make the trip. While this question was not asked in 2018, a similar question was asked in 2016. In 2016, 15% reported they wouldn’t have made the trip if BART were not available.
Total
Weekday Peak
Weekday Off-peak
Weekday Subtotal
Weekend
Base 2,922 957 1,201 2,158 764
Bus or other transit 30% 28% 32% 30% 29%
Drive alone and park 26% 32% 23% 28% 16%
Would not make this trip 23% 20% 24% 22% 30%
Uber, Lyft or taxi 21% 18% 21% 20% 25%
Carpool / drive with others 8% 10% 5% 8% 9%
Get dropped off 7% 8% 7% 7% 8%
Bicycle 3% 3% 3% 3% 4%
Other 1% 1% 1% 1% 2%
Multiple responses accepted; will not add to 100%.
5. If BART service were not available, how would you make this trip?

2020 BART CUSTOMER SATISFACTION STUDY
BART Marketing and Research Department 37
SOCIAL DISTANCING
Overall, 79% reported that they were able to social distance for their whole BART ride. This percentage dropped slightly to 73% among weekday peak riders.
Note that those who were able to social distance for the whole ride were more likely to be satisfied with BART that those who were not able to do so (refer to page 42).
Total
Weekday Peak
Weekday Off-peak
Weekday Subtotal
Weekend
Base 2,919 957 1,201 2,158 761
Yes – for this whole BART ride 79% 73% 84% 78% 84%
Yes, but only for part of this BART ride 16% 21% 13% 17% 12%
No 4% 6% 3% 4% 4%
Total 100% 100% 100% 100% 100%
6. Are you able to socially-distance (stay 3 to 6 feet away from other passengers) onboard this BART car?

2020 BART CUSTOMER SATISFACTION STUDY
38 BART Marketing and Research Department
HOW TRAVELED BETWEEN HOME AND BART
• 45% of respondents walked, biked, or used a scooter to travel from home to BART. • 34% used an auto-based mode (drove/carpooled, got dropped off, Uber/Lyft, or taxi). • 20% took a bus or other transit to BART. Weekday peak riders were more likely to drive alone and less likely to walk, as compared to weekday off-peak and weekend riders. Compared to 2018 data overall, there have been large shifts in access modes. Higher percentages are currently walking (up six percentage points from 32%) or taking transit (up seven percentage points from 13%), while lower percentages are driving alone (down 13 percentage points from 29%). This is likely due to the fact that current riders are less likely to have a car (see page 50). [Note that percentage point changes cited in this paragraph are rounded.]
Total
Weekday Peak
Weekday Off-peak
Weekday Subtotal
Weekend
Base 2,930 963 1,204 2,167 763
Walked all the way 37% 33% 41% 37% 41%
Bus / transit 20% 21% 19% 20% 20%
Drove alone 17% 21% 15% 18% 9%
Got dropped off 10% 12% 9% 10% 9%
Bicycled 7% 7% 7% 7% 7%
Uber or Lyft 4% 2% 6% 4% 6%
Carpooled 2% 3% 2% 2% 3%
Scooter / e-scooter / skateboard 1% 1% 1% 1% 1%
Taxi <1% <1% <1% <1% 1%
Other 1% 1% 1% 1% 2%
Total 100% 100% 100% 100% 100%
7a. How did you travel between home and BART today?

2020 BART CUSTOMER SATISFACTION STUDY
BART Marketing and Research Department 39
WHERE PARKED / FEE
• Among those who drove or carpooled to BART, most parked in BART parking; the daily fee was the most common type of parking fee paid.
Where parked
Total
Weekday Peak
Weekday Off-peak
Weekday Subtotal
Weekend
Base (Drove or carpooled to BART) 493 212 186 398 95
BART parking 77% 79% 70% 76% 85%
Other parking 23% 21% 30% 24% 15%
Total 100% 100% 100% 100% 100%
Parking fee paid
Total
Weekday Peak
Weekday Off-peak
Weekday Subtotal
Weekend
Base (Parked in BART parking) 346 150 124 274 72
None / free 21% 11% 13% 12% 86%
Daily fee 73% 82% 79% 81% 12%
Monthly permit 5% 6% 4% 5% 0%
Other 2% 1% 4% 2% 2%
Total 100% 100% 100% 100% 100%
7b. (If drove alone or carpooled) Where did you park today? 7c. (If BART parking) What fee, if any, did you pay to park?

2020 BART CUSTOMER SATISFACTION STUDY
40 BART Marketing and Research Department
CLIPPER USE
• Most riders (94%) used Clipper to pay for their BART trip. Similar usage rates were reported across peak, off-peak and weekend time periods.
Total
Weekday Peak
Weekday Off-peak
Weekday Subtotal
Weekend
Base 2,915 961 1,195 2,156 759
Yes 94% 96% 93% 94% 94%
No 6% 4% 7% 6% 6%
Total 100% 100% 100% 100% 100%
FARE PAID
• About three-fourths of all riders pay the regular fare. • Usage of the High Value Discount fare is slightly higher among peak riders.
Total
Weekday Peak
Weekday Off-peak
Weekday Subtotal
Weekend
Base 2,886 947 1,185 2,132 754
Regular BART fare 76% 75% 77% 76% 75%
Senior discount 6% 5% 8% 7% 5%
High Value Discount ($48 or $64 value) 6% 8% 5% 7% 5%
Disabled discount 4% 4% 4% 4% 5%
Muni Fast Pass 1% 1% 1% 1% <1%
Youth discount <1% <1% <1% <1% 2%
Other discount* 6% 6% 6% 6% 8%
Total 100% 100% 100% 100% 100%
*Note that Clipper Start (for eligible low-income riders) is included within “Other discount” as there appeared to be some confusion among some who had chosen this response (who may have equated it with a regular Clipper card).
8. Did you use a Clipper card to pay for this BART ride?
9. What type of fare did you pay for this BART ride? (Check one.)

2020 BART CUSTOMER SATISFACTION STUDY
BART Marketing and Research Department 41
OVERALL SATISFACTION WITH BART
• Overall, 72% are very or somewhat satisfied with BART. This is 16 percentage points higher than 2018, when 56% were satisfied with BART. • Weekday peak riders are less likely to be “very satisfied.”
Total
Weekday Peak
Weekday Off-peak
Weekday Subtotal
Weekend
Base 2,959 972 1,215 2,187 772
Very satisfied 39% 34% 42% 38% 44%
Somewhat satisfied 34% 37% 32% 35% 29%
Very or somewhat satisfied 72% 71% 73% 72% 73%
Neutral 18% 19% 17% 18% 19%
Somewhat dissatisfied 7% 7% 7% 7% 5%
Very dissatisfied 3% 3% 2% 3% 3%
Very or somewhat dissatisfied 9% 10% 10% 10% 8%
Total 100% 100% 100% 100% 100%
Mean (5-point scale) 3.99 3.92 4.04 3.97 4.06
10. Overall, how satisfied are you with the services provided by BART?

2020 BART CUSTOMER SATISFACTION STUDY
42 BART Marketing and Research Department
OVERALL SATISFACTION WITH BART (continued)
Read % across
Base Satisfied Neutral Dissatisfied MEAN GROUP # % % % (5 point scale)
By Frequency of Riding BART
5+ days a week 1,224 68% 20% 12% 3.87
1 – 4 days a week 919 74% 17% 8% 4.01
1 – 3 days a month 399 77% 16% 6% 4.12
Less than once a month 338 79% 16% 6% 4.21
By How Long Riding BART
6 months or less 234 83% 14% 3% 4.32
6 months – one year 93 75% 22% 4% 4.07
One – two years 349 75% 18% 8% 4.02
Three – five years 464 71% 18% 11% 3.93
More than five years 1,794 71% 19% 10% 3.96
By Ability to Social Distance
Whole BART ride 2,345 77% 16% 6% 4.13
Part of BART ride 446 59% 24% 17% 3.56
Not able to social distance 122 37% 29% 34% 3.08
By Trip Purpose
Commuting to work 1,661 70% 19% 11% 3.90
Visiting friends / family 418 80% 13% 7% 4.16
Shopping 206 79% 16% 5% 4.24
Medical / dental 115 80% 9% 11% 4.20
Other 367 76% 18% 7% 4.14
By Age
13 – 24 455 69% 26% 6% 3.96
25 – 34 795 70% 19% 12% 3.91
35 – 44 524 70% 19% 11% 3.90
45 – 54 417 73% 19% 9% 4.03
55 – 64 440 76% 15% 9% 4.08
65+ 229 84% 8% 7% 4.25
By Race/Ethnicity
White 709 81% 11% 8% 4.15
Hispanic 718 73% 17% 10% 4.01
African-American 611 67% 23% 10% 3.90
Asian / Pacific Islander 567 72% 21% 7% 4.01
Other, including multiple race 240 61% 24% 15% 3.70

2020 BART CUSTOMER SATISFACTION STUDY
BART Marketing and Research Department 43
OVERALL SATISFACTION WITH BART (continued)
Read % across
Base Satisfied Neutral Dissatisfied MEAN GROUP # % % % (5 point scale)
By Gender
Male 1,559 74% 18% 9% 4.03
Female 1,203 71% 18% 10% 3.94
By Vehicle Ownership
Have a car / motorcycle 1,319 71% 19% 10% 3.95
Don’t have a car / motorcycle 1,577 73% 18% 9% 4.02
By Household Income
Under $25,000 570 76% 16% 8% 4.14
$25,000- $49,999 737 72% 19% 9% 3.98
$50,000 - $74,999 459 68% 20% 11% 3.86
$75,000 - $99,999 240 71% 18% 11% 3.90
$100,000 - $149,999 240 77% 14% 8% 4.03
$150,000 - $199,999 134 72% 20% 8% 3.91
$200,000 or more 115 79% 10% 10% 4.12
By Access Mode
Walked all the way 1,123 74% 18% 8% 4.05
Bicycled 195 73% 15% 12% 3.92
Bus / transit 579 73% 19% 8% 4.05
Drove alone 453 70% 17% 13% 3.86
Carpooled 73 68% 21% 11% 3.92
Got dropped off 283 70% 18% 12% 3.90
Uber or Lyft 137 73% 21% 7% 4.05
By Type of Fare Paid
Regular BART fare 2,201 73% 18% 10% 3.99
High Value Discount 166 71% 19% 10% 3.85
Senior discount 179 82% 8% 9% 4.19
Disabled discount 116 71% 17% 12% 3.91
Other 217 62% 32% 6% 3.88

2020 BART CUSTOMER SATISFACTION STUDY
44 BART Marketing and Research Department
OVERALL SATISFACTION WITH BART (continued)
Read % across
Base Satisfied Neutral Dissatisfied MEAN
GROUP # % % % (5 point scale)
By County of Residence*
Alameda 1,031 74% 17% 10% 3.99
Contra Costa 590 67% 20% 13% 3.83
San Francisco 404 78% 15% 7% 4.10
San Mateo 112 68% 24% 8% 3.89
Other 238 76% 18% 6% 4.09
By Type of Car Surveyed On**
Legacy 2,090 71% 20% 10% 3.96
Fleet of the Future 864 77% 15% 9% 4.06
*Based on home ZIP code provided ** Note that those surveyed on Fleet of the Future cars were less likely to have been surveyed during weekday peak hours, and more likely to have been surveyed during weekday off-peak hours, as compared to those surveyed on Legacy cars. This could have also impacted the differences in satisfaction ratings between these two groups.

2020 BART CUSTOMER SATISFACTION STUDY
BART Marketing and Research Department 45
WILLINGNESS TO RECOMMEND BART
• Eighty-one percent would definitely or probably recommend using BART to a friend or out-of-town guest. This is up eight percentage points from 2018 when 74% said they’d recommend BART. (Note the percentage point gain is impacted by rounding.)
Total
Weekday Peak
Weekday Off-peak
Weekday Subtotal
Weekend
Base 2,952 969 1,210 2,179 773
Definitely 53% 49% 54% 51% 59%
Probably 29% 30% 29% 29% 26%
Definitely or Probably 81% 79% 83% 81% 84%
Might or might not 13% 15% 12% 13% 10%
Probably not 4% 5% 3% 4% 3%
Definitely not 2% 2% 2% 2% 2%
Probably Not or Definitely Not 6% 7% 5% 6% 5%
Total 100% 100% 100% 100% 100%
Mean (5-point scale) 4.26 4.18 4.31 4.24 4.37
11. Would you recommend using BART to a friend or out-of-town guest?

2020 BART CUSTOMER SATISFACTION STUDY
46 BART Marketing and Research Department
VALUE
• About two out of three riders (66%) agree with the statement: “BART is a good value for the money.” This is up 11 percentage points from 55% in 2018.
Total Weekday
Peak Weekday Off-peak
Weekday Subtotal Weekend
Base 2,920 963 1,192 2,155 765
Agree Strongly 35% 32% 38% 35% 38%
Agree Somewhat 31% 31% 32% 31% 29%
Agree Strongly or Somewhat 66% 63% 70% 66% 67%
Neutral 20% 21% 18% 20% 20%
Disagree Somewhat 9% 10% 8% 9% 9%
Disagree Strongly 5% 6% 4% 5% 5%
Disagree Somewhat or Strongly 14% 16% 12% 14% 13%
Total 100% 100% 100% 100% 100%
Mean 3.83 3.73 3.92 3.82 3.86
12. To what extent do you agree with the following statement: ”BART is a good value for the money?”

2020 BART CUSTOMER SATISFACTION STUDY
BART Marketing and Research Department 47
LENGTH OF TIME A BART CUSTOMER
• About six out of ten (61%) have been riding BART for more than five years. This is up nine percentage points from 2018, when 53% had been riding for more than five years. (Note that the percentage point increase is impacted by rounding.)
• Only 11% of riders have been riding BART for less than one year.
Total Weekday
Peak Weekday Off-peak
Weekday Subtotal Weekend
Base 2,941 964 1,206 2,170 771
6 months or less 8% 7% 7% 7% 10%
More than 6 months, but less than 1 year 3% 4% 2% 3% 3%
1 – 2 years 12% 11% 12% 12% 13%
3 – 5 years 16% 18% 14% 16% 15%
More than 5 years 61% 59% 64% 62% 59%
Total 100% 100% 100% 100% 100%
13. About how long have you been riding BART?

2020 BART CUSTOMER SATISFACTION STUDY
48 BART Marketing and Research Department
FREQUENCY OF RIDING BART
• Prior to the pandemic, 59% of current riders had been riding at least five days per week. This has declined to 45% in October 2020 (-14 percentage points). • Note that in the 2018 survey, 59% of riders also reported riding at least five days per week.
Total Weekday
Peak Weekday Off-peak
Weekday Subtotal Weekend
Base 2,889 957 1,180 2,137 752
6 – 7 days / week 20% 19% 20% 20% 22%
5 days / week 39% 50% 34% 43% 21%
5+ days / week subtotal 59% 69% 55% 62% 43%
3 – 4 days / week 14% 12% 14% 13% 16%
1 – 2 days / week 9% 6% 11% 8% 13%
1 – 3 days / month 9% 6% 10% 8% 15%
Less than once / month 10% 8% 10% 9% 13%
Total 100% 100% 100% 100% 100%
Total Weekday
Peak Weekday Off-peak
Weekday Subtotal Weekend
Base 2,888 956 1,177 2,133 755
6 – 7 days / week 14% 14% 13% 14% 14%
5 days / week 32% 42% 27% 35% 15%
5+ days / week subtotal 45% 56% 40% 48% 29%
3 – 4 days / week 19% 20% 18% 19% 16%
1 – 2 days / week 13% 10% 15% 12% 16%
1 – 3 days / month 13% 8% 14% 11% 20%
Less than once / month 10% 6% 12% 9% 18%
Total 100% 100% 100% 100% 100%
14. Prior to the COVID-19 pandemic (before March 2020), how often did you ride BART? (Check one.)
15. How often do you currently ride BART? (Check one.)
Note that some of the 5+ days / week subtotals are impacted by rounding.
Note that some of the 5+ days / week subtotals are impacted by rounding.

2020 BART CUSTOMER SATISFACTION STUDY
BART Marketing and Research Department 49
GENDER
• Greater than half (55%) of riders are male. This is up from 49% in 2018.
Total Weekday
Peak Weekday Off-peak
Weekday Subtotal Weekend
Base 2,799 931 1,145 2,076 723
Male 55% 52% 58% 55% 56%
Female 44% 47% 41% 44% 42%
Another Gender 1% 1% 1% 1% 1%
Total 100% 100% 100% 100% 100%
AGE
• While nearly half (47%) of riders are ages 25 – 44, nearly one in four riders (24%) is age 55+. In 2018, 16% of riders were ages 55+.
Total Weekday
Peak Weekday Off-peak
Weekday Subtotal Weekend
Base 2,867 949 1,179 2,128 739
13 – 17 1% <1% 1% 1% 5%
18 – 24 13% 11% 14% 12% 18%
25 – 34 28% 31% 26% 28% 28%
35 – 44 19% 21% 18% 19% 17%
45 – 54 14% 14% 15% 14% 15%
55 – 64 16% 17% 16% 17% 12%
65+ 8% 7% 10% 8% 7%
Total 100% 100% 100% 100% 100%
16. Gender
17. Age

2020 BART CUSTOMER SATISFACTION STUDY
50 BART Marketing and Research Department
PERSONAL VEHICLE
• Greater than half of riders (53%) do not have a car or motorcycle. This is up substantially from 2018, when 31% reported not having a vehicle. • On weekends, about two out of three riders (66%) do not have a vehicle.
Total Weekday
Peak Weekday Off-peak
Weekday Subtotal Weekend
Base 2,903 960 1,188 2,148 755
Yes 47% 54% 46% 50% 34%
No 53% 46% 54% 50% 66%
Total 100% 100% 100% 100% 100%
SMART PHONE
• Most riders (94%) have a smart phone. This is similar to 2018, when 96% of riders reported having
smart phones.
Total Weekday
Peak Weekday Off-peak
Weekday Subtotal Weekend
Base 2,917 962 1,195 2,157 760
Yes 94% 94% 93% 94% 94%
No 6% 6% 7% 6% 6%
Total 100% 100% 100% 100% 100%
18. Do you have a car or motorcycle?
19. Do you have a smart phone (can access internet, use apps)?

2020 BART CUSTOMER SATISFACTION STUDY
BART Marketing and Research Department 51
ETHNIC IDENTIFICATION
• Three out of four riders (75%) identify as non-white. This is up 11 percentage points from 65% in the 2018 survey. (This percentage point change is impacted by rounding.) • The percentages identifying as White or Asian have decreased (each down 11 percentage points),
while those identifying as African American or Hispanic have increased (up 12 and eight percentage points, respectively).
Some context for these changes is provided by recent data from the Bay Area Council Economic Institute. These data showed that certain groups were less likely to have jobs that were eligible for remote work, including Hispanic/Latino workers, African American workers, and low-income workers.
Total Weekday
Peak Weekday Off-peak
Weekday Subtotal Weekend
Base 2,852 951 1,157 2,108 744
White alone, non-Hispanic 25% 24% 25% 25% 26%
Hispanic / Latino, any race 25% 24% 23% 24% 29%
African American alone, non-Hispanic 21% 21% 22% 22% 20%
Asian/Pac. Islander alone, non-Hispanic 21% 23% 20% 22% 15%
American Indian alone, non-Hispanic 1% 1% 2% 1% 2%
Other, non-Hispanic 2% 3% 2% 2% 3%
Multiple race, non-Hispanic 5% 4% 5% 4% 5%
Total 100% 100% 100% 100% 100%
Non-white subtotal 75% 76% 75% 75% 74%
Note: Reported races were categorized into single categories in order to be comparable to Census data shown on the next page. All those who reported being Hispanic, Latino, or of Spanish origin were categorized as Hispanic, regardless of number of races reported. All other multiple responses were categorized as Multiple Race.
20. What is your race or ethnic identification? (Check all that apply.)

2020 BART CUSTOMER SATISFACTION STUDY
52 BART Marketing and Research Department
BART CUSTOMER ETHNICITY COMPARED TO REGION
• In comparison to the region, current BART riders are less likely to be White or Asian/Pacific Islander, and more likely to be African American.
Race and Ethnicity BART Compared to Bay Area Counties in BART’s Service Area
ALAMEDA CONTRA COSTA
SAN FRANCISCO
SAN MATEO
SANTA CLARA
FOUR- COUNTY TOTAL
FIVE-COUNTY TOTAL
BART 2020 CUST. SAT.
SURVEY
Population
1,671,329
1,153,526
881,549
766,573
1,927,852 4,472,977 6,400,829 2,852
% % % % % % % % White (non-Hispanic) 30% 42% 40% 38% 30% 37% 35% 25%
Hispanic (any race) 22% 26% 15% 24% 25% 22% 23% 25% Black/African American (non-Hispanic) 10% 9% 5% 2% 2% 7% 6% 21% Asian/Pacific Islander (non-Hispanic) 32% 18% 35% 31% 38% 29% 31% 21% American Indian or Alaska Native (non-Hispanic) <1% <1% <1% <1% <1% <1% <1% 1% Other, including 2+ Races (non-Hispanic) 5% 5% 4% 4% 4% 5% 4% 7%
Total 100% 100% 100% 100% 100% 100% 100% 100%
Non-white subtotal 70% 58% 60% 62% 70% 63% 65% 75%
Sources: • U.S. Census Bureau, 2019 American Community Survey 1-Year Estimates: Table B03002 “Hispanic or Latino Origin by Race.” • BART 2020 Customer Satisfaction Survey Notes: 1) The categories shown in this table classify respondents based on single vs. two-plus race and Hispanic vs. non-Hispanic. The categories “White,”
“Black / African American,” “Asian/Pacific Islander,” and “American Indian/Alaska Native” only include respondents who reported a single race and are non-Hispanic. All two-plus race, non-Hispanic responses are included within “Other.” All Hispanic responses are included within Hispanic, regardless of race.
2) The four-county total includes Alameda, Contra Costa, San Francisco, and San Mateo counties. The five-county total adds Santa Clara County. 3) The BART data distribution is based on 2,852 unweighted responses and excludes 4% non-response. 4) Totals may not add to 100% due to rounding.
BART Customer Ethnicity Compared to Bay Area Counties in BART’s Service Area

2020 BART CUSTOMER SATISFACTION STUDY
BART Marketing and Research Department 53
INCOME
• Greater than half (51%) of riders have household incomes under $50,000 per year. This is up substantially from 26% in 2018. • On weekends, 58% of riders have household incomes under $50,000 per year. Some context for these changes is provided by recent data from the Bay Area Council Economic Institute. As mentioned in the “Ethnic Identification” section, these data showed that low-income workers were less likely to have jobs that were eligible for remote work.
Total Weekday
Peak Weekday Off-peak
Weekday Subtotal Weekend
Base 2,500 835 1,016 1,851 649
Under $25,000 21% 14% 27% 20% 28%
$25,000 – $34,999 14% 13% 13% 13% 17%
$35,000 – $49,999 15% 16% 16% 16% 13%
$50,000 – $59,999 9% 9% 8% 9% 8%
$60,000 – $74,999 10% 12% 9% 11% 9%
$75,000 – $99,999 10% 12% 8% 10% 9%
$100,000 – $149,999 10% 11% 9% 10% 9%
$150,000 – $199,999 6% 7% 5% 6% 5%
$200,000+ 5% 5% 5% 5% 4%
Total 100% 100% 100% 100% 100%
Income categorization based on both household income and household size*
Base 2,437 816 989 1,805 632
Low income 41% 34% 46% 39% 48%
Not low income 59% 66% 54% 61% 52%
Total 100% 100% 100% 100% 100%
*This categorization approximates 200% of the federal poverty level. In 2020, this threshold was $52,400 for a household size of four. Using survey income categories, the threshold of $50,000 was used for a household size of four.
21. What is your total annual household income before taxes?

2020 BART CUSTOMER SATISFACTION STUDY
54 BART Marketing and Research Department
NUMBER IN HOUSEHOLD
• 52% of riders live in one- or two-person households.
Total Weekday
Peak Weekday Off-peak
Weekday Subtotal Weekend
Base 2,589 864 1,053 1,917 672
1 23% 22% 23% 22% 26%
2 29% 31% 28% 30% 28%
3 19% 19% 19% 19% 19%
4 14% 16% 12% 15% 12%
5 8% 7% 10% 8% 9%
6+ 6% 6% 7% 6% 7%
Total 100% 100% 100% 100% 100%
22. Including yourself, how many people live in your household?

2020 BART CUSTOMER SATISFACTION STUDY
BART Marketing and Research Department 55
COUNTY OF RESIDENCE
Total Weekday
Peak Weekday Off-peak
Weekday Subtotal Weekend
Base 2,380 800 976 1,776 604
Alameda 43% 43% 43% 43% 45%
Contra Costa 26% 29% 26% 28% 17%
San Francisco 17% 15% 17% 16% 20%
San Mateo 5% 6% 4% 5% 5%
Solano 2% 3% 2% 3% 2%
Santa Clara 2% 1% 2% 1% 3%
San Joaquin 1% 1% 1% 1% 1%
Other 2% 2% 2% 2% 4%
Out of state / country 2% 1% 2% 2% 4%
Total 100% 100% 100% 100% 100%
*ZIP codes provided were matched with counties for this table.
23. What is your home ZIP code?*

2020 BART CUSTOMER SATISFACTION STUDY
56 BART Marketing and Research Department
RATING BART ON SPECIFIC ATTRIBUTES POOR EXCELLENT 1 2 3 4 5 6 7
Note: “7” is the highest rating a respondent can give and “1” is the lowest. Blank responses were eliminated when calculating the mean.
24. Please help BART improve service by rating each of the following attributes. “7” (excellent) is the highest rating, and “1” (poor) is the lowest rating. You also can use any number in between. Skip attributes that do not apply to you.

2020 BART CUSTOMER SATISFACTION STUDY
BART Marketing and Research Department 57
RATING BART ON SPECIFIC ATTRIBUTES Sorted in descending order on mean (Total) SCALE: 1 = Poor, 7 = Excellent
MEAN (1 – 7 scale)
Attribute
Base for
Total Total Weekday
Peak Weekday Off-peak
Weekday Subtotal Weekend
On-time performance of trains
2,695 5.50 5.45 5.54 5.49 5.56
bart.gov website
2,339 5.31 5.33 5.29 5.31 5.31
Access for people with disabilities
2,312 5.30 5.26 5.32 5.29 5.33
BART (official) mobile app
2,199 5.28 5.31 5.25 5.28 5.27
Timely information about service disruptions
2,437 5.20 5.15 5.21 5.18 5.29
Ability to social distance (stay 3 to 6 feet away from others) on the BART system
2,562 5.02 4.85 5.13 4.98 5.20
Comfortable temperature aboard trains
2,582 4.99 4.82 5.08 4.94 5.24
BART's COVID-related response efforts
2,429 4.94 4.81 5.01 4.90 5.10
Compliance with face covering policy on the BART system
2,515 4.87 4.78 4.92 4.84 5.01
Hours of operation
2,651 4.82 4.91 4.80 4.86 4.61
Escalator availability and reliability
2,525 4.70 4.57 4.77 4.66 4.90
Frequency of train service
2,608 4.69 4.66 4.68 4.67 4.78
Elevator availability and reliability
2,374 4.61 4.48 4.71 4.58 4.76
Clarity of public address announcements
2,558 4.53 4.41 4.60 4.50 4.73
Availability of Station Agents
2,570 4.52 4.46 4.53 4.49 4.65
Noise level on trains
2,583 4.29 4.16 4.32 4.24 4.57
Station cleanliness
2,650 4.28 4.15 4.36 4.25 4.44
Train interior cleanliness
2,636 4.20 3.99 4.32 4.14 4.53
Personal security in the BART system
2,497 4.17 4.04 4.26 4.14 4.36
Presence of BART Police
2,476 3.99 3.88 4.07 3.97 4.13
Enforcement against fare evasion
2,385 3.95 3.77 4.08 3.91 4.15
Addressing homelessness on the BART system
2,435 3.61 3.44 3.70 3.56 3.90

2020 BART CUSTOMER SATISFACTION STUDY
58 BART Marketing and Research Department
Appendix C: SERVICE ATTRIBUTE RATINGS -
PERCENTAGES

2020 BART CUSTOMER SATISFACTION STUDY
BART Marketing and Research Department 59
Service Attribute Ratings – Percentages Sorted in descending order on mean SCALE: 1 = Poor, 7 = Excellent
Attribute Base Mean Top Two Neutral Bottom
Two
On-time performance of trains
2,695 5.50 57% 39% 3%
bart.gov website
2,339 5.31 51% 45% 4%
Access for people with disabilities
2,312 5.30 54% 40% 6%
BART (official) mobile app
2,199 5.28 51% 44% 5%
Timely information about service disruptions
2,437 5.20 48% 46% 6%
Ability to social distance (stay 3 to 6 feet away from others) on the BART system
2,562 5.02 44% 48% 8%
Comfortable temperature aboard trains
2,582 4.99 43% 48% 9%
BART's COVID-related response efforts
2,429 4.94 43% 47% 10%
Compliance with face covering policy on the BART system
2,515 4.87 45% 42% 13%
Hours of operation
2,651 4.82 42% 45% 13%
Escalator availability and reliability
2,525 4.70 38% 49% 13%
Frequency of train service
2,608 4.69 35% 54% 11%
Elevator availability and reliability
2,374 4.61 35% 51% 14%
Clarity of public address announcements
2,558 4.53 36% 48% 17%
Availability of Station Agents
2,570 4.52 34% 51% 16%
Noise level on trains
2,583 4.29 28% 53% 18%
Station cleanliness
2,650 4.28 28% 52% 19%
Train interior cleanliness
2,636 4.20 27% 52% 21%
Personal security in the BART system
2,497 4.17 29% 49% 23%
Presence of BART Police
2,476 3.99 26% 48% 26%
Enforcement against fare evasion
2,385 3.95 29% 41% 30%
Addressing homelessness on the BART system
2,435 3.61 22% 43% 35%
Note: Ratings are based on a scale of 1 - 7. Top Two includes 6 or 7 ratings, Neutral includes 3, 4, or 5 ratings, and Bottom Two includes 1 or 2 ratings.

2020 BART CUSTOMER SATISFACTION STUDY
60 BART Marketing and Research Department
Appendix D: DESCRIPTION OF METHODOLOGY

2020 BART CUSTOMER SATISFACTION STUDY
BART Marketing and Research Department 61
DESCRIPTION OF METHODOLOGY
FIELD PROCEDURES A total of eight survey takers, managed by Q & A Research, worked on this project. Five of the eight survey takers were designated as supervisors. The survey training session was conducted outdoors near BART’s headquarters in Oakland on Monday, October 5, 2020. Including the two survey runs that were conducted immediately after training, surveying took place onboard trains from October 5 – 20, 2020. (Note that no surveying was conducted on Monday, October 12th due to the federal holiday.) Survey takers mostly worked in pairs, with only a few short portions of runs covered by just one person. (Note that in past surveys, one pair of survey takers covered one car. This year, due to low ridership, survey takers were almost always in different cars of the selected train for greater coverage.) Survey takers boarded pre-selected BART trains and distributed questionnaires to riders, starting on two random, pre-selected adjacent cars. Due to relatively low passenger loads, survey takers typically covered one to three cars each depending on the number of riders present. Survey takers rode most of their designated line continually collecting completed surveys and distributing surveys to new riders entering their cars. Origination/destination stations were generally:
• Yellow line: Concord and Glen Park • Orange line: El Cerrito Plaza and South Hayward • Red line: El Cerrito Plaza and Glen Park • Blue line: Castro Valley and Glen Park • Green line: South Hayward and Glen Park
Note that in past surveys, survey takers have generally remained on westbound trains until Balboa Park, Millbrae, or San Francisco International Airport. For this survey, however, a review of ridership patterns showed that surveying until Glen Park would sufficiently capture the majority of riders. Survey takers were provided with a survey packet for each run, consisting of a manilla envelope with printed surveys inside (in English, Spanish and Chinese) and a combined control/tally sheet adhered to the outside. Control sheets were pre-populated with control instructions (e.g., run number, departure time, boarding car, etc.), as well as the serial numbers of printed surveys assigned to that particular run. In cases where survey takers needed more printed surveys than were assigned to a packet, they pulled extras from a supplemental envelope and noted serial numbers on the control/tally sheet.

2020 BART CUSTOMER SATISFACTION STUDY
62 BART Marketing and Research Department
Survey takers carried clipboards with a flyer adhered to the back that described the survey and the incentive (a drawing to win one of four $100 gift cards) in English, Spanish and Chinese. It also contained a large scannable QR code at the bottom to provide riders with a contactless method of participation if desired (refer to image below). Interviewers also wore buttons that said "Customer Satisfaction Survey" in all three languages. QR Code Flyer

2020 BART CUSTOMER SATISFACTION STUDY
BART Marketing and Research Department 63
In past surveys, riders primarily completed the survey onboard, with a business-reply envelope offered in cases where the rider didn’t have enough time to complete it. In 2020, the following return options were offered:
• Complete paper questionnaire and return onboard • Complete paper questionnaire and return via mail (questionnaire could be folded into a postage-
paid mail piece; no envelope required) • Complete online by scanning QR code on paper questionnaire (questionnaire serial number
required) • Complete online by typing URL from paper questionnaire (questionnaire serial number required) • Complete online by scanning contactless QR code on clipboard (questionnaire serial number not
required) Survey takers offered questionnaires to everyone on their designated cars, except:
• Children who appeared to be under 13 years old; • Riders who were sleeping; • Riders who were not wearing a face covering.
They kept tallies of the above, plus refusals and those who exited the train before they could be approached, on their control/tally sheets. After each run, survey takers put all questionnaires from that run back in the envelope and sealed it closed. Q & A Project Managers collected these envelopes from interviewers regularly. Completed surveys were scanned and then shipped to Q & A Research's Kansas City office for data entry. After each batch was data-entered, 10% were randomly selected for visual verification - comparing the actual paper survey to the data record. A total of 280 surveys were verified in this manner. After adding in the mail-ins and online completes, and removing any surveys completed by children under 13 years old, a total of 2,969 questionnaires were considered sufficiently complete for analysis (at least half of front side completed, including at least one of the three key satisfaction questions answered). Unweighted counts by method of return and survey language are as follows:
Method of return
Unweighted
count Unweighted
%
Onboard 2,730 92.0%
Mailed back 126 4.2%
Completed online (questionnaire QR code)
105 3.5%
Completed online (questionnaire URL)
7 0.2%
Completed online (contactless flyer QR code)
1 <1%
Total 2,969 100.0%

2020 BART CUSTOMER SATISFACTION STUDY
64 BART Marketing and Research Department
Questionnaire language*
Unweighted
count Unweighted
%
English 2,848 95.9%
Spanish 101 3.4%
Chinese 14 0.5%
Unknown 6 0.2%
Total 2,969 100.0%
*Note that some English language questionnaires contained written comments in Spanish. For tallying purposes, these are included in the English count (language in which the survey was printed). A few online surveys that were considered only partially completed by the online survey program did not capture the survey language; these are shown in “Unknown.”
SAMPLING While the overall number of peak, off-peak and weekend runs was comparable to prior Customer Satisfaction surveys, the sampling strategy for selecting specific runs to survey differed. In the past, runs were selected based on how closely they matched the prior survey’s sampled runs. In this way, the survey sample was kept as similar as possible over time for tracking purposes. In 2020, schedule changes (reduced hours of operation and frequency) would have made it difficult to survey the same runs as 2018. Additionally, with lower ridership and concerns about potentially lower response rates, it was desirable to target some runs that were likely to have more riders for surveying. BART provided Q & A Research with the following guidelines for developing the survey schedule:
• Total number of runs to approximate the total surveyed in 2018 (96 weekday and 44 weekend). • Targeted weekday run split: approximately 40% peak and 60% off-peak (matching 2018).
o Definitions were the same as in the past, with peak defined as weekday trains dispatched between 5:30 am - 8:30 am and 3:30 pm - 6:30 pm. Off-peak included weekday trains dispatched all other times.
• Sampling by line should take into account the amount of service provided on that line. • Peak period runs that are likely to have a relatively high number of riders, as compared to other
peak runs, should be prioritized when possible. (These runs were identified based on passenger load data from September 2020.)
• Weekend runs selected should incorporate a variety of times of day.
Q & A Research used these guidelines to develop the sampling plan, which also took fieldwork scheduling and logistics into account.

2020 BART CUSTOMER SATISFACTION STUDY
BART Marketing and Research Department 65
The final plan resulted in surveying a total of 139 runs that broke out as follows:
Runs surveyed by day part
Weekday
Peak Weekday Off-
Peak Saturday Sunday Total
Number of runs surveyed 39 56 26 18 139
Runs surveyed by line color Yellow Orange Red Blue Green Total
Weekday runs 22 19 19 17 18 95
Saturday runs 6 6 5 5 4 26
Sunday runs 6 6 N/A 6 N/A 18
Total 34 31 24 28 22 139
WEIGHTING The data were weighted by daypart to proportionately represent BART trips. The dayparts used were weekday peak, weekday off-peak, Saturday, and Sunday. The chart below shows the actual number of unweighted questionnaires by daypart, as well as the weighted number of questionnaires by daypart. It also shows the estimated number of weekly BART trips during the survey time period, upon which the weights were based.
Weekday
Peak Weekday Off-peak
Saturday
Sunday
Weekly Total
Questionnaires received (unweighted) 974 1,218 540 237 2,969
Questionnaires weighted by daypart 1,300 1,177 288 205 2,969
Estimated # of BART trips*
138,912
125,732
30,736
21,871 317,251
Weighted % 43.8% 39.6% 9.7% 6.9% 100.0%
* Estimated number of BART trips taken from ridership averages from the following days during survey period: Monday, 10/19; Tuesday, 10/20; Wednesday, 10/14; Thursday, 10/8; Friday, 10/16; Saturday, 10/17; Sunday, 10/11.
RESPONSE RATE A total of 2,969 surveys were sufficiently complete for analysis. Based on survey takers’ tallies on the surveyed cars, an estimated 7,112 passengers were eligible to take the survey. (“Eligible” passengers includes everyone onboard the sampled car except: sleeping passengers, passengers who appeared to be under 13 years of age, and any passengers who were not wearing a face covering). Based on these tallies, the overall response rate for this survey is estimated at 42%.

2020 BART CUSTOMER SATISFACTION STUDY
66 BART Marketing and Research Department
QUADRANT CHART METHODOLOGY The quadrant chart is an important tool for helping BART to prioritize future initiatives to improve customer satisfaction. The "Target Issues" quadrant (top left) displays the most important service attributes in need of attention (those attributes that are likely to be most important to BART customers, but receive relatively low ratings).
Values along the horizontal axis are average ratings. Customers marked their ratings on a scale of 1 = poor to 7 = excellent, so higher ratings on the right side of the Quadrant Chart are better scores, and those on the left side are worse. The vertical axis ("Derived Importance") scale was derived by correlating each of the service attributes with customers' overall satisfaction levels. Those service attributes having strong correlations with overall satisfaction are seen as "More Important,” while those with weaker correlations are seen as "Less Important." For example, customer ratings of “train interior cleanliness” are very strongly correlated with overall satisfaction (i.e., customers that are happy with train interior cleanliness tend to be more satisfied overall, and conversely, customers that are disappointed with train interior cleanliness tend to be less satisfied overall). On the other hand, customer ratings of “clarity of public address announcements” (shown in chart as “train PA”) have only a weak correlation with overall satisfaction (i.e., customers may give low ratings to announcements, while still being very satisfied with BART). Therefore, train interior cleanliness is located in the upper part of the chart, while train PA is located in the lower part.

2020 BART CUSTOMER SATISFACTION STUDY
BART Marketing and Research Department 67
Specific values along the vertical axis are derived by calculating ratios between correlation coefficients for each service attribute and the median correlation level. For example, the correlation coefficient for train interior cleanliness and overall satisfaction was .518. The median correlation coefficient for all attributes and overall satisfaction was .422. Using the formula .518 / .422 * 100 resulted in a derived importance score of 123. Those service attributes with derived importance scores above 100 (i.e., above the median correlation coefficient) are more correlated with overall satisfaction, while those below 100 are less so. Note that some service attributes are seen as fairly unimportant on average because not all customers are affected by them, even though they are quite important to specific customer segments (e.g., access for people with disabilities). The vertical axis crosses the horizontal axis at the average (mean) performance rating from this year’s survey, which is 4.672 on a scale from 1 to 7. (Note that in all past studies, the mean performance rating from the 1996 benchmark study was used as the dividing line. Since this study is not being directly compared to past studies for trending purposes, the 2020 average was used rather than the 1996 average. Interestingly, the average from the 1996 study was very similar at 4.685, so this change did not impact the quadrants in which each attribute was placed.) While the 2018 quadrant chart is included at the end of this report for reference, please note that the horizontal and vertical scales are different from those used in the 2020 chart, so these two charts should not be directly compared.

2020 BART CUSTOMER SATISFACTION STUDY
68 BART Marketing and Research Department
Appendix E: CODING OF RESPONDENT COMMENTS

2020 BART CUSTOMER SATISFACTION STUDY
BART Marketing and Research Department 69
CODING OF RESPONDENT COMMENTS
EDITING AND CODING OPEN-ENDED COMMENTS
This section outlines editing and coding procedures used on the 2020 BART Customer Satisfaction Study. For the most part, information as provided by the respondent on the self-administered questionnaire was entered as recorded. Editing procedures, where disparities occurred, were as follows: Scaling Questions • If multiples occurred where only one response was acceptable (e.g., both 5 and 6 circled on the Poor -
Excellent scale or Agree Strongly and Agree Somewhat both checked), the answer input alternated between the higher and lower responses. On the first occurrence we took the higher response, and on the next occurrence we took the lower response, etc.
• In cases where bipolar discrepancies were observed (e.g., both 1 and 7 circled) the midpoint was used.
Open-ended Comments The back side of the questionnaire included a section for open-ended comments. Overall, 791 respondents, or 27% of all respondents, provided comments. All comments were data-entered as written and subsequently reviewed in order to develop comment codes. A total of 34 codes were developed, and a comment could be coded into multiple categories if the comment addressed multiple topics. Note that in past studies, a different code list was used, which was fairly consistent across past Customer Satisfaction surveys. Due to the different context for this year’s survey, the code list was developed from scratch based on the topics mentioned, instead of using the standard code list. The verbatim comments for each code are available to the BART departments responsible for each area. This provides them with an additional tool to understand the reasons for customer rating levels. The counts on the next page show the number of comments received in each category. Note that they total 1,263, rather than 791, since comments often addressed multiple topics. While these are not intended to provide quantitative data on the importance of various issues, they do provide additional insight into possible reasons behind the ratings. For example, based on the number of comments received, issues pertaining to policing/security, homelessness, and train cleanliness are top-of-mind for many customers.

2020 BART CUSTOMER SATISFACTION STUDY
70 BART Marketing and Research Department
2020 Customer Satisfaction Study Code Sheet – Comment Code Frequencies
Category Unweighted
count
Compliment / "Thank you" - general 153
BART Police Department / Policing / Security / Ambassadors 121
Homelessness / vagrants 93
Cleanliness & condition - trains 81
Hours of operation 72
Fares / discount fares / transit should be free 64
Fare evasion 60
Personal security / crime 59
Fleet of the Future cars 51
Masks 46
Cleanliness - general 44
Frequency of service (excluding weekend-specific comments) 43
Drug use 36
Crowding / social distancing / train length 31
Station Agents / other customer service 29
Other Quality-of-Life: loud music, panhandling, mental illness 28
Cleanliness & condition - stations 24
On-time performance / reliability 22
Restrooms 22
Noise 21
Smoking 17
Negative comment - general 14
PA / announcements 14
Weekend service 14
Elevators or escalators 12
Fare media or equipment 12
Other BART personnel / unspecified BART personnel 9
Parking / parking fees / parking payment 7
Expand service area 7
Temperature onboard 7
BART app / BART Watch / text BPD 5
Bikes 5
Access for people with disabilities 3
Other misc. 37
Total number of riders providing a comment: 791 As many comments were coded to multiple categories, total unweighted count will exceed 791.

2020 BART CUSTOMER SATISFACTION STUDY
BART Marketing and Research Department 71
Appendix F: 2018 Quadrant Chart
Note that the horizontal and vertical axis scales used in the 2018 quadrant chart differ from those used in the 2020 quadrant chart, so the two charts should not be directly compared.
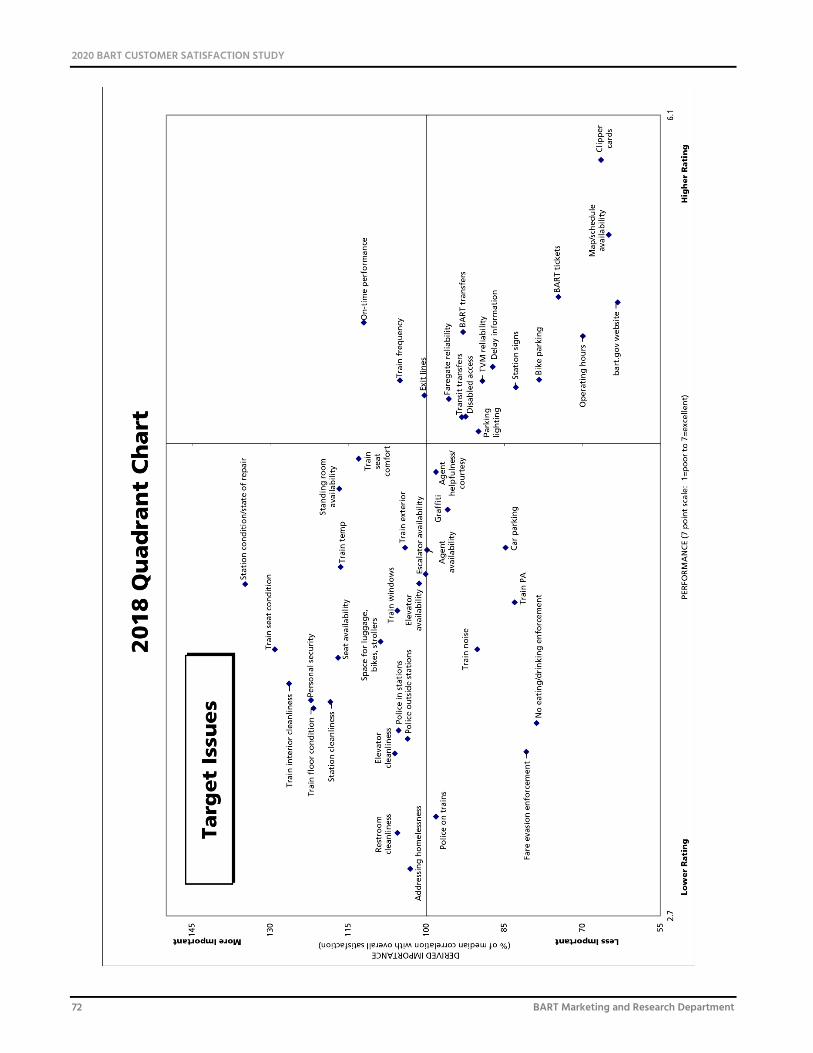
2020 BART CUSTOMER SATISFACTION STUDY
72 BART Marketing and Research Department