2020-21 Budget Paper No. 1 - Budget Statement - Chapter 4 ...
25
Budget Statement 2020-21 4 - 1 4. REVENUE The Government will provide significant payroll tax relief for businesses to support the economic recovery through: • a temporary reduction in the payroll tax rate from 5.45 per cent to 4.85 per cent for two years • a permanent increase in the payroll tax threshold to $1.2 million from 1 July 2020. Tax relief in combination with the economic impacts of the pandemic results in general government revenue being $2.8 billion lower in 2019-20 than forecast at the 2019-20 Half-Yearly Review. Lower revenue collections in 2019-20 also reflect the significant level of Government tax support for bushfire-affected communities and businesses impacted by the COVID-19 pandemic: • businesses with payrolls below $10.0 million had 25 per cent of their 2019-20 payroll tax liabilities waived • a payroll tax exemption was also applied to certain payroll amounts arising as a result of JobKeeper payments. General government revenue is expected to be $14.8 billion lower in net terms over the four years to 2023-24 in comparison to forecasts at the 2019-20 Half-Yearly Review, with the near-term revenue outlook shaped by the ongoing economic impacts of the COVID-19 pandemic and temporary support through the tax system. In particular: • lower national consumption is expected to result in a loss of GST revenue (including “no worse off” payments) to New South Wales of $8.7 billion over the four years to 2023-24 • business support measures, weak employment and wages growth will drive a $6.8 billion reduction in forecast payroll tax revenue over the four years to 2023-24 • transfer duty revenue has been revised down by $2.3 billion over the four years to 2023-24 on weaker than previously forecast transaction volumes, in the near term • revenue from sales of goods and services has been revised down by $1.1 billion over the four years to 2023-24, largely as a consequence of weaker transport service revenues • sustained weakness in the global coal market has reduced expected mining royalties revenue by $1.4 billion over the four years to 2023-24. 4.1 Impacts of COVID-19 on revenue in 2019-20 General government revenue in 2019-20 was $2.8 billion lower than forecast at the 2019-20 Half-Yearly Review, largely as a consequence of the COVID-19 pandemic. From January 2020, state and Commonwealth governments responded to public health risks with containment measures that had significant economic impacts through to the end of the financial year, affecting almost all revenue sources. The immediate and lasting effects of the pandemic on the New South Wales and Australian economy are expected to continue to weigh on revenues over the coming years.
Transcript of 2020-21 Budget Paper No. 1 - Budget Statement - Chapter 4 ...

Budget Statement 2020-21 4 - 1
4. REVENUE
The Government will provide significant payroll tax relief for businesses to support the economic recovery through:
• a temporary reduction in the payroll tax rate from 5.45 per cent to 4.85 per cent for two years
• a permanent increase in the payroll tax threshold to $1.2 million from 1 July 2020.
Tax relief in combination with the economic impacts of the pandemic results in general government revenue being $2.8 billion lower in 2019-20 than forecast at the 2019-20 Half-Yearly Review.
Lower revenue collections in 2019-20 also reflect the significant level of Government tax support for bushfire-affected communities and businesses impacted by the COVID-19 pandemic:
• businesses with payrolls below $10.0 million had 25 per cent of their 2019-20 payroll tax liabilities waived
• a payroll tax exemption was also applied to certain payroll amounts arising as a result of JobKeeper payments.
General government revenue is expected to be $14.8 billion lower in net terms over the four years to 2023-24 in comparison to forecasts at the 2019-20 Half-Yearly Review, with the near-term revenue outlook shaped by the ongoing economic impacts of the COVID-19 pandemic and temporary support through the tax system. In particular:
• lower national consumption is expected to result in a loss of GST revenue (including “no worse off” payments) to New South Wales of $8.7 billion over the four years to 2023-24
• business support measures, weak employment and wages growth will drive a $6.8 billion reduction in forecast payroll tax revenue over the four years to 2023-24
• transfer duty revenue has been revised down by $2.3 billion over the four years to 2023-24 on weaker than previously forecast transaction volumes, in the near term
• revenue from sales of goods and services has been revised down by $1.1 billion over the four years to 2023-24, largely as a consequence of weaker transport service revenues
• sustained weakness in the global coal market has reduced expected mining royalties revenue by $1.4 billion over the four years to 2023-24.
4.1 Impacts of COVID-19 on revenue in 2019-20
General government revenue in 2019-20 was $2.8 billion lower than forecast at the 2019-20 Half-Yearly Review, largely as a consequence of the COVID-19 pandemic. From January 2020, state and Commonwealth governments responded to public health risks with containment measures that had significant economic impacts through to the end of the financial year, affecting almost all revenue sources. The immediate and lasting effects of the pandemic on the New South Wales and Australian economy are expected to continue to weigh on revenues over the coming years.

Revenue
4 - 2 Budget Statement 2020-21
For 2019-20, the main tax and non-tax revenue sources impacted by the pandemic include:
• Payroll tax: Public health measures, weaker economic conditions and concerns about COVID-19 led firms to reduce employment, hours worked and employee earnings, which weighed on payroll tax receipts. To protect businesses and employment through the period of heightened public health restrictions, the Government provided a 25 per cent discount on 2019-20 payroll tax liabilities for businesses with a payroll less than $10.0 million. An exemption was also applied to certain payroll amounts arising as a result of JobKeeper payments. These factors have contributed to payroll tax revenue in 2019-20 being $1.3 billion lower than expected at the 2019-20 Half-Yearly Review.
• Transfer duty: The number of property transactions during the June quarter fell by over 20 per cent relative to the March quarter, reflecting a period of heightened restrictions, including some limits on property inspections and auctions, and uncertainty as the COVID-19 pandemic escalated. Accordingly, transfer duty revenue in 2019-20 was $578.4 million lower than expected at the 2019-20 Half-Yearly Review.
• Gambling and betting taxes: Public Health Orders required the closure of clubs, hotels and casinos between March and May 2020 preventing patrons from attending these businesses. This, combined with restrictions in June, lowered gambling tax revenues by $455.9 million relative to 2019-20 Half-Yearly Review expectations.
• Sales of goods and services: COVID-19 restrictions on mobility and transport capacity lowered patronage on public transport.
For 2019-20, the main grant revenue impacts of the pandemic were as follows:
• GST payments to New South Wales were $266.2 million lower in 2019-20 than expected at the 2019-20 Half Yearly Review. See Box 4.2 for further details.
• National Agreement and National Partnership Payments increased relative to forecasts at the 2019-20 Half-Yearly Review. The additional payments were made in response to increased demand for government assistance as a result of COVID-19 and bushfire recovery efforts (see section 4.5 for more detail).
The NSW Government expects COVID-19 will continue to place sustained pressure on State revenue sources. Further detail is outlined in this chapter.
4.2 Revenue measures since 2019-20 Half-Yearly Review
Since the 2019-20 Half-Yearly Review, the NSW Government has announced a number of support measures to businesses and communities devastated by bushfires and COVID-19. These measures are aimed at keeping people in jobs and businesses in business.
The package of tax reductions, waivers and deferrals is forecast to reduce the budget result by $1.5 billion in 2020-21 and by a further $1.6 billion over the forward estimates to 2023-24.
New taxation measures and non-taxation revenue measures are detailed below.
Taxation revenue measures since 2019-20 Half-Yearly Review
Table 4.1 shows the new taxation revenue measures announced since the 2019-20 Half-Yearly Review, including more than $2.8 billion in measures announced in this Budget.

Revenue
Budget Statement 2020-21 4 - 3
Table 4.1: New taxation revenue measures
2019-20 2020-21 2021-22 2022-23 2023-24 Four years $m $m $m $m $m to 2023-24
Payroll tax rate reduction ... (1,030) (1,070) ... ... (2,100)
Payroll tax threshold increase to $1.2 million ... (166) (175) (199) (204) (744)
Payroll tax waiver for small businesses (450) ... ... ... ... ...
Payroll tax exemption for additional wages arising from JobKeeper (130) (140) ... ... ... (140)
Bring forward of $1.0 million payroll tax threshold ... (56) ... ... ... (56) Reducing transfer duty for first home buyers purchasing new
homes ... (52) (26) ... ... (78) Government response to NSW Bushfire Inquiry - insurers contribution ... ... 30 58 17 104
Freeze of indexation rates for heavy vehicles ... (8) (9) (9) (9) (34)
Drought relief and assistance - Primary Producer Heavy Vehicle ... (36) ... ... ... (36)
Other taxation measures (18) ... ... ... ... ...
Total - taxation measures (598) (1,488) (1,250) (150) (196) (3,084)
Lowering the payroll tax rate
The payroll tax rate will be reduced from 5.45 per cent to 4.85 per cent for all New South Wales tax-paying businesses in 2020-21 and 2021-22. The lower tax rate is estimated to provide New South Wales’ businesses with around $2.1 billion in savings in total across 2020-21 and 2021-22, with an equivalent reduction in government revenue. See Box 4.1 below for further details.
Increasing the payroll tax threshold to $1.2 million from 1 July 2020
To further support the recovery and viability of businesses in New South Wales, the Government is raising the payroll tax threshold from $900,000 to $1.2 million from 1 July 2020.
As part of the Government’s response to COVID-19, the Government announced in March 2020 that it would accelerate the increase to the payroll tax threshold to $1.0 million from 1 July 2021 to 1 July 2020. This was expected to save business an additional $56.0 million in 2020-21.
As part of the 2020-21 Budget, the Government is taking this further by permanently increasing the payroll tax threshold to $1.2 million from 1 July 2020. This is expected to save businesses an additional $166.0 million in 2020-21 and $744.0 million in total over the four years to 2023-24.
Together, these increases in the threshold from $900,000 to $1.2 million will save businesses around $800.0 million over the four years to 2023-24. This is on top of savings to businesses of $571.0 million over the forward estimates from previously announced threshold increases.
Waiving 25 per cent of 2019-20 payroll tax for smaller businesses
Businesses with grouped Australian wages of $10 million or less for 2019-20 had 25 per cent of their 2019-20 annual payroll tax waived by the NSW Government. This measure was designed to help these businesses stay afloat during the pandemic and to help them retain staff. This measure was expected to lower payroll tax revenue by $450.0 million in 2019-20.

Revenue
4 - 4 Budget Statement 2020-21
Payroll tax exemption for additional wages arising from JobKeeper
The NSW Government acted to ensure that businesses did not face additional costs when passing on JobKeeper payments to their employees. Under the JobKeeper scheme, employers must pay their eligible employees an amount at least equal to the JobKeeper payment. The NSW Government has exempted from payroll tax any additional wages paid to employees to meet this requirement.
This means that where an employee is temporarily stood down from work duties, the full JobKeeper payment will be exempt from payroll tax. For employees who ordinarily earn less than the JobKeeper payment amount, the difference between their regular wage and the JobKeeper payment will be exempt from payroll tax.
The exemption is expected to reduce payroll tax revenue by $270.0 million, of which $130.0 million was for the 2019-20 year and $140.0 million for the 2020-21 financial year.
Land tax relief for landlords, supporting rental relief for tenants
The Government is providing land tax relief for landlords who reduce the rents of tenants experiencing financial distress as a result of the pandemic. This is intended to encourage landlords to allow tenants to remain in their current location during this difficult time. Landlords can receive land tax relief (in the 2020 land tax year) of up to 50 per cent of their land tax liability relating to the land leased. This Budget extends this support to provide land tax relief of up to 25 per cent for the 2021 land tax year for landlords of retail tenants.
Landlords can receive land tax relief of up to 25 per cent for rental reductions provided in each of the periods from 1 April 2020 to 30 September 2020, 1 October 2020 to 31 December 2020 and 1 January 2021 to 28 March 2021.
To qualify for the relief, landlords must reduce the rents of commercial tenants who have faced at least a 30 per cent reduction in turnover, or residential tenants who have faced at least a 25 per cent reduction in household income. In 2020, commercial tenants must have an annual turnover of not more than $50.0 million, in order for the rental reductions to be eligible. In 2021, the relief will be limited to rental reductions provided to retail tenants with annual turnover of up to $5.0 million.
This relief is provided as a grant payment and is therefore recognised as expenditure rather than foregone revenue. It is expected to raise government expenditure by $450.0 million over 2019-20 and 2020-21.
Land tax concession for build-to-rent properties
Build-to-rent housing can provide high-quality rental accommodation with long-term leases, offering greater security for tenants. The Government is encouraging more rental housing through land tax concessions of up to 50 per cent on applicable land – until 2040 – for new build-to-rent development that commenced construction on or after 1 July 2020.
The concession aims to ensure that build-to-rent developments are subject to similar overall amounts of state tax as comparable build-to-sell developments. A build-to-rent property must meet several eligibility criteria, including that the property is managed under unified ownership and must not be sub-divided within the first 15 years.
Eligible build-to-rent properties are also exempt from foreign investor surcharges.
Build-to-rent properties that qualify for the 50 per cent land tax discount are expected to generate a comparable amount of tax revenue in the long run as build-to-sell properties. With build-to-sell developments, all individual properties generate transfer duty, but only a minority of units generate land tax. A build-to-rent property, by contrast, would generate land tax from all units, for at least 15 years. This measure is therefore expected to be broadly revenue neutral over the four years to 2023-24.
Revenue
Budget Statement 2020-21 4 - 5
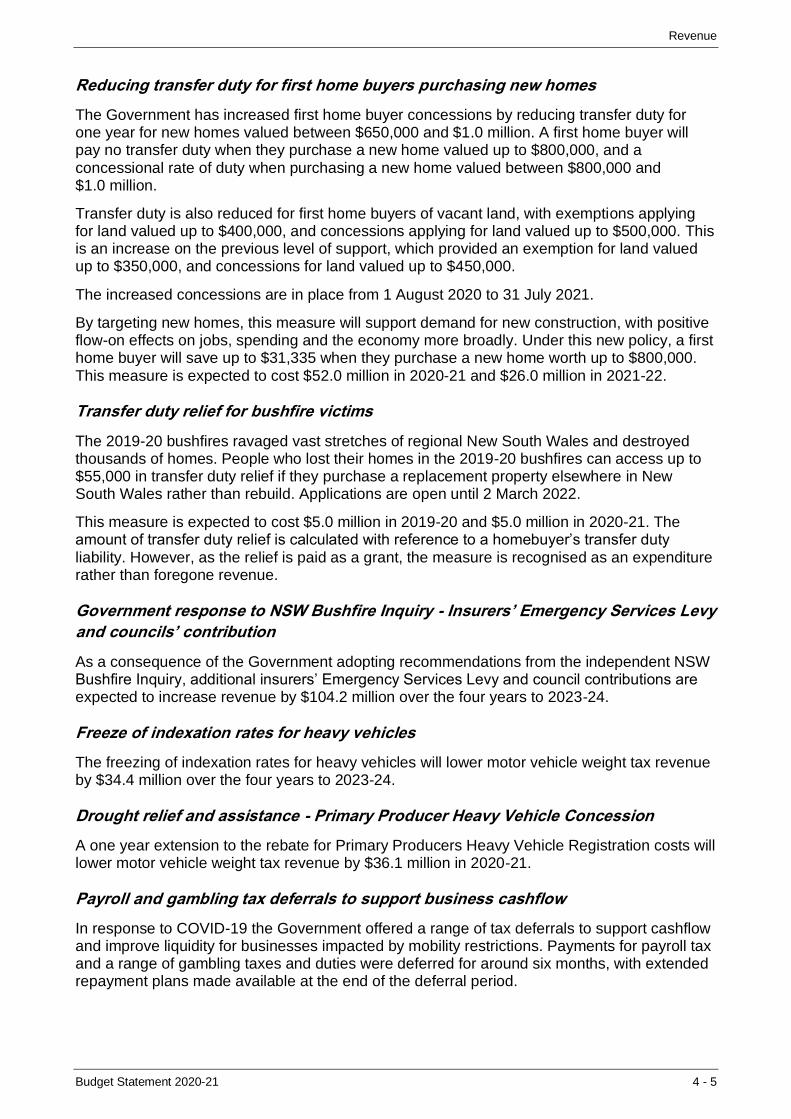
Reducing transfer duty for first home buyers purchasing new homes
The Government has increased first home buyer concessions by reducing transfer duty for one year for new homes valued between $650,000 and $1.0 million. A first home buyer will pay no transfer duty when they purchase a new home valued up to $800,000, and a concessional rate of duty when purchasing a new home valued between $800,000 and $1.0 million.
Transfer duty is also reduced for first home buyers of vacant land, with exemptions applying for land valued up to $400,000, and concessions applying for land valued up to $500,000. This is an increase on the previous level of support, which provided an exemption for land valued up to $350,000, and concessions for land valued up to $450,000.
The increased concessions are in place from 1 August 2020 to 31 July 2021.
By targeting new homes, this measure will support demand for new construction, with positive flow-on effects on jobs, spending and the economy more broadly. Under this new policy, a first home buyer will save up to $31,335 when they purchase a new home worth up to $800,000. This measure is expected to cost $52.0 million in 2020-21 and $26.0 million in 2021-22.
Transfer duty relief for bushfire victims
The 2019-20 bushfires ravaged vast stretches of regional New South Wales and destroyed thousands of homes. People who lost their homes in the 2019-20 bushfires can access up to $55,000 in transfer duty relief if they purchase a replacement property elsewhere in New South Wales rather than rebuild. Applications are open until 2 March 2022.
This measure is expected to cost $5.0 million in 2019-20 and $5.0 million in 2020-21. The amount of transfer duty relief is calculated with reference to a homebuyer’s transfer duty liability. However, as the relief is paid as a grant, the measure is recognised as an expenditure rather than foregone revenue.
Government response to NSW Bushfire Inquiry - Insurers’ Emergency Services Levy
and councils’ contribution
As a consequence of the Government adopting recommendations from the independent NSW Bushfire Inquiry, additional insurers’ Emergency Services Levy and council contributions are expected to increase revenue by $104.2 million over the four years to 2023-24.
Freeze of indexation rates for heavy vehicles
The freezing of indexation rates for heavy vehicles will lower motor vehicle weight tax revenue by $34.4 million over the four years to 2023-24.
Drought relief and assistance - Primary Producer Heavy Vehicle Concession
A one year extension to the rebate for Primary Producers Heavy Vehicle Registration costs will lower motor vehicle weight tax revenue by $36.1 million in 2020-21.
Payroll and gambling tax deferrals to support business cashflow
In response to COVID-19 the Government offered a range of tax deferrals to support cashflow and improve liquidity for businesses impacted by mobility restrictions. Payments for payroll tax and a range of gambling taxes and duties were deferred for around six months, with extended repayment plans made available at the end of the deferral period.

Revenue
4 - 6 Budget Statement 2020-21
The deferral of payments for payroll tax, gambling taxes and duties is not expected to directly reduce general government sector revenue overall. However, a component of 2019-20 payroll tax revenue will now be recognised in 2020-21 rather than 2019-20. This is because deferred payroll tax for some businesses will not be confirmed until deferred annual reconciliations are finalised in 2020-21.
Box 4.1: Building on tax support for NSW businesses: Lowering the payroll tax rate
The Government is building on its strong record of reducing the payroll tax burden on New South Wales businesses. The Government has successively increased the payroll tax threshold from $750,000, with the Government now increasing the threshold from $900,000 to $1.2 million from 1 July 2020. This builds upon and replaces the Government’s previous announcement to increase the threshold to $1.0 million from 1 July 2020. At the 2018-19 Budget, it was estimated that around 5,000 businesses that would have paid payroll tax would be exempt once the threshold reached $1.0 million. It is estimated a further 3,500 businesses will be exempt with the Government’s decision to now increase the threshold from $1.0 million to $1.2 million.
As part of its initial COVID-19 support package, the Government also provided a 25 per cent discount on payroll tax for businesses with payrolls up to $10.0 million and deferrals of payroll tax for all businesses for up to six months.
Building upon these measures, the Government will reduce the payroll tax rate from 5.45 per cent to 4.85 per cent for all New South Wales businesses in 2020-21 and 2021-22. This is equal to the lowest headline rate of payroll tax payable by businesses in any metropolitan area across Australia. Matching New South Wales to the lowest headline tax rate benefits businesses due to the lower compliance costs associated with more harmonized tax settings. It also complements the Government’s efforts in pursuing harmonised payroll tax administration reform nationally, in line with recommendations of the 2018 Review of Payroll Tax Administration and of the NSW Review of Federal Financial Relations.
When combined with the higher payroll tax threshold in New South Wales, these tax cuts also mean that while a lower headline payroll tax rate applies to businesses in regional Victoria in 2020-21, a business with a payroll of below $1.59 million will pay less payroll tax in New South Wales than an equivalent business in regional Victoria. These tax cuts are expected to benefit around 36,000 payroll taxpayers across the State in both metropolitan and regional areas.
Following from payroll tax support provided through the earlier phase of the pandemic, this measure supports businesses to play their role in the economic recovery, by reducing the cost to business of increasing worker hours and employment.
All New South Wales’ payroll taxpayers will benefit from paying less tax and, on average, a business liable for payroll tax could save around $34,000 each year, over 2020-21 and 2021-22 from measures announced in this Budget. These cost savings will help support increased working hours or additional employment in New South Wales, especially as the JobKeeper scheme is phased out in 2021, with around 8,000 jobs supported on average across 2020-21 and 2021-22 from increased hours or additional employment. Businesses will also be entitled to immediate tax savings as the lower tax rate applies retrospectively from 1 July 2020.
The lower tax rate is expected to provide New South Wales businesses with around $2.1 billion in savings in total across 2020-21 and 2021-22.
Revenue
Budget Statement 2020-21 4 - 7
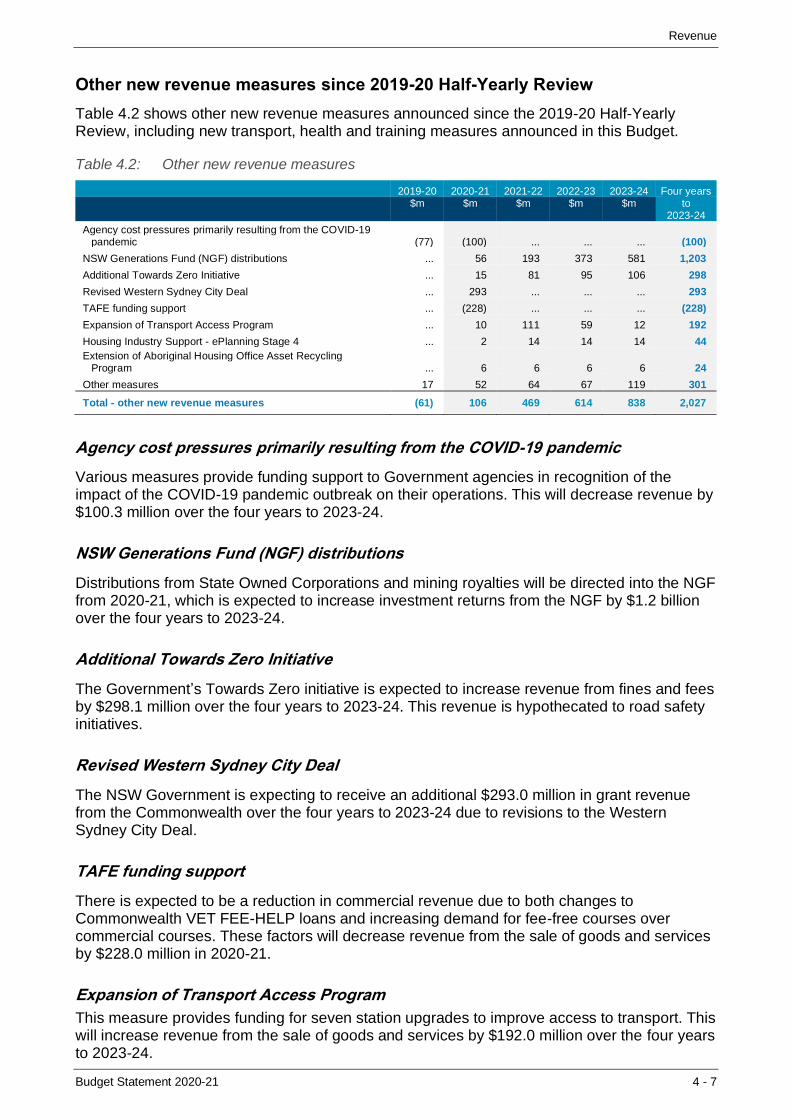
Other new revenue measures since 2019-20 Half-Yearly Review
Table 4.2 shows other new revenue measures announced since the 2019-20 Half-Yearly Review, including new transport, health and training measures announced in this Budget.
Table 4.2: Other new revenue measures
2019-20 2020-21 2021-22 2022-23 2023-24 Four years $m $m $m $m $m to
2023-24
Agency cost pressures primarily resulting from the COVID-19 pandemic (77) (100) ... ... ... (100)
NSW Generations Fund (NGF) distributions ... 56 193 373 581 1,203
Additional Towards Zero Initiative ... 15 81 95 106 298
Revised Western Sydney City Deal ... 293 ... ... ... 293
TAFE funding support ... (228) ... ... ... (228)
Expansion of Transport Access Program ... 10 111 59 12 192
Housing Industry Support - ePlanning Stage 4 ... 2 14 14 14 44
Extension of Aboriginal Housing Office Asset Recycling Program ... 6 6 6 6 24
Other measures 17 52 64 67 119 301
Total - other new revenue measures (61) 106 469 614 838 2,027
Agency cost pressures primarily resulting from the COVID-19 pandemic
Various measures provide funding support to Government agencies in recognition of the impact of the COVID-19 pandemic outbreak on their operations. This will decrease revenue by $100.3 million over the four years to 2023-24.
NSW Generations Fund (NGF) distributions
Distributions from State Owned Corporations and mining royalties will be directed into the NGF from 2020-21, which is expected to increase investment returns from the NGF by $1.2 billion over the four years to 2023-24.
Additional Towards Zero Initiative
The Government’s Towards Zero initiative is expected to increase revenue from fines and fees by $298.1 million over the four years to 2023-24. This revenue is hypothecated to road safety initiatives.
Revised Western Sydney City Deal
The NSW Government is expecting to receive an additional $293.0 million in grant revenue from the Commonwealth over the four years to 2023-24 due to revisions to the Western Sydney City Deal.
TAFE funding support
There is expected to be a reduction in commercial revenue due to both changes to Commonwealth VET FEE-HELP loans and increasing demand for fee-free courses over commercial courses. These factors will decrease revenue from the sale of goods and services by $228.0 million in 2020-21.
Expansion of Transport Access Program
This measure provides funding for seven station upgrades to improve access to transport. This will increase revenue from the sale of goods and services by $192.0 million over the four years to 2023-24.
Revenue
4 - 8 Budget Statement 2020-21
Housing Industry Support - ePlanning Stage 4
This measure will support the rollout of Stage 4 of ePlanning, which will increase revenue from the sale of goods and services by $44.0 million over the four years to 2023-24.
Extension of Aboriginal Housing Office Asset Recycling Program
Insurance revenue will be retained within the Aboriginal Housing Office to replace properties lost through sale or major damage to ensure constant dwelling stock. This will increase other revenue by $24.0 million over the four years to 2023-24.
4.3 General government revenue
Revenue result for 2019-20
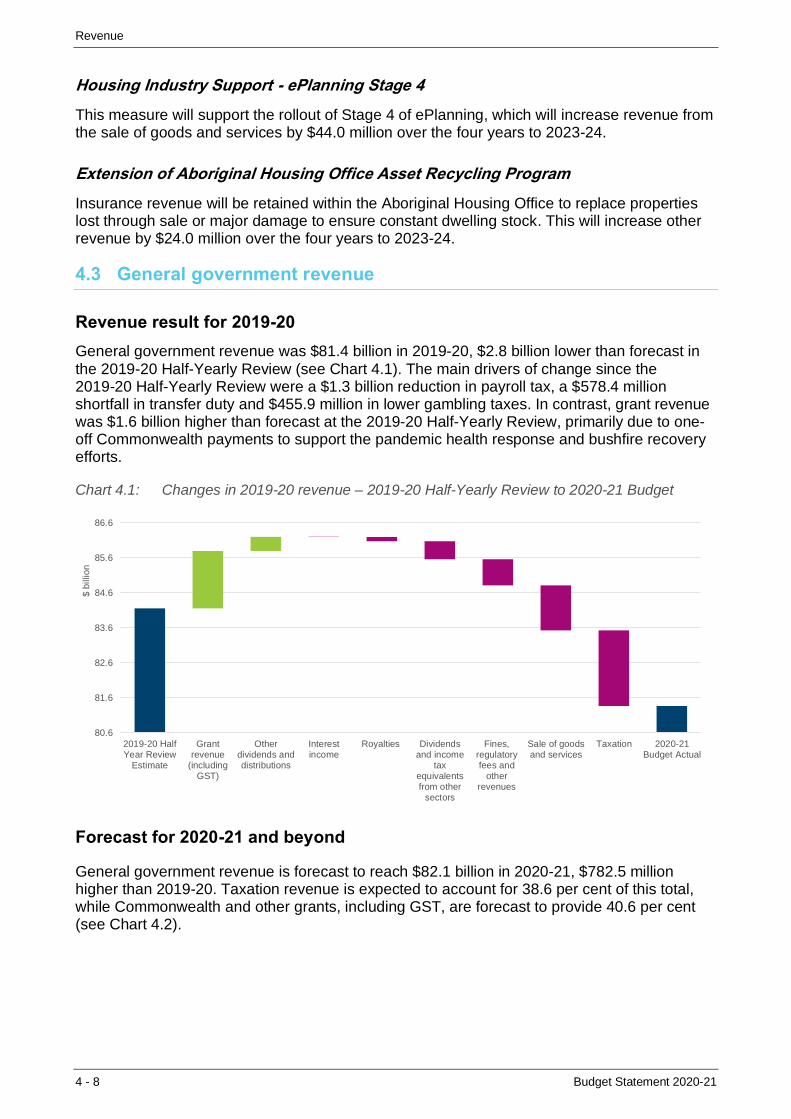
General government revenue was $81.4 billion in 2019-20, $2.8 billion lower than forecast in the 2019-20 Half-Yearly Review (see Chart 4.1). The main drivers of change since the 2019-20 Half-Yearly Review were a $1.3 billion reduction in payroll tax, a $578.4 million shortfall in transfer duty and $455.9 million in lower gambling taxes. In contrast, grant revenue was $1.6 billion higher than forecast at the 2019-20 Half-Yearly Review, primarily due to one-off Commonwealth payments to support the pandemic health response and bushfire recovery efforts.
Chart 4.1: Changes in 2019-20 revenue – 2019-20 Half-Yearly Review to 2020-21 Budget
Forecast for 2020-21 and beyond
General government revenue is forecast to reach $82.1 billion in 2020-21, $782.5 million higher than 2019-20. Taxation revenue is expected to account for 38.6 per cent of this total, while Commonwealth and other grants, including GST, are forecast to provide 40.6 per cent (see Chart 4.2).
80.6
81.6
82.6
83.6
84.6
85.6
86.6
2019-20 HalfYear Review
Estimate
Grantrevenue
(includingGST)
Otherdividends anddistributions
Interestincome
Royalties Dividendsand income
taxequivalentsfrom other
sectors
Fines,regulatoryfees and
otherrevenues
Sale of goodsand services
Taxation 2020-21Budget Actual
$ b
illion

Revenue
Budget Statement 2020-21 4 - 9
Chart 4.2: Composition of total revenue, 2020-21
General government revenue is expected to grow at a compound annual rate of 3.4 per cent over the four years to 2023-24 (Table 4.3), which is comparable to the previous forecast rate of 3.3 per cent over the four years to 2022-23 in the 2019-20 Half-Yearly Review, but now off a base that is $2.8 billion lower.
Taxation revenue is forecast to grow by 5.4 per cent per annum on average over the four years to 2023-24, while grant revenue is expected to grow at an average annual rate of only 2.8 per cent over the four years to 2023-24.
Table 4.3: General government sector - summary of revenue
2018-19 2019-20 2020-21 2021-22 2022-23 2023-24 % Average
growth p.a.
2019-20 to 2023-24
% Share of Revenue
over 4
years to 2023-24
Actual Actual Budget Forward Estimates
$m $m $m $m $m $m
Revenue from transactions
Taxation 31,026 29,941 31,711 32,552 35,211 36,885 5.4 38.6%
Grant revenue (including GST) 31,848 34,306 33,325 36,788 37,399 38,323 2.8 41.3%
Sale of goods and services 9,745 8,713 9,560 10,802 9,919 8,988 0.8 11.1%
Interest income 491 364 302 322 337 350 (1.0) 0.4%
Dividends and income tax
equivalents from other sectors 1,932 1,354 1,070 723 933 1,044 (6.3) 1.1%
Other dividends and distributions 1,934 2,426 1,779 1,896 2,360 2,720 2.9 2.5%
Royalties 2,093 1,683 1,417 1,497 1,515 1,587 (1.5) 1.7%
Fines, regulatory fees and other revenues 2,586 2,578 2,985 3,108 2,927 3,034 4.2 3.4%
Total revenue 81,655 81,367 82,149 87,689 90,601 92,930 3.4
General government revenue is forecast to be $14.8 billion lower over the four years to 2023-24 in comparison to forecasts at the 2019-20 Half-Yearly Review (See Chart 4.3 and Table 4.4). Significant downgrades, largely due to the impacts of the pandemic, include:
• a downward revision to forecast GST revenue (including “no worse off” payments) of $8.7 billion, mostly due to downward revisions of the GST pool
• a downward revision to payroll tax revenue of $6.8 billion, due to the projected cost of tax relief and lower expected employment and wages
Taxation38.6%
Commonwealth -general purpose(Includes GST)
19.9%
Commonwealth -National Agreements
14.3%Commonwealth -
National Partnerships4.9%
Other grants 1.6%
Sale of goods and services11.6%
Dividend, income taxequivalents & other
distributions 3.5%
Royalties 1.7%
Fines, fees, interest and other revenues
4.0%

Revenue
4 - 10 Budget Statement 2020-21
• a downward revision to transfer duty revenue of $2.3 billion, reflecting weaker than previously expected property prices growth and lower transaction volumes, notably in the near term
• a reduction in land tax of $1.7 billion, largely reflecting lower forecasts for average land values
• a reduction in revenue from the sales of goods and services of $1.1 billion, largely due to weaker transport revenue.
Chart 4.3: Deviations in total revenue since 2019-20 Half-Yearly Review
Box 4.2: GST revenues under pressure from the pandemic and spending trends
GST revenue has come under pressure in recent years from weak consumption growth and shifting trends in household spending. These effects were compounded by the COVID-19 pandemic, which is expected to result in the GST pool remaining well below what was forecast at the 2019-20 Half-Yearly Review.
The downgrade to the GST pool is expected to result in a loss of revenue (including “no worse off” payments) to New South Wales of $3.2 billion in 2020-21 and $8.7 billion over the four years to 2023-24. This comes after a downgrade of $922.8 million in GST revenue over the four years to 2022-23 from the 2019-20 Budget to the 2019-20 Half-Yearly Review.
The national GST pool fell by 7.6 per cent in 2019-20, as:
• across Australia, people spent less during the period from March to June 2020 (nominal household consumption fell 13 per cent in the June quarter)
• household spending shifted towards items that do not attract GST (e.g. from entertainment and eating out to goods such as fresh food)
• the total GST collected by businesses but not yet paid to the Australian Tax Office increased.
-15
-10
-5
0
5
2019-20 2020-21 2021-22 2022-23 2023-24
$billions
GST Payroll tax Transfer duty
Sales of goods and services Grant revenue (excl. GST) Other revenue
Total Revenue

Revenue
Budget Statement 2020-21 4 - 11
Chart 4.4: National GST pool ($ billions)
The national GST pool is expected to:
• remain broadly flat in 2020-21, with the negative impact of the ‘second wave’ of COVID-19 in Victoria offset by a modest recovery in consumption elsewhere
• grow strongly in 2021-22 – off a national GST pool that is $8.0 billion lower than the 2019-20 Half-Yearly Review forecast for the same period – due to the progressive removal of COVID-related measures
• grow modestly by an average of 3.7 per cent in the following two years.
On this trajectory the national GST pool will be $32.5 billion lower over the four years to 2023-24 in comparison to forecasts at the 2019-20 Half-Yearly Review. There are two factors driving this sustained deviation from 2019-20 Half-Yearly Review forecasts:
• weaker population growth, largely due to the closure of international borders, flowing to lower consumption and dwelling investment
• higher unemployment, relative to earlier forecasts, flowing through to a sustained period of weaker wages growth and lower household spending capacity.
Looking ahead, the pace of future growth in the national GST pool (and New South Wales’ potential GST revenue) will be strongly influenced by a number of factors. These include management of further COVID-19 outbreaks (both domestically and globally), the responsiveness of the private sector to government stimulus, the distribution and effectiveness of vaccines against COVID-19 and the outlook for net overseas migration (which is heavily dependent on Commonwealth Government policy settings). Any adjustment to international border restrictions will impact population growth through changes to net overseas migration. See Appendix B for more information on these risks.
30
40
50
60
70
80
90
Actual 2019-20 Budget 2019-20 HYR 2020-21 Budget
Forecast
$billions
Revenue
4 - 12 Budget Statement 2020-21
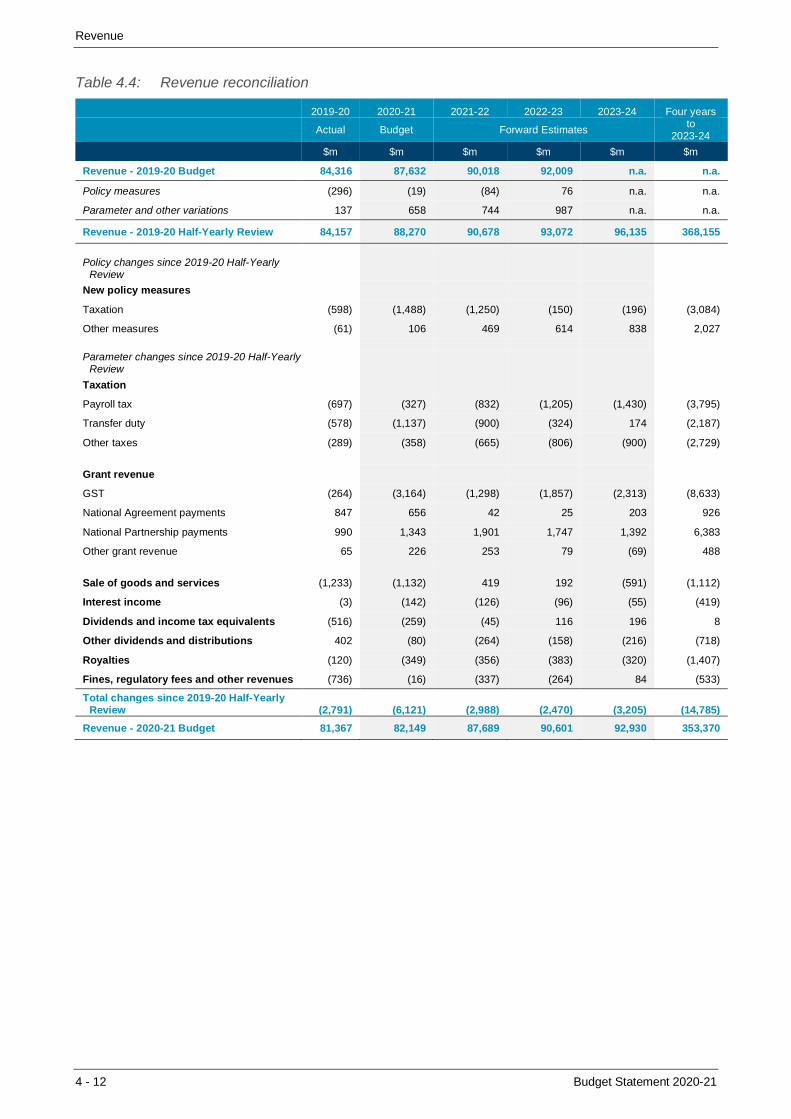
Table 4.4: Revenue reconciliation
2019-20 2020-21 2021-22 2022-23 2023-24 Four years
Actual Budget Forward Estimates
to 2023-24
$m $m $m $m $m $m
Revenue - 2019-20 Budget 84,316 87,632 90,018 92,009 n.a. n.a.
Policy measures (296) (19) (84) 76 n.a. n.a.
Parameter and other variations 137 658 744 987 n.a. n.a.
Revenue - 2019-20 Half-Yearly Review 84,157 88,270 90,678 93,072 96,135 368,155
Policy changes since 2019-20 Half-Yearly Review
New policy measures
Taxation (598) (1,488) (1,250) (150) (196) (3,084)
Other measures (61) 106 469 614 838 2,027
Parameter changes since 2019-20 Half-Yearly Review
Taxation
Payroll tax (697) (327) (832) (1,205) (1,430) (3,795)
Transfer duty (578) (1,137) (900) (324) 174 (2,187)
Other taxes (289) (358) (665) (806) (900) (2,729)
Grant revenue
GST (264) (3,164) (1,298) (1,857) (2,313) (8,633)
National Agreement payments 847 656 42 25 203 926
National Partnership payments 990 1,343 1,901 1,747 1,392 6,383
Other grant revenue 65 226 253 79 (69) 488
Sale of goods and services (1,233) (1,132) 419 192 (591) (1,112)
Interest income (3) (142) (126) (96) (55) (419)
Dividends and income tax equivalents (516) (259) (45) 116 196 8
Other dividends and distributions 402 (80) (264) (158) (216) (718)
Royalties (120) (349) (356) (383) (320) (1,407)
Fines, regulatory fees and other revenues (736) (16) (337) (264) 84 (533)
Total changes since 2019-20 Half-Yearly Review (2,791) (6,121) (2,988) (2,470) (3,205) (14,785)
Revenue - 2020-21 Budget 81,367 82,149 87,689 90,601 92,930 353,370

Revenue
Budget Statement 2020-21 4 - 13
4.4 Taxation revenue
State taxation revenue is expected to be $31.7 billion in 2020-21 (see Table 4.5), $3.3 billion lower than forecast at the 2019-20 Half-Yearly Review.
Payroll tax remains the largest single source of taxation revenue, accounting for 26.9 per cent in 2020-21 (see Chart 4.4), followed by transfer duty, which is forecast to account for 25.0 per cent. Taxation revenue is expected to grow by 5.4 per cent per annum, on average, over the four years to 2023-24.
Table 4.5: General government sector – summary of taxation revenue
2018-19 2019-20 2020-21 2021-22 2022-23 2023-24 % Average
growth p.a. 2019-20 to 2023-24
Actual Actual Budget Forward Estimates
$m $m $m $m $m $m
Stamp duties
Transfer duty 7,430 6,955 7,926 8,642 9,659 10,542 11.0
Insurance 1,022 1,091 1,127 1,206 1,261 1,318 4.8
Motor vehicles 792 768 852 842 876 909 4.3
Other 1 1 0 0 0 0 …
9,245 8,815 9,905 10,690 11,796 12,769 9.7
Payroll tax (a) 9,357 8,508 8,526 8,579 9,790 10,112 4.4
Land tax 4,216 4,477 4,639 4,547 4,574 4,646 0.9
Taxes on motor vehicle
ownership and operation
Weight tax 2,210 2,256 2,288 2,331 2,410 2,497 2.6
Vehicle transfer fees (b) 52 53 57 58 61 62 4.2
Other motor vehicle taxes 40 35 36 37 38 39 2.3
2,302 2,344 2,381 2,426 2,509 2,598 2.6
Gambling and betting taxes
Racing 127 174 212 163 175 189 2.1
Club gaming devices 783 625 846 796 810 824 7.1
Hotel gaming devices 862 756 1,056 1,087 1,144 1,212 12.5
Lotteries and lotto 454 473 481 488 504 521 2.4
Casino 394 169 158 239 298 311 16.6
Other gambling & betting 15 10 17 16 16 17 14.0
2,634 2,207 2,770 2,789 2,948 3,074 8.6
Other taxes and levies
Health insurance levy 210 214 221 226 230 235 2.4
Parking space levy 109 109 111 111 113 115 1.2
Emergency services levy contributions 785 907 1,090 1,040 1,040 1,029 3.2
Emergency services council contributions 143 175 162 161 169 167 (1.2)
Waste and environment levy 767 749 751 761 783 832 2.6
Government guarantee fee 300 322 317 366 391 422 6.9
Private transport operators levy 77 68 85 17 8 8 (41.5)
Pollution control licences 18 18 26 26 27 18 (0.3)
Other taxes 862 1,027 726 813 834 861 (4.3)
3,272 3,590 3,490 3,521 3,595 3,686 0.7
Total taxation revenue 31,026 29,941 31,711 32,552 35,211 36,885 5.4
Annual change -3.5% 5.9% 2.7% 8.2% 4.8%
(a) Due to the deferral of payroll tax returns, deferred 2019-20 payroll tax for some businesses will not be confirmed until deferred annual reconciliations are finalised. This component of deferred 2019-20 payroll tax is recognised as revenue in 2020-21 instead of 2019-20.
(b) Vehicle registration fees are no longer recorded as taxation revenue as they have been reclassified to fines, regulatory fees and other revenue to comply with accounting standard AASB 15.

Revenue
4 - 14 Budget Statement 2020-21
Revenue volatility
Transfer duty revenue continues to exhibit significant volatility. In some years it has been the largest taxation revenue source. For example, in 2016-17 it contributed 31.4 per cent of tax revenue. In other years it was much lower, down to only 18.2 per cent in 2011-12.
The four-year forecast for transfer duty to 2023-24 inclusive was revised up by $4.0 billion in the 2019-20 Half-Yearly Review on the back of a much stronger outlook for the residential property market. However, the immediate and lasting effects of COVID-19 have resulted in a $2.3 billion downgrade to expectations over the four years to 2023-24.
Chart 4.5: The composition of annual taxation revenue can fluctuate
Payroll tax
Payroll tax, which remains the State’s largest source of taxation revenue, is predicted to grow by only 0.2 per cent in 2020-21 to $8.5 billion, having been revised down by $6.8 billion over the four years to 2023-24 since the 2019-20 Half-Yearly Review. This reflects the cost of stimulus measures, increases to the threshold and expectations of sustained weak growth in wages and employment.
The Government gave all payroll tax-paying businesses in New South Wales the option to defer payroll tax returns and payments until 30 October 2020. As a result, deferred payroll tax for some businesses will not be confirmed until deferred annual reconciliations are finalised. This component of deferred 2019-20 payroll tax is recognised in 2020-21 instead of 2019-20.
Payroll tax revenue is forecast to grow at an average annual rate of 4.4 per cent over the four years to 2023-24, reflecting a rebound from exceptionally weak receipts in 2019-20. Growth in payroll tax is expected to accelerate in 2022-23 as the payroll tax rate reverts to 5.45 per cent.
0%
10%
20%
30%
40%
50%
60%
70%
80%
90%
100%
Transfer duty Payroll tax Land tax Motor vehicle taxes Gambling and betting taxes Other tax revenue Other stamp duties

Revenue
Budget Statement 2020-21 4 - 15
Chart 4.6: Payroll tax annual growth
Transfer duty
The amount of transfer duty collected is a function of property prices and the volume of sales. Transfer duty is expected to be $7.9 billion in 2020-21. While this is $1.2 billion below forecast at the 2019-20 Half-Yearly Review, it still represents a growth rate of 14.0 per cent relative to 2019-20 (when COVID-19 interrupted on-site auctions and open house inspections).
Residential transfer duty is expected to grow at an average annual rate of 12.0 per cent over the four years to 2023-24, coming off a base for 2019-20 that is almost $400.0 million lower than expected at the 2019-20 Half-Yearly Review. This forecast is largely driven by historically low interest rates and rising incomes forecast from late 2021, partly offset by weaker population growth than previously forecast. Residential property transactions are expected to rise by around 16 per cent in 2020-21.
Chart 4.7: Residential transaction volumes (quarterly)
Transfer duty revenue on larger commercial property transactions is also expected to fall by $253.1 million in 2020-21, before recovering in 2022-23 and 2023-24 in response to stronger capital values.
-10
-5
0
5
10
15
20
Annual
gro
wth
-per
cent
Annual growth 2020-21 Budget 2019-20 Half-Yearly Review
Forecast
20
25
30
35
40
45
50
55
60
Jun-04 Jun-06 Jun-08 Jun-10 Jun-12 Jun-14 Jun-16 Jun-18 Jun-20 Jun-22 Jun-24
Tra
nsactions (000's
)
Quarterly transactions 2020-21 Budget 2019-20 HYR
Forecast
Seasonally adjusted

Revenue
4 - 16 Budget Statement 2020-21
Land tax
Land tax revenue is expected to be $4.6 billion in 2020-21, $139.4 million below expectations at the 2019-20 Half-Yearly Review. The forecast for land tax has been reduced by $1.7 billion over the four years to 2023-24, reflecting weaker than previously forecast increases in average land values.
Residential land values are now expected to rise by 2.0 per cent in 2020, while commercial land values are forecast to remain stationary.
Land tax is forecast to grow by 0.9 per cent over the four years to 2023-24.
Gambling and betting taxes
Gambling tax revenue is expected to be $2.8 billion in 2020-21, an increase of $49.7 million, or 1.8 per cent, since the 2019-20 Half-Yearly Review. Forecast gambling tax revenue has been revised downwards by $128.3 million over the four years to 2023-24.
Casino revenue has been revised down by $190.5 million over the four years to 2023-24, reflecting stricter border restrictions resulting from COVID-19.
Hotel and club gaming device revenue was $307.6 million lower in 2019-20 than expected at the 2019-20 Half-Yearly Review, due to the closure of venues and subsequent restrictions on activity. Hotel and club gaming device revenue has been revised up by $136.8 million in 2020-21, reflecting strong receipts since the relaxation of restrictions and are expected to be $181.6 million higher over the four years to 2023-24.
Taxes on motor vehicle ownership and operation
Motor vehicle taxes are expected to be $2.4 billion in 2020-21, $91.9 million lower than at the 2019-20 Half-Yearly Review. Forecast motor vehicle taxes have been reduced by $572.0 million over the four years to 2023-24, reflecting slower growth in the vehicle stock.
Motor vehicle taxes are forecast to grow by 2.6 per cent over the four years to 2023-24.
Other stamp duties
Other stamp duties include insurance duty and motor vehicle registration duty. Revenue from other stamp duties is forecast to reach $2.0 billion in 2020-21 – reflecting a minor downward revision of $4.6 million since the 2019-20 Half-Yearly Review.
Stronger-than-expected insurance duty revenue in 2019-20 has resulted in forecast duty revenue to be revised up by $179.2 million over the four years to 2023-24.
Motor vehicle registration duty has been revised downward by $7.9 million since the 2019-20 Half-Yearly Review to $852.1 million for 2020-21. This reflects lower than expected new vehicle registrations and vehicle price growth. Motor vehicle registration duty has been revised down by $128.5 million over the four years to 2023-24, reflecting a revised outlook for new vehicle sales.
Other taxes and levies
Other taxes and levies are expected to provide $3.5 billion in 2020-21, growing at an average annual rate of 0.7 per cent in the four years to 2023-24.
Revenue from the Emergency Services Levy (including insurer and council contributions) is forecast to be $1.3 billion in 2020-21 and $4.9 billion over the four years to 2023-24. The increase over the four years, relative to the 2019-20 Half-Yearly Review reflects the Government’s adoption of recommendations from the NSW independent bushfire review.

Revenue
Budget Statement 2020-21 4 - 17
They include investment in the State’s emergency services agencies and fleet replacement, personal protective equipment, mental health support and aerial fire-fighting and training.
The Long Service Levy is paid on building and construction work to make long service payments available to construction workers. Revenue from the levy is forecast to be $152.9 million lower over the four years to 2023-24 since the 2019-20 Half-Yearly Review. Weaker than previously forecast building activity over the next four years is likely to result in lower payments for a smaller amount of completed work and result in lower total levy collections.
The decrease in other taxes and levies is also partly explained by a lower Compulsory Third Party (CTP) Premium Levy, due to the State Insurance Regulatory Authority (SIRA) recognising unclaimed CTP refunds as revenue.
In addition, lower interest rates since the 2019-20 Half-Yearly Review have also contributed to lower Government Guarantee Fee being paid by Sydney Water.
4.5 Grant revenue
Grant revenue is comprised primarily of general purpose grants (including GST) and specific purpose payments in the form of funding under National Agreements and National Partnerships. Total Commonwealth grant revenue is expected to fall by $1.0 billion in 2020-21 to $32.7 billion, but then rise to $37.7 billion by 2023-24.
Table 4.6: Grant revenue
2018-19 2019-20 2020-21 2021-22 2022-23 2023-24 %
Average growth
p.a. 2019-20
to
2023-24
Actual Actual Budget Forward Estimates
$m $m $m $m $m $m
Commonwealth - general purpose 17,907 18,073 16,308 19,612 19,913 20,057 2.6
GST revenue 17,851 18,066 16,272 19,554 18,868 19,125 1.4
Other general purpose grants 56 8 36 58 1,045 932 232.9
Commonwealth - National Agreements 10,224 11,278 11,740 11,721 12,385 13,053 3.7
Commonwealth - National Partnerships 2,737 3,886 3,996 4,166 3,955 3,984 0.6
Other Commonwealth payments 414 455 644 687 535 572 5.8
Total Commonwealth grants 31,282 33,694 32,687 36,185 36,788 37,665 2.8
Annual change in Commonwealth grants 1.7% 7.7% -3.0% 10.7% 1.7% 2.4%
Other grants 567 613 638 604 612 657 1.8
Total grant revenue 31,848 34,306 33,325 36,788 37,399 38,323 2.8
General purpose grants
The pandemic is expected to significantly reduce New South Wales’ GST-derived revenue over the coming years.
New South Wales GST revenue (including “no worse off” payments) is expected to be $16.3 billion in 2020-21, 9.9 per cent lower than in 2019-20. Over the four years to 2023-24, GST revenue is forecast to grow by an average of 2.6 per cent per year and be $8.7 billion lower than expected at the 2019-20 Half-Yearly Review.

Revenue
4 - 18 Budget Statement 2020-21
The main cause of the downgrade is a weaker national GST pool, which is forecast to be $32.5 billion lower over the four years to 2023-24 than expected at the 2019-20 Half-Yearly Review (see Box 4.2). This downgrade is driven by large downward revisions to forecasts for taxable consumption and private dwelling investment. In addition, unpaid GST debt (GST collected by businesses but not yet paid to the Australian Tax Office) was much higher than expected in 2019-20, which has also reduced the GST pool.
Weaker forecasts for the GST pool will be partly offset by an increase in New South Wales’ forecast relative GST share following completion of the Commonwealth Grants Commission 2020 Review and strong Western Australian royalties revenue.
Table 4.7: GST (including “no worse off”) revenues to NSW – reconciliation statement(a)
2019-20 2020-21 2021-22 2022-23 Four-year
total Actual Budget Forward Estimates
$m $m $m $m $m
2019-20 Budget 18,684 19,789 20,953 21,981 81,407
Change due to:
2019-20 adjustment (126) … … … (126)
Change in population 30 49 65 85 228
Change in pool (255) (365) (456) (579) (1,654)
Change in relativities … (1) 331 140 471
'No worse off' payments … … 17 142 159
2019-20 Half-Yearly Review 18,332 19,472 20,910 21,770 80,484
Change due to:
2019-20 adjustment … (1,469) … … (1,469)
Change in population (24) (115) (177) (259) (574)
Change in pool (243) (2,256) (2,068) (2,326) (6,893)
Change in relativities … 640 933 518 2,090
'No worse off' payments … … (5) 189 184
2020-21 Budget 18,066 16,272 19,593 19,892 73,823
Change since 2019-20 Half-Yearly Review (266) (3,200) (1,317) (1,878) (6,661)
(a) The Commonwealth Government will provide separate untied grants from 2021-22 to 2026-27 so that states and territories are not adversely affected by changes to horizontal fiscal equalisation in the form of “no worse off” payments. These payments are not part of the GST pool, are counted as other general purpose grant revenue and are not assessed by the Commonwealth Grants Commission.

Revenue
Budget Statement 2020-21 4 - 19
Box 4.3: Changes to horizontal fiscal equalisation are proving to be unfair and unsustainable
In 2018 following a Productivity Commission inquiry into horizontal fiscal equalisation (HFE), the Commonwealth Government made profound changes to how GST is distributed between the states and territories.
The practical effect of these changes is now becoming evident.
Over the next four years, Western Australia is set to receive an additional $10.8 billion because of these changes. This amount comprises top up payments from the Commonwealth of $3.5 billion in 2020-21 and 2021-22 and $7.3 billion in additional GST revenue in 2022-23 and 2023-24. At the same time, Western Australia continues to enjoy significant fiscal advantage from its mineral royalties due to the strength of global iron ore prices.
This means the Western Australian Government is being insulated from the economic and fiscal impacts of the COVID-19 pandemic. At a time when all other state and territory governments are dealing with the economic and fiscal costs of the COVID-19 pandemic on their respective economies, the Western Australian Government 2020-21 Budget released on 8 October 2020 forecasts that the State will have a general government operating surplus of $1.2 billion in 2020-21. This means the Western Australian Government can provide greater access to potentially higher quality services and more infrastructure to its residents, and a lower taxation burden, relative to any other state or territory.
More and more, the Australian Government’s HFE changes appear fiscally unsustainable, as well as being profoundly unfair. For the Commonwealth, the cost is rising. In laying out its changes to HFE in 2018, the Commonwealth Government projected that implementing its HFE changes would cost it $2.8 billion over the four years to 2023-24. The difference between the projected and actual cost is now forecast to reach $8.0 billion over the next four years.
For New South Wales, a transitional no worse off legislated guarantee is helping safeguard the State’s GST revenue share by securing $2.0 billion in the form of “no worse off payments” for the State from 2021-22 to 2034-24. However, the no worse off guarantee will come to an end in 2026-27 and presents longer term GST revenue risks for all states and territories other than Western Australia.
Council on Federal Financial Relations (CFFR)
Earlier in 2020, National Cabinet tasked CFFR with responsibility for the negotiation and development of all Commonwealth-state funding agreements under the Intergovernmental Agreement on Federal Financial Relations 2008. At the same time, CFFR was also asked to conduct a review to streamline and rationalise the existing stock of National Partnership Agreements (NPAs) and Project Agreements (PAs).
CFFR’s review has led to a reduction in the stock of tied funding agreements – 82 NPAs and PAs have now been consolidated into five sector-based umbrella Federation Funding Agreements (FFAs) spanning health, environment, infrastructure, education and skills, affordable housing, community services and other.
The four existing National Agreements (National Health Reform Agreement, the National School Reform Agreement, the National Housing and Homelessness Agreement, the National Agreement on Skills and Workforce Development) were unchanged by the review.
The objectives of CFFR’s review were to:
• provide states with budget autonomy and greater flexibility
• provide states with greater funding certainty where possible
• reduce the administrative burden on all jurisdictions.

Revenue
4 - 20 Budget Statement 2020-21
This was consistent with the key themes explored through the NSW Federal Financial Relations Review, chaired by Mr David Thodey AO (see Box 4.3 below). Fully realising these objectives will continue to be a key focus for the NSW Government and its engagement with the Government through CFFR and its role on the Board of Treasurers.
National Agreements
This category comprises payments for specific purposes from the Commonwealth to the states and territories under the National Health Reform Agreement, National School Reform Agreement, National Housing and Homelessness Agreement and the Specific Purpose Payment made relating to the National Agreement for Skills and Workforce Development.
Revenue from National Agreements is forecast to total $11.7 billion in 2020-21, an increase of 4.1 per cent on 2019-20. These revenues are expected to grow at an average annual rate of 3.7 per cent over the four years to 2023-24. Table 4.8 summarises national agreement payments by key service delivery area.
Since the 2019 Half-Yearly Review, revenue from National Agreements have increased by $963.6 million over the four years to 2023-24. This is primarily due to anticipated payments in 2020-21 to New South Wales under the COVID-19 Response National Partnership which directs funds through the National Health Reform Agreement. These funds are supporting costs incurred in public hospitals to treat and manage COVID-19 cases, as well as other costs incurred by the State in preventing the spread of COVID-19 in the community, such as the purchase of personal protective equipment. Further growth over the forward estimates since the 2019 Half-Yearly Review is primarily due to growth in activity and operating costs associated with hospital projects across the State.
A $227.5 million increase in forecast payments under the National School Reform Agreement over the four years to 2023-24 since the 2019 Half-Yearly review has also contributed to the increase in forecast revenue from National Agreements. This largely reflects technical adjustments and revised student enrolment estimates following the release of the 2020-21 Commonwealth Budget.
Table 4.8: National Agreement payments to New South Wales
2018-19 2019-20 2020-21 2021-22 2022-23 2023-24 % Average growth p.a.
2019-20 to 2023-24
Actual Actual Budget Forward Estimates
$m $m $m $m $m $m
Health 6,741 7,667 7,947 7,743 8,207 8,698 3.2
Education 2,428 2,637 2,808 2,993 3,185 3,349 6.2
Skills and workforce development 578 491 496 499 504 510 0.9
Affordable housing 477 483 489 485 490 496 0.7
Disability (0) ... ... ... ... ... -
Total National Agreements 10,224 11,278 11,740 11,721 12,385 13,053 3.7
National Partnerships (incorporating Federation Funding Agreements)
The Commonwealth provides National Partnership payments to support specified projects, ongoing service delivery or service delivery improvements. This also includes schedules under the five new sector-based Federation Funding Agreements.

Revenue
Budget Statement 2020-21 4 - 21
NSW Government revenue from National Partnerships is expected to be $4.0 billion in 2020-21, an increase of $109.1 million from 2019-20, driven largely by increased transport infrastructure funding. Revenue from National Partnerships is expected to grow at 0.6 per cent per annum on average over the four years to 2023-24. This overall modest growth reflects forecast stronger growth in transport over the forward estimates, mostly offset by reductions in Disaster Recovery Funding Arrangements (DRFA) payments and the declining payment profile of the DisabilityCare Australia Fund. The expiry of a number of National Partnerships such as the Skilling Australians Fund, Universal Access to Early Childhood Education and Public Dental Services for Adults also lowers the revenue profile over the forward estimates.
Transport revenue comprises the largest component of total National Partnership revenues, with $11.9 billion over the four years to 2023-24 with growth expected at an average annual rate of 12.3 per cent over the same period (see Table 4.9).
Since the 2019-20 Half-Yearly Review, revenue from National Partnerships has increased by $6.7 billion over the four years to 2023-24. This is primarily driven by the inclusion of transport infrastructure announcements contained in the Commonwealth’s 2020-21 Budget and earlier announcements, as well as an additional $379.0 million to New South Wales expected under DRFA following the 2019-20 bushfires.
Key transport infrastructure projects driving increased Commonwealth revenues over the forward estimates since the 2019-20 Half-Yearly Review include:
• $2.6 billion of new, and a revised profile of Commonwealth funding for the Sydney Metro - Western Sydney Airport
• $2.3 billion for new and accelerated road projects such as the Coffs Harbour Bypass, Newcastle Inner City Bypass, New England Highway Upgrades including Bolivia Hill and Singleton Bypass and Newell Highway Upgrades
• an additional $451.0 million for the NSW Infrastructure Package for the Pinch Point Program, Fixing Local Roads and Safer Roads Program.
Other significant National Partnerships signed since the 2019 Half-Yearly Review include:
• the National Legal Assistance Partnership (NLAP), with New South Wales forecast to receive $554.6 million over five years to 2024-25
• Homebuilder, with $187.0 million expected to be received in 2020-21
• the JobTrainer Fund, with receipts of $159.3 million forecast in 2020-21.
Table 4.9: National Partnership payments to New South Wales
2018-19 2019-20 2020-21 2021-22 2022-23 2023-24 %
Average growth
p.a. 2019-20 to
2023-24
Actual Actual Budget Forward Estimates
$m $m $m $m $m $m
Transport (a) 1,717 2,126 2,432 3,068 3,028 3,378 12.3
Education and skills 130 244 371 177 ... ... (100.0)
Disability 547 607 618 630 350 362 (12.1)
Health 145 115 113 55 36 83 (7.9)
Housing ... ... 187 ... ... ...
Environment 60 696 54 113 419 37 (51.9)
Other 138 99 221 123 122 124 6.0
Total National Partnership payments 2,737 3,886 3,996 4,166 3,955 3,984 0.6
(a) Includes Asset Recycling Initiative payments.

Revenue
4 - 22 Budget Statement 2020-21
Other Commonwealth payments
Other Commonwealth payments are forecast to be $643.7 million in 2020-21. This represents a $188.4 million increase in revenue since 2019-20. Over the four years to 2023-24, other Commonwealth payments have increased by $603.2 million since the 2019-20 Half-Yearly Review. These revisions reflect a forecast additional $270 million over 2020-21 and 2021-22 for Bushfire Local Economies Recovery funding and also the reclassification of $181 million over the four years to 2023-24 for the Aged Care Assessment Program to this category.
Other grants
Other grants are expected to provide $638.3 million in 2020-21 and grow by 1.8 per cent per annum on average over the four years to 2023-24.
Box 4.4: Driving federation reform: the NSW Review of Federal Financial Relations
As the Nation’s largest State economy, it is incumbent on New South Wales to take a leading role in driving a stronger, more effective Federation, where Commonwealth-state relations support the autonomy and ability of states to sustainably fund and deliver services and critical infrastructure to benefit the people of New South Wales.
In the 2019-20 Budget, the NSW Government announced an independent review into federal financial relations, appointing a panel of pre-eminent experts to lead the review. The panel was chaired by Mr David Thodey AO and included the Rt Hon Sir Bill English KNZM, the Hon John Anderson AO, Professor Anne Twomey, Professor John Freebairn AO and Ms Jane Halton AO PSM. The panel drew together leading experts in public policy reform, microeconomics and tax, constitutional law and federal financial relations.
The Review explored the key challenges and opportunities for the New South Wales revenue system and Commonwealth-state relations. Extensive consultation, supported by a discussion paper and draft report, spanned a broad range of viewpoints across the community, industry, think tanks, academia and all levels of government.
In the context of the devastating 2019-20 bushfires, COVID-19 pandemic and subsequent economic and fiscal downturn across states and territories, the recommendations of the Review’s final report focus on reform of the tax system and federal financial relations to better support the State’s economic recovery, sustainably fund and deliver essential services and infrastructure, and shore up the State’s financial capacity to respond to future crises. The Review also focused on the need for taxes to be as low as possible and changing the tax mix to reduce reliance on inefficient and harmful taxes.
The Review recommended the following areas of reform:
• phase out some of the State’s most inefficient taxes, including transfer duties and insurance taxes
• work with other states to address the hollowing out of payroll tax, support harmonisation and reduce complexity
• transition to the use of broad-based land taxes, to promote a more equitable and efficient tax system
• work with other states to modernise the way that roads are used and funded.
By commissioning this independent Review and by actively driving forums such as the Board of Treasurers in our intergovernmental landscape, New South Wales is at the forefront of federation reform.
Through wide-ranging consultation and public discourse, the Review has generated a renewed national conversation on federation reform and promoted wide-reading public debate. In the coming months, the Government will continue to explore reform opportunities informed by the Review and its recommendations.

Revenue
Budget Statement 2020-21 4 - 23
4.6 Non-tax revenues
The NSW Government collects revenue through a number of sources beyond taxation. This section outlines current forecasts.
Sale of goods and services
After falling by 10.6 per cent in 2019-20, sales of goods and services revenue is forecast to grow by only 0.8 per cent per annum on average over the four years to 2023-24. Revenue has been downgraded by $1.4 billion in 2020-21 compared to the 2019-20 Half-Yearly Review, driven partly by lower fare revenue collected by Transport NSW. This reflects lower patronage on public transport resulting from the COVID-19 pandemic.
From 2021-22, forecast revenue is $280.6 million higher over the three years to 2023-24 in comparison to forecasts at the 2019-20 Half-Yearly Review. This largely reflects a $1.8 billion upgrade to expected revenue from Transport NSW, driven by an increase in fee for service revenue from the Transport Asset Holding Entity (TAHE). This is associated with increased spending on rail projects - including the Regional Rail Fleet program, New Intercity Fleet, More Trains, More Services, and Transport Access Program.
The upgrade from Transport NSW is mostly offset by downgrades to forecast revenue collected by the Ministry of Health and the Department of Education. Forecast revenue collected by the Ministry of Health is $826.0 million lower over the four years to 2023-24. This primarily reflects revised estimates of infrastructure and facility charges collected from private practitioners, and the estimated impact of reduced single room supplement payments from private health funds.
Revenue collected by the Department of Education is also forecast to be $646.4 million lower over the four years to 2023-24. This is due to a combination of downgrades in fee for service revenue and a shift in recognition from sales of goods and services to fees and fines.
Table 4.10: Sale of goods and services
2018-19 2019-20 2020-21 2021-22 2022-23 2023-24 % Average growth p.a.
2019-20 to 2023-24
Actual Actual Budget Forward Estimates
$m $m $m $m $m $m
Rents and leases 343 325 251 251 256 250 (6.4)
Fee for service 2,605 2,145 3,091 4,053 3,011 1,918 (2.8)
Entry fees 64 43 23 53 58 59 8.2
Patient fees and hospital charges 1,070 975 1,088 1,110 1,151 1,163 4.5
Department of Veterans' Affairs 252 210 188 177 166 156 (7.1)
Court fees 134 138 137 128 127 126 (2.3)
Road tolls 158 138 136 163 164 173 5.7
Other sales of goods and services 5,119 4,739 4,646 4,867 4,985 5,144 2.1
Sale of goods and services 9,745 8,713 9,560 10,802 9,919 8,988 0.8
Interest income
Interest income includes returns on managed bond investments, including investments made by TCorp, and interest earned on bank deposits. This income is expected to be $301.8 million in 2020-21, or $111.9 million lower than forecast at the 2019-20 Half-Yearly Review. Forecast interest income is also $265.4 million lower over the four years to 2023-24, primarily due to lower interest rates which will flow through into lower expected returns on deposits.
Revenue
4 - 24 Budget Statement 2020-21
Dividends and income tax equivalents
State-owned corporations pay dividends that provide a commercially appropriate return on government investment. These dividends support investment in essential government services.
Dividends and income tax equivalents have been revised down by $259.1 million for 2020-21 since the 2019-20 Half-Yearly Review. Revenue is expected to be $7.8 million higher over the four years to 2023-24.
The main driver of the downgrade in 2020-21 is the deferral of dividend income from Landcom from 2020-21 to 2022-23 and 2023-24. This is due to a slow-down in the sales market and the resultant deferral of forthcoming major transactions. The increase in revenue over the four years to 2023-24 is mostly driven by Landcom’s decision to target a deferral of $400 million over 2022-23 and 2023-24.
The revenue increase in the forward years is partly offset by reduced forecast dividend income by Port Authority of NSW as a result of the COVID-19 pandemic and the interruption of cruise activity, and downturn of the bulk liquids, container, and vehicle trade. Forestry Corporation of NSW is also forecasting a reduction in dividend income over the four years following the 2019-20 bushfires.
Other dividends and distributions
Other dividends and distributions are received from entities other than State Owned Corporations and investment distibutions and are expected to be $1.8 billion in 2020-21, or $23.8 million lower than forecast at the 2019-20 Half-Yearly Review. Forecast revenue from other dividends and distributions is $485.4 million higher over the four years to 2023-24. This is due to updated assumptions around future expected investment return rates, shifts in underlying fund cashflows and, for the NSW Generations Fund, the impacts of additional contributions in accordance with the Government’s fiscal repair strategy.
Fines, regulatory fees, licences and other revenue (excluding royalties)
Total revenue from fines, regulatory fees, licences and other revenue is forecast to be $3.0 billion in 2020-21, and is forecast to grow at an average annual rate of 4.2 per cent over the four years to 2023-24.
Fines revenue is forecast to be $651.1 million in 2020-21 and $3.2 billion over the four years to 2023-24, an upward revision since the 2019-20 Half-Yearly Review. The additional fines revenue is due to the Government’s Towards Zero initiative to reduce trauma on New South Wales roads, which includes a roll out of red light speed cameras and optimising mobile speed cameras.
Other revenues are expected to be $6.3 billion over the four years to 2023-24, which is a $2.2 billion decrease since the 2019-20 Half-Yearly Review. This is partially explained by lower Special Infrastructure Contributions (SIC) than forecast at the 2019-20 Half-Yearly Review; reflecting weaker building activity and therefore fewer SIC payments to the State from developers. Revenue from donations has also been revised down due to a reduction in voluntary parental donations and contributions as a result of drought, bushfire and COVID-19 related hardship.

Revenue
Budget Statement 2020-21 4 - 25
Table 4.11: Fines, regulatory fees, licences and other revenues
2018-19 2019-20 2020-21 2021-22 2022-23 2023-24 % Average
growth p.a. 2019-20 to
2023-24
Actual Actual Budget Forward Estimates
$m $m $m $m $m $m
Fines 653 596 651 864 868 864 9.7
Regulatory fees 117 174 145 198 161 175 0.2
Licences 623 655 687 650 663 696 1.6
Other revenues 1,193 1,153 1,502 1,395 1,236 1,298 3.0
Total fines, regulatory fees, licences and other revenues 2,586 2,578 2,985 3,108 2,927 3,034 4.2
Royalties
Mining royalties are forecast to fall to $1.4 billion in 2020-21, with a further $4.6 billion revenue over the three years to 2023-24. This reflects a $1.4 billion downgrade over the four years to 2023-24 in comparison to expectations at the 2019-20 Half-Yearly Review.
The much weaker outlook for coal royalties is due to a combination of lower than previously forecast thermal coal prices and a higher than anticipated Australian dollar. Improvements to the expectations for gold and copper prices and production volumes provide a minor offset.
Global coal markets are facing significant long-term structural challenges. Demand for thermal coal as an energy source has been weakening, driven by competition from other sources, the widespread substitution away from coal-fired electricity generation into technologies fuelled by increasingly competitive liquid natural gas and renewable energy sources.