2019 Visitor Survey Report - Tourism Victoria
36
2019 Visitor Survey Report December 2019
Transcript of 2019 Visitor Survey Report - Tourism Victoria
2019 Visitor Survey ReportDecember 2019

Visitor Survey Report: Page 2 of 35
Message from Destination Greater Victoria’s CEO Over the last 18 months, and more specifically since January 2019, Destination Greater Victoria has worked quietly to increase its research and management capacity and bring together a coherent and strong research team producing excellent products for our members while also guiding our own management team decision making and providing independent third party information to support our Advisory Committees and Board of Directors. In reviewing and evaluating our previous visitor intercept surveys, we found that while they were helpful and undertaken consistently each summer they lacked methodological rigor and incorporated very small sample sizes. Additionally, with a strategic focus on being a year-round destination it was important that we interview visitors in all seasons of the year to assess, likely for the first time, whether there are different motivators or visitor characteristics by season. This report presents the main results of a comprehensive visitor study that addresses these issues. Our in-house research team dedicated dozens of hours reviewing and cleaning the raw data and producing the report which we can confidently stand behind. Although this project has taken an extended period of time to complete, the results and extensive database to help inform decision making are worth it. Although all research projects provide a range of insights, some insights will be especially valuable to specific businesses or sectors and each dataset will apply differently within different business contexts. Our research team will hold a member workshop in the new year to go through this in detail. It is also important to note that all research, particularly for social sciences, often has inherent limitations. Our team will also work with and incorporate insights provided by other sources, such as our advertising evaluations and digital metrics, along with research from organizations such as Destination BC and Destination Canada, to provide a holistic view of our destination and its characteristics, customers, opportunities and constraints. Going forward we commit to communicating research insights more regularly and in readily consumable ways. We also plan to refresh this visitor research every three years because it is very substantive work. Tourism research is a personal passion of mine. I am grateful to have a strong research team and encourage you to get to know them. Sincerely, Paul Nursey CEO, Destination Greater Victoria December 2019

Visitor Survey Report: Page 3 of 35
Executive Summary To better understand the characteristics, dynamics and complexity of overnight visitation to Greater Victoria, Destination Greater Victoria recently completed a full-year program of visitor-focused research. Rather than only interviewing visitors during the peak summer period as has previously been the case, the research was conducted each season throughout the year to provide a comprehensive picture of visitor characteristics as well as the key aspects of their visit and their perceptions. Work commenced during late 2018 and continued through 2019. Data were collected using in-destination intercept interviews with overnight visitors in conjunction with online post-visit surveys, providing information about a wide range of trip parameters on a seasonal basis. Sample sizes were 4,002 visitors for the intercept interviews and 986 visitors for online surveys. Data were weighted to align with benchmark seasonal visitor volumes. Results for the full year showed there were more female than male overnight visitors to Greater Victoria, the majority were aged over 44 years (most from 55 to 74), and almost two-thirds had visited previously. Half of all visitors were from within Canada while a further third were from the USA, confirming that Greater Victoria is primarily a short-haul getaway destination. Average travel party size was two, usually comprising spouses or partners, or immediate family. Greater Victoria is primarily a leisure and vacation destination and average duration of stay was three nights, most often in hotels or motels or, less frequently, short-term vacation rentals. Visits were usually planned two months in advance, most visitors booked their accommodation online themselves, and more than two-thirds arrived on BC Ferries or by flight to Victoria International Airport. Each overnight visitor spent an average of CAD$710 within Greater Victoria, primarily on accommodation along with food and beverage and shopping. The study provided many insights about visitors’ activities and satisfaction with their experience, as well as trip highlights and shortcomings. Perhaps most importantly, the research highlighted seasonal variation and nuances across many of the characteristics explored, filling gaps in our understanding of current visitation. While this report outlines high-level results from the research, a key outcome was building a comprehensive dataset regarding visitors to Greater Victoria that can be used to examine a diverse range of questions and benchmark important measures. Multivariate analysis is possible and the methods are repeatable over time to detect and monitor changes. Given the continuing growth of tourism in Greater Victoria and the increasing complexity of drivers of visitation, it is envisaged that going forward the dataset will be a valuable tool helping to inform decision making for Destination Greater Victoria’s management, Board of Directors and members. _______________________________________________________________________________________
This report has been prepared by Graham Wallace and Bruna Kopik.
If you have any questions about the report or the visitor survey, or would like further information about Destination Greater Victoria’s research activities and resources, please contact: Graham Wallace Email: [email protected] Phone: 778-587-5235
Bruna Kopik Email: [email protected] Phone: 250-414-6987 _______________________________________________________________________________________

Visitor Survey Report: Page 4 of 35
Contents
1 Background and Objectives ………………………………………………………...………... 5 2 Methods ……………………………………………………………………...…………………... 6 2.1 Approach ………………………………………………………………………………… 6 2.2 Data Collection …………………………………………………………………...……... 6 2.3 Sampling Effort ………………………………………………………………………….. 7 2.4 Weighting and Analysis ………………………………………………………………… 8 2.5 Profile of Sample ………………………………………………………………………... 9 3 Visitor Characteristics …………………………………………………………………………. 11 3.1 Previous Visitation …………………………………………...……………………….… 11 3.2 Visitor Origin …………………………………………………………………………….. 11 3.3 Travel Party Size and Composition …………………………………………………… 14 3.4 Organized Groups or Tours ……………………………………………………………. 15 3.5 Household Income ……………………………………………………………………… 15 4 Visit Characteristics ……………………………………………………………………………. 16 4.1 Purpose of Visit …………………………………………………………………………. 16 4.2 Primary Trip Destination ………………………………………………………………..
16
4.3 Duration of Stay and Trip Duration ……………………………………………………. 17 4.4 Areas Visited on Vancouver Island …………………………………………………… 17 4.5 Advance Planning ………………………………………………………………………. 19 4.6 Use of Destination Greater Victoria’s Services ……………………………………… 20 5 Arrival and Accommodation ………………………………………………………………….. 20 5.1 Mode of Arrival ………………………………………………………………………….. 20 5.2 Type of Accommodation ……………………………………………………………….. 21 5.3 Accommodation Booking Method …………………………………………………….. 21 6 Activities and Tours ……………………………………………………………………………. 22 6.1 Activities …………………………………………………………………………………. 22 6.2 Attractions ……………………………………………………………………………….. 23 6.3 Tours ……………………………………………………………………………………... 24 7 Visitor Expenditure ………………………………………………………...…………………... 25 7.1 Apportioning Visitor Spending …………………………………………………………. 25 7.2 Expenditure Per Visitor and Per Visitor Per Night …………………………………... 26 7.3 Expenditure Based on Visitor Variables ……………………………………………… 26 8 Visitor Experience ……………………………………………………………...………………. 28 8.1 Visitor Satisfaction ……………………………………………………………………… 28 8.2 Likelihood of Recommending Greater Victoria ………………………………………. 29 8.3 Net Promoter Score …………………………………………………………………….. 29 8.4 Impact of Visitor Volume ……………………………………………………………….. 30 8.5 Highlights of Visit ……………………………………………………………………….. 31 8.6 Shortcomings of Visit …………………………………………………………………… 31 8.7 Enhancing Visits ………………………………………………………………………… 32 9 Key Insights ……………………………………………………………………...……………… 33

Visitor Survey Report: Page 5 of 35
1 Background and Objectives Greater Victoria is a globally-recognized destination attracting more than four million overnight visitors each year. The Greater Victoria Visitors & Convention Bureau, trading as Destination Greater Victoria (previously Tourism Victoria) is the official not-for-profit destination marketing organization (DMO) working with industry partners, municipalities, communities, and more than 1,000 member businesses throughout Greater Victoria to drive visitation and steward economic benefits from tourism in a sustainable manner. Given significant growth in tourism within Greater Victoria over recent years, greater complexity in the drivers and dynamics of visitation and strategic focus on being a year-round destination, Destination Greater Victoria recognized the need for comprehensive, up-to-date information about overnight visitors to the region. Going forward this information would be essential to not only inform management and Board decision-making, but also deliver valuable insights and good service for Destination Greater Victoria’s members. Whereas earlier intercept surveys had provided a broad snapshot of visitors to Greater Victoria, these were limited in scope, no longer current, only occurred in summer, and did not examine potentially-important seasonal differences. To address this research need, Destination Greater Victoria embarked on a comprehensive, year long, four season study of overnight visitors to Greater Victoria to understand their characteristics, main parameters of their visit, their perceptions of Greater Victoria, and their visitor experience. Core objectives for the research were to:
1. Identify visitor and trip characteristics each season and across the year,
2. Understand visitation patterns and preferences,
3. Measure visitor expenditure and satisfaction, and
4. Utilize best-practice methods that are repeatable over time. This report summarizes high-level results of the research, in line with the above objectives. Importantly, the research provided an extensive dataset about overnight visitation to Greater Victoria that can be configured and queried to answer a diverse range of questions at various scales. The data can also support multivariate analysis, while the methods are repeatable over time to enable refreshed research identifying changes and trends. The ability to help inform decision-making widely is intended to not only benefit Destination Greater Victoria’s management and Board, but particularly its members. Members who have questions that could be answered by this study, or a business that would benefit from additional insights from the research, are encouraged to contact Destination Greater Victoria.
Acknowledgements Destination Greater Victoria wishes to acknowledge the assistance of Linda Affolder during all stages of the research, particularly in terms of helping to define the scope of the study, survey design, interim reports and project liaison. The team at Align Consulting is also acknowledged for their work compiling survey materials, developing sampling plans, and coordinating and conducting data collection. Destination Greater Victoria thanks management and staff of the Royal BC Museum, as well as staff at the Victoria Visitor Centre, for their support in facilitating data collection throughout the study.
Visitor Survey Report: Page 6 of 35
2 Methods This section outlines the approach adopted for the research along with details of data collection and analysis, including sampling effort and how data were weighted to maximize sample validity across seasons. The main characteristics of the sample are provided. Overall, the methods were appropriate for the scope of research, facilitated broad representative sampling, and generated robust sample sizes that enable analysis at a range of scales.
2.1 Approach Given the research objectives and range of questions to be explored, it was beneficial to adopt a two-phase approach to data collection. Some data (such as visitor profile, purpose of visit, trip planning, mode of arrival and type of accommodation) could be acquired most readily through in-person interviews while visitors were within the destination. Other data (such as activities, tours, expenditure, highlights and satisfaction with visit) could then be best collected after visits were completed and interview respondents had returned home. Two linked surveys collecting different information were therefore developed and used: 1. A semi-structured intercept interview conducted in person with visitors (the Intercept Survey) and 2. A structured questionnaire completed online following visits (the Online Follow-Up Survey). To ensure the sample was representative of Greater Victoria’s overnight visitor population, it was imperative that data were collected (a) during each season of the year (i.e. winter, spring, summer, fall), (b) at a range of locations where visitors would usually be present for some time during their stay (i.e. within or near Victoria’s downtown), and (c) across all days of the week as well as core times of day. Sampling plans were developed to meet these criteria. This approach was considered most likely to produce accurate insights about who is visiting Greater Victoria, the main aspects of their visit (including why they visit, how long they stay, where they stay, how they book, what they do and how much they spend), their perceptions of Greater Victoria and whether they are likely to recommend the destination.
2.2 Data Collection An external partner, Align Consulting Group, was engaged to assist with developing research materials and sampling plans and to coordinate and conduct data collection. Questions within the surveys covered a large number of parameters relevant to building insights about Greater Victoria’s overnight visitors. Intercept Survey Intercept surveys comprised up to 25 questions and required 10 to 15 minutes to complete. Each survey was conducted as a semi-structured in-person interview, with the interviewer recording each of the interviewee’s responses electronically. There were no incentives for completing an interview and questions were primarily regarding:
• gender, age and advance planning, • purpose of visit and previous visitation, • market origin, • travel party size and composition, • duration of visit, • accommodation and booking method, • mode of arrival, and • activities during the visit.

Visitor Survey Report: Page 7 of 35
On conclusion of each interview the respondent was thanked for participating and asked whether they would agree to be contacted after returning home, to complete a short online follow-up survey for more information about their visit. Those who agreed provided their email address. Data collection for intercept surveys occurred at four locations within or near the downtown core of Victoria, where visitors were often present:
• Inner Harbour and Visitor Centre • Downtown Shopping Area • Royal BC Museum Forecourt • Fisherman’s Wharf
Data collection occurred in four waves, each corresponding to a season within the tourism calendar in order to build a dataset covering the full year (Table 1). During each wave of data collection a team of interviewers was rostered across interview locations, covering all days of the week as well as core times of day to achieve a representative sample.
Table 1 Timing of each wave of data collection for intercept surveys.
Wave Data Collection Season Months of Season
1 October 2018 Fall September, October, November
2 January 2019 Winter December, January, February
3 April 2019 Spring March, April, May 4 July 2019 Summer June, July, August
Online Follow-Up Survey A link to the online follow-up survey was emailed to each intercept interview respondent who had agreed to be contacted after returning home. Timing was two to three weeks after the intercept interview. The online follow-up surveys comprised up to 24 questions and required 15 to 20 minutes to complete. As an incentive to complete the survey respondents could enter a draw to win a CAD$250 gift card. Questions were primarily regarding:
• main trip destination and regions or locations visited, • activities and/or tours undertaken during the visit, • age, gender and relationship of travel-party members, • expenditure while in Greater Victoria, • annual household income, • highlights and/or shortcomings of the visit, • satisfaction with a range of aspects of the visit, and • any recommendations to enhance the visitor experience.
2.3 Sampling Effort A sampling plan incorporating at least 48 interviewer days and 360 interview hours was developed for each wave of intercept surveys. Minor adjustments were made as necessary to provide comprehensive coverage of interview locations over days of the week. Prospective respondents were approached opportunistically by interviewers roaming at each location. Across all four seasons a total of 16,772 people were approached; of these, 32% declined to be interviewed, 32% were ineligible because they were residents of Greater Victoria and 12% were ineligible because they were day (rather than overnight) visitors.
Visitor Survey Report: Page 8 of 35
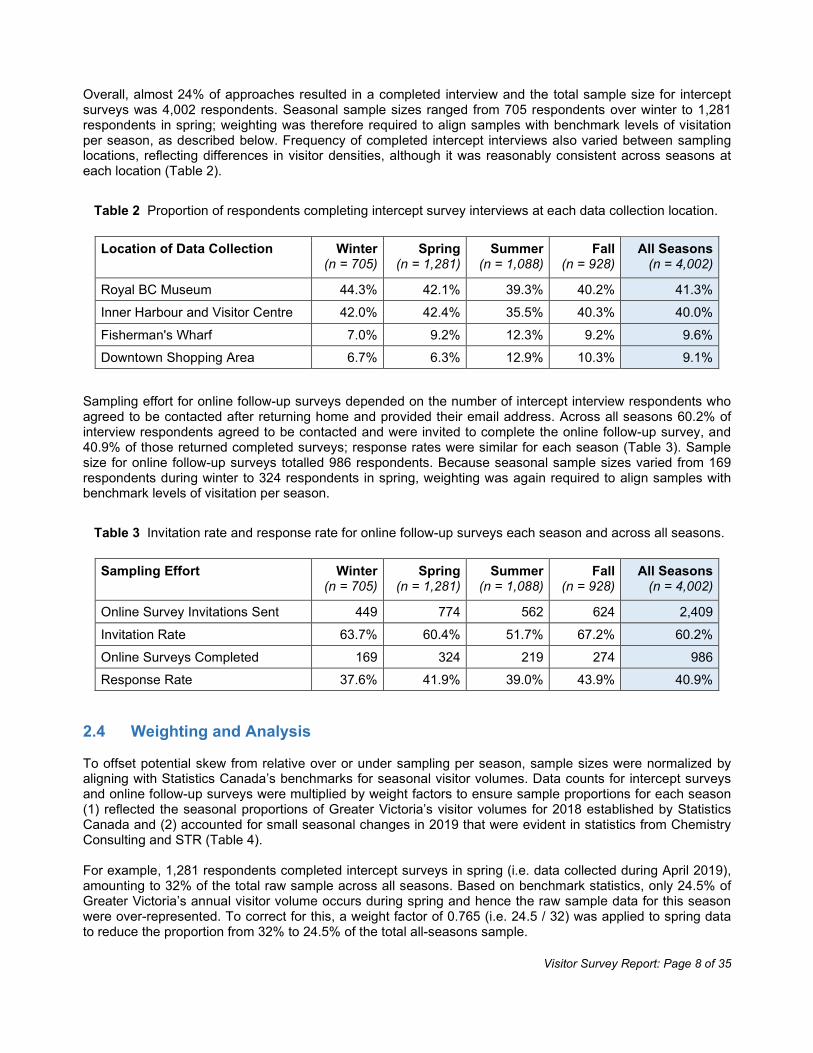
Overall, almost 24% of approaches resulted in a completed interview and the total sample size for intercept surveys was 4,002 respondents. Seasonal sample sizes ranged from 705 respondents over winter to 1,281 respondents in spring; weighting was therefore required to align samples with benchmark levels of visitation per season, as described below. Frequency of completed intercept interviews also varied between sampling locations, reflecting differences in visitor densities, although it was reasonably consistent across seasons at each location (Table 2).
Table 2 Proportion of respondents completing intercept survey interviews at each data collection location.
Location of Data Collection Winter (n = 705)
Spring (n = 1,281)
Summer (n = 1,088)
Fall (n = 928)
All Seasons (n = 4,002)
Royal BC Museum 44.3% 42.1% 39.3% 40.2% 41.3%
Inner Harbour and Visitor Centre 42.0% 42.4% 35.5% 40.3% 40.0%
Fisherman's Wharf 7.0% 9.2% 12.3% 9.2% 9.6% Downtown Shopping Area 6.7% 6.3% 12.9% 10.3% 9.1%
Sampling effort for online follow-up surveys depended on the number of intercept interview respondents who agreed to be contacted after returning home and provided their email address. Across all seasons 60.2% of interview respondents agreed to be contacted and were invited to complete the online follow-up survey, and 40.9% of those returned completed surveys; response rates were similar for each season (Table 3). Sample size for online follow-up surveys totalled 986 respondents. Because seasonal sample sizes varied from 169 respondents during winter to 324 respondents in spring, weighting was again required to align samples with benchmark levels of visitation per season.
Table 3 Invitation rate and response rate for online follow-up surveys each season and across all seasons.
Sampling Effort Winter (n = 705)
Spring (n = 1,281)
Summer (n = 1,088)
Fall (n = 928)
All Seasons (n = 4,002)
Online Survey Invitations Sent 449 774 562 624 2,409
Invitation Rate 63.7% 60.4% 51.7% 67.2% 60.2%
Online Surveys Completed 169 324 219 274 986 Response Rate 37.6% 41.9% 39.0% 43.9% 40.9%
2.4 Weighting and Analysis To offset potential skew from relative over or under sampling per season, sample sizes were normalized by aligning with Statistics Canada’s benchmarks for seasonal visitor volumes. Data counts for intercept surveys and online follow-up surveys were multiplied by weight factors to ensure sample proportions for each season (1) reflected the seasonal proportions of Greater Victoria’s visitor volumes for 2018 established by Statistics Canada and (2) accounted for small seasonal changes in 2019 that were evident in statistics from Chemistry Consulting and STR (Table 4). For example, 1,281 respondents completed intercept surveys in spring (i.e. data collected during April 2019), amounting to 32% of the total raw sample across all seasons. Based on benchmark statistics, only 24.5% of Greater Victoria’s annual visitor volume occurs during spring and hence the raw sample data for this season were over-represented. To correct for this, a weight factor of 0.765 (i.e. 24.5 / 32) was applied to spring data to reduce the proportion from 32% to 24.5% of the total all-seasons sample.

Visitor Survey Report: Page 9 of 35
Table 4 Weighting factors for (a) intercept survey data and (b) online follow-up survey data for each season.
Intercept Surveys Online Follow-Up Surveys
Timing of Data Collection
Season Benchmark Proportion of Visitor Volume *
Count (n)
Proportion of Raw
Sample
Weight Factor
Count (n)
Proportion of Raw
Sample
Weight Factor
October 2018 Fall 18.5% 928 23.19% 0.798 274 27.79% 0.666 January 2019 Winter 18.0% 705 17.62% 1.022 169 17.14% 1.050
April 2019 Spring 24.5% 1,281 32.01% 0.765 324 32.86% 0.746
July 2019 Summer 39.0% 1,088 27.19% 1.435 219 22.21% 1.756 4,002 986
* 2018 Statistics Canada data for annual visitor volume, adjusted to account for seasonal changes in visitor arrivals and hotel occupancy during 2019 sourced from Chemistry Consulting Tourism Bulletins and STR Destination Reports.
It should be noted that weighting was neither required nor appropriate in analyses based on mean or median data. Sample sizes for intercept surveys and online follow-up surveys following weighting are summarised in Table 5. Prior to weighting and analysis, data were cleaned extensively by Destination Greater Victoria staff.
Table 5 Sample sizes for intercept interview surveys and online follow-up surveys after weighting.
Survey Winter Spring Summer Fall All Seasons
Intercept Interview Surveys 720 980 1,561 741 4,002
Online Follow-Up Surveys 177 242 385 182 986
Descriptive statistics have been used for analysis and reporting results, and sample sizes reflect which of the two surveys the data are drawn from. Sample sizes also differ across results because analysis is based on responses per individual question and not all respondents answered all questions. Totals often sum to more than 100% where respondents were able to provide multiple responses to one question. The dataset is also sufficiently robust to explore patterns at finer scale when required or support further analysis using statistical tests. Data for most variables in the sample were not distributed normally and non-parametric tests will apply.
2.5 Profile of Sample Gender and age distribution of respondents were important sample characteristics. Previous exit surveys of visitors to Greater Victoria had shown proportionally more female than male visitors as well as proportionally more visitors aged more than 44 years. Because it was unlikely that these visitor demographics had changed significantly over recent years it was expected the sample for the current research would be similar, thereby increasing research validity. The profile of the sample confirmed this was the case. Across all seasons, 55% of respondents were female and 45% were male (Table 6). Relative proportions of female respondents and male respondents were consistent each season. Least variation in gender mix was during summer (54% female and 46% male) with greatest variation over winter and spring (56% female and 44% male). However, seasonal fluctuations were very small and the gender mix of visitors to Greater Victoria can be considered steady throughout the year, with approximately 20% more females than males.
Visitor Survey Report: Page 10 of 35
Table 6 Gender of respondents visiting Greater Victoria (n = 4,002 weighted).
Gender Winter (n = 720)
Spring (n = 980)
Summer (n = 1,561)
Fall (n = 741)
All Seasons (n = 4,002)
Female 56% 56% 54% 55% 55%
Male 44% 44% 46% 45% 45%
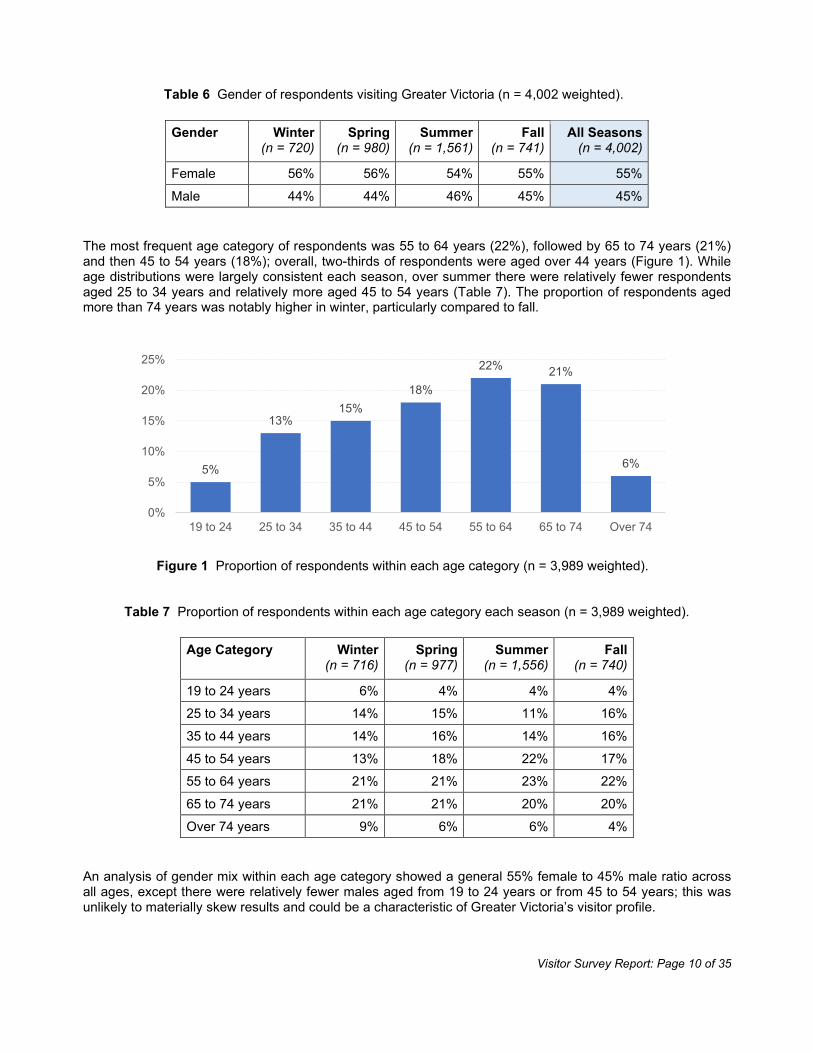
The most frequent age category of respondents was 55 to 64 years (22%), followed by 65 to 74 years (21%) and then 45 to 54 years (18%); overall, two-thirds of respondents were aged over 44 years (Figure 1). While age distributions were largely consistent each season, over summer there were relatively fewer respondents aged 25 to 34 years and relatively more aged 45 to 54 years (Table 7). The proportion of respondents aged more than 74 years was notably higher in winter, particularly compared to fall.
Figure 1 Proportion of respondents within each age category (n = 3,989 weighted).
Table 7 Proportion of respondents within each age category each season (n = 3,989 weighted).
Age Category Winter
(n = 716) Spring
(n = 977) Summer
(n = 1,556) Fall
(n = 740)
19 to 24 years 6% 4% 4% 4% 25 to 34 years 14% 15% 11% 16%
35 to 44 years 14% 16% 14% 16%
45 to 54 years 13% 18% 22% 17% 55 to 64 years 21% 21% 23% 22%
65 to 74 years 21% 21% 20% 20%
Over 74 years 9% 6% 6% 4%
An analysis of gender mix within each age category showed a general 55% female to 45% male ratio across all ages, except there were relatively fewer males aged from 19 to 24 years or from 45 to 54 years; this was unlikely to materially skew results and could be a characteristic of Greater Victoria’s visitor profile.
5%
13%15%
18%
22% 21%
6%
0%
5%
10%
15%
20%
25%
19 to 24 25 to 34 35 to 44 45 to 54 55 to 64 65 to 74 Over 74
Visitor Survey Report: Page 11 of 35
3 Visitor Characteristics Survey data provided a range of information about the characteristics of visitors to Greater Victoria, including extent of previous visitation, where visitors travelled from (i.e. their market origin), who and how many people they travelled with, whether they were part of an organized group or tour and their annual household income before tax. Collectively these data provide a high-level profile of visitors to Greater Victoria each season and over the full year.
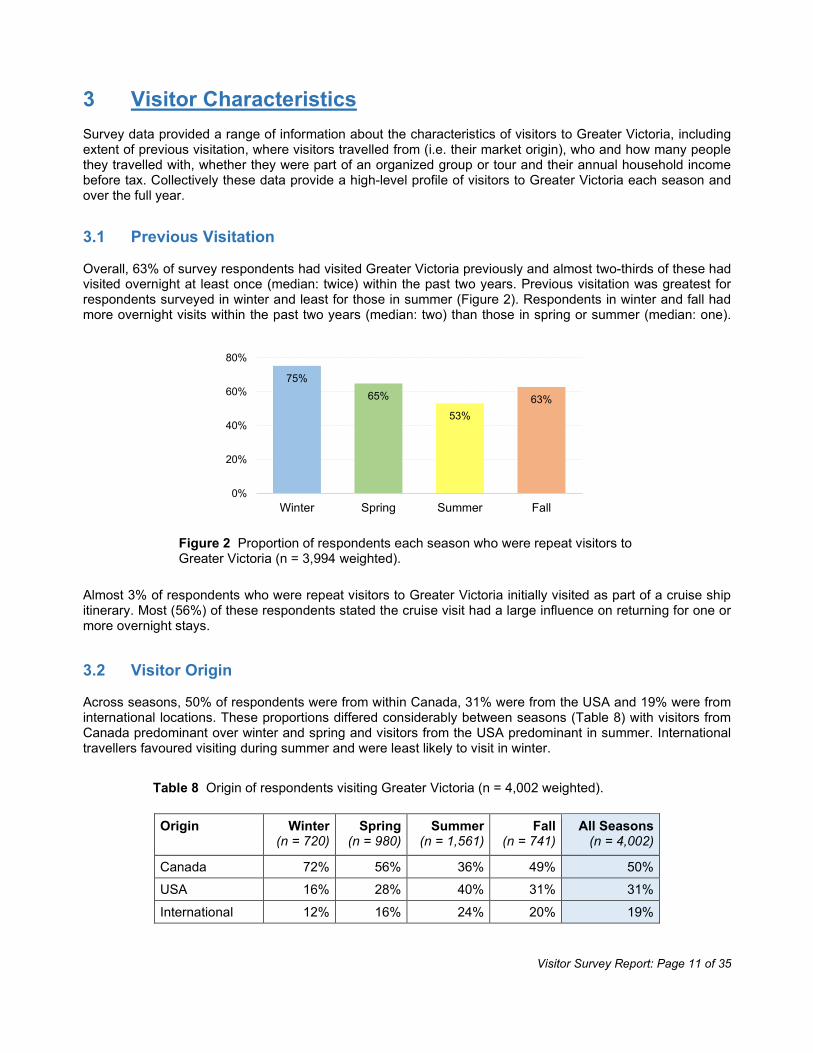
3.1 Previous Visitation Overall, 63% of survey respondents had visited Greater Victoria previously and almost two-thirds of these had visited overnight at least once (median: twice) within the past two years. Previous visitation was greatest for respondents surveyed in winter and least for those in summer (Figure 2). Respondents in winter and fall had more overnight visits within the past two years (median: two) than those in spring or summer (median: one).
Figure 2 Proportion of respondents each season who were repeat visitors to Greater Victoria (n = 3,994 weighted).
Almost 3% of respondents who were repeat visitors to Greater Victoria initially visited as part of a cruise ship itinerary. Most (56%) of these respondents stated the cruise visit had a large influence on returning for one or more overnight stays.
3.2 Visitor Origin Across seasons, 50% of respondents were from within Canada, 31% were from the USA and 19% were from international locations. These proportions differed considerably between seasons (Table 8) with visitors from Canada predominant over winter and spring and visitors from the USA predominant in summer. International travellers favoured visiting during summer and were least likely to visit in winter.
Table 8 Origin of respondents visiting Greater Victoria (n = 4,002 weighted).
Origin Winter
(n = 720) Spring
(n = 980) Summer
(n = 1,561) Fall
(n = 741) All Seasons
(n = 4,002)
Canada 72% 56% 36% 49% 50% USA 16% 28% 40% 31% 31%
International 12% 16% 24% 20% 19%
75%65%
53%63%
0%
20%
40%
60%
80%
Winter Spring Summer Fall
Visitor Survey Report: Page 12 of 35
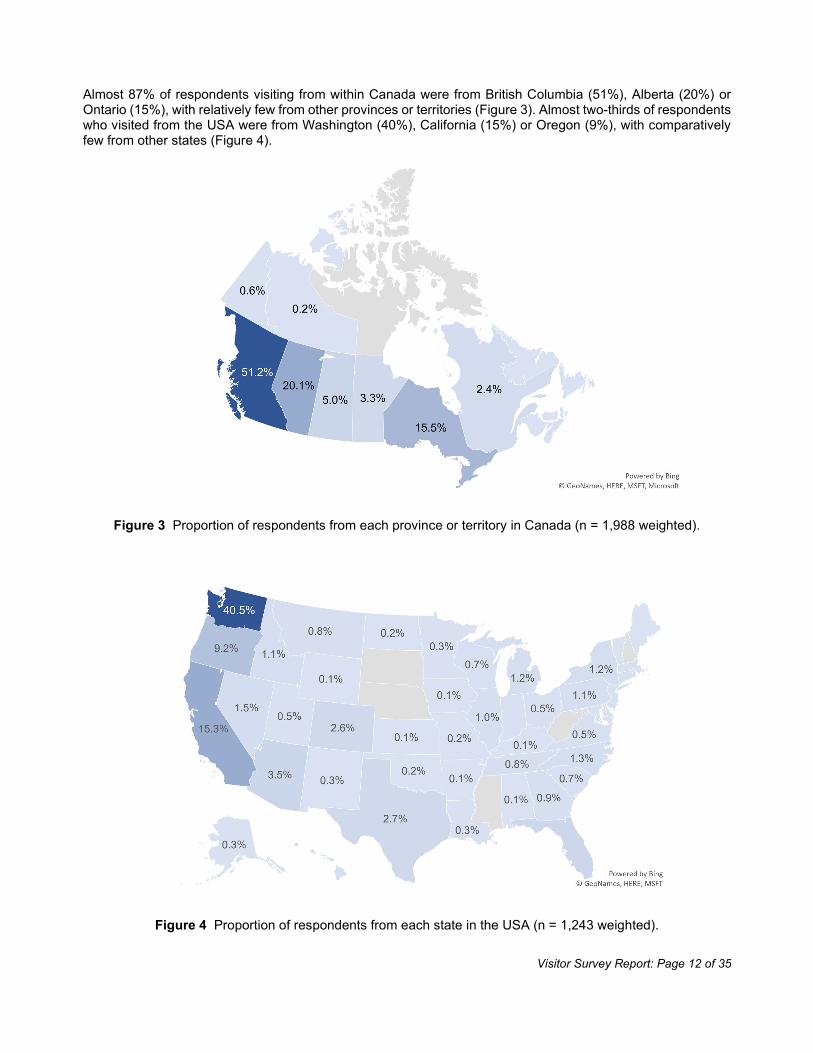
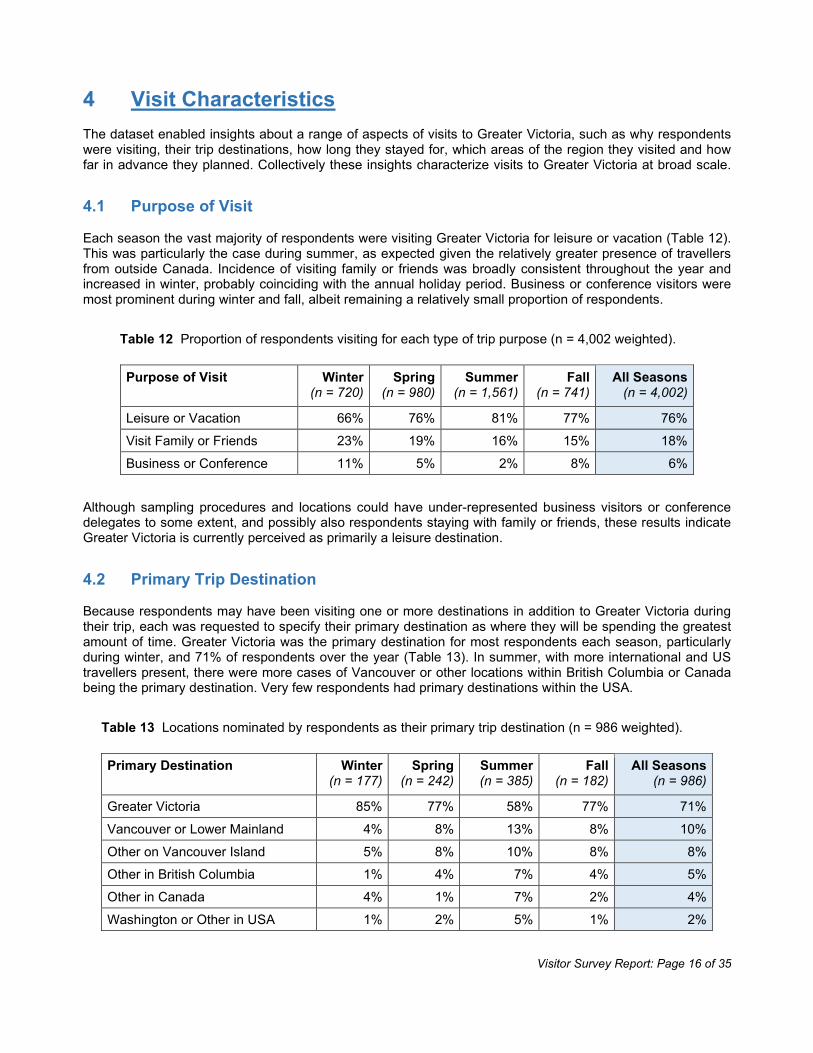
Almost 87% of respondents visiting from within Canada were from British Columbia (51%), Alberta (20%) or Ontario (15%), with relatively few from other provinces or territories (Figure 3). Almost two-thirds of respondents who visited from the USA were from Washington (40%), California (15%) or Oregon (9%), with comparatively few from other states (Figure 4).
Figure 3 Proportion of respondents from each province or territory in Canada (n = 1,988 weighted).
Figure 4 Proportion of respondents from each state in the USA (n = 1,243 weighted).

Visitor Survey Report: Page 13 of 35
Although there were respondents from a total of 54 international locations within the sample, 60% were from the United Kingdom, Australia, Germany, the Netherlands or Mexico (Table 9). Respondents from Australia, Brazil, China, France, Japan or New Zealand were much more likely than other international travellers to be present in Greater Victoria in similar proportions throughout the year. Travellers from most European countries, India, Singapore or the Philippines were more likely to visit seasonally. While Europeans tended to favour summer, travellers from India generally favoured winter and fall; travellers from Singapore or the Philippines (or other south-east Asian countries) were mostly present during spring and fall. Although it is possible that language factors reduced intercept interviews with visitors from China, Japan or South Korea, many travellers from these countries visit Greater Victoria on a day tour rather than overnight, which excluded them from the target sample.
Table 9 Proportion of respondents from the five most frequent international origins (n = 771 weighted).
Origin Winter
(n = 87) Spring
(n = 158) Summer (n = 377)
Fall (n = 149)
All Seasons (n = 771)
United Kingdom 8% 29% 27% 18% 24%
Australia 14% 14% 13% 13% 13%
Germany 4% 9% 14% 14% 12% Netherlands 4% 4% 8% 8% 7%
Mexico 6% 2% 4% 7% 4%
The ten market origins reported most frequently by respondents are ranked in Table 10. There was notable seasonal variance in the proportion of visitors from Greater Vancouver, Washington, Ontario and Vancouver Island. Visitors from Greater Vancouver, Ontario or Vancouver Island were predominant in winter, whereas those from Washington or Alberta generally favoured spring or fall. Respondents from California, Oregon or the United Kingdom were least likely to visit during winter. Irrespective of seasonal variations, these results confirm Greater Victoria is primarily a short haul destination throughout the year.
Table 10 Proportion of respondents from the ten most frequent market origins (n = 4,002 weighted).
Market Origin Winter
(n = 720) Spring
(n = 980) Summer
(n = 1,561) Fall
(n = 741) All Seasons
(n = 4,002)
Greater Vancouver 21% 16% 8% 11% 13%
Washington 9% 16% 11% 14% 13% Alberta 10% 12% 8% 10% 10%
Ontario 11% 7% 7% 8% 8%
Other British Columbia 7% 7% 6% 9% 7% Vancouver Island 10% 5% 2% 7% 5%
California 2% 3% 7% 4% 5%
United Kingdom 1% 5% 7% 4% 5% Oregon 1% 2% 4% 3% 3%
Australia 2% 2% 3% 3% 3%

Visitor Survey Report: Page 14 of 35
3.3 Travel Party Size and Composition Median travel party size was two (n = 3,998) and this was the case each season. Overall, 55% of respondents were travelling in a party of two and more than 90% of respondents were in a party of four or less (Figure 5). Larger party sizes were most common during summer and least frequent in winter.
Figure 5 Relative proportions of party sizes (n = 3,998 weighted).
Compared to the entire sample, solo travellers were:
• more likely to be female and in older age categories,
• more likely to be visiting family or friends or visiting for business or a conference, and
• least likely to have travelled from the USA. The vast majority (86%) of respondents were travelling with family or friends and this was broadly consistent across seasons (Figure 6). Finer-scale examination of travel party composition showed that visiting Greater Victoria with family members was considerably more frequent than visiting with friends, regardless of gender or age category.
Figure 6 Proportion of respondents each season who were travelling with family or friends (n = 4,002 weighted).
13%
55%
10%
13%
6%
3%
1 2 3 4 5 to 7 8 or more
77%86% 90% 86%
0%
20%
40%
60%
80%
100%
Winter Spring Summer Fall

Visitor Survey Report: Page 15 of 35
In each season most travel parties comprised family members, typically spouses or partners and immediate relatives (Table 11). Respondents were most likely to travel in larger family groups in summer, or with friends in summer and fall. These results indicate couples and immediate families are core market segments year-round and should be foundational for marketing plans, with couples potentially precedent for winter and fall.
Table 11 Proportion of respondents in each type of travel party, excluding solo travellers (n = 969 weighted).
Travel Party Composition Winter (n = 177)
Spring (n = 238)
Summer (n = 374)
Fall (n = 180)
All Seasons (n = 969)
Spouse or Partner 62% 56% 46% 59% 54% Immediate Family 20% 24% 28% 21% 24%
Extended Family 5% 5% 8% 3% 6%
Friends 5% 9% 12% 11% 10% Work Colleagues 4% 3% 2% 3% 3%
Other 4% 3% 4% 3% 3%
3.4 Organized Groups or Tours Only 4% of respondents (n = 4,002) were part of an organized group or tour, ranging from 3% in winter and fall to 6% over summer. Group or tour visitors were more likely to be from international origins than Canada or the USA and their travel bookings were usually made by an organization they represented (32%), a travel agent (29%), or the tour operator (25%) rather than themselves (14%). Only 5% of solo travellers (n = 522) were with an organized group or tour, indicating this form of travel was not oriented to or favoured by them.
3.5 Household Income Annual gross (i.e. before tax) household income for each respondent was converted (where necessary) into Canadian dollars (CAD$) then rounded to the nearest thousand dollars for analysis. Each season the most common level of household income was $50,000 to $99,000 (33%), followed by $100,000 to $149,000 (27%) and $150,000 or more (25%); comparatively few (15%) had income of less than $50,000 (Figure 7). Visitors with household income of $150,000 or more were most prevalent over summer (30%) which, given currency exchange rates, is consistent with the increased presence of US and international travellers during that time.
Figure 7 Relative proportions of annual household incomes (CAD$) before tax (n = 766 weighted).
0%
10%
20%
30%
40%
Winter Spring Summer Fall All Seasons
Less than $50,000 $50,000 to $99,000 $100,000 to $149,000 $150,000 or more
Visitor Survey Report: Page 16 of 35
4 Visit Characteristics The dataset enabled insights about a range of aspects of visits to Greater Victoria, such as why respondents were visiting, their trip destinations, how long they stayed for, which areas of the region they visited and how far in advance they planned. Collectively these insights characterize visits to Greater Victoria at broad scale.
4.1 Purpose of Visit Each season the vast majority of respondents were visiting Greater Victoria for leisure or vacation (Table 12). This was particularly the case during summer, as expected given the relatively greater presence of travellers from outside Canada. Incidence of visiting family or friends was broadly consistent throughout the year and increased in winter, probably coinciding with the annual holiday period. Business or conference visitors were most prominent during winter and fall, albeit remaining a relatively small proportion of respondents.
Table 12 Proportion of respondents visiting for each type of trip purpose (n = 4,002 weighted).
Purpose of Visit Winter (n = 720)
Spring (n = 980)
Summer (n = 1,561)
Fall (n = 741)
All Seasons (n = 4,002)
Leisure or Vacation 66% 76% 81% 77% 76%
Visit Family or Friends 23% 19% 16% 15% 18%
Business or Conference 11% 5% 2% 8% 6%
Although sampling procedures and locations could have under-represented business visitors or conference delegates to some extent, and possibly also respondents staying with family or friends, these results indicate Greater Victoria is currently perceived as primarily a leisure destination.
4.2 Primary Trip Destination Because respondents may have been visiting one or more destinations in addition to Greater Victoria during their trip, each was requested to specify their primary destination as where they will be spending the greatest amount of time. Greater Victoria was the primary destination for most respondents each season, particularly during winter, and 71% of respondents over the year (Table 13). In summer, with more international and US travellers present, there were more cases of Vancouver or other locations within British Columbia or Canada being the primary destination. Very few respondents had primary destinations within the USA.
Table 13 Locations nominated by respondents as their primary trip destination (n = 986 weighted).
Primary Destination Winter (n = 177)
Spring (n = 242)
Summer (n = 385)
Fall (n = 182)
All Seasons (n = 986)
Greater Victoria 85% 77% 58% 77% 71%
Vancouver or Lower Mainland 4% 8% 13% 8% 10%
Other on Vancouver Island 5% 8% 10% 8% 8% Other in British Columbia 1% 4% 7% 4% 5%
Other in Canada 4% 1% 7% 2% 4%
Washington or Other in USA 1% 2% 5% 1% 2%

Visitor Survey Report: Page 17 of 35
The results presented above highlight that Greater Victoria is a stand-alone destination for the large majority of visitors throughout most of the year. Although the destination is often part of a broader trip itinerary during summer, this is probably driven by itineraries for international and US travellers and/or people having longer vacations, and hence longer trips away from home, at that time of year.
4.3 Duration of Stay and Trip Duration Median duration of stay in Greater Victoria was three nights; this was the case in almost all seasons, with a decrease to two nights in fall (Figure 8). Median length of respondents’ trips (i.e. time away from home) was six nights, ranging from four nights in winter and spring to nine nights over summer. Seasonally these results align with those above for primary trip destination, further indicating Greater Victoria is the main or often sole destination for many travellers for a large part of the year.
Figure 8 Median duration of visit to Greater Victoria and median total trip duration (n = 3,982 unweighted).
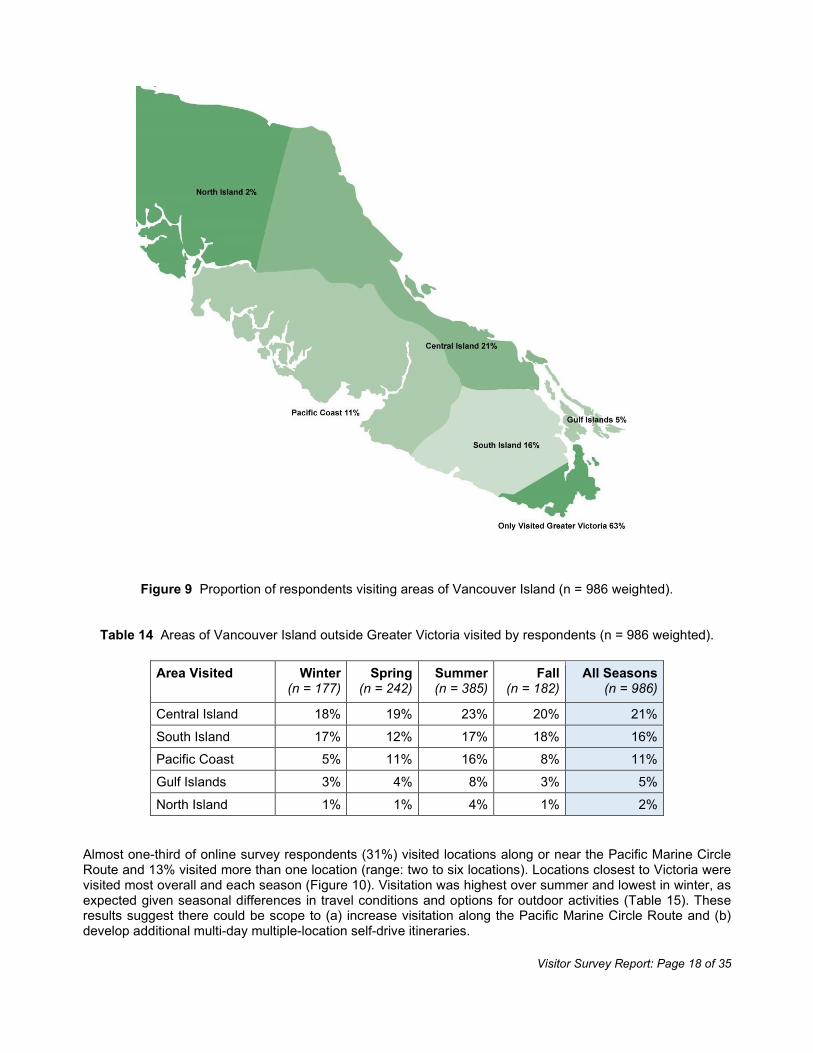
4.4 Areas Visited on Vancouver Island Across all seasons, 63% of respondents limited their visit to only Greater Victoria while on Vancouver Island. Seasonally this ranged from 58% of respondents during summer to 69% in winter and spring, which suggests there may be considerable scope to build duration of stay and dispersion to other areas of Vancouver Island alongside visits to Greater Victoria. The areas of Vancouver Island visited most frequently by respondents who travelled outside Greater Victoria were Central Island and South Island (Figure 9); visits to the Gulf Islands were relatively infrequent and very few respondents travelled to North Island. Visitation to areas of Vancouver Island other than Greater Victoria was greatest in summer and least during winter, as expected given seasonal differences in travel conditions and options for outdoor activities (Table 14).
6
5
9
4
4
3
2
3
3
3
0 2 4 6 8 10
All Seasons
Fall
Summer
Spring
Winter
Nights in Greater Victoria Total Trip Nights
Visitor Survey Report: Page 18 of 35
Figure 9 Proportion of respondents visiting areas of Vancouver Island (n = 986 weighted).
Table 14 Areas of Vancouver Island outside Greater Victoria visited by respondents (n = 986 weighted).
Area Visited Winter (n = 177)
Spring (n = 242)
Summer (n = 385)
Fall (n = 182)
All Seasons (n = 986)
Central Island 18% 19% 23% 20% 21%
South Island 17% 12% 17% 18% 16% Pacific Coast 5% 11% 16% 8% 11%
Gulf Islands 3% 4% 8% 3% 5%
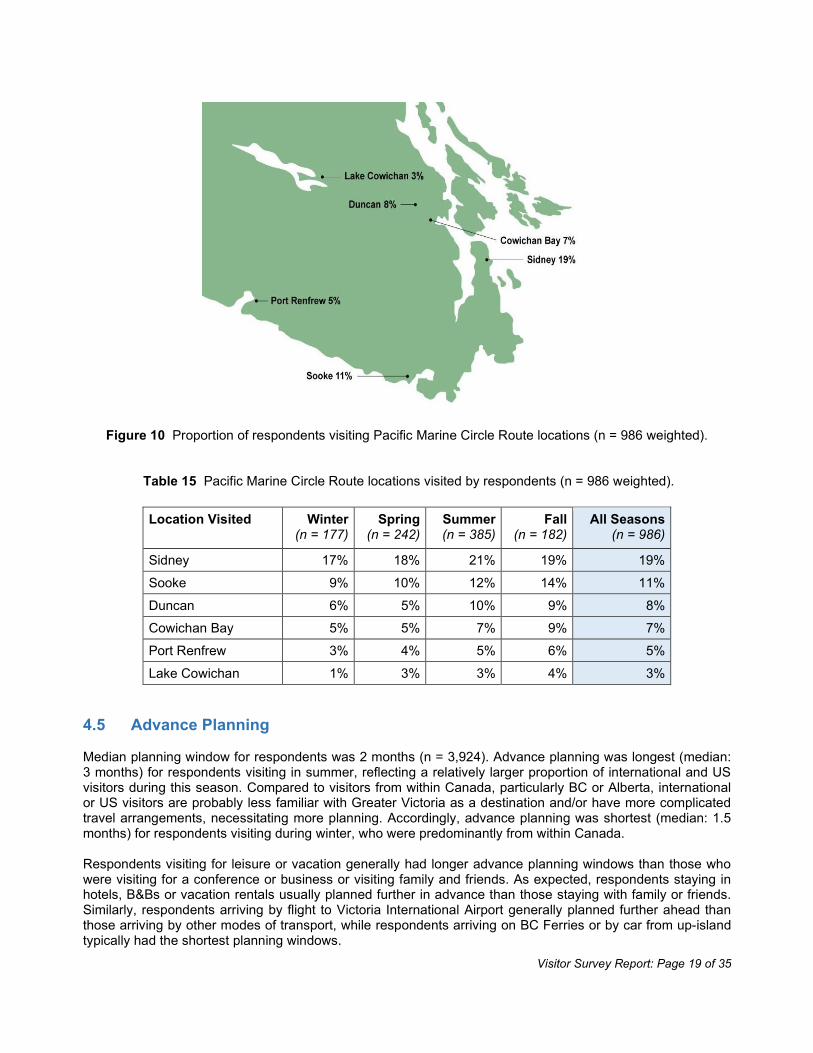
North Island 1% 1% 4% 1% 2% Almost one-third of online survey respondents (31%) visited locations along or near the Pacific Marine Circle Route and 13% visited more than one location (range: two to six locations). Locations closest to Victoria were visited most overall and each season (Figure 10). Visitation was highest over summer and lowest in winter, as expected given seasonal differences in travel conditions and options for outdoor activities (Table 15). These results suggest there could be scope to (a) increase visitation along the Pacific Marine Circle Route and (b) develop additional multi-day multiple-location self-drive itineraries.
Visitor Survey Report: Page 19 of 35
Figure 10 Proportion of respondents visiting Pacific Marine Circle Route locations (n = 986 weighted).
Table 15 Pacific Marine Circle Route locations visited by respondents (n = 986 weighted).
Location Visited Winter
(n = 177) Spring
(n = 242) Summer (n = 385)
Fall (n = 182)
All Seasons (n = 986)
Sidney 17% 18% 21% 19% 19%
Sooke 9% 10% 12% 14% 11%
Duncan 6% 5% 10% 9% 8% Cowichan Bay 5% 5% 7% 9% 7%
Port Renfrew 3% 4% 5% 6% 5%
Lake Cowichan 1% 3% 3% 4% 3%
4.5 Advance Planning Median planning window for respondents was 2 months (n = 3,924). Advance planning was longest (median: 3 months) for respondents visiting in summer, reflecting a relatively larger proportion of international and US visitors during this season. Compared to visitors from within Canada, particularly BC or Alberta, international or US visitors are probably less familiar with Greater Victoria as a destination and/or have more complicated travel arrangements, necessitating more planning. Accordingly, advance planning was shortest (median: 1.5 months) for respondents visiting during winter, who were predominantly from within Canada. Respondents visiting for leisure or vacation generally had longer advance planning windows than those who were visiting for a conference or business or visiting family and friends. As expected, respondents staying in hotels, B&Bs or vacation rentals usually planned further in advance than those staying with family or friends. Similarly, respondents arriving by flight to Victoria International Airport generally planned further ahead than those arriving by other modes of transport, while respondents arriving on BC Ferries or by car from up-island typically had the shortest planning windows.

Visitor Survey Report: Page 20 of 35
4.6 Use of Destination Greater Victoria’s Services Prior to or while visiting Greater Victoria, 41% of respondents (n = 986) used one or more information services provided by Destination Greater Victoria, including the Visitor Centre (26%) and DGV’s website (22%). These results confirm Destination Greater Victoria and its members have opportunities to influence planning and/or within-destination activities for a significant proportion of visitors to Greater Victoria.
5 Arrival and Accommodation Survey data provided information about how respondents arrived in Greater Victoria, where they stayed and how they booked their accommodation. Insights in this regard could inform where travellers can be engaged most effectively leading into and during their visit.
5.1 Mode of Arrival Across all seasons, respondents most frequently arrived in Greater Victoria on BC Ferries from Tsawwassen (43%) or by airline into Victoria International Airport (26%) and these were the predominant modes of arrival each season, especially during winter (Table 16). Although overall 21% of respondents arrived by ferry from the USA, this fluctuated seasonally from 9% in winter to 21% in spring and fall and 26% over summer. Other modes of arrival (4% overall) included V2V ferry, seaplane, helicopter, bus from up island, or personal boat.
Table 16 Respondents’ mode of arrival into Greater Victoria (n = 4,002 weighted).
Mode of Arrival Winter (n = 720)
Spring (n = 980)
Summer (n = 1,561)
Fall (n = 741)
All Seasons (n = 4,002)
BC Ferries 46% 39% 46% 42% 43% Flight into YYJ 33% 28% 21% 27% 26%
Coho Black Ball Ferry 4% 9% 13% 7% 9%
Clipper Ferry 5% 10% 8% 9% 8% Car from Up Island 10% 8% 3% 7% 6%
Washington State Ferry 0% 2% 5% 5% 4%
Other 2% 4% 4% 3% 4%
Of the respondents who arrived in Greater Victoria on BC Ferries (n = 1,721):
• 69% travelled with a vehicle
• 19% travelled as a walk-on passenger
• 12% travelled on a coach bus These proportions were generally consistent each season. Mode of arrival aligned closely with the main transportation services available from market origins. Travellers from within Canada primarily arrived on BC Ferries, a flight into YYJ or by vehicle from up island, while those from the USA mostly arrived on a flight into YYJ or on one of the three ferries from Washington. International visitors most frequently arrived on a flight into YYJ or on BC Ferries. These observations are consistent with Greater Victoria being the primary destination for the majority of respondents.

Visitor Survey Report: Page 21 of 35
5.2 Type of Accommodation Across all seasons, three of four respondents stayed in a hotel or motel (61%) or vacation rental (16%) while visiting Greater Victoria and 13% stayed with family or friends (Figure 11). The relative mix was very similar irrespective of season, except that camping or RV accommodation was used markedly more frequently over summer and rarely in winter, as expected. “Other” types of accommodation included timeshares, self-owned properties or boats, house-sitting and exchange programs.
Figure 11 Types of accommodation used by respondents visiting Greater Victoria (n = 4,002 weighted).
Analysis based on market origins showed that: • Travellers from within Canada were more likely than other visitors to stay with family or friends.
• Travellers from the USA were more likely than other visitors to stay in a vacation rental, bed & breakfast
or timeshare, and least likely to stay with family or friends or use hostel, camping or RV accommodation. • Travellers from international locations were more likely than other visitors to use hostel, camping or RV
accommodation, while a notable proportion stayed with family or friends.
5.3 Accommodation Booking Method Of those respondents who stayed in commercial accommodation (i.e. not with family or friends), most (68%) booked their accommodation online themselves (Figure 12). One in five accommodation bookings were by a third party, including a travel agent, family member or friend, transportation operator (usually BC Ferries or Clipper Vacations) or an association (mainly for conference visitors). Only 6% of respondents used a travel agent to book accommodation. One in ten respondents booked in advance or on arrival by telephone direct to the accommodation provider, while very few (2%) booked in person after arriving in Greater Victoria. Of the respondents who stayed in commercial accommodation and booked the accommodation themselves online (n = 2,335):
• 44% booked through an OTA or Travel Booking Website
• 34% booked direct through the Property Website
• 22% booked through a Short-Term Vacation Rental Website These proportions were generally consistent each season.
3%
2%
2%
3%
13%
16%
61%
0% 10% 20% 30% 40% 50% 60% 70%
Other
Camping or RV
Hostel
Bed & Breakfast
With Family or Friends
Vacation Rental
Hotel / Motel
Visitor Survey Report: Page 22 of 35
Figure 12 Accommodation booking methods used by respondents (n = 3,427 weighted).
6 Activities and Tours Data from the online follow-up survey provided detailed summaries of the activities respondents engaged in while visiting Greater Victoria, as well as the attractions they visited and any guided or organized tours they joined. The results presented here are primarily overviews at reasonably broad scale.
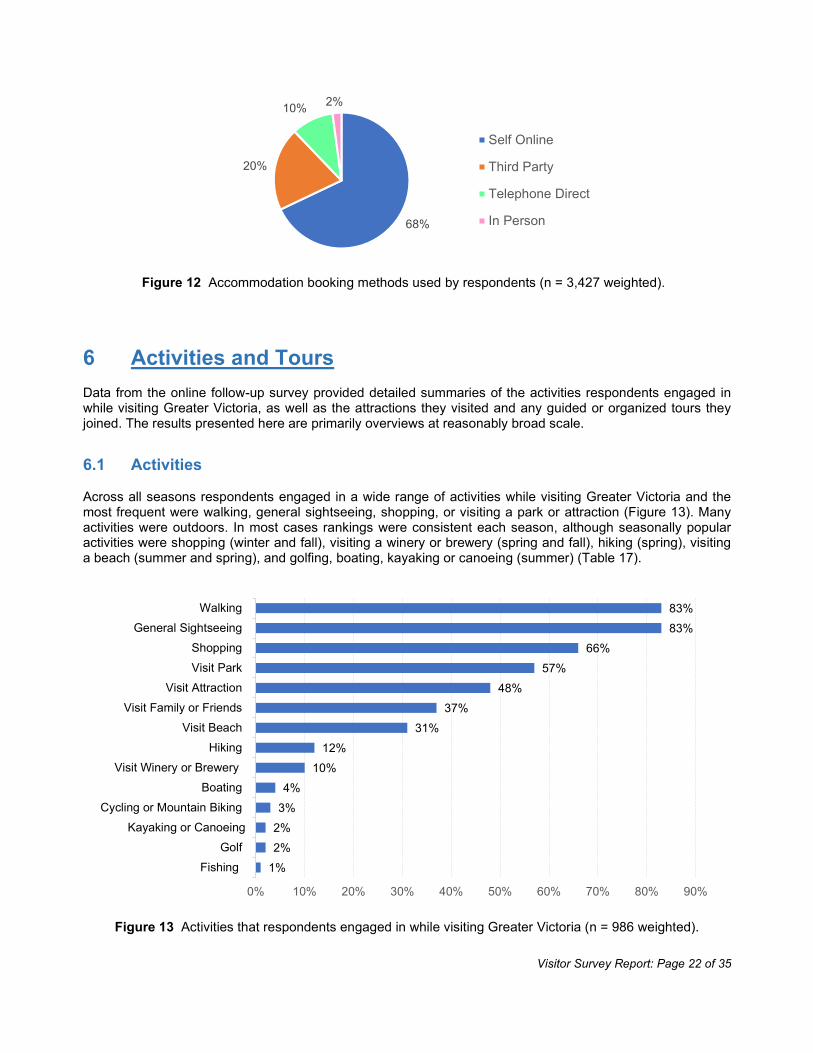
6.1 Activities Across all seasons respondents engaged in a wide range of activities while visiting Greater Victoria and the most frequent were walking, general sightseeing, shopping, or visiting a park or attraction (Figure 13). Many activities were outdoors. In most cases rankings were consistent each season, although seasonally popular activities were shopping (winter and fall), visiting a winery or brewery (spring and fall), hiking (spring), visiting a beach (summer and spring), and golfing, boating, kayaking or canoeing (summer) (Table 17).
Figure 13 Activities that respondents engaged in while visiting Greater Victoria (n = 986 weighted).
68%
20%
10% 2%
Self Online
Third Party
Telephone Direct
In Person
1%2%2%3%4%
10%12%
31%37%
48%57%
66%83%83%
0% 10% 20% 30% 40% 50% 60% 70% 80% 90%
FishingGolf
Kayaking or CanoeingCycling or Mountain Biking
BoatingVisit Winery or Brewery
HikingVisit Beach
Visit Family or FriendsVisit Attraction
Visit ParkShopping
General SightseeingWalking
Visitor Survey Report: Page 23 of 35
Table 17 Proportion of respondents engaging in each activity each season (n = 986 weighted).
Winter (n = 177)
Spring (n = 242)
Summer (n = 385)
Fall (n = 182)
Activity % Activity % Activity % Activity %
Walking 88% Walking 86% General Sightseeing 82% General
Sightseeing 86%
General Sightseeing 80% General
Sightseeing 84% Walking 77% Walking 84%
Shopping 73% Shopping 64% Shopping 63% Shopping 71%
Visit Park 50% Visit Park 61% Visit Park 59% Visit Park 51%
Visit Attraction 45% Visit Attraction 46% Visit Attraction 50% Visit Attraction 49%
Visit Family or Friends 43% Visit Family or
Friends 40% Visit Beach 37% Visit Family or Friends 35%
Visit Beach 18% Visit Beach 32% Visit Family or Friends 33% Visit Beach 28%
Hiking 9% Hiking 15% Hiking 12% Visit Winery or Brewery 11%
Visit Winery or Brewery 8% Visit Winery or
Brewery 13% Visit Winery or Brewery 9% Hiking 9%
Golf 2% Cycling or Mountain Biking 3% Boating 8% Cycling or
Mountain Biking 4%
Cycling or Mountain Biking 1% Boating 3% Cycling or
Mountain Biking 4% Boating 1%
Fishing 1% Fishing 1% Kayaking or Canoeing 4% Kayaking or
Canoeing 1%
Golf 1% Golf 4%
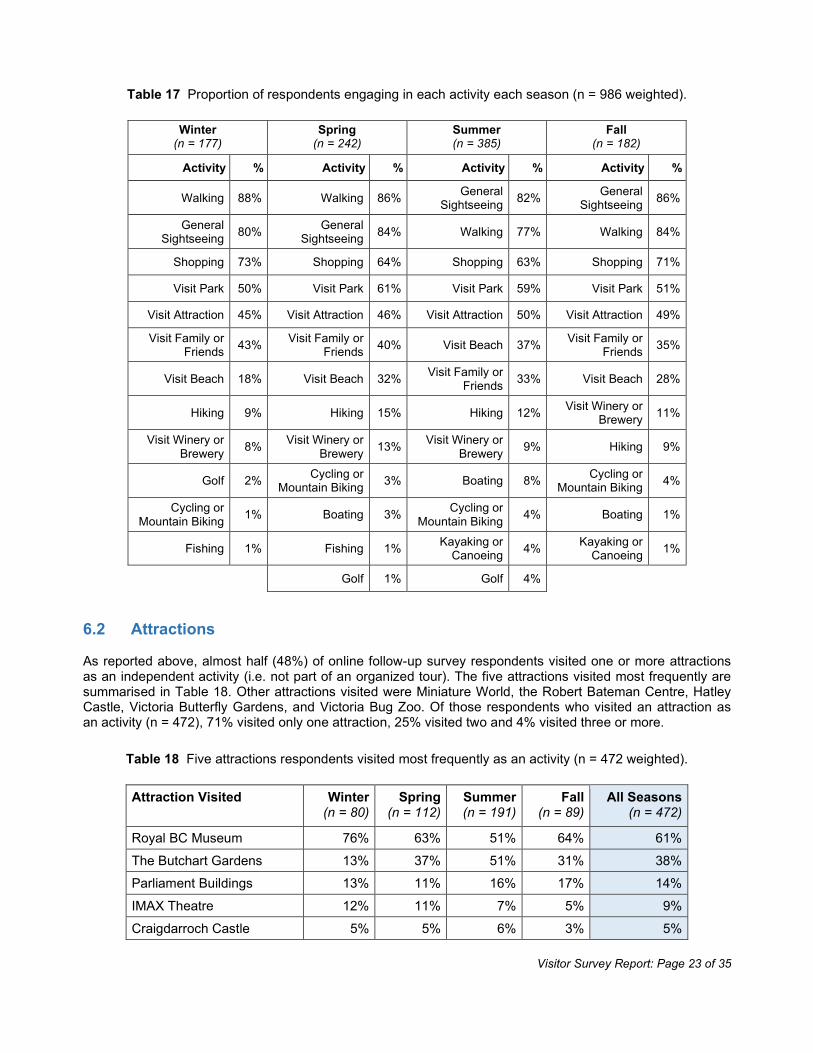
6.2 Attractions As reported above, almost half (48%) of online follow-up survey respondents visited one or more attractions as an independent activity (i.e. not part of an organized tour). The five attractions visited most frequently are summarised in Table 18. Other attractions visited were Miniature World, the Robert Bateman Centre, Hatley Castle, Victoria Butterfly Gardens, and Victoria Bug Zoo. Of those respondents who visited an attraction as an activity (n = 472), 71% visited only one attraction, 25% visited two and 4% visited three or more.
Table 18 Five attractions respondents visited most frequently as an activity (n = 472 weighted).
Attraction Visited Winter (n = 80)
Spring (n = 112)
Summer (n = 191)
Fall (n = 89)
All Seasons (n = 472)
Royal BC Museum 76% 63% 51% 64% 61%
The Butchart Gardens 13% 37% 51% 31% 38% Parliament Buildings 13% 11% 16% 17% 14%
IMAX Theatre 12% 11% 7% 5% 9%
Craigdarroch Castle 5% 5% 6% 3% 5%

Visitor Survey Report: Page 24 of 35
6.3 Tours Across all seasons 41% of respondents joined an organized and/or guided tour, most often a walking, whale watch or sightseeing tour (Figure 14). As was the case for activities, most tours were outdoors. Tour uptake was more seasonal than for activities and whereas 47% of respondents joined one or more tours in summer only 39% did so in winter. This difference could have been largely tied to tour availability as well as weather. Tours with particularly seasonal participation were whale watch tours, boat or sailing tours, horse & carriage tours, and winery or brewery tours (Table 19).
Figure 14 Tours that respondents participated in while visiting Greater Victoria (n = 986 weighted).
Table 19 Proportion of respondents participating in each type of tour each season (n = 986 weighted).
Winter
(n = 177) Spring
(n = 242) Summer (n = 385)
Fall (n = 182)
Tour % Tour % Tour % Tour %
Walking 21% Walking 17% Whale Watch 22% Walking 16%
Winery or Brewery 7% Sightseeing 13% Walking 13% Sightseeing 14%
Sightseeing 5% Whale Watch 10% Sightseeing 13% Whale Watch 13%
Boat or Sailing 2% Boat or Sailing 6% Boat or Sailing 10% Boat or Sailing 8%
Whale Watch 1% Winery or Brewery 5% Attraction 6% Winery or Brewery 4%
Horse & Carriage 1% Horse & Carriage 5% Winery or Brewery 3% Horse & Carriage 4%
Hiking 1% Attraction 3% Hiking 3% Attraction 4%
Attraction 1% Hiking 2% Horse & Carriage 2% Hiking 1%
Cycle or Mountain Bike 1% Cycle or Mountain
Bike 2% Cycle or Mountain Bike 2% Cycle or Mountain
Bike 1%
No Tour 71% No Tour 60% Kayak or Canoe 2% Kayak or Canoe 1%
No Tour 53% No Tour 58%
1%
1%
2%
3%
4%
4%
7%
12%
14%
16%
0% 2% 4% 6% 8% 10% 12% 14% 16% 18%
Cycle or Mountain Bike
Kayak or Canoe
Hiking
Horse & Carriage
Winery or Brewery
Attraction
Boat or Sailing
Sightseeing
Whale Watch
Walking
Visitor Survey Report: Page 25 of 35
Markedly fewer respondents visited an attraction on an organized tour (4%, n = 986) than as an independent activity (48%, n = 986). Low uptake of organized tours to attractions may have been because many of these are part of day trips to Greater Victoria which were excluded from the target sample. The attractions visited most frequently by overnight visitors on organized tours were The Butchart Gardens (53%), BC Legislature (30%), Craigdarroch Castle (16%) and Victoria Butterfly Gardens (5%).
7 Visitor Expenditure For the purpose of this research, visitor expenditure was defined as within-destination spending and did not include the costs of travel and associated expenses to get to and from Greater Victoria. Transportation costs referred to local transport only. To enable comparative analysis, expenditure by respondents and their travel party was converted (where necessary) into Canadian dollars (CAD$) using exchange rates when data were collected. Data from intercept interviews provided estimates of anticipated within-destination spending while data from online follow-up surveys provided actual spending. Travel parties usually ended up spending approximately 20% more than they estimated when interviewed during their visit; mean actual expenditure was $1,654 and mean anticipated expenditure was $1,392. This section summarizes allocations of respondents’ expenditure across various spending categories as well as how expenditure differed for a range of variables.
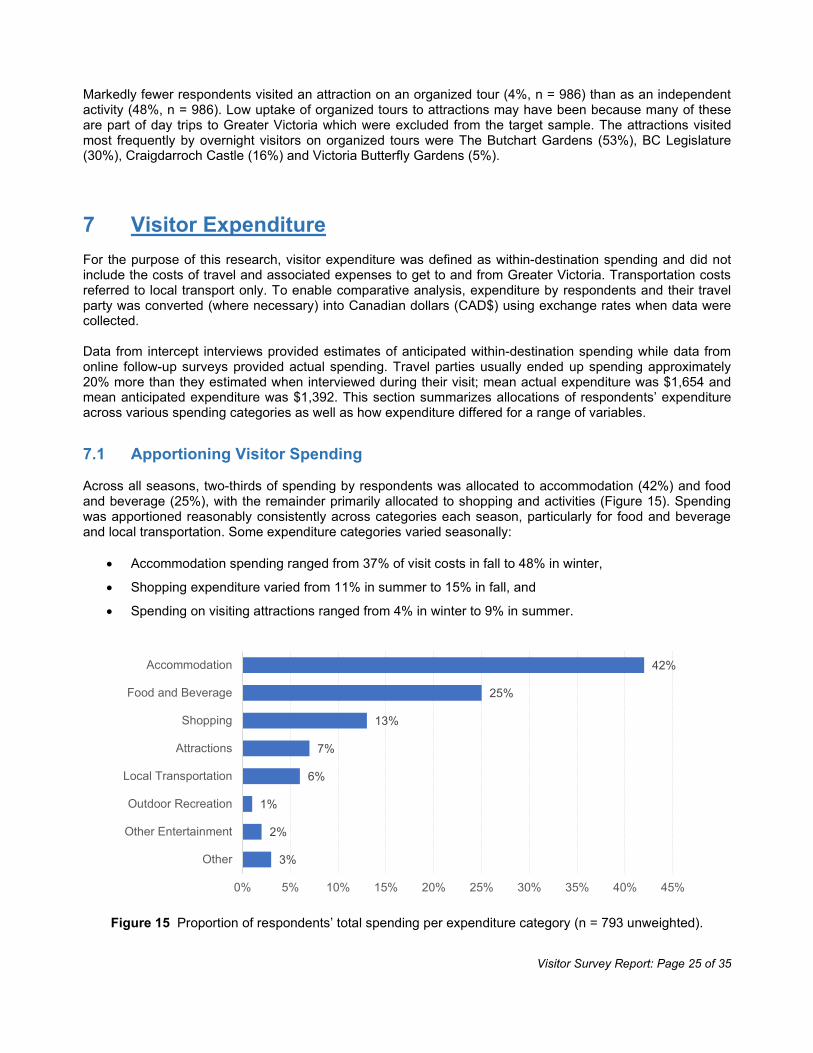
7.1 Apportioning Visitor Spending Across all seasons, two-thirds of spending by respondents was allocated to accommodation (42%) and food and beverage (25%), with the remainder primarily allocated to shopping and activities (Figure 15). Spending was apportioned reasonably consistently across categories each season, particularly for food and beverage and local transportation. Some expenditure categories varied seasonally:
• Accommodation spending ranged from 37% of visit costs in fall to 48% in winter,
• Shopping expenditure varied from 11% in summer to 15% in fall, and
• Spending on visiting attractions ranged from 4% in winter to 9% in summer.
Figure 15 Proportion of respondents’ total spending per expenditure category (n = 793 unweighted).
3%
2%
1%
6%
7%
13%
25%
42%
0% 5% 10% 15% 20% 25% 30% 35% 40% 45%
Other
Other Entertainment
Outdoor Recreation
Local Transportation
Attractions
Shopping
Food and Beverage
Accommodation

Visitor Survey Report: Page 26 of 35
7.2 Expenditure Per Visitor and Per Visitor Per Night Across all seasons, total visit expenditure per person averaged $710 while expenditure per person per night was $237 (Table 20). Average expenditure per person varied considerably each season, from $680 in spring to $888 during winter. Seasonal variation was primarily linked to spending on accommodation, shopping and attractions and to a lesser extent on food and beverage. Similarly, average expenditure per person per night varied seasonally, with lowest spending in spring and summer and highest spending in winter and fall. These results suggest revenues for many tourism businesses in Greater Victoria will be tied to their share of visitor volume each season.
Table 20 Mean CAD$ expenditure (a) per person and (b) per person per night (n = 793 unweighted).
Expenditure Category (CAD$ Per Person)
Winter (n = 131)
Spring (n = 256)
Summer (n = 184)
Fall (n = 222)
All Seasons (n = 793)
Accommodation (range: $0 to $6,250) $425 $275 $308 $244 $299
Food and Beverage (range: $0 to $1,750) $212 $184 $167 $168 $180
Shopping (range: $0 to $2,250) $102 $93 $77 $101 $93
Attractions (range: $0 to $850) $36 $49 $65 $48 $50
Local Transportation (range: $0 to $1,000) $50 $40 $43 $42 $43
Outdoor Recreation (range: $0 to $400) $7 $9 $10 $5 $8
Other Entertainment (range: $0 to $750) $19 $14 $5 $21 $15
Other (range: $0 to $3,000) $37 $17 $21 $24 $23
Expenditure Per Person (range: $0 to $7,750) $888 $680 $697 $652 $710
Median Duration of Visit 3 nights 3 nights 3 nights 2 nights 3 nights Expenditure Per Person Per Night $296 $227 $232 $326 $237
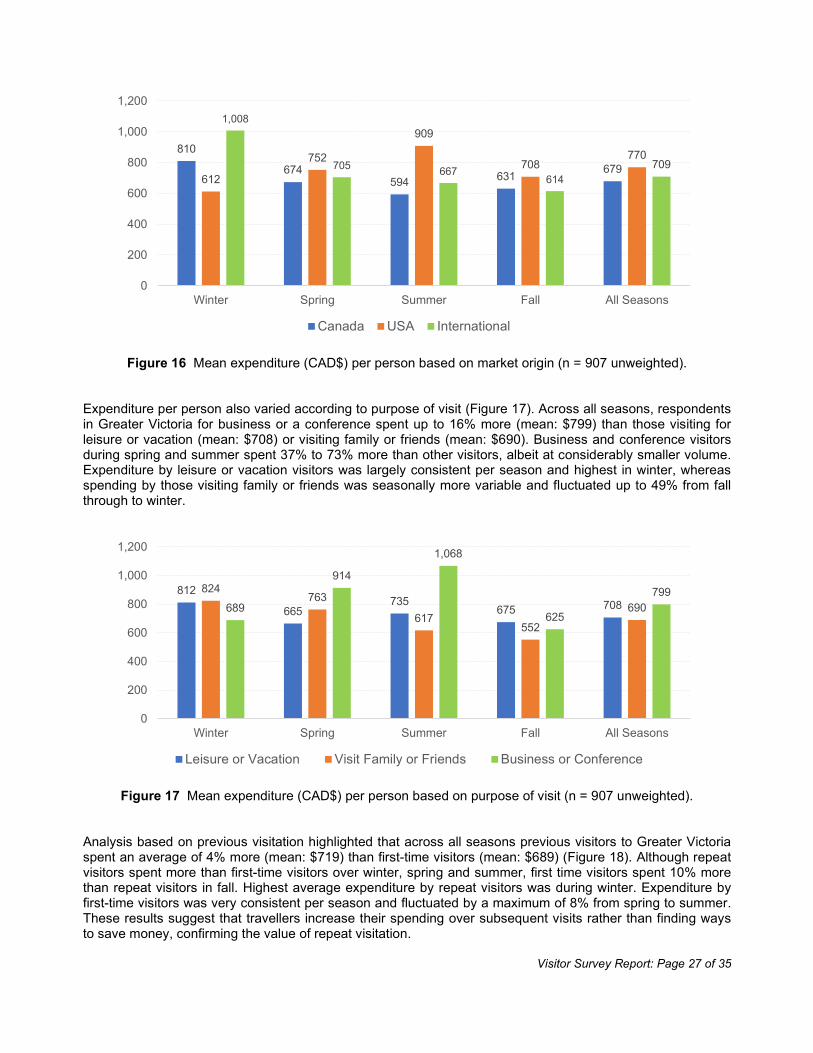
7.3 Expenditure Based on Visitor Variables Analysis showed variation in average expenditure per person according to market origin (Figure 16). Across all seasons, travellers from the USA spent more (mean: $770) than those from international locations (mean: $709) or Canada (mean: $679). This was also the case seasonally; visitors from the USA spent 12% to 53% more than others, although markedly less when visiting in winter. Travellers from Canada or international locations spent at reasonably consistent levels each season, except notably more than average when visiting in winter.
Visitor Survey Report: Page 27 of 35
Figure 16 Mean expenditure (CAD$) per person based on market origin (n = 907 unweighted).
Expenditure per person also varied according to purpose of visit (Figure 17). Across all seasons, respondents in Greater Victoria for business or a conference spent up to 16% more (mean: $799) than those visiting for leisure or vacation (mean: $708) or visiting family or friends (mean: $690). Business and conference visitors during spring and summer spent 37% to 73% more than other visitors, albeit at considerably smaller volume. Expenditure by leisure or vacation visitors was largely consistent per season and highest in winter, whereas spending by those visiting family or friends was seasonally more variable and fluctuated up to 49% from fall through to winter.
Figure 17 Mean expenditure (CAD$) per person based on purpose of visit (n = 907 unweighted).
Analysis based on previous visitation highlighted that across all seasons previous visitors to Greater Victoria spent an average of 4% more (mean: $719) than first-time visitors (mean: $689) (Figure 18). Although repeat visitors spent more than first-time visitors over winter, spring and summer, first time visitors spent 10% more than repeat visitors in fall. Highest average expenditure by repeat visitors was during winter. Expenditure by first-time visitors was very consistent per season and fluctuated by a maximum of 8% from spring to summer. These results suggest that travellers increase their spending over subsequent visits rather than finding ways to save money, confirming the value of repeat visitation.
810
674594 631 679
612
752
909
708770
1,008
705 667614
709
0
200
400
600
800
1,000
1,200
Winter Spring Summer Fall All Seasons
Canada USA International
812
665735
675 708824
763
617552
690689
914
1,068
625
799
0
200
400
600
800
1,000
1,200
Winter Spring Summer Fall All Seasons
Leisure or Vacation Visit Family or Friends Business or Conference

Visitor Survey Report: Page 28 of 35
Figure 18 Mean expenditure (CAD$) per person based on previous visitation (n = 906 unweighted).
8 Visitor Experience Data from online follow-up surveys provided various insights regarding respondents’ experiences of Greater Victoria. These included visitor satisfaction scores, how likely they were to recommend Greater Victoria as a destination to others, net promoter ratings, whether they were impacted by visitor volumes, highlights and/or shortcomings of their visit, and recommendations for how visits may be enhanced. Collectively such insights indicate how Greater Victoria is perceived by travellers and how well it delivers positive visitor experiences.
8.1 Visitor Satisfaction Respondents were requested to score their satisfaction with 11 attributes of their visit, as well as satisfaction overall, using a scale from 1 to 5 where 1 = “very dissatisfied” and 5 = “very satisfied”. Scores were high for all attributes across all seasons and also each season, with a score of 4.9 for overall satisfaction (Table 21). Table 21 Mean satisfaction scores (out of 5) for attributes of visits to Greater Victoria (n = 986 unweighted).
Attribute of Visit Winter (n = 169)
Spring (n = 324)
Summer (n = 219)
Fall (n = 274)
All Seasons (n = 986)
Atmosphere or Ambience (n = 983) 4.8 4.9 4.8 4.9 4.9 Frontline Staff (n = 725) 4.8 4.7 4.6 4.8 4.7 Outdoor Recreation (n = 672) 4.7 4.8 4.7 4.7 4.7 Entertainment, Arts and Culture (n = 718) 4.7 4.7 4.7 4.7 4.7 Accommodations (n = 916) 4.7 4.7 4.5 4.7 4.7 Attractions (n = 900) 4.6 4.7 4.6 4.7 4.7 Culinary (n = 808) 4.6 4.7 4.6 4.7 4.7 Information Services (n = 658) 4.5 4.6 4.5 4.7 4.6 Tours (n = 391) 4.3 4.5 4.4 4.6 4.5 Local Transportation (n = 545) 4.4 4.4 4.5 4.5 4.5 Shopping (n = 857) 4.4 4.4 4.3 4.5 4.4 Overall Trip Satisfaction (n = 986) 4.8 4.9 4.8 4.9 4.9
678 664 717 693 689
841716 731
630719
0
200
400
600
800
1,000
Winter Spring Summer Fall All Seasons
First Visit Previous Visit

Visitor Survey Report: Page 29 of 35
While high satisfaction scores are very positive, the values provided by the data do not readily indicate areas where the visitor experience could be improved. Analysis of where satisfaction was scored 1 or 2 or 3 (which was infrequent and no more than 15% of responses for any attribute) showed potential to improve in specific areas. Accommodation (in terms of affordability and/or quality) had the most scores of 1 or 2 (“very dissatisfied” or “dissatisfied”) followed by shopping, culinary and local transportation. Analysis including scores of 3 (“neither satisfied nor dissatisfied”) indicated potential for improvement was greatest for shopping, local transportation and information services, and to a lesser extent for accommodation and tours. Additional research would be necessary to pinpoint which aspects or features of these attributes should be addressed to build satisfaction. Although satisfaction scores ranged from 1 to 5 for all attributes, the high average and overall scores clearly suggest Greater Victoria is perceived as providing a very positive visitor experience.
8.2 Likelihood of Recommending Greater Victoria Using a scale from 0 (“Not at all likely”) to 10 (“Extremely likely”), respondents were requested to specify their likelihood of recommending Greater Victoria to others as a travel destination to visit. Across all seasons and also each season the mean score was 9.4 out of 10, confirming a very high likelihood of recommending the destination. In all seasons more than 90% of respondents scored their likelihood of recommendation as 8 or 9 or 10, which is consistent with visitor satisfaction scores reported above. Analysis of recommendation likelihood at finer scale showed that mean score increased almost linearly with age category of respondent, but decreased linearly as respondents’ household income increased. Although differences between scores were small, these results suggest Greater Victoria is likely to be recommended most by the age groups comprising the large majority of its visitors, but could do more to increase appeal to those with high household incomes.
8.3 Net Promoter Score Net promoter score (NPS) was calculated using respondents’ scores for likelihood of recommending Greater Victoria. As per standard practice, respondents who scored 9 or 10 are termed “promoters”, those scoring 7 or 8 are deemed “passives” and those scoring 6 or less are considered “detractors”. Net promoter score is calculated as the proportion of promoters less the proportion of detractors, and a NPS greater than zero is considered a good result. Net promoter score was 78 across all seasons and ranged from 74 in summer to 81 in fall (Table 22), which is very positive and aligned with visitor satisfaction scores. Perhaps not surprisingly, net promoter score for repeat visitors to Greater Victoria (NPS 81) was higher than for first-time visitors (NPS 76) across all seasons (Table 23).
Table 22 Respondents’ net promoter scores (n = 986 weighted).
Feedback Type Winter
(n = 177) Spring
(n = 242) Summer (n = 385)
Fall (n = 182)
All Seasons (n = 986)
Promoters 82% 83% 77% 84% 80% Passives 16% 15% 21% 13% 17%
Detractors 2% 3% 3% 3% 2%
Net Promoter Score 80 80 74 81 78

Visitor Survey Report: Page 30 of 35
Table 23 Net promoter scores for first-time visitors and repeat visitors (n = 986 weighted).
Feedback Type First-Time Visitors (n = 355)
Repeat Visitors (n = 631)
Promoters 78% 82%
Passives 19% 16% Detractors 2% 1%
Net Promoter Score 76 81
8.4 Impact of Visitor Volume Respondents indicated the extent to which their visit experience was impacted by visitor volumes in Greater Victoria by selecting one of five alternatives, ranging from “very negative” to “very positive”. As illustrated in Figure 19, for a vast majority (74%) of respondents across all seasons the volume of visitors present during their visit had no impact on the quality of their experience. This was also the case for most respondents per season, ranging from 68% in summer (which has seasonally the highest visitor volume) to 78% during winter (which has lowest visitor volume).
Figure 19 Impact of volume of visitors on respondents’ experience in Greater Victoria (n = 986 weighted).
Only 1% of respondents overall and per season, including summer, stated that the volume of visitors present had a very negative impact on their visitor experience. Overall, 8% of respondents reported a negative effect of visitor volume, ranging from 1% of respondents in winter to 15% in summer. In contrast, larger proportions of respondents – 17% overall, from 16% in spring and summer to 20% during winter – stated that the volume of visitors in Greater Victoria had a positive or very positive impact on the quality of their experience. Further research would be required to determine whether respondents perceived relatively high or low visitor volume as positive or negative. While lower volumes are often intuitively seen as positive, and vice-versa, it could be that too few visitors detracts from the visitor experience, particularly if low volume reduces products or services available. Similarly, a large number of visitors could ensure maximum products and services are available, which may enhance the visitor experience.
0% 10% 20% 30% 40% 50% 60% 70% 80% 90% 100%
Fall
Summer
Spring
Winter
All Seasons
Very Positive Positive No Impact Negative Very Negative
Visitor Survey Report: Page 31 of 35
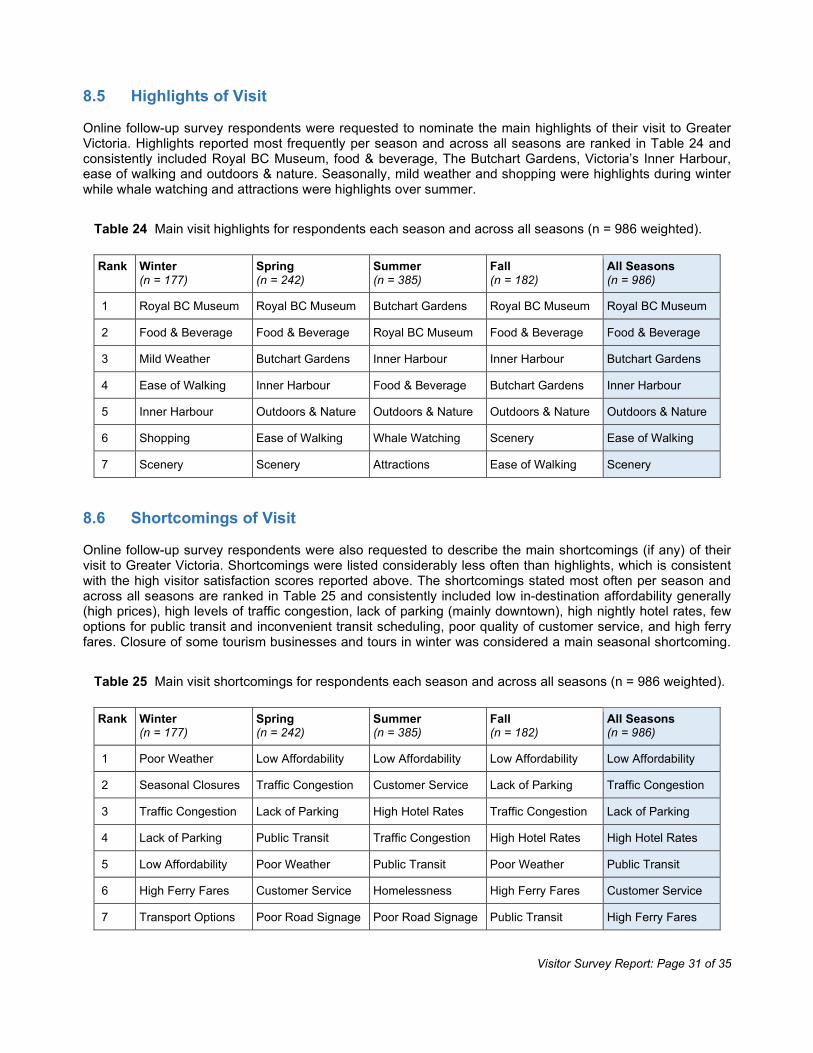
8.5 Highlights of Visit Online follow-up survey respondents were requested to nominate the main highlights of their visit to Greater Victoria. Highlights reported most frequently per season and across all seasons are ranked in Table 24 and consistently included Royal BC Museum, food & beverage, The Butchart Gardens, Victoria’s Inner Harbour, ease of walking and outdoors & nature. Seasonally, mild weather and shopping were highlights during winter while whale watching and attractions were highlights over summer.
Table 24 Main visit highlights for respondents each season and across all seasons (n = 986 weighted).
Rank Winter (n = 177)
Spring (n = 242)
Summer (n = 385)
Fall (n = 182)
All Seasons (n = 986)
1 Royal BC Museum Royal BC Museum Butchart Gardens Royal BC Museum Royal BC Museum
2 Food & Beverage Food & Beverage Royal BC Museum Food & Beverage Food & Beverage
3 Mild Weather Butchart Gardens Inner Harbour Inner Harbour Butchart Gardens
4 Ease of Walking Inner Harbour Food & Beverage Butchart Gardens Inner Harbour
5 Inner Harbour Outdoors & Nature Outdoors & Nature Outdoors & Nature Outdoors & Nature
6 Shopping Ease of Walking Whale Watching Scenery Ease of Walking
7 Scenery Scenery Attractions Ease of Walking Scenery
8.6 Shortcomings of Visit Online follow-up survey respondents were also requested to describe the main shortcomings (if any) of their visit to Greater Victoria. Shortcomings were listed considerably less often than highlights, which is consistent with the high visitor satisfaction scores reported above. The shortcomings stated most often per season and across all seasons are ranked in Table 25 and consistently included low in-destination affordability generally (high prices), high levels of traffic congestion, lack of parking (mainly downtown), high nightly hotel rates, few options for public transit and inconvenient transit scheduling, poor quality of customer service, and high ferry fares. Closure of some tourism businesses and tours in winter was considered a main seasonal shortcoming.
Table 25 Main visit shortcomings for respondents each season and across all seasons (n = 986 weighted).
Rank Winter (n = 177)
Spring (n = 242)
Summer (n = 385)
Fall (n = 182)
All Seasons (n = 986)
1 Poor Weather Low Affordability Low Affordability Low Affordability Low Affordability
2 Seasonal Closures Traffic Congestion Customer Service Lack of Parking Traffic Congestion
3 Traffic Congestion Lack of Parking High Hotel Rates Traffic Congestion Lack of Parking
4 Lack of Parking Public Transit Traffic Congestion High Hotel Rates High Hotel Rates
5 Low Affordability Poor Weather Public Transit Poor Weather Public Transit
6 High Ferry Fares Customer Service Homelessness High Ferry Fares Customer Service
7 Transport Options Poor Road Signage Poor Road Signage Public Transit High Ferry Fares

Visitor Survey Report: Page 32 of 35
8.7 Enhancing Visits Along with listing highlights and shortcomings of their visit, online follow-up survey respondents were invited to provide suggestions about ways of enhancing the visitor experience in Greater Victoria. Suggestions were provided by 21% of survey respondents (n = 986). Of respondents providing suggestions, 25% stated visits would be better if they could be for longer duration. Many acknowledged duration of visit was more within travellers’ control than a destination’s control, although a notable proportion also attributed shorter-than-optimal stays to high pricing and low affordability of visiting Greater Victoria for longer periods. Almost 20% suggested “better weather” would improve visits, but readily acknowledged this was beyond control. Other suggestions for enhancing the visitor experience, ranked from highest frequency (n = 16) to lowest frequency (n = 1), were:
• More information about attractions, tours or getting around. • Lower accommodation rates. • Better transit to or from gateways. • Less construction and traffic congestion. • More attractions or tour options. • More parking. • More food or entertainment options. • Lower ferry and local transport fares. • Better hotel or restaurant service. • Making Greater Victoria more affordable to visit. • Less panhandling downtown. • More hotel options. • More year-round travel options from the USA. • Access to ridesharing services such as Uber or Lyft. • Longer retail or restaurant hours. • Improved accessibility to facilities. • More businesses operating in slower seasons. • More public transit options. • Fewer billboards along highways. • Fewer protestors or activists. • Fewer tourists. • Less exploitation of indigenous culture. • More activities within walking distance of the inner harbour. • More ferry crossings. • More high-end shopping options. • Not paying for shopping bags.
Many of the suggestions for improvements were infrastructure oriented or referred to socio-economic issues at broader government or community scales. However, a sizeable proportion related to products or services within the ambit of the tourism and hospitality sector, and hence could be addressed on a cost-benefit basis by tourism businesses.
Visitor Survey Report: Page 33 of 35
9 Key Insights Based on the dataset provided by both surveys, which is considered robust as well as representative, various insights can be drawn from analyses: Each season (winter, spring, summer, fall) there are more female than male overnight visitors to Greater
Victoria. Over the full year the ratio is approximately 1.2 females per male. Gender mix is most disparate in winter and spring, and most similar during summer.
Two-thirds of overnight visitors to Greater Victoria are more than 44 years of age, while almost half are from 55 to 74. Proportions did not vary greatly between seasons, indicating this older demographic is a core characteristic of Greater Victoria’s visitor profile.
Almost two-thirds of overnight visitors have stayed in Greater Victoria previously and more than 40% of visitors have stayed at least once, usually twice, within the past two years. Although repeat visitation is highest in winter and less frequent during summer, at any time of the year a large proportion of visitors have also stayed reasonably recently and are likely to be familiar with the destination.
Overall, half of all overnight visitors to Greater Victoria are from within Canada (primarily BC, Alberta or
Ontario), almost one-third are from the USA (mainly Washington, California or Oregon), and one in five are from international locations (mostly the United Kingdom, Australia or Germany).
The mix of overnight visitors from within Canada, the USA and international locations varies seasonally. Visitation from within Canada is proportionally greater in winter and spring, while visitation from the USA or international locations is highest in summer and fall. This variation may be reflected in differences in types of accommodation used, modes of arrival, activities engaged in, or visitor expenditure per season.
The market origins of overnight visitors each season and across all seasons confirm Greater Victoria is primarily a short-haul destination, largely from lucrative markets such as Vancouver, Seattle, Calgary and San Francisco.
Average travel party size for overnight visitors is two. The large majority of travel parties comprise either immediate family (spouses, partners, parents, children) or friends, regardless of age. Solo travellers are often female, visiting family or friends or for business, and unlikely to be from the USA.
Relatively few overnight visitors are part of an organized group or tour. Most visitors who are part of an organized group or tour are international travellers rather than from within Canada or the USA.
More than half of Greater Victoria’s overnight visitors have an annual household income of CAD$50,000 to $150,000, and a further 25% have household income exceeding CAD$150,000. A sizeable proportion of Greater Victoria’s visitor base can therefore be considered as having above-average income.
Although many overnight visitors are visiting family or friends or for business or a conference (and could have been under-represented in the sample due to data collection methods), Greater Victoria is primarily a leisure and vacation destination each season. Greater Victoria is also the main or only trip destination for the large majority of visitors per season, although to a lesser degree over summer when trips away from home tend to be longer and include more locations.
On average, during each season except fall overnight visitors stay three nights in Greater Victoria, while in fall the average is two nights. During their visit only approximately one in three visitors travel to areas of Vancouver Island outside Greater Victoria, indicating there is scope to increase length of stay as well as dispersion to other areas of Vancouver Island, possibly with multi-day self-drive itineraries, alongside visits to Greater Victoria.

Visitor Survey Report: Page 34 of 35
Most overnight visitors plan their visit to Greater Victoria approximately two months in advance, although this increases to three months for visits during summer given the relatively greater proportion of US and international travellers visiting at that time. Information services provided by Destination Greater Victoria are used by two of five overnight visitors before or during travel.
More than two-thirds of overnight visitors arrive in Greater Victoria on BC Ferries or by flight into Victoria International Airport. This proportion is consistent each season and highest over winter. Arrivals by ferry from the USA are markedly more seasonal, peaking in summer and considerably less frequent in winter. More than two thirds of visitors arriving on BC Ferries travel with a vehicle.
Two-thirds of overnight visitors to Greater Victoria stay in a hotel, motel, bed & breakfast or hostel, while the remainder stay in a short-term vacation rental or with family or friends. Travellers from within Canada are more likely than other visitors to stay with family or friends; those from the USA are more likely than others to stay in a vacation rental.
Almost 70% of visitors who stay in commercial accommodation (rather than with family or friends) book their accommodation online themselves. Third-party bookings for accommodation are usually by tour or transportation operators, or by an association for conference visitors. Relatively few visitors use a travel agent to book their accommodation. Visitors booking their commercial accommodation themselves most frequently use an OTA or travel booking website, although one in three book directly through a property’s website.
Visitors to Greater Victoria typically engage in a wide range of activities; although these vary seasonally, many are outdoors or attractions oriented. The vast majority engage in walking and general sightseeing, and two-thirds spend time shopping.
Almost half of all overnight visitors visit an attraction as an independent activity rather than an organized tour; attractions visited most often are the Royal BC Museum, The Butchart Gardens and the Parliament Buildings. Approximately 15% of visitors visit two or more attractions while one-third visit only one.
Uptake of organized or guided tours is more seasonal than most other aspects of overnight visits and is greatest for outdoor activities over summer, including whale watching, walking, sightseeing and boating. Over the full year approximately 40% of overnight visitors join one or more tours, although relatively few involve visiting attractions.
Two-thirds of visitor spending is allocated to accommodation (42%) and food and beverage (25%), with a further 13% spent on shopping. Whereas allocation of spending to accommodation or shopping varies considerably each season, spending on food and beverage and local transportation is highly consistent.
Expenditure per overnight visitor averages CAD$710 over the year and ranges from $652 in summer to $888 in winter. Expenditure per visitor per night averages $237 over the year, from $232 during summer to $326 in fall.
Visitor expenditure varies seasonally according to market origin, purpose of visit and previous visitation. Visitors from the USA spend more than others each season except for winter. Business or conference visitors spend more than others during spring and summer and also across the year (albeit with smaller volume) while spending by leisure and vacation visitors is consistent each season, averaging CAD$708 per person over the year. Repeat visitors typically spend more than those visiting for the first time.
Overnight visitors perceive that Greater Victoria delivers a very positive visitor experience across a wide range of attributes, particularly ambience, frontline staff, outdoor recreation, entertainment, arts, culture, accommodation, attractions, and culinary. High satisfaction scores for such a diverse range of attributes indicate Greater Victoria is seen as a vibrant, multi-faceted destination that appeals to a broad range of travellers. Opportunities to improve visitor satisfaction are mainly regarding accommodation affordability and quality, shopping and culinary options, and information and local transportation services.

Visitor Survey Report: Page 35 of 35
Visitors are very likely to recommend Greater Victoria to others as a travel destination and net promoter scores are high, particularly for repeat visitors, despite some seasonal variation.
For the large majority of overnight visitors, the volume of visitors present in Greater Victoria has little or no impact on the quality of their visitor experience. Lack of impact varies seasonally from 68% of visitors during summer (where volume is highest) to 78% in winter (where volume is lowest). Furthermore, each season the number of visitors perceiving the prevailing volumes as having positive impacts exceeds the number deeming them negative, also indicating that Greater Victoria is seen as delivering a high quality experience for overnight visitors.
Despite the above, it should be noted that in summer up to 15% of overnight visitors perceive the volume
of visitors in Greater Victoria has a generally negative impact on their experience. Although not currently detracting from visitor satisfaction scores or likelihood of recommending the destination, this should be monitored to ensure impacts are understood.
Highlights of Greater Victoria for overnight visitors are primarily non-seasonal and include the Royal BC Museum, food and beverage, The Butchart Gardens, Victoria’s Inner Harbour, outdoors and nature, and ease of walking. Shortcomings are low affordability, traffic congestion, lack of parking, high nightly hotel rates, limited public transit options, poor customer service and high ferry fares. However, highlights are mentioned much more frequently than shortcomings, indicating positive visitor experiences.
Affordability, in terms of accommodation, food and beverage, attractions, tours and local transportation, may be an increasingly important factor impinging upon or limiting duration of overnight stays in Greater Victoria. Efforts to mitigate this by adding further value to the visitor experience are likely to deliver solid returns on investment.
Although it is valuable to interview visitors while they are within a destination, to compile a complete and more accurate record of their visit (including their activities, spending and trip satisfaction) it can be very beneficial to also engage with them shortly after they have returned home and had time to reflect on the visit.
To develop a comprehensive understanding of overnight visitation within a destination it is imperative to acquire data across the full year and particularly seasonal periods. Visitation will rarely, if ever, have the same characteristics throughout the year and information regarding seasonal nuances will help identify opportunities to manage visitation seasonally while fine-tuning decision making.

Greater Victoria Visitors & Convention Bureau200 737 Yates Street
Victoria, B.C. V8W 1L6