2019 URBAN ENERGY REPORT THE LIMITS TO RENEWABLE …
48
THE LIMITS TO RENEWABLE ENERGY 2019 URBAN ENERGY REPORT
Transcript of 2019 URBAN ENERGY REPORT THE LIMITS TO RENEWABLE …
TH E L I MI TS TO R E NE WAB LE E NE RGY
2019UR B A N E NERGYR E PO RT

iii
URBAN INSIGHT 2019
URBAN ENERGY
THE LIMITS
TO RENEWABLE
ENERGY

1
URBAN INSIGHT 2019
URBAN ENERGY
THE LIMITS
TO RENEWABLE
ENERGY
1
THE L IMITS
TO RENEWABLE
ENERGY
TANJA GROTH
VIJAY SHINDE
ROBIN MEADE
PANAGIOTIS KEFAL A S

URBAN INSIGHT 2019
URBAN ENERGY
THE LIMITS
TO RENEWABLE
ENERGY
WHAT WOULD A WORLD WITH A 100 PER CENT RENEWABLE ENERGY MIX LOOK LIKE? AND WHICH ARE THE LIMITS TO INTEGRATE RENEWABLE ENERGY?
2

1 INTRODUCTION 4
2 CASE STUDY: FAMILY ROAD TRIP IN EUROPE 6
3 DIFFERENT RENEWABLES IN DIFFERENT COUNTRIES? 14
4 WHY CAN’T WE ALL BE LIKE COSTA RICA? 20
5 CHALLENGES TO ACHIEVING MAXIMUM
PENETRATION OF RENEWABLE ENERGY 30
6 CONCLUSIONS AND RECOMMENDATIONS 38
7 ABOUT THE AUTHORS 42
CONTENTS
3
URBAN INSIGHT 2019
URBAN ENERGY
THE LIMITS
TO RENEWABLE
ENERGY
44
In October 2018, the Intergovernmental Panel on Climate Change (IPCC) published a special report on the effects of global average temperature rising by 1.5ºC.1 The report summarised the consequences of reaching or exceeding a 1.5ºC average increase in global average temperatures by 2050. It estimated that a net 1ºC increase in global average tempera-ture has already happened. However, the IPCC argued that the most severe effects of this warming could be avoided if action was taken.
Common examples of climate mitigation include reducing energy demand and shifting energy production from fossil fuels to renewable energy. For example, access to affordable, reliable, sustainable and modern energy for all is one of the United Nation’s Sustainable Development Goals. But what are the limits to integrating renewable energy? And what does a world with a 100 per cent renewable energy mix look like?”
The recent global School Strikes 4 Climate Action, #FridaysForFuture, which has become a growing movement in Europe, demonstrate that the younger generation is aware of the scale of the challenge we are facing, which begs the question, “What it is that is holding us back?”
The way we produce and use energy today is a legacy of the Industrial Revolution, where the use of first coal, then oil and gas, revolutionised transport and industrial processes, gradually filtering through to house-hold use of electricity, heating and transport. However, this energy system had unintended consequences, primarily as a result of the combustion and extraction of fossil fuels.
1.INTRODUCTION
URBAN INSIGHT 2019
URBAN ENERGY
THE LIMITS
TO RENEWABLE
ENERGY
1) The Intergovernmental Panel on Climate Change (IPCC): https://www.ipcc.ch/sr15/2) Division for Sustainable Development Goals (DSDG) https://sustainabledevelopment.un.org/milestones/humanenvironment
In 1972 the first UN Conference on the Human Environment was held in Stockholm, with 122 countries attending.
The resulting “Stockholm Declaration” covered 26 principles concerning the environment and development and is seen as the foundation for more recent climate agreements such as the Kyoto Protocol and the Paris Agreement.2
5
“CLIMATE CHANGE RESEARCH SUGGESTS THAT TIME IS RUNNING OUT TO MAKE THE NECESSARY CHANGES TO CONSUMPTION TO MINIMISE THE EFFECTS OF A WARMING WORLD.”
Forty years ago, we began to articulate the scale and severity of the impact of energy consumption patterns.
Dealing with climate change may seem complicated given the vast amounts of conflicting advice on the best route forward and the number of experts (certified or self-proclaimed) providing well-meaning but contradictory recommendations.
Losing weight is also subject to multiple opinions and any number of well-meaning experts providing conflicting advice. In essence though, it is simple – eat more vegetables, drink more water, exercise more. Dealing with climate change is the same – use less energy, recycle more, generate less waste.
In terms of energy use, you could ask what generates the least waste – pumping gas from the North Sea, processing it, transporting it hundreds and thousands of kilometres and then converting a proportion of it to energy? Or capturing locally available energy and using it within tens and hundreds of kilometres?
Renewable energy generation costs the same as conventional energy such as coal and oil. Renewable energy is readily available – in one form or another – in every country in the world. The technologies needed to convert renewable energy are proven and readily available. Widespread adoption of as much fossil-free energy as possible in as short a time-frame as possible is crucial to preventing irreversible damage to the world and our way of life.
So, why does renewable energy not play a greater role in our everyday lives?
5
URBAN INSIGHT 2019
URBAN ENERGY
THE LIMITS
TO RENEWABLE
ENERGY

66
2.CASE STUDY: FAMILY ROAD TRIP IN EUROPE
URBAN INSIGHT 2019
URBAN ENERGY
THE LIMITS
TO RENEWABLE
ENERGY

7
URBAN INSIGHT 2019
URBAN ENERGY
THE LIMITS
TO RENEWABLE
ENERGY

8
URBAN INSIGHT 2019
URBAN ENERGY
THE LIMITS
TO RENEWABLE
ENERGY
The Smith family – Chris, 43, Madeleine, 45, Sophie, 14, and Danny, 12 – decided to spend two weeks during the summer of 2018 driving from their home in Barnsley (outside Leeds) to Scandinavia, stopping in Stavanger, Gothenburg and Copenhagen.
Chris had family on his grandmother’s side originating from Norway and, following a family obsession with the Amazon Prime series Vikings, the entire family was keen to get a “real” taste of Scandinavian culture.
Following weeks of planning, they mapped their route that would take them by ferry from Harwich to the Netherlands, through Bremen and Hamburg in Germany, Legoland in Denmark and by ferry to Kristiansand in Norway, with a final stop in Stavanger. Danny was insistent that they stop by Legoland in Billund on their way through Denmark as he was a massive Lego fan and wanted to see the original “Home of the Brick”.
The family bought a new hybrid car in 2017 and were curious to see how well it would perform on a long drive. Sophie was planning to map the car’s fuel efficiency as a summer maths project – she had made a deal with her father that if she did a good job calculating the average and peak fuel performance for different stretches of the trip, he would get her the new iPhone for her birthday.
The return trip would take them across to Sweden, following the coastline to Copenhagen in Denmark, heading down through Cologne in Germany to Brussels in Belgium through the EuroTunnel at Calais to Dover and back up to Leeds.
Sophie was not thrilled to be doing a maths project during the holidays, but she was very keen to get the new iPhone. Chris was an accountant by trade and sat down with her before the trip to set the parameters of her maths project. She would start with the car manufacturer guidelines for fuel consumption and compare the mileage and petrol consumption at each stop during the trip.
Ill. 1–2: The Smith family looking at a map.

9
URBAN INSIGHT 2019
URBAN ENERGY
THE LIMITS
TO RENEWABLE
ENERGY
The family’s route from Leeds to Harwich takes them through a series of small, historic villages of distinctive character, whose residential streets include a notable coverage of roof-mounted solar photovoltaic (PV) panels.
Travelling along motorways, wind turbines are seen within a mosaic of farmland, large-scale commercial development and overhead power lines supplying power to cities.
Madeleine keeps an eye out for solar PV panels and windfarms as she is a planning officer for Leeds City Council. There is widespread concern regarding the visual impact of renewable energy projects on the landscape in Leeds, and she is curious to learn what is considered acceptable in other countries. In the UK there remains a sizeable proportion of the population that feels that onshore wind turbines blight the landscape and would prefer them to be in someone else’s line of sight.
Ill. 3: Renewable energy is readily available – in one form or another – in every country in the world.
3) Climate X Change. The University of Edinburgh. (2014). Community Benefits from Offshore Renewables: Good Practice Review.
4) Haggett, Claire. (2009). “Planning and Persuasion”: Public Engagement in Renewable Energy Decision-making. Renewable Energy and the Public: From NIMBY to Participation. 15-28.
The term “NIMBY” (Not in My Back Yard) refers to the way in which people respond to development through their perceptions, emotions and attachment to the landscape.
It is recognised that renewable energy is linked to concerns such as the visual, noise and flicker effects from wind turbines or glare from solar panels, which may in turn present unwelcome associations with certain types of development.
However, research indicates that while most people are concerned about inappropriate development in an area, they are not against all development, and that with engagement and consultation people’s perceptions can change and be more accepting of changes to their local landscape.
Part of this engagement and consultation process increasingly includes the use of 3D images and visualisations of proposed energy developments.3, 4

10
URBAN INSIGHT 2019
URBAN ENERGY
THE LIMITS
TO RENEWABLE
ENERGY
As the Smiths travel from the UK to Germany, rooftop solar PV panels become increas-ingly numerous. The family plays a game of spotting the next rooftop solar panel, with Danny spotting the most – 65 – on a single stretch.
As the trip continues from Germany to Denmark, solar rooftop panels become less com-mon and are instead replaced by solitary wind turbines and windfarms. By this point Sophie and Danny have got quite into their game of spotting solar panels, so they are a bit disappointed with the change in scenery, although Madeleine is quite intrigued by the reasons underlying the change in “renewable scenery”.
THE CHANGING INFLUENCE OF ENERGY PRODUCTIONThe family’s experience of renewable energy on their travels touches on several themes common to varying methods of energy generation.
Conventional power generation tends to be centralised, for example through petrol stations for refuelling vehicles and household gas or oil heating. Petrol stations have become so ubiquitous over time that they are almost invisible in cityscapes. Likewise conventional power production tends to be centralised and heating is either largely produced within buildings, supplied by national distribution systems or district heating systems.
While the scale of renewable energy generation installations is, in many instances, comparable to that of non-renewable plants, there are more differences than similarities.
Non-renewable production is associated with extraction and processing infrastructure, degraded landscapes and waste products associated with energy production.
Renewable energy production is typically close to its energy sources, (hydro on rivers, geothermal to accessible thermal resources, small-scale biomass close to forests or in agricultural heartlands). Wind turbines are perhaps the most visually impactful and least integrated with their surroundings.
Ill. 4 (above left): A building featuring a vertical solar façade.
Ill. 5 (above right): Houses with rooftop solar panels and wind turbines.

11
URBAN INSIGHT 2019
URBAN ENERGY
THE LIMITS
TO RENEWABLE
ENERGY
The Smith family’s first sight of offshore wind energy is from a ferry on departure from Harwich, whilst passing the Great Gabbard and Galloper wind farms off the east coast of England. This experience is repeated at several locations on their journey around Europe.
Off-shore wind energy is rapidly becoming a defining feature of coastal and off-shore waters. Historically, the influence of sea-based infrastructure was largely associated with oil and gas exploration offering a relatively dispersed and remote built presence in the seascape. The scale and extent of offshore wind generation is now adding a new level of “development” to the seascape environment.
The effect of this seascape “urbanisation” is most directly experienced by people living, working or engaging in recreational activities by or on the sea.
The presence of wind turbines has the potential to change perceptions of openness and remoteness that are otherwise associated with the seascape environment.
Although offshore windfarms are visually difficult to integrate into an ocean horizon, they are typically positioned to take advantage of wind conditions and grid access points.
Ill. 6: Silhouette with wind turbines.

12
URBAN INSIGHT 2019
URBAN ENERGY
THE LIMITS
TO RENEWABLE
ENERGY
WHY ELECTRIC VEHICLES ARE SO COMMON IN NORWAYWhile driving through Norway, the Smith family starts to notice a growing number of electric vehicles (EV). Norway is the leading market for electric vehicles, and it continues to show the rest of the world how rapidly electric vehicle adoption can happen.
In 2018, EV sales grew by 40 per cent in Norway, and one out of three vehicles sold was zero-emission.
According to the Norwegian Road Traffic Information Authority (OFV), of the 148,000 new passenger vehicles registered in 2018, 31 per cent were all-electric. If we include all plug-in vehicles, this number increases to 49 per cent.
While electric cars are increasingly noticeable in most capital cities, the sheer number in Oslo and throughout the rest of the country can surprise visitors. The Norwegian parliament has set 2025 as the goal for all new cars to have zero emissions, compared with the UK’s 2040 target and Germany’s target of 2030.
While motorists in Norway are typically subject to punitive levels of taxation, those who buy purely electric vehicles are rewarded with a string of incentives worth thousands of euros. Buyers of electric vehicles avoid heavy import and purchase taxes, and are also exempt from 25 per cent VAT. They also avoid road tax, road tolls, pay half price on ferries, get free municipal parking in cities and can usually use bus lanes.
Ill. 7–8: Electrical Cars are a common sight in Norway.
13
URBAN INSIGHT 2019
URBAN ENERGY
THE LIMITS
TO RENEWABLE
ENERGY
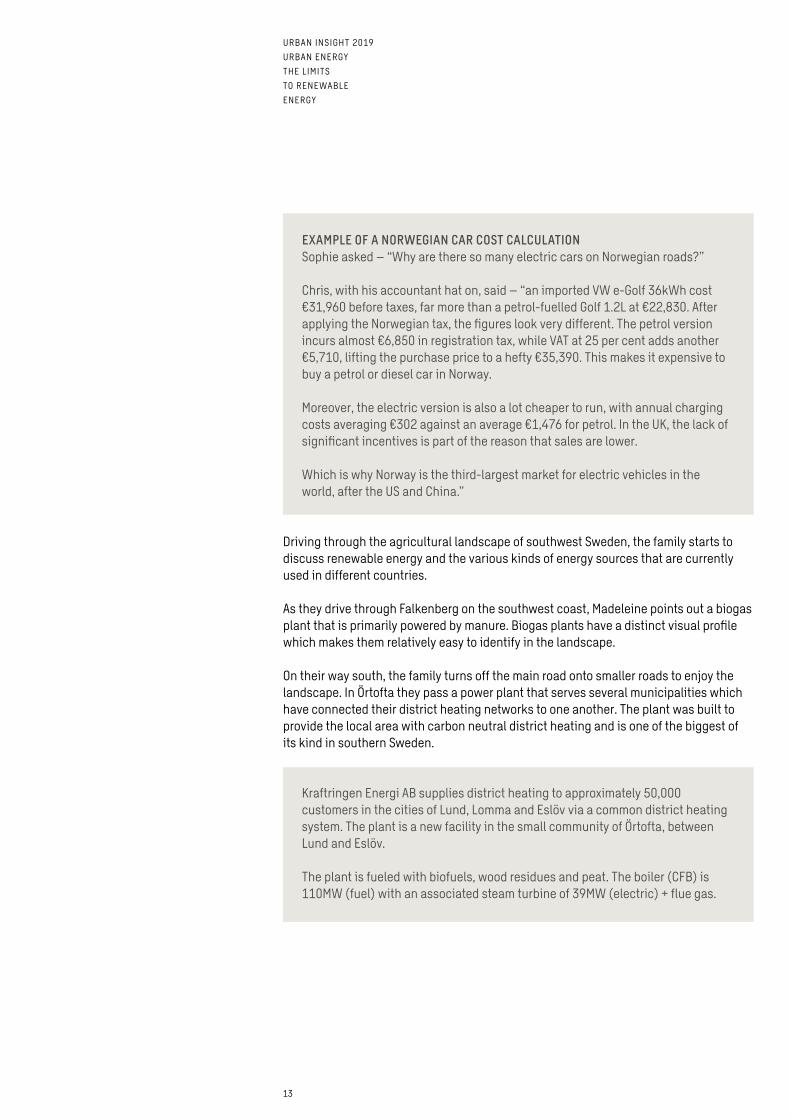
Driving through the agricultural landscape of southwest Sweden, the family starts to discuss renewable energy and the various kinds of energy sources that are currently used in different countries.
As they drive through Falkenberg on the southwest coast, Madeleine points out a biogas plant that is primarily powered by manure. Biogas plants have a distinct visual profile which makes them relatively easy to identify in the landscape.
On their way south, the family turns off the main road onto smaller roads to enjoy the landscape. In Örtofta they pass a power plant that serves several municipalities which have connected their district heating networks to one another. The plant was built to provide the local area with carbon neutral district heating and is one of the biggest of its kind in southern Sweden.
EXAMPLE OF A NORWEGIAN CAR COST CALCULATIONSophie asked – “Why are there so many electric cars on Norwegian roads?”
Chris, with his accountant hat on, said – “an imported VW e-Golf 36kWh cost €31,960 before taxes, far more than a petrol-fuelled Golf 1.2L at €22,830. After applying the Norwegian tax, the figures look very different. The petrol version incurs almost €6,850 in registration tax, while VAT at 25 per cent adds another €5,710, lifting the purchase price to a hefty €35,390. This makes it expensive to buy a petrol or diesel car in Norway.
Moreover, the electric version is also a lot cheaper to run, with annual charging costs averaging €302 against an average €1,476 for petrol. In the UK, the lack of significant incentives is part of the reason that sales are lower.
Which is why Norway is the third-largest market for electric vehicles in the world, after the US and China.”
Kraftringen Energi AB supplies district heating to approximately 50,000 customers in the cities of Lund, Lomma and Eslöv via a common district heating system. The plant is a new facility in the small community of Örtofta, between Lund and Eslöv.
The plant is fueled with biofuels, wood residues and peat. The boiler (CFB) is 110MW (fuel) with an associated steam turbine of 39MW (electric) + flue gas.

1414
3.DIFFERENT RENEWABLES IN DIFFERENT COUNTRIES?
URBAN INSIGHT 2019
URBAN ENERGY
THE LIMITS
TO RENEWABLE
ENERGY

15
URBAN INSIGHT 2019
URBAN ENERGY
THE LIMITS
TO RENEWABLE
ENERGY

16
URBAN INSIGHT 2019
URBAN ENERGY
THE LIMITS
TO RENEWABLE
ENERGY
WHY ARE THERE DIFFERENCES BETWEEN TYPES OF RENEWABLE ENERGY USED IN EUROPEAN COUNTRIES?During their road trip, the Smith family noticed significant differences in the kinds of renewable energy that were visible in each country.
A number of factors can explain a country’s preference for one type of technology over another. Academic research indicates that growth in renewable energy in any specific country is less motivated by climate change concerns or fossil fuel costs, and more by the presence of strong lobby groups looking to support national industry.5
National industry is in turn more likely to have grown where there are natural resources to support the early development of an industry, as seen in the biomass boiler industry in Austria and the wind turbine industries in Germany and Denmark. Conversely, the popularity of electric vehicles in Norway, as described in the previous chapter, exists despite Norway lacking a domestic car industry.
Public interest and acceptance for particular types of renewable energy are driven by multiple factors, including support of local jobs and industry, visual impacts and public awareness of climate change. The graph below illustrates the relative popularity of two established car brands, Audi and BMW, against two well-known electric cars, Tesla and the Nissan Leaf. Search results for electric cars (“Elbil”) are included for comparison.
Tesla has performed exceptionally well in selected markets, with a brand recognition far beyond anything the electric vehicle industry – or the renewable energy industry – has seen before. In Norway, it took a relatively short time before Tesla became as established as other established car brands, such as Audi and BMW.
5) Marques, António C., Fuinhas, José A., Manso, J.R. Pires, 2010. Motivations driving renewable energy in European countries: A panel data approach. Energy Policy 38, 6877–6885. Marques, António C., Fuinhas, José A., 2011. Drivers promoting renewable energy: A dynamic panel approach. Renewable and Sustainable Energy Reviews, Vol. 15, 1601–1608.
Ill. 9: Data sourced from Google Trends.
0
20
40
60
80
100
Relative popularity (max = 100)
BMW
Audi
Nissan Leaf
Elbil
Tesla
2019-012018-012017-012016-012015-012014-012013-012012-012011-012010-012009-01
Tesla Elbil Nissan Leaf Audi BMW
GOOGLE TREND SEARCH RESULTS (NORWAY)

17
URBAN INSIGHT 2019
URBAN ENERGY
THE LIMITS
TO RENEWABLE
ENERGY
Other changes in renewable energy are more significant but have been comparatively unnoticed. Direct purchasing from companies has increased in line with the importance of sustainability and green procurement in multinational corporations. For example, growth in corporate purchase power agreements is driving a new wave of renewables investment. Lego are now buying 100 per cent of their electricity from renewable sources, having invested in the Burbo Bank Offshore wind farm.6
LEGISLATION UNDERPINNING NATIONAL DIFFERENCESThe European Union (EU) is backing renewable energy alternatives, with European-wide legislation committing member states to reduce primary energy consumption, reduce greenhouse gas emissions and increase the share of renewables in the energy supply.Meeting targets set by EU Directives should help keep global average temperature increases below two degrees Celsius, but will be insufficient without similar initiatives on a global scale.7
6) Offshore WIND: https://www.offshorewind.biz/2017/05/17/burbo-bank-extension-brings-lego-to-100-renewables-goal/ 7) Climate Action Tracker: https://climateactiontracker.org/publications/scalingupeu/
RENEWABLE ENERGY DIRECTIVE 2009/28/EC To address concerns over future energy supply in Europe, the EU established the 20-20-20 climate and energy targets in 2009:
• A minimum reduction of greenhouse gas emissions of 20% below 1990 levels• A 20 per cent share of energy consumption to come from renewable energy
sources• A 20 per cent reduction in primary energy usage, primarily from increased
energy efficiency
All these targets were to be achieved by 2020 for the EU as a whole. Each indi-vidual EU country is bound by different targets, reflecting the level at which it started in 2007.
Renewable Energy Directive (EU) 2018/2001 and Energy Efficiency Directive (EU) 2018/2002
In December 2018, the 2009 Directive was replaced in favour of establishing a 32 per cent renewable energy target by 2030 and a 32.5 per cent energy efficiency target by 2030, maintaining and building on the 2020 targets for each country.

18
URBAN INSIGHT 2019
URBAN ENERGY
THE LIMITS
TO RENEWABLE
ENERGY
8) National Renewable Energy Action Plans (European Commission): https://ec.europa.eu/energy/en/topics/renewable-en-ergy/national-action-plans
9) European Environment Agency: https://www.eea.europa.eu/data-and-maps/indicators/use-of-cleaner-and-alterna-tive-fuels/use-of-cleaner-and-alternative-4
The graphs below show the 2020 renewable energy targets for the countries visited on the Smith family road trip, against a 2010 starting point and actual achieved renewable energy in 2017.
It is worth noting that while renewables’ share of total electricity is roughly on track to meet the 2020 targets, the share of renewable heating and cooling has already exceeded 2020 targets for several countries (Denmark, France, the Netherlands, Norway and Sweden). However, targets for heating were set significantly lower than targets for electricity. While some progress has been made on electricity and heating targets, transport continues to lag behind as demonstrated in the graph below.
Ill. 10: 2017 data sourced from Eurostat. 2010 and 2020 data sourced from National Renewable Energy Action Plans.
Ill. 11: Source: 2010 and 2020 data from National Renewable Energy Action Plans (European Com-mission).8 2016 data from 2016 transport data from European Environ-ment Agency.9
0
10
20
30
40
Percentage
2020
20161
2010
NorwayUKSwedenNetherlandsFranceGermanyDenmarkBelgium
2010 2016* 2020 * 2016 data sourced from European Environment Agency.
RENEWABLE CONTRIBUTION TO TRANSPORT
0
20
60
40
80
100
120
Percentage
Norw
ayUK
Swed
en
Neth
erla
nds
Fran
ce
Germ
any
Denm
ark
Belg
ium
2020
20171
2010
2010 2017* 2020 * 2017 data sourced from Eurostat.
RENEWABLE CONTRIBUTION TO ELECTRICITY
0
20
60
40
80
100
120
Percentage
Norw
ayUK
Swed
en
Neth
erla
nds
Fran
ce
Germ
any
Denm
ark
Belg
ium
2020
20171
2010
RENEWABLE CONTRIBUTION TO HEATING AND COOLING

19
URBAN INSIGHT 2019
URBAN ENERGY
THE LIMITS
TO RENEWABLE
ENERGY
10) National Renewable Energy Action Plans (European Commission): https://ec.europa.eu/energy/en/topics/renewable-en-ergy/national-action-plans
11) European Environment Agency: https://www.eea.europa.eu/data-and-maps/indicators/use-of-cleaner-and-alterna-tive-fuels/use-of-cleaner-and-alternative-4
12) European Environment Agency: Trends and projections in Europe 2018.
Sweden is the only outlier in achieving the renewables target for transport for the avail-able 2016 data (no comparable data is available for Norway).
Overall, the target for the share of renewable energy of total energy consumption for 2020 is on track – but what is next? Not all countries have set targets for 2030 or beyond – the new Renewable Energy Directive signed in December 2018 commits sig-natories to a 32 per cent share of renewables in total energy consumption by 2030 across the EU as a whole.
However, individual member targets have been inconsistent – some have committed to 100 per cent renewables in electricity production but few have issued draft or final targets for total energy consumption.
This lack of consistency in target setting makes it difficult to know the way forward. Both Denmark and Belgium have committed to a 100 per cent fossil-free future by 2050 but have a long way to go relative to their 2016 achievements. Following a similar year-on-year increase in renewables seen to date, we are currently likely to achieve between 55 and 75 per cent renewables in total final energy consumption by 2050 in the EU on average.12
Should we (and the Smith family) be looking outside of Europe for inspiration?
Ill. 12: Source: 2010 and 2020 data from National Renewable Energy Action Plans (European Com-mission).10 2016 data from 2016 transport data from European Environ-ment Agency.11 2030, 2040 and 2050 targets from draft energy plans where available.
0
20
40
60
80
100
Percentage
2050
2030
2020
20161
2010
UKSwedenNetherlandsFranceGermanyDenmarkBelgium
2010 2016* 2020 2030 2050 * 2016 data sourced from European Environment Agency.
TOTAL RENEWABLE SHARE IN ENERGY INCLUDING STATED FUTURE TARGETS

2020
4.WHY CAN’T WE ALL BE LIKE COSTA RICA?
URBAN INSIGHT 2019
URBAN ENERGY
THE LIMITS
TO RENEWABLE
ENERGY

22
URBAN INSIGHT 2019
URBAN ENERGY
THE LIMITS
TO RENEWABLE
ENERGY
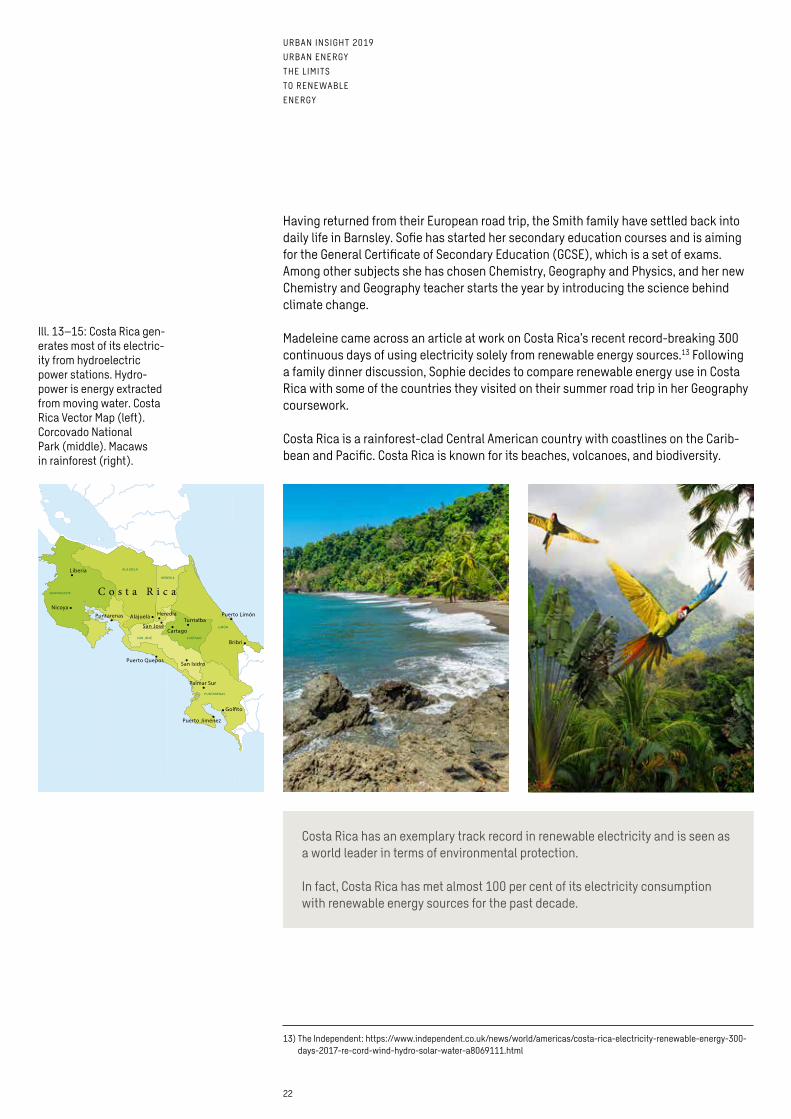
Having returned from their European road trip, the Smith family have settled back into daily life in Barnsley. Sofie has started her secondary education courses and is aiming for the General Certificate of Secondary Education (GCSE), which is a set of exams. Among other subjects she has chosen Chemistry, Geography and Physics, and her new Chemistry and Geography teacher starts the year by introducing the science behind climate change.
Madeleine came across an article at work on Costa Rica’s recent record-breaking 300 continuous days of using electricity solely from renewable energy sources.13 Following a family dinner discussion, Sophie decides to compare renewable energy use in Costa Rica with some of the countries they visited on their summer road trip in her Geography coursework.
Costa Rica is a rainforest-clad Central American country with coastlines on the Carib-bean and Pacific. Costa Rica is known for its beaches, volcanoes, and biodiversity.
13) The Independent: https://www.independent.co.uk/news/world/americas/costa-rica-electricity-renewable-energy-300- days-2017-re-cord-wind-hydro-solar-water-a8069111.html
Ill. 13–15: Costa Rica gen-erates most of its electric-ity from hydroelectric power stations. Hydro-power is energy extracted from moving water. Costa Rica Vector Map (left). Corcovado National Park (middle). Macaws in rainforest (right).
Costa Rica has an exemplary track record in renewable electricity and is seen as a world leader in terms of environmental protection.
In fact, Costa Rica has met almost 100 per cent of its electricity consumption with renewable energy sources for the past decade.

23
URBAN INSIGHT 2019
URBAN ENERGY
THE LIMITS
TO RENEWABLE
ENERGY
Costa Rica used exclusively renewable electricity for more than 300 days during 2018,and for the whole of that year, renewables accounted for 98 per cent of the country’selectricity needs.14
Costa Rica’s electricity mix 2018Hydro Wind Geothermal Biomass Solar Thermal
72.3% 16.2% 8.9% 0.8% 0.1% 1.8%
However, in terms of total energy consumption across all sectors, (electricity, heating and transportation), the renewable share only amounts to 50 per cent. This is because transportation is heavily based on oil products with a negligible share of hybrid, biofuel or battery-powered vehicles.
By comparison, in Europe in 2018, almost half of all electricity produced was generatedby coal, gas and other fossil fuels.15 Renewable energy in Europe contributed an average of 17.5 per cent of total energy consumption that year.
Europe’s average electricity mix 2018Fossils Nuclear Wind Hydro Biomass Solar
42.1% 25.5% 11.8% 10.6% 6.1% 3.9%
“WHY ARE EUROPEAN COUNTRIES LAGGING BEHIND COSTA RICA?”
To elaborate on this question, it is worth noting that not all European countries lag behind Costa Rica. In fact, Sweden – the best performer in the European Union – produced over 41 per cent of its total primary energy supply from renewables in 2015. Similarly, Norway has performed consistently well and matched Costa Rica’s performance in 2016.16
SHARE OF RENEWABLES IN TOTAL PRIMARY ENERGY SUPPLY
14) The weather channel: https://weather.com/news/news/2018-12-21-costa-rica-300-days-energy-renewable-sources15) Agora energiewende: https://www.agora-energiewende.de/en/publications/the-european-power-sector-in-2018/16) IEA Atlas of Energy: http://energyatlas.iea.org/#!/tellmap/-107625089117) Total Primary Energy Supply is the sum of production and imports subtracting exports and storage changes. Primary
energy is an energy form found in nature that has not been subjected to any human engineered conversion process.
Ill. 16: Data from IEA Atlas of Energy17
0
10
20
30
40
50
60
%
Sweden
Costa Rica
Norway
201520102005200019951990
Norway Costa Rica Sweden
24
URBAN INSIGHT 2019
URBAN ENERGY
THE LIMITS
TO RENEWABLE
ENERGY
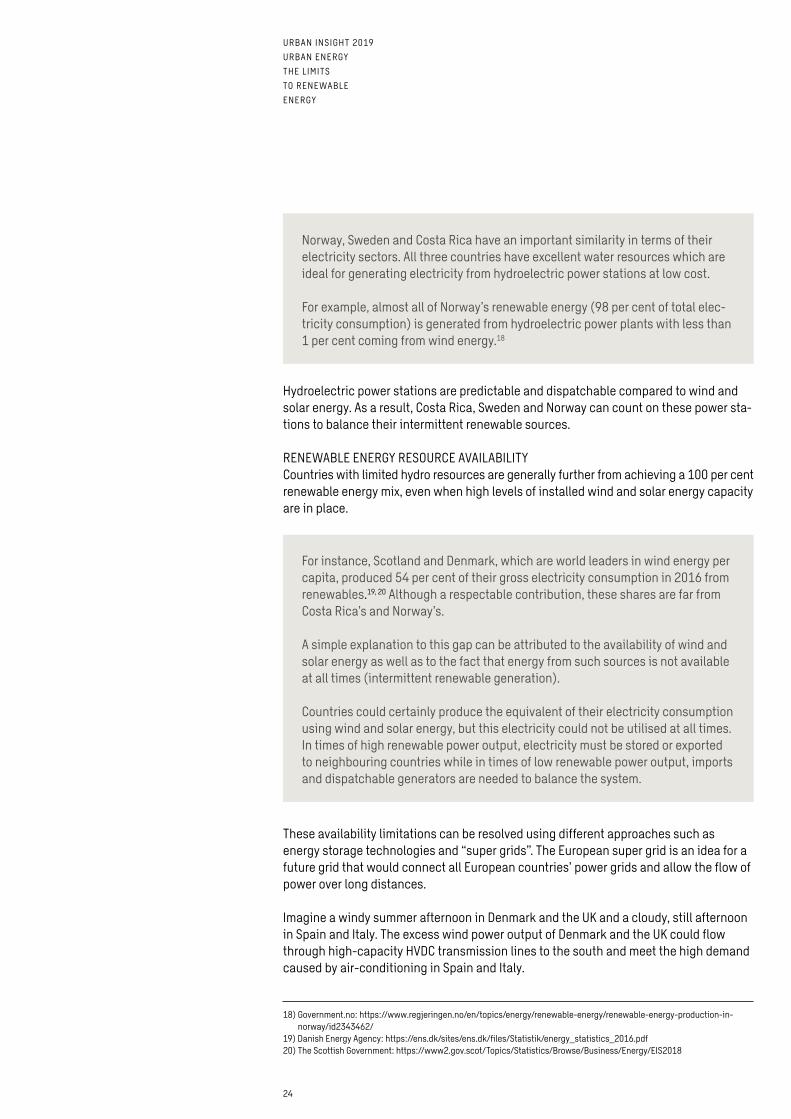
Hydroelectric power stations are predictable and dispatchable compared to wind and solar energy. As a result, Costa Rica, Sweden and Norway can count on these power sta-tions to balance their intermittent renewable sources.
RENEWABLE ENERGY RESOURCE AVAILABILITYCountries with limited hydro resources are generally further from achieving a 100 per cent renewable energy mix, even when high levels of installed wind and solar energy capacity are in place.
These availability limitations can be resolved using different approaches such as energy storage technologies and “super grids”. The European super grid is an idea for a future grid that would connect all European countries’ power grids and allow the flow of power over long distances.
Imagine a windy summer afternoon in Denmark and the UK and a cloudy, still afternoon in Spain and Italy. The excess wind power output of Denmark and the UK could flow through high-capacity HVDC transmission lines to the south and meet the high demand caused by air-conditioning in Spain and Italy.
Norway, Sweden and Costa Rica have an important similarity in terms of their electricity sectors. All three countries have excellent water resources which are ideal for generating electricity from hydroelectric power stations at low cost.
For example, almost all of Norway’s renewable energy (98 per cent of total elec-tricity consumption) is generated from hydroelectric power plants with less than 1 per cent coming from wind energy.18
For instance, Scotland and Denmark, which are world leaders in wind energy per capita, produced 54 per cent of their gross electricity consumption in 2016 from renewables.19, 20 Although a respectable contribution, these shares are far from Costa Rica’s and Norway’s.
A simple explanation to this gap can be attributed to the availability of wind and solar energy as well as to the fact that energy from such sources is not available at all times (intermittent renewable generation).
Countries could certainly produce the equivalent of their electricity consumption using wind and solar energy, but this electricity could not be utilised at all times. In times of high renewable power output, electricity must be stored or exported to neighbouring countries while in times of low renewable power output, imports and dispatchable generators are needed to balance the system.
18) Government.no: https://www.regjeringen.no/en/topics/energy/renewable-energy/renewable-energy-production-in- norway/id2343462/
19) Danish Energy Agency: https://ens.dk/sites/ens.dk/files/Statistik/energy_statistics_2016.pdf20) The Scottish Government: https://www2.gov.scot/Topics/Statistics/Browse/Business/Energy/EIS2018

25
URBAN INSIGHT 2019
URBAN ENERGY
THE LIMITS
TO RENEWABLE
ENERGY
Similarly, Spain and Italy could transmit power back to Denmark and the UK in times of excess solar output.
Another option would be the use of energy storage technologies that allow electrical energy to be stored and released when necessary. There are several available types of energy storage devices covering small- and large-scale applications.
High-Voltage Direct Current (HVDC) is a highly efficient way to transmit large amounts of electricity over long distances.
Hydroelectric dams are the most common technology for large amounts of energy storage but are limited to areas where there is availability of suitable water resources. On the other hand, battery storage suits small to medium storage applications and offers a high degree of flexibility.
Sweden and Denmark use thermal storage to help balance their electricity system, embedded in their extensive district heating systems. Thermal storage allows for the use of electricity for heating when electricity costs are very low, typically when there is a high degree of intermittent renewable generation in the grid.
Ill. 17 (above): Hydro-electric power stations are highly flexible and can provide large amounts of energy stor-age through the use of dams containing water.
Ill. 18–19 (below): Wind, sun and water are all natural energy sources which together can be used to produce a bal-anced electricity mix.

26
URBAN INSIGHT 2019
URBAN ENERGY
THE LIMITS
TO RENEWABLE
ENERGY
ENERGY DEMAND RELATIVE TO COUNTRY SIZE People in Europe consume on average three times more energy per capita than people in Costa Rica.21 Additionally, Costa Rica has a small population compared to most Euro-pean countries. As a result, energy demand per capita and per unit area is much greater in Europe.
Renewable energy sources typically cover larger surface areas per unit of power than conventional power stations. We would need to cover large amounts of land to install enough renewable energy to meet European energy demand, which is a challenge because we have relatively lower space availability and the landscape would be more easily saturated.
The table below illustrates the relative space requirements in square kilometres per megawatt relative to the size of installation. Coal power generation requires the least amount of space, while hydro takes the largest amount of space.
Electricity source km2/MW
Coal 0.049
Natural gas 0.050
Nuclear 0.051
Solar 0.176
Wind 0.285
Hydro 1.28
It is therefore easier for a small country with ample space and lower population density to meet energy needs through renewable energy than it is for a larger country with more limited space and greater population density.
Table 1: Power density. Power per unit area for various electricity generation sources.
21) WorldData.info: https://www.worlddata.info/america/costa-rica/energy-consumption.php
Ill. 20: Space and population are factors to consider when choosing energy sources.
27
URBAN INSIGHT 2019
URBAN ENERGY
THE LIMITS
TO RENEWABLE
ENERGY
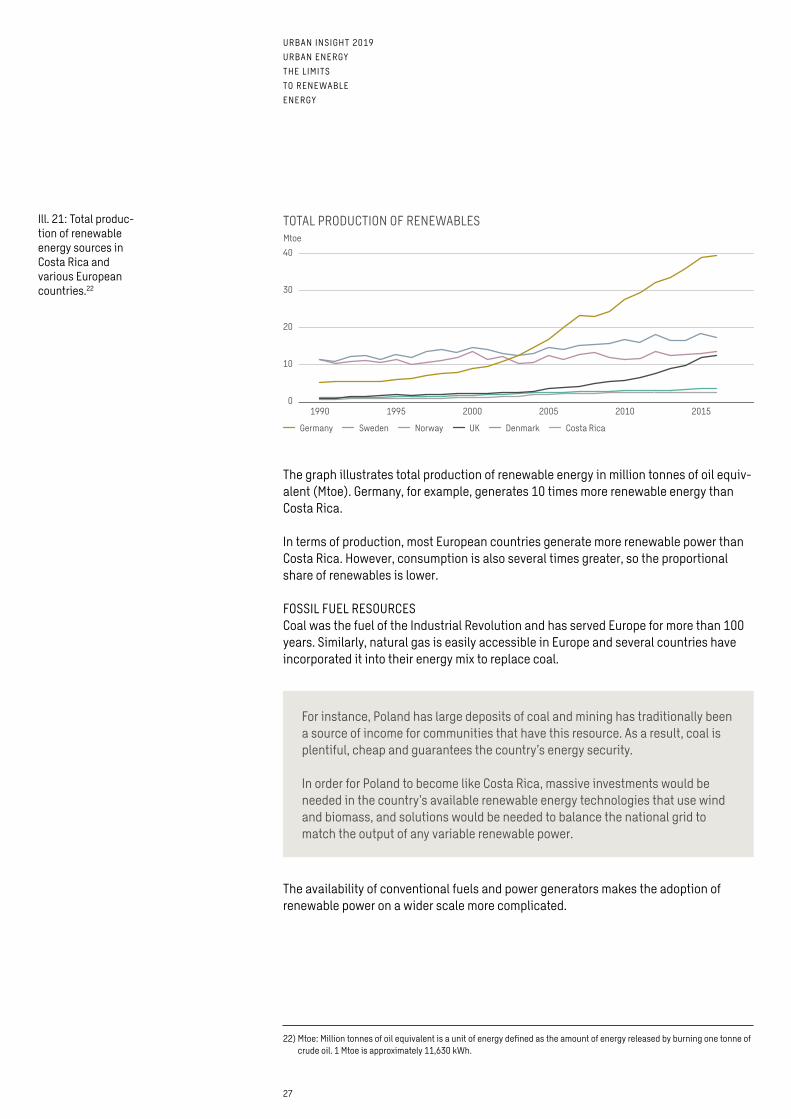
TOTAL PRODUCTION OF RENEWABLES
The graph illustrates total production of renewable energy in million tonnes of oil equiv-alent (Mtoe). Germany, for example, generates 10 times more renewable energy than Costa Rica.
In terms of production, most European countries generate more renewable power than Costa Rica. However, consumption is also several times greater, so the proportional share of renewables is lower.
FOSSIL FUEL RESOURCESCoal was the fuel of the Industrial Revolution and has served Europe for more than 100 years. Similarly, natural gas is easily accessible in Europe and several countries have incorporated it into their energy mix to replace coal.
The availability of conventional fuels and power generators makes the adoption of renewable power on a wider scale more complicated.
22) Mtoe: Million tonnes of oil equivalent is a unit of energy defined as the amount of energy released by burning one tonne of crude oil. 1 Mtoe is approximately 11,630 kWh.
Ill. 21: Total produc-tion of renewable energy sources in Costa Rica and various European countries.22
0
10
20
30
40
Mtoe
Costa Rica
Denmark
UK
Norway
Sweden
Germany
201520102005200019951990
For instance, Poland has large deposits of coal and mining has traditionally been a source of income for communities that have this resource. As a result, coal is plentiful, cheap and guarantees the country’s energy security.
In order for Poland to become like Costa Rica, massive investments would be needed in the country’s available renewable energy technologies that use wind and biomass, and solutions would be needed to balance the national grid to match the output of any variable renewable power.
Germany Sweden Norway UK Denmark Costa Rica

28
URBAN INSIGHT 2019
URBAN ENERGY
THE LIMITS
TO RENEWABLE
ENERGY
GOVERNMENT POLICYThe development of alternative energy sources is, to a large extent, a political decision. The energy goals and ambitions of European countries vary widely for a number of different reasons. For instance, there are countries with bolder goals, such as Sweden’s target to meet all of its energy needs (heat, transport, power) from renewables by 2040, and countries with less aggressive targets, such as Malta’s goal to achieve 10 per cent renewable energy use by 2020.
The target that each country sets is based on the energy triangle, or energy trilemma, that links security of supply, affordability and carbon emissions (environmental factors).
Different countries emphasise different parts of the triangle, depending on what chal-lenges they face.
For example, a country rich in fossil fuels may have a solid performance on affordability and security of supply, but a low sustainability score. Striking a balance in the energy trilemma is challenging. More specifically, focusing on the environment is much harder for some countries than others. This leads to unequal targets and leaves governments with varying amounts of scope to promote the adoption of renewable energy.
Ill. 22: The energy trilemma relates the energy strategies of an organisation, city or country based on three pillars: security, affordability and envi-ronmental impact.
CO2
Energy trilemma
Security of supply
Carbon emissionsAffordability

29
URBAN INSIGHT 2019
URBAN ENERGY
THE LIMITS
TO RENEWABLE
ENERGY
WHY CAN’T WE ALL BE LIKE COSTA RICA?
Availability of natural resources is unevenly distributed between countries For instance, there are countries with large fossil fuel reserves and countries with excellent renewable power potential.
Economics play a pivotal role Affordability is vital for continuing economic growth and powering societies. It is there-fore very high on the agenda for many countries.
Energy storage cost Energy storage cost is relatively high for large-scale adoption although the cost of battery storage is decreasing dramatically.
Politics Energy is a large part of the political scene of many countries. Supporting the uptake of renewable energy requires government support and the creation of favourable condi-tions for the markets to develop.
Energy density & area requirements Renewable power technologies have a low energy density (energy generated per unit of area covered) compared to fossil fuel plants. For instance, land use is approximately 49,400 m2/MW for a coal power station and 256,000 m2/MW for a wind farm. This trans-lates to more than five times the area usage for wind power than coal. In densely popu-lated countries, the available area is more valuable and aesthetics are important.
Ill. 23 (above left): A coal mine in West Virginia.
Ill. 24 (above right): Gas storage tanks.
Ill. 25 (below): Solar power: a new dawn?

3030
5.CHALLENGES TO ACHIEVING MAXIMUM PENETRATION OF RENEWABLE ENERGY
URBAN INSIGHT 2019
URBAN ENERGY
THE LIMITS
TO RENEWABLE
ENERGY


32
URBAN INSIGHT 2019
URBAN ENERGY
THE LIMITS
TO RENEWABLE
ENERGY
ENVIRONMENTThe energy scene of the past century has been based on the extraction and combustion of fossil fuels. Fossil fuels have supported exponential economic growth and under-pinned the development of modern society.
However, current habits and ways of powering communities are unsustainable. To ensure that humans continue to survive and thrive, it is vital to maintain the natural environment.
If we perpetuate dependence on fossil fuels to meet transport, heating and power needs, climate change is expected to worsen as the global population grows and energy demand increases.
ELECTRICITYMaximum renewable energy penetration will bring with it a massive transformation of electricity networks and the way electrical power is transmitted, generated and sold.
As discussed in Chapter 4, conventional power stations are highly dispatchable and centralised. The electricity system of the future needs to be highly flexible to rapidly adjust to the variable power output of renewable energy sources.
Concepts such as flexible generation, demand side response, electricity storage, inter-connectors and network reinforcement are likely to become more common in the near future.
In addition to effects on generation and transmission, characteristics of renewable energy converters disrupt the way conventional electricity markets function. Market structures need to evolve to properly integrate renewable power.
On a local level, zero-emissions translates into improved air quality. On a national level, it allows the preservation of natural heritage and biodiversity.
On a global level, achieving maximum renewable penetration is vital for avoiding the detrimental effects of climate change and promoting sustainable development.
33
URBAN INSIGHT 2019
URBAN ENERGY
THE LIMITS
TO RENEWABLE
ENERGY
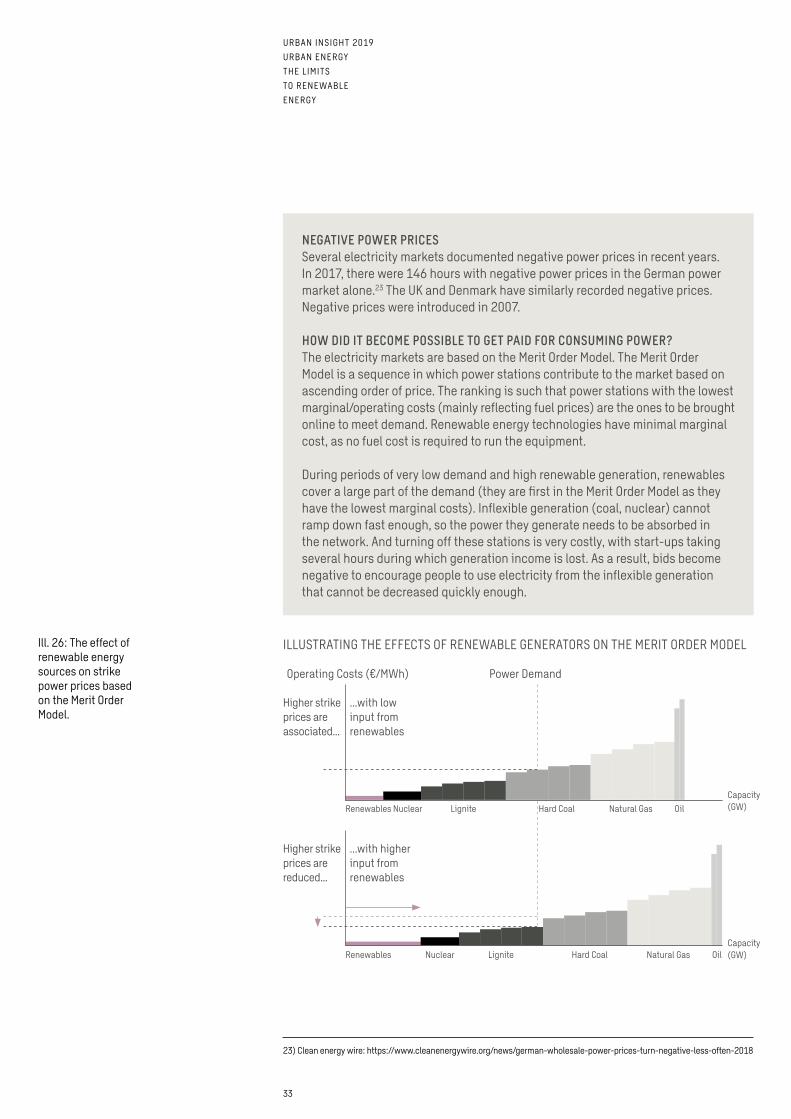
Ill. 26: The effect of renewable energy sources on strike power prices based on the Merit Order Model.
NEGATIVE POWER PRICESSeveral electricity markets documented negative power prices in recent years. In 2017, there were 146 hours with negative power prices in the German power market alone.23 The UK and Denmark have similarly recorded negative prices. Negative prices were introduced in 2007.
HOW DID IT BECOME POSSIBLE TO GET PAID FOR CONSUMING POWER?The electricity markets are based on the Merit Order Model. The Merit Order Model is a sequence in which power stations contribute to the market based on ascending order of price. The ranking is such that power stations with the lowest marginal/operating costs (mainly reflecting fuel prices) are the ones to be brought online to meet demand. Renewable energy technologies have minimal marginal cost, as no fuel cost is required to run the equipment.
During periods of very low demand and high renewable generation, renewables cover a large part of the demand (they are first in the Merit Order Model as they have the lowest marginal costs). Inflexible generation (coal, nuclear) cannot ramp down fast enough, so the power they generate needs to be absorbed in the network. And turning off these stations is very costly, with start-ups taking several hours during which generation income is lost. As a result, bids become negative to encourage people to use electricity from the inflexible generation that cannot be decreased quickly enough.
23) Clean energy wire: https://www.cleanenergywire.org/news/german-wholesale-power-prices-turn-negative-less-often-2018
Higher strike prices are associated...
Operating Costs (€/MWh) Power Demand
Higher strike prices are reduced...
...with low input from renewables
Renewables
Renewables
Nuclear
Nuclear
Lignite
Lignite
Hard Coal
Hard Coal
Natural Gas
Natural GasCapacity (GW)
Capacity (GW)Oil
Oil
...with higher input from renewables
ILLUSTRATING THE EFFECTS OF RENEWABLE GENERATORS ON THE MERIT ORDER MODEL
34
URBAN INSIGHT 2019
URBAN ENERGY
THE LIMITS
TO RENEWABLE
ENERGY
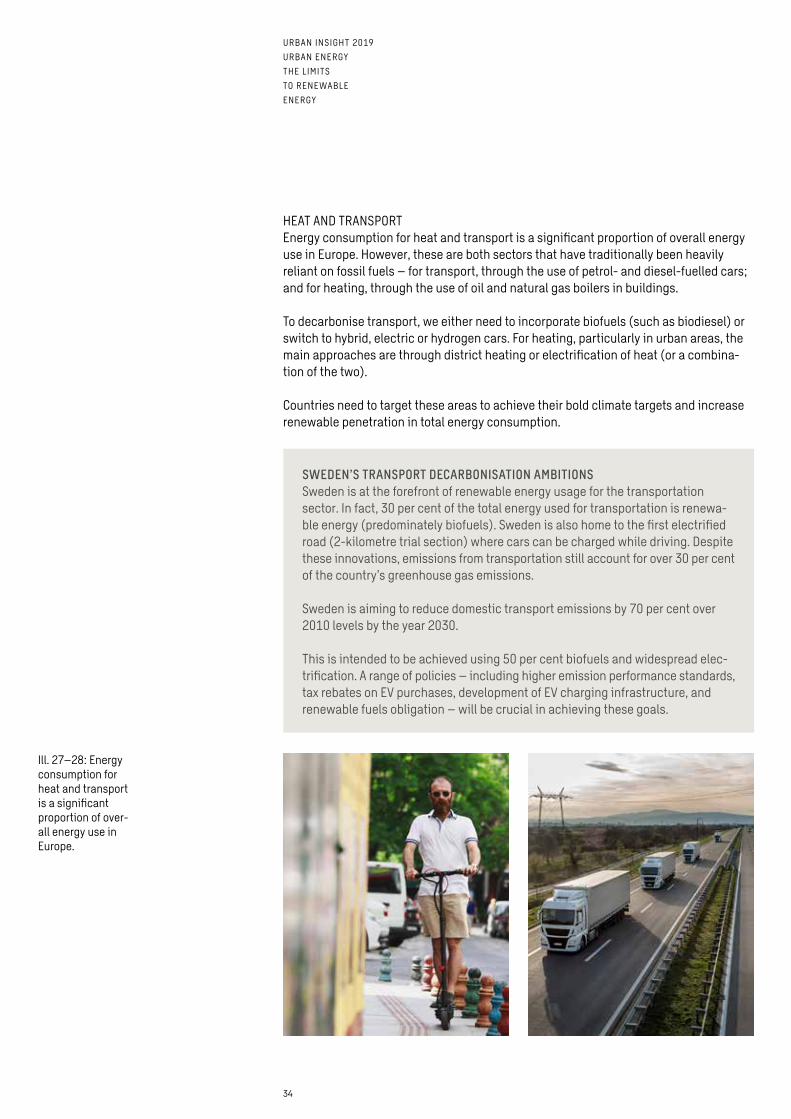
HEAT AND TRANSPORTEnergy consumption for heat and transport is a significant proportion of overall energy use in Europe. However, these are both sectors that have traditionally been heavily reliant on fossil fuels – for transport, through the use of petrol- and diesel-fuelled cars; and for heating, through the use of oil and natural gas boilers in buildings.
To decarbonise transport, we either need to incorporate biofuels (such as biodiesel) or switch to hybrid, electric or hydrogen cars. For heating, particularly in urban areas, the main approaches are through district heating or electrification of heat (or a combina-tion of the two).
Countries need to target these areas to achieve their bold climate targets and increase renewable penetration in total energy consumption.
SWEDEN’S TRANSPORT DECARBONISATION AMBITIONSSweden is at the forefront of renewable energy usage for the transportation sector. In fact, 30 per cent of the total energy used for transportation is renewa-ble energy (predominately biofuels). Sweden is also home to the first electrified road (2-kilometre trial section) where cars can be charged while driving. Despite these innovations, emissions from transportation still account for over 30 per cent of the country’s greenhouse gas emissions.
Sweden is aiming to reduce domestic transport emissions by 70 per cent over 2010 levels by the year 2030.
This is intended to be achieved using 50 per cent biofuels and widespread elec-trification. A range of policies – including higher emission performance standards, tax rebates on EV purchases, development of EV charging infrastructure, and renewable fuels obligation – will be crucial in achieving these goals.
Ill. 27–28: Energy consumption for heat and transport is a significant proportion of over-all energy use in Europe.

35
URBAN INSIGHT 2019
URBAN ENERGY
THE LIMITS
TO RENEWABLE
ENERGY
Heating and hot water account for 79 per cent of total final energy use in EU households. In industry, 70.6 per cent of energy consumption was used for space and industrial pro-cess heating. The share of renewable energy in heating is less than 20 per cent.24
District heating networks along with electrification of heating will need to be signifi-cantly developed to reach decarbonisation targets in this sector. For countries with an over-reliance on natural gas or oil-based boilers at the individual building level, govern-ment intervention is necessary to support decarbonisation of the natural gas grid, ban future sales of these technologies and develop and support alternative heating solutions – e.g. hydrogen-based boilers.
SOCIAL AND POLITICAL IMPLICATIONSOn a local level, societies may benefit from municipal- and community-owned renewable energy schemes. In such schemes, the centralised nature of power is decentralised, giving end-users more control over the whole system.
On a national level, renewable energy may create new jobs in the industry and support moves towards a long-term sustainable development plan with lower risks associated with fuel import volatility, carbon prices and political tensions. This is particularly true where countries are highly dependent on fuel imports.
The trade in electricity between countries is less prone to political tension than trade involving oil and gas. Naturally, some countries have more energy resources than others, but differences in renewable resources are smaller than those relating to fossil fuel reserves.25
Emissions do not respect national borders. Developed nations that utilise large amounts of energy and use fossil fuels in production may contribute to climate change more than other nations, but will not necessarily feel its impact to a greater extent than others. The negative effects of anthropogenic climate change are distributed on a global scale to all countries unrelated to their share of global emissions.
24) European Commission: https://ec.europa.eu/energy/en/topics/energy-efficiency/heating-and-cooling25) The UNFCCC secretariat (UN Climate Change): https://unfccc.int/news/combination-of-climate-change-and-inequality-
increasingly-drives-risk
Although not obvious, accelerated climate change increases inequality within and between countries.
Disadvantaged groups may have a higher exposure to the adverse effects of climate change, an increased susceptibility to damage and a decreased ability to cope and recover from the damage suffered.

36
URBAN INSIGHT 2019
URBAN ENERGY
THE LIMITS
TO RENEWABLE
ENERGY
The most recent IPCC report identified Africa as the continent that will be most affected by climate change. At the same time, African countries have the lowest carbon emis-sions per capita in the world and use a tiny fraction of the fossil fuels that European countries use.26
As a consequence, Europe is likely to see increasing numbers of climate refugees. Finland and Sweden are currently the only countries in the world with an official policy concern-ing environmental migrants included in their official immigration and asylum policies. This may be subject to change as weather trends become increasingly less predictable and more severe and the number of “climate change refugees” increases.
ECONOMICSThe cost of renewable power has been decreasing for decades and falling faster than anticipated. Today, renewable power uptake is driving up electricity prices, and requires government support. This is due to the fact that current electricity systems operate based on the architecture of conventional power stations. As more renewable power is integrated into the grid, electricity networks need to be upgraded or re-engineered to allow smooth operation. This gives rise to additional costs that are not reflected in the capital and operational cost of renewable power generators.
In the long term, as technology matures, the costs of running an entire energy system on renewable energy will be lower and subsidies on fossil fuels are likely to fall away.
The graphs below illustrate the difference in levelized cost of energy (LCOE) in Germany over five years, between 2013–18. Levelized cost of energy is a way of calculating the lifetime costs of different energy types, including initial capital investment, operating, financing and fuel costs, with the aim of facilitating comparisons between very different types of technology.
26) Our World: https://ourworld.unu.edu/en/africa-and-climate-change
Ill. 29: Finland and Sweden are the only countries in the world with an official policy concerning environ-mental migrants included in their official immigration and asylum policies.

37
URBAN INSIGHT 2019
URBAN ENERGY
THE LIMITS
TO RENEWABLE
ENERGY
For example, the average levelized cost of energy seen above shows a 20 per cent decrease in costs for onshore wind and a 37 per cent fall in costs for utility-scale PV systems. The length of the bar illustrates the difference between the lowest and highest costs. A taller bar means there is a greater variation in cost levels.
27) Fraunhofer, ISE: https://www.ise.fraunhofer.de/en/publications/studies/cost-of-electricity.html28) Sweco, Urban Insight report: https://www.swecourbaninsight.com/urban-energy/electricity-how-long-could-we-survive-
without-it/
4
6
8
10
12
14
18
16
20
22
LCOE (€cent/kWh)
CCGTHardcoal
Browncoal
BiogasOffshorewind
Onshorewind
PVrooftop
PVutility-scale
4
6
8
10
12
14
18
16
20
22
LCOE (€cent/kWh)
CCGTHardcoal
Browncoal
BiogasOffshorewind
Onshorewind
PVrooftop
PVutility-scale
Estimates of the total global economic cost to limit average global warming to 2°C above pre-industrial temperatures is €200-350 billion per year by 2030. This is less than 1 per cent of the forecasted global GDP (Gross Domestic Product) in 2030.
Similarly, in the UK, the costs of reducing GHG (Green House Gases) emissions to 80 per cent below 1990 levels by 2050 have been estimated at around 1 per cent of GDP by the Committee on Climate Change.
Although these are substantial amounts, many estimates project that the eco-nomic costs of not taking action to avert climate change would greatly exceed investments in mitigation opportunities.28
Ill. 31–32: Cities need to improve storm water management to reduce the costs of waste-water treatment.
LCOE IN GERMANY, 2013 LCOE IN GERMANY, 2018
Ill. 30: Data from Fraunhofer, Institute for Solar Energy Systems ISE.27

3838
6.CONCLUSIONS AND RECOMMENDATIONS
URBAN INSIGHT 2019
URBAN ENERGY
THE LIMITS
TO RENEWABLE
ENERGY


40
URBAN INSIGHT 2019
URBAN ENERGY
THE LIMITS
TO RENEWABLE
ENERGY
We already have the technologies, the proven business cases and the infrastructure to support wider integration of renewables into energy systems. What is holding us back? Who is holding us back?
For some, there is a fear that the scale of available renewables is insufficient to meet all of our energy demands. What happens if we go down the route towards 100 per cent renewables? The goal is not to cover and crowd the landscape and let the horizon to disappear under tens of thousands of solar panels or large wind turbines, but instead use renewable sources in smart ways. To meet future demands we need to create more interactions between sectors and systems.
WHAT DOES THE FUTURE LOOK LIKE?Traditional energy solutions have focussed on electricity, heating and transport as sep-arate sectors, with limited interaction between them. If you think about your home or your office, there is probably no connection between your choice of transport, how your electricity works, and where your heating comes from.
Let’s say your home is heated by electricity and you also decide to buy an electric car. Does that mean your maximum electricity consumption is the sum of your maximum electricity, heating and transport use? And does it mean if we all switch to a 100 per cent electrical system, national generation and transmission will have to meet this maximum amount if we all decide to charge our cars, heat our houses and use our computers at the same time?
SCHOOL STRIKES 4 CLIMATE ACTION, #FRIDAYSFORFUTUREStarting with a single individual striking in front of the Swedish Parliament in August 2018, the then-15-year old Greta Thunberg has inspired peers globally to protest the current state of climate policy activities. Starting with local protests, these have grown into national and internationally coordinated events, with the first global strike planned on 15 March 2019.
Every Friday, school children are going on strike to protest in front of their local or national government offices in favour of more immediate action to tackle climate change.
Ill. 33 (left): Renewable energy sources – wind energy, solar energy, biomass and hydro-power.
Ill. 34 (right): To meet future demands, coun-tries need to use renew-able energy in a smart way, e.g. create more interactions between systems and use differ-ent energy sources.

41
URBAN INSIGHT 2019
URBAN ENERGY
THE LIMITS
TO RENEWABLE
ENERGY
One of the biggest challenges in the energy sector is matching the timings between generation and consumption of energy. On a “good” energy day, the sun blazes and the wind howls and fills our electricity grid with cheap, renewable energy. On a “bad” energy day, the skies are grey and the wind is still and we rely on backup from hydro or conven-tional generation. On good days we should also be furiously energetic and use as much energy as we can – and on bad days we should turn to quieter pursuits.
Digitalisation, energy storage and demand response are the keys to helping future energy systems maintain balance as we move from an energy system that lacks unified thinking about our generation of electricity, heating and transport. The generation of energy for heat, electricity and transport is interconnected through storage, monitored through smart meters, and changed through voluntary shifting of demand. Policy either needs to support this whole-system perspective or, at a minimum, ensure that outdated policies do not prevent the market from developing whole-system solutions.
If you were offered a 33 per cent discount on your electricity bill for charging your new electric car between 2am and 5am rather than between 6pm and 9pm, would you do so? All over the world initiatives are being taken to minimise carbon emissions and the impacts of climate change. The increase of renewable energy is key to achieving a climate neu-tral, sustainable future and it’s a solution that is already being implemented in many different countries.
Time is running out for making unprecedented changes to the way we work and live if we want to continue to work and live in a world that resembles the one we have today.
A 15-year-old schoolgirl has inspired a global movement of teenagers and adults, demonstrating that there is no limit to what an individual is capable of doing. The limits to renewables are not technical, or financial or regulatory – they are the ones we set for ourselves and for each other.
SORT YOUR WASTE EFFICIENTLY AND GET A DISCOUNT ON YOUR ENERGY COST – AN INTEGRATED BUSINESS MODEL FOR THE FUTUREThe Högbytorp Plant in Sweden combines a recycling centre with a combined heat and power system and biogas facility utilising household waste. Waste is sorted as re-usable, recyclable, combustible and organic waste.
Combustible items are converted to heat and power and organic waste and water sewage are converted into biogas for transport.
The intention is to introduce a new business model, where households are rewarded with lower energy prices for careful sorting. Sorting is digitally moni-tored and logged through waste collection.

4242
7.ABOUT THEAUTHORS
URBAN INSIGHT 2019
URBAN ENERGY
THE LIMITS
TO RENEWABLE
ENERGY

43
URBAN INSIGHT 2019
URBAN ENERGY
THE LIMITS
TO RENEWABLE
ENERGY
As lead Economist within the Energy Business Unit at Sweco, Dr TANJA GROTH heads the provision of socio-economic, financial and economic support across Sweco’s energy project portfolio. With more than 10 years of experience working on renewable energy and low carbon projects in the UK, Northern Europe and South-East Asia, she has an established track record in seeing projects through from feasibility to operation.
ROBIN MEADE is a Chartered Landscape Architect with over 20 years’ experience in landscape planning and design. Robin’s diverse experience includes the assessment and design of large-scale infrastructure, including onshore and offshore wind energy development, highways, rail and airports. He has also been influential in developing guidance for seascape and townscape character assessment.
VIJAY SHINDE, Grid Services Lead as Sweco UK, has over 18 years’ experience in deliver-ing specialist technical and regulatory advice on project delivery across the UK’s energy sector. He is retained by investors and developers for specialist advice in energy storage, onshore and offshore transmission networks, solar, grid and electric vehicle charging infrastructure.
PANAGIOTIS KEFALAS, a junior energy engineer, holds a M.Sc. in Sustainable Energy Sys-tems with Distinction from the University of Edinburgh and a B.Sc. in Power Engineering from Warsaw University of Technology. Panagiotis works on the Grid Services team and is involved in projects in areas including battery storage, EV charging infrastructure, and PV estimations.
Other contributing experts:Andy King, Director of Energy and Environment, Sweco UKMaria Ahlberg, Senior Project Manager for Smart City, Sweco Sweden


SWECOURBANINSIGHT.COM
Urban Insight is an initiative launched by Sweco to illustrate our expertise – encompassing both local knowledge and global capacity – as the leading adviser to the urban areas of Europe. This initiative offers unique insights into sustainable urban development in Europe, from the citizens’ perspective.
The theme for 2019 is Urban Energy, describing various facets of sustainable urban develop-ment about energy usage, renewable energy and energy efficiency – with future challenges and opportunities in the new energy land-scape.
In our insight reports, written by Sweco’s experts, we explore how citizens view and use urban areas and how local circumstances can be improved to create more liveable, sustainable cities and communities.
Please visit our website to learn more:swecourbaninsight.com