2019 Summary Annual Report · earnings and cash flow generation is underpinned by long-term...
58
2019 SUMMARY ANNUAL REPORT
Transcript of 2019 Summary Annual Report · earnings and cash flow generation is underpinned by long-term...

2019 SUMMARY ANNUAL REPORT

Cautionary Statement • Statements that reference future events or conditions in this report are forward-looking statements. Actual future results, including demand growth and energy source mix; capacity growth; the impact of new technologies; production growth; project plans, dates, costs, and capacities; resource additions, production rates, and resource recoveries; efficiency gains; cost savings; earnings growth; cash flow generation; integration and technology benefits; project returns; and product sales could differ materially due to a number of factors, including: global or regional changes in oil, natural gas, petrochemicals, or feedstock prices, differentials, or other market or economic conditions affecting the oil, gas, and petrochemical industries and the demand for our products; reservoir performance; the outcome and timing of exploration and development projects; timely completion of construction projects; war and other political, public health, or security disturbances; changes in law or government regulation, including environmental, trade, and tax regulations and political sanctions; the actions of competitors and customers; unexpected technological developments; general economic conditions, including the occurrence and duration of economic recessions; the outcome of commercial negotiations; opportunities for and regulatory approval of investments or divestments that may arise; the impact of fiscal and commercial terms; the outcome of future research efforts; unexpected technological developments and the ability to bring new technology to commercial scale on a cost-competitive basis, including large-scale hydraulic fracturing projects; unforeseen technical difficulties; unanticipated operational disruptions; and other factors discussed in this report and in Item 1A of ExxonMobil’s most recent Form 10-K. All forward-looking statements are based on management’s knowledge and reasonable expectations and we assume no duty to update these statements as of any future date.
Frequently Used Terms and Non-GAAP Measures • We use non-GAAP concepts and financial measures throughout this publication. These measures may not be comparable to similarly titled measures used by other companies. Definitions of certain financial and operating measures and other terms used in this report – such as “resources” – are contained in the section titled “Frequently Used Terms” on pages 48 through 51. In the case of non-GAAP financial measures, such as “Return on Average Capital Employed” and “Cash Flow from Operations and Asset Sales,” the definitions also include any reconciliation or other information required by SEC Regulation G. “Factors Affecting Future Results” and “Frequently Used Terms” are also available on the “Investors” section of our website.
General Information • As used in this publication, the term “industry” refers to publicly traded international energy companies. The term “project” can refer to a variety of different activities and does not necessarily have the same meaning as in any government payment transparency reports. Unless otherwise specified, data shown is for 2019. Prior years’ data have been reclassified in certain cases to conform to the 2019 presentation basis. Unless otherwise stated, production rates, project capacities, and acreage values are gross. References to “emissions” refer to energy-related emissions.

1
CONTENTS
2 2019 Financial and Operating Highlights
3 2019 Business Highlights
4 Letter to Shareholders
6 The Fundamentals of Supply and Demand
8 Meeting the World’s Growing Energy Needs While Reducing Emissions
10 Competitive Advantages
16 Business Lines Organized by Value Chains
18 Upstream
28 Downstream
34 Chemical
40 Global Projects and Services
43 Financial Information
48 Frequently Used Terms
51 Footnotes
52 Board of Directors, Officers, and Affiliated Companies
54 Investor Information
55 General Information
COVER PHOTO: The Liza Destiny, shown offshore Guyana, started up ahead of schedule in December 2019.
2019 SUMMARY ANNUAL REPORT
28
10
18
34
1

KEY FINANCIAL DATA
(millions of dollars, unless noted)Earnings after income taxes
Average capital
employed*
Return on average capital
employed (%)*
Capital and exploration
expenditures*
Upstream 14,442 179,423 8.0 23,485
Downstream 2,323 28,033 8.3 4,371
Chemical 592 31,309 1.9 3,265
Corporate and Financing (3,017) (2,162) N.A. 27
Total 14,340 236,603 6.5 31,148 KEY OPERATING DATA
Liquids production (net, thousands of barrels per day) 2,386
Natural gas production available for sale (net, millions of cubic feet per day) 9,394
Oil-equivalent production1 (net, thousands of oil-equivalent barrels per day) 3,952
Refinery throughput (thousands of barrels per day) 3,981
Petroleum product sales2 (thousands of barrels per day) 5,452
Chemical prime product sales2 (thousands of tonnes) 26,516
2019 FINANCIAL AND OPERATING HIGHLIGHTS
See page 51 for all Footnotes in this report.* See Frequently Used Terms on pages 48 through 51.
E X X O N M O B I L 2 0 1 9 S U M M A R Y A N N U A L R E P O R T
2

NET LIQUIDS GROWTH, year-over-year, up 5% from 2018
120 KBD
IN EARNINGS, achieved in weak price and margin environment
$14 BILLION
IN DIVESTMENTS, actively highgrading portfolio
$5 BILLION
DEEPWATER DISCOVERIES, the largest in industry
6 MAJOR
TO RESEARCH lower-emission technologies
8 AGREEMENTS
PROVIDES FINANCIAL CAPACITY to invest through the cycle
13% LEVERAGE
2019 BUSINESS HIGHLIGHTS
Note: See Frequently Used Terms on pages 48 through 51 and the accompanying Footnotes.3

STRENGTHENING OUR BUSINESS AND DELIVERING ON OUR COMMITMENTS
As we begin a new decade, we do so with confidence
that we are making significant progress on plans
to strengthen and grow our business and deliver on
the commitment to increase value for you,
our shareholders.
Our growth strategy to significantly improve
earnings and cash flow generation is underpinned by
long-term industry fundamentals – the energy needs
of a growing and more prosperous global population
– and our competitive advantages of technology,
scale, integration, functional excellence, and our
highly capable workforce.
Our strategy is supported by the strongest portfolio
of opportunities we’ve seen since the Exxon and
Mobil merger more than two decades ago. Our
broad and diverse growth portfolio, which leads the
industry, is capable of generating returns even at the
bottom of the commodity price cycle, as we capture
value in a favorable cost environment.
In 2019, we saw commodity prices and margins drop
to near 10-year lows due to near-term oversupply
across the industry. Despite these challenges, we
generated $14 billion in earnings and increased the
dividend for the 37th consecutive year, invested in
future growth, and continued our work to develop
new technology solutions to manage the risks
related to climate change.
Across each of our business lines, we made progress
on our growth strategy.
In the Upstream, the Liza Phase 1 development
offshore Guyana started production less than five
years from initial discovery – about half the industry
average for projects of this scale. We’re working to
bring on more production in Guyana over the next
few years, and our exploration success increased
the estimated recoverable resource to more than
8 billion oil-equivalent barrels.
“Our growth strategy to significantly improve earnings and cash flow
generation is underpinned by long-term industry fundamentals”
E X X O N M O B I L 2 0 1 9 S U M M A R Y A N N U A L R E P O R T
4
| L E T T E R T O S H A R E H O L D E R S

In the Permian Basin, we grew unconventional
production by almost 80 percent in 2019, while
building out logistics and infrastructure to support a
uniquely integrated development approach. Our plan
captures additional value for shareholders by linking
our producing assets to our refineries and chemical
manufacturing operations on the U.S. Gulf Coast.
Elsewhere in the Upstream, we drilled six deepwater
discoveries, expanded exploration opportunities in
Brazil, and advanced LNG projects in Mozambique
and Papua New Guinea.
We invested in our Downstream business to improve
the competitiveness and earnings growth potential of
our refining network, and recently completed projects
in Antwerp, Beaumont, and Rotterdam generated
$300 million in earnings in a challenging margin
environment.
Our Chemical business expanded capacity to
capture demand growth. Eight growth projects are
complete, and funding was approved for another
four. Construction and expansion of manufacturing
projects along the Texas and Louisiana coast gained
momentum with start-up of the Beaumont high-
performance polyethylene plant and ground breaking
for a steam cracker and derivative product lines near
Corpus Christi, Texas.
The strength of our balance sheet enabled us to make
many of these investments during the down cycle,
taking advantage of an attractive cost environment.
These investments are critical given projected energy
and product demand growth in the coming decades
and natural decline rates associated with producing
assets. In fact, the International Energy Agency
estimates in their Stated Policies Scenario that nearly
$20 trillion of additional oil and natural gas investment
is needed by 2040, just to keep pace with demand
and avoid a shortfall in supply.
As we grow our operations and build long-term
shareholder value, we retain our strong commitment
to maintaining a safe work environment and have
achieved an almost 80-percent reduction in our
lost-time incident rate since 2000. We also continue
to pursue emission reduction efforts to mitigate the
risks related to climate change.
Our environmental efforts include partnerships and
collaborations with universities, government agencies,
and leading research organizations to develop
breakthroughs in lower-emission technologies.
Sustainable climate change solutions require a
united effort across industry, academia, government,
and broader society.
In 2019, ExxonMobil signed or extended eight
significant agreements to advance lower-emission
technologies that included working with the
U.S. Department of Energy’s National Renewable
Energy Laboratory and National Energy
Technology Laboratory.
As we enter this next decade, we focus on the
future – on meeting the needs of a growing global
society that seeks affordable, reliable energy with
continuously improving environmental performance.
Our progress in the past year, our advantaged
opportunity set, and our clear forward plan make us
confident we can deliver on our commitments and
create significant value for you, our shareholders.
Thank you for investing in ExxonMobil.
Darren Woods
Chairman and CEO
5

(circle size depicts relative size of population)
2015 energy demand per capita (1,000 BTU/person/day)
HIGH
MEDIUM
LOW
VERY HIGH
ENERGY DEMAND AND HUMAN DEVELOPMENT ²
U.N. 2017 Human Development Index
YEMEN BANGLADESH
INDIA MEXICO SPAIN UNITED STATES CANADA ICELAND
NIGERIA EGYPT
CHINA
1,00010010
AS QUALITY OF LIFE IMPROVES, ENERGY CONSUMPTION INCREASES
THE FUNDAMENTALS OF SUPPLY AND DEMAND1
What drives demand for energy? It begins with
people – billions of people striving for improved
living standards around the world.
This relationship is illustrated in the graphic below.
The United Nations uses the Human Development
Index to assess key dimensions of human development,
including health, education, and standards of living.
The chart illustrates the connection between these
key dimensions and per-capita energy consumption
by country.
The size of the circle represents population size.
In general, as quality of life improves, energy
consumption increases.
Affordable, reliable energy is therefore essential to
facilitate improvements in life expectancy, education,
and gross national income per capita, regardless of
where a person lives. Advancing billions of individuals
to a living standard experienced by many in developed
nations will require every available source of energy and
significant investment. Restricting access to existing
sources of affordable energy will adversely affect those
in emerging economies the most, as it reduces supply
and increases cost.
Consider that today, half the world’s population has
a life expectancy 12 years less than those living in
the United States, and receives about a third less
education. Close to a billion people still live without
electricity. This has enormous implications for the
future of energy and the products that make modern
life possible.
E X X O N M O B I L 2 0 1 9 S U M M A R Y A N N U A L R E P O R T
6
| E N E R G Y O V E R V I E W

In the next two decades, the global population
is expected to grow by 2 billion people to more than
9 billion; the middle class will expand to more
than 5 billion people; and the world’s demand for
energy is projected to grow by about 20 percent.
While this growing energy demand will result in
improved living standards for many in the developing
world, it will also lead to further emissions growth.
Strong demand for our products forms the
basis for ExxonMobil’s long-term strategy to grow
energy supply, earnings, cash flow, and value for
our shareholders.
Oil, which is energy-dense, affordable, and widely
available, is projected to remain the predominant
transportation fuel source. Natural gas, given its
emissions benefits relative to coal, will likely increase
in use, largely for power generation. More than half
of energy demand is expected to be met by oil and
natural gas through 2040.
NON-OECD DRIVES ENERGY DEMAND¹
(quadrillion BTUs, 2020 forward-data projections)
800
600
400
200
0
Non-OECD
OECD
20202010 2030 2040
PROJECTED 2040 GLOBAL ENERGY DEMAND BY FUEL
(quadrillion BTUs)
250
200
150
100
50
0Natural GasOil BiomassCoal Wind/Solar Hydro/Geo BiofuelNuclear
NATURAL GAS DEMAND IS EXPECTED TO GROW 35% BY 2040, LARGELY DRIVEN BY POWER GENERATION AND GIVEN ITS EMISSIONS BENEFITS VERSUS COAL
7

MEETING THE WORLD’S GROWING ENERGY NEEDS WHILE REDUCING EMISSIONS1
Addressing the dual challenge of providing energy
while managing emissions requires a long-term
perspective, competency in fundamental science and
engineering, and significant investment. ExxonMobil
has a 135-year history as an energy innovator and is
committed to doing its part to help society address
this critical challenge.
ExxonMobil continues to make progress on our
long-term plans. We do so with a commitment to
develop new resources to ensure the world has the
energy it needs while also minimizing the environmental
impacts, including the risks associated with greenhouse
gas emissions and climate change.
ExxonMobil is playing an important role in helping
to reduce climate risks through our commitment to
manage operational emissions; produce cleaner, more
advanced products; conduct fundamental research
into advanced technology solutions; and engage in
climate policy discussions.
Over the past two decades, ExxonMobil has invested
nearly $10 billion in technology and programs to reduce
emissions, resulting in highly efficient operations that
have eliminated or avoided more than 400 million
tonnes of CO2-equivalent emissions.
Near-term actions the company is taking to prepare for a lower-carbon future include:
• Expanding supplies of cleaner-burning natural gas
• Improving energy efficiency in operations
• Operating and investing in carbon capture and storage (CCS)
• Reducing flaring and methane emissions from operations
• Developing products – such as premium lubricants, lightweight plastics, and special tire liners – to help consumers improve efficiency and reduce emissions
• Supporting effective climate policy to address the risks related to climate change at the lowest societal cost
Longer-term efforts include:
• Progressing advanced biofuels from algae and cellulosic biomass for commercial transportation and petrochemicals
• Researching breakthroughs to improve the commercial viability of CCS for power generation and industrial applications
• Developing new and efficient technologies that further reduce emissions in refining and chemical facilities
E X X O N M O B I L 2 0 1 9 S U M M A R Y A N N U A L R E P O R T
8
| E N E R G Y O V E R V I E W

(billions of tonnes)
18
15
12
9
6
3
020171980 1990 2000 2010
Asia Pacific
ENERGY-RELATED CO2 EMISSIONS BY REGION
Europe
Russia/CaspianMiddle East
North America
Rest of world
ENERGY-RELATED CO2 EMISSIONS BY SECTOR
(billions of tonnes, 2017)
0 4 6 82 10 12 14
Power generation
Commercialtransportation
OECD Non-OECD
Industrial
Light-dutytransportation
Residential/commercial
NATURAL GAS / OIL COAL SOLAR / WIND
ADVANTAGES • Energy dense • Available• Affordable • Easily transportable
• Energy dense • Available• Affordable • Easily transportable
• Low emissions • Operating costs• Renewable
CHALLENGES • Emissions • Emissions • Intermittency • Transportability• Geographic compatibility
PERSPECTIVE Oil and natural gas represent 55% of global energy sources and about 35% of greenhouse gas emissions.3
Coal for power generation represents more than 25% of global energy-related CO2 emissions. Natural gas could cut these nearly in half.4
A 737-800 commercial aircraft would require about 10 times its empty weight in batteries to fly for five hours.5
ADVANCES REQUIRED
More efficient carbon capture and storage (CCS), biofuels, and energy-efficient manufacturing
More efficient CCS and pollutant mitigation Long-duration, high-capacity storage solutions
ExxonMobil is uniquely positioned to make significant
contributions in the global effort to reduce emissions.
By leveraging our deep scientific expertise, we
are developing technologies that address the
highest-emissions sectors. These sectors – power
generation, industrial, and commercial transportation
– collectively account for 80 percent of energy-related
CO2 emissions, and there are currently gaps in the
technology-solution set limiting broad deployment.
Existing alternatives, such as vehicle electrification and
power generated from wind and solar, play an important
role in reducing emissions, but only offer partial solutions.
Assuming the full electrification of the light-duty vehicle
fleet by 2040, global energy-related CO2 emissions could
potentially be reduced by about 5 percent.2 Every source
of energy has challenges, some of which are noted in
the table below. Technology advances are needed to
address the significant emissions that would remain even
EXISTING OPTIONS HAVE LIMITATIONS1
if society fully leveraged vehicle electrification and power
generation from wind and solar. Importantly, solutions
need to be affordable to encourage broad adoption,
especially in developing countries where economic
growth leads to increased energy use. The chart at
bottom left illustrates the impact of the economic
expansion in Asia Pacific and the associated energy-
related CO2 emissions increase, compared with more
mature economies in Europe and North America.
9

TECHNOLOGY SCALE INTEGRATION FUNCTIONAL EXCELLENCE
PEOPLE
Combined with a best-in-class portfolio and financial
capacity, ExxonMobil’s competitive advantages position
the company to deliver superior growth and value.
COMPETITIVE ADVANTAGES
E X X O N M O B I L 2 0 1 9 S U M M A R Y A N N U A L R E P O R T
10

ExxonMobil is a proven technology leader, securing nearly 70 percent more U.S. patents than our closest competitor over the past decade.1 Our investments in fundamental research lead to key advantages, such as lower operating and project costs and development of higher-value products to meet society’s evolving needs.
In the Upstream, technology advances such as artificial intelligence (AI) enable seismic data interpretation, enhance exploration activities, and improve subsurface understanding, all of which increase resource recovery. Technology also allows us to optimize developments and improve operations. Our digital partnership with Microsoft in the Permian, which is anticipated to improve capital efficiency and support production growth, is a prime example.
In Downstream and Chemical, we continue to develop catalyst and process technology to upgrade and improve our products. Our Rotterdam advanced hydrocracker uses proprietary technology to produce high-quality lube basestocks and ultra-low-sulfur diesel that generate higher returns than industry average.2 We have also developed and utilize steam-cracker technology with the broadest feed range in industry, which provides maximum raw-material flexibility.
ExxonMobil also works on lower-carbon energy solutions with leading universities, research institutions, and private firms. In 2019, we signed agreements with the U.S. Department of Energy’s National Labs, the Indian Institutes of Technology (Bombay and Madras), and private sector companies Global Thermostat and Mosaic Materials, to advance CCS, biofuels, and other emission-reducing technologies.
TECHNOLOGY
ARTIFICIAL INTELLIGENCE combined with reservoir
stratigraphy, advanced
materials science, and fluid
flow research enhance
exploration and recovery.
PATENTS ExxonMobil has secured
70% more U.S. patents than
its closest competitor over
the past 10 years.
COLLABORATIONS Eight new or extended
agreements add to the dozens
of R&D efforts under way with
leading universities, research
institutions, and private firms
to advance lower-carbon
energy solutions.
PHOTO: An ExxonMobil research scientist prepares a carbonate
fuel cell to study carbon capture processes.
11

ExxonMobil is among the largest producers of oil and natural gas in the world, operating in 45 countries, with expertise in unconventional, deepwater, LNG, heavy-oil, and conventional assets. Our Downstream and Chemical businesses span the globe. We are one of the world’s largest manufacturers and marketers of fuels and lubricants, and have Chemical sales of nearly 27 million tonnes per year.
The scale of our global business facilitates broad deployment of expertise, cost efficiencies, operational learnings, and preferred partnership opportunities.
In the Upstream, for example, our Permian Basin development includes standardized, modular facility designs applied across our 1.8 million net acres. In our Chemical business, world-scale manufacturing sites serve all major global markets and leverage a global supply chain network. Our Downstream refining capacity is among the largest in industry, and provides significant cost advantages, making us one of the lowest-cost operators in the world. This manufacturing advantage is important as the balance of supply and demand evolves, driving industry price cycles.
SCALE
PRODUCTION ExxonMobil produces about
4 million oil-equivalent barrels
per day, with expertise in
unconventional, deepwater,
LNG, heavy-oil, and
conventional assets.
CUBE DEVELOPMENT Our innovative development
approach in the Permian Basin
is made possible by the scale
of our operations, enabling us
to minimize our footprint and
maximize resource recovery.
SUPPLY CHAIN Our global Chemical supply
chain network completed
more than 500,000 safe
and reliable deliveries to
more than 6,000 customers
in 2019.
PHOTO: ExxonMobil’s Singapore facility is one of the largest
integrated refining and petrochemical complexes in the world.
E X X O N M O B I L 2 0 1 9 S U M M A R Y A N N U A L R E P O R T
12
| C O M P E T I T I V E A D V A N T A G E S

Integration across global value chains drives efficiency and profitability. It allows us to capture incremental value for our products and provides extensive operational and product flexibility to adapt to changing market demands. Integration also enables the capture of cost benefits and sharing of support organizations and facility infrastructure, yielding significant synergies.
Our expansive and integrated infrastructure and logistics network enable optimization at multiple points along value chains, providing opportunities to realize incremental value, particularly when markets become disconnected. An example is the integration of our North American operations that creates a pathway for supply-advantaged Permian crudes to reach our manufacturing assets on the U.S. Gulf Coast, and ultimately global markets. Over the past two years alone, we captured nearly $1 billion of incremental value from our integrated Permian supply.
Another example is the integration of key manufacturing facilities. Nearly 80 percent of our refining capacity is integrated with chemical or lubricant manufacturing, giving us the ability to shift production and optimize operations to capture higher margins and maximize production of the highest-value products.
INTEGRATION
PHOTO: The Spring, Texas, campus facilitates collaboration and
integrated decision making across functions and businesses.
$1 BILLION of incremental value was
captured over the past
two years from our
integrated Permian supply.
80 PERCENT of ExxonMobil’s refining
capacity is integrated with
our chemical or lubricant
manufacturing.
90 PERCENT of ExxonMobil’s chemical
capacity is integrated with
refineries or natural gas
processing plants.
13

ExxonMobil has a long and successful history of operating complex global businesses, which has resulted in the development of deep knowledge in critical disciplines and industry-leading execution capabilities. We have a strong culture of consistently doing the right things, the right way, to the highest standard.
As an example, consistent application of the highest operational and safety standards is achieved through global application of our Operations Integrity Management System. This system is leveraged across all operations to support safety, health, and environmental performance.
Functional excellence also drives improvements in business performance. For example, process optimization and debottlenecking projects in our Chemical business have enabled us to expand production capacity from existing units by more than 700,000 tonnes per year in the past decade – the equivalent of adding a world-scale polyethylene line. In the Upstream, proprietary geoscience and geophysics knowledge gained from decades of global exploration and development experience supported nine straight discoveries in Guyana – allowing ExxonMobil to organically grow the industry’s most profitable greenfield deepwater project.1
FUNCTIONAL EXCELLENCE
PHOTO: Extensive training and ongoing education ensure the
appropriate level of competency to manage the complexity of
manufacturing processes.
FIRST OIL The Liza Phase 1 Development
offshore Guyana began
production less than five years
after the first discovery –
much faster than the industry
average of nine years.2
GIANT DISCOVERIES Six new discoveries, four of
which contained recoverable
resources totaling more than
500 million oil-equivalent
barrels each, highlighted a
successful year in exploration.
HIGHGRADED PORTFOLIO With $5 billion of divestments in
2019, we continued to execute
our highgrading program
and remain focused on our
efforts to divest $15 billion of
non-strategic assets by 2021.
E X X O N M O B I L 2 0 1 9 S U M M A R Y A N N U A L R E P O R T
14
| C O M P E T I T I V E A D V A N T A G E S
14

PEOPLE
The benefits of our competitive advantages are realized only through the commitment and hard work of our dedicated people.
Our world-class workforce is our most important competitive advantage. We value diversity and have more than 160 nationalities represented in our employee base.
Our employees bring expertise across a wide range of disciplines, including engineering, behavioral sciences, mathematics, chemistry, and biology, to name just a few. ExxonMobil has more than 20,000 scientists and engineers, including 2,300 PhDs.
We encourage, respect, and reward unique perspectives and a commitment to innovation and excellence. The long-term nature of our business makes employee development a critical success factor. We take a personalized approach to developing professionals and leaders through a combination of challenging work assignments, training, and on-the-job experiences.
Most of our employees spend the majority of their career with ExxonMobil, and we utilize a career-long approach to professional development. The average length of service of our career employees is longer than 30 years, providing ExxonMobil with unparalleled industry experience and in-house expertise to deploy across our global portfolio.
DIVERSITY More than 160 nationalities are
represented in ExxonMobil’s
employee base, enhancing
collaboration, decision making,
and bottom-line results.
EXPERIENCE Career employees at
ExxonMobil average more
than 30 years of service.
EXPERTISE We employ more than
2,300 PhDs, 20,000 scientists
and engineers, and many
others with deep
competencies in their
respective areas of expertise.
PHOTO: Subject matter technical experts support innovation
and best practices across ExxonMobil’s operations.
15

Countries with ExxonMobil operations
Upstream
Downstream
Chemical
ExxonMobil works to safely provide the energy and products that advance modern life. Organized and managed by value chain, the
company oversees a diverse global portfolio of high-quality assets and advantaged projects across our Upstream, Downstream, and
Chemical business lines.
BUSINESS LINES ORGANIZED BY VALUE CHAINS
E X X O N M O B I L 2 0 1 9 S U M M A R Y A N N U A L R E P O R T
16

UPSTREAM
We are one of the world’s largest producers of oil and natural gas, and have unconventional, deepwater, LNG, heavy-oil, and conventional operations. We use innovation and industry- leading technology across our organization to safely and responsibly explore for and develop energy to meet global demand.
DOWNSTREAM
As one of the largest refiners in the world, we manufacture and distribute products derived from crude oil and other feedstocks. Our global network of manufacturing plants, transportation systems, and distribution centers provides fuels, basestocks, finished lubricants, and other high-value products to customers.
CHEMICAL
We operate one of the largest chemical manufacturing companies in the world. Our basic chemicals and commodity and performance products serve as the building blocks for a broad range of consumer goods and industrial products.
UNCONVENTIONAL
DEEPWATER
LNG
HEAV Y OIL
CONVENTIONAL
FUELS
LUBES
BASIC CHEMICALS
COMMODIT Y AND PERFORMANCE PRODUCTS
17

E X X O N M O B I L 2 0 1 9 S U M M A R Y A N N U A L R E P O R T
18

UPSTREAM BUSINESS OVERVIEW
ExxonMobil produces about 4 million oil-equivalent barrels of net oil and natural gas per day. We are active in
45 countries, and we participate in all areas of the upstream global value chain, including exploration, development,
production, and marketing. Over the coming decades, trillions of dollars of industry investments will be necessary
to increase supplies of oil and natural gas to meet rising global demand and overcome the natural decline rates of
producing reservoirs.2 Our investments focus on unconventional, deepwater, and LNG value chains and represent
the best portfolio of opportunities since the Exxon and Mobil merger 20 years ago.
PHOTO: ExxonMobil is the most active operator in the Permian Basin.3
PERMIAN LIQUIDS GROWTH OF 79%1
FIRST OIL ACHIEVED IN GUYANA LESS THAN 5 YEARS AFTER DISCOVERY
5 ADDITIONAL DISCOVERIES OFFSHORE GUYANA
UPSTREAM
19

Our Upstream business is organized into five
businesses: unconventional, deepwater, LNG,
heavy oil, and conventional. This organizational
model is underpinned by deep technical and
commercial capabilities along each value chain.
UNCONVENTIONAL: PERMIANWe produced an average of 272,000 oil-equivalent
barrels per day from our unconventional operations in
the Permian Basin in 2019, an almost 80-percent year-
on-year production increase. This growth came from
more than 175 new wells across the Midland Basin
and more than 125 new wells in the Delaware Basin,
where we continue to reduce drilling and completion
costs. Our inventory of more than 8,000 well locations
and an estimated net recoverable resource of 10 billion
oil-equivalent barrels across 1.8 million net acres,
position us to significantly increase production levels
in the years ahead.1
Deploying leading-edge technology
The unconventional business is an ideal place to deploy
ExxonMobil’s proven technological capabilities to
accelerate learning and inform development plans.
Using in-house geomechanical laboratory capabilities and
downhole technologies, such as fiber optic systems, we
can gather massive amounts of data to better define
fracture geometry and well spacing. Combining this
information with proprietary reservoir-simulation
technology enables us to improve depletion planning and
maximize recovery rates across stacked producing horizons.
Applying an innovative development approach at scale
Cube development allows us to drill multiple horizontal
wells in stacked intervals from a single surface location.
By applying this unique approach across our acreage,
we can safely and efficiently bring online large sections
of producing acreage in a shorter period of time, which
maximizes recovery, reduces costs, and minimizes
the environmental footprint of our operations. Most
importantly, this development approach maximizes
recovery by minimizing or removing potential parent-
child production impacts that are caused by pressure
depletion. In addition, we realize greater capital
efficiencies from drilling and completion operations
and surface-treating facilities, enabled by large tracts
of contiguous acreage and development at scale.
This approach enables a development plan and return
profile that is resilient across a wide range of prices
and market scenarios.
Investing in integration
We have invested in infrastructure from New Mexico
to the U.S. Gulf Coast to provide logistics flexibility
and maximize the integrated value of our growing
Permian production. We have advanced construction of
gathering and processing facilities, including the Cowboy
central delivery point in the Delaware Basin. Integration,
including transportation and downstream investments,
enables us to maximize our value chain contributions
from resource development through to fuels, lubes,
and chemicals production.
DELAWARE BASIN DRILLINGAND COMPLETING COSTS
(percent, indexed to second half 2018)
100
90
80
70
60
50Second half
2018First half
2019Second half
2019
UPSTREAM VALUE CHAINS
NET LIQUIDS GROWTH OF 120 KBD WORLDWIDE
E X X O N M O B I L 2 0 1 9 S U M M A R Y A N N U A L R E P O R T
20
| U P S T R E A M

UP CLOSE: SCALE AND TECHNOLOGY IN THE PERMIAN
Capital-efficient cube development across multiple stacked producing horizons maximizes the recovered resource by minimizing or removing potential parent-child production impacts caused by pressure depletion. Applying this approach at scale differentiates our operations from competitors. Above, seven rigs drill stacked targets within our Permian Basin acreage. Simultaneously accessing multiple shale layers reduces costs and minimizes surface footprint.
LEVERAGING EXXONMOBIL’S UNIQUE CAPABILITIES, SCALE, AND TECHNOLOGY ACROSS OUR PERMIAN OPERATIONS
Drilling rigs
(not to scale)Surface
6,000'
12,000'
Future
opportunitie
s
Current cube
development—
multiple
stacked
producing
horizons
Future
opportunitie
s
21

DEEPWATER: GUYANAIn Guyana, our exploration success continued in 2019.
Five additional discoveries brought the total to 15 at
year end and increased the estimated oil-equivalent
recoverable resource to more than 8 billion barrels.
We are efficiently developing these discovered
resources while maintaining an active exploration pace
to test multiple remaining prospects across all blocks.
ExxonMobil’s proprietary reservoir-simulation technology
strengthens project development and depletion
planning, and helps to identify additional synergies
throughout the multiple phases of development.
The Liza Phase 1 development achieved first oil in
December 2019, less than five years after initial discovery,
in approximately half the time of the industry average
for projects of this size. The Liza Phase 2 development
is on track for start-up in 2022. A subsequent phase of
development, Payara, is targeted to start up in 2023,
pending government approval and a final investment
decision. These three developments, combined with two
additional floating production, storage, and offloading
vessels, are expected to produce more than 750,000
barrels of oil per day by 2025.
UP CLOSE: TECHNOLOGY – MACHINE LEARNING TRANSFORMS SUBSURFACE CHARACTERIZATION
ExxonMobil applies machine learning and artificial intelligence to leverage a global repository of seismic data, which creates insights that maximize value for resource owners and shareholders. Complemented by traditional subsurface techniques and the expertise of our explorers, these insights enable rapid identification of opportunities and subsurface scenario evaluation to support development and exploration activities that maximize recovery and value from the resource.
For recent discoveries in Guyana, this technology improved resource assessment and reservoir characterization. It also enabled the integration of appraisal wells, supporting faster, more efficient development planning and execution.
GUYANA “BY-THE-BIT ”CUMULATIVE DISCOVERED RESOURCE
(gross recoverable resource,billions of oil-equivalent barrels)
9
6
3
02015 2016 2017 2018 2019
We have worked to develop a strong partnership with
the government and people of Guyana as it becomes a
significant global producer. As part of our commitment
to develop the value of this opportunity for the country
and its people, more than 700 local vendors and
suppliers and nearly 1,900 Guyanese have worked on
our developments to date.
PHOTO: Use of proprietary technology enables ExxonMobil geoscientists to efficiently identify subsurface value.
8+ BILLION OIL-EQUIVALENT BARRELS OF RECOVERABLE RESOURCE
E X X O N M O B I L 2 0 1 9 S U M M A R Y A N N U A L R E P O R T
22
| U P S T R E A M

DEEPWATER: BRAZILWe strengthened our global portfolio by capturing
new blocks offshore Brazil, one of the world’s most
promising exploration plays. ExxonMobil’s acreage
position is among the largest in Brazil, with 2.5 million
net acres. We operate more than 60 percent of our
28-block portfolio.1
The Uirapuru Araucaria-Sul well spud in late 2019,
beginning a multiyear exploration drilling program
to test prospects with multibillion-barrel potential.
Multiple exploration wells are targeted for 2020–2021
across the Santos, Campos, and Sergipe basins.
In addition to the exploration program, we finalized
the purchase of an additional 3.5 percent interest in
the BM-S-8 block (Bacalhau field, formerly Carcara),
increasing our net interest to 40 percent. A final
investment decision for Bacalhau Phase 1 is expected
in late 2020.
DEEPWATER: GLOBAL EXPLORATIONOur deepwater exploration portfolio includes plans
to drill multiple wells in 2020, including opportunities
in Guyana, Brazil, and the Eastern Mediterranean.
ExxonMobil maintains one of the most active
deepwater exploration programs in the industry
with deepwater acreage positions in 27 of the
34 countries where we are actively exploring.
BRAZIL NET ACREAGE VERSUSIOC COMPETITORS²
(millions of acres)
3
2
1
0ExxonMobil BP Shell Total Equinor Chevron
S e r g i p e B a s i n
C a m p o sB a s i n
S a n t o s B a s i n
BM-S-8
200 miles
Uirapuru
Tita
C-M-479
C-M-37C-M-67
SEAL-351SEAL-428
SEAL-637SEAL-501 SEAL-573
SEAL-430SEAL-503SEAL-505SEAL-575
NorthCarcara
C-M-657C-M-709C-M-753C-M-789S-M-536S-M-647
C-M-210C-M-277C-M-344C-M-346C-M-411C-M-413
AtlanticOcean
BRAZIL
2017 captures
2018 captures
2019 captures
UP CLOSE: SCALE – BRAZIL
ExxonMobil holds a leading acreage position with approximately 2.5 million net acres, having added more than 460,000 net acres in 2019. We operate more than 60 percent of this acreage.1
Multiple exploration wells are planned for 2020–2021. Our success in Guyana provides learnings and capabilities to leverage in Brazil.
B R A Z I L
S e r g i p e B a s i n
C a m p o sB a s i n
S a n t o s B a s i n
BM-S-8
200 miles
Uirapuru
Tita
C-M-479
C-M-37C-M-67
SEAL-351SEAL-428
SEAL-637SEAL-501 SEAL-573
SEAL-430SEAL-503SEAL-505SEAL-575
NorthCarcara
C-M-657C-M-709C-M-753C-M-789S-M-536S-M-647
C-M-210C-M-277C-M-344C-M-346C-M-411C-M-413
23

LNG: PAPUA NEW GUINEA (PNG) The ExxonMobil-operated PNG LNG facility continued
to operate above nameplate capacity, achieving record-
setting daily production levels, surpassing 8.5 million
tonnes per year in 2019. Exploration activity added
future flexibility with the successful Muruk-2 well, which
extended the Muruk gas discovery. ExxonMobil and its
partners reached agreement with the PNG government
on the Papua gas development and are working to reach
alignment on the P’nyang development. The proximity
of PNG to premium Asian markets and the ability to
leverage existing infrastructure support the three-train
expansion project.
LNG: MOZAMBIQUEIn Mozambique, we progressed the Area 4 offshore
LNG development, and construction of the 3.4-million-
tonnes-per-year Coral Floating LNG (FLNG) vessel is on
schedule for start-up in 2022. Rovuma, the next phase
of development, consists of two 7.6-million-tonnes-
per-year onshore trains. The Rovuma development
plan received approval in 2019 from the government of
Mozambique, and in preparation for a final investment
decision, we secured preferred contractors and
commenced detailed front-end engineering and design.
LNG: GOLDEN PASS ExxonMobil and Qatar Petroleum reached a final
investment decision on the Golden Pass export project,
building on a long history of successful collaboration.
Construction of the approximately 16-million-tonnes-
per-year liquefaction facility in Sabine Pass, Texas,
commenced in 2019, and is on track for a 2024
start-up. With access to abundant natural gas supply in
North America, Golden Pass is well positioned to
export low-cost LNG to customers in Europe and Asia.
UP CLOSE: SCALE – GLOBAL LNG SUPPLY
ExxonMobil is an industry leader in liquefied natural gas (LNG) with participation in production of 86 million tonnes per year. We supply more than 15 markets around the world and participate in nearly 25 percent of global LNG production.1 This leading position comes from decades of innovative technical experience and superior project management capabilities in complex environments. Advantaged locations, world-class resources, and strong project performance will enable ExxonMobil to continue to add low cost-of-supply LNG production in the coming decade.
PHOTO: Golden Pass LNG is expected to start up in 2024, leveraging existing infrastructure to support a low cost of supply.
WE PARTICIPATE IN NEARLY 25% OF THE WORLD’S LNG PRODUCTION
E X X O N M O B I L 2 0 1 9 S U M M A R Y A N N U A L R E P O R T
24
| U P S T R E A M

UP CLOSE: FUNCTIONAL EXCELLENCE – CONVENTIONAL OPERATIONS
Our conventional operations span the globe. We deliver value in a safe and environmentally responsible manner by leveraging deep functional expertise and experience, industry best practices, and ExxonMobil’s Operations Integrity Management System.
HEAVY OILExxonMobil and its majority-owned affiliate Imperial Oil
Limited (IOL) have a significant heavy-oil-asset portfolio
with 442,000 barrels per day of total production.
Building on investments to improve reliability, the Kearl
project continued strong production performance in
2019, averaging 205,000 barrels per day. Production
is forecast to increase to 240,000 barrels per day in
2020 through installation of additional ore crushing
and hydrotransport capacity. We continue to deploy
new technologies to enhance production and reduce
operating costs. These include drone trials to assess ore
quality and optimize mining plans, as well as material
enhancements, estimated to double the life span of
ore-processing equipment components.
Cold Lake in-situ operations delivered more than 140,000
barrels per day in 2019, with plans under way to further
increase production. Technology projects, including
steam-flood optimization to enhance current production,
as well as new projects in the Grand Rapids reservoir, will
further strengthen the Cold Lake asset portfolio.
CONVENTIONAL Conventional oil and natural gas is the largest and
most diverse value chain in the Upstream portfolio,
and has operations spanning a wide range of operating
conditions in nearly 20 countries. Our conventional
assets produce more than 1.3 million net oil-equivalent
barrels every day. In our mature conventional operations,
we are focused on maximizing cash flow generation
through the application of proprietary technology, such
as production surveillance and optimization algorithms.
This helps minimize decline and increase recovery
efficiency, supporting production and sales of approximately
1 million net barrels of oil and more than 2 billion net
cubic feet of natural gas per day. Our assets in Russia,
Indonesia, Kazakhstan, and the United Arab Emirates all
recorded their highest-ever daily production rates in 2019.
PHOTO: The Berkut facility (Sakhalin, Russia) operates in a remote sub-Arctic environment.
25

4 OF THE TOP 10 CONVENTIONAL OIL AND GAS DISCOVERIES IN 2019
Upstream presence
2019 capture
2019 “by-the-bit” discovery
2019 asset sale
PORTFOLIO HIGHGRADING ExxonMobil invests in exploration and growth assets to
maintain a pipeline of high-quality future developments
to offset the natural decline of producing assets. We
continued to fill this pipeline in 2019, and had four
of the industry’s top 10 conventional oil and natural
26 million acres added to exploration portfolio in 2019
4 million barrels per day oil-equivalent production
$5 billion in asset sales to highgrade the portfolio
$4.5 BILLION from Norway asset sale2
GLAUCUS DISCOVERY AND 4 BLOCKS added in Eastern Mediterranean
5 DISCOVERIES offshore Guyana
10+ MILLION ACRES added in Africa
gas discoveries.1 In addition to efforts to optimize the
portfolio through exploration, we are progressing
efforts to divest $15 billion of non-strategic assets by
2021. We regularly evaluate acquisition and divestment
opportunities to ensure that material, high-quality assets
anchor our portfolio.
E X X O N M O B I L 2 0 1 9 S U M M A R Y A N N U A L R E P O R T
26
| U P S T R E A M

UPSTREAM: KEY PROJECTS
Facility capacity (gross) ExxonMobil
working interest (%) OperatorRECENTLY COMPLETED
Liquids (Kbd)
Gas (Mcfd)
Angola AB32 Kaombo Split Hub – Norte 115 – 15 C
AB32 Kaombo Split Hub – Sul 115 – 15 C
Canada Hebron 150 – 35 E
Guyana Liza Phase 1 120 – 45 E
FUTURE (PROJECTED)
Australia Gorgon Expansion 20 2,700 25 C
Brazil Bacalhau (formerly Carcara) Phase 1 220 – 40 C
Canada Kearl Supplemental Crusher 40 – 100 E
Syncrude Mildred Lake Extension 210 – 25 J
Guyana Liza Phase 2 220 – 45 E
Payara 220 – 45 E
Future Phases 230+ – 45 E
Iraq West Qurna I 1,600 – 34 J
Kazakhstan Kashagan Compression and Debottlenecking 450 450 17 J
Tengiz Expansion 655 – 25 C
Mozambique Coral FLNG 5 575 25 C
Rovuma LNG Phase 1 10 2,400 25 E
PNG Papua LNG 15 800 28 E
PNG LNG Expansion – 400 33 E
Qatar Barzan 90 1,400 7 J
Romania Neptun Deep – 630 50 E
Russia Far East LNG – 880 30 E
Sakhalin-1 Central and South Dagi 40 – 30 E
U.A.E. Upper Zakum Expansion (multiple phases) 1,000 – 28 J
U.S. Golden Pass LNG Export – 2,500 30 J
Vietnam Ca Voi Xanh (Blue Whale) 3 580 64 E
Kbd = thousand barrels per day Mcfd = million cubic feet per day Operator: E = ExxonMobil operated C = co-venturer operated J = joint operations
PHOTO: PNG LNG serves premium Asian markets.
27

E X X O N M O B I L 2 0 1 9 S U M M A R Y A N N U A L R E P O R T
28

DOWNSTREAM BUSINESS OVERVIEW
ExxonMobil’s Downstream business is one of the world’s largest manufacturers and marketers of fuels and lubricants
and sells more than 5.4 million barrels per day of petroleum products. The commercial success of well-known brands
and high-quality products is underpinned by our strong customer focus and supply reliability.
Advantaged investments will increase production and sales of key products globally. These include diesel and
commercial jet fuel, and lube basestocks, where demand is projected to grow by more than 25 percent and 10 percent,
respectively, by 2040.1 Our growth plans include seven major projects, including three recently completed in Antwerp,
Rotterdam, and Beaumont.
PHOTO: The Antwerp coker supports ExxonMobil’s integrated operations in northwest Europe.
3 MAJOR PROJECTS ONLINE, SUPPORTING LONG-TERM DEMAND
FOR HIGHER-VALUE PRODUCTS
PETROLEUM PRODUCT SALES OF MORE THAN 5.4 MBD
MORE THAN 20,000 BRANDED RETAIL OUTLETS
DOWNSTREAM
29

The Downstream business, organized along fuels and
lubes value chains, provides high-value products and
services to customers, supported by a global supply
chain and manufacturing network. Our commitment
to innovation, technology, brand, and sustainability
drives value for customers and shareholders.
FUELSThe integrated fuels value chain includes crude
acquisition, manufacturing, distribution, and sales of fuels
products through retail, commercial, and supply channels.
The fuels business is organized around geographic
UP CLOSE: TECHNOLOGY – SINGAPORE RESID UPGRADE PROJECT
We are investing in the Singapore integrated complex to increase production capacity of high-value lube basestocks and distillates. A combination of proprietary catalyst and process technologies will increase the site’s competitiveness by converting low-value refining and chemical feeds into high-value products. The project is expected to significantly increase earnings potential by leveraging proprietary technologies and site integration. Construction began in 2019 and start-up is expected in 2023.
markets, providing line-of-sight on market dynamics
at the local level, while retaining regional and global
oversight for the complete end-to-end business.
Manufacturing operations and logistics
ExxonMobil is one of the world’s largest refiners, and has
nearly 5 million barrels per day of distillation capacity at
21 refineries. An integrated, global manufacturing and
logistics footprint enables reliable supply of high-quality,
high-value products. We also have extensive optimization
capabilities, and approximately 80 percent of our refining
capacity is integrated with chemical or lube basestocks.
Advantaged manufacturing and logistics investments
In the past two years, we completed three major projects,
including the Beaumont hydrofiner, Antwerp coker, and
Rotterdam hydrocracker. Four additional projects are
in development, including a hydrofiner at Fawley, light-
crude expansion at Beaumont, resid upgrade facilities
in Singapore, and the Permian-to-U.S. Gulf Coast joint-
venture pipeline. Investments in these projects leverage
our integrated manufacturing and logistics footprint,
scale, and proprietary process and catalyst technology.
These projects are expected to deliver long-term earnings
growth and improved competitiveness by upgrading
low-value raw materials into higher-value products and
lube basestocks.
Chemical plant
FUEL OIL
HEAVY BY-PRODUCT
BASESTOCKS
CLEAN FUELS
E X XO N M O B I L P R O P R I E TA R Y T E C H N O LO GY
Refinery
DOWNSTREAM VALUE CHAINS
EXPANDING DOWNSTREAM FUELS VALUE CHAIN INTO NEW MARKETS
E X X O N M O B I L 2 0 1 9 S U M M A R Y A N N U A L R E P O R T
30
| D O W N S T R E A M

UP CLOSE: INTEGRATION – PERMIAN AND GULF COAST OPERATIONS
ExxonMobil has one of the largest positions in the Permian Basin with 10 billion net oil-equivalent barrels of estimated recoverable resource. Our operations provide low-cost feedstocks to our Downstream business, supporting U.S. Gulf Coast investments and exports of Permian crude to global markets.
Our logistics system – including marine and inland transportation networks, terminals, pipelines, and storage capacity – is integrated from the wellhead to our manufacturing facilities. This enables strict quality specs on non-blended feedstocks and maximizes the value of Upstream production, while optimizing our operations and finished product mix.
We expect Permian production to be capable of providing 75 percent of required light-crude feedstock to our refineries by 2022. Investments at our Beaumont refinery will increase refining capacity of lighter crudes from the Permian by 250,000 barrels per day. Permian production will also generate significant volumes of chemical feedstocks, supporting production of more than 3 million tonnes per year of ethylene.
Expanding retail and commercial fuels
Our high-quality fuels are sold through a global network
of more than 20,000 retail stations under the Exxon,
Mobil, and Esso brands, and through commercial
channels. We selectively enter new growth markets
where we leverage supply from our advantaged
manufacturing and logistics footprint, including recent
market expansions in Mexico and Indonesia.
The retail fuels network is primarily operated through
branded wholesalers with long-term supply agreements.
We invest in the Exxon, Mobil, and Esso fuel brands,
including through the development of digitally enabled
marketing offers and high-quality products, such as
Synergy gasoline and Synergy Diesel Efficient fuels.
A diverse commercial fuels offering serves marine,
aviation, road transportation, mining, and wholesale
customers who value the reliability and product quality
ExxonMobil provides. We are also growing commercial
market sales, including expanding Asia Pacific activities, by
leveraging our integrated refining complex in Singapore.
These fuels value chain investments support improved
market position and brand-driven premium pricing.
10 billion net oil-equivalent barrels
of recoverable resource
>2,500 miles of pipeline network1 50% increase
in light-crude processing capability by 2022
(graphic representation of production flow, not to scale)
OUR WORLDWIDE FUELS VALUE CHAIN INCLUDES 21 REFINERIES
31

LUBESThe lubes value chain includes crude acquisition and
the development, production, and sale of basestocks
and finished lubricant products. The lubes business is
organized into two global business units: basestocks
and specialties, and finished lubricants. This global
structure enables consistent, market-facing execution
and reliable supply.
Our finished lubricants business is further divided
into five geographic businesses that enable us to develop
and deliver targeted lubricant solutions to meet customer
needs in those markets. ExxonMobil is integrated across
the entire lubes value chain, with six lube basestock
refineries and 21 finished lubricant blending facilities.
Leading brands and proprietary technology support
the wide-ranging offer of products and services we
provide to customers in markets and industry sectors
around the world.
Expanding basestocks
As the world’s largest manufacturer of basestocks,
ExxonMobil brings some of the most efficient production
capacity to the base oils marketplace – enabling reliable
supply of innovative lube basestocks that provide
consistent quality. Product integrity and supply reliability
form the foundation of our basestock production.
We develop basestock products leveraging leading-edge
technology and significant ongoing investment in research
and development. More than 50 percent of our global
basestock supply is produced using proprietary catalyst
technology. With the recent completion of the advanced
hydrocracker at our Rotterdam refinery, ExxonMobil is
now the largest Group I and Group II basestocks producer
in the world.
Growing synthetic lubricants
ExxonMobil is the market leader in high-value synthetic
lubricants. Growth in synthetics to meet global consumer
demand for higher-performance products remains a
strategic priority, and includes significant investments in
growing markets, including China, India, and Indonesia.
Marketing investments and expansion of blending and
packaging capacity support this high-value sales growth.
In addition, we are expanding distribution to additional
population centers through new marketing channels,
including e-commerce in China, where the Mobil 1 brand
is a sales leader on the Chinese web portal Alibaba.
Mobil 1 synthetic lubricant is the worldwide leader in
synthetic motor oils. Formulated to handle extreme
temperatures and the harshest conditions of powerful
engines, manufacturers of 70 high-performance vehicle
models choose it as their factory fill. Mobil 1 is the
top-selling motor oil (conventional or synthetic) in the
U.S. retail channel, reflecting consumer confidence
in our brand.
The Mobil EV product line was launched in 2019 and provides high-performance fluids for gears, bearings, and thermal management in electric vehicles (EVs). Strong technical formulation expertise and supply relationships with vehicle manufacturers provide exceptional market insight, and strongly position ExxonMobil for increasing the value of our lubricant sales in this rapidly evolving and growing automotive segment.
Chevron Shell Total
BASESTOCKS MARKET LEADER
(market position1, percent)
15
12
9
6
3
0ExxonMobil
UP CLOSE: TECHNOLOGY – MOBIL EV
E X X O N M O B I L 2 0 1 9 S U M M A R Y A N N U A L R E P O R T
32
| D O W N S T R E A M
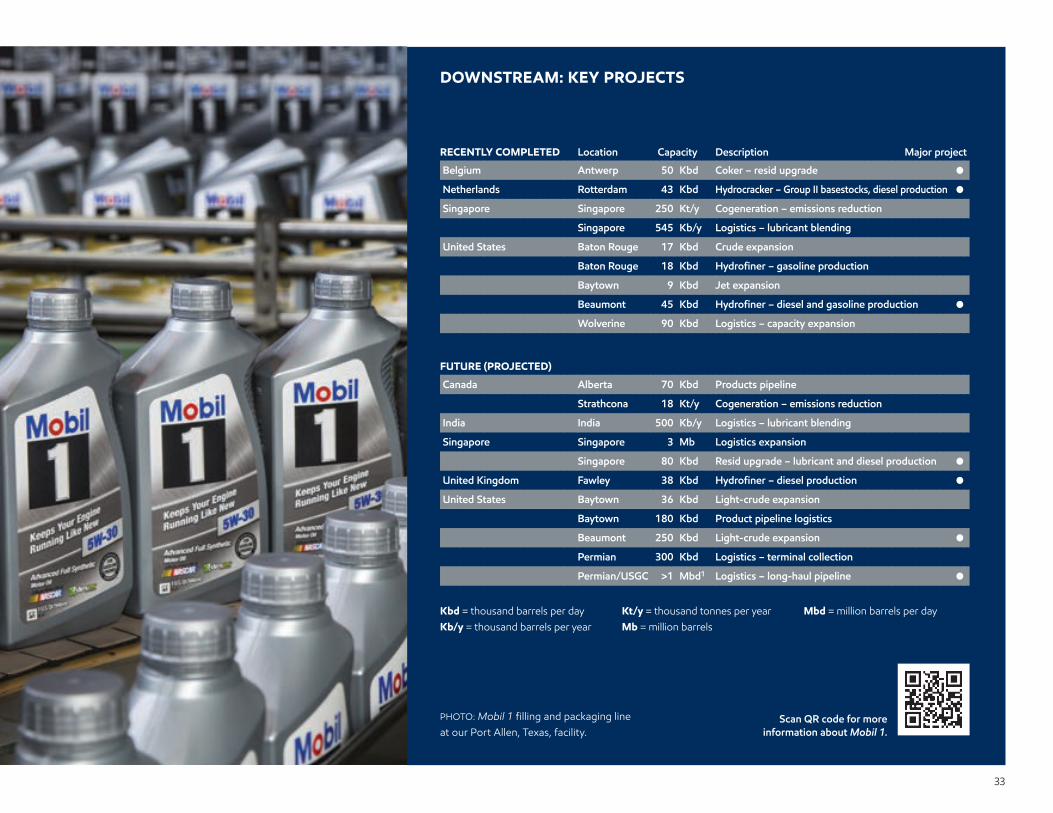
RECENTLY COMPLETED Location Capacity Description Major project
Belgium Antwerp 50 Kbd Coker – resid upgrade ●
Netherlands Rotterdam 43 Kbd Hydrocracker – Group II basestocks, diesel production ●
Singapore Singapore 250 Kt/y Cogeneration – emissions reduction
Singapore 545 Kb/y Logistics – lubricant blending
United States Baton Rouge 17 Kbd Crude expansion
Baton Rouge 18 Kbd Hydrofiner – gasoline production
Baytown 9 Kbd Jet expansion
Beaumont 45 Kbd Hydrofiner – diesel and gasoline production ●
Wolverine 90 Kbd Logistics – capacity expansion
FUTURE (PROJECTED)
Canada Alberta 70 Kbd Products pipeline
Strathcona 18 Kt/y Cogeneration – emissions reduction
India India 500 Kb/y Logistics – lubricant blending
Singapore Singapore 3 Mb Logistics expansion
Singapore 80 Kbd Resid upgrade – lubricant and diesel production ●
United Kingdom Fawley 38 Kbd Hydrofiner – diesel production ●
United States Baytown 36 Kbd Light-crude expansion
Baytown 180 Kbd Product pipeline logistics
Beaumont 250 Kbd Light-crude expansion ●
Permian 300 Kbd Logistics – terminal collection
Permian/USGC >1 Mbd1 Logistics – long-haul pipeline ●
Kbd = thousand barrels per dayKb/y = thousand barrels per year
Kt/y = thousand tonnes per yearMb = million barrels
Mbd = million barrels per day
PHOTO: Mobil 1 filling and packaging line at our Port Allen, Texas, facility.
Scan QR code for more information about Mobil 1.
DOWNSTREAM: KEY PROJECTS
33

E X X O N M O B I L 2 0 1 9 S U M M A R Y A N N U A L R E P O R T
34

CHEMICAL BUSINESS OVERVIEW
ExxonMobil’s Chemical business is among the largest in the world with annual sales of nearly 27 million tonnes.
The company provides products that sustainably support improved living standards around the globe. Worldwide
demand for chemicals is expected to rise by approximately 45 percent by 2030, underpinned by an expanding
middle class and a corresponding increase in demand for appliances, cars, clothing, and other consumer goods
and packaging.1 ExxonMobil is focused on these growth sectors, delivering performance products that leverage
technology for higher-value end uses. Investment plans include two major steam crackers and multiple derivative
projects, which leverage a global footprint of 20 manufacturing sites and a customer base in more than 130 countries.
With industry-leading product development capability built through decades of technology leadership, ExxonMobil
delivers performance products that provide the technical attributes customers value.
PHOTO: The new performance polyethylene plant in Beaumont, Texas, started up in July 2019.
13 CHEMICAL GROWTH PROJECTS
3 NEW FACILITIES OPERATING ABOVE DESIGN RATES
LONG-TERM FUNDAMENTALS SUPPORT GROWTH STRATEGY
CHEMICAL
35

In ExxonMobil’s Chemical business, the basic chemicals
value chain feeds our commodity and performance
product value chain. Chemical is deeply integrated
with our Upstream and Downstream, leveraging access
to low-cost feedstocks and optimization capability not
available to standalone chemical companies.
BASIC CHEMICALSThe basic chemicals value chain leverages proprietary
technology to produce building blocks for many of the
products essential to modern life. This value chain is
comprised of olefins, aromatics, and glycols, and serves
both external industry customers and our internal
commodity and performance products value chain.
Olefins feed production of polyethylene, polypropylene,
and other polymers used in a range of applications,
including plastic packaging, automotive bumpers and
interiors, tires, construction materials, food and drink
containers, and appliances. Aromatics are vital for a wide
range of consumer and industrial products, including
polyester resins, fibers for clothing, and insulation.
Glycols are also used in the manufacture of polyester
resins, films, and fibers.
Integration, advanced optimization tools, and flexible
process design enable us to optimize our basic
chemicals operations and provide advantaged feed
for the commodity and performance product value
chain. Our facilities use proprietary technology that
provides feedstock flexibility, from light gases to crude
U P S T R E A M C H E M I C A L V A L U E C H A I N S
C O M M O D I T YA N DP E R F O R M A N C EP R O D U C T S
B A S I CC H E M I C A L S
D O W N S T R E A M
Crude Refining
Natural Gas Liquids
oil. This flexibility enables economic optimization across
a variety of market environments. Integration with our
refining operations provides direct access to a range of
advantaged feedstocks, from refinery gas to heavy fluids.
PERFORMANCE PRODUCT SALES GROWTH¹
(volume, indexed)
350
300
250
200
150
100
2007 2010 2015 2020 2025
ExxonMobilPerformanceProducts
Estimated
Globalcommoditychemicals
Global GDP
Our Chemical business is organized into two key value chains. Basic chemicals are the fundamental building blocks. They are primarily consumed as feedstock to make commodity and performance products, but can also be sold to external industry customers. We leverage this optionality to secure the highest value for our production.
CHEMICAL VALUE CHAINS
90% OF OUR CHEMICAL CAPACITY IS INTEGRATED WITH REFINERIES OR NATURAL GAS PROCESSING PLANTS
UP CLOSE: EXXONMOBIL CHEMICAL
E X X O N M O B I L 2 0 1 9 S U M M A R Y A N N U A L R E P O R T
36
| C H E M I C A L

COMMODITY AND PERFORMANCE PRODUCTSMuch like other areas of our business, the future
of our Chemical business is supported by global
population growth, an increase in middle-class
households, and demand for improved living standards,
primarily in Asia Pacific. These factors are projected
to drive long-term demand growth for packaged
goods, appliances, automobiles, and clothing. Many
of these modern goods are made possible by
ExxonMobil’s proprietary scientific and technological
advancements in petrochemicals and polymers.
Performance products command a premium over
commodity products due to their enhanced properties
and the significant value they bring to customers and
end-users. Customers use ExxonMobil’s performance
products in a wide range of consumer applications,
including vehicles, diapers, food packaging, and drilling
fluids. Performance applications enable tougher and
lighter products that use less material, save energy
and cost, and reduce waste. ExxonMobil makes
more than 200 performance products leveraging
advantaged basic chemical building blocks.
UP CLOSE: TECHNOLOGY – THE BENEFITS OF PERFORMANCE PRODUCTS1
1.7x better film seal
EXCEED XP POLYETHYLENE
Up to
PACKAGE FRESHNESS
4.6x tougher
ACHIEVE ADVANCED POLYPROPYLENE
Up to
CAR PARTS STRENGTH
90% recycled content
VISTAMAXX PERFORMANCE POLYMER
Enables up to
RECYCLABILITY
37
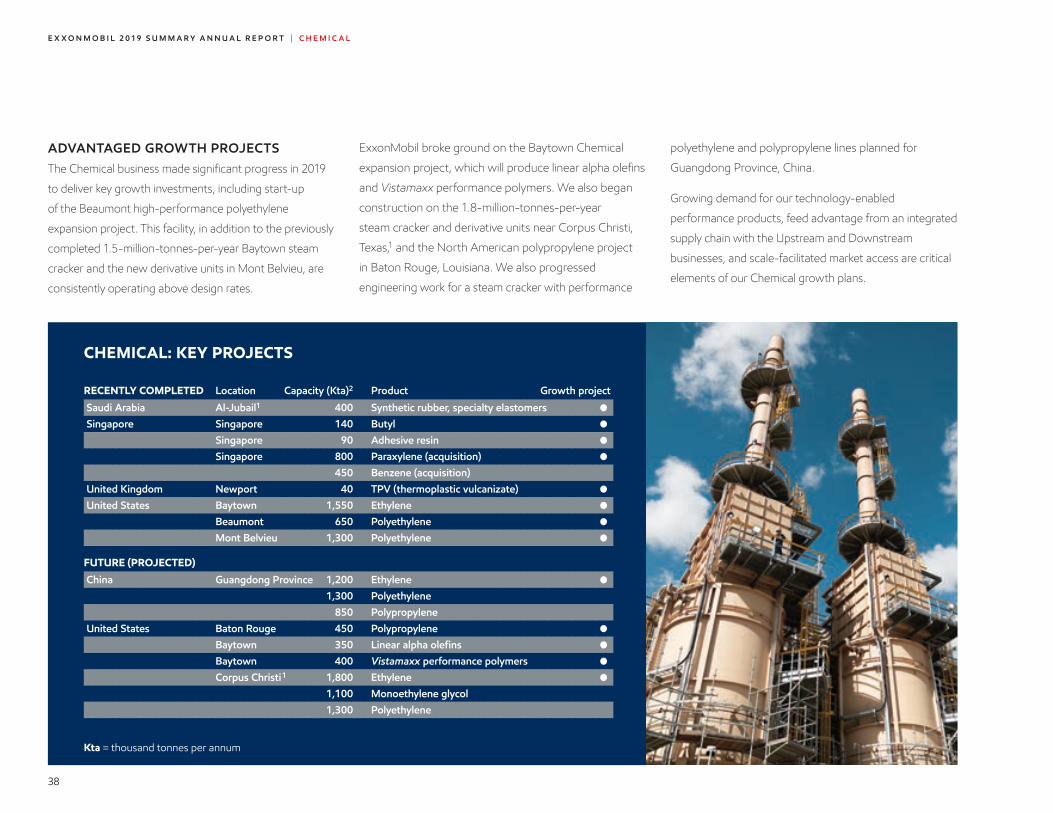
ADVANTAGED GROWTH PROJECTSThe Chemical business made significant progress in 2019
to deliver key growth investments, including start-up
of the Beaumont high-performance polyethylene
expansion project. This facility, in addition to the previously
completed 1.5-million-tonnes-per-year Baytown steam
cracker and the new derivative units in Mont Belvieu, are
consistently operating above design rates.
ExxonMobil broke ground on the Baytown Chemical
expansion project, which will produce linear alpha olefins
and Vistamaxx performance polymers. We also began
construction on the 1.8-million-tonnes-per-year
steam cracker and derivative units near Corpus Christi,
Texas,1 and the North American polypropylene project
in Baton Rouge, Louisiana. We also progressed
engineering work for a steam cracker with performance
polyethylene and polypropylene lines planned for
Guangdong Province, China.
Growing demand for our technology-enabled
performance products, feed advantage from an integrated
supply chain with the Upstream and Downstream
businesses, and scale-facilitated market access are critical
elements of our Chemical growth plans.
CHEMICAL: KEY PROJECTS
RECENTLY COMPLETED Location Capacity (Kta)2 Product Growth project
Saudi Arabia Al-Jubail1 400 Synthetic rubber, specialty elastomers ●
Singapore Singapore 140 Butyl ●
Singapore 90 Adhesive resin ●
Singapore 800 Paraxylene (acquisition) ●
450 Benzene (acquisition)
United Kingdom Newport 40 TPV (thermoplastic vulcanizate) ●
United States Baytown 1,550 Ethylene ●
Beaumont 650 Polyethylene ●
Mont Belvieu 1,300 Polyethylene ●
FUTURE (PROJECTED)
China Guangdong Province 1,200 Ethylene ●
1,300 Polyethylene
850 Polypropylene
United States Baton Rouge 450 Polypropylene ●
Baytown 350 Linear alpha olefins ●
Baytown 400 Vistamaxx performance polymers ●
Corpus Christi1 1,800 Ethylene ●
1,100 Monoethylene glycol
1,300 Polyethylene
Kta = thousand tonnes per annum
E X X O N M O B I L 2 0 1 9 S U M M A R Y A N N U A L R E P O R T
38
| C H E M I C A L
We are also a founding member of the Alliance to End
Plastic Waste, an organization focused on developing
safe, scalable, and economically viable solutions to help
end plastic waste in the environment. The global alliance
works to prove effectiveness of solutions, particularly
in markets with the highest levels of plastic waste in the
environment. In addition, ExxonMobil is progressing
CHEMICAL PRODUCT BENEFITSPlastics provide sustainability benefits and play an
important role in helping society mitigate greenhouse
gas emissions. Plastics are strong, lightweight materials,
and are widely used in the transportation of water,
food, and people.
ExxonMobil performance products focus on technically
challenging applications that have greater societal and
consumer benefits when compared to typical alternatives.
These benefits include:
• Customers’ ability to use a higher content of
recycled materials without degrading performance
• Increased crop yields, extended shelf life, and reduced
food waste
• Lighter-weight vehicles and higher-performance tires,
which improve fuel efficiency and reduce emissions
• Safer materials for hygiene products and advanced
medical applications
• Improved energy efficiency of buildings, utilizing
advanced house-wrap construction material technology
Plastics have value throughout their life cycle, including
at end of life, and play a vital role in a global, resource-
efficient economy. ExxonMobil is investing in research and
development to find ways to recycle products at scale.
potential sustainability solutions such as advanced
recycling and regeneration technologies to capture
value from plastic waste and reduce overall greenhouse
gas emissions on a full life-cycle basis. We are well
positioned to add value through ExxonMobil’s expertise in
hydrocarbon molecule management and industry-leading
research and development capability.
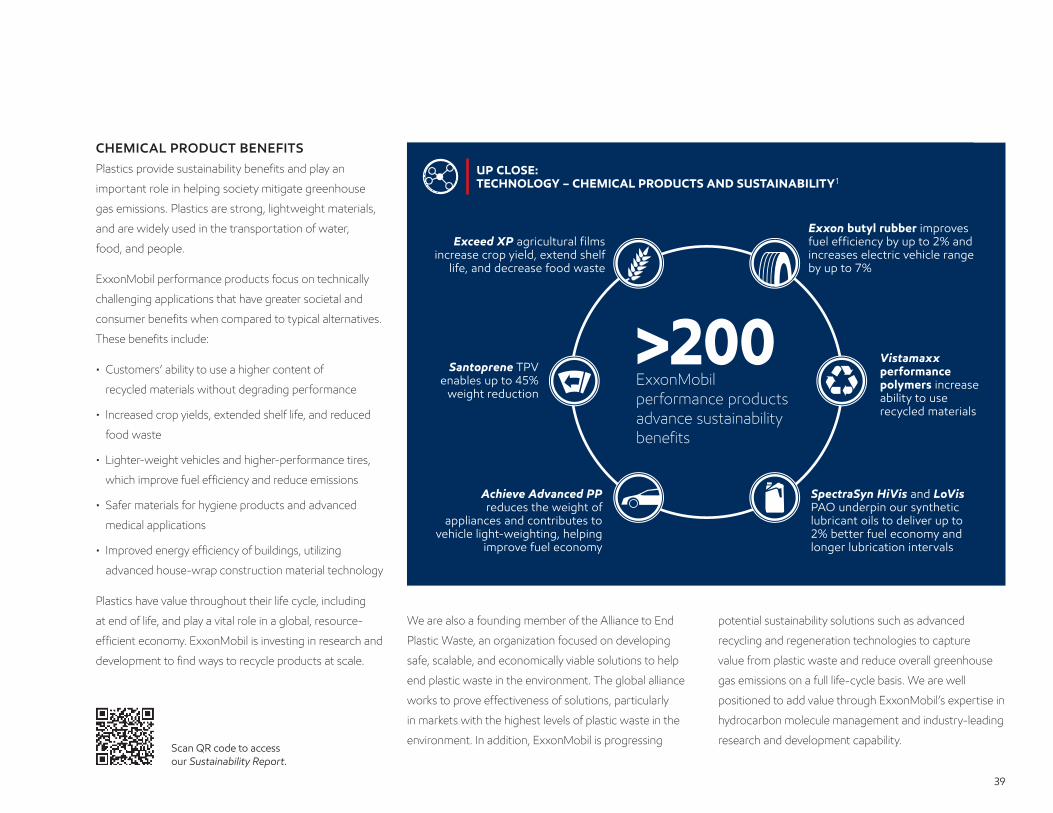
Exxon butyl rubber improves fuel efficiency by up to 2% and increases electric vehicle range by up to 7%
Vistamaxx performance polymers increase ability to use recycled materials
SpectraSyn HiVis and LoVis PAO underpin our synthetic lubricant oils to deliver up to 2% better fuel economy and longer lubrication intervals
Exceed XP agricultural films increase crop yield, extend shelf
life, and decrease food waste
Santoprene TPV enables up to 45%
weight reduction
Achieve Advanced PP reduces the weight of
appliances and contributes to vehicle light-weighting, helping
improve fuel economy
Scan QR code to access our Sustainability Report.
UP CLOSE: TECHNOLOGY – CHEMICAL PRODUCTS AND SUSTAINABILITY1
VE
RS
ION
Feb. 22, 2020
LAST FILE CHANGE MADE BY
39A 19XOMSAR V2-TechCircle.ai
Carol Eric Bill
IN SAR V2 ON PAGE 39A
AR
TB
OO
K Eric Whetstone • Whetstone Design studio/cell: 214-412-8000fax: [email protected]
ED
ITO
R Ryan Dix • Investor RelationsExxon Mobil Corporation, Irving, TXOffice: 972-940-6063Cell: [email protected]
Carol Zuber-Mallison • ZM Graphics, Inc.studio/cell: 214-906-4162 • fax: [email protected]
Usage: Exclusive rights within ExxonMobilA
TT
EN
TIO
N: O
WN
ER Data list is used to drive the black and
white chart, which is then used as a template for the color chart. Bars and lines are cut and pasted from the black and white template and are highly accurate. However, the color chart is NOT linked to the database and is NOT “driven” by the data; it is a piece of artwork buiilt by a human. Therefore, the editor needs to thoroughly proof the final artwork, not JUST the data list .
>200ExxonMobil performance products advance sustainability benefits
39

ExxonMobil’s Global Projects organization and
Global Services Company support our operations
and investment plans around the world.
GLOBAL PROJECTSThe Global Projects organization was formed in
2019 and integrates decades of mega-project
management experience, deep technical knowledge,
and commercial capabilities into one global team that
delivers projects across the Upstream, Downstream,
and Chemical businesses. The new organization builds
on experience gained from more than $125 billion of
major capital projects over the past decade.
This experienced and dedicated team provides a
critical foundation of project-development expertise
and delivery capabilities, which is applied across the
corporation.
The ethane steam cracker and derivative products
project near Corpus Christi, Texas, is an excellent
example of the benefits derived from an integrated
global projects organization. The project is a joint
venture that incorporates the Chemical organization’s
operational experience, customer focus, supply chain,
and technology expertise, with Upstream’s mega-
project and modularization capabilities. The facility
will be ExxonMobil’s first fully modularized chemical
plant, with fabrication of more than 140,000 tonnes
of mega modules. The venture remains on schedule,
on budget, and on track to competitively capture
significant execution savings when compared to other
standard industry steam crackers.
The Liza Phase 1 development in Guyana is another
example of the value created by our Global Projects
organization. The project was completed under
budget and ahead of schedule in less than five years
from discovery to start-up, representing industry-
leading performance in the deepwater value
chain. The project benefitted from an optimized
contracting strategy and strong local and international
partnerships. Future Guyana developments will
leverage the Liza Phase 1 approach.
PHOTO: Three 1,150-tonne boiler modules are safely transported for our Corpus Christi project.
MANAGING >1,500 PROJECTS IN 30 COUNTRIES
GLOBAL PROJECTS AND SERVICES
4040
E X X O N M O B I L 2 0 1 9 S U M M A R Y A N N U A L R E P O R T

Russia Far East LNGSakhalin-1 Central and South Dagi
PNG Expansion
Gorgon Expansion
China Chemical Complex
Ca Voi Xanh (Blue Whale)
Singapore Resid Upgrade
Rovuma LNGCoral FLNG
Barzan
Fawley Hydrofiner
Bacalhau Phase 1(formerly Carcara)
Vaca Muerta
Liza Phase 1Liza Phase 2PayaraFuture Phases
Kearl Supplemental CrusherSyncrude Mildred Lake Extension
UpperZakum
TengizKashagan
NeptunDeep
Conventional
Unconventional
Deepwater
Heavy oil
F&L
LNG
Chemical
Countries with active projects
ExxonMobil operated
Operated by Others/Joint Venture
Beaumont Light Crude ExpansionBaton Rouge PolypropyleneBaytown Chemical Expansion (LAO/Vistamaxx)Golden Pass LNG ExportCorpus Christi Chemical Complex
PermianPermian/USGC Crude Pipeline Venture Bakken
GLOBAL SERVICESExxonMobil Global Services Company supports
operations by providing procurement, information
technology, and environmental and property
solutions around the world. Global Services delivers
local, fit-for-purpose services, while leveraging
ExxonMobil’s scale to capture cost and execution
benefits. These include competitive rates for more
than $40 billion in purchases annually, efficient and
effective facilities operations, and project support
for real estate and retail station projects. Global
Services also delivers highly reliable IT solutions that
enable innovation in all aspects of our business,
including well optimization in the Permian, mobile-
To learn more about our global operations,
scan the QR code.
device-enabled customer interface in China, and the
processing of tens of millions of transactions globally
each day.
UP CLOSE: SCALE – EXXONMOBIL MANAGES A DIVERSE PORTFOLIO OF PROJECTS THAT SUPPORT OUR WORLDWIDE BUSINESSES
4141

ExxonMobil responsibly provides the energy and
products that advance modern life while also developing
and deploying technologies to help reduce emissions.
ENERGY IS ESSENTIAL
E X X O N M O B I L 2 0 1 9 S U M M A R Y A N N U A L R E P O R T
42

REPORT OF INDEPENDENT REGISTERED PUBLIC ACCOUNTING FIRM
To the Board of Directors and Shareholders of Exxon Mobil Corporation
We have audited, in accordance with the standards of the Public Company Accounting Oversight Board (United States), the consolidated balance sheet of Exxon Mobil Corporation and its subsidiaries (the “Corporation”) as of December 31, 2019 and 2018, and the related consolidated statements of income, comprehensive income, changes in equity and cash flows for each of the three years in the period ended December 31, 2019 (not presented herein) appearing in the ExxonMobil 2019 Financial Statements and Supplemental Information booklet enclosed with the proxy materials for the 2020 annual meeting of shareholders of the Corporation and have issued our report thereon dated February 26, 2020, which included an unqualified opinion on those consolidated financial statements. In our opinion, the information set forth in the accompanying condensed consolidated financial statements (pages 45-47) is fairly stated, in all material respects, in relation to the consolidated financial statements from which it has been derived.
Dallas, Texas February 26, 2020
SUMMARY OF ACCOUNTING POLICIES AND PRACTICESThe Corporation’s accounting and financial reporting fairly reflect its integrated business model involving exploration for, and production of, crude oil and natural gas and manufacture, trade, transport and sale of crude oil, natural gas, petroleum products, petrochemicals and a wide variety of specialty products. The preparation of financial statements in conformity with U.S. Generally Accepted Accounting Principles (GAAP) requires management to make estimates and judgments that affect the reported amounts of assets, liabilities, revenues, expenses and the disclosure of contingent assets and liabilities. Actual results could differ from these estimates.The summary financial statements include the accounts of those subsidiaries the Corporation controls. They also include the Corporation’s share of the undivided interest in certain Upstream assets, liabilities, revenues, and expenses. Amounts representing the Corporation’s interest in the net assets and net income of entities that it does not control are included in “Investments, advances, and long-term receivables” on the Balance Sheet and “Income from equity affiliates” on the Income Statement.The “functional currency” for translating the accounts of the majority of Downstream and Chemical operations outside the United States is the local currency. The local currency is also used for Upstream operations that are relatively self-contained and integrated within a particular country. The U.S. dollar is
used for operations in countries with a history of high inflation and certain other countries.Revenue is recognized at the amount the Corporation expects to receive when the customer has taken control, which is typically when title transfers and the customer has assumed the risks and rewards of ownership.Inventories of crude oil, products, and merchandise are carried at the lower of current market value or cost (generally determined under the last-in, first-out method – LIFO). Inventories of materials and supplies are valued at cost or less.The Corporation may use derivative instruments for trading purposes and to offset exposures associated with commodity prices, foreign currency exchange rates and interest rates. All derivative instruments, except those designated as normal purchase and normal sale, are recorded at fair value, and gains and losses arising from changes in their fair value are recognized in earnings.The Corporation’s exploration and production activities are accounted for under the “successful efforts” method. Depreciation, depletion, and amortization are primarily determined under either the unit-of-production method or the straight-line method. Unit-of-production rates are based on the amount of proved developed reserves of oil, natural gas, and other minerals that are estimated to be recoverable from existing facilities. The straight-line method is based on estimated asset service life.The Corporation incurs retirement obligations for certain assets at the time they are installed. The fair values of these
obligations are recorded as liabilities on a discounted basis and are accreted over time for the change in their present value. The costs associated with these liabilities are capitalized as part of the related assets and depreciated. Liabilities for environmental costs are recorded when it is probable that obligations have been incurred and the amounts can be reasonably estimated.The Corporation recognizes the underfunded or overfunded status of defined benefit pension and other postretirement plans as a liability or asset in the balance sheet with the offset in equity, net of deferred taxes.A variety of claims have been made against ExxonMobil and certain of its consolidated subsidiaries in a number of pending lawsuits and tax disputes. For further information on litigation and tax contingencies, see Notes 16 and 19 to the Consolidated Financial Statements in ExxonMobil’s 2019 Financial Statements and Supplemental Information booklet.The Corporation awards stock-based compensation to employees in the form of restricted stock units. Compensation expense is measured by the price of the stock at the date of grant and is recognized in income over the requisite service period.Further information on the Corporation’s accounting policies, estimates, and practices can be found in ExxonMobil’s 2019 Financial Statements and Supplemental Information booklet (Critical Accounting Estimates and Note 1 to the Consolidated Financial Statements).
FINANCIAL INFORMATION
43

44
FINANCIAL HIGHLIGHTS(millions of dollars, unless noted) 2019 2018 2017
Net income attributable to ExxonMobil 14,340 20,840 19,710Cash flow from operations and asset sales1 33,408 40,137 33,169Capital and exploration expenditures1 31,148 25,923 23,080Research and development costs 1,214 1,116 1,063Total debt at year end 46,920 37,796 42,336Average capital employed1 236,603 232,374 222,631Market valuation at year end 295,431 288,892 354,561Regular employees at year end (thousands) 74.9 71.0 69.6
KEY FINANCIAL RATIOS2019 2018 2017
Return on average capital employed1 (percent) 6.5 9.2 9.0Earnings to average ExxonMobil share of equity (percent) 7.5 11.0 11.1Debt to capital2 (percent) 19.1 16.0 17.9Net debt to capital3 (percent) 18.1 14.9 16.8Current assets to current liabilities (times) 0.78 0.84 0.82
DIVIDEND AND SHAREHOLDER RETURN INFORMATION2019 2018 2017
Dividends per common share (dollars) 3.43 3.23 3.06
Dividends per share growth (annual percent) 6.2 5.6 2.7
Number of common shares outstanding (millions) Average 4,270 4,270 4,256 Average – assuming dilution 4,270 4,270 4,256 Year end 4,234 4,237 4,239
Total shareholder return1 (annual percent) 7.2 (15.1) (3.8)
Common stock acquired (millions of dollars) 594 626 747
Market quotations for common stock (dollars) High 83.49 89.30 91.34 Low 66.31 64.65 76.05 Average daily close 73.73 79.96 81.86 Year-end close 69.78 68.19 83.64
1 See Frequently Used Terms on pages 48 through 51.2 Debt includes short-term and long-term debt. Capital includes short-term and long-term debt and total equity. 3 Debt net of cash and cash equivalents, excluding restricted cash.
E X X O N M O B I L 2 0 1 9 S U M M A R Y A N N U A L R E P O R T
44
| F I N A N C I A L I N F O R M A T I O N

45
SUMMARY STATEMENT OF INCOME(millions of dollars) 2019 2018 2017
Revenues and other incomeSales and other operating revenue 255,583 279,332 237,162Income from equity affiliates 5,441 7,355 5,380Other income 3,914 3,525 1,821Total revenues and other income 264,938 290,212 244,363
Costs and other deductionsCrude oil and product purchases 143,801 156,172 128,217Production and manufacturing expenses 36,826 36,682 32,690Selling, general and administrative expenses 11,398 11,480 10,649Depreciation and depletion 18,998 18,745 19,893Exploration expenses, including dry holes 1,269 1,466 1,790Non-service pension and postretirement benefit expense 1,235 1,285 1,745Interest expense 830 766 601Other taxes and duties 30,525 32,663 30,104Total costs and other deductions 244,882 259,259 225,689Income before income taxes 20,056 30,953 18,674Income taxes 5,282 9,532 (1,174)Net income including noncontrolling interests 14,774 21,421 19,848Net income attributable to noncontrolling interests 434 581 138
Net income attributable to ExxonMobil 14,340 20,840 19,710
Earnings per common share (dollars) 3.36 4.88 4.63
Earnings per common share – assuming dilution (dollars) 3.36 4.88 4.63
The information in the Summary statement of income (for 2017 to 2019), the Summary balance sheet (for 2018 and 2019), and the Summary statement of cash flows (for 2017 to 2019), shown on pages 45 through 47, corresponds to the information in the Consolidated statement of income, the Consolidated balance sheet, and the Consolidated statement of cash flows in ExxonMobil’s 2019 Financial Statements and Supplemental Information booklet. See also Management’s discussion and analysis of financial condition and results of operations and other information in ExxonMobil’s 2019 Financial Statements and Supplemental Information booklet.
45
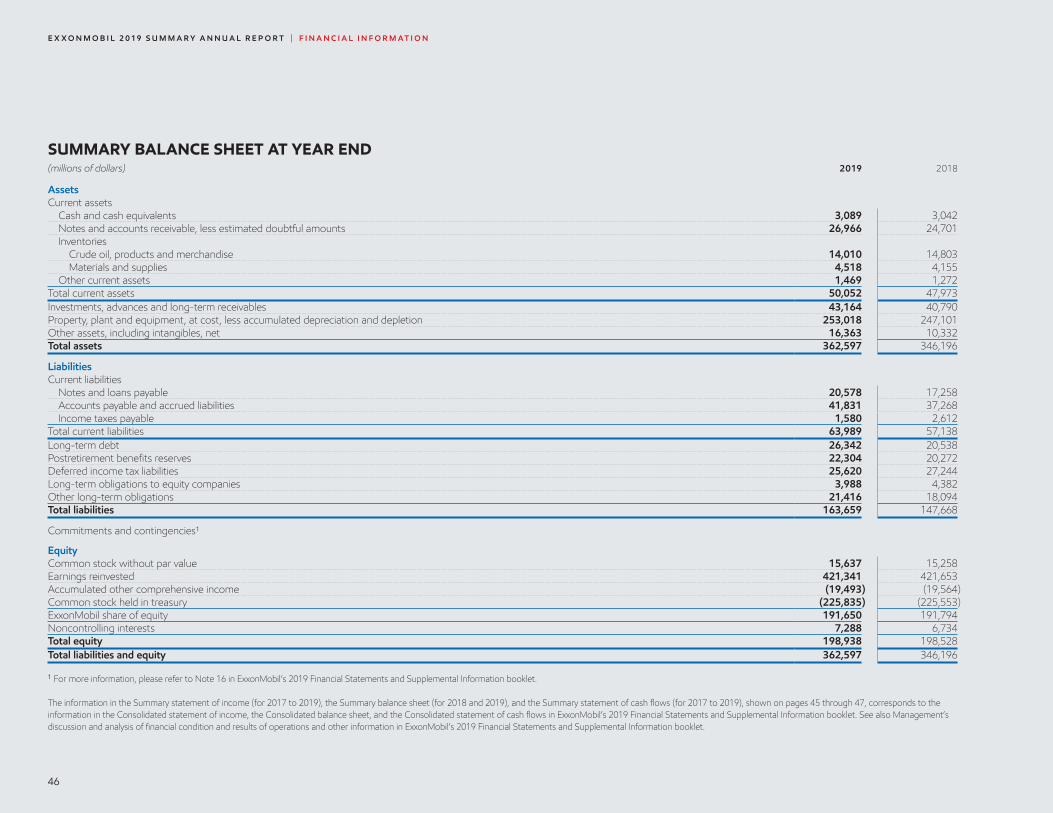
46
SUMMARY BALANCE SHEET AT YEAR END(millions of dollars) 2019 2018
AssetsCurrent assets Cash and cash equivalents 3,089 3,042 Notes and accounts receivable, less estimated doubtful amounts 26,966 24,701 Inventories Crude oil, products and merchandise 14,010 14,803 Materials and supplies 4,518 4,155 Other current assets 1,469 1,272Total current assets 50,052 47,973Investments, advances and long-term receivables 43,164 40,790Property, plant and equipment, at cost, less accumulated depreciation and depletion 253,018 247,101Other assets, including intangibles, net 16,363 10,332Total assets 362,597 346,196
LiabilitiesCurrent liabilities Notes and loans payable 20,578 17,258 Accounts payable and accrued liabilities 41,831 37,268 Income taxes payable 1,580 2,612Total current liabilities 63,989 57,138Long-term debt 26,342 20,538Postretirement benefits reserves 22,304 20,272Deferred income tax liabilities 25,620 27,244Long-term obligations to equity companies 3,988 4,382Other long-term obligations 21,416 18,094Total liabilities 163,659 147,668
Commitments and contingencies1
EquityCommon stock without par value 15,637 15,258Earnings reinvested 421,341 421,653Accumulated other comprehensive income (19,493) (19,564)Common stock held in treasury (225,835) (225,553)ExxonMobil share of equity 191,650 191,794Noncontrolling interests 7,288 6,734Total equity 198,938 198,528Total liabilities and equity 362,597 346,196
1 For more information, please refer to Note 16 in ExxonMobil’s 2019 Financial Statements and Supplemental Information booklet.
The information in the Summary statement of income (for 2017 to 2019), the Summary balance sheet (for 2018 and 2019), and the Summary statement of cash flows (for 2017 to 2019), shown on pages 45 through 47, corresponds to the information in the Consolidated statement of income, the Consolidated balance sheet, and the Consolidated statement of cash flows in ExxonMobil’s 2019 Financial Statements and Supplemental Information booklet. See also Management’s discussion and analysis of financial condition and results of operations and other information in ExxonMobil’s 2019 Financial Statements and Supplemental Information booklet.
E X X O N M O B I L 2 0 1 9 S U M M A R Y A N N U A L R E P O R T
46
| F I N A N C I A L I N F O R M A T I O N

47
SUMMARY STATEMENT OF CASH FLOWS(millions of dollars) 2019 2018 2017
Cash flows from operating activitiesNet income including noncontrolling interests 14,774 21,421 19,848Adjustments for noncash transactions Depreciation and depletion 18,998 18,745 19,893 Deferred income tax charges/(credits) (944) (60) (8,577) Postretirement benefits expense in excess of/(less than) net payments 109 1,070 1,135 Other long-term obligation provisions in excess of/(less than) payments (3,038) (68) (610)Dividends received greater than/(less than) equity in current earnings of equity companies (936) (1,684) 131Changes in operational working capital, excluding cash and debt Reduction/(increase) – Notes and accounts receivable (2,640) (545) (3,954) – Inventories 72 (3,107) (1,682) – Other current assets (234) (25) (117) Increase/(reduction) – Accounts and other payables 3,725 2,321 5,104Net (gain) on asset sales (1,710) (1,993) (334)All other items – net 1,540 (61) (771)Net cash provided by operating activities 29,716 36,014 30,066
Cash flows from investing activitiesAdditions to property, plant and equipment (24,361) (19,574) (15,402)Proceeds associated with sales of subsidiaries, property, plant and equipment, and sales and returns of investments 3,692 4,123 3,103Additional investments and advances (3,905) (1,981) (5,507)Other investing activities including collection of advances 1,490 986 2,076Net cash used in investing activities (23,084) (16,446) (15,730)
Cash flows from financing activitiesAdditions to long-term debt 7,052 46 60Reductions to long-term debt (1) – –Additions to short-term debt – – 1,735Reductions in short-term debt (4,043) (4,752) (5,024)Additions/(reductions) in commercial paper, and debt with three months or less maturity 5,654 (219) 2,181Cash dividends to ExxonMobil shareholders (14,652) (13,798) (13,001)Cash dividends to noncontrolling interests (192) (243) (184)Changes in noncontrolling interests 158 146 (150)Common stock acquired (594) (626) (747)Net cash used in financing activities (6,618) (19,446) (15,130)Effects of exchange rate changes on cash 33 (257) 314Increase/(decrease) in cash and cash equivalents 47 (135) (480)Cash and cash equivalents at beginning of year 3,042 3,177 3,657Cash and cash equivalents at end of year 3,089 3,042 3,177
The information in the Summary statement of income (for 2017 to 2019), the Summary balance sheet (for 2018 and 2019), and the Summary statement of cash flows (for 2017 to 2019), shown on pages 45 through 47, corresponds to the information in the Consolidated statement of income, the Consolidated balance sheet, and the Consolidated statement of cash flows in ExxonMobil’s 2019 Financial Statements and Supplemental Information booklet. See also Management’s discussion and analysis of financial condition and results of operations and other information in ExxonMobil’s 2019 Financial Statements and Supplemental Information booklet.
47

Heavy oil and oil sands • Heavy oil, for the purpose of this report, includes heavy oil, extra heavy oil, and bitumen, as defined by the World Petroleum Congress in 1987 based on American Petroleum Institute (API) gravity and viscosity at reservoir conditions. Heavy oil has an API gravity between 10 and 22.3 degrees. The API gravity of extra heavy oil and bitumen is less than 10 degrees. Extra heavy oil has a viscosity less than 10,000 centipoise, whereas the viscosity of bitumen is greater than 10,000 centipoise. The term “oil sands” is used to indicate heavy oil (generally bitumen) that is recovered in a mining operation.
Divestments • As used in this report, divestments represent the unadjusted sale price specified in the applicable contract of sale as of the effective date for asset divestiture agreements which the corporation or one of its affiliates has executed since January 1, 2019. Actual final sale price and cash proceeds may differ in amount and timing from the divestment value depending on applicable contract terms.
Leverage • Leverage is defined as “net debt/(net debt + market capitalization).”
Project • The term “project” as used in this report can refer to a variety of different activities and does not necessarily have the same meaning as in any government payment transparency reports.
Resources, resource base, and recoverable resources • Along with similar terms used in this report, these refer to the total remaining estimated quantities of oil and natural gas that are expected to be ultimately recoverable. ExxonMobil refers to new discoveries and acquisitions of discovered resources as resource additions. The resource base includes quantities of oil and natural gas classified as proved reserves, as well as quantities that are not yet classified as proved reserves, but that are expected to be ultimately recoverable. The term “resource base” is not intended to correspond to SEC definitions such as “probable” or “possible” reserves. The term “in-place” refers to those quantities of oil and natural gas estimated to be contained in known accumulations and includes recoverable and unrecoverable amounts.
Listed below are definitions of several of ExxonMobil’s key business and financial performance measures and other terms. These definitions are provided to facilitate understanding of the terms and their calculation. In the case of financial measures that we believe constitute “non-GAAP financial measures” under Securities and Exchange Commission Regulation G, we provide a reconciliation to the most comparable Generally Accepted Accounting Principles (GAAP) measure and other information required by that rule.
Total shareholder return (TSR) • Measures the change in value of an investment in stock over a specified period of time, assuming dividend reinvestment. We calculate shareholder return over a particular measurement period by: dividing (1) the sum of (a) the cumulative value of dividends received during the measurement period, assuming reinvestment, plus (b) the difference between the stock price at the end and at the beginning of the measurement period; by (2) the stock price at the beginning of the measurement period. For this purpose, we assume dividends are reinvested in stock at market prices at approximately the same time actual dividends are paid. Shareholder return is usually quoted on an annualized basis.
Capital and exploration expenditures (Capex) • Represents the combined total of additions at cost to property, plant and equipment, and exploration expenses on a before-tax basis from the Summary statement of income. ExxonMobil’s Capex includes its share of similar costs for equity companies. Capex excludes assets acquired in nonmonetary exchanges, the value of ExxonMobil shares used to acquire assets, and depreciation on the cost of exploration support equipment and facilities recorded to property, plant and equipment when acquired. While ExxonMobil’s management is responsible for all investments and elements of net income, particular focus is placed on managing the controllable aspects of this group of expenditures.
Returns, investment returns, project returns • Unless referring specifically to ROCE, references to returns, investment returns, project returns, and similar terms mean future discounted cash flow returns on future capital investments based on current company estimates. Investment returns exclude prior exploration and acquisition costs.
DISTRIBUTIONS TO SHAREHOLDERS 2019 2018 2017 2016 2015
(millions of dollars)
Dividends paid to ExxonMobil shareholders 14,652 13,798 13,001 12,453 12,090
Cost of shares acquired to reduce shares outstanding – – – – 3,000Distributions to ExxonMobil shareholders 14,652 13,798 13,001 12,453 15,090Memo: Gross cost of shares acquired to offset shares or units settled in shares issued under benefit plans and programs 594 626 747 977 1,039
The Corporation distributes cash to shareholders in the form of both dividends and share purchases. Shares are acquired to reduce shares outstanding and offset shares or units settled in shares issued in conjunction with company benefit plans and programs. For purposes of calculating distributions to shareholders, the Corporation only includes the cost of those shares acquired to reduce shares outstanding.
FREQUENTLY USED TERMS
E X X O N M O B I L 2 0 1 9 S U M M A R Y A N N U A L R E P O R T
48
| F I N A N C I A L I N F O R M A T I O N

RETURN ON AVERAGE CAPITAL EMPLOYED (ROCE) 2019 2018 2017 2016 2015
(millions of dollars)
Net income attributable to ExxonMobil 14,340 20,840 19,710 7,840 16,150
Financing costs (after tax)
Gross third-party debt (1,075) (912) (709) (683) (362)
ExxonMobil share of equity companies (207) (192) (204) (225) (170)
All other financing costs – net 141 498 515 423 88
Total financing costs (1,141) (606) (398) (485) (444)
Earnings excluding financing costs 15,481 21,446 20,108 8,325 16,594
Average capital employed 236,603 232,374 222,631 212,226 208,755
Return on average capital employed – corporate total 6.5% 9.2% 9.0% 3.9% 7.9%
ROCE is a performance measure ratio. From the perspective of the business segments, ROCE is annual business segment earnings divided by average business segment capital employed (average of beginning and end-of-year amounts). These segment earnings include ExxonMobil’s share of segment earnings of equity companies, consistent with our capital employed definition, and exclude the cost of financing. The Corporation’s total ROCE is net income attributable to ExxonMobil, excluding the after-tax cost of financing, divided by total corporate average capital employed. The Corporation has consistently applied its ROCE definition for many years and views it as the best measure of historical capital productivity in our capital-intensive, long-term industry, both to evaluate management’s performance and to demonstrate to shareholders that capital has been used wisely over the long term. Additional measures, which are more cash-flow based, are used to make investment decisions. See page 2 for segment information relevant to ROCE.
CAPITAL EMPLOYED AT YEAR END 2019 2018 2017 2016 2015
(millions of dollars)
Business uses: asset and liability perspective
Total assets 362,597 346,196 348,691 330,314 336,758
Less liabilities and noncontrolling interests share of assets and liabilities
Total current liabilities excluding notes and loans payable (43,411) (39,880) (39,841) (33,808) (35,214)
Total long-term liabilities excluding long-term debt (73,328) (69,992) (72,014) (79,914) (86,047)
Noncontrolling interests share of assets and liabilities (8,839) (7,958) (8,298) (8,031) (8,286)
Add ExxonMobil share of debt-financed equity company net assets 3,906 3,914 3,929 4,233 4,447Total capital employed 240,925 232,280 232,467 212,794 211,658
Total corporate sources: debt and equity perspective
Notes and loans payable 20,578 17,258 17,930 13,830 18,762
Long-term debt 26,342 20,538 24,406 28,932 19,925
ExxonMobil share of equity 191,650 191,794 187,688 167,325 170,811
Less noncontrolling interests share of total debt (1,551) (1,224) (1,486) (1,526) (2,287)
Add ExxonMobil share of equity company debt 3,906 3,914 3,929 4,233 4,447Total capital employed 240,925 232,280 232,467 212,794 211,658
Capital employed is a measure of net investment. When viewed from the perspective of how the capital is used by the businesses, it includes ExxonMobil’s net share of property, plant and equipment and other assets, less liabilities, excluding both short-term and long-term debt. When viewed from the perspective of the sources of capital employed in total for the Corporation, it includes ExxonMobil’s share of total debt and equity. Both of these views include ExxonMobil’s share of amounts applicable to equity companies, which the Corporation believes should be included to provide a more comprehensive measure of capital employed.
49

OPERATING COSTS 2019 2018 2017 2016 2015
(millions of dollars)
Reconciliation of operating costs
From ExxonMobil’s Consolidated statement of income
Total costs and other deductions 244,882 259,259 225,689 200,145 227,282
Less:
Crude oil and product purchases 143,801 156,172 128,217 104,171 130,003
Interest expense 830 766 601 453 311
Other taxes and duties 30,525 32,663 30,104 29,020 30,309
Subtotal 69,726 69,658 66,767 66,501 66,659
ExxonMobil’s share of equity company expenses 9,088 9,569 9,016 7,409 8,309 Total operating costs 78,814 79,227 75,783 73,910 74,968
Components of operating costs
From ExxonMobil’s Consolidated statement of income
Production and manufacturing expenses 36,826 36,682 32,690 30,448 33,951
Selling, general and administrative expenses 11,398 11,480 10,649 10,443 11,038
Depreciation and depletion 18,998 18,745 19,893 22,308 18,048
Exploration expenses, including dry holes 1,269 1,466 1,790 1,467 1,523
Non-service pension and postretirement benefit expense 1,235 1,285 1,745 1,835 2,099
Subtotal 69,726 69,658 66,767 66,501 66,659
ExxonMobil’s share of equity company expenses 9,088 9,569 9,016 7,409 8,309 Total operating costs 78,814 79,227 75,783 73,910 74,968
Operating costs are the costs during the period to produce, manufacture, and otherwise prepare the company’s products for sale – including energy, staffing, and maintenance costs. They exclude the cost of raw materials, taxes, and interest expense and are on a before-tax basis. While ExxonMobil’s management is responsible for all revenue and expense elements of net income, operating costs, as defined above, represent the expenses most directly under management’s control, and therefore, are useful for investors and ExxonMobil management in evaluating management’s performance.
CASH FLOW FROM OPERATIONS AND ASSET SALES 2019 2018 2017 2016 2015
(millions of dollars)
Net cash provided by operating activities 29,716 36,014 30,066 22,082 30,344Proceeds associated with sales of subsidiaries, property, plant and equipment, and sales and returns of investments 3,692 4,123 3,103 4,275 2,389Cash flow from operations and asset sales 33,408 40,137 33,169 26,357 32,733
Cash flow from operations and asset sales is the sum of the net cash provided by operating activities and proceeds associated with sales of subsidiaries, property, plant and equipment, and sales and returns of investments from the Summary statement of cash flows. This cash flow reflects the total sources of cash from both operating the Corporation’s assets and from the divesting of assets. The Corporation employs a long-standing and regular disciplined review process to ensure that all assets are contributing to the Corporation’s strategic objectives. Assets are divested when they are no longer meeting these objectives or are worth considerably more to others. Because of the regular nature of this activity, we believe it is useful for investors to consider proceeds associated with asset sales together with cash provided by operating activities when evaluating cash available for investment in the business and financing activities, including shareholder distributions.
E X X O N M O B I L 2 0 1 9 S U M M A R Y A N N U A L R E P O R T
50
| F I N A N C I A L I N F O R M A T I O N

FREE CASH FLOW 2019 2018 2017 2016 2015
(millions of dollars)
Net cash provided by operating activities 29,716 36,014 30,066 22,082 30,344
Additions to property, plant and equipment (24,361) (19,574) (15,402) (16,163) (26,490)Proceeds associated with sales of subsidiaries, property, plant and equipment, and sales and returns of investments 3,692 4,123 3,103 4,275 2,389
Additional investments and advances (3,905) (1,981) (5,507) (1,417) (607)
Other investing activities including collection of advances 1,490 986 2,076 902 842Free cash flow 6,632 19,568 14,336 9,679 6,478
Free cash flow is cash flow from operations and asset sales less additions to property, plant and equipment, and additional investments and advances, plus other investing activities, including collection of advances. This measure is useful when evaluating cash available for financing activities, including shareholder distributions, after investment in the business.
FOOTNOTES
Page 21 Natural gas converted to oil-equivalent at 6 million cubic feet
per 1,000 barrels2 Sales data reported net of purchases/sales contracts with the
same counterparty
Page 61 Unless otherwise specified, the source of data for pages 6 and 7
is ExxonMobil’s 2019 Outlook for Energy2 Source: U.N. Human Development Reports 2018; World Bank
DataBank 2019; ExxonMobil analysis, updated September 11, 2019
Page 71 Organisation for Economic Co-operation and Development
(OECD): A forum for 36 nations that work with each other, as well as with many more partner nations, to promote policies that will improve the economic and social well-being of people around the world. In this report, OECD is referring to the 36 nations that are members of the forum; Non-OECD is a term used collectively for countries other than the 36 OECD nations.
Page 81 Unless otherwise specified, the source of data for page 8
is ExxonMobil’s 2020 Energy & Carbon Summary
Page 91 Unless otherwise specified, the source of data for page 9
is ExxonMobil’s 2019 Outlook for Energy2 Source: ExxonMobil’s 2018 Outlook for Energy
3 Source: IPCC AR5 Climate Change 2014: Mitigation of Climate Change; ExxonMobil analysis
4 Source: U.S. Energy Information Administration (EIA)5 Source: National Academies of Sciences, Engineering, and
Medicine (2016); Commercial Aircraft Propulsion and Energy Systems Research: Reducing Global Carbon Emissions (2016); Behaviour of Lithium-Ion Batteries in Electric Vehicles – Battery Health, Performance, Safety, and Cost (2018); ExxonMobil analysis
Page 111 Source: ExxonMobil analysis2 Source: ExxonMobil analysis
Page 141 Source: Wood Mackenzie (2019–2023 FID Tracker)2 Source: ExxonMobil estimates where available,
Wood Mackenzie, IHS Markit
Page 191 Year-on-year growth in Midland and Delaware Basins2 Source: IEA World Energy Outlook 20193 Source: IHS Markit, based on rig count
Page 201 Resource and acreage values include Midland, Delaware, and
minor conventional operations in the Central Basin Platform.
Page 231 Pending regulatory approval of Ceara-Potiguar divestment in 20202 Source: Wood Mackenzie; includes already-awarded licenses and
licenses pending government award. Compared to International Oil Companies (IOC).
Page 241 Source: Wood Mackenzie; ExxonMobil analysis
Page 261 Source: Wood Mackenzie; ExxonMobil analysis2 Agreed sales value as of January 1, 2019. Estimated total cash to
be received is $4 billion, including $3.1 billion received in 2019.
Page 291 Source: ExxonMobil’s 2019 Outlook for Energy;
ExxonMobil analysis
Page 311 Estimated total pipeline network by 2022
Page 321 Source: Kline & Company
Page 331 Volumes shown on 100-percent basis
Page 351 Source: ExxonMobil’s 2019 Outlook for Energy;
ExxonMobil analysis
Page 361 Source: ExxonMobil’s 2019 Outlook for Energy; IHS Markit;
ExxonMobil analysis
Page 371 Source: ExxonMobil analysis. For further information, see
our 2019 Chemical Spotlight available at exxonmobil.com
Page 381 50/50 joint venture with SABIC2 Volumes shown on 100-percent basis
Page 391 Source: ExxonMobil analysis. For further information, see
our 2019 Chemical Spotlight available at exxonmobil.com
51

STANDING COMMITTEES OF THE BOARD Audit Committee U.M. Burns (Chair) J.L. Hooley D.R. Oberhelman W.C. Weldon
Board Affairs Committee K.C. Frazier (Chair) S.K. Avery S.J. Palmisano S.S Reinemund
Compensation Committee S.J. Palmisano (Chair) A.F. Braly K.C. Frazier S.A. Kandarian
Finance Committee D.W. Woods (Chair) U.M. Burns J.L. Hooley D.R. Oberhelman W.C. Weldon
Public Issues and Contributions Committee A.F. Braly (Chair) S.K. Avery S.A. Kandarian S.S Reinemund
Executive Committee D.W. Woods (Chair) U.M. Burns K.C. Frazier S.J. Palmisano S.S Reinemund
FUNCTIONAL AND SERVICE ORGANIZATIONS Upstream
L.D. DuCharme President, ExxonMobil Upstream Integrated Solutions Company 1
S.M. Greenlee President, ExxonMobil Upstream Business Development Company 1
L.M. Mallon President, ExxonMobil Upstream Oil & Gas Company 1
Downstream
B.W. Milton President, ExxonMobil Fuels & Lubricants Company 1
Chemical
K.T. McKee President, ExxonMobil Chemical Company 1
Other
N.W. Duffin President, ExxonMobil Global Projects Company 1
J.M. Gibbs President, ExxonMobil Global Services Company
B.H. March President, ExxonMobil Research and Engineering Company
OFFICERS
D.W. Woods Chairman of the Board 1
N.A. Chapman Senior Vice President 1
A.P. Swiger Senior Vice President 1
J.P. Williams, Jr. Senior Vice President 1
R.M. Ebner Vice President and General Counsel 1
S.M. Greenlee Vice President 1
T.C. Gunnlaugsson Vice President – Human Resources
N.A. Hansen Vice President – Investor Relations and Corporate Secretary 1
L.M. Mallon Vice President 1
S.M. McCarron Vice President – Public and Government Affairs
K.T. McKee Vice President 1
B.W. Milton Vice President1
D.S. Rosenthal Vice President and Controller 1
R.N. Schleckser Vice President and Treasurer 1
J.M. Spellings, Jr. Vice President and General Tax Counsel1
D.G. Wascom Vice President – Operational Excellence, Safety, Security, Health and Environment
T.J. Wojnar, Jr. Vice President – Corporate Strategic Planning 1
1 Required to file reports under Section 16 of the Securities Exchange Act of 1934. As of January 1, 2020
Scan QR code for more information about our management team.
BOARD OF DIRECTORS, OFFICERS, AND AFFILIATED COMPANIES
E X X O N M O B I L 2 0 1 9 S U M M A R Y A N N U A L R E P O R T
52

Angela F. Braly Former Chairman of the Board, President, and Chief Executive Officer, WellPoint, Inc. (health care)
Kenneth C. Frazier Chairman of the Board and Chief Executive Officer, Merck & Company (pharmaceuticals)
Joseph L. Hooley Former Chairman of the Board, President, and Chief Executive Officer, State Street Corporation (financial services)
Ursula M. Burns Chairman of the Board and Chief Executive Officer, VEON Ltd. (telecommunication services)
(left to right)
Samuel J. Palmisano Former Chairman of the Board, President, and Chief Executive Officer, International Business Machines Corporation (computer hardware, software, business consulting, and IT services)
Darren W. Woods Chairman of the Board and Chief Executive Officer
Douglas R. Oberhelman Former Chairman of the Board and Chief Executive Officer, Caterpillar Inc. (heavy equipment)
Steven S Reinemund Presiding Director; Former Chairman of the Board and Chief Executive Officer, PepsiCo (consumer food products)
William C. Weldon Former Chairman of the Board and Chief Executive Officer, Johnson & Johnson (pharmaceuticals)
Susan K. Avery President Emerita, Woods Hole Oceanographic Institution (nonprofit ocean research, exploration, and education)
Steven A. Kandarian Former Chairman of the Board, President, and Chief Executive Officer, MetLife Inc. (insurance)
As of January 1, 2020
5353

Exxon Mobil Corporation has numerous affiliates, many with names that include ExxonMobil, Exxon, Mobil, Esso, and XTO. For convenience and simplicity, those terms and terms such as Corporation, company, our, we, and its are sometimes used as abbreviated references to specific affiliates or affiliate groups. Abbreviated references describing global or regional operational organizations, and global or regional business lines are also sometimes used for convenience and simplicity. Similarly, ExxonMobil has business relationships with thousands of customers, suppliers, governments, and others. For convenience and simplicity, words such as venture, joint venture, partnership, co-venturer, and partner are used to indicate business and other relationships involving common activities and interests, and those words may not indicate precise legal relationships.
Included in this Summary Annual Report are financial and operating highlights and summary financial statements. For complete financial statements, including notes, please refer to ExxonMobil’s 2019 Financial Statements and Supplemental Information booklet included in the Summary Annual Report mailing or in the “Investors” section of ExxonMobil’s website (exxonmobil.com) under “Investor publications.” The Financial Statements and Supplemental Information booklet also includes “Management’s Discussion and Analysis of Financial Condition and Results of Operations.” The “Investors” section of ExxonMobil’s website (exxonmobil.com) also contains the Proxy Statement and other company publications. These publications provide additional detail about the company’s global operations.
The following are trademarks, service marks, or proprietary process names of Exxon Mobil Corporation or one of its affiliates: Achieve Advanced, Esso, Exceed XP, Exxon, ExxonMobil, Mobil, Mobil 1, Mobil EV, Santoprene, SpectraSyn HiVis, SpectraSyn LoVis, Synergy, Synergy Diesel Efficient, and Vistamaxx. The following third-party trademarks or service marks referred to in the text of the report are owned by The Trustees of the PWC Business Trust: PWC + Design.
SHAREHOLDER SERVICESShareholder inquiries should be addressed to ExxonMobil Shareholder Services at Computershare Trust Company, N.A., ExxonMobil’s transfer agent:
ExxonMobil Shareholder Services c/o Computershare P.O. Box 505000 Louisville, KY 40233
1-800-252-1800 (Within the United States and Canada)
1-781-575-2058 (Outside the United States and Canada)
An automated voice-response system is available 24 hours a day, 7 days a week.
Service representatives are available Monday through Friday 8 a.m. to 8 p.m. Eastern Time.
Registered shareholders can access information about their ExxonMobil stock accounts via the Internet at computershare.com/exxonmobil.
STOCK PURCHASE AND DIVIDEND REINVESTMENT PLANComputershare Trust Company, N.A., sponsors a stock purchase and dividend reinvestment plan, the Computershare Investment Plan for Exxon Mobil Corporation Common Stock. For more information and plan materials, go to computershare.com/exxonmobil or call or write ExxonMobil Shareholder Services.
DIVIDEND DIRECT DEPOSITShareholders may have dividends deposited directly into their U.S. bank accounts. If you would like to elect this option, go to computershare.com/exxonmobil or call or write ExxonMobil Shareholder Services for an authorization form.
CORPORATE GOVERNANCEOur Corporate Governance Guidelines and related materials are available by selecting “Investors” on our website at exxonmobil.com.
ELECTRONIC DELIVERY OF DOCUMENTSRegistered shareholders can receive the following documents online, instead of by mail, by contacting ExxonMobil Shareholder Services:
• Annual meeting materials• Tax documents• Account statements
Beneficial shareholders should contact their bank or broker for electronic receipt of proxy voting materials.
EXXONMOBIL PUBLICATIONSThe following publications are available without charge to shareholders and can be found at exxonmobil.com. Requests for printed copies should be directed to ExxonMobil Shareholder Services.
• Summary Annual Report• Annual Report on Form 10-K• Sustainability Report• Outlook for Energy: A Perspective to 2040• Energy & Carbon Summary
For more information about ExxonMobil investor relations scan the QR code.
INVESTOR INFORMATION
E X X O N M O B I L 2 0 1 9 S U M M A R Y A N N U A L R E P O R T
54
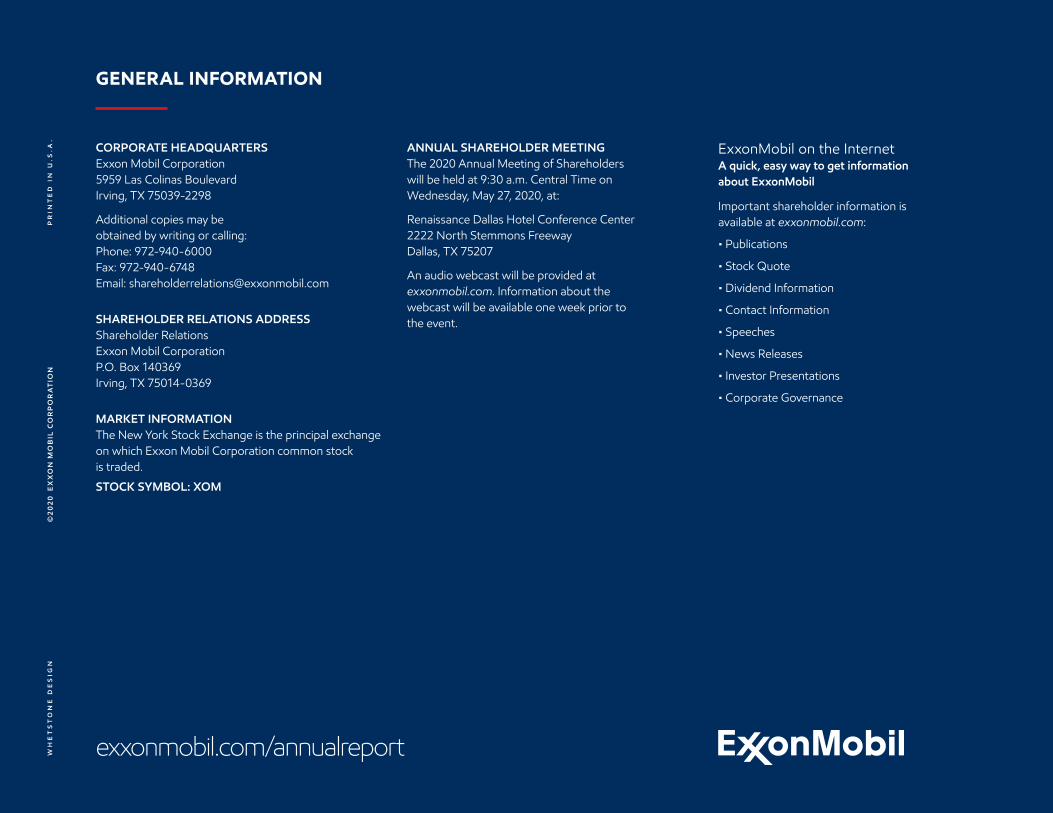
CORPORATE HEADQUARTERSExxon Mobil Corporation 5959 Las Colinas Boulevard Irving, TX 75039-2298
Additional copies may be obtained by writing or calling: Phone: 972-940-6000 Fax: 972-940-6748 Email: [email protected]
SHAREHOLDER RELATIONS ADDRESSShareholder Relations Exxon Mobil Corporation P.O. Box 140369 Irving, TX 75014-0369
MARKET INFORMATIONThe New York Stock Exchange is the principal exchange on which Exxon Mobil Corporation common stock is traded.
STOCK SYMBOL: XOM
ExxonMobil on the InternetA quick, easy way to get information about ExxonMobil Important shareholder information is available at exxonmobil.com:
• Publications
• Stock Quote
• Dividend Information
• Contact Information
• Speeches
• News Releases
• Investor Presentations
• Corporate Governance
ANNUAL SHAREHOLDER MEETINGThe 2020 Annual Meeting of Shareholders will be held at 9:30 a.m. Central Time on Wednesday, May 27, 2020, at:
Renaissance Dallas Hotel Conference Center 2222 North Stemmons Freeway Dallas, TX 75207
An audio webcast will be provided at exxonmobil.com. Information about the webcast will be available one week prior to the event.
exxonmobil.com/annualreport
GENERAL INFORMATION
WH
ET
ST
ON
E D
ES
IGN
©2
02
0 E
XX
ON
MO
BIL
CO
RP
OR
AT
ION
PR
INT
ED
IN
U.S
.A.

20
19
S
UM
MA
RY
A
NN
UA
L
RE
PO
RT
EX
XO
N
MO
BI
L
CO
RP
OR
AT
IO
N
002CSNA8D4
Exxon Mobil CorporationCorporate Headquarters5959 Las Colinas Blvd.Irving, Texas 75039-2298exxonmobil.com
Printed in U.S.A.
For more information, visit exxonmobil.com