2019 STUDY: YOUNG PROFESSIONALS
8
2019 STUDY: YOUNG PROFESSIONALS IN SUPPLY CHAIN WHAT THEY THINK ABOUT ˜ Their Jobs Today ˜ The Role of the Supply Chain ˜ Training and Advancement Opportuni’es A SPECIAL SUPPLEMENT TO SPONSORED BY
Transcript of 2019 STUDY: YOUNG PROFESSIONALS

2019 STUDY:
YOUNG PROFESSIONALS IN SUPPLY CHAIN WHAT THEY THINK ABOUT ˜ Their Jobs Today ˜ The Role of the Supply Chain ˜ Training and Advancement Opportuni’es
A SPECIAL SUPPLEMENT TO
SPONSORED BY

YOUNG PROFESSIONALS IN SUPPLY CHAIN Supply chain professionals under 30 are satisfied with their careers but are still hungry for growth, saying they work in a rewarding field with strong development opportunities.
What are young professionals looking for in a supply chain career, and how satisfied are
they with the work they are performing in the field today? The Council of Supply Chain Management Professionals (CSCMP) and Penske Logistics set out to answer these questions earlier this year when they surveyed more than 100 young professionals working in the supply chain—all under the age of 30 and either professional or student members of CSCMP. All in all, young professionals say they are satisfied with their career choice, describing the supply chain as a challenging and rewarding field that offers plenty of room for growth and advance-ment. Most also say they work in a supportive environment that offers a competitive salary and benefits and allows them to pursue a financially
comfortable living. This year’s study is a follow-up to CSCMP and
Penske’s 2017 report that asked similar questions of young professionals, and it offers a glimpse at how the industry is progressing when it comes to grooming a new generation of workers. Once again, CSCMP and Penske asked a wide range of questions to get to the heart of what supply chain organizations can do to help attract, retain, and develop young talent—an especially important
EXHIBIT 1 How many years have you been employed in a supply chain-related career?
2019 Mean 4.2
task in light of today’s increasingly tight labor mar-ket. The study sought to discover how young people describe their work, the value they place on it, what
EXHIBIT 2 Which of the following best describe the company you work for?
2019 3PL/4PL (Third Party Logistics) 21%
Manufacturing 18%
Merchandising/Retail Trade 11%
Information Technology 10%
Transportation and Warehousing 9%
Health Care 5%
Government/Military (Public Administration) 3%
Professional Services/Consultancy 2%
Real Estate (including rentals and leasing) 2%
Material Handling 2%
Accommodation and Food Services 2%
Construction 2%
Mining, Quarrying, Oil and Gas Extraction 2%
Pharmaceuticals 2%
Education/Academia 1%
Remediation Services 1%
Wholesale Trade 1%
Carrier 1%
Not-for-Profit 1%
Recruiting 1%
Finance and Insurance 0%
Management of Companies and Enterprise 0%
Administrative 0%
Agriculture, Forestry, Fishing and Hunting 0%
Arts, Entertainment and Recreation 0%
Scientific and Technical Services 0%
Social Assistance 0%
Support 0%
Utilities 0%
Waste Management 0%
Other Services (Please specify) 6%
Percentages may add to more than 100 because multiple responses were accepted.
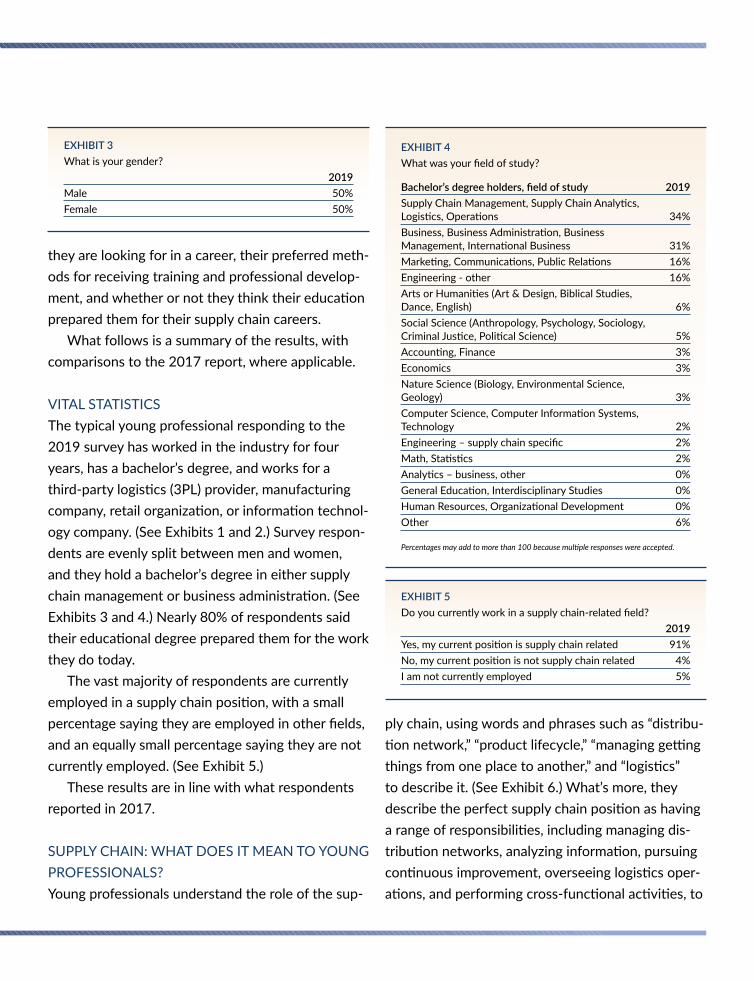
EXHIBIT 3 What is your gender?
2019 Male 50%
Female 50%
they are looking for in a career, their preferred meth-ods for receiving training and professional develop-ment, and whether or not they think their education prepared them for their supply chain careers.
What follows is a summary of the results, with comparisons to the 2017 report, where applicable.
VITAL STATISTICS The typical young professional responding to the 2019 survey has worked in the industry for four years, has a bachelor’s degree, and works for a third-party logistics (3PL) provider, manufacturing company, retail organization, or information technol-ogy company. (See Exhibits 1 and 2.) Survey respon-dents are evenly split between men and women, and they hold a bachelor’s degree in either supply chain management or business administration. (See Exhibits 3 and 4.) Nearly 80% of respondents said their educational degree prepared them for the work they do today.
The vast majority of respondents are currently employed in a supply chain position, with a small percentage saying they are employed in other fields, and an equally small percentage saying they are not currently employed. (See Exhibit 5.)
These results are in line with what respondents reported in 2017.
SUPPLY CHAIN: WHAT DOES IT MEAN TO YOUNG PROFESSIONALS?
Young professionals understand the role of the sup-
EXHIBIT 4 What was your field of study?
Bachelor’s degree holders, field of study 2019
Supply Chain Management, Supply Chain Analytics, Logistics, Operations 34%
Business, Business Administration, Business Management, International Business 31%
Marketing, Communications, Public Relations 16%
Engineering - other 16%
Arts or Humanities (Art & Design, Biblical Studies, Dance, English) 6%
Social Science (Anthropology, Psychology, Sociology, Criminal Justice, Political Science) 5%
Accounting, Finance 3%
Economics 3%
Nature Science (Biology, Environmental Science, Geology) 3%
Computer Science, Computer Information Systems, Technology 2%
Engineering – supply chain specific 2%
Math, Statistics 2%
Analytics – business, other 0%
General Education, Interdisciplinary Studies 0%
Human Resources, Organizational Development 0%
Other 6%
Percentages may add to more than 100 because multiple responses were accepted.
EXHIBIT 5 Do you currently work in a supply chain-related field?
2019 Yes, my current position is supply chain related 91%
No, my current position is not supply chain related 4%
I am not currently employed 5%
ply chain, using words and phrases such as “distribu-tion network,” “product lifecycle,” “managing getting things from one place to another,” and “logistics” to describe it. (See Exhibit 6.) What’s more, they
describe the perfect supply chain position as having a range of responsibilities, including managing dis-tribution networks, analyzing information, pursuing continuous improvement, overseeing logistics oper-ations, and performing cross-functional activities, to

YOUNG PROFESSIONALS IN SUPPLY CHAIN
name the top five. (See Exhibit 7.) In addition, those currently employed in the field say their jobs largely
align with their description of the perfect supply
chain position. (See Exhibit 8.) Respondents said they chose to pursue a supply chain career due to a previous positive experience in the industry, be-cause it is challenging, and because it offers a variety
of career opportunities, among other reasons. (See Exhibit 9.)
Again, these results are in line with what respon-dents reported two years ago.
SUPPORTIVE ENVIRONMENT, HIGH SATISFACTION
Young supply chain professionals give their super-visors and peers high marks for creating a support-ive environment where they are challenged and
EXHIBIT 6 When you think about the words “supply chain,” what is the first thing that comes to mind?
2019 Distribution network, managing getting things from one place to another efficiently, moving goods from producer-supplier 23%
Product lifecycle, from raw materials to end customer 22%
Logistics, in general 12%
Transporting, specific types of transportation modes and-or warehousing 9%
Inventory management, inventory transportation 9%
Optimization, continuous improvement, efficiencies, intelligent movement 8%
Business critical, essentiality, strategic business approach, competitive advantage 6%
Supply and demand 5%
Manufacturing or producing goods 4%
Complexity 2%
Connecting value chain, adding value 2%
Relationships (strategic business relationships, customer relationships) 2%
Sourcing, procurement 3%
can grow. When asked to describe the supervision they get on the job, the majority said their manag-ers praise good work (85%), know their jobs well (82%), and are tactful in their leadership roles (79%). They also referred to their managers as influential (69%) and up-to-date on industry and company
issues (76%). Young professionals are equally posi-tive about their peers in the workplace, describing them as responsible (92%) and smart (87%). Fewer respondents referred to their peers as frustrating (26%) or slow (16%). These results are in line with
what the research found in 2017.
EXHIBIT 7 What are the key responsibilities of a supply chain position?
Responsibilities 2019
Distribution network, managing getting things from one place to another efficiently, moving goods from producer-supplier 20%
Analyst, analyzing 18%
Optimization, continuous improvement, efficiencies, intelligent movement 17%
Logistics 15%
Cross functional 11%
Customer service, customer programs 9%
Product lifecycle 6%
Consulting 5%
Project management 4%
Manufacturing 3%
Sourcing 2%
People focused (HR, securing talent, creating teams, etc) 1%
Other Responsibilities 6%
Percentages may add to more than 100 because multiple responses were accepted.
EXHIBIT 8 On a scale of 1 to 10, where 1 means it does not describe your current position and 10 means it perfectly describes your current position, how closely does your current position match your description of the perfect supply chain position?
2019 Mean 6.55Other 16%
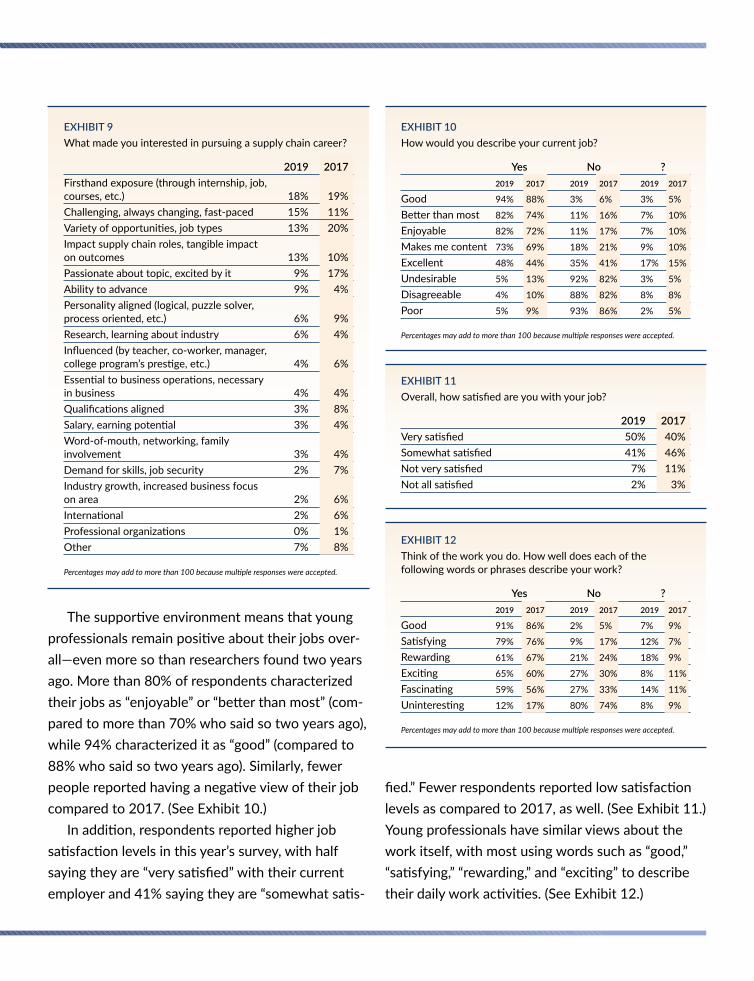
EXHIBIT 9 EXHIBIT 10 What made you interested in pursuing a supply chain career? How would you describe your current job?
2019 2017 Yes No ? Firsthand exposure (through internship, job, 2019 2017 2019 2017 2019 2017 courses, etc.) 18% 19% Good 94% 88% 3% 6% 3% 5%
Challenging, always changing, fast-paced 15% 11% Better than most 82% 74% 11% 16% 7% 10%
Variety of opportunities, job types 13% 20% Enjoyable 82% 72% 11% 17% 7% 10%
Impact supply chain roles, tangible impact Makes me content 73% 69% 18% 21% 9% 10% on outcomes 13% 10% Excellent 48% 44% 35% 41% 17% 15% Passionate about topic, excited by it 9% 17% Undesirable 5% 13% 92% 82% 3% 5% Ability to advance 9% 4% Disagreeable 4% 10% 88% 82% 8% 8% Personality aligned (logical, puzzle solver, Poor 5% 9% 93% 86% 2% 5%process oriented, etc.) 6% 9%
Research, learning about industry 6% 4% Percentages may add to more than 100 because multiple responses were accepted.
Influenced (by teacher, co-worker, manager, college program’s prestige, etc.) 4% 6%
Essential to business operations, necessary EXHIBIT 11 in business 4% 4% Overall, how satisfied are you with your job? Qualifications aligned 3% 8%
2019 2017Salary, earning potential 3% 4% Very satisfied 50% 40%Word-of-mouth, networking, family
involvement 3% 4% Somewhat satisfied 41% 46%
Demand for skills, job security 2% 7% Not very satisfied 7% 11%
Not all satisfied 2% 3% on area 2% 6%
International 2% 6%
Professional organizations 0% 1%
Industry growth, increased business focus
EXHIBIT 12 Other 7% 8% Think of the work you do. How well does each of the
Percentages may add to more than 100 because multiple responses were accepted. following words or phrases describe your work?
Yes No ? 2019 2017 2019 2017 2019 2017The supportive environment means that young Good 91% 86% 2% 5% 7% 9%
professionals remain positive about their jobs over- Satisfying 79% 76% 9% 17% 12% 7%
Rewarding 61% 67% 21% 24% 18% 9%all—even more so than researchers found two years Exciting 65% 60% 27% 30% 8% 11%ago. More than 80% of respondents characterized Fascinating 59% 56% 27% 33% 14% 11%
their jobs as “enjoyable” or “better than most” (com- Uninteresting 12% 17% 80% 74% 8% 9%
pared to more than 70% who said so two years ago), Percentages may add to more than 100 because multiple responses were accepted.
while 94% characterized it as “good” (compared to 88% who said so two years ago). Similarly, fewer people reported having a negative view of their job fied.” Fewer respondents reported low satisfaction compared to 2017. (See Exhibit 10.) levels as compared to 2017, as well. (See Exhibit 11.)
In addition, respondents reported higher job Young professionals have similar views about the satisfaction levels in this year’s survey, with half work itself, with most using words such as “good,” saying they are “very satisfied” with their current “satisfying,” “rewarding,” and “exciting” to describe employer and 41% saying they are “somewhat satis- their daily work activities. (See Exhibit 12.)

YOUNG PROFESSIONALS IN SUPPLY CHAIN
OPPORTUNITY ABOUNDS
The study also found that young professionals are growing increasingly satisfied with the opportunities a supply chain career affords them. They pointed to promotion opportunities within their companies as a key example. More than half of respondents said their companies offer a good opportunity for pro-motion, with more than 70% saying their companies offer a “fairly good chance” for promotion. A small percentage said they would characterize their posi-tion as a “dead-end job”—fewer than those who said so two years ago. (See Exhibit 13.)
Respondents to this year’s survey are slightly less willing to relocate for a new position than in the past. Just 31% of respondents said they would be “very willing” to relocate for a new opportunity,
EXHIBIT 13 How would you describe your opportunity for being promoted?
Yes No ? 2019 2017 2019 2017 2019 2017
Fairly good chance for promotion 72% 60% 15% 28% 13% 13%
Good chance for promotion 51% 54% 26% 35% 23% 12%
Good opportunities for promotion 52% 53% 29% 34% 19% 13%
Opportunities somewhat limited 45% 52% 48% 42% 7% 5%
Regular promotions 30% 33% 52% 51% 18% 16%
Dead-end job 7% 14% 88% 79% 5% 7%
Percentages may add to more than 100 because multiple responses were accepted.
EXHIBIT 14 How willing are you to relocate for a new opportunity?
2019 2017 Very willing 31% 49%
Somewhat willing 41% 39%
Not very willing 18% 8%
Not at all willing 10% 5%
compared with nearly 50% who said so two years ago. Those who said they are “somewhat willing” to relocate remained the same—around 40%—while more people reported being unwilling to relocate. (See Exhibit 14.)
Respondents also said they are less eager to extend their daily commute for a better opportunity. Just 23% of respondents said they would be “very
willing” to add commuting time to their day for a better job, compared with 32% of respondents in 2017. About half of respondents said they would be “somewhat willing” to do so, the same as two years ago. (See Exhibit 15.)
Once again, young supply chain professionals say they are eager to continue their education on the job. And once again, they say they want to do it the old-fashioned way, via face-to-face training sessions. When asked whether they would like to re-ceive training/education via online media or through in-person training/development sessions, the ma-jority said they prefer in-person training, as they did two years ago, delivered through mentoring or task-
EXHIBIT 15 How willing are you to extend your commute for a new opportunity?
2019 2017 Very willing 23% 32%
Somewhat willing 53% 50%
Not very willing 15% 15%
Not at all willing 9% 3%
EXHIBIT 16 How would you like to experience education/training opportunities in your company?
Online = 0 In Person = 10
2019 2017 Mean 7.0 7.5

EXHIBIT 17 Please rank each of the following in terms of their importance to you in an employment opportunity.
2019 2017
Mean Rank
Rank Order
Mean Rank
Rank Order
Pay and benefits that are competitive with other local companies 4.5 1 4.9 1
Positive working relationship with manager 4.7 2 5.6 2
A work/life balance 4.9 3 5.7 3
Freedom in decision making 5.8 4 6.2 5
A clear development track in my career field 6.0 5 6.4 6
Training opportunities to develop the skills to succeed 6.4 6 6.1 4
Co-workers with whom I enjoy working 6.5 7 6.7 7
High importance placed on the tasks I am given 7.5 8 7.5 8
Variety of skills used on the job 7.7 9 7.6 9
Feedback about my performance on the job 7.9 10 8.0 10
The best supplies and equipment to do my job 9.0 11 9.2 12/13
Travel opportunities 9.0 12 8.1 11
Closely related to my education 11.0 13 9.2 12/13
based activities that can be completed at their own pace (either individually or in a one-on-one setting). (See Exhibit 16.)
WELL COMPENSATED
Young supply chain professionals list a range of factors that are important to them in a job, and first and foremost are competitive pay and benefits. They also seek a positive working relationship with
their manager, work/life balance, the freedom to make decisions in their daily work, and a clear career development path—in that order. Their priorities have shifted slightly in the last couple of years: The top three requirements (competitive pay/benefits, positive relationship with manager, and work/life balance) are the same as they were in 2017, but
EXHIBIT 18 How well does each of the following words or phrases describe your present pay?
Yes No ? 2019 2017 2019 2017 2019 2017
Enough to live on 87% 72% 7% 23% 6% 4%
Comfortable 76% 64% 16% 29% 8% 8%
Underpaid 28% 40% 62% 52% 10% 7%
Well paid 49% 38% 41% 51% 10% 11%
Barely live on income 6% 25% 89% 68% 5% 7%
Bad 4% 13% 88% 79% 8% 8%
Percentages may add to more than 100 because multiple responses were accepted.
freedom in decision making and a clear career devel-opment path jumped in the ranks, pushing demand for training opportunities a bit further down the list. (See Exhibit 17.)
Looking closer at pay, young professionals remain satisfied with the compensation they receive, even more so than they were in 2017. More profession-als reported being either “well paid,” “comfortable,” or having “enough to live on” in 2019, while fewer reported being underpaid. (See Exhibit 18.)
IN SUMMARY All in all, young supply chain professionals say they understand the role of the supply chain in today’s business world and are well prepared to fill the vari-ety of opportunities available to them at companies across the country. Competitive compensation, a positive and supportive work environment, and the opportunity for advancement are the key elements they seek in return.
In early 2019, the Council for Supply Chain Management Pro-fessionals (CSCMP) and Penske Logistics conducted an online survey of CSCMP members under the age of 30 for their Young Professionals in Supply Chain report. More than 100 responses were analyzed in aggregate; individual responses were kept con-fidential. For more information on CSCMP, visit www.cscmp.org.