2019 Global Insurance Pools trends and forecasts: P&C and ...
18
Insurance Practice 2019 Global Insurance Pools trends and forecasts: P&C and health insurance Developed markets still dominate by total premiums, but emerging nations are growing at the fastest clip. An in-depth examination of global property- and-casualty (P&C) and health insurance markets reveals trends by region and product line and identifies likely pockets of value for the coming years. May 2019
Transcript of 2019 Global Insurance Pools trends and forecasts: P&C and ...

Insurance Practice
2019 Global Insurance Pools trends and forecasts: P&C and health insuranceDeveloped markets still dominate by total premiums, but emerging nations are growing at the fastest clip. An in-depth examination of global property-and-casualty (P&C) and health insurance markets reveals trends by region and product line and identifies likely pockets of value for the coming years.
May 2019

The P&C insurance landscapeThe global P&C industry improved between 2016 to 2017, with North America and developing Asia–Pacific (APAC) contributing the most toward growth in gross premiums written in this period. The emerging markets of Africa, developing APAC, and Latin America exhibited the fastest growth (Exhibit 1).1
Absolute growth in global P&C premiums has increased from previous years, largely because of the robust expansion of the US P&C market, which contributed approximately 40 percent of the premium growth for the 2016–17 period. Accident and motor insurance posed the largest increase in the United States during this period, mainly resulting from rate increases by US auto insurers.
Exhibit 1
North America continues to lead the growth in P&C, while developing APAC is the fastest-growing market.
P&C GDDPW absolute growth,¹2014–15; €, billions²
P&C GDDPW absolute growth,¹2015–16; €, billions²
P&C GDDPW absolute growth,¹2016–17;³ €, billions²
1 Gross direct domestic premiums written absolute growth.² Average �xed exchange rate for 2016 used.³ Estimates for 2017 �gures based on Q3, H1, and full-year reporting.
Source: McKinsey Global Insurance Pools
McKinsey Insurance 2019Global Insurance Pools Non-lifeExhibit 1 of 15
North America 24
5
4
1
2
14
2
1
53
4
7
2
3
16
3
1
54
5
8
2
4
19
1
1
68
4
14
1
3
1
11
10
11
4
3
9
2
8
2
11
10
10
4
5
x Growth rate, %
10
2
6
2
12
4
11
5
19 29
Latin America
Western Europe
Eastern Europe
Developed APAC
Developing APAC
Middle East
Africa
Total
1 Latin America refers to all countries therein besides Venezuela, which was excluded because data is skewed due to hyperinflation. Remaining regions refer to the following countries. Africa: Egypt, Kenya, Morocco, Nigeria, South Africa, Tunisia. Developed APAC: Australia, Hong Kong, Japan, New Zealand, Singapore, South Korea, Taiwan. Developing APAC: China, India, Indonesia, Malaysia, Philippines, Thailand, Vietnam. Middle East: Bahrain, Iran, Israel, Jordan, Saudi Arabia, Turkey, United Arab Emirates.
Our 2019 analysis of McKinsey’s Global Insurance Pools database offers detailed trends and forecasts on the insurance industry. Overall, the global industry grew by more than 4 percent in 2017, the same level as its compound annual growth rate from 2010 to 2016, and total premiums reached €4.7 trillion. This report, one in a three-part series, provides analysis and insights on P&C and health insurance, with an in-depth look by region and product line.
2 2019 Global Insurance Pools trends and forecasts: P&C and health

Exhibit 2
1 Figures for 2017 estimated based on Q3, H1, and full-year reporting.² Average �xed exchange rate for 2016 used.
Source: McKinsey Global Insurance Pools
P&C industry in emerging markets has been booming and o�ers growth opportunities across all P&C products
CAGR, 2009–17 <0% 0–4% 4–8% >8%
McKinsey Insurance 2019Global Insurance Pools Non-lifeExhibit 2 of 15
CAGR, 2017¹–25E 0–2% 2–5% 5–8% >8%
Total 2017;¹ €, millions2
Average net combined ratio, 2014–17, %
317
95 91 98 96 98 97 94 92 97
30 621 16851 14 30 = 1,410
641
311
205
110
142
177
Motor
Western Europe
Eastern Europe
North America
Latin America
Developed APAC
Developing APAC Africa Middle East
World, 2017;¹ €, millions2
Fire and property
Liability
Accident
Other
P&C premium heat map
From 2016 to 2017, 28 percent of the growth in premiums came from the emerging markets of China and India, where the P&C industry rose at a CAGR of 14 percent over the same period. This bump can be attributed to rising income levels, greater awareness of products, and increased government-backed penetration. For instance, the size of the crop insurance segment in India grew fourfold from 2016 to 2017 after the government introduced a new scheme ensuring comprehensive protection for farmers.
Trends in P&C lines of business across regionsIn North America, liability and accident product lines are forecasted to improve growth from 2017 to
2025, while the other three product categories are expected to experience slowing growth (Exhibit 2). Liability in the United States is expected to rise in the coming years because of more robust economic growth and impact from the new tax law’s Base Erosion and Anti-Abuse Tax (BEAT) provision.
As Western Europe’s major economies recovered from the aftereffects of the global financial recession in 2008, growth in P&C products was sluggish until 2017. In Spain, for example, the number of liability policies sold dropped as the country was embroiled in economic crisis from 2008 to 2014. However, Western Europe is predicted to show a slight improvement from 2017 to 2025 across all P&C products.
32019 Global Insurance Pools trends and forecasts: P&C and health

Rising demand and untapped market potential in the accident, liability, and motor product lines have caused P&C premiums to rise in emerging markets (such as Latin America and developing APAC) from 2009 to 2017. This trend is also expected to lead to future growth. Trends in regional profitabilityIn the past few years, the P&C market has experienced deteriorating profitability owing to natural catastrophes in the Americas and APAC as well as to softer underwriting. In 2017, China, Japan, and the United States were subject to a huge volume of claims in the aftermath of storms, floods, and earthquakes, making that year one of the worst for natural catastrophes in recent history (Exhibit 3).
In North America, devastating losses resulting from Hurricanes Harvey, Irma, and Maria caused the net combined ratio to worsen in 2017.
Other developed regions experienced a steady trajectory. Underwriting profitability remained consistent in Western Europe, for example, with an average net combined ratio of 95 percent. However, it is expected to deteriorate in the future due to a softer rate cycle. Profitability in developed APAC stabilized in large part because of Japan, which accounts for almost 50 percent of the claims incurred in the region. That country improved its profitability thanks to the absence of natural disasters in 2017.
Exhibit 3
Underwriting pro�tability in the Americas declined in the past few years.Net combined ratio, P&C insurance; %
World North America Western Europe Developed APAC
1 Figures for 2017 estimated based on Q3, H1, and full-year reporting.
Source: McKinsey Global Insurance Pools
McKinsey Insurance 2019Global Insurance Pools Non-lifeExhibit 3 of 15
0
20
40
60
80
100
120
2010 ’12 ’14 ’16’11 ’13 ’15 2017¹
0
20
40
60
80
100
120
2010 ’12 ’14 ’16’11 ’13 ’15 2017¹
0
20
40
60
80
100
120
2010 ’12 ’14 ’16’11 ’13 ’15 2017¹
0
20
40
60
80
100
120
2010 ’12 ’14 ’16’11 ’13 ’15 2017¹
Africa Latin America Eastern Europe Developing APAC
0
20
40
60
80
100
120
2010 ’12 ’14 ’16’11 ’13 ’15 2017¹
0
20
40
60
80
100
120
2010 ’12 ’14 ’16’11 ’13 ’15 2017¹
0
20
40
60
80
100
120
2010 ’12 ’14 ’16’11 ’13 ’15 2017¹
0
20
40
60
80
100
120
2010 ’12 ’14 ’16’11 ’13 ’15 2017¹
Net claims ratio Net expense ratio
4 2019 Global Insurance Pools trends and forecasts: P&C and health

The picture was mixed for emerging markets in 2017. Latin American countries witnessed declining profitability caused by earthquakes, floods, and wildfires. In Eastern Europe, net combined ratios shot up after declining since 2013, mainly led by rising claims. Developing APAC has shown gradual improvement in its net combined ratio from 2013 onward. However, losses from floods in China resulted in a slight decline in profitability in 2017.
The expense ratio in different regions may vary significantly depending on a few factors, including the difference in product preferences, which drives
differences in commission rates. Administrative expenses can also differ by region due to cost of operations, investment in digitization, and general operating expenses. Trends in motor insuranceMotor insurance has led growth in the P&C industry with a CAGR of 7 percent from 2016 to 2017. This increase was primarily because of improving macroeconomic conditions in North America, a rise in disposable income, and the increasing number of vehicles in emerging markets (Exhibit 4).
Exhibit 4
Motor insurance has been the dominant product in P&C lines and is likely to drive growth in the future.
Global insurance premiums, P&C, €, billions CAGR, %
2010–16 2016–172
1 Figure does not sum to 1,020, because of rounding.2 Average �xed exchange rate for 2016 used.3 Figures for 2017 estimated based on Q3, H1, and full-year reporting.
Source: McKinsey Global Insurance Pools
McKinsey Insurance 2019Global Insurance Pools Non-lifeExhibit 4 of 15
Motor
Fire and property
Other
Liability
Accident
5 7
3 3
4 1
5 6
6 5
2010
1,020¹
440
247
158
80
96
2014
1,234
535
292
190
94
123
2015
1,287
564
298
199
98
128
2016
1,342
600
301
202
104
135
20173
1,410
641
311
205
110
143
+5%
+5%
52019 Global Insurance Pools trends and forecasts: P&C and health

In the United States, which accounted for around 38 percent of global motor premiums in 2017, insurers raised their rates to compensate for rising claims; the result was a CAGR of around 8 percent from 2016 to 2017. Among emerging countries, China (which holds approximately 16 percent of global market share in motor insurance) is the leading market and has continually recorded CAGRs above 10 percent in the past few years. The
other emerging markets that have achieved high growth—that is, more than 10 percent CAGR over the past few years—are Colombia, India, Mexico, the Philippines, Poland, and Vietnam. From 2013 to 2017, motor insurance grew faster than non-motor lines in all regions except Western Europe, where its contribution has been dropping over the past few years (Exhibit 5). The motor
Exhibit 5
The share of motor premiums has been growing in North America in the past few years while it has stabilized in other regions.
Motor and non-motor premium share, % CAGR 2013–17, %
North America
Developed APAC
Western Europe
2013 2017¹ 2013 2017¹
Motor and non-motor premium share, % CAGR 2013–17, %
Latin America
1 Figures for 2017 estimated based on Q3, H1, and full-year reporting.
Source: McKinsey Global Insurance Pools
McKinsey Insurance 2019Global Insurance Pools Non-lifeExhibit 5 of 15
6
3
39
61
42
58
4
1
41
59
43
57
11
11
47
53
47
53
Developing APAC
12
11
67
33
68
32
1
2
40
60
39
61
Eastern Europe
5
4
52
48
54
46
Motor Non-motor
6 2019 Global Insurance Pools trends and forecasts: P&C and health
insurance industry’s growth in dominant markets, such as Spain, was sluggish during this time period because of price wars and declining new car sales. Indeed, 62 percent of vehicles in Spain in 2017 were more than ten years old.
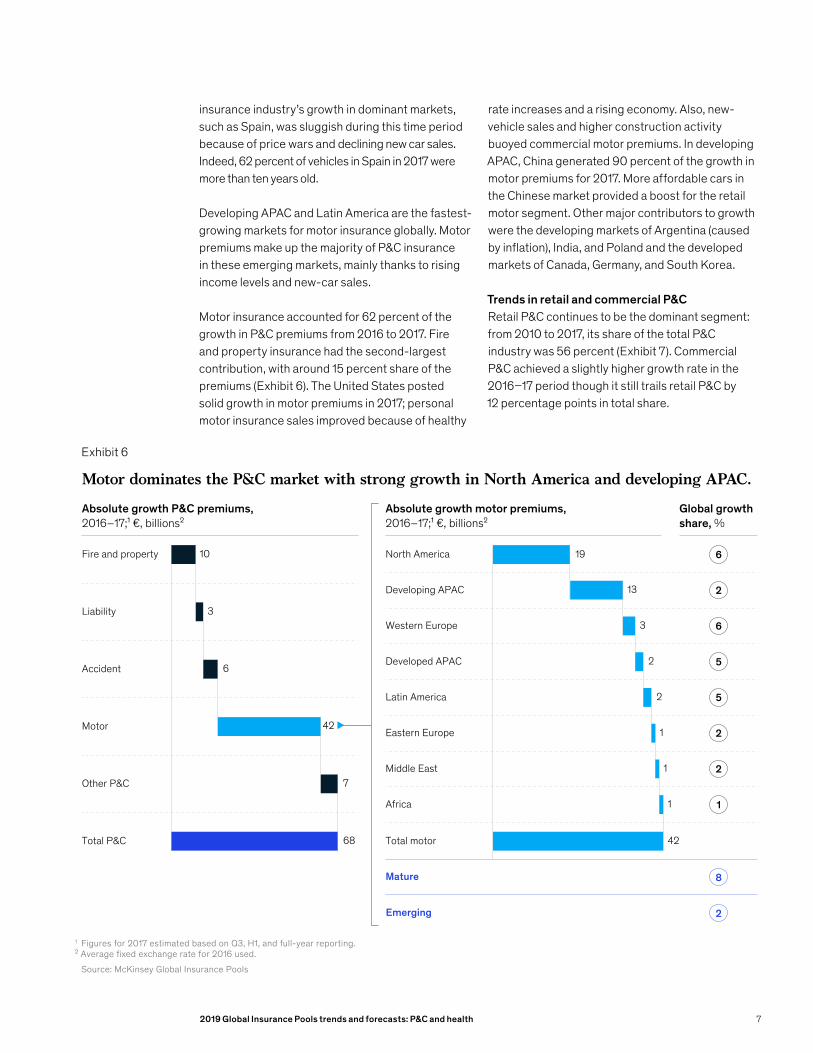
Developing APAC and Latin America are the fastest-growing markets for motor insurance globally. Motor premiums make up the majority of P&C insurance in these emerging markets, mainly thanks to rising income levels and new-car sales. Motor insurance accounted for 62 percent of the growth in P&C premiums from 2016 to 2017. Fire and property insurance had the second-largest contribution, with around 15 percent share of the premiums (Exhibit 6). The United States posted solid growth in motor premiums in 2017; personal motor insurance sales improved because of healthy
rate increases and a rising economy. Also, new-vehicle sales and higher construction activity buoyed commercial motor premiums. In developing APAC, China generated 90 percent of the growth in motor premiums for 2017. More affordable cars in the Chinese market provided a boost for the retail motor segment. Other major contributors to growth were the developing markets of Argentina (caused by inflation), India, and Poland and the developed markets of Canada, Germany, and South Korea.
Trends in retail and commercial P&CRetail P&C continues to be the dominant segment: from 2010 to 2017, its share of the total P&C industry was 56 percent (Exhibit 7). Commercial P&C achieved a slightly higher growth rate in the 2016–17 period though it still trails retail P&C by 12 percentage points in total share.
Exhibit 6
Motor dominates the P&C market with strong growth in North America and developing APAC.
Absolute growth P&C premiums,2016–17;¹ €, billions²
Absolute growth motor premiums,2016–17;¹ €, billions²
Global growth share, %
1 Figures for 2017 estimated based on Q3, H1, and full-year reporting.² Average xed exchange rate for 2016 used.
Source: McKinsey Global Insurance Pools
McKinsey Insurance 2019Global Insurance Pools Non-lifeExhibit 6 of 15
Fire and property
3
6
7
68
3
1
42
6
2
6
5
5
2
2
1
8
2
10 19
Liability
Accident
Motor
Other P&C
Total P&C
North America
Developing APAC
Western Europe
Developed APAC
Latin America
Eastern Europe
Middle East
Africa
Total motor
Mature
Emerging
2
2
13
1
142
72019 Global Insurance Pools trends and forecasts: P&C and health

Exhibit 7
The share of commercial P&C has not changed much in the past few years.Global retail and commercial premiums, P&C, €, billions1 CAGR, %
2010–16 2016–17³
Note: Figures may not sum, because of rounding.1 Average �xed exchange rate for 2016 used.2 Figures for 2017 estimated based on Q3, H1, and full-year reporting.
Source: McKinsey Global Insurance Pools
McKinsey Insurance 2019Global Insurance Pools Non-lifeExhibit 7 of 15
Commercial
Retail
4 6
5 4
2010
1,020
454
566
2014
1,234
546
687
2015
1,287
566
721
2016
1,342
583
758
20172
1,410
617
793
+5%
+5%
Retail premiums grew faster than commercial premiums from 2013 to 2017 in all regions except developed APAC. In the emerging markets of developing APAC and Eastern Europe, retail premiums increased at double the rate of commercial segments in this time period (Exhibit 8). The United States, which underwrites almost half of the global P&C commercial lines premiums, experienced a slowdown through 2017. However, in the aftermath of natural disasters in 2017, rate increases are expected to boost premium growth in commercial motor and commercial property in this market.
China has the second-largest share of the global commercial P&C market, and its commercial segment grew at a CAGR of 7 percent from 2013 to 2017. By contrast, retail P&C grew 16 percent during the same time period. From 2013 to 2017, in the top Western European commercial P&C markets, such as France, Germany, and the United Kingdom, premium growth ranged from 0 to 3 percent. Global commercial lines in P&CThe global commercial P&C insurance industry consists of small, medium, and large customer segments accounting for 33 percent, 20 percent, and
8 2019 Global Insurance Pools trends and forecasts: P&C and health

Exhibit 8
The share of commercial P&C premiums in emerging markets has been shrinking while it has been stable in mature markets.
Commercial and retail market share, % CAGR 2013–17, %
North America
Developed APAC
Western Europe
2013 2017¹ 2013 2017¹
Commercial and retail market share, % CAGR 2013–17, %
Latin America
1 Figures for 2017 estimated based on Q3, H1, and full-year reporting.
Source: McKinsey Global Insurance Pools
McKinsey Insurance 2019Global Insurance Pools Non-lifeExhibit 8 of 15
4
5
51
49
50
50
3
2
29
71
30
70
10
11
54
46
53
47
Developing APAC
8
15
44
56
38
62
2
2
40
60
40
60
Eastern Europe
3
6
47
53
45
55
Commercial Retail
47 percent, respectively, of the market (Exhibit 9). The huge US commercial P&C industry has an outsized influence across global customer segments. In contrast, Western Europe has a completely different distribution at 43 percent, 26 percent, and 30 percent, respectively. This market composition highlights the difference in the insurance industry’s
client segmentation in the two regions. For instance, the global commercial markets of Lloyd’s of London and the London Companies Market, which represent a combined 11 percent of the total commercial P&C market, primarily provide specialty risk coverage to large corporations.
92019 Global Insurance Pools trends and forecasts: P&C and health

Exhibit 9
Large corporation segment accounts for ~47 percent of the total commercial insurance business, with the largest contribution from Latin America.Global commercial lines premiums by segment,¹ % of premiums, 2016
1 Segmentation turnover: small is $0–25 million, medium is $25 million–500 million, large is <$500 million.² Figure does not sum to 100, because of rounding.
Source: McKinsey Global Insurance Pools
McKinsey Insurance 2019Global Insurance Pools Non-lifeExhibit 9 of 15
Total
47
20
33
30
26
43
31
26
43
53
13
34
61
21
18
55
25
20
56
26
18
31
26
43
32
26
42
79
15
6
Western Europe²
Eastern Europe
North America
Latin America
Developed Asia
Developing Asia
Middle East
Africa Global commercial
markets
Small
100
Medium
Large
The industries that contribute the most to the world’s commercial P&C insurance market premiums are manufacturing (32 percent), professional services (17 percent), and trade (11 percent). The global share of premiums generated by manufacturing, professional services, and trade in North America and Western Europe are 59 percent, 85 percent, and 72 percent, respectively. A deep dive into the commercial lines segment analysis on the basis of different lines of business also provides unique insights. For example, analysis indicates that, in Spain, the line of business that contributes the most to commercial lines is property in the middle segment (44 percent). A breakdown of premium contribution by customer segments within
business lines shows that the medium segment represents the largest bloc, with 40 to 44 percent across all lines of businesses (Exhibit 10). Forecast for P&C insurance industryA new wave of insurtechs has disrupted the P&C insurance industry and could heavily influence the growth of premiums. While macro factors will likely continue to shape premium development, rapid technological innovations (such as usage-based insurance, blockchain, robo-advisory, and the Internet of Things—especially in pricing and distribution) are transforming the insurance landscape across product lines. More specifically, the sharing economy could create new products by shifting risks into commercial lines. Lifestyle
10 2019 Global Insurance Pools trends and forecasts: P&C and health

changes—for example, to insure mobility concepts—are increasing demand for flexible coverages.
On the regulation side, the rising demand for transparency could reduce the sale of certain product types, especially bundled products. At the same time, increased litigation could expand the demand for liability insurance. Car telematics could further decrease claims by encouraging safer behavior of drivers, while assisted- and self-driving cars could diminish the future motor premium pool. Smart homes have the potential to reduce risks for home insurance, and cybercrime’s emerging risks could result in the creation of new insurance
products. The greater frequency and increasing severity of natural catastrophes may result in additional claims.
For these reasons, the global P&C market is expected to maintain its momentum in the next couple of years. Premiums are forecasted to rise by a CAGR of 4 percent through 2020, and mature markets, which account for more than 50 percent of premiums, would continue to fuel this growth. Latin America, developing APAC (led by China, India, and Vietnam), and Africa are predicted to grow at double-digit rates in the short term.
Exhibit 10
Medium corporation segment has the highest contribution across all lines�of business in the Spanish P&C commercial insurance market.
Premium contribution by customer segments within LoB¹Spain commercial insurance² GWP,³ 2016,4 %
Penetration (premium/turnover), basis points
Small(<$25 million)
100
Engineering
MAT Accident Property
Width denotes the size of line of business
Liability
Medium(<$25 million–500 million)
Large(<$500 million)
Note: Figures may not sum to 100%, because of rounding.1 Customized oering created based on client information from Spain.² Fleets or commercial motor not included in analysis.³ Gross written premiums.⁴ Average �xed exchange rate for 2016 used.
Source: McKinsey Global Insurance Pools, World Health Organization
McKinsey Insurance 2019Global Insurance Pools Non-lifeExhibit 10 of 15
232528282627
4441424340
3130313133
22
19
112019 Global Insurance Pools trends and forecasts: P&C and health

Exhibit 11
McKinsey Insurance 2019Global Insurance Pools Non-lifeExhibit 11 of 15
North America continues to drive the growth in health.
Health GDDPW abs. growth,¹ 2014–15; €, billions²
Health GDDPW abs. growth,¹2015–16; €, billions²
Health GDDPW abs. growth,¹2016–17;³ €, billions²
Note: Figures may not sum, because of rounding.1 Gross direct domestic premiums written absolute growth.² Average �xed exchange rate for 2016 used.³ Figures for 2017 estimated based on Q3, H1, and full-year reporting.
Source: McKinsey Global Insurance Pools
North America 58
1
2
0
4
12
2
0
79
1
4
0
4
23
1
0
81
2
5
0
0
6
2
0
56
9
13
1
4
8
46
21
12
9
7
9
3
7
8
61
8
18
8
5
x Growth rate, %
13
4
10
1
12
13
5
47 40
Latin America
Western Europe
Eastern Europe
Developed APAC
Developing APAC
Middle East
Africa
Total
10
The health insurance landscapeThe global health insurance market grew 5 percent in 2017. North America and developing APAC were the top two regions by contribution. Developing APAC, followed by Africa, had the best track record for growth rates from 2014 to 2017 (Exhibit 11). North America continues to lead the growth of health premiums, with an increase in premiums of €40 billion and a 5 percent CAGR from 2016 to 2017. Medical cost inflation and an aging population helped to boost demand. In developing APAC, China recorded a CAGR of 40 percent from 2014 to 2017. This trajectory can be attributed to public health awareness, greater wealth levels, and unmet demand for basic medical insurance.
Africa has also witnessed huge growth, with Egypt and Kenya achieving CAGRs of 21 and 22 percent,
respectively, from 2014 to 2017. Egypt’s robust market can be attributed to increased government spending on health and improved infrastructure. In addition, Misr Insurance (the biggest player in Egypt, with 48 percent of the market) saw a sharp increase in its medical insurance line. Kenya’s rise can be attributed to an increase of around 8 percent in penetration over the past several years. Further, the country’s top six players, which constitute around 80 percent of the market, expanded by a CAGR of 48 percent from 2014 to 2016.
Overall, the global health insurance market grew by 6.5 percent from 2010 to 2016 and 5.3 percent in 2017 (Exhibit 12). Although health insurance is a growing line of business, the commercial segment appears to be declining significantly. In the United States, for example,
12 2019 Global Insurance Pools trends and forecasts: P&C and health

the share of commercial dropped from 53 percent in 2010 to 46 percent in 2016. Two factors are responsible: employers are increasingly opting to self-insure instead of purchasing risk products, and Medicare Advantage and managed Medicaid have grown substantially during this period.
ProfitabilityFrom 2010 to 2017, the global health insurance market’s average combined ratio was around 98 percent. However, profits have declined over the past few years (Exhibit 13). The recent decrease of global underwriting profit can be largely attributed to North America. In Canada, for example, the net claims incurred grew by a CAGR of 11 percent from 2010 to 2016 while net premiums earned rose by 8 percent. The increase in net claims incurred was caused by cost inflation, higher utilization of services, entry of new services and products, and regulatory changes. The increase in net premiums earned was because of a 70 percent
jump in average healthcare costs during the past two decades and an aging population.
The United States followed a similar pattern: from 2010 to 2016, the CAGR of net claims incurred outpaced net premiums earned by one percentage point. The increase in net claims incurred was caused by poor claims performance in the individual market and the growth of managed Medicaid products, which tend to have high claims rates but low margins. In addition, total healthcare spending grew by around 6 percent a year from 2010 to 2016, and this steady increase contributed to the rise in net premiums earned.
The expense ratio in different regions may vary significantly depending on a few factors, including the difference in product preferences, which drives differences in commission rates. Administrative expenses can also differ by region due to cost of operations, investment in digitization, and general operating expenses.
Exhibit 12
Health insurance is growing at a high rate, with the individual share continuing to rise.
Total insurance premiums, health, €, billions
1,200
1,100
1,000
900
800
700
600
500
400
300
200
100
02010 2014 2015 2016 20171
Note: Figures may not sum, because of rounding. 1 Figures for 2017 estimated based on Q3, H1, and full-year reporting.
Source: McKinsey Global Insurance Pools
McKinsey Insurance 2019Global Insurance Pools Non-lifeExhibit 12 of 15
335
717
887966
1,0461,102
382
450
437
504
461
566
481
591
512
Commercial Retail
+6.5%
+5.3%
132019 Global Insurance Pools trends and forecasts: P&C and health

Exhibit 13
North America has contributed to the decline of underwriting protability in the world in the past few years.
Combined ratio, health insurance; %
World North America Western Europe Developed APAC
1 Figures for 2017 estimated based on Q3, H1, and full-year reporting.
Source: McKinsey Global Insurance Pools
McKinsey Insurance 2019Global Insurance Pools Non-lifeExhibit 13 of 15
0
20
40
60
80
100
120
2010 ’12 ’14 ’16’11 ’13 ’15 20171
0
20
40
60
80
100
120
2010 ’12 ’14 ’16’11 ’13 ’15 20171
0
20
40
60
80
100
120
2010 ’12 ’14 ’16’11 ’13 ’15 20171
0
20
40
60
80
100
120
2010 ’12 ’14 ’16’11 ’13 ’15 20171
Africa Latin America Eastern Europe Developing APAC
0
20
40
60
80
100
120
2010 ’12 ’14 ’16’11 ’13 ’15 20171
0
20
40
60
80
100
120
2010 ’12 ’14 ’16’11 ’13 ’15 20171
0
20
40
60
80
100
120
2010 ’12 ’14 ’16’11 ’13 ’15 20171
0
20
40
60
80
100
120
2010 ’12 ’14 ’16’11 ’13 ’15 20171
Claims ratio Expense ratio
Forecast for the health insurance industryThe momentum in the global health market is expected to persist in the next couple of years. Premiums are forecasted to grow at a CAGR of around 7 percent from 2017 to 2020. The contribution by emerging markets to global premiums would continue to grow even in the future. The highest-growth markets will be developing APAC (particularly China and India) and Africa, which are predicted to expand at double-digit rates.
The global insurance industry continues to evolve. P&C insurance is forecasted to continue expanding, while health has experienced a comparative slowdown but still leads in overall growth. Although emerging markets will exhibit the fastest rates of expansion in the coming years, the developed regions, particularly North America, will maintain their prominence in contribution to overall premiums for the foreseeable future. The global insurance industry still offers tremendous opportunities for carriers that can quickly identify pockets of value and respond accordingly.
Copyright © 2019 McKinsey & Company. All rights reserved.Photography: ©laremenko/Getty Images
14 2019 Global Insurance Pools trends and forecasts: P&C and health
An overview of McKinsey’s Global Insurance PoolsMcKinsey’s Global Insurance Pools (GIP) consists of six proprietary databases: Markets Database, Local Insurers Database, Global Insurers Database, Commercial Lines Pools, Direct Distribution Database, and Multi-Access Database. The data and insights have been provided by local researchers and regional and functional experts.
Markets Database contains more than 150,000 data points covering 66 countries, 14 subregions, and 99 percent of global insurance premiums. It includes key financial indicators for every market from 2000 to 2017¹ and projections to 2025. Future numbers prepared using a uniform forecasting methodology have been validated by local experts.
Local Insurers Database provides domestic premium-level data for total, life, and nonlife businesses of the top insurers in 43 countries. Additionally, the database also provides more granular (local) financials, such as cost and profitability metrics, for 14 countries.
Global Insurers Database captures group-level company financials for more than 100 global insurers, including premiums, cost, and profitability metrics from 2005 to 2017.
Commercial Lines Pools Database consists of information on the P&C commercial insurance industry with cuts for 17 industries, seven customer segments, and six business lines in 66 markets.
Direct Distribution Database features key financial information and trends in the life and nonlife businesses of the major direct channel players in 11 markets from 2000 to 2017.
Multi-Access Database offers comprehensive insights into customer multichannel journeys via analyses of clients’ channel preferences and usage regarding core insurance products for 13 countries.
How GIP can help support clientsMcKinsey’s Global Insurance Pools can help insurers along several dimensions. GIP’s Granularity of Growth analysis can identify a company’s specific drivers of growth; the tool can also benchmark the company’s growth and profitability against market performance and competitors and identify the impact of different macroeconomic scenarios on growth and future market shares. McKinsey offers a subscription to the database that gives users unlimited access to all data.
1 Currently, the Markets Database has data available for 2017 only for markets in which regulators have already released this information.
This report analyzes trends in the nonlife insurance industry. We’ve used historical data to examine current trends and present an assessment based on our understanding and research. This report is meant to provide a perspective on the direction the industry is headed. It identifies current trends and key pockets of growth; it does not present a bias or draw conclusions about any industry, product, or geography. Any forecasts in this report are based on our own research; they are merely meant to indicate the direction of the industry.
152019 Global Insurance Pools trends and forecasts: P&C and health

AppendixMcKinsey’s GIP initiative uses a bottom-up approach to size insurance markets. The level of detail in our GIP database varies from market to market. For less advanced markets, the data might include gross premiums written, technical reserves, and profits. For more advanced markets, GIP includes complete sets of financial indicators for each product line, including the mix of distribution channels. Historical data covers the period from 2000 to 2017 and forecasts to 2025.
GIP distinguishes five product groups in life, based on European terminology: term life, endowments, annuities, unit-linked, and group life (see below for detailed descriptions).
P&C consists of five product groups: motor, fire and property, liability, accident, and other (such as travel). Health is considered a separate line and consists of all health premiums underwritten by pure health insurers and life or P&C insurers (based on data extracted either from the life data or P&C records, depending on the regulatory treatment).
The distribution mix is available for the largest 35 countries. Channel categories consist of tied agents, brokers or independent financial advisers, bancassurance, branches, direct, and others (such as retailers and car dealers). These channels are defined later in this section.
The GIP model was built by collecting and analyzing public data (such as national insurance regulators’ data or industry association publications) country by country and drawing on the insights of our global network of local experts. We mapped the local product types and distribution channels to the standard of globally accepted definitions.
Distribution channel definitionsTied agents work exclusively for one or a few companies, or for the partners cooperating with a company. Self-employed tied agents are remunerated on a commission-only basis. Salaried employed tied agents are remunerated with salary plus commission.
Insurance distribution through branches implies that the salesmen are part of the insurer’s staff; in other words, they receive a salary, not commission.
Brokers are independent insurance distributors who are not tied to any company or salaried. They represent a client (not a company) and distribute products from a panel of companies.
Bancassurance involves distribution through bank branches.
Direct channels refer to insurance distribution through remote channels such as telephone, internet, or mail. Other channels include channels not included in any of the above categories (such as retailers, car dealers, worksite marketing, affinities).
Life product definitionsTerm life: all types of protection products with purely biometric risk coverage.
Endowments: all individual life-savings products (both single and regular premium) that provide a guaranteed credited-rate component and a lump-sum payout. Under US terminology, this would include universal life and whole life.
Annuities: individual life-savings products (both single and regular premium) that provide a guaranteed credited-rate component and a payout in the form of an annuity (in other words, a regular monthly payment stream for either a fixed duration or life). Under US terminology, this would include fixed annuities.
Unit-linked: individual life-savings products (both single and regular premium) for which the policyholder bears the investment risk and that provide a lump-sum payout. Under US terminology, this would include variable life, variable universal life, and variable annuities.
Group life: group protection, group unit-linked products, and group annuities; the largest segment is corporate pensions.
16 2019 Global Insurance Pools trends and forecasts: P&C and health
Forecasting methodologyOur volumes-forecasting model is based on a series of historical multivariate regression models that use both macroeconomic drivers and momentum as explanatory variables for premium growth.
We run panel regressions with random effects at both country and product-category levels. For life, P&C, and health, we split countries into two or three subgroups, based primarily on each country’s level of economic maturity. We then run separate regressions for the subgroups at the country and product-category levels, with particular equation specifications for each product.
For our profit-forecasting model we also developed separate methodologies for life, P&C and health. For P&C and health, we take a driver-based approach in which we forecast separately all components of profit (claims, costs, and investment income). For each profit component, we test various specifications, combining macroeconomic variables (such as GDP growth, interest rates, and inflation) and time-series variables (such as momentum effects and mean-reversion effects). The approach for life was similar. That said, since life profits are highly sensitive to capital market and regulatory conditions, any profit forecast is only valid under the assumption of stability on both these fronts.
For both P&C and life, we ran panel regressions grouping similar countries. Overall, the regressions have generated superior results, with strong r² values, good stability, and reasonable back-testing behavior.
All our models employ economic forecasts from Oxford Economics. The macrodrivers we considered include GDP growth (nominal and real), long-term and short-term interest rates, penetration, and equity market returns.
Our global network of local experts reviews the forecasts produced by our regression models to adjust for any specificities in local markets (upcoming regulatory changes, demographic shifts, or pension or healthcare system reforms).
172019 Global Insurance Pools trends and forecasts: P&C and health

18 2019 Global Insurance Pools trends and forecasts: P&C and health
Authors and acknowledgements
Claudia MaxAssociate PartnerMunich
Philipp Klais Engagement Manager Munich
Shitij GuptaExpert Gurgaon
Nataliya Fedorenko Specialist Paris
Varun John JacobAnalystGurgaon
Kavya RamjiyaniAnalyst Gurgaon
Tanya SoganiAnalystGurgaon
Shivani Agarwal Junior Analyst Gurgaon
The authors would like to acknowledge the contributions of colleagues Pierre-Ignace Bernard, Stephan Binder, Tanguy Catlin, Ari Chester, Bernhard Kotanko, Brad Mendelson, Jörg Mußhoff, and Kurt Strovink.
The team can be reached at the central email address: [email protected]
Visit McKinsey.com for more on Global Insurance Pools