
2019 Full Year Results - Campari Group · 2020-02-18 · Investor Presentation 18 February 2020....
72
2019 Full Year Results Investor Presentation 18 February 2020
Transcript of 2019 Full Year Results - Campari Group · 2020-02-18 · Investor Presentation 18 February 2020....

2019 Full YearResults
Investor Presentation
18 February 2020

Results for the Full Year 2019 ended 31 December 2019
Table of contents
Results Summary
Sales Results‒ By region
‒ By brand
Operating Results by Region
Consolidated P&L
Cash Flow & Net Financial Debt
New initiatives & Outlook
Annex
2

Results for the Full Year 2019 ended 31 December 2019
FY 2019 (1)
€ million % on sales Reported Organic FX Perimeter (2)
Net sales 1,842.5 100.0% +7.6% +5.9% +2.1% -0.4%
of which: Global priorities +7.3%
Regional priorities +4.3%
Gross profit 1,121.2 60.9% +9.1% +7.0% +2.2% -0.1%
margin accretion (bps) (3)
+80bps +60bps 0bps +20bps
EBIT adjusted (4)
408.0 22.1% +7.7% +6.7% +1.7% -0.7%
margin accretion (bps) (3)
0bps +20bps -10bps -10bps
EBITDA adjusted (4)
479.8 26.0% +10.9% +9.6% +1.7% -0.4%
margin accretion (bps) (3)
+80bps +90bps -10bps 0bps
Group net profit adjusted (5)
267.4 +7.3%
Adjusted basic EPS (€) 0.23
Recurring free cash flow 267.3
Net Debt at period end (1)
777.4
Dividend per share (€) 0.055
Change vs. FY 2018
Key figures
Results for full year ended 31 December 2019
3
Consistent solid performance across all key underlying indicators
(1) Application of IFRS 16-’Leases’ (effective 1 January 2019)
(2) Effect of termination of agency brands contracts, net of acquisitions
(3) Basis points rounded to the nearest ten
(4) EBIT and EBITDA before negative operating adjustments of €(21.7) million in FY 2019, mainly attributable to restructuring operations (positive operating adjustments of €1.9 million in FY 2018)
(5) Group net profit before overall net positive adjustments of €41.0 million in FY 2019 (overall net positive adjustments of €47.0 million in FY 2018)

Results for the Full Year 2019 ended 31 December 2019
Key highlights
> Net Sales
> Free cash flow
> EBIT
> Net profit
• Positive organic growth in FY 2019 (+5.9%), despite selective destocking in Japan and South Africa ahead of changes in route-to-market
• Consistent outperformance of key high-margin brands in core developed markets
- By brand: Global Priorities outperformed (+7.3% in FY 2019), mainly driven by Aperol and Campari. Regional Priorities up
+4.3% thanks to Espolòn, while Local Priorities were up +1.8%, thanks to the single-serve aperitifs (Crodino and Campari Soda)
and Wild Turkey read-to-drink
- By geography: good performance in high-margin markets, driven mainly by the US, Italy and the rest of Europe. Recovery in
South America and Russia, although in a highly volatile environment
4
• Reported change of +7.6%, reflecting a negative perimeter effect of -0.4% or €(6.9) million, mainly due to agency brands
discontinuation, and a positive FX effect of +2.1% or €36.1 million, driven by the strengthened US Dollar vs. Euro
• EBIT adjusted
- Organic growth of +6.7%, slightly ahead of organic sales growth (+20 bps margin accretion), driven by organic gross margin
expansion of +60 bps in FY 2019 thanks to the positive sales mix despite the agave headwinds and after reinvestments back into the
business (A&P and SG&A -40 bps dilutive)
- In Q4, organic gross margin was slightly accretive (+10 bps), largely hindered by a tough comparable base vs Q4 2018 (+230 bps).
Combined with the phasing effect of A&P, organic EBIT margin was dilutive by -90 bps
- On a reported basis change of +7.7%, taking into account the negative perimeter of -0.7% or €(2.6) million and positive FX of
+1.7% or €6.5 million
• Group net profit adjusted to €267.4 million (1), up +7.3%
• Group net profit reported to €308.4 million, up +4.1%
Sustained positive topline, fueling investments back into the business for future growth
(1) Group net profit before overall net positive adjustments of €41.0 million
(2) Please refer to slide 49 for details on the net financial debt
(3) Calculated based on the same criteria adopted for the ratio of 31 December 2019
> Net debt • Net financial debt at €777.4 million (2) as of 31 December 2019 vs. €846.3 million as of 31 December 2018, down €68.9 million, driven by
positive cash flow, net of acquisitions and real estate disposal as well as the incremental debt generated by the adoption of IFRS16-’Leases’
• Net debt to EBITDA adjusted ratio at 1.6 times as of 31 December 2019 (down from 2.0 times (3) as of 31 December 2018)
• Free cash flow at €258.5 million, of which recurring free cash flow of €267.3 million
> Dividend • Increase in proposed full year dividend to €0.055 per share, up +10.0% vs. last year
> Share buy-back • Continuation of share buy-back program to be implemented up to an amount of €350 million in the next 12 months
Other resolutions

Results for the Full Year 2019 ended 31 December 2019
Delivering on strategy
5
Positive margin expansion driven by outperformance of core high-margin brand and market
combinations
Organic net sales growth
(FY 2014 - FY 2019)
Gross margin improvement FY 2014 – FY 2019 (1)
> Cumulative 5-year: +750 bps, of which +450 bps organic
> On annual basis: +150 bps overall, of which +90 bps organic
53.3%
60.9%
(15
0)
bp
s
+4
50
bp
s
+4
50
bp
s
> Cumulative 5-year: +300 bps, of which +140 bps organic
> On annual basis: +60 bps overall, of which +30 bps organic
19.1%
22.1%
+4
50
bp
s
(16
0)
bp
s
+9
0 b
ps
+7
0 b
ps
+140 bps organic
EBIT adjusted improvement by key driver (1)
(15
0)
bp
s
(1) Basis points rounded to the nearest ten
(2) Including effect of IAS 29 hyperinflation in Argentina (non-material)
(3) IFRS15 implementation as of 1 January 2018. Under IFRS15 certain A&P expenses are reclassified in deduction of sales
(2)
> Strong gross margin expansion driven by sales mix improvement, fuelling consistent re-investments in brand
building and business infrastructure for future growth
(3)(3)
(2)

Results for the Full Year 2019 ended 31 December 2019
Positive organic sales growth
> Americas: satisfactory growth across the region driven by the
core US market, up +5.3%, Jamaica +17.6% and Latin America
> SEMEA: Italy up +5.8% and good growth in the rest of the
region, particularly France, helping compensate destocking
ahead of route-to-market change in South Africa
> NCEE: strong positive performance overall, mainly driven by
the UK and Russia
> Asia Pacific: flattish performance overall against a tough
comparison base (FY 2018: +12.9%), while Australia grew
positively which helped to largely offset destocking in Japan
ahead of route-to-market change
> Global Priorities: strong full year performance in Aperol and the
Jamaican rums. Campari and Wild Turkey were positive overall,
despite destocking ahead of route-to-market change in Japan.
Grand Marnier was broadly flattish. SKYY declined overall, albeit
with improving trends in the main US market, affected by
destocking in South Africa ahead of route-to-market change
> Regional Priorities: very positive performance from Espolòn,
Averna and Riccadonna
> Local Priorities: positive growth driven largely by the single-serve
aperitifs (Campari Soda and Crodino) and Wild Turkey RTD
Continued positive growth across all regions and brand clusters
By Region By Brand
(1) Including Rest of Portfolio, up +6.2% in FY 2019
(1)
6

Results for the Full Year 2019 ended 31 December 2019
Table of contents
Results Summary
Sales Results‒ By region
‒ By brand
Operating Results by Region
Consolidated P&L
Cash Flow & Net Financial Debt
New initiatives & Outlook
Annex
7

Results for the Full Year 2019 ended 31 December 2019
Net sales results for Full Year 2019Growth drivers
8
1,842.5+101.5 (6.9)1,711.7
-0.4%
€million
% change
> Organic change of +5.9% (after excluding the positive price effect in Argentina of 70bps) (1) or €101.5 million (+3.6% or €18.4 million in
Q4 2019), largely driven by the key brand-market combinations
> Forex effect of +2.1% or €36.1 million, largely thanks to the strengthened US Dollar vs. Euro (+1.0% or €5.2 million in Q4 2019) which
more than offset weakness in Latin American currencies
> Perimeter impact of -0.4% or €(6.9) million, due to the tail-end effect of the termination of agency brands contracts, only in part offset by
the consolidation of Rhumantilles, Ancho Reyes and Montelobos acquisitions (completed in Q4)
+2.1%
Organic change (1)
+5.9%
(1) Starting from Q3 2018, following the inclusion of Argentina into the cluster of Hyperinflationary Economies, sales organic change in this country has been calculated to reflect only the volume change,
therefore excluding the price effect and the revaluation component required by IAS 29 (both included in FX effect)
+36.1

Results for the Full Year 2019 ended 31 December 2019
Net sales by regions & key markets in FY 2019US remains the largest market with 26.9% of Group Net Sales
9
Asia Pac: 7.0% of total
Organic growth: +0.8%
NCEE: 21.4% of total
Organic growth: +8.8%
SEMEA: 27.1% of total
Organic growth: +5.3%
Americas: 44.6% of total
Organic growth: +5.8%
Developed vs. emerging markets(1): 80% vs. 20%
(1) Key emerging markets include Jamaica, Russia, Brazil, Argentina, Mexico, South Africa, Peru and Nigeria
FY 2019 Group Net Sales €1,842.5 million
Organic growth +5.9%

Results for the Full Year 2019 ended 31 December 2019
Americas: +5.8% organic
10
+43.5 +33.8 (0.6)
+5.8% -0.1%+4.5%
744.7 821.5€million
% change
Organic growth by key market in FY 2019
Americas44.6%
Regional net sales organic growth
by quarter
> US • Overall positive growth in the US market, driven by double-digit growth in Aperol (+33.9%), Espolòn (+34.4%) and Russell’s Reserve
(+18.1%) and by the positive performance of Campari, Wild Turkey, Wray&Nephew Overproof and Grand Marnier. Cynar and
Averna also registered positive growth off a small base. SKYY declined due to the competitive pressure in flavours, while core vodka is
progressively aligning to more favourable consumption trends
> Jamaica • Continued strong performance and ongoing favourable trends in Jamaica with positive mix driven by core Wray&Nephew Overproof
(+22.2%), Appleton Estate (+50.4%), Magnum Tonic Wine (+26.4%) and Campari (+8.8%)
• Overall satisfactory growth, in a still highly volatile environment: a positive performance from Aperol and Campari was partly offset by
weakness in the local Brazilian brands. Macroeconomic weakness, high unemployment rates and political instability continue to impact
the Brazilian market
+5.3%
+17.6%
+3.3%
> Others +1.0% • Mexico registered positive growth, largely thanks to SKYY ready-to-drink, Cinzano sparkling wine and Aperol while Argentina also
registered a positive performance (+9.7%) against an easy comparable base (FY 2018: -32.4%) largely due to growth in SKYY, Cinzano
sparkling wine, Campari and Aperol while macro conditions remain uncertain and challenging. Other markets in North America declined
while other markets in South America grew thanks to Aperol and Riccadonna
> Brazil
Q1 Q2 Q3 Q4
2019 13.1% 7.3% 0.5% 4.3%
2018 2.9% 6.0% 4.7% 2.1%
> Canada +2.6% • Overall positive performance thanks to the double-digit growth of Aperol, Espolòn and Campari, mitigating the slight decline of Appleton
Estate and Forty Creek

Results for the Full Year 2019 ended 31 December 2019
SEMEA: +5.3% organic
11
(1) Incl. Global Travel Retail
(2) Perimeter effect largely driven by agency brand distribution termination in Italy combined with first-time consolidation of Rhumantilles in Q4 2019
> Italy • Very solid full year performance, largely driven by the aperitifs portfolio: double-digit growth of Aperol (+12.8%), continued solid
growth of Campari (+8.3%) and growth in local aperitifs such as Crodino and Campari Soda. Cynar, Espolòn and GlenGrant also
contributed to a positive result
> Others • France grew positively by +14.2% thanks to double-digit growth of Aperol and Riccadonna while Spain declined overall (-1.4%) as
positive growth in Aperol and Cinzano Vermouth was offset by weakness in Bulldog which was impacted by a very competitive gin
market. In the African markets, Nigeria grew positively thanks to a strong performance of Campari and American Honey while South
Africa declined due to destocking ahead of route-to-market change
• Global Travel Retail grew by +4.1% thanks to double-digit growth in Aperol, Campari and GlenGrant
+25.4 (0.4) (6.2)
+5.3% -1.3%-0.1%
498.7479.8€million
% change
+5.8%
+3.9%
SEMEA27.1%
(1)
(2)
Regional net sales organic growth
by quarter
Organic growth by key market in FY 2019
Q1 Q2 Q3 Q4
2019 6.4% 8.6% 8.9% -1.8%
2018 1.1% 6.3% 9.6% 2.8%

Results for the Full Year 2019 ended 31 December 2019
NCEE: +8.8% organic
12
+31.5 (0.1)+3.6
+8.8% +1.0% -0.0%
393.8358.9€million
% change
> Germany • Positive performance in Germany largely driven by double-digit growth of Aperol (+18.2%) as the brand continues to leverage
new consumption occasions beyond deseasonalisation, as well as positive trends in Ouzo 12, Averna, SKYY, Crodino,
Frangelico and GlenGrant. This offset a temporary decline in Campari due to a very tough comparison base from 2018 (+13.9%)
ahead of the price increase implemented at the beginning of the year as well as weakness in Cinzano sparkling wines
> Russia • Overall positive performance against an easy comparison base (FY 2018 -11.4%) as the market shows signs of recovery, despite
volatility, with positive trends in Aperol, the Cinzano portfolio and Mondoro
> UK • Very positive growth showing an accelerated trend, driven by sustained growth of Aperol (+23.0%) and the Jamaican brands
(+42.0%), largely Wray&Nephew Overproof and Magnum Tonic. Espolòn also registered positive growth, albeit off a small
base, as the brand is seeded internationally
+3.3%
+11.9%
+39.6%
NCEE21.4%
Regional net sales organic growth
by quarter
> Others +6.5% • Good performance across the rest of the region, particularly Austria, Switzerland, Scandinavia and Eastern Europe, mainly
driven by Aperol and Campari
Organic growth by key market in FY 2019
Q1 Q2 Q3 Q4
2019 11.6% 4.2% 10.4% 9.9%
2018 -3.8% 14.4% 13.9% -0.2%

Results for the Full Year 2019 ended 31 December 2019
Asia Pacific: +0.8% organic
13
+1.1 (0.9) 0.0
+0.8% 0.0%-0.7%
128.5128.3€million
% change
> Australia • Very satisfactory performance, despite the tough comparison base (FY 2018 +10.5%) and the negative impact of bushfires
towards the end of Q4. Positive growth in Wild Turkey ready-to-drink, Aperol, which continues its double-digit trend (+22.8%),
SKYY and Espolòn
> Others • Overall decline driven by the Japanese market due to destocking ahead of route-to-market change while China (SKYY, Cinzano
sparkling wine, Aperol) and New Zealand (Appleton Estate, Wild Turkey) grew positively off a small base
+2.0%
-1.8%
Asia Pacific7.0%
Regional net sales organic growth
by quarter
Organic growth by key market in FY 2019
Q1 Q2 Q3 Q4
2019 -3.1% 4.9% 0.7% 0.6%
2018 17.8% 11.7% 19.2% 6.0%

Results for the Full Year 2019 ended 31 December 2019
14
Net sales by key brand
Agency brands & Co-packing 7%Rest of Portfolio: 15%
Global Priorities, 57%
(+100bps vs FY 2018)
Organic change: +7.3%
Local Priorities, 11%Organic change: +1.8%
Regional Priorities,17%Organic change: +4.3%
Rest of own brands 8%
FY 2019 Group Net Sales €1,842.5 million
Organic growth +5.9%

Results for the Full Year 2019 ended 31 December 2019
15
Aperol (18% of Group sales): +20.5% Global Priorities
> Continued strong double-digit sales growth building on a very positive performance from previous years (5-year
average +19.7%) thanks to sustained growth in the brand’s core established and high potential markets, in line
with the brand’s growth model, as well as high growth from seeding markets
> Aperol remains the Group’s largest brand by value and continues to outperform in every market with improving
geographic mix
> Performance by market stage:
• Core Established
- Strong result in Italy (+12.8%) as the brand continues to extend its usage occasions by taking ownership of
food occasions. Aperol continues to grow by underlying double-digit after 16 years of consistent execution of the
brand strategy
- Germany registered solid double-digit growth of +18.2% thanks to both the continued strengthening of the
brand via deseasonalisation outside of the summer season as well as the initial move into extending usage
occasions. Austria and Switzerland also achieved solid growth
• High Potential
- Solid shipment result in the US market (+33.9%), lagging much stronger depletion and sellout trends, against
last year’s tough comparison base (FY 2018 +73.7% driven by first-time activations). The US remains the brand’s
3rd largest market by value. The brand begins to penetrate both the on and off premise occasion, largely on the
East & West Coasts while initial activations in the mid-west took place this year. Canada also grew double digits,
up +54.4%
- Russia, now the brands 4th largest market, is also growing high double digits (+62.7%)
- Continued double-digit growth in the UK, up +23.0%, as the brand remains one of the fastest growing brands
in the UK for the fifth year in a row, while continued double-digit growth in France (+42.4%) and Spain
(+18.1%) as well as sustained positive development in Global Travel Retail (+22.9%)
- Australia continued double-digit growth, up +22.8%
• Seeding
- High double-digit growth across Europe (particularly Scandinavian markets, Czech Republic, Poland),
Americas (particularly Argentina, Brazil, Chile) while China also registered very high double-digit growth
after first-time activations in Shanghai this summer
(1) Sales at constant FX. Q4 2019 sales organic growth: +15.9%
> Italy
> Germany
> US
> Russia
> Austria
Top 5 markets by value
(1)

Results for the Full Year 2019 ended 31 December 2019
16
Celebrating 100 years in 2019Global Priorities
‘Aperol Happy Together Live’ – Venice
An important birthday deserves
an unforgettable party. To
celebrate the centenary of
Aperol, a unique show joined
different artists, set over a
weekend, connected by the same
passion for the music. Venice and
Piazza S. Marco hosted the special
edition of the Aperol Happy
Together Live: a unique event that
mixes different styles of music
and different people to toast
together.
US Festivals / Pop ups
'Aperol Big Spritz Social’ – UK
During May & June in London, at the
Shoreditch Electric Light Station and
at Manchester’s Oast House, Aperol
invited Londoners and Mancunians
(over 5,000 of them) to celebrate its
centenary anniversary by immersing
themselves in a world built for endless
possibilities of Italian-style spontaneity
and sociability. A one of a kind
celebration with food, dj-set, the UK’s
first ever revolving Aperol bar
carousel, embedded ‘bubble booths’
hidden behind a giant Aperol Spritz as
well as the unmissable flowing orange
waterfall
Aperol activations continued to run in the US market
throughout the summer and into November, with four key
sponsorships: the highly anticipated Governor’s Ball in NY,
Lollapalooza festival in Chicago, Riptide Music Festival in
Florida and Camp Flog Gnaw in LA
Aperol Spritz swings, signs and special Aperol gardens
created the perfect Aperol Spritz ambiance, with customized
Aperol bars where Aperol Spritz were served was central to
the activations, with wearable merchandise was offered in
exchange for social & instagrammable sharing – creating
millions of impressions
Moreover, this autumn saw the pop-up of a dedicated Aperol
Spritz bar, in the heart of NYC, in Bryant Park. At night the
temporary ice-rink glowed orange with Aperol Spritz!

Results for the Full Year 2019 ended 31 December 2019
17
Campari (10% of Group sales): +4.6% Global Priorities
> Campari registered positive growth of +4.6% in the year, building on the positive international trends in the
previous years, partly offset by the Japanese destocking ahead of route-to-market change (+6.0% organic
growth before the destocking effect). Overall results in 2019 was also hindered by the soft performance in
the brand’s third largest market by value, Germany (-7.6%), after a price increase earlier this year coupled with
a tough comparable base from Q4 2018 (+26.6%) ahead of the price repositioning
> Performance by market
• SEMEA
- Core market of Italy registered solid growth of +8.3% benefitting from very solid underlying trends of
classic cocktails and Campari mixes such as the Campari Spritz or Campari & Tonic
- Temporary weakness in France and Spain
• North, Central & Eastern Europe
- Germany registered a decline of -7.6%, due to the aforementioned price increase while other markets in
the region (Austria, Switzerland, Belgium) registered positive performances as the brand receives
marketing support alongside specific mixology and cocktail events such as the Negroni week
• Americas
- The US remains Campari’s second largest market by value and grew positively by +9.6%, behind a
double-digit depletion trend, as the brand continues to benefit from the revival of Campari-based classic
cocktails and speakeasy-style mixology, in particular the Negroni, Americano and Boulevardier
- Argentina recovered against an easier comparison base from last year due to the tough macroeconomic
situation and Brazil, despite continued market volatility, registered double-digit growth
- Continued solid growth in Jamaica and Canada
• Asia Pacific
- Australia continued to register positive growth while Japan declined due to destocking ahead of route-to-
market change
(1) Sales at constant FX. Q4 2019 sales organic growth: +3.5%
> Italy
> US
> Germany
> Jamaica
> Brazil
Top 5 markets by value
(1)

Results for the Full Year 2019 ended 31 December 2019
18
Cocktail focus: essential for mixology Global Priorities
Camparino Reopening – the
birthplace of Campari
The iconic Camparino in Galleria - the
birthplace of the Milanese aperitivo -
reopened its doors to the city in winter 2019.
Campari Group marked the relaunch with an
exclusive event, unveiling its new look which
has preserved and emphasized the historic
heritage and Art Nouveau detailing of the
bar, while at the same time creating a new
identity for the present and future.
The relaunched venue serves an innovative
range of drinks and food with a focus on
quality, using gastronomic ingredients and
cocktails from the traditional to more
contemporary, original creations
Negroni week: 100 years of Negroni
Negroni Week began by unveiling a plaque celebrating the
creation of the Negroni in the presence of the Deputy Mayor of the
city of Florence as well as Pier Lamberto and Paolo Andalò Negroni
Bentivoglio, Count Camillo’s grandsons and Luca Picchi, author of
the book ‘Negroni Cocktail. An Italian legend’. In this corner of the
Viviani Della Robbia Palace in the Drogheria Casoni (Caffè Casoni)
100 years ago the Count Cammillo Negroni inspired the creation of
one of the most famous cocktails in the world – the Negroni!
The participation of bars across the world has increased year on
year, and in 2019 the number of bars participating in Negroni week
grew by +23% (12,000 venues!) compared to the 2018 edition, with
more than 12 thousand venues subscribed in 60+ countries!
THERE’S NO NEGRONI WITHOUT CAMPARI
Celebrating art – NY & Venice Film Festival
Campari extended its long-standing
commitment to the world of art and
cinema as the exclusive spirits partner
of the 57th New York Film Festival
(NYFF) as well as the main sponsor of
the Venice Film Festival. In New York,
Campari was front and center with
brand visibility, bar presence, featured
cocktails and experiential activations,
while in Venice, Campari hosted a
number of activations including the
Venetika, the floating cinema and
Entering Red, the secret closing party
which took place in one of the most
prestigious locations in the City,
spreading the brand style and essence
everywhere, painting Venice with a
distinctive tone of red, the Campari red

Results for the Full Year 2019 ended 31 December 2019
19
SKYY (8% of Group sales): -3.8% Global Priorities
> The SKYY franchise declined by -3.8% in FY 2019, largely driven by the core US following the
destocking activity mainly aimed at streamlining the SKYY infusions, which lasted until the end of
the third quarter with some tail end effect in Q4 2019
> The international markets, which account for 27.0% of the brand’s global sales value, were
flattish, impacted by the destocking activities in South Africa, ahead of route-to-market
change, which offset entirely the good growth in other markets
> Performance by market
• US
- The US market registered a mid-single digit decline as the brand was impacted by
destocking activity during the year. Concomitantly, the brand continues to suffer from strong
competitive pressure, particularly in flavours, with the infusions portfolio down -9.2% in
FY 2019, dragging down the overall performance, while core vodka is progressively
aligning to more favourable consumption trends. The ‘Proudly American’ campaign as
well as sponsorship of World Pride events are helping to keep the brand premium and
relevant among millennial consumers while the destocking activity has helped to close the
gap to more favourable consumption trends year on year
• International markets
- Development into the Americas continues: good growth in Argentina (5th largest
market) and continued double-digit growth in Mexico offset some weakness in Brazil
- Within SEMEA, growth in GTR was unable to offset declines in Italy and Spain while South
Africa also declined temporarily due to destocking ahead of route-to-market change
- In North, Central & Eastern Europe, double-digit growth in Germany was partly mitigated
by weakness in the UK
- In Asia Pacific, China (3rd largest market) and Australia registered positive growth
(1) Sales at constant FX. Q4 2019 sales organic growth: -6.6%
> US
> Germany
> China
> South Africa
> Argentina
Top 5 markets by value
(1)

Results for the Full Year 2019 ended 31 December 2019
20
Building on traditionsGlobal Priorities
SKYY USA WorldPride Sponsorship
In June 2019, SKYY Vodka continues its’ efforts to champion a new era of
social progress fueled by diversity within the LGBTQ+ community in the
USA, by serving as the Official Vodka of WorldPride NYC and Los
Angeles Pride Festivals. This year, in honor of the 50th Anniversary of the
Stonewall riots, SKYY has partnered with the original Vogue performers,
paying tribute to the people and history that shaped LGBTQ+ culture today.
Activities included 9+ events, with over 4 million consumer engagements
including a branded float on June 30th during the official WorldPride
Parade held in NYC
SKYY Cold Brew
For a limited time only during Summer 2019, SKYY Vodka is bringing the
authentic taste of the USA’s latest obsession, cold brew coffee, to cocktail
bars and retail stores with the release of SKYY Infusions® Cold Brew
Coffee. This flavor is infused with Arabica coffee beans. Perfect for
brunches, summer parties or after work drinks, it is enjoyed on the rocks,
in coffee-inspired cocktails, or as a twist on a classic, like the SKYY Martini
SKYY Limited Edition
Launched in Spring 2019, SKYY Vodka proudly brings its San Francisco
roots to life through the new limited-edition SKYY Bottle Series. These
three new bottles celebrate the culture and values that have made the
brands hometown a global progressive icon. For a limited time only, the
brand’s famous blue vodka bottle features recognized San Francisco
landmarks paired with bold statements such as ‘We Build Bridges, Not
Walls’ or ‘There is no straight path’: that define the city’s leadership in
diversity through social progress, optimism and empowerment
SKYY Vodka: celebrating diversity

Results for the Full Year 2019 ended 31 December 2019
21
Wild Turkey (8% of Group sales): +2.9%Global Priorities
> Organic growth of +2.9% after declines in the fourth quarter due to phasing in the core US market, with depletions
up double-digits
• Wild Turkey bourbon grew +0.4% affected by the destocking in Japan, while the Russell’s Reserve premium
offering continued its solid growth, up +16.7% overall
• American Honey registered a positive performance overall, up +6.0% driven by the core US market as well as
Nigeria, only partly offset by some temporary weakness in Australia
> Performance by market
• US
- Portfolio of premium extensions and offerings such as Wild Turkey Longbranch, Russell’s Reserve and the
Master’s Keep series continued to grow double-digits combined. Overall positive performance of +1.4%
affected by slow down of Wild Turkey 101 core business due to price repositioning
- Overall the brand remains a top choice for high-end mixologists and connoisseurs, while also leveraging the
brand’s quality, heritage and craft credentials, alongside continued national marketing support from the
Matthew McConaughey campaigns and other brand activations
• International markets
- Positive momentum in the seeding European markets such as Germany, Italy and Austria
- Japan declined by double digits, due to destocking ahead of route-to-market changes (accounting for -0.5%
of the brand’s overall organic performance). Australia was slightly down while New Zealand and China grew
positively off a small base
(1) Sales at constant FX. Q4 2019 sales organic growth: -5.8%
(2) Incl. Wild Turkey bourbon, Russell’s Reserve, American Honey. Wild Turkey ready-to-drink and American Honey ready-to-drink are excluded
> US
> Australia
> Japan
> GTR
> Canada
Top 5 markets by value
(1) (2)

Results for the Full Year 2019 ended 31 December 2019
22
Premiumisation journeyGlobal Priorities
Wild Turkey: Talk Turkey
Wild Turkey, with Creative Director and brand storyteller, Matthew McConaughey,
launched Talk Turkey, a new unscripted, digital interview series featuring
conversations between McConaughey, and trailblazers from influential movements who
are helping to define culture through acts of personal conviction. With themes of
redemption, female empowerment, self-help, and reconnecting with the outdoors
grounding each episode, this series propelled the authentic story of these inspiring
individuals. The interview and documentary episodes ran weekly on IGTV, Twitter and
Wild Turkey launched Master’s
Keep Cornerstone Rye, the fourth
release in the award-winning
Master’s Keep series. The result is
a Rye Whiskey of extraordinary
maturity – the triumphant
culmination of more than 150
years of Kentucky artisanship and
heritage. For this limited release,
Eddie hand-picked from among his
oldest #4 alligator char barrels –
each with Rye aged between nine
and 11 years. From there, Eddie
crafted a perfectly balanced, high-
aged Rye Whiskey that exquisitely
showcases Wild Turkey’s signature
bold and spicy flavors
Wild Turkey: Cornerstone Rye
Wild Turkey: ‘With Thanks’
In November, in Los Angeles, Matthew McConaughey,
Eddie Russell, a group of volunteers and charity
partner Operation BBQ Relief, kicked off the season of
giving and prepared and delivered 800 turkey dinners to
first responders in charge of relief efforts around the
wildfires in the Los Angeles. A group of 40 volunteers
from the Wild Turkey community visited and delivered
meals to more than 20 fire houses and an additional 800
meals were prepared for local homeless shelters in Los
Angeles. Matthew McConaughey & Eddie Russell
announced the efforts on Facebook live and personally
visited the firehouses to deliver meals and thank the first
responders

Results for the Full Year 2019 ended 31 December 2019
23
Grand Marnier (7% of Group sales): -0.9%Global Priorities
> Overall flattish performance (-0.9%) with positive reversal in Q4 (+8.1%) recovering the negative Q3
performance due to shipment phasing
> The core brand continues to receive support from the ‘Live Grand’ campaign, launched in 2018,
alongside a redefined drinking strategy, while the Grand Marnier Cuvées (Louis Alexandre and
Cuvée du Centenaire) are being progressively launched in the core US market, aiming to improve the
price mix over time
> Performance by region
• Americas
- The core US market grew by +2.2% while Canada was flattish against a significant price
repositioning. Double-digit growth in Mexico, albeit off a small base
• SEMEA, North, Central & Eastern Europe and Asia Pacific
• Overall soft performance mainly due to temporary weakness in Global Travel Retail and softness in
some European markets
(1) Sales at constant FX. Q4 2019 sales organic growth: +8.1%
> US
> Canada
> France
> GTR
> Italy
Top 5 markets by value
(1)

Results for the Full Year 2019 ended 31 December 2019
24
Grand Mixes & Grand CuvéesGlobal Priorities
Grand Marnier: Cordon Rouge –
premiumising with ‘Grand’ cocktails
Grand Marnier’s ‘Live Grand’
campaign, launched in 2018 in NY
and Paris, invites consumers to
celebrate life’s more luxurious,
out-of-the ordinary experiences,
to move from ‘good to grand’ by
using Grand Marnier both in
mixology, for high-end cocktails but
also for easy mixers, supporting the
rollout of the brand’s strategy across
North American and European
geographies
Grand Marnier Cuvée du Centenaire
The new Cuvée du Centenaire was launched
with a premium packaging inspired by the
vibrant artistic movement of Art Nouveau.
Originally created in 1927 in honour of the
first Century of The House of Marnier
Lapostolle, Cuvée du Centenaire celebrates
an extraordinary era of audacity and
eccentricity by combining for the first time
orange bigaradia with XO cognacs. The
cognacs used in this extraordinary Cuvée
come from the finest growing areas of Cognac
region: Grand and Petite Champagne
Grand Marnier: Louis Alexandre
In January 2019, the new Cuvée Louis
Alexandre was launched in the US
market, with VSOP liquid and brand new,
more premium packaging. Created by
Patrick Raguenaud, Grand Marnier’s
master blender, Cuvée Louis Alexandre
uses cognac taken from the most
prestigious area in Cognac, then aged in
oak barrels in Bourg-Charente. The
Cuvée Louis Alexandre has carefully
selected cognac, enriched with the essence of highly aromatic bitter orange
Results for the Full Year 2019 ended 31 December 2019
25
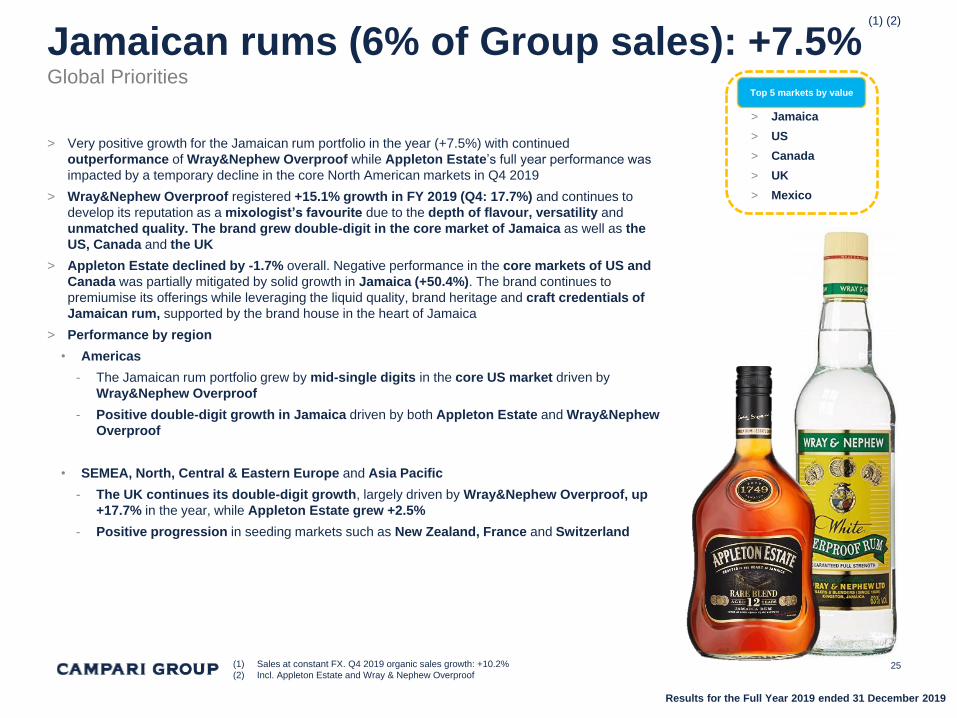
Jamaican rums (6% of Group sales): +7.5%Global Priorities
> Very positive growth for the Jamaican rum portfolio in the year (+7.5%) with continued
outperformance of Wray&Nephew Overproof while Appleton Estate’s full year performance was
impacted by a temporary decline in the core North American markets in Q4 2019
> Wray&Nephew Overproof registered +15.1% growth in FY 2019 (Q4: 17.7%) and continues to
develop its reputation as a mixologist’s favourite due to the depth of flavour, versatility and
unmatched quality. The brand grew double-digit in the core market of Jamaica as well as the
US, Canada and the UK
> Appleton Estate declined by -1.7% overall. Negative performance in the core markets of US and
Canada was partially mitigated by solid growth in Jamaica (+50.4%). The brand continues to
premiumise its offerings while leveraging the liquid quality, brand heritage and craft credentials of
Jamaican rum, supported by the brand house in the heart of Jamaica
> Performance by region
• Americas
- The Jamaican rum portfolio grew by mid-single digits in the core US market driven by
Wray&Nephew Overproof
- Positive double-digit growth in Jamaica driven by both Appleton Estate and Wray&Nephew
Overproof
• SEMEA, North, Central & Eastern Europe and Asia Pacific
- The UK continues its double-digit growth, largely driven by Wray&Nephew Overproof, up
+17.7% in the year, while Appleton Estate grew +2.5%
- Positive progression in seeding markets such as New Zealand, France and Switzerland
(1) Sales at constant FX. Q4 2019 organic sales growth: +10.2%
(2) Incl. Appleton Estate and Wray & Nephew Overproof
> Jamaica
> US
> Canada
> UK
> Mexico
Top 5 markets by value
(1) (2)

Results for the Full Year 2019 ended 31 December 2019
26
New Brand Visual IdentityGlobal Priorities
Appleton Estate 2020
Appleton Estate, our premium rum brand,
introduced a new Brand Visual Identity (BVI)
to the global marketplace in October 2019.
Our BVI celebrates our home of Jamaica
through a rich pallet of blue hues, as well
as an accent of copper which represents
our pots stills and golden rum. Central to
the BVI is our Jamaican Insignia, an artistic
emblem comprised of five iconic symbols
of Jamaica. These unique BVI elements
further elevate Appleton Estate’s visual
impact as a premium brand that strives to
exemplify Joyful Excellence
Appleton Estate: Ultimate Spirits
Challenge
Appleton Estate Wins Big at 2019 Ultimate Spirits
Challenge held in April 2019. Awards:
Appleton Estate 21YO: 98 Points, Extraordinary, Ultimate
Recommendation, Chairman’s Trophy
Appleton Estate Rare Blend 12YO: 94 Points, Excellent,
Highly Recommended, Finalist
Appleton Estate Signature Blend: 92 Points, Excellent,
Highly Recommended, Finalist, Great Value
Appleton Estate Reserve Blend: 92 Points, Highly
Recommended, Finalist, Great Value
Appleton Estate: 23y/o Journey rum
In December 2019, The Joy
Spence Appleton Estate Rum
Experience introduced an
exclusive limited edition 23 Year
Old Journey Rum. Limited to
only 300 750ml bottles, priced
each at $250USD, this rum is first
in a series of limited edition
rums under the name ‘Journey’.
This name was chosen in
gratitude to our guests who have
made the journey to Jamaica’s
Nassau Valley to visit our Estate

Results for the Full Year 2019 ended 31 December 2019
Brand sales reviewRegional Priorities
27
Wh
iskie
s
1%
1%
> Overall negative results, amplified by destocking in the South
African market ahead of route-to-market change, reflecting the
Group’s long-term strategic refocus on higher-margin and
longer-aged premium expressions
> Soft performance in the core market of Canada against a tough
comparison base (FY 2018 +12.4%, Q4 2018: +18.5%)
Teq
uil
a
4%
> Solid double-digit growth driven by core US market, with
positive shipment recovery in Q4, as the brand is consistently
outpacing category trends
> Seeding markets such as Australia, Russia, Canada, Italy, South
Africa and the UK continue to grow positively
-6.7%
-4.2%
+32.4%
+0.4%
-14.5%
+54.0%
1%
> Overall soft performance due to ongoing gin market pressure in core
markets of Spain, the UK and Belgium. Improving consumption
trend in core Germany
> Strong growth in seeding markets such as South Africa and Brazil
Gin
-3.2% -8.6%
Regional priorities Brand sales as %
of Group’s sales
in FY 2019
Organic
change
in FY 2019
Organic
change
in Q4 2019
Co
gn
ac
<1% +6.7% -34.6%
> Overall positive first full year organic performance, with declines
in Q4 driven by phase out of previous packaging ahead of 2020
relaunch

Results for the Full Year 2019 ended 31 December 2019
Brand sales reviewRegional Priorities
28
Sp
ark
lin
g w
ine &
verm
ou
th (1) Incl. Cinzano verrmouth and
Cinzano sparkling wines
3% (1)
3%
> Vermouth declined (-8.2%) as positive growth in the core
Russian, Argentinian and Spanish market was offset by strong
declines in Germany and other European markets due to
significant price repositioning
> Sparkling wines registered a decline due to weakness in the core
markets of Germany and Italy. Positive growth in core Russia and
seeding markets such as China and Japan
> Good performance in Mondoro (+2.9%) driven by the core
market of Russia
> Riccadonna registered positive results of +14.3% thanks to
a double-digit growth in the core market of France, offsetting
temporary weakness in Australia
-6.9%
+8.5%
-10.4%
+5.7%
Itali
an
bit
ters
an
d
liq
ueu
rs
4%
> Soft performance by Frangelico as positive growth in
Germany was offset by weakness in core US, Spain and
Australia
> Averna registered a good overall performance as growth in
Germany, the US and Austria offsets weakness in core Italy
> Good performance in Cynar as solid growth in core Italy
and seeding US offset declines in Brazil and Switzerland
> Slight decline in Braulio due to a robust price increase in
core Italy, while GTR registered solid double-digit growth
-0.9% -1.9%
Regional priorities Brand sales as %
of Group’s sales
in FY 2019
Organic
change
in FY 2019
Organic
change
in Q4 2019

Results for the Full Year 2019 ended 31 December 2019
Brand sales reviewLocal Priorities
29
3%
3%
2%
1%
1%
> Positive result overall thanks to growth in core Italy as well
as seeding central European markets
> Negative Q4 impact driven by the expected realignment of
shipments
> Negative overall performance in core Brazilian market
which remains highly volatile
> Overall good performance thanks to core Italy, with Q4
performance driven by the expected realignment of shipments
> Good performance in core Australia and New Zealand
> Overall positive driven by Germany, the US and the UK
+1.6%
+2.4%
+5.0%
-5.1%
+3.0%
1% > Positive growth driven by the core US, with depletions up
high-single digit+3.7%
-10.3%
-7.1%
+7.7%
-21.6%
+6.8%
-2.5%
Local priorities Brand sales as %
of Group’s sales
in FY 2019
Organic
change
in FY 2019
Organic
change
in Q4 2019

Results for the Full Year 2019 ended 31 December 2019
Regional Priority initiatives
30
Espolòn – DEATH magazine
Espolòn Tequila launched DEATH, a limited-edition magazine celebrating
the Day of the Dead through literary calaveras. Once Mexico’s illustrated
poems for satirical obituaries, literary calaveras are the holiday’s signature
witty poems, poking fun at loved ones in a game of creativity, irreverence, and
mortality. DEATH celebrates the holiday with modern calaveras penned by
rising literary stars and pop culture personalities, including Mexican
American and Latin authors. Miguel, Grammy-winning R&B superstar,
was in the cover with illustration done by Scott Campbell, world-renowned
tattoo artist. The launch of DEATH kicked off at a pop-up “newsstand from the
other side” from 10/31 to 11/1. Lucky attendees had the chance to be invited to
“cross over” into a once-in-an-afterlife immersive celebration hidden deep
within the space
Bisquit & Dubouché
The first production of the new bottle of Bisquit&Dubouché took place in November
2019. The offer reflects the new super premium positioning of the brand, leveraging
on a complete new marketing mix – from the new brand name - Bisquit&Dubouché -
that brings back in the logotype the co-founder Adrien Dubouché - to the new
packaging design – a super premium squared bottle that underlines the brand rebel
character and the wish to disrupt the traditional codes of cognac. The new
Bisquit&Dubouché unveils a new liquid, with a smooth aromatic bouquet, a
persistent taste with floral notes of rose, dried apricot and muscat grape. First
markets to be served will be South Africa and Belgium, designed to relaunch the
current business of VS and VSOP variant, immediately followed by USA, GTR and
Switzerland by February 2020

Results for the Full Year 2019 ended 31 December 2019
Regional Priority initiatives
31
2019 saw the kick-off of the Global Partnership between
Cinzano Vermouth and Sofar Sounds, where three
markets were successfully activated: the US, Spain and
Argentina. Cinzano Moments by Sofar Sounds is
confirming to be a valuable platform to share genuine
moments in music engaging the younger target. All the
events have been amplified through relevant local media
partners and influencers, on top of the digital support
created through local and global channels with a single
minded approach. The events have been crucial for the
launch of the new brand identity in a consistent and
engaging way cross geos and channels
Cinzano Vermouth: Cinzano
Moments
Bulldog Gin
Bulldog Gin invited consumers in
Barcelona for the second
#FULLSHINEPARTY in Spain (the
first in Madrid held in April),
inspiring consumers to shine
from within. A few hundred guests
including microsite-competition
winners and digital influencers,
toasted with Bulldog G&Ts with a
black twist and enjoyed tailored
activations such as UV Tattoos,
interactive lights, in addition to the
shining dance floor
Bulldog Gin closed out the year by ramping up its presence in the
Greek market with an official launch party in central Athens for
hundreds of media, trade and VIP guests. Highlights of the event
included local celebrities, DJ Agent Greg and performance by
dancer-choreographer Tasos Xiarcho

Results for the Full Year 2019 ended 31 December 2019
GlenGrant wins big: 2020 Whisky Bible
32
GlenGrant 18 Year Old, the rarest variant in the GlenGrant single malt range, has once again been named “Scotch Whisky of the Year", “Single
Malt of the Year" and “Best Single Malt Scotch Aged 16-21 years" by the esteemed Whisky writer and reviewer, taking home the top prize in the
category for a stunning fourth year in a row. Additionally, The GlenGrant 10 Year Old wins in the “Best Single Malt Scotch Aged 10 Years and
Under" category for a remarkable 7th time. There were also awards for the GlenGrant 15 year old whisky as well as the unaged ‘Rothes Chronicles
Cask Haven’. The complete list is below:
Jim Murray 2020 Whisky Bible
Scotch Whisky of the Year
GlenGrant Aged 18 Years Rare
Edition
Single Malt of the Year (Multiple
Casks)
GlenGrant Aged 18 Years Rare
Edition
Scotch No Age Statement
GlenGrant Rothes Chronicles Cask
Haven
10 Years & Under (Multiple Casks)
GlenGrant Aged 10 Years
11-15 Years (Multiple Casks)
GlenGrant Aged 15 Years Batch
Strength
16-21 Years (Multiple Casks)
GlenGrant Aged 18 Years Rare
Edition

Results for the Full Year 2019 ended 31 December 2019
Table of contents
Results Summary
Sales Results‒ By region
‒ By brand
Operating Results by Region
Consolidated P&L
Cash Flow & Net Financial Debt
New initiatives & Outlook
Annex
33

Results for the Full Year 2019 ended 31 December 2019
Net sales & EBIT analysis by region
34(1) EBIT adjusted
FY 2018
EBIT (1) breakdown
by region
Net Sales
breakdown by
region
FY 2019
> The Americas remain the Group’s largest region in terms of net sales and profitability (44.6% of Group’s net sales and 42.0% of Group’s
EBIT(1) in FY 2019. Decrease in SEMEA’s weight on sales (-90bps) vs. FY 2018 driven by disposals of non-core businesses while increase
in NCEE’s weight on profitability (+220bps) driven by sustained growth of high-margin brands

Results for the Full Year 2019 ended 31 December 2019
EBIT(1)
by region - Americas
35
> FX & Perimeter:
> Organic change:
(1) EBIT adjusted
(2) Bps rounded to the nearest ten
Organic change -70 bps (2)
+20 bps 20.9%
-10 bps
21.7%
-70 bps-20 bps
EBIT adjusted organic growth of +2.5% with -70 bps dilution. Key drivers:
• Growth (+5.4% in value) slightly behind topline, leading to -20 bps margin dilution: positive sales mix more than
offset by the increasingly negative impact of agave as well as the dilutive effect of recovery in emerging
markets, most notably Brazil and Argentina
• A&P growth (+9.6% in value) ahead of topline, -70 bps margin dilution, driven by increased brand building
investments, particularly behind key global brands (Aperol, Campari and Grand Marnier) and Espolòn
• SG&A increase behind topline (+4.7% in value and +20 bps margin accretion), as a consequence of the
downsizing of local structures in South America
Positive FX effect largely driven by the strengthening USD vs Euro (-10 bps dilution)
> EBIT margin: EBIT margin at 20.9% in FY 2019
Gross Profit
A&P
SG&A
FY 2019 FY 2018 Reported change Organic change
€ million % of sales € million % of sales % %
Net sales 821.5 100.0% 744.7 100.0% +10.3% +5.8%
Gross profit 479.7 58.4% 434.8 58.4% +10.3% +5.4%
A&P (157.3) -19.1% (136.4) -18.3% +15.3% +9.6%
SG&A (151.0) -18.4% (137.0) -18.4% +10.2% +4.7%
EBIT (1)171.4 20.9% 161.5 21.7% +6.1% +2.5%

Results for the Full Year 2019 ended 31 December 2019
EBIT(1)
by region - SEMEA
36
Organic change +50 bps (2)
-30 bps
17.7%
-20 bps
17.4%
-20 bps
+100 bps
> FX & Perimeter:
EBIT adjusted organic growth of +8.4%, despite a lower contribution of the South African market due to destocking
ahead of route-to-market change. EBIT adjusted +50 bps organic margin accretion, mainly driven by positive sales
mix. Key drivers:
• Strong gross margin expansion (+6.9% in value and +100 bps margin accretion) driven by solid
performance of high-margin aperitif portfolio, in particular Aperol and Campari, across the region
• A&P growth above topline (+6.4% in value and -20 bps margin dilution) due to sustained investment activity
behind global priority brands, in particular Aperol
• SG&A increase (+6.4% in value) ahead of sales, leading to -30 bps margin dilution, mainly driven by the
strengthening of central structures
Negative perimeter effect
(1) EBIT adjusted
(2) Bps rounded to the nearest ten
> EBIT margin: EBIT margin up to 17.7% in FY 2019
> Organic change:
Gross Profit
A&P
SG&A
FY 2019 FY 2018 Reported change Organic change
€ million % of sales € million % of sales % %
Net sales 498.7 100.0% 479.8 100.0% +3.9% +5.3%
Gross profit 333.1 66.8% 312.8 65.2% +6.5% +6.9%
A&P (89.2) -17.9% (83.7) -17.4% +6.6% +6.4%
SG&A (155.8) -31.2% (145.6) -30.3% +7.0% +6.4%
EBIT (1)88.1 17.7% 83.6 17.4% +5.5% +8.4%

Results for the Full Year 2019 ended 31 December 2019
EBIT(1)
by region - NCEE
37
Organic change +160 bps (2)
0 bps 33.7%+10 bps32.1% +20 bps+150 bps
EBIT adjusted organic growth of +14.3%, well ahead of sales growth, leading to +160bps margin accretion
Key drivers:
• Growth (+11.4% in value) ahead of sales (+150 bps margin accretion), driven by strong sales mix
improvement by brand and by market, led by the positive performance of the high-margin aperitif portfolio
(in particular Aperol) in core high-margin markets such as Germany, the UK, Switzerland and Austria
• A&P growing (+7.5% in value) below topline, leading to +20 bps margin accretion
• SG&A increase (+9.0% in value) slightly ahead of sales, broadly neutral on margin
Negligible FX and perimeter effect> FX & Perimeter:
(1) EBIT adjusted
(2) Bps rounded to the nearest ten
> EBIT margin: EBIT margin up to 33.7% in FY 2019
> Organic change:
Gross Profit
A&P
SG&A
FY 2019 FY 2018 Reported change Organic change
€ million % of sales € million % of sales % %
Net sales 393.8 100.0% 358.9 100.0% +9.7% +8.8%
Gross profit 248.5 63.1% 220.7 61.5% +12.6% +11.4%
A&P (55.6) -14.1% (51.3) -14.3% +8.4% +7.5%
SG&A (60.0) -15.2% (54.4) -15.2% +10.3% +9.0%
EBIT (1)132.9 33.7% 115.1 32.1% +15.5% +14.3%

Results for the Full Year 2019 ended 31 December 2019
EBIT(1)
by region - Asia Pacific
38
Organic change -190 bps (2)
-270 bps
12.1%
-50 bps
14.5% +10 bps+70 bps
EBIT adjusted organic decline of -12.5%, leading to a dilution of -190 bps. Key drivers:
• Growth (+2.4% in value) ahead of topline, leading to +70 bps margin accretion, driven by positive sales mix in
Australian market which fully offset the lower contribution from the Japanese market following destocking ahead
of route-to-market change which impacted high margin brands (Campari and Wild Turkey)
• A&P flattish, +10 bps margin accretion
• SG&A increase (+16.2% in value) above topline, generating -270 bps margin dilution, driven by lower absorption
of fixed costs given the contained topline growth combined with the enhancement of the region’s commercial
structures and provisions in connection with the regional headquarters move to Singapore
Negative FX effect largely driven by weakness in the Australian Dollar vs. Euro and neglectable perimeter impact> FX & Perimeter:
(1) EBIT adjusted
(2) Bps rounded to the nearest ten
> EBIT margin: EBIT margin down to 12.1% in FY 2019
> Organic change:
Gross Profit
A&P
SG&A
FY 2019 FY 2018 Reported change Organic change
€ million % of sales € million % of sales % %
Net sales 128.5 100.0% 128.3 100.0% +0.2% +0.8%
Gross profit 60.0 46.6% 59.6 46.5% +0.5% +2.4%
A&P (17.8) -13.9% (17.9) -14.0% -0.4% +0.1%
SG&A (26.5) -20.6% (23.1) -18.0% +15.1% +16.2%
EBIT (1)15.6 12.1% 18.7 14.5% -16.5% -12.5%

Results for the Full Year 2019 ended 31 December 2019
Table of contents
Results Summary
Sales Results‒ By region
‒ By brand
Operating Results by Region
Consolidated P&L
Cash Flow & Net Financial Debt
New initiatives & Outlook
Annex
39

Results for the Full Year 2019 ended 31 December 2019
FY 2019 Q4 2019
Reported
change
Organic margin
accretion/
(dilution)
Organic
change
Forex
impact
Perimeter
effect
€ million % of sales € million % of sales % (bps) (3)
% % %
Net Sales 1842.5 100.0% 1711.7 100.0% 7.6% 5.9% 2.1% -0.4%
COGS (1)
(721.3) -39.1% (683.6) -39.9% 5.5% 4.3% 2.0% -0.8%
Gross Profit 1121.2 60.9% 1028.1 60.1% 9.1% 60 7.0% 2.2% -0.1%
A&P (319.9) -17.4% (289.2) -16.9% 10.6% -30 7.7% 2.8% 0.1%
Contribution after A&P 801.3 43.5% 738.9 43.2% 8.5% 30 6.7% 1.9% -0.2%
SG&A (2)
(393.3) -21.3% (360.1) -21.0% 9.2% -20 6.8% 2.1% 0.3%
EBIT adjusted 408.0 22.1% 378.8 22.1% 7.7% 20 6.7% 1.7% -0.7%
Operating adjustments (21.7) -1.2% 1.9 0.1% -
Operating profit (EBIT) 386.3 21.0% 380.7 22.2% 1.5%0.0 0.0% 0.0 0.0% #DIV/0!
Net financial income (charges) (33.0) -1.8% (33.8) -2.0% -2.4%
Adjustments to financial income (charges) 5.8 0.3% 1.8 0.1% -
Proft (loss) related to companies valued at equity 0.1 0.0% (0.2) 0.0% -
Put option, earn out income (charges) and
hyperinflation effects (4.7) -0.3% 2.3 0.1% -
Group pre-tax profit 354.6 19.2% 350.8 20.5% 1.1%
Group pre-tax profit adjusted 370.4 20.1% 347.1 20.3% 6.7%
Income Tax expense (46.2) -2.5% (54.5) -3.2% -15.1%
Net Profit 308.4 16.7% 296.3 17.3% 4.1%
Non-controlling interests 0.0 0.0% 0.0 0.0% -
Group net profit 308.4 16.7% 296.3 17.3% 4.1%
Group net profit adjusted 267.4 14.5% 249.3 14.6% 7.3%
Depreciation & Amortisation (71.8) -3.9% (53.8) -3.1% 33.4% -70 30.1% 1.8% 1.5%
EBITDA adjusted 479.8 26.0% 432.6 25.3% 10.9% 90 9.6% 1.7% -0.4%
EBITDA 458.1 24.9% 434.5 25.4% 5.4%
FY 2019 FY 2018
FY 2019 consolidated P&L
40
(1) COGS = cost of materials, production and logistics expenses
(2) SG&A = selling, general and administrative expenses
(3) Bps rounded to the nearest ten

Results for the Full Year 2019 ended 31 December 2019
FY 2018 Organic Forex Perimeter FY 2019
EBIT adjusted – summary effects
41
€ million
% change
(1) Bps rounded to the nearest ten
25.2 6.5 (2.6)
+6.7% +1.7% -0.7%
+7.7%378.8 408.0
> EBIT adjusted: on a reported basis up +7.7% in value, stable at 22.1% on net sales, in line with last year
• Organic growth of +6.7% in value, above topline growth, generating +20 bps margin accretion, thanks to solid organic
gross margin accretion, net of investments in marketing and structure costs. The adoption of IFRS16-‘Leases’ accounting
principle from 1 January 2019 generated a positive effect of €1.4 million
• Forex and perimeter combined effect of +1.0% in value, corresponding to -20 bps margin dilution
> EBITDA adjusted: on a reported basis up +10.9% in value, to 26.0% on net sales. The increase includes a positive effect
generated by the adoption of IFRS 16-‘Leases’ of €15.0 million, driven by the incremental depreciation on the rights of use
• Organic growth of +9.6% in value, leading to +90 bps margin accretion
• Forex and perimeter combined effect of +1.3% in value, -10 bps margin dilution

Results for the Full Year 2019 ended 31 December 2019
EBIT adjusted margin - key drivers
> Gross profit: on a reported basis up +9.1% in value, to 60.9% on sales (+80 bps accretion):
• Organic growth of +7.0% in value, +60 bps margin expansion. Organic growth ahead of topline thanks to favourable
sales mix by brand and market, despite the increasingly adverse agave purchase price, the lower contribution of some
high-margin brands in selected markets due to destocking ahead of route-to-market change (mainly Japan) and the dilutive
effect of emerging market recovery
• Forex and perimeter combined effect of +2.1% in value, +20 bps margin expansion, driven by termination of low-margin
agency brands. The overall impact from new acquisitions was limited
> A&P: on a reported basis up +10.6% in value, to 17.4% on net sales (-50 bps dilution)
• Organic growth of +7.7% in value, above topline growth leading to -30 bps margin dilution, reflecting higher marketing
investments particularly behind global brands, such as Aperol, Campari and the Jamaican rum portfolio, as well as selected
Regional Priority brands, such as Espolòn
• Forex and perimeter combined effect of +2.9% in value, -20 bps margin dilution, driven by the termination of low A&P-
intensity agency brands
> SG&A: on a reported basis up +9.2% in value, to 21.3% on net sales (-30 bps dilution)
• Organic growth of +6.8% in value, above topline growth, leading to -20 bps margin dilution, mainly due to the strengthening
of on-premise commercial capabilities in selected markets
• Forex and perimeter combined effect of +2.5% in value, -10 bps margin dilution, primarily driven by the deconsolidation of
businesses carrying no structure costs
(1) Rhumantilles from October 2019 and Ancho Reyes and Montelobos from 20 November 2019
(2) Bps rounded to the nearest ten
22.1% 22.1%
+60 bps -30 bps -20 bps -20 bps
+20 bps
Organic
42
(2)

Results for the Full Year 2019 ended 31 December 2019
43
> Negative operating adjustments of €21.7 million, mainly attributable to restructuring projects (incl. outsourcing initiatives)
> Net financial charges were €33.0 million in FY 2019, aligned vs. last year, reflecting the lower average indebtedness
(€865.8 million in FY 2019 vs €925.4 million in FY 2018) which compensated the effect of first time adoption of IFRS16-
’Leases’ (€3.4 million additional interest charges)
> Average cost of net debt at 4.1%(1) in FY2019, up from 3.3% in FY 2018, mainly attributable to the first time application of
IFRS16-’Leases’ and the significant negative carry effect
> Group pre-tax profit was €354.6 million, up +1.1% in FY 2019
> Group pre-tax profit adjusted (2) was €370.4 million, up +6.7% in FY 2019
Group pre-tax profitFinancial charges
(1) Calculated based on net financial income (charges) over average financial debt
(2) In FY 2019, net negative operating and financial adjustments of €(15.8) million, mainly attributable to restructuring projects. This compares with the net positive operating and financial
adjustment of €3.7 million in FY 2018.

Results for the Full Year 2019 ended 31 December 2019
€ millionActual
FY 2019
Actual
FY 2018
Reported
change
EBIT adjusted 408.0 378.8 7.7%
Recurring net financial charges (33.0) (33.8) -
Put option costs and others (4.6) 2.1 -
Pretax profit adjusted 370.4 347.1 6.7%
Total recurring taxes, of which: (103.1) (97.8) -
- Recurring cash tax (87.2) (81.3) -
- Goodwill deferred tax (15.8) (16.5) -
Group net profit adjusted 267.4 249.3 7.3%
Recurring cash tax rate -23.5% -23.4% -
Recurring effective tax rate -27.8% -28.2% -
Total adjustments net, of which 41.0 47.0 -
- Operating adjustments (21.7) 1.9 -
- Financial adjustments 5.8 1.8 -
- Patent box 25.4 26.0 -
- Fiscal effects on adjustments 5.4 12.6 -
- Other fiscal adjustments 26.0 4.8 -
Group net profit 308.4 296.3 4.1%
Reported tax rate -13.0% -15.5% -
Basic earnings per share (€) adjusted 0.23 0.22 -
44
Group net profit adjustedTax rate and EPS
> Group net profit adjusted at €267.4 million, up +7.3%:
• Recurring effective tax rate at 27.8% in FY 2019, down from 28.2% in FY 2018
• Adjusting the recurring effective tax rate for the goodwill deferred taxes (broadly in line with last year), recurring cash
tax rate at 23.5% in FY 2019, broadly in line with FY 2018
> Reported tax rate of 13.0% reflecting total net adjustments amounted to €41.0 million in FY 2019, which included
€25.4 million Patent Box benefit
> Cumulated Patent Box benefit in 2014-2019 of €96.2 million
> Recurring effective tax rate down by 480 basis points from 32.6% to 27.8% in 2016-2019
(1) Partial release of provisions related to uncertain tax risks for €47.8 million (IFRIC 23), net of increase in deferred tax liability on future dividend distribution for €(21.8) million (IAS12)
(2) EPS calculation based on weighted average outstanding shares (net of own shares) of 1,144,315,926 shares in FY2019 (vs. 1,154,903,852 shares in FY2018)
(1)
(2)
Results for the Full Year 2019 ended 31 December 2019
Table of contents
Results Summary
Sales Results‒ By region
‒ By brand
Operating Results by Region
Consolidated P&L
Cash Flow & Net Financial Debt
New initiatives & Outlook
Annex
45

Results for the Full Year 2019 ended 31 December 2019
Free cash flow
46
> Free cash flow at €258.5 million, up €22.8 million vs. FY 2018. Recurring free cash flow at €267.3 million, broadly
unchanged vs. FY 2018. Key drivers:
• Increase of EBITDA adjusted of €47.2 million, partially due to the first time application of IFRS16-’Leases’
• Taxes paid of €45.3 million in FY 2019 after non-recurring tax benefits (‘Patent Box’) and fiscal effects on adjustments. Recurring
taxes at €81.1 million in FY 2019
• OWC increase of €29.6 million in FY 2019 (vs. increase of €25.5 million in FY 2018) (1)
• Financial expenses of €22.1 million in FY 2019, of which recurring financial expenses of €27.9 million
• Capex of €82.4 million in FY 2019, of which recurring capex of €61.1 million
• Negative impact from other non-cash items of €(41.9) million in FY 2019, mainly due to provisions release for restructuring projects.
Recurring at €(12.8) million in FY 2019
> Recurring FCF/EBITDA adjusted ratio at 55.7% in FY 2019 (from 61.9% in FY 2018)
Total Recurring Total Recurring Total Recurring
€ m € m € m € m € m % € m %
EBITDA adjusted 479.8 479.8 432.6 432.6 47.2 10.9% 47.2 10.9%
Taxes paid (45.3) (81.1) (48.5) (72.5) 3.2 (8.6)
Change in OWC (at constant FX and perimeter) (29.6) (29.6) (25.5) (25.5) (4.1) (4.1)
Financial income (expense), of which (22.1) (27.9) (21.0) (22.8) (1.0) (5.1)
Net interest paid (27.9) (27.9) (22.8) (22.8) (5.1) (5.1)
Financial adjustments 5.8 0.0 1.8 0.0 4.0 0.0
Capex (1) (82.4) (61.1) (70.9) (49.7) (11.5) (11.4)
Other non-cash items(2) (41.9) (12.8) (31.0) 5.7 (10.9) (18.5)
Free Cash Flow (FCF) 258.5 267.3 235.6 267.7 22.8 9.7% (0.5) -0.2%(1)
Recurring capex refers to maintenance capex(2)
Other non-cash i tems mainly attributable to provis ion for restructuring projects , incentive plans , net use of funds
FY 2019 FY 2018Δ FY19 vs. FY18 Δ FY19 vs. FY18
(1) Refer to annex 9 ‘Operating working capital’ for details
Results for the Full Year 2019 ended 31 December 2019
OWC at 31/12/2018 Organic Forex Perimeter OWC at 31/12/2019
Operating working capital(1)
47
636.0 694.8
29.6 10.5 18.8
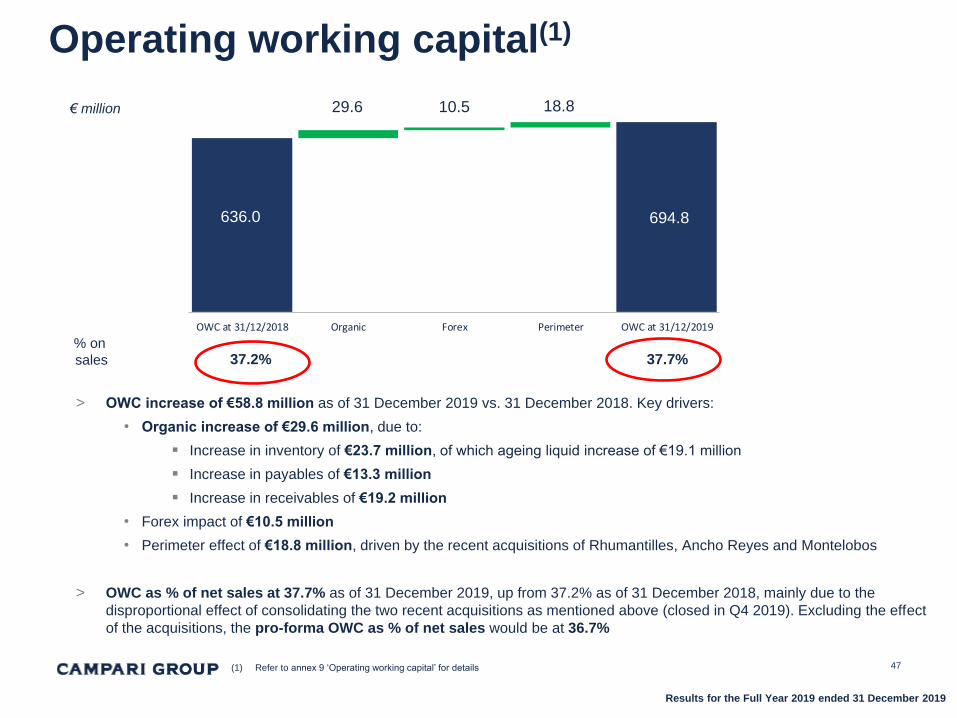
> OWC increase of €58.8 million as of 31 December 2019 vs. 31 December 2018. Key drivers:
• Organic increase of €29.6 million, due to:
▪ Increase in inventory of €23.7 million, of which ageing liquid increase of €19.1 million
▪ Increase in payables of €13.3 million
▪ Increase in receivables of €19.2 million
• Forex impact of €10.5 million
• Perimeter effect of €18.8 million, driven by the recent acquisitions of Rhumantilles, Ancho Reyes and Montelobos
> OWC as % of net sales at 37.7% as of 31 December 2019, up from 37.2% as of 31 December 2018, mainly due to the
disproportional effect of consolidating the two recent acquisitions as mentioned above (closed in Q4 2019). Excluding the effect
of the acquisitions, the pro-forma OWC as % of net sales would be at 36.7%
€ million
37.7%37.2%% on
sales
(1) Refer to annex 9 ‘Operating working capital’ for details

Results for the Full Year 2019 ended 31 December 2019
CAPEX
48
• Total capex investment was equal to €82.4 million, of which:
- €61.1 million maintenance capex
- €21.3 million extraordinary capex
• For FY 2020, maintenance capex is expected at approximately €64 million and extraordinary capex at
approximately €30 million reflecting investments on extra projects (incl. brand houses and other projects)
€ millionFY 2018
actual
FY 2019
actual
FY 2020
guidance
Maintenance capex (net of barrel disposal) 49.7 61.1 64
Extraordinary capex (incl.new offices, brand houses and other projects) 21.2 21.3 30
Total capex 70.9 82.4 94

Results for the Full Year 2019 ended 31 December 2019
Net debt at 31/12/2018 FCF Net value from disposals
& acquisitions
Dividend Purchase of own shares IFRS 16 application Others Net debt at 31/12/2019
Strong FCF generation driving €68.9 million reduction in net financial debt
49
> Net financial debt at €777.4 million as of 31 December 2019, down €68.9 million from €846.3 million as of 31 December
2018, driven by strong generation of cash flow, net of the acquisition of Rhumantilles and Ancho Reyes & Montelobos, the
disposal of Villa Les Cèdres (4) and after the dividend payment, the net purchase of own shares and the effect of IFRS16-
’Leases’ application
> Net debt to EBITDA adjusted ratio at 1.6 times as of 31 December 2019 (down from 2.0 times (5) as of 31 December 2018)
(1) Purchase of own shares net of sale of shares for stock option exercises
(2) Including the effect of the first-time application of IFRS16-’Leases’ of €(81.4) million (as of 1 January 2019) as well as the net effect generated during the year relating to lease contracts
(3) Mainly related to FX and earn-out
(4) Impacting the net financial debt as of 31 December 2019 by €141.9 million, of which €60.1 million related to tax to be paid in 2020 (to impact net financial debt of 2020)
(5) Calculated based on the same criteria adopted for the ratio of 31 December 2019
(846.3) (777.4)
258.5
28.9(57.3)
(47.3)
(90.4) (23.5)
(189.6)
(1) (3)(2)

Results for the Full Year 2019 ended 31 December 2019
Debt maturity(1)
50
> Net debt of €777.4 million as of 31 December 2019
> Long-term gross debt at €600 million(2)
- Overall long-term gross debt average coupon at 1.62%
- Fixed interest rate debt accounts for c. 58% of the overall long-term gross debt
(2) €580.9 million Eurobond expiring in September 2020 reclassified as short-term debt
(3) Includes Lease Debt arising from the adoption of IFRS16-‘Leases’
(1) Refer to annex 8 Financial debt details
(3)

Results for the Full Year 2019 ended 31 December 2019
Table of contents
Results Summary
Sales Results‒ By region
‒ By brand
Operating Results by Region
Consolidated P&L
Cash Flow & Net Financial Debt
New initiatives & Outlook
Annex
51

Results for the Full Year 2019 ended 31 December 2019
52
Business developments in Asia in 2020Singapore - New Asia Pacific Regional Headquarters
Japan - Joint venture setup
China - Market exploration for Aperol
> Campari will move from a third party market to a newly established equity partnership
with a local premium spirits operator aimed at the development of marketing and sales
activities of a premium spirits portfolio, including Campari brand, in the Japanese
market. With an initial stake of 40% of the J/V, Campari Group has the right to purchase
up to 100% of the J/V share capital starting from 2023
> Currently generating c.1% of Campari Group’s net sales, Japan is a key market for
Campari and Wild Turkey brands, while representing a key opportunity for a wider super
premium offering
> The Group will relocate its Asia Pacific Regional Headquarters from Sydney to
Singapore in spring 2020
> With a prime and centric location within the region, the move to Singapore will allow
the Group to better focus on the growth opportunities in the region and facilitate
closer connections between the region and the other business units of the Group
> The Group will engage in exploratory initiatives aimed to localize the Aperol global
playbook to China
> This includes a series of micro battles for top potential channels in the on-premise to
determine ‘where to play’ and ‘how to win’

Results for the Full Year 2019 ended 31 December 2019
53
Distribution developments in France
> In December 2019, the Group announced the signing for the acquisition of 100% of the French distributor Baron
Philippe de Rothschild France Distribution S.A.S. (‘RFD’), which has been the exclusive distributor of Campari
Group’s brand portfolio for the French market since 2009. It is also the exclusive distributor of a portfolio of premium
and super-premium wine varieties in the French market, such as Mouton Rothschild and Mouton Cadet brands
> The deal is expected to close during the first quarter of 2020, subject to customary antitrust approval
> In 2018, RFD achieved reported sales of €145.1 million (under local GAAP), including the net sales of Campari Group
own brands as well as third-party brands
> Accounting for 2.2% of the Group’s net sales in FY2019, France is a core and high potential market for the Group,
mainly thanks to the aperitifs business and the newly acquired rhum agricole premium brands
> By insourcing the distribution, the Group aims to enhance focus on its core brand portfolio in the French market
Campari Group’s presence in France - own portfolio Core 3rd party brands (1)
(1) Seller’s premium and super-premium portfolio of prestigious and renowned local and international wine varieties, such as Mouton Rothschild
and Mouton Cadet brands, to be distributed by Campari Group upon the deal closing

Results for the Full Year 2019 ended 31 December 2019
Corporate actions and other resolutions
54
> Continuation of share buy-back program to be implemented for an
increased amount up to €350 million in twelve months
• The increase of the buyback serves the purpose of implementing
the new Company’s policy of having a portfolio of treasury shares
sufficient to serve all outstanding stock options plans as
opposed to the vested ones only, in order to hedge the risk of the
price increase of the shares underlying the options and, as a result,
contain the overall outlay of the incentive plans (1)
Evolution of dividend per share (€) for
the past 5 years
Evolution of share buy-back, net
in the past 5 years (€ million)
Share buy-back program
> Increase in proposed full year dividend to €0.055 per share,
up +10.0% vs. last year, in line with Company’s dividend policy
Dividend
Transfer of the registered office of
Davide Campari-Milano S.p.A. to the Netherlands and
enhancement of current increased voting mechanism
(1) Additional details on the program will be communicated before the commencement of the purchases
(2) Refer to related Company’s announcement of 18 February 2020
> Transaction aimed at encouraging a capital structure more supportive of the Group’s external growth strategy in the
long run and rewarding a shareholder base with a long term investment horizon, in line with the Group’s strategic
guidance (2)

Results for the Full Year 2019 ended 31 December 2019
55
Conclusion and Outlook
> In FY 2019, the Group delivered sustained performance across sales and profit indicators despite selective
destocking and negative agave price effect, thanks to continuous sales mix improvement driven by outperformance
of key high-margin brands in core developed markets
> Looking forward, for FY 2020, the outlook remains fairly balanced in terms of risks and opportunities:
• The positive underlying business momentum is expected to continue, driven by the combinations of key high-
margin brands in core developed markets. The tail-end effect of the destocking activities, linked to route-to-
market changes, is expected to impact the first half of the year, on top of a tough comparison base
• Positive evolution of EBIT organic performance by value is expected. While the margin development is
expected to reflect agave’s increasingly elevated purchase price, the import tariff imposed by the US as well
as investments in brand building and route-to-market initiatives for business long-term development
• Perimeter effect is to reflect the recent acquisitions as well as the agreement related to the acquisition of the
French distributor (subject to Antitrust approval) while FX is to be impacted by volatile macro environment
The Group remains confident in delivering a positive performance across
all key business indicators in 2020

Results for the Full Year 2019 ended 31 December 2019
Table of contents
Results Summary
Sales Results‒ By region
‒ By brand
Operating Results by Region
Consolidated P&L
Cash Flow & Net Financial Debt
New initiatives & Outlook
Annex
56

Results for the Full Year 2019 ended 31 December 2019
57
Annex - 1 Net sales by region and key market
Annex - 2 Net sales by brand cluster
Annex - 3 Q4 2019 consolidated income statement
Annex - 4 Reclassified balance sheet at 31 December 2019 - Invested capital and financing sources
Annex - 5 Consolidated balance sheet at 31 December 2019 - Assets and liabilities
Annex - 6 FY 2019 reclassified cash flow
Annex - 7 FY 2019 consolidated cash flow statement
Annex - 8 Financial debt details
Annex - 9 Operating working capital
Annex - 10 Exchange rates effects

Results for the Full Year 2019 ended 31 December 2019
58
Annex - 1
Net sales by region & key market
Region breakdown by key market
FY 2019 FY 2018 Change of which: Q4 2019
€ m % € m % % organic perimeter forex organic
Americas 821.5 44.6% 744.7 43.5% 10.3% 5.8% -0.1% 4.5% 4.3%
Southern Europe, Middle East & Africa 498.7 27.1% 479.8 28.0% 3.9% 5.3% -1.3% -0.1% -1.8%
North, Central & Eastern Europe 393.8 21.4% 358.9 21.0% 9.7% 8.8% 0.0% 1.0% 9.9%
Asia Pacific 128.5 7.0% 128.3 7.5% 0.2% 0.8% 0.0% -0.7% 0.6%
Total 1,842.5 100.0% 1,711.7 100.0% 7.6% 5.9% -0.4% 2.1% 3.6%
Americas by market
FY 2019 FY 2018 Change of which: Q4 2019
€ m % € m % % organic perimeter forex organic
USA 495.1 60.3% 445.6 59.8% 11.1% 5.3% 0.0% 5.8% 3.3%
Jamaica 108.0 13.1% 90.1 12.1% 19.8% 17.6% -0.2% 2.4% 18.3%
Canada 58.0 7.1% 54.8 7.4% 5.7% 2.6% 0.0% 3.1% 0.8%
Brazil 52.0 6.3% 51.5 6.9% 0.8% 3.3% 0.0% -2.4% -2.4%
Mexico 41.8 5.1% 37.8 5.1% 10.6% 5.9% -0.8% 5.6% 13.7%
Other countries 66.7 8.1% 64.8 8.7% 2.9% -1.9% -0.1% 4.9% -5.4%
Americas 821.5 100.0% 744.7 100.0% 10.3% 5.8% -0.1% 4.5% 4.3%

Results for the Full Year 2019 ended 31 December 2019
59
Annex - 1
Net sales by region & key market
Southern Europe, Middle East & Africa by market
FY 2019 FY 2018 Change of which: Q4 2019
€ m % € m % % organic perimeter forex organic
Italy 367.0 73.6% 356.1 74.2% 3.1% 5.8% -2.7% 0.0% -0.7%
France 40.3 8.1% 33.7 7.0% 19.5% 14.2% 5.3% 0.0% 28.2%
GTR 30.1 6.0% 29.6 6.2% 1.4% 4.1% -2.6% -0.1% 18.6%
Other countries 61.3 12.3% 60.3 12.6% 1.7% -2.0% 4.2% -0.6% -28.9%
Southern Europe, Middle East & Africa 498.7 100.0% 479.8 100.0% 3.9% 5.3% -1.3% -0.1% -1.8%
North, Central & Eastern Europe by market
FY 2019 FY 2018 Change of which Q4 2019
€ m % € m % % organic perimeter forex organic
Germany 172.6 43.8% 167.2 46.6% 3.3% 3.3% 0.0% 0.0% -2.2%
Russia 55.9 14.2% 48.9 13.6% 14.4% 11.9% 0.0% 2.5% 12.3%
United Kingdom 46.2 11.7% 32.8 9.2% 40.8% 39.6% 0.0% 1.2% 67.8%
Other countries 119.0 30.2% 110.0 30.6% 8.2% 6.5% -0.1% 1.8% 9.7%
North, Central & Eastern Europe 393.8 100.0% 358.9 100.0% 9.7% 8.8% 0.0% 1.0% 9.9%
Asia Pacific by market
FY 2019 FY 2018 Change of which Q4 2019
€ m % € m % % organic perimeter forex organic
Australia 88.4 68.7% 88.3 68.8% 0.1% 2.0% 0.0% -1.9% -1.3%
Other countries 40.2 31.3% 40.1 31.2% 0.3% -1.8% 0.0% 2.1% 5.5%
Asia Pacific 128.5 100.0% 128.3 100.0% 0.2% 0.8% 0.0% -0.7% 0.6%

Results for the Full Year 2019 ended 31 December 2019
60
Annex - 2
Net sales by brand cluster
Consolidated Net sales by brand
FY 2019 FY 2018 Change of which: Q4 2019
€ m % € m % % organic perimeter forex organic
Global Priorities 1,048.5 56.9% 955.4 55.8% 9.7% 7.3% 0.0% 2.5% 4.7%
Regional Priorities 309.2 16.8% 287.9 16.8% 7.4% 4.3% 1.1% 2.1% 2.6%
Local Priorities 211.5 11.5% 208.1 12.2% 1.6% 1.8% 0.1% -0.2% -6.5%
Rest of portfolio 273.2 14.8% 260.4 15.2% 4.9% 6.2% -3.9% 2.6% 9.0%
Total 1,842.5 100.0% 1,711.7 100.0% 7.6% 5.9% -0.4% 2.1% 3.6%

Results for the Full Year 2019 ended 31 December 2019
61
Annex - 3
Q4 2019 Consolidated income statement
(1) COGS = cost of materials, production and logistics expenses
(2) SG&A = selling, general and administrative expenses
Q4 2019 Q4 2018Reported
change
Organic
change
Forex
impact
Perimeter
effect
€ million % of sales € million % of sales % % % %
Net Sales 538.7 100.0% 511.1 100.0% 5.4% 3.6% 1.0% 0.8%
COGS (1) (226.1) -42.0% (214.9) -42.0% 5.2% 3.3% 0.3% 1.6%
Gross Profit 312.6 58.0% 296.2 58.0% 5.5% 3.8% 1.5% 0.2%
A&P (87.6) -16.3% (78.4) -15.3% 11.8% 9.8% 1.7% 0.3%
Contribution after A&P 225.0 41.8% 217.9 42.6% 3.3% 1.6% 1.4% 0.2%
SG&A (2) (105.0) -19.5% (98.2) -19.2% 6.9% 4.2% 1.4% 1.3%
EBIT adjusted 120.0 22.3% 119.6 23.4% 0.3% -0.5% 1.4% -0.7%
Operating adjustments (7.8) -1.4% (10.5) -2.0% -
Operating profit (EBIT) 112.2 20.8% 109.1 21.4% 2.8%
Financial income (charges) (7.6) -1.4% (11.4) -2.2% -33.4%
Financial adjustments 5.8 1.1% 0.2 0.0% -
Proft (loss) related to companies valued
at equity(0.0) 0.0% (0.1) 0.0% -
Put option, earn out income (charges)
and hyperinflation effects(1.0) -0.2% 3.5 0.7% -
Profit before taxes and
non-controlling interests109.5 20.3% 101.4 19.8% 7.9%
Other Information
Depreciation&Amortisation (19.5) -3.6% (13.1) -2.6% 48.7% 41.6% 1.1% 6.1%
EBITDA adjusted 139.5 25.9% 132.8 26.0% 5.1% 3.7% 1.4% 0.0%
EBITDA 131.7 24.5% 122.3 23.9% 7.7%

Results for the Full Year 2019 ended 31 December 2019
62
Annex - 4
Reclassified balance sheetInvested capital and resources
€ million 31 December 2019 31 December 2018 Change
Inventories and current biological assets 618.6 566.1 52.5
Trade receivables 316.9 285.9 31.0
Trade payables (240.7) (216.0) (24.7)
Operating working capital 694.8 636.0 58.8
Tax credits 18.7 22.4 (3.7)
Other receivables and current assets 44.7 32.3 12.4
Assets held for sale 5.3 7.8 (2.5)
Other current assets 68.7 62.6 6.1
Payables for taxes (75.1) (13.9) (61.1)
Other current liabilities (141.5) (153.3) 11.8
Liabilities held for sale - - -
Other current liabilities (216.5) (167.2) (49.3)
Defined benefit obligations (33.4) (31.6) (1.8)
Deferred tax liabilities (386.1) (368.2) (17.9)
Deferred tax assets 37.5 38.4 (0.9)
Other non-current assets 8.2 8.1 0.0
Other non-current liabilities (67.6) (131.6) 63.9
Other net non-current assets / liabilities (441.4) (484.8) 43.4
Net tangible fixed assets 581.9 578.2 3.6
Intangible assets, including goodwill & trademarks 2,481.1 2,383.9 97.2
Equity investments 0.5 0.4 0.1
Total fixed assets 3,063.5 2,962.5 101.0
Invested capital 3,169.0 3,009.1 159.9
Group shareholders' equity 2,389.7 2,162.8 226.9
Non-controlling interests 1.9 0.0 1.9
Net financial debt 777.4 846.3 (68.9)
Financing sources 3,169.0 3,009.1 159.9
% Net debt on equity 32.5% 39.1%

Results for the Full Year 2019 ended 31 December 2019
63
Annex - 5
Consolidated balance sheet (1 of 2)Assets
31 December 2019 31 December 2018 Change
€ million € million
ASSETS
Non-current assets
Net tangible fixed assets 496.4 454.4 42.0
Right of use assets 80.5 - 80.5
Biological assets 3.9 1.0 2.9
Investment properties 1.1 122.8 (121.7)
Goodwill and brands 2,431.8 2,341.0 90.8
Intangible assets with a finite life 49.3 42.9 6.4
Investments in associates and joint ventures 0.5 0.4 0.1
Deferred tax assets 37.5 38.4 (0.9)
Other non-current asssets 22.8 23.9 (1.1)
Total non-current assets 3,123.8 3,024.9 98.9
Current assets
Inventories 617.7 565.3 52.5
Biological assets 0.9 0.8 0.0
Trade receivables 316.9 286.0 30.9
Short-term financial receivables 8.3 29.1 (20.8)
Cash and cash equivalents 704.4 613.9 90.5
Income tax receivables 18.7 22.4 (3.7)
Other receivables 44.7 32.3 12.4
Total current assets 1,711.6 1,549.8 161.8
Assets held for sale 5.3 7.8 (2.5)
Total assets 4,840.7 4,582.5 258.2

Results for the Full Year 2019 ended 31 December 2019
64
Annex - 5
Consolidated balance sheet (2 of 2)Liabilities
31 December 2019 31 December 2018 Change
€ million € million
LIABILITIES AND SHAREHOLDERS’ EQUITY
Shareholders’ equity
- Share capital 58.1 58.1 -
- Reserves 2,331.6 2,104.7 226.9
Capital and reserves attributable to Parent Company 2,389.7 2,162.8 226.9
Non-controlling interests 1.9 - 1.9
Total shareholders' equity 2,391.6 2,162.8 228.8
Non-current liabilities
Bonds 349.4 778.7 (429.4)
Other non-current liabilities 476.4 463.7 12.7
Post-employment benefit obligations 33.4 31.6 1.8
Provisions for risks and charges 51.4 118.7 (67.2)
Deferred tax liabilities 386.1 368.2 17.9
Total non-current liabilities 1,296.7 1,760.9 (464.2)
Current liabilities
Payables to banks 31.0 4.5 26.5
Bonds 580.0 218.6 361.4
Other financial liabilities 84.3 52.5 31.8
Trade payables 240.7 216.0 24.7
Income tax payables 75.1 13.9 61.1
Other current liabilities 141.5 153.4 (11.9)
Total current liabilities 1,152.5 658.9 493.6
Liabilities held for sale - - -
Total liabilities 2,449.1 2,419.7 29.4
Total liabilities and shareholders' equity 4,840.7 4,582.6 258.2

Results for the Full Year 2019 ended 31 December 2019
65
Annex - 6
Reclassified cash flow statement
31 December
2019
31 December
2018Change
€ million € million € million
EBITDA Adjusted 479.8 432.6 47.2
Provisions and other changes from operating activities (41.9) (31.1) (10.9)
Taxes paid (45.3) (48.5) 3.2
Cash flow from operating activities before changes in working capital 392.5 353.0 39.5
Changes in net operating w orking capital (29.6) (25.5) (4.1)
Cash flow from operating activities 363.0 327.5 35.5
Net interests paid (27.9) (22.8) (5.1)
Adjustments to f inancial income (charges) 5.8 1.8 4.0
Capital expenditure (82.4) (70.9) (11.5)
Free cash flow 258.5 235.6 22.9
(Acquisition) disposal of companies or business division 110.8 22.2 88.6
Dividend paid out by the Parent Company (57.3) (57.5) 0.2
Other changes (incl. net puchase of ow n shares) (54.3) (62.0) 7.6
Total cash flow used in other activities (0.8) (97.3) 96.4
Exchange rate differences and other changes (13.9) (4.0) (9.9)
Change in net financial position due to operating activities 243.7 134.3 109.4
Put option and earn-out changes (77.6) 1.0 (78.7)
IFRS 16-'Leases' application (81.4) - (81.4)
Increase in investments for lease right of use (15.8) - (15.8)
Net cash flow of the period = change in net financial position 68.9 135.3 (66.4)
Net financial position at the beginning of the period (846.3) (981.5) 135.3
Net financial position at the end of the period (777.4) (846.3) 68.9

Results for the Full Year 2019 ended 31 December 2019
66
Annex - 7
Cash flow statement (1 of 2)
€ million 31 December 2019 31 December 2018 Change
EBIT 386.3 380.7 5.7
Effects from applying hyperinflation accounting 4.5 3.0 1.5
Depreciation and amortisation 71.8 53.8 18.0
Gains and losses on sales of fixed assets (2.5) (3.0) 0.5
Gains on sales of business - (38.5) 38.5
Write-downs of tangible fixed assets, goodwill, trademark and business 6.1 2.2 4.0
Accruals of provision (15.7) 2.0 (17.7)
Use of provisions (10.0) 5.3 (15.3)
Net change in Operating Working Capital (29.6) (25.5) (4.1)
Income tax paid (45.3) (48.5) 3.2
Joint Venture profit - 0.2 (0.2)
Other non-cash items (2.7) (3.9) 1.3
Cash flow generated from (used in) operating activities 363.0 327.5 35.4
Purchase of tangible and intangible fixed assets (92.0) (82.8) (9.2)
Disposal of tangible assets 9.6 11.9 (2.3)
Acquisition and sale of companies or subsidiaries (86.5) 15.7 (102.1)
Debt assumed with acquisition 6.0 6.5 (0.5)
Disposal of non strategic assets 200.0 - 200.0
Payment of put option and earn out (69.2) (42.9) (26.3)
Interests received 9.0 7.1 1.9
Net change in securities 27.4 8.2 19.3
Dividends received 0.0 0.1 (0.1)
Other changes (0.1) (0.4) 0.3
Cash flow generated from (used in) investing activities 4.3 (76.6) 80.9

Results for the Full Year 2019 ended 31 December 2019
67
Annex - 7
Cash flow statement (2 of 2)
€ million 31 December 2019 31 December 2018 Change
Bond issued by Parent Company 149.3 - 149.3
Repayment of medium-/long -term financing 248.7 - 248.7
Repayment of private placements and bonds (219.1) - (219.1)
Payment of lease liabilites (13.0) - (13.0)
Repayment of other medium-/long -term financing (300.0) (0.5) (299.5)
Net change in short-term financial payables and bank loans 19.8 (10.4) 30.1
Interests paid (27.7) (29.6) 1.9
Interest on leases (3.4) (0.3) (3.1)
Change in other financial payables and receivables (23.2) (5.3) (17.9)
Own shares purchase and sale (47.3) (55.5) 8.2
Dividend paid by Group (57.3) (57.5) 0.2
Cash flow generated (used in) financing activities (273.2) (159.2) (114.0)
Other differences including exchange rate differences (3.6) 7.7 (11.2)
Net increase (decrease) in cash and banks 90.5 99.5 (9.0)
Net cash position at the beginning of period 613.9 514.5 99.5
Net cash position at the end of period 704.4 613.9 90.5

Results for the Full Year 2019 ended 31 December 2019
Issue date Maturity Type Currency Coupon Outstanding Amount
(€ million)Original tenor As % of total
Sep 30, 2015 (1)
Sep-20 Unrated Eurobond EUR 2.75% 581 5 years 49%
Apr 5, 2017 Apr-22 Unrated Eurobond EUR 1.768% 50 5 years 4%
Apr 5, 2017 Apr-24 Unrated Eurobond EUR 2.165% 150 7 years 13%
Apr 23, 2019 Apr-24 Unrated Eurobond EUR 1.655% 150 5 years 13%
Jul 31, 2019 Jul-24 Term Loan EUR 1.25% +3m euribor 250 5 years 21%
Total gross debt 1,181 100%
Of which: medium-long term 600
Financial debt details
68
(1) Reclassified as short-term debt
(2) Including commitments for future minority purchases (including Grand Marnier) and payable for future earn-outs
Gross debt composition as of 31 December 2019
Net financial debt composition as of 31 December 2019
Annex - 8
€ million 31 December 2019 31 December 2018 Δ 31 December 2019 vs.
31 December 2018
Short-term cash/(debt) (A) 71.5 404.1 (332.6)
- Cash and cash equivalents 704.4 613.9 90.5
- Short-term debt (633.0) (209.9) (423.1)
Medium to long-term cash/(debt) (B) (666.1) (1,076.0) 409.9
Debt relating to operating activities (A+B) (594.6) (672.0) 77.3
Liabilities for put option and earn-out payments (2) (182.8) (174.3) (8.5)
Net cash/(debt) (777.4) (846.3) 68.9

Results for the Full Year 2019 ended 31 December 2019
69
Annex - 9
Operating working capital
Reported
change
Organic
change
Forex
impact
Perimeter
effect
% sales
Receivables 316.9 17.2% 285.9 16.7% 31.0 19.2 3.9 7.9
Inventories 618.6 33.6% 566.1 33.1% 52.5 23.7 7.5 21.3
- Maturing inventory 364.7 19.8% 340.1 19.9% 24.6 19.1 5.6 -
- Biological assets 0.9 0.0% 0.8 0.0% 0.0 0.0 0.0 -
- Other inventory 253.0 13.7% 225.2 13.2% 27.8 4.6 1.9 21.3
Payables (240.7) -13.1% (216.0) -12.6% (24.7) (13.3) (0.9) (10.5)
Operating Working Capital 694.8 37.7% 636.0 37.2% 58.8 29.6 10.5 18.8
31 December 2019 31 December 2018
€ million % sales € million €million

Results for the Full Year 2019 ended 31 December 2019
FY 2019change vs FY
201831 December 2019
change vs 31 December
2018
: 1 Euro % : 1 Euro %
US Dollar 1.120 5.5% 1.123 1.9%
Canadian Dollar 1.486 3.0% 1.460 6.9%
Jamaican Dollar 149.201 2.0% 148.887 -2.0%
Mexican Peso 21.558 5.4% 21.220 6.0%
Brazilian Real 4.413 -2.4% 4.516 -1.6%
Argentine Peso 67.275 -35.8% 67.275 -35.8%
Russian Ruble 72.459 2.2% 69.956 14.0%
Australian Dollar 1.611 -1.9% 1.600 1.4%
Chinese Yuan 7.734 1.0% 7.821 0.7%
British Pound Sterling 0.877 0.9% 0.851 5.1%
Swiss Franc 1.113 3.8% 1.085 3.8%
Average exchange rate Period end exchange rate
70
Annex - 10
Exchange rates effects
(1) Following the adoption of IAS 29 ‘Financial reporting Hyperinflationary economies’ in Argentina, the average exchange rate of Argentine Peso for FY 2019 was adjusted to be equal to the rate as
of 31 December 2019
(1)

Results for the Full Year 2019 ended 31 December 2019
Disclaimer
71
This document contains forward-looking statements that relate to future events and future operating, economic and
financial results of Campari Group. By their nature, forward-looking statements involve risk and uncertainty because
they depend on the occurrence of future events and circumstances. Actual results may differ materially from those
reflected in forward-looking statements due to a variety of factors, most of which are outside of the Group’s control.
It should be noted that the company’s accounts and consolidated results are currently subject to auditing.