2019 First Quarter Briefing - twse.com.tw
59
May 2019 2019 First Quarter Briefing
Transcript of 2019 First Quarter Briefing - twse.com.tw

May 2019
2019 First Quarter Briefing
2
Disclaimer
This document is provided by Cathay Financial Holding Co., Ltd. (the "Company"). Except for the numbers and information included in the Company's financial statements, the information contained in this document has not been audited or reviewed by any accountant or independent expert. The Company makes no express or implied representations or warranties as to the fairness, accuracy, completeness, or correctness of such information or opinions. This document is provided as of the date herein and will not be updated to reflect any changes hereafter. The Company, its affiliates and their representatives do not accept any responsibility or liability for any damage caused by their negligence or any other reasons, nor do they accept responsibility or liability for any loss or damages arising from the use of this document or the information contained herein or anything related to this document.
This document may contain forward-looking statements, including but not limited to all statements that address activities, events or developments that the Company expects or anticipates to take place in the future based on the projections of the Company toward the future, and various factors and uncertainness beyond the Company's control. Therefore, the actual results may differ materially from those contained in the forward-looking statements.
This document is not and cannot be construed as an offer to purchase or sell securities or other financial products or solicitation of an offer.
This document may not be directly or indirectly reproduced, redistributed or forwarded to any other person and may not be published in whole or in part for any purpose.

1Q19 Business Overview
Overseas Expansion
Business Performance Summary
Cathay United BankCathay LifeCathay Century
Cathay Life Embedded Value & Appraisal Value Impact of IFRS 17 Appendix
3
Agenda

4
1Q19 Business overview
Cathay United Bank
Cathay Life
Cathay SITE
Cathay Century
Cathay Securities
Delivered solid loan and deposit growth with benign credit quality.
Overseas expansion continued. FX loan grew steadily.
Fee income continued to increase. Wealth management fee grew 10% YoY. Number of
active cards ranked No.1 in the industry.
Focused on value-driven strategy. FYP for protection products grew ~70% YoY. FYPE remained No. 1 in the industry.
Cost of liability continued to improve. Pre-hedging recurring yield increased to 3.34%.
The shareholders’ equity rebounded sharply. Unrealized G/L of financial assets has turned positive.
Premium income grew 7% YoY. Remained in second place with 11.8% market share.
Developed online business in China and enlarged local team in Vietnam. Overseas
premium income continued to rise.
Ranked No.1 in terms of AUM, which amounted to NT$727.1 BN.
Recognized by Asia Asset Management, Asian Investor, Benchmark and received
Morning Star & Smart Magazine Taiwan Fund Award and TFF-Bloomberg Best Fund
Award in 2019.
Brokerage business grew steadily. Sub-brokerage market share ranked No.1.
Optimized customer experience with new digital business model.
5
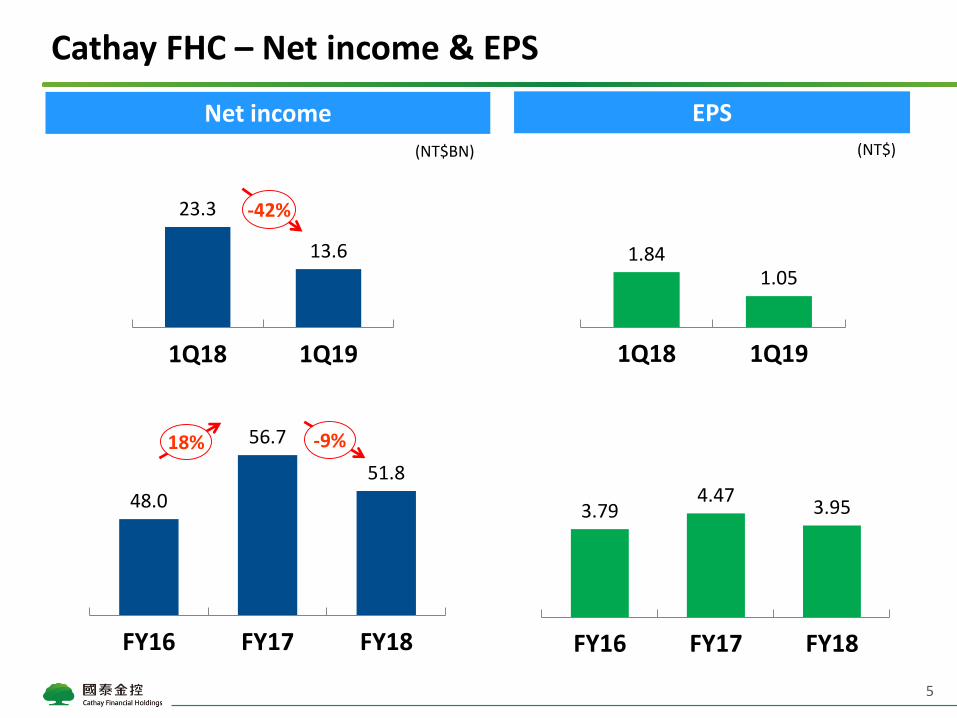
Cathay FHC – Net income & EPS
Net income EPS
(NT$BN) (NT$)
48.0
56.7
51.8
FY16 FY17 FY18
23.3
13.6
1Q18 1Q19
18% -9%
3.794.47
3.95
FY16 FY17 FY18
-42%
1.841.05
1Q18 1Q19

6
Cathay FHC – Net income & ROE
Net income of primary subsidiaries ROE
Note: Starting from 1Q18, ROE calculation was based on IFRS 9.
(NT$BN)
5.8
16.7
0.5 0.2 0.16.4 6.4
0.5 0.2 0.1
CUB CathayLife
CathayCentury
CathaySITE
CathaySecurities
10.0% 11.5%9.0%
18.8% 19.7%
8.8%10.9%
7.3%
14.7%
26.3%
CathayFHC
CUB CathayLife
CathayCentury
CathaySITE
14.9% 12.4% 14.8%18.0%
27.2%
9.1% 12.1%6.1%
18.3%
27.2%
CathayFHC
CUB CathayLife
CathayCentury
CathaySITE
19.7
36.3
1.9 0.4 0.3
21.330.3
1.5 0.6 0.5
CUB CathayLife
CathayCentury
CathaySITE
CathaySecurities
1Q18 1Q19 1Q18 1Q19
FY17 FY18 FY17 FY18

7
Book value
Cathay FHC – Book value & BVPS
Note:(1) Book value includes preferred shares and minority interests, BVPS represented BVPS attributable to common shareholders.(2) Starting Jan.1, 2018, the reporting was based on IFRS 9.
BVPS(NT$BN) (NT$)
529.8
608.5
529.3
661.1
FY16 FY17 FY18 1Q19
37.743.7
34.0
44.5
FY16 FY17 FY18 1Q19

1Q19 Business Overview
Overseas Expansion
Business Performance Summary
Cathay United BankCathay LifeCathay Century
Cathay Life Embedded Value & Appraisal Value Impact of IFRS 17 Appendix
8
Agenda

9
Cathay FHC in South East Asia
Thailand Vietnam
Cambodia
Indonesia
Malaysia
Cathay United BankCathay Life
Cathay Century
Philippines
Banking
− Vietnam: Indovina Bank performed steadily.
− Cambodia: Subsidiary’s businesses grew steadily.
− Philippines: Invested 23% stake in RCBC(3)
− Indonesia: Invested 40% stake in Bank Mayapada(3)
Cathay Life (Vietnam)
− Total premium grew 58% YoY to VND 204BN in 1Q19.
− Expanded and diversified distribution channels.
Cathay Century
− Continued to expand local distribution channels to enhance growth momentum.
Note: (1) Henan branch office opened in January, 2019. (2) Footprints in Thailand, Myanmar and Indonesia are rep. offices.(3) Investments in RCBC and Bank Mayapada are funded by Cathay Life.(4) Cathay FHC owns 49% stake of Cathay Century (China), and 33%
stake of CDBS Cathay Asset Management.
Laos
Myanmar
Singapore
China Vietnam Cambodia Hong Kong Singapore Malaysia Laos Philippines Thailand Myanmar Indonesia
Bank 7 36 16 1 1 1 1 1 1 1 1Life 51(1) 64P&C 27 2Asset Mgt. 1 1Securities 1

10
Cathay FHC in China
Cathay United Bank
− The China subsidiary grew steadily.
Cathay Lujiazui Life
− Total premium grew 16% YoY to RMB 800MN in 1Q19.
Cathay Century (China)
− Formed a strategic alliance with Ant Financial group to capture new business opportunities.
Cathay Securities (HK)
− Each business line grew steadily.
JV with China Development Bank Securities (CDBS Cathay Asset Management)
− Continued to launch new products. Mainly focused on fixed income funds.
Conning Asia Pacific Limited
− Continued to expand asset management business.Cathay Century (China)
Cathay United Bank
Cathay Lujiazui Life
Conning Asia Pacific Limited
CDBS Cathay Asset Management Company
Cathay Securities
Shanghai
Beijing Liaoning
Tianjin
Shandong
Jiangsu
Zhejiang
Fujian
Guangdong
Hong Kong
HubeiSzechwan
Henan
1Q19 Business Overview
Overseas Expansion
Business Performance Summary
Cathay United BankCathay LifeCathay Century
Cathay Life Embedded Value & Appraisal Value Impact of IFRS 17 Appendix
11
Agenda

12
Cathay United Bank – Loan & Deposit breakdown
Deposit breakdown Loan breakdown
CorporateMortgageConsumerCredit card related (NT$BN)
Time deposit
Demand deposit (NT$BN)
Note: China subsidiary was launched in Sep 2018, hence 1Q19 loan and deposit excluded preliminary amount of NT$17BN and NT$15BN, respectively.
801.4 833.4
1,300.0 1,395.2
1Q18 1Q19
669.7 720.2
684.2 711.8
135.6 153.3 16.3 17.6
1Q18 1Q19
2,101.42,228.6
61.9%
38.1%
62.6%
37.4%
6%
1.1%1.1%
44.9%
9.6%9.0%
45.4%
44.5%
6%
44.4%
1,505.91,602.8

13
Cathay United Bank – Interest yields
Note: (1) Credit card related loans are included in the calculation of interest spread.(2) China subsidiary was launched in Sep 2018. Hence, since 9M18, China subsidiary results was excluded.
2.08%1.99%
1.76% 1.80% 1.83% 1.86% 1.88%2.01% 2.04% 2.06% 2.06% 2.08%
1.84% 1.83%
1.66%1.56% 1.60% 1.64% 1.67%
1.81% 1.83% 1.85% 1.85% 1.80%
1.33%1.20%
1.07% 1.11% 1.14% 1.16% 1.18%1.24% 1.25% 1.26% 1.25% 1.22%
0.75% 0.79%0.69% 0.69% 0.69% 0.70% 0.71%
0.77% 0.79% 0.80% 0.81% 0.86%
FY14 FY15 FY16 1Q17 1H17 9M17 FY17 1Q18 1H18 9M18 FY18 1Q19
Avg. rate of interest-earning assets Interest spread Net interest margin Funding cost
1Q17 2Q17 3Q17 4Q17 1Q18 2Q18 3Q18 4Q18 1Q19
1.56% 1.64% 1.74% 1.76% 1.81% 1.85% 1.90% 1.83% 1.80%
1.11% 1.18% 1.20% 1.22% 1.24% 1.26% 1.27% 1.22% 1.22%
1.19% 1.21% 1.22% 1.25% 1.22% 1.22%
Spread
NIM
NIM-pro forma excl. China(2)
Quarterly

0.8 1.1
0.3 0.5
1Q18 1Q19
14
Cathay United Bank – Credit quality
NPL & Coverage ratio Gross provision
(NT$BN)Gross provision
RecoveryNPL ratio
Coverage ratio
Note:China subsidiary was launched in Sep 2018. Hence, 1Q19 number excluded China subsidiary results. (NPL ratio: 0.00%, Coverage ratio: 0.00%, Gross provision: NT$-36.7MN, Recovery: 0; preliminary).
0.21% 0.16%
7.56%9.32%
FY17 FY18
0.20% 0.18%
7.78%8.64%
1Q18 1Q19
4.5 5.5
1.8 1.1
FY17 FY18
864%778%
932%756%
0.15% 0.15 %Mortgage NPL
0.14% 0.19 %Mortgage NPL

15
Cathay United Bank – SME & FX loans
SME loans Foreign currency loans
(NT$BN) (NT$BN)
As % of total loans
Note: (1) Total loans exclude credit card revolving balance.(2) China subsidiary was launched in Sep 2018, hence 1Q19 foreign currency balance excluded NT$17BN (preliminary)
from China subsidiary.
10.7% 11.4%9.2%10.6% 11.6% 12.2% 15.8%13.3% 15.0% 15.1%
118.8130.9
151.9178.1 184.0
FY15 FY16 FY17 FY18 1Q19
148.9174.0
224.0 233.0 239.7
FY15 FY16 FY17 FY18 1Q19

9.4
7.68.5
10.0
6.5
FY14 FY15 FY16 FY17 FY18
16
Cathay United Bank – Offshore earnings
As % of CUB pre-tax profitsOffshore earnings
(NT$BN)
-35%12%-19% 17%
83%
29.0%
50.0%
1Q18 1Q19
1.9
3.6
1Q18 1Q19
46.1%
36.3%44.3% 45.6%
27.0%
FY14 FY15 FY16 FY17 FY18

17
Cathay United Bank – Fee income
Note: China subsidiary was launched in Sep 2018, hence 1Q19 fee income excluded NT$ 5.1MN (preliminary)from China subsidiary.
Quarterly fee income Annual fee income
(NT$BN)Others
Cards related
FXWealth management
Syndicated loans
1.6 1.6
3.0 3.3
0.10.20.20.30.40.4
1Q18 1Q19
4.4 4.9 5.7 6.5 7.3
6.7
8.89.8 8.8
9.20.4
0.4
0.4 0.40.5
1.1
1.2
1.1 0.80.9
1.3
1.3
1.3 1.4
1.7
FY14 FY15 FY16 FY17 FY18
10%
19%
11%
-3%
13.9
16.6
18.4 17.9
19.7
48.1%
46.6%
8.9%
4.7%2.6%
37.2%
9.5%8.1%2.8%
31.5%
(NT$BN)Others
Cards related
FXWealth management
Syndicated loans
3.0%
5.25.8
11%
56.4%
7.7%4.9%2.7%
28.3%
56.9%
7.2%
2.2%
30.7%

18
Cathay United Bank – Wealth management fee
Wealth management fee breakdown
(NT$MN) 1Q18 1Q19 FY16 FY17 FY18
Wealth management fee income 2,952 3,252 9,828 8,837 9,183
YoY growth (%) 11.8% 10.1% 11.9% -10.1% 3.9%
1,573
124 304
7,794
2,453
230 316
5,790
2,399
378 364
5,974
Mutual Funds Structuredproducts
& Securities
Trust &Custody
Insurance
754
61 95
2,025
479 148 100
2,510
MutualFunds
Structuredproducts
& Securities
Trust &Custody
Insurance
FY17 FY18FY161Q18 1Q19

1Q19 Business Overview
Overseas Expansion
Business Performance Summary
Cathay United BankCathay LifeCathay Century
Cathay Life Embedded Value & Appraisal Value Impact of IFRS 17 Appendix
19
Agenda

20
Cathay Life – Total premium
Quarterly total premium Annual total premium(NT$BN)
Traditional life
Health, accident and others
Investment-linked (VUL)
Investment-linked (non-VUL)
Interest sensitive annuity(NT$BN)
Traditional life
Health, accident and others
Investment-linked (VUL)
Investment-linked (non-VUL)
Interest sensitive annuity
116.4 115.5 105.2126.5
21.4 21.823.0
23.74.0 3.73.5
3.411.953.1
44.613.60.1
0.00.0 0.8
1Q16 1Q17 1Q18 1Q19
292.1366.1
418.1499.1 496.4
438.7
73.5
84.9
94.0
99.3 101.9
106.5
30.3
26.0
17.5
15.6 14.5
13.9
24.0
70.5
115.5
55.8155.5
121.2
141.5
13.8
0.10.2
0.1
0.4
FY10 FY12 FY15 FY16 FY17 FY18
561.3
645.2669.9
561.4
13.1%
15.6%
0.1%
17.8%
2.0%
64.5%
25.2%
4.3%5.4%
52.0%
768.3
680.7
-11%
194.0176.4 168.0
-5%
14.1%
0.4%8.1%2.0%
75.3%
153.7
26%
-9%

21
Cathay Life – Quarterly FYP & APE
First Year Premium
(NT$BN)
Traditional life – single paidHealth, accident and othersInvestment-linked (VUL)Investment-linked (non-VUL)Interest sensitive annuity
Traditional life – regular paid
(NT$BN)
Traditional life
Health, accident and others
Investment-linked (VUL)
Investment-linked (non-VUL)
Interest sensitive annuity
Annualized FYP (APE)
Note: Annualized FYP = 10% x single-paid FYP + 20% x 2-yr-paid FYP + … + 50% x 5-yr-paid FYP + 100% x 6-yr and above payment term FYP
36.2
17.914.1
24.6
2.4
2.22.9
3.0
0.0
0.00.0
0.0
1.2
5.34.5
1.4
0.0
0.00.0
0.1
1Q16 1Q17 1Q18 1Q19
37.5
20.5 19.6
31.9
0.6
1.0 1.1
11.7 2.4
2.2 2.9
3.0 0.1
0.0 0.0
0.0 11.6 52.7
44.3 13.4 0.0
0.0
0.0
0.7
1Q16 1Q17 1Q18 1Q19
10.4%
25.3
-15%
21.4
29.10.3%
84.4%
4.8%0.1%
36%
39.8-36%
0.1%5.0%
19.2%
1.2%
67.9
60.7
52.5%
22.0%
-11%
76.5 -11%
52.1
47%
22
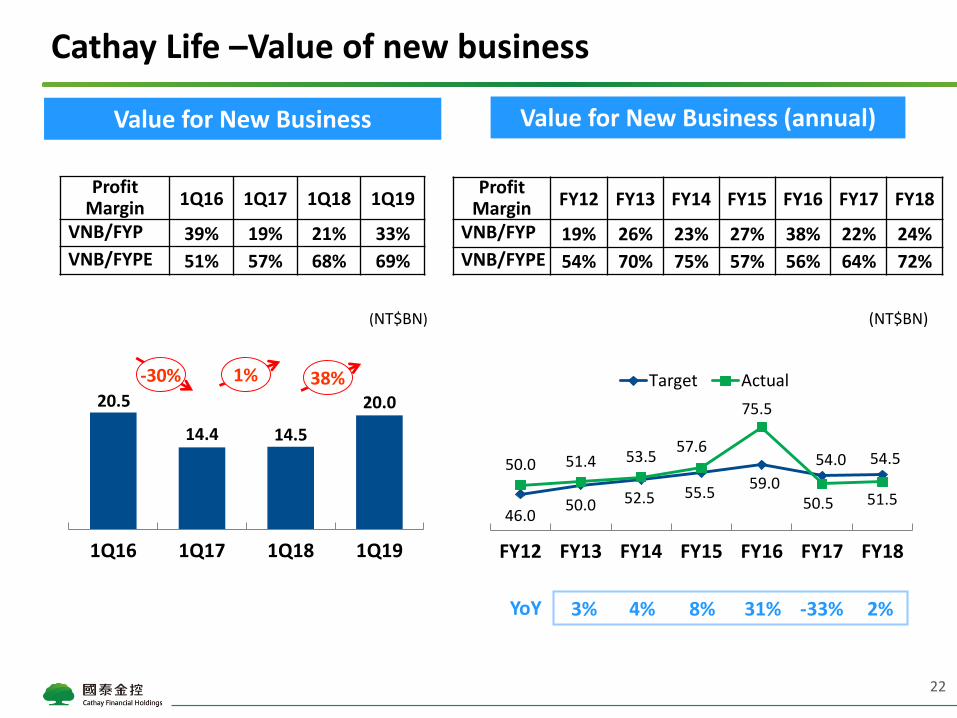
Cathay Life –Value of new business
Value for New Business Value for New Business (annual)
(NT$BN)
Profit Margin FY12 FY13 FY14 FY15 FY16 FY17 FY18
VNB/FYP 19% 26% 23% 27% 38% 22% 24%
VNB/FYPE 54% 70% 75% 57% 56% 64% 72%
Profit Margin 1Q16 1Q17 1Q18 1Q19
VNB/FYP 39% 19% 21% 33%
VNB/FYPE 51% 57% 68% 69%
YoY 8% 31%4% -33% 2%3%
46.0 50.0 52.5 55.5
59.0
54.0 54.550.0 51.4 53.5 57.6
75.5
50.5 51.5
FY12 FY13 FY14 FY15 FY16 FY17 FY18
Target Actual20.5
14.4 14.5
20.0
1Q16 1Q17 1Q18 1Q19
-30% 1% 38%
(NT$BN)
23
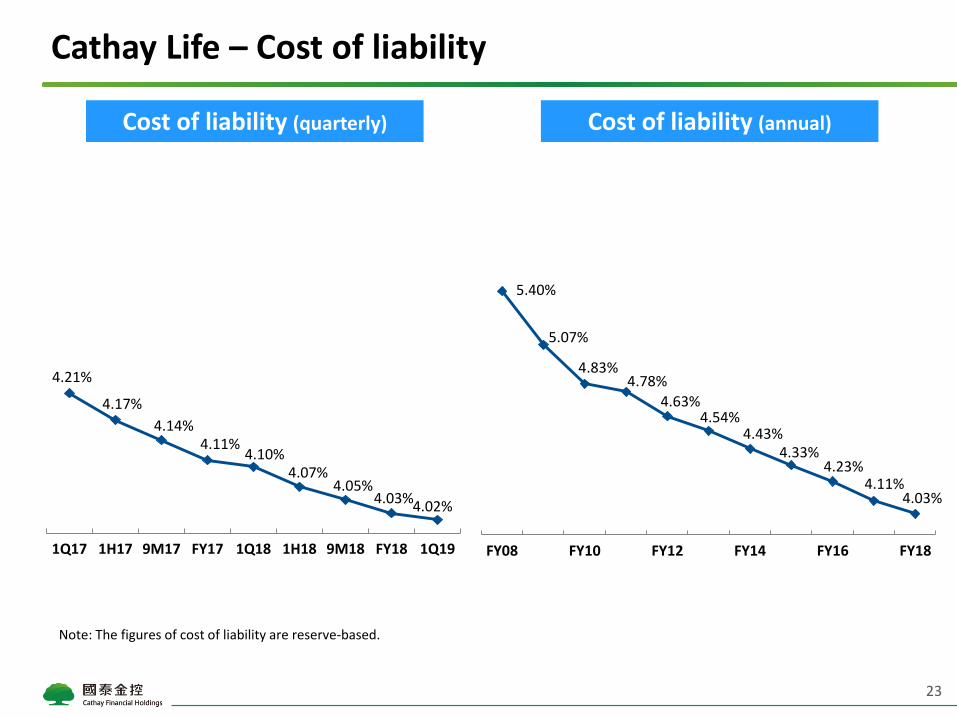
Cathay Life – Cost of liability
Note: The figures of cost of liability are reserve-based.
Cost of liability (annual)Cost of liability (quarterly)
5.40%
5.07%
4.83%4.78%
4.63%4.54%
4.43%4.33%
4.23%4.11%
4.03%
FY08 FY10 FY12 FY14 FY16 FY18
4.21%
4.17%
4.14%4.11%
4.10%4.07%
4.05%4.03%
4.02%
1Q17 1H17 9M17 FY17 1Q18 1H18 9M18 FY18 1Q19

24
Cathay Life – Investment portfolio
(NT$BN) FY16 FY17 FY18 1Q19
Total investments(1) 5,001.1 5,502.6 5,761.0 5,985.9
Weight Weight Weight Amount Return Weight Amount Return
Cash & Cash equivalents 1.3% 1.6% 1.1% 61 0.6% 1.9% 112 0.5%
Equity- Domestic 7.9% 8.4% 7.5% 431 9.6% 7.3% 434 3.5%
Equity- International(2)
6.4% 6.3% 6.7% 388 8.7% 6.4% 384 9.2%
Bond- Domestic 6.5% 5.5% 5.0% 287 3.6% 5.3% 319 6.3%
Bond- International(1)(2)
53.8% 55.7% 58.6% 3,374 4.6% 59.1% 3,535 4.9%
Mortgage & Secured loans
8.9% 8.1% 7.1% 411 2.0% 6.6% 392 2.2%
Policy loans 3.3% 3.0% 3.0% 170 5.8% 2.8% 168 5.5%
Real estate 9.8% 9.2% 8.7% 501 2.3% 8.6% 512 2.7%
Others 2.2% 2.4% 2.4% 140 2.1% 128
Note: (1) Total assets excluded separate account assets; international bond includes foreign currency deposit and related adjustments(2) Yields of international equity and international bond are pre-hedge investment yields.
25
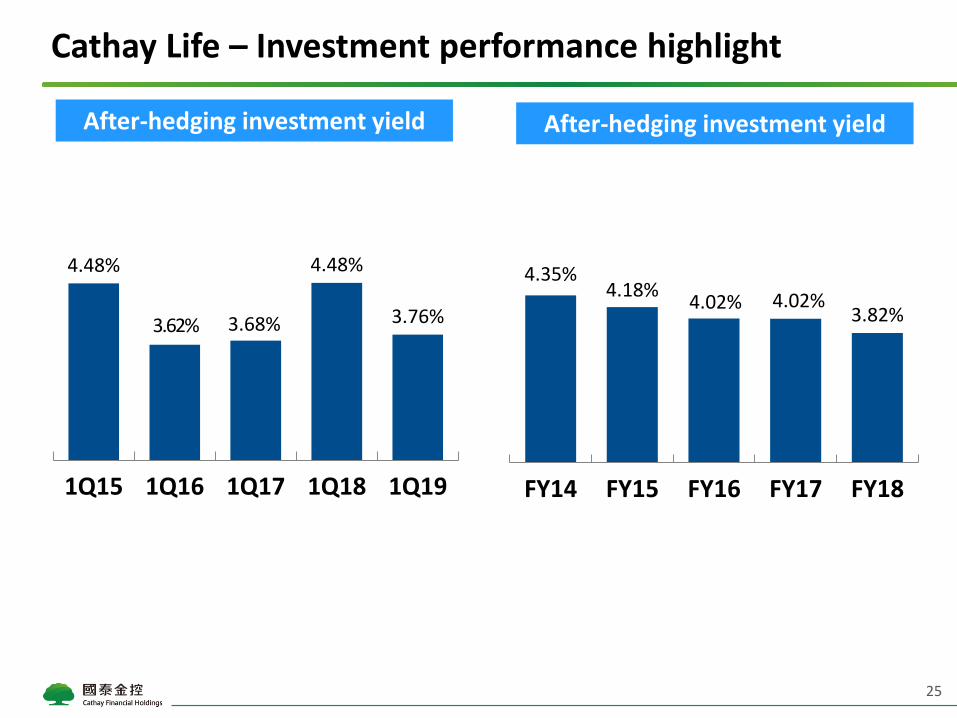
Cathay Life – Investment performance highlight
After-hedging investment yield After-hedging investment yield
FVOCI &
FVTPL (overlay)
4.35%4.18%
4.02% 4.02%3.82%
FY14 FY15 FY16 FY17 FY18
4.48%
3.62% 3.68%
4.48%
3.76%
1Q15 1Q16 1Q17 1Q18 1Q19

58%
15%
27%
26
Cathay Life – Investment performance highlight
Note: Pre-hedging recurring income doesn’t include capital gains but rental, interest revenue and cash dividend.
Pre-hedging recurring yield Pre-hedging recurring yield
Currency hedging structure
FX assetNT$4.00TR
FX risk exposure
70%
FX policy30%
1Q19 Hedging cost 1.32%
3.17% 3.28% 3.39% 3.35% 3.50%
FY14 FY15 FY16 FY17 FY18
Proxy& Open
Currency Swap & NDF
FVOCI & FVTPL (overlay)
2.84% 3.02% 2.98% 2.86%3.34%
1Q15 1Q16 1Q17 1Q18 1Q19

27
(NT$BN)
Note: Exclude overseas deposit.
Cathay Life – Cash dividend income &Overseas fixed income by region
Cash dividend income Overseas fixed income by region
Asia PacificEuropeNorth America
Others
20.3
22.623.7 24.2
FY15 FY16 FY17 FY18
44% 43% 44% 43%
19% 18% 20% 21%
22% 22% 22% 22%
15% 17% 14% 14%
FY16 FY17 FY18 1Q19

28
Cathay Life – Book value & Unrealized G/L of financial assets
(NT$BN) (NT$BN)
FVOCI & FVTPL (overlay approach)
AFS financial assets
Book value Unrealized G/L of financial assets
FY18
3.2
51.6
-73.1
39.9
FY16 FY17 1Q19FY18
364.0
441.2
362.1
482.1
FY16 FY17 FY18 1Q19

29
Cathay Life – Distribution channel
Tied agents
Bancassurance-CUBOthers
First Year Premium Annualized FYP (APE)
71.8%60.0%
24.0%34.8%
4.2% 5.3%
1Q18 1Q19
82.2% 83.9%
15.9% 14.5%1.9% 1.6%
1Q18 1Q19

30
Cathay Life – Operational indicators
Persistency ratio Expense ratio
1Q18 1Q19
98.4%
94.5%
98.0%
95.6%
13 months 25 months
10.3%11.0%
1Q18 1Q19

1Q19 Business Overview
Overseas Expansion
Business Performance Summary
Cathay United BankCathay LifeCathay Century
Cathay Life Embedded Value & Appraisal Value Impact of IFRS 17 Appendix
31
Agenda

Premium income
32
Cathay Century – Premium income
(NT$BN)
AutoFireMarineEngineeringOthers
Premium income (annual)
(NT$BN)
Market share
Retention
13.1% 13.0%
76.2% 77.1%
13.6%
75.7%
13.3%
74.9%
21.620.7
19.0
6%22.9
14.6%
16.3%
4.3%
62.2%60.1%
9.5%
15.6%
11.4%
3.4%2.6%
5.75.3
7%
12.5%
17.6%
3.1%
63.7% 61.1%
9.4%
13.3%
13.1%
3.1%3.2%
11.8%
78.5%
11.8%
79.4%
Distribution channel
33
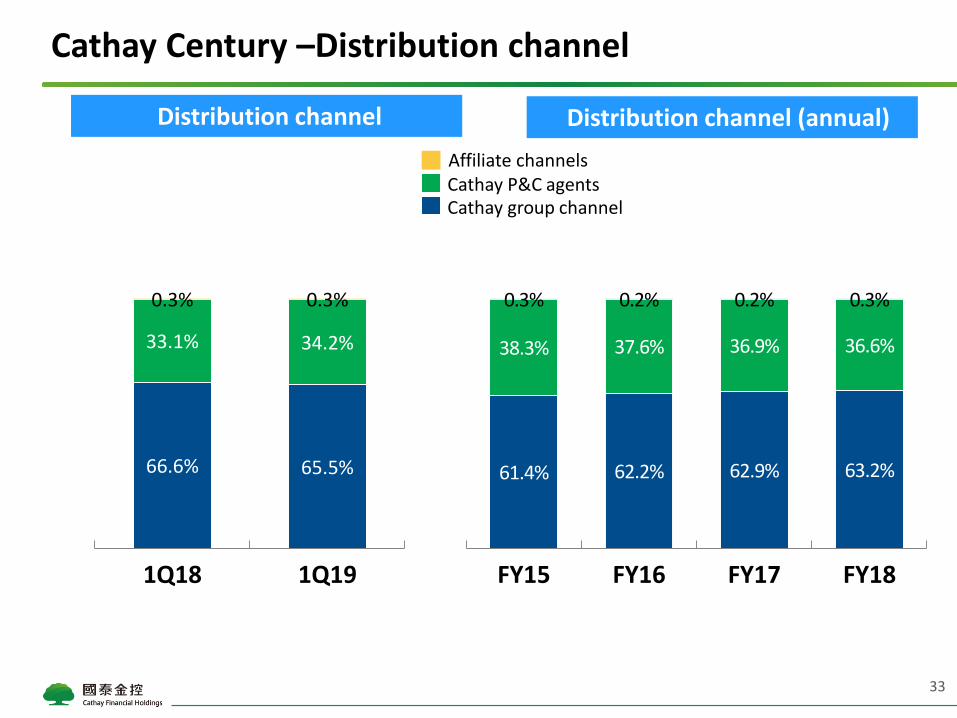
Cathay Century –Distribution channel
Distribution channel (annual)
Cathay P&C agentsCathay group channel
Affiliate channels
66.6% 65.5%
33.1% 34.2%
0.3% 0.3%
1Q18 1Q19
61.4% 62.2% 62.9% 63.2%
38.3% 37.6% 36.9% 36.6%
0.3% 0.2% 0.2% 0.3%
FY15 FY16 FY17 FY18

34
Cathay Century – Combined ratio
Gross combined ratio Retained combined ratio
Retained expense ratioRetained loss ratio
Gross expense ratioGross loss ratio
49.2% 50.3%
30.8% 31.5%
FY17 FY18
47.2% 51.7%
32.2% 31.9%
1Q18 1Q19
55.8% 57.4%
35.1% 34.8%
FY17 FY18
57.4% 57.1%
34.7% 34.3%
1Q18 1Q19
92.2%90.9%
81.8%80.0%
91.4%92.1%
83.6%79.4%

1Q19 Business Overview
Overseas Expansion
Business Performance Summary
Cathay United BankCathay LifeCathay Century
Cathay Life Embedded Value & Appraisal Value Impact of IFRS 17 Appendix
35
Agenda

Embedded Value & Appraisal Value
36
NT$BN, except for per share figures
Valuation date 2017/12/31 2018/12/31
In-force business investment yield
3.92% ~ Year 2037 5.05%for NTD policies
4.67% ~ Year 2037 5.82%for USD policies
(Equivalent investment yield: 4.43%Rolling over to 2018: 4.51%)
3.95% ~ Year 2038 5.00%for NTD policies
4.64% ~ Year 2038 5.78%for USD policies
(Equivalent investment yield: 4.38%)
Risk discount rate 10% 10%Adjusted net worth 464 387
Value of in-force business 670 722Cost of capital (CoC) -190 -210
Value of in-force business (After CoC) 480 512Embedded Value (EV) 944 898
EV / per share 164.8(75.1) 156.9(71.5)
Future one year’s new businessinvestment yield
2.91%~ Year 2037 4.91%for NTD policies
4.22% ~ Year 2037 5.84%for USD policies
3.13%~ Year 2038 4.86%for NTD policies
4.66% ~ Year 2038 5.79%for USD policies
Value of future one year’snew business (After CoC) 54.5 52.0
Appraisal Value (AV) 1,416 1,351AV / per share 247.3(112.7) 235.9(107.5)
Note: (1) EV/AV calculation does not include business of Cathay Life in China and Vietnam.(2) per share = per share of Cathay Life; (per share) = per share of Cathay FHC(3) The outstanding shares of Cathay Life and Cathay FHC are 5.7bn and 12.6bn, respectively. (The outstanding shares of Cathay Life in 2017
reflects capital injection in June 2018.) (4) May not sum to total due to rounding.

Investment return assumptions for the value of in force business of NTD-denominated policies as of the
end of 2017 & 2018.
Investment return assumptions for the value of in force business of USD-denominated policies as of the
end of 2017 & 2018.
Economic Assumptions:In-force business investment yield
37

38
Economic Assumptions:Future one year’s new business investment yield Investment return assumptions for the value of future one year’s new business of NTD-denominated
policies as of the end of 2017 & 2018.
Investment return assumptions for the value of future one year’s new business of USD-denominated
policies as of the end of 2017 & 2018.
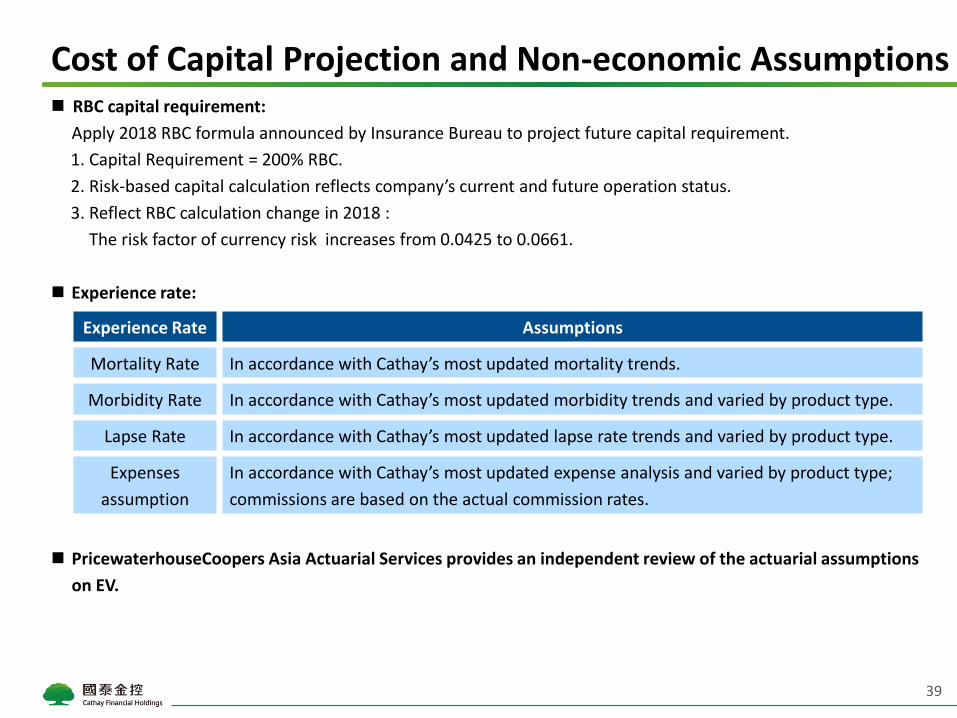
Cost of Capital Projection and Non-economic Assumptions
39
RBC capital requirement:
Apply 2018 RBC formula announced by Insurance Bureau to project future capital requirement.
1. Capital Requirement = 200% RBC.
2. Risk-based capital calculation reflects company’s current and future operation status.
3. Reflect RBC calculation change in 2018 :
The risk factor of currency risk increases from 0.0425 to 0.0661.
Experience rate:
PricewaterhouseCoopers Asia Actuarial Services provides an independent review of the actuarial assumptions
on EV.
Experience Rate Assumptions
Mortality Rate In accordance with Cathay’s most updated mortality trends.
Morbidity Rate In accordance with Cathay’s most updated morbidity trends and varied by product type.
Lapse Rate In accordance with Cathay’s most updated lapse rate trends and varied by product type.
Expenses
assumption
In accordance with Cathay’s most updated expense analysis and varied by product type;
commissions are based on the actual commission rates.

Analysis of change in Adjusted Net Worth (ANW)
40
(NT$BN)
(1)
Note:(1) Others mainly include effects on retrospective application and restatement of IFRS 9.

Analysis of change in value of in-force business (VIF)
41
The value of one year new business (after CoC) of 2018 is 51.5 billion.
(NT$BN)

Analysis of change in value of one year’s new business (V1NB)
42
(NT$BN)

Sensitivity Analysis
43
NT$BN, except for per share figures
Note: (1) “Investment yield +0.25% (capped)” : the investment return is capped by 5.00% for NTD policies and 5.78% for USD policies.
(2) May not sum to total due to rounding.
Valuation date 2018/12/31
AssumptionInvestment
yield - 0.25%
Investmentyield
+ 0.25%
Investmentyield + 0.25%
(capped)(1)
Base CaseDiscount
rate – 0.5%Discount
rate + 0.5%
Adjusted net worth 387 387 387 387 387 387
Value of in-force business 592 852 794 722 768 680
Cost of capital (CoC) -220 -201 -205 -210 -202 -218
Value of in-force business
(After CoC)371 651 589 512 566 462
Embedded Value 758 1,038 976 898 953 849
EV / per share132.4 181.3 170.4 156.9 166.4 148.3(60.4) (82.6) (77.7) (71.5) (75.9) (67.6)
Appraisal Value 1,170 1,530 1,446 1,351 1,449 1,263
Value of future one year’s
new business (After CoC)45.9 58.2 54.4 52.0 56.3 48.1
AV / per share204.4 267.2 252.4 235.9 253.0 220.6(93.2) (121.8) (115.1) (107.5) (115.3) (100.6)

YoY Comparison
44
Valuation date 2017/12/31 2018/12/31
Embedded Value 899~994 849~953
Value of future oneyear’s new business
50.7~58.7 48.1~56.3
Appraisal Value 1,347~1,493 1,263~1,449
Under the different discount rate assumption (9.5%~10.5%), the results of the Year 2017 & 2018 go as follows.
(NT$BN)

Summary
45
Valuation date 2017 2018 Growth rate 1Q19
Embedded
value
Equity 436 357 -18% --
Adjusted net worth 464 387 -17% --
Value of in-force business(before CoC) 670 722 8% --
Cost of capital (CoC) -190 -210 11% --
Value in-force business (after CoC) 480 512 7% --
Embedded value 944 898 -5% --
Value of one
year’s new
business
First year premium (FYP) 233.2 211.6 -9% 60.7
First year premium equivalent (FYPE) 78.6 71.4 -9% 29.1
Value of one year’s new business (V1NB) 50.5 51.5 2% 20.0
Profit margin (V1NB/FYP) 22% 24% -- 33%
Profit margin (V1NB/FYPE) 64% 72% -- 69%
Profit margin (V1NB/FYP)(investment-
linked(non-VUL)is excluded)57% 52% -- 41%
Appraisal value
(20 years NB)
Multiple 8.7 8.7 -- --
Appraisal value 1,416 1,351 -5% --
Basic Value
per share
EV / per share of Cathay FHC 75.1 71.5 -5% --
AV / per share of Cathay FHC 112.7 107.5 -5% --
NT$BN, except for per share figures
Note: (1) Basic EV and AV per share is based on weighted average of outstanding shares 12.6bn.(2) Totals may not sum due to rounding.

1Q19 Business Overview
Overseas Expansion
Business Performance Summary
Cathay United BankCathay LifeCathay Century
Cathay Life Embedded Value & Appraisal Value Impact of IFRS 17 Appendix
46
Agenda
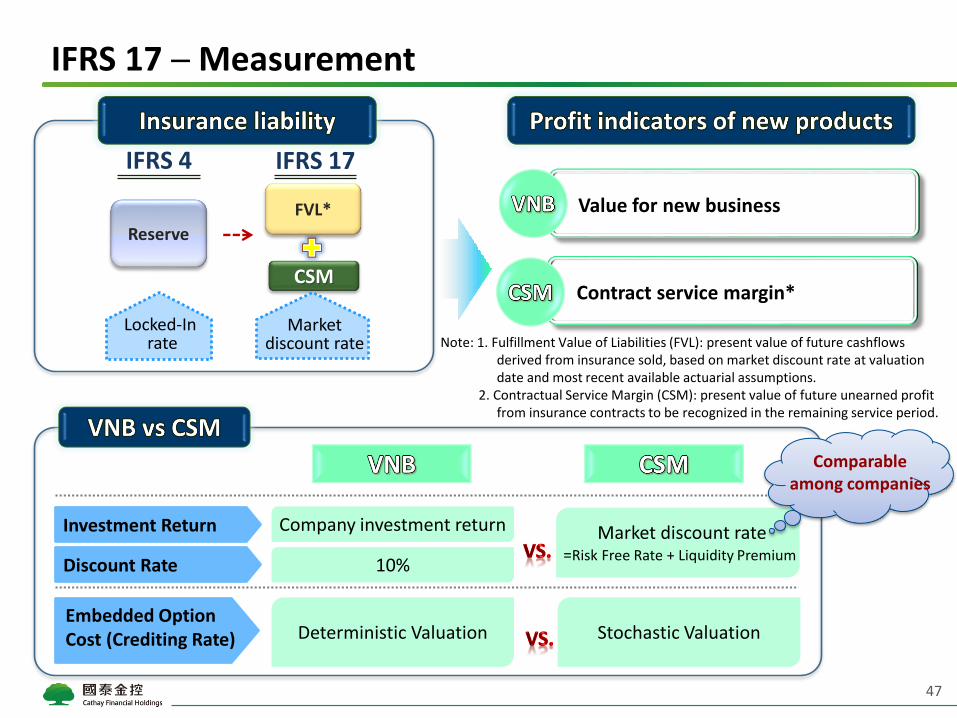
IFRS 17 ─ Measurement
47
Value for new business
Contract service margin*
Note: 1. Fulfillment Value of Liabilities (FVL): present value of future cashflows derived from insurance sold, based on market discount rate at valuation date and most recent available actuarial assumptions.
2. Contractual Service Margin (CSM): present value of future unearned profit from insurance contracts to be recognized in the remaining service period.
Investment Return
Comparable among companies
Embedded Option Cost (Crediting Rate)
Discount Rate
Reserve
Locked-Inrate
CSM
IFRS 4 IFRS 17
FVL*
Market discount rate

IFRS 17 – Adoption date
48
Retrospect IFRS17 to policy underwriting date. This
requires full historic data throughout adoption date
Retrospective Approach
The impact of legacy book can be offset by
new book
Fair Value Approach
Use reasonable and supportable
information to derive similar results to
Retrospective Approach
Modified Retrospective Approach
Apply “Modified Retrospective “ or “Fair Value” Approach
If Impracticable
Note: Legacy book - contracts with guaranteed rates ≥ 4%
Note: New book - contracts with guaranteed rates <4%

Example ─ Learning from the case
IFRS 17 implementation changes the measurement of insurance liability. It does not affect the value of insurance contracts but affects the timing of profit recognition for insurance services.
Insurers need to mark to market both assets and liabilities.
It may increase the volatility of shareholders’ equity, hence asset-liability management expertise is critical.
49

50
IFRS 17 impact & preparation
Capital plan
Value-driven product strategy CSM-focused products
The impact from legacy book is fully reflected on adoption date Reduce the interest expense of insurance liability thereafter
12
3
Cathay
Competitor
Capital market volatility and IFRS 17 adoption
Build adequate capital buffer Early preparation ahead of the industry
Protection products with superior CSM margin (CSM/FYP) Savings products with positive CSM
Better risk-pricing disciplines among competitors restore industry profit margins Strong ALM expertise is critical for achieving stable financial performance
Healthier Industry development
Benefiting from IFRS 17

1Q19 Business Overview
Overseas Expansion
Business Performance Summary
Cathay United BankCathay LifeCathay Century
Cathay Life Embedded Value & Appraisal Value Impact of IFRS 17 Appendix
51
Agenda

304.6 304.8 309.5 291.7
FY15 FY16 FY17 FY18
12.0 10.7 11.7 11.8
4.43.5
4.2 3.1
FY15 FY16 FY17 FY18
52
Capital adequacy
Cathay Life RBC (%)
CUB Capital Adequacy (%)
Cathay FHC CAR (%)
Tier2
Tier1
BIS 16.4 14.2 15.015.9
151.0 146.3
141.1
127.1
FY15 FY16 FY17 FY18

1.3
2.4
3.9
4.6
3.8
4.5
4.0
6.8%
10.9%
12.1%
12.9%
9.7%10.0%
8.8%
0.0%
2.0%
4.0%
6.0%
8.0%
10.0%
12.0%
14.0%
16.0%
-
0.5
1.0
1.5
2.0
2.5
3.0
3.5
4.0
4.5
FY12 FY13 FY14 FY15 FY16 FY17 FY18
EPS ROE
82%50%
36% 32% 36% 35% 41%
16%53%
64% 66% 63% 64% 58%
FY12 FY13 FY14 FY15 FY16 FY17 FY18
CUB Cathay Life
13.3 14.6 17.8 18.8 17.5 19.7 21.32.5
15.4
31.738.4
30.236.3 30.3
FY12 FY13 FY14 FY15 FY16 FY17 FY18
CUB Cathay Life
Cathay FHC continued to deliver solid earnings
53
Profit contributionEPS & ROE
Note: (1) FY13 figures do not reflect the impact from applying fair value method on investment property.
(2) Since Cathay FHC has more subsidiaries other than Cathay Life and CUB, besides, due to affiliate transactions, the Cathay FHC net income might not equal to the sum of Cathay Life and CUB’s.
(3) EPS has been adjusted for stock dividend (stock split).
(NT$/%) (NT$BN)
FHC 16.2 29.0 49.6 57.9 48.0 56.7 51.8
Life 2.5 15.4 31.7 38.4 30.2 36.3 30.3
CUB 13.3 14.6 17.8 18.8 17.5 19.7 21.3

IG, 96%
Non-IG, 4%
USD, 94%
CNH, 2%
AUD, 2%
VND, 0.4% Euro, 0.6%
Others, 1%
54
Cathay Life – Overseas bond breakdown by currency and rating
Overseas bond by currency (1Q19) Overseas bond by rating (1Q19)
Fully hedged to
USD
55
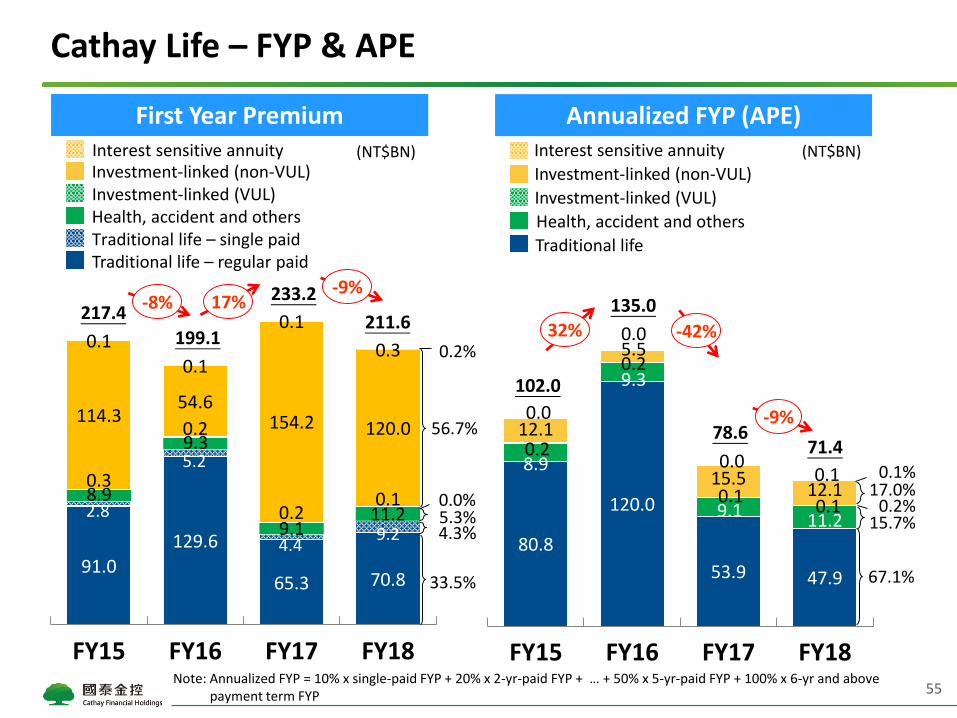
Cathay Life – FYP & APE
First Year Premium
(NT$BN)
Traditional life – single paidHealth, accident and othersInvestment-linked (VUL)Investment-linked (non-VUL)Interest sensitive annuity
Traditional life – regular paid
(NT$BN)
Traditional life
Health, accident and others
Investment-linked (VUL)
Investment-linked (non-VUL)
Interest sensitive annuity
Annualized FYP (APE)
Note: Annualized FYP = 10% x single-paid FYP + 20% x 2-yr-paid FYP + … + 50% x 5-yr-paid FYP + 100% x 6-yr and above payment term FYP
80.8
120.0
53.9 47.9
8.9
9.3
9.1 11.2
0.2
0.2
0.10.1
12.1
5.5
15.512.1
0.0
0.0
0.00.1
FY15 FY16 FY17 FY18
91.0
129.6
65.3 70.8
2.8
5.2
4.4 9.2
8.9
9.3
9.1 11.2
0.3
0.2
0.2 0.1
114.3 54.6
154.2 120.0
0.1
0.1
0.1
0.3
FY15 FY16 FY17 FY18
15.7%
135.0
-42%
78.671.4
0.1%
67.1%
17.0%0.2%
-9%
102.0
32%
0.0%5.3%4.3%
0.2%
233.2
211.6
33.5%
56.7%
-9%
199.1
17%217.4
-8%

Cathay Financial Holdings FY18/ 1Q19/
(NT$MN) FY17 1Q18
Income Statement Data (Consolidated) FY16 FY17 FY18 % Chg 1Q18 1Q19 % Chg
Operating Income
Net interest income 153,478 168,461 180,628 7% 41,104 48,506 18%
Net commission and fee (8,050) 1,070 2,883 170% 978 (1,855) -290%
Net earned premium 622,916 624,617 576,811 -8% 136,368 159,865 17%
Change in liability reserve (408,614) (445,833) (334,122) -25% (79,909) (87,353) -9%
Net claims payment (308,697) (295,503) (368,656) 25% (89,750) (102,420) -14%
Investment income 37,782 62,065 82,634 33% 31,162 22,015 -29%
Contribution from associates-equity method 1,202 1,298 1,004 -23% 67 284 326%
Other net non-interest income 40,606 22,446 (1,378) -106% 1,215 (1,309) -208%
Bad debt expense (5,232) (3,460) (4,599) 33% (417) (437) -5%
Operating expense (75,207) (75,526) (79,606) 5% (19,020) (21,769) -14%
Income before taxes 50,185 59,636 55,599 -7% 21,799 15,527 -29%
Income taxes (2,145) (2,962) (3,777) 27% 1,458 (1,977) -236%
Net income 48,039 56,673 51,822 -9% 23,257 13,550 -42%
EPS (NT$) 3.79 4.47 3.95 1.84 1.05
Dividend Payout
Cash dividend per share 2.00 2.50
Stock dividend per share 0.00 0.00
Weighted average outstanding shares 12,563 12,563 12,563 12,563 12,563
(Millions of common shares)
Balance Sheet Data (Consolidated)
Total assets 8,135,137 8,841,510 9,224,484 8,961,966 9,542,838
Total shareholders' equity 529,824 608,471 529,289 608,892 661,118
Operating Metrics
ROAE (Consolidated) 9.70% 9.96% 8.83% 14.85% 9.11%
ROAA (Consolidated) 0.61% 0.67% 0.57% 1.04% 0.58%
Double leverage ratio(inc. preferred stock) 105% 108% 112% 108% 110%
Capital Adequacy Metrics
Capital Adequacy Ratio 146% 141% 127%
Notes:
(1) All data and information on this page is provided for informational purposes only, and may subject to adjustment.
For more details, please refer to our official financial reports.
(2) Total may not sum due to rounding.
(3) Starting from 2018/1/1, Cathay FHC adopted IFRS9. The comparative information for prior periods was not restated.
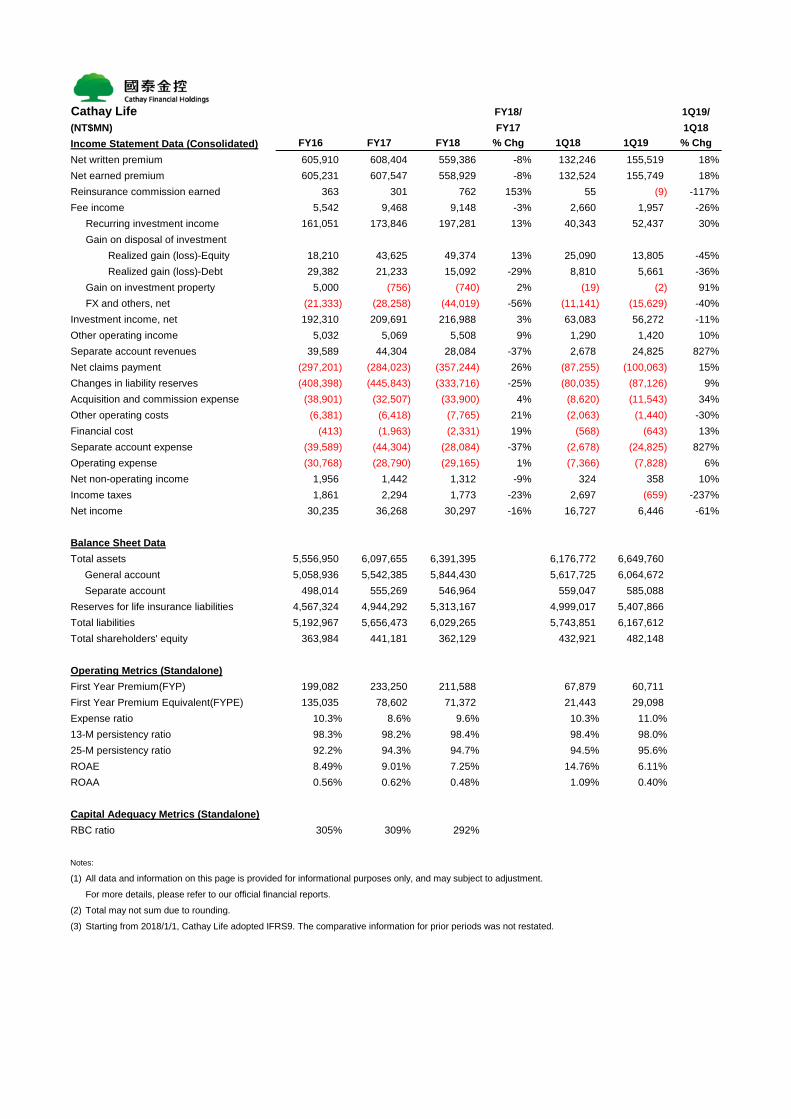
Cathay Life FY18/ 1Q19/
(NT$MN) FY17 1Q18
Income Statement Data (Consolidated) FY16 FY17 FY18 % Chg 1Q18 1Q19 % Chg
Net written premium 605,910 608,404 559,386 -8% 132,246 155,519 18%
Net earned premium 605,231 607,547 558,929 -8% 132,524 155,749 18%
Reinsurance commission earned 363 301 762 153% 55 (9) -117%
Fee income 5,542 9,468 9,148 -3% 2,660 1,957 -26%
Recurring investment income 161,051 173,846 197,281 13% 40,343 52,437 30%
Gain on disposal of investment
Realized gain (loss)-Equity 18,210 43,625 49,374 13% 25,090 13,805 -45%
Realized gain (loss)-Debt 29,382 21,233 15,092 -29% 8,810 5,661 -36%
Gain on investment property 5,000 (756) (740) 2% (19) (2) 91%
FX and others, net (21,333) (28,258) (44,019) -56% (11,141) (15,629) -40%
Investment income, net 192,310 209,691 216,988 3% 63,083 56,272 -11%
Other operating income 5,032 5,069 5,508 9% 1,290 1,420 10%
Separate account revenues 39,589 44,304 28,084 -37% 2,678 24,825 827%
Net claims payment (297,201) (284,023) (357,244) 26% (87,255) (100,063) 15%
Changes in liability reserves (408,398) (445,843) (333,716) -25% (80,035) (87,126) 9%
Acquisition and commission expense (38,901) (32,507) (33,900) 4% (8,620) (11,543) 34%
Other operating costs (6,381) (6,418) (7,765) 21% (2,063) (1,440) -30%
Financial cost (413) (1,963) (2,331) 19% (568) (643) 13%
Separate account expense (39,589) (44,304) (28,084) -37% (2,678) (24,825) 827%
Operating expense (30,768) (28,790) (29,165) 1% (7,366) (7,828) 6%
Net non-operating income 1,956 1,442 1,312 -9% 324 358 10%
Income taxes 1,861 2,294 1,773 -23% 2,697 (659) -237%
Net income 30,235 36,268 30,297 -16% 16,727 6,446 -61%
Balance Sheet Data
Total assets 5,556,950 6,097,655 6,391,395 6,176,772 6,649,760
General account 5,058,936 5,542,385 5,844,430 5,617,725 6,064,672
Separate account 498,014 555,269 546,964 559,047 585,088
Reserves for life insurance liabilities 4,567,324 4,944,292 5,313,167 4,999,017 5,407,866
Total liabilities 5,192,967 5,656,473 6,029,265 5,743,851 6,167,612
Total shareholders' equity 363,984 441,181 362,129 432,921 482,148
Operating Metrics (Standalone)
First Year Premium(FYP) 199,082 233,250 211,588 67,879 60,711
First Year Premium Equivalent(FYPE) 135,035 78,602 71,372 21,443 29,098
Expense ratio 10.3% 8.6% 9.6% 10.3% 11.0%
13-M persistency ratio 98.3% 98.2% 98.4% 98.4% 98.0%
25-M persistency ratio 92.2% 94.3% 94.7% 94.5% 95.6%
ROAE 8.49% 9.01% 7.25% 14.76% 6.11%
ROAA 0.56% 0.62% 0.48% 1.09% 0.40%
Capital Adequacy Metrics (Standalone)
RBC ratio 305% 309% 292%
Notes:
(1) All data and information on this page is provided for informational purposes only, and may subject to adjustment.
For more details, please refer to our official financial reports.
(2) Total may not sum due to rounding.
(3) Starting from 2018/1/1, Cathay Life adopted IFRS9. The comparative information for prior periods was not restated.
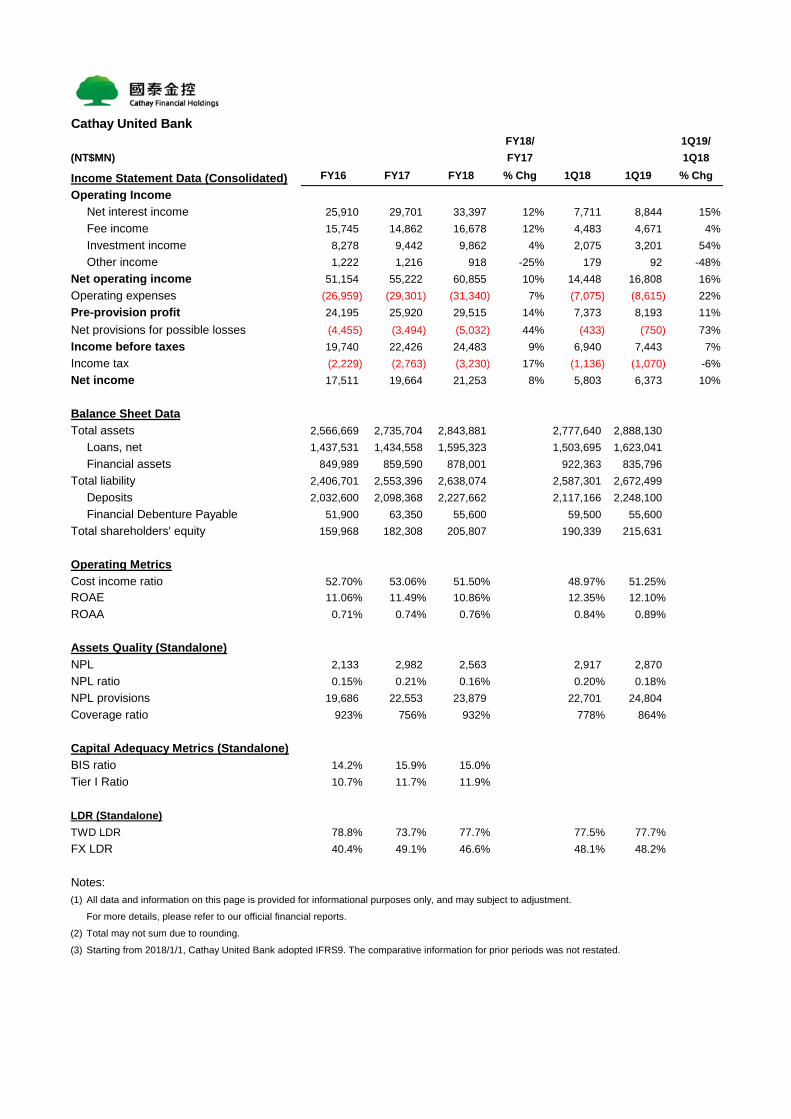
Cathay United Bank
FY18/ 1Q19/
(NT$MN) FY17 1Q18
Income Statement Data (Consolidated) FY16 FY17 FY18 % Chg 1Q18 1Q19 % Chg
Operating Income
Net interest income 25,910 29,701 33,397 12% 7,711 8,844 15%
Fee income 15,745 14,862 16,678 12% 4,483 4,671 4%
Investment income 8,278 9,442 9,862 4% 2,075 3,201 54%
Other income 1,222 1,216 918 -25% 179 92 -48%
Net operating income 51,154 55,222 60,855 10% 14,448 16,808 16%
Operating expenses (26,959) (29,301) (31,340) 7% (7,075) (8,615) 22%
Pre-provision profit 24,195 25,920 29,515 14% 7,373 8,193 11%
Net provisions for possible losses (4,455) (3,494) (5,032) 44% (433) (750) 73%
Income before taxes 19,740 22,426 24,483 9% 6,940 7,443 7%
Income tax (2,229) (2,763) (3,230) 17% (1,136) (1,070) -6%
Net income 17,511 19,664 21,253 8% 5,803 6,373 10%
Balance Sheet Data
Total assets 2,566,669 2,735,704 2,843,881 2,777,640 2,888,130
Loans, net 1,437,531 1,434,558 1,595,323 1,503,695 1,623,041
Financial assets 849,989 859,590 878,001 922,363 835,796
Total liability 2,406,701 2,553,396 2,638,074 2,587,301 2,672,499
Deposits 2,032,600 2,098,368 2,227,662 2,117,166 2,248,100
Financial Debenture Payable 51,900 63,350 55,600 59,500 55,600
Total shareholders' equity 159,968 182,308 205,807 190,339 215,631
Operating Metrics
Cost income ratio 52.70% 53.06% 51.50% 48.97% 51.25%
ROAE 11.06% 11.49% 10.86% 12.35% 12.10%
ROAA 0.71% 0.74% 0.76% 0.84% 0.89%
Assets Quality (Standalone)
NPL 2,133 2,982 2,563 2,917 2,870
NPL ratio 0.15% 0.21% 0.16% 0.20% 0.18%
NPL provisions 19,686 22,553 23,879 22,701 24,804
Coverage ratio 923% 756% 932% 778% 864%
Capital Adequacy Metrics (Standalone)
BIS ratio 14.2% 15.9% 15.0%
Tier I Ratio 10.7% 11.7% 11.9%
LDR (Standalone)
TWD LDR 78.8% 73.7% 77.7% 77.5% 77.7%
FX LDR 40.4% 49.1% 46.6% 48.1% 48.2%
Notes:
(1) All data and information on this page is provided for informational purposes only, and may subject to adjustment.
For more details, please refer to our official financial reports.
(2) Total may not sum due to rounding.
(3) Starting from 2018/1/1, Cathay United Bank adopted IFRS9. The comparative information for prior periods was not restated.

Cathay Century
FY18/ 1Q19/
(NT$MM) FY17 1Q18
Income Statement Data (Consolidated) FY16 FY17 FY18 % Chg 1Q18 1Q19 % Chg
Premium income 22,774 21,878 23,186 6% 5,364 5,775 8%
Net written premium 17,390 16,610 17,797 7% 4,254 4,482 5%
Net earned premium 17,213 16,344 17,349 6% 4,153 4,456 7%
Reinsurance commission earned 526 489 556 14% 141 162 15%
Fee income 44 42 43 3% 11 11 -2%
Investment 2,082 892 640 -28% 247 205 -17%
Interest income 568 547 559 2% 134 132 -2%
Other investment income, net 1,514 345 81 -76% 112 74 -34%
Other operating income 0 0 0 0 0 0%
Net claims payment (9,559) (9,138) (9,408) 3% (2,411) (2,289) 5%
Changes in liability reserves (209) 10 (406) 4148% 125 (227) -282%
Commissions and other operating costs (3,015) (2,859) (3,043) 6% (763) (764) 0%
Operating expenses (4,248) (3,609) (3,848) 7% (907) (974) -7%
Operating income 2,834 2,170 1,883 -13% 596 579 -3%
Net non-operating income (1) (16) (24) -53% (5) 0 108%
Income taxes (492) (297) (349) 18% 109 98 -10%
Net income 2,342 1,858 1,510 -19% 483 482 0%
Balance Sheet Data
Total assets 38,250 38,351 37,956 38,171 38,749
Total stockholders' equity 9,216 10,517 10,025 10,917 10,999
Operating Metrics
Gross Combined ratio 99.3% 80.0% 81.8% 79.4% 83.6%
Net Combined ratio 93.3% 90.9% 92.2% 92.1% 91.4%
ROAE 28.50% 18.83% 14.69% 18.01% 18.34%
ROAA 5.83% 4.85% 3.96% 5.05% 5.02%
Capital Adequacy Metrics
RBC ratio (Standalone) 385% 392% 370%
Notes:
(1) All data and information on this page is provided for informational purposes only, and may subject to adjustment.
For more details, please refer to our official financial reports.
(2) Total may not sum due to rounding.
(3) Starting from 2018/1/1, Cathay Century adopted IFRS9. The comparative information for prior periods was not restated.