
2019 BASEL III PILLAR 3 DISCLOSURE - ANZ...ANZ Basel III Pillar 3 Disclosure September 2019 1....
95
2019 BASEL III PILLAR 3 DISCLOSURE AS AT SEPTEMBER 2019 APS 330: PUBLIC DISCLOSURE
Transcript of 2019 BASEL III PILLAR 3 DISCLOSURE - ANZ...ANZ Basel III Pillar 3 Disclosure September 2019 1....

2019 BASEL III PILLAR 3 DISCLOSURE
AS AT SEPTEMBER 2019
APS 330: PUBLIC DISCLOSURE

ANZ Basel III Pillar 3 Disclosure September 2019
1
Important notice This document has been prepared by Australia and New Zealand Banking Group Limited (ANZ) to meet its disclosure obligations under the Australian P r ud e n t i a l Regulation Authority (APRA) ADI Prudential Standard (APS) 330: Public Disclosure.

ANZ Basel III Pillar 3 Disclosure September 2019
2
Table of Contents1 Chapter 1 – Introduction ............................................................................................................................... 3 Purpose of this document .................................................................................................................. 3 Chapter 2 - Risk appetite and governance ...................................................................................................... 4 Risk types ...................................................................................................................................... 4 Risk appetite framework ................................................................................................................... 5 Risk management governance ........................................................................................................... 5 Chapter 3 – Capital reporting and measurement .............................................................................................. 7 Chapter 4 – Capital and capital adequacy ........................................................................................................ 8 Table 1 Capital disclosure template ................................................................................................ 9 Table 2 Main features of capital instruments ..................................................................................19 Table 6 Capital adequacy .............................................................................................................19 Chapter 5 – Credit risk .................................................................................................................................23 Table 7 Credit risk – General disclosures........................................................................................23 Table 8 Credit risk – Disclosures for portfolios subject to the Standardised approach and supervisory risk weights in the IRB approach ......................................................................40 Table 9 Credit risk – Disclosures for portfolios subject to Advanced IRB approaches ............................41 Table 10 Credit risk mitigation disclosures .......................................................................................51 Table 11 General disclosures for derivative and counterparty credit risk .............................................56 Chapter 6 – Securitisation ...........................................................................................................................60 Table 12 Banking Book - Securitisation disclosures ...........................................................................63 Trading Book - Securitisation disclosures ............................................................................71 Chapter 7 – Market risk ................................................................................................................................72 Table 13 Market risk – Standard approach .......................................................................................72 Table 14 Market risk – Internal models approach ..............................................................................73 Chapter 8 - Operational risk ..........................................................................................................................77 Table 15 Operational risk ..............................................................................................................77 Chapter 9 – Equities ...................................................................................................................................81 Table 16 Equities – Disclosures for banking book positions ................................................................81 Chapter 10 – Interest Rate Risk in the Banking Book .......................................................................................83 Table 17 Interest Rate Risk in the Banking Book ..............................................................................83 Chapter 11 – Leverage and Liquidity Coverage Ratio ........................................................................................86 Table 18 Leverage Ratio ................................................................................................................86 Table 19 Summary comparison of accounting assets vs. leverage ratio exposure measure.....................87 Table 20 Liquidity Coverage Ratio disclosure template ......................................................................88 Table 21 NSFR disclosure template .................................................................................................89 Glossary .....................................................................................................................................................91
1 Each table reference adopted in this document aligns to those required by APS 330 to be disclosed at half year.

ANZ Basel III Pillar 3 Disclosure September 2019
3
Chapter 1 - Introduction
Purpose of this document This document has been prepared in accordance with the Australian Prudential Regulation Authority (APRA) ADI Prudential Standard (APS) 330: Public Disclosure. APS 330 mandates the release to the investment community and general public of information relating to capital adequacy and risk management practices. APS 330 was established to implement Pillar 3 of the Basel Committee on Banking Supervision’s framework for bank capital adequacy2. In simple terms, the Basel framework consists of three mutually reinforcing ‘Pillars’:
Pillar 1 Minimum capital requirement
Pillar 2 Supervisory review process
Pillar 3 Market discipline
Minimum capital requirements for Credit Risk, Operational Risk, Market Risk and Interest Rate Risk in the Banking Book
Firm-wide risk oversight, Internal Capital Adequacy Assessment Process (ICAAP), consideration of additional risks, capital buffers and targets and risk concentrations, etc.
Regular disclosure to the market of qualitative and quantitative aspects of risk management, capital adequacy and underlying risk metrics
APS 330 requires the publication of various levels of information on a quarterly, semi-annual and annual basis. This document is the annual disclosure.
Basel in ANZ In December 2007, ANZ received accreditation for the most advanced approaches permitted under Basel for credit risk and operational risk, complementing its accreditation for market risk. Effective January 2013, ANZ adopted APRA requirements for Basel III with respect to the measurement and monitoring of regulatory capital.
Verification of disclosures These Pillar 3 disclosures have been verified in accordance with Board approved policy, including ensuring consistency with information contained in ANZ’s Financial Report and in Pillar 1 returns provided to APRA. In addition, ANZ’s external auditor has performed an agreed upon procedure review with respect to these disclosures.
Comparison to ANZ’s Financial Reporting These disclosures have been produced in accordance with regulatory capital adequacy concepts and rules, rather than with accounting policies adopted in ANZ’s financial reports. As such, there are different areas of focus and measures in some common areas of disclosures. These differences are most pronounced in the credit risk disclosures, for instance: • The principal method for measuring the amount at risk is Exposure at Default (EAD), which is the estimated
amount of exposure likely to be owed on a credit obligation at the time of default. Under the Advanced Internal Ratings Based (AIRB) approach in APS 113 Capital Adequacy: Internal Ratings-based Approach to Credit Risk, banks are accredited to provide their own estimates of EAD for all exposures (drawn, commitments or contingents) reflecting the current balance as well as the likelihood of additional drawings prior to default.
• Loss Given Default (LGD) is an estimate of the amount of losses expected in the event of default. LGD is essentially calculated as the amount at risk (EAD) less expected net recoveries from realisation of collateral as well as any post default repayments of principal and interest.
• Most credit risk disclosures split ANZ’s portfolio into regulatory asset classes, which span different areas of ANZ’s internal divisional and business unit organisational structure.
Unless otherwise stated, all amounts are rounded to AUD millions.
2 Basel Committee on Banking Supervision, International Convergence of Capital Measurement and Capital Standards: A Revised Framework, 2004.

ANZ Basel III Pillar 3 Disclosure September 2019
4
Chapter 2 – Risk appetite and governance
Risk types: ANZ is exposed to a broad range of inter-related business risks. • Capital Adequacy risk is the risk of loss arising from the Group failing to maintain the level of capital required
by prudential regulators and other key stakeholders (shareholders, debt investors, depositors, rating agencies, etc.) to support ANZ’s consolidated operations and risk appetite.
• Compliance risk is the risk of failure to act in accordance with laws, regulations, industry standards and codes,
internal policies and procedures and principles of good governance as applicable to ANZ’s businesses. • Credit risk is the risk of financial loss resulting from a counterparty failing to fulfil its obligations or a decrease in
credit quality of a counterparty resulting in a financial loss. Credit Risk incorporates the risks associated with us lending to customers who could be impacted by climate change or by changes to laws, regulations, or other policies adopted by governments or regulatory authorities, including carbon pricing and climate change adaptation or mitigation policies.
• Equity risk is the risk of financial loss arising from the unexpected reduction in value of equity investments not
held in the trading book including those of the Group’s associates. • Insurance risk is risk of unexpected losses resulting from worse than expected claims experience, including any
of the following that expose an insurer to financial loss: inadequate or inappropriate underwriting, claims management, reserving, insurance concentrations, reinsurance management, product design and pricing.
• Market risk stems from ANZ’s trading and balance sheet activities and is the risk to the Group’s earnings arising
from changes in any interest rates, foreign exchange rates, credit spreads, volatility, and correlations or from fluctuations in bond, commodity or equity prices.
• Liquidity and Funding risk is the risk that the Group is unable to meet its payment obligations as they fall due,
including repaying depositors or maturing wholesale debt or the Group having insufficient capacity to fund increases in assets.
• Operational risk is risk of loss and/or non-compliance with laws resulting from inadequate or failed internal
processes, people and/or systems, or from external events. This definition includes legal risk, and the risk of reputation loss, or damage arising from inadequate or failed internal processes, people and systems, but excludes strategic risk.
• Reputation risk3 is defined as the risk of loss that directly or indirectly impacts earnings, capital adequacy or
value, that is caused by adverse perceptions of the Group held by any of customers, the community, shareholders, investors, regulators, or rating agencies, conduct risk associated with the Group’s employees or contractors (or both) or the social or environmental (or both) impacts of our lending decisions.
• Securitisation risk is the risk of credit related losses greater than expected due to a securitisation failing to
operate as anticipated, or of the values and risks accepted or transferred, not emerging as expected. • Strategic risk is the risk that the Group’s business strategy and strategic objectives may lead to an increase in
other key Material Risks — for example: Credit Risk, Market Risk and Operational Risk. • Technology risk is the risk of loss and/or non-compliance with laws resulting from inadequate or failed internal
processes, people and systems or from external events impacting on IT assets, including the compromise of an IT asset’s confidentiality, integrity or availability.
3 Regulatory Capital is calculated in accordance with the definition of Operational Risk outlined in APS 115 Capital Adequacy: Advanced Measurement Approaches to Operational Risk, and therefore excludes reputation risk considerations.

ANZ Basel III Pillar 3 Disclosure September 2019
5
Risk Appetite Framework ANZ's Board is ultimately responsible for ANZ’s risk management framework, which includes the Group Risk Appetite Statement (RAS). The Group RAS is the document which clearly and concisely sets out the Board’s expectations regarding the degree of risk that ANZ is prepared to accept in pursuit of its strategic objectives and business plan. The articulation of risk appetite and risk tolerances is central to the risk appetite statement. ANZ’s Group RAS conveys the following: • The degree of risk (risk appetite) that ANZ is prepared to accept in pursuit of its strategy, objectives and business
plans with consideration of its shareholders’ and customers’ best interests. • For each material risk, ANZ has set the maximum level of risk (risk tolerance) that it is willing to operate within,
expressed as a risk limit and based on its risk appetite, risk profile and capital strength. Risk tolerances translate risk appetite into operational limits for the day-to-day management of material risks, where possible.
• The process for ensuring that risk tolerances are set at an appropriate level, based on an estimate of the impact in the event that a risk tolerance is breached, and the likelihood that each material risk is realised.
• The process for monitoring compliance with each risk tolerance and for taking appropriate action in the event that it is breached; and
• The timing and process for review of the risk appetite and risk tolerances.
Risk management governance The Board is principally responsible for overseeing the establishment by Management of a sound risk management culture with an operational structure and the necessary resources to facilitate effective risk management throughout ANZ, and which in turn supports the ability of ANZ to operate consistently within its risk appetite and approves the risk appetite within which management is expected to operate and including ANZ’s risk appetite statement and risk management strategy. The Committees and their purpose are:
Risk Committee The purpose of the Risk Committee is to assist the Board of Directors in the effective discharge of its responsibilities for business, market, credit, equity and other investment, financial, operational, liquidity and reputational risk management and for the management of the Group’s compliance obligations. The Risk Committee also assists the Board by providing an objective non-executive oversight of the implementation by management of ANZ’s risk management framework and its related operation and by enabling an institution-wide view of ANZ’s current and future risk position relative to its risk appetite and capital strength. The Committee meets at least four times annually.
Audit Committee Assists the Board of Directors in reviewing: financial reporting principles and policies, controls and procedures; the effectiveness of ANZ's internal control and risk management framework; the work of Internal Audit which reports directly to the Board Audit Committee; the integrity of ANZ’s financial statements and the independent audit thereof and compliance with related legal and regulatory requirements; due diligence procedures; prudential supervision procedures and other regulatory requirements to the extent relating to financial reporting and for reviewing reports from major subsidiary audit committees. It’s also responsible for the appointment and evaluation of the external auditor. The committee meets at least four times annually.
Digital Business and Technology Committee The purpose of the Digital Business and Technology Committee is to assist the Board of Directors in the effective discharge of its responsibilities in connection with the oversight of ANZ’s information technology, digitalisation and technology-related innovation strategies. The Committee meets at least three times annually.
Human Resource Committee The Committee is responsible for, among other matters, reviewing and making recommendations to the Board with regard to the remuneration of ANZ Board Appointees and ANZ Material Risk Takers, the design of executive remuneration structures and significant incentive plans and the Group’s Remuneration Policy. It also approves the appointment and termination of ANZ Board Appointees (excluding the CEO, CRO and GGM-IA4), reviews senior executive succession plans and monitors the effectiveness of ANZ’s culture, employee engagement and diversity and inclusion programs. The Committee meets at least four times annually.
Ethics, Environment, Social and Governance Committee Amongst other matters, the Committee reviews the development of and approves all other corporate governance policies and principles applicable to ANZ and seeks to ensure an appropriate Board and Committee structure is in place. It seeks to ensure there is a robust and effective process for evaluating the performance of the Board, Board Committee and Non-Executive Directors. It also reviews, monitors and approves ANZ’s corporate sustainability objectives and provides advice to management on sustainability issues within ANZ. The Committee meets at least twice annually.
The above Committees are exclusively comprised of Non-Executive directors. Members, including the Chair are appointed by the Board and serve at the discretion of the Board and for such term or terms as the Board determines. Processes and procedures relating to the operation of each of the board committees are documented in the committee charters and in the Board Committees’ Standing Rules.
4 CRO: Chief Risk Officer; GGM-IA: Group General Manager-Internal Audit

ANZ Basel III Pillar 3 Disclosure September 2019
6
Executive Management Committees are responsible for co-ordination of risk matters for each of the areas of risk management. The Executive Management Committees most relevant to the risks described above and overall capital management at ANZ are as follows: Group Asset and Liability Committee (GALCO) GALCO is responsible for the oversight and strategic management of the ANZ’s balance sheet activities including balance sheet structure, liquidity, funding, capital management, non-traded interest rate risk, and non-traded FX risks and exposures. The Committee meets at least 4 times a year, or more frequently as required. Credit and Market Risk Committee (CMRC) CMRC is responsible for the oversight and control of credit, market, insurance and material financial risks across the ANZ Group. The Committee meets monthly, with additional meetings as required. Operational Risk Executive Committee (OREC) OREC is responsible for oversight of and monitoring Operational and Compliance Risk and the related Control Environment, setting policies and frameworks for the implementation across ANZ. The committee meets at least six times per year, with additional meetings as required. Ethics and Responsible Business Committee (ERBC) ERBC is a leadership and decision making body that exists to advance ANZ’s purpose, namely to shape a world where people and communities thrive. The Committee meets at least 4 times a year, or more frequently as required. Credit Ratings System Oversight Committee (CRSOC) CRSOC is a sub-committee of CMRC responsible for the oversight and control of the Internal Ratings System for credit risk including credit model approvals and performance monitoring. The Committee meets at least 4 times a year, or more frequently as required. Capital and Stress Testing Oversight Committee (CSTOC) CSTOC is responsible for the oversight and control of the Group’s stress testing framework, modelling and processes, economic profit methodology and framework, capital allocation framework and other capital management (apart from Group ICAAP) and portfolio measurement related recommendations. The Committee meets a minimum of three times per year, with additional meetings at the discretion of the Chair. CSTOC is a sub-committee of GALCO. Processes and procedures relating to the operation of each of the Executive Management Committees are documented in the committee charters.

ANZ Basel III Pillar 3 Disclosure September 2019
7
Chapter 3 – Capital reporting and measurement
Capital reporting and measurement To ensure that an Authorised Deposit-taking Institution (ADI) is adequately capitalised on both a standalone and group basis, APRA adopts a tiered approach to the measurement of an ADI’s capital adequacy by assessing the ADI’s financial strength at three levels: • Level 1 - being the ADI i.e. Australia and New Zealand Banking Group Limited, consolidated with APRA approved
subsidiaries, to form the ADI’s Extended Licensed Entity (ELE). • Level 2 - being the consolidated group for financial reporting purposes adjusted to exclude associates activities and
certain subsidiaries referenced under APS 001: Definitions that undertake the following business activities:
• Insurance businesses (including friendly societies and health funds). • Acting as manager, responsible entity, approved trustee, trustee or similar role in relation to funds
management. • Non-financial (commercial) operations. • Securitisation special purpose vehicles to which assets have been transferred in accordance with APRA's
requirements as set out in APS 120: Securitisation. • Level 3 – the consolidated group for financial reporting purposes. APRA is extending its prudential supervision framework to Conglomerate Groups via the Level 3 framework which will regulate a bancassurance group such as ANZ as a single economic entity with minimum capital requirements and additional monitoring of risk exposure levels. In August 2016, APRA confirmed the deferral of capital requirements for Conglomerate Groups to allow for the final capital requirements arising from FSI recommendations and from international initiatives to be determined. The non-capital components of the Level 3 framework relating to group governance, risk exposures, intragroup transactions and other risk management and compliance requirements came into effect on 1 July 2017. These have had no material impact on the Group’s capital position This Pillar 3 report is based on the Level 2 prudential structure.
Refer to Note 25 Controlled Entities of ANZ’s 2019 Annual Report for a list of all material subsidiaries and a brief description of their key activities.

ANZ Basel III Pillar 3 Disclosure September 2019
8
Chapter 4 – Capital and Capital Adequacy
Table 1 Capital Disclosure template The head of the Level 2 Group to which this prudential standard applies is Australia and New Zealand Banking Group Limited. Table 1 of this chapter consists of a Capital Disclosure template that assists users in understanding the differences between the application of the Basel III reforms in Australia and those rules as detailed in the document Basel III: A global regulatory framework for more resilient banks and banking systems, issued by the Bank for International Settlements. The information in the lines of the template has been mapped to ANZ’s Level 2 balance sheet, which adjusts for non-consolidated subsidiaries as required under APS 001: Definitions. Where this information cannot be mapped on a one to one basis, it is provided in an explanatory table. ANZ’s material non-consolidated subsidiaries are also listed in this chapter.
Restrictions on Transfers of Capital within ANZ ANZ operates branches and locally incorporated subsidiaries in many countries. These operations are capitalised at an appropriate level to cover the risks in the business and to meet local prudential requirements. This level of capitalisation may be enhanced to meet local taxation and operational requirements. Any repatriation of capital from subsidiaries or branches is subject to meeting the requirements of the local prudential regulator and/or the local central bank. Apart from ANZ’s operations in New Zealand, local country capital requirements do not impose any material call on ANZ’s capital base. ANZ undertakes banking activities in New Zealand principally through its wholly owned subsidiary, ANZ Bank New Zealand Limited, which is subject to minimum capital requirements as set by the Reserve Bank of New Zealand (RBNZ). The RBNZ adopted the Basel II framework, effective from 1 January 2008 and Basel III reforms from 1 January 2013. ANZ Bank New Zealand Limited has been accredited to use the advanced approach for the calculation of credit risk and standardised approach for operational risk. ANZ Bank New Zealand Limited maintains a buffer above the minimum capital base required by the RBNZ. This capital buffer has been calculated via the ICAAP undertaken for ANZ Bank New Zealand Limited, to ensure ANZ Bank New Zealand Limited is appropriately capitalised under stressed economic scenarios.

ANZ Basel III Pillar 3 Disclosure September 2019
9
Table 1 Capital disclosure template
Sep-19 Reconciliation
Table $M Reference
Common Equity Tier 1 Capital: instruments and reserves 1 Directly issued qualifying ordinary shares (and equivalent for mutually-owned entities)
capital 26,187 Table A
2 Retained earnings 32,856 Table B 3 Accumulated other comprehensive income (and other reserves) 1,759 Table C 4 Directly issued capital subject to phase out from CET1 (only applicable to mutually-owned
companies) n/a
5 Ordinary share capital issued by subsidiaries and held by third parties (amount allowed in group CET1)
3 Table D
6 Common Equity Tier 1 capital before regulatory adjustments 60,805
Common Equity Tier 1 capital : regulatory adjustments 7 Prudential valuation adjustments - 8 Goodwill (net of related tax liability) 3,772 Table E 9 Other intangibles other than mortgage servicing rights (net of related tax liability) 1,878 Table F 10 Deferred tax assets that rely on future profitability excluding those arising from temporary
differences (net of related tax liability) 9 Table J
11 Cash-flow hedge reserve 730 12 Shortfall of provisions to expected losses 1 Table G 13 Securitisation gain on sale - 14 Gains and losses due to changes in own credit risk on fair valued liabilities 7 15 Defined benefit superannuation fund net assets 204 Table H 16 Investments in own shares (if not already netted off paid-in capital on reported balance
sheet) -
17 Reciprocal cross-holdings in common equity - 18 Investments in the capital of banking, financial and insurance entities that are outside the
scope of regulatory consolidation, net of eligible short positions, where the ADI does not own more than 10% of the issued share capital (amount above 10% threshold)
-
19 Significant investments in the ordinary shares of banking, financial and insurance entities that are outside the scope of regulatory consolidation, net of eligible short positions (amount above 10% threshold)
-
20 Mortgage service rights (amount above 10% threshold) - 21 Deferred tax assets arising from temporary differences (amount above 10% threshold, net
of related tax liability) -
22 Amount exceeding the 15% threshold - 23 of which: significant investments in the ordinary shares of financial entities - 24 of which: mortgage servicing rights - 25 of which: deferred tax assets arising from temporary differences - 26 National specific regulatory adjustments (sum of rows 26a - 26j) 6,849 26a of which: treasury shares - 26b of which: offset to dividends declared under a dividend reinvestment plan (DRP), to the
extent to that the dividends are used to purchase new ordinary shares issued by the ADI -
26c of which: deferred fee income (108) 26d of which: equity investment in financial institutions not reported in rows 18, 19 and 23 4,353 Table I 26e of which: deferred tax assets not reported in rows 10, 21 and 25 1,367 Table J 26f of which: capitalised expenses 1,178 Table K 26g of which: investments in commercial (non-financial) entities that are deducted under
APRA rules 35 Table L
26h of which: covered bonds in excess of asset cover in pools - 26i of which: undercapitalisation of a non-consolidated subsidiary - 26j of which: other national specific regulatory adjustments not reported in rows 26a to 26i 24 27 Regulatory adjustments applied to CET1 due to insufficient Additional Tier 1 and Tier 2 to
cover deductions -
28 Total regulatory adjustments to CET1 13,450
29 Common Equity Tier 1 capital (CET1) 47,355

ANZ Basel III Pillar 3 Disclosure September 2019
10
Table 1 Capital disclosure template
Sep-19 Reconciliation
Table $M Reference
Additional Tier 1 Capital: instruments 30 Directly issued qualifying Additional Tier 1 instruments 7,735 Table M 31 of which: classified as equity under applicable accounting standards - 32 of which: classified as liabilities under applicable accounting standards 7,735 Table M 33 Directly issued capital instruments subject to phase out from Additional Tier 1 - Table M 34 Additional Tier 1 instruments (and CET1 instruments not included in row 5) issued by
subsidiaries and held by third parties (amount allowed in group AT1)
309 Table M
35 of which: instruments issued by subsidiaries subject to phase out n/a
36 Additional Tier 1 capital before regulatory adjustments 8,044
Additional Tier 1 Capital: regulatory adjustments - 37 Investments in own Additional Tier 1 instruments - 38 Reciprocal cross-holdings in Additional Tier 1 instruments - 39 Investments in the capital of banking, financial and insurance entities that are outside the
scope of regulatory consolidation, net of eligible short positions, where the ADI does not own more than 10% of the issued share capital (amount above 10% threshold)
-
40 Significant investments in the capital of banking, financial and insurance entities that are outside the scope of regulatory consolidation, (net of eligible short positions)
155 Table M
41 National specific regulatory adjustments (sum of rows 41a - 41c) 23 41a of which: holdings of capital instruments in group members by other group members on
behalf of third parties -
41b of which: investments in the capital of financial institutions that are outside the scope of regulatory consolidations not reported in rows 39 and 40
22 Table M
41c of which: other national specific regulatory adjustments not reported in rows 41a and 41b 1 Table M 42 Regulatory adjustments applied to Additional Tier 1 due to insufficient Tier 2 cover deductions -
43 Total regulatory adjustments to Additional Tier 1 capital 178
44 Additional Tier 1 capital (AT1) 7,866
45 Tier 1 Capital (T1=CET1+AT1) 55,221
Tier 2 Capital: instruments and provisions - 46 Directly issued qualifying Tier 2 instruments 7,884 47 Directly issued capital instruments subject to phase out from Tier 2 444 Table N 48 Tier 2 instruments (and CET1 and AT1 instruments not included in rows 5 or 34) issued by
subsidiaries and held by third parties (amount allowed in group T2) 63
49 of which: instruments issued by subsidiaries subject to phase out - 50 Provisions 296
51 Tier 2 capital before regulatory adjustments 8,687
Tier 2 Capital: regulatory adjustments - 52 Investments in own Tier 2 instruments 10 Table N 53 Reciprocal cross-holdings in Tier 2 instruments - 54 Investments in the Tier 2 capital of banking, financial and insurance entities that are outside
the scope of regulatory consolidation, net of eligible short positions, where the ADI does not own more than 10% of the issued share capital (amount above 10%
-
55 Significant investments in the Tier 2 capital of banking, financial and insurance entities that are outside the scope of regulatory consolidation, net of eligible short positions
85 Table N
56 National specific regulatory adjustments (sums of rows 56a - 56c) 43 56a of which: holdings of capital instruments in group members by other group members on
behalf of third parties -
56b of which: investments in the capital of financial institutions that are outside the scope of regulatory consolidation not reported in rows 54 and 55
43 Table N
56c of which: other national specific regulatory adjustments not reported in rows 56a and 56b -
57 Total regulatory adjustment to Tier 2 capital 138
58 Tier 2 capital (T2) 8,549
59 Total capital (TC=T1+T2) 63,770
60 Total risk-weighted assets based on APRA standards 416,961

ANZ Basel III Pillar 3 Disclosure September 2019
11
Table 1 Capital disclosure template5
Reconciliation
Table Sep-19 Reference
Capital ratios and buffers 61 Common Equity Tier 1 ( as a percentage of risk-weighted assets) 11.4% 62 Tier 1 (as a percentage of risk-weighted assets) 13.2% 63 Total capital (as a percentage of risk-weighted assets) 15.3% 64 Institution specific buffer requirement (minimum CET1 requirement plus capital conservation
buffer plus countercyclical buffer requirements plus G-SIBs buffer requirement, expressed as a percentage of risk-weighted assets)
8.049%
65 of which: capital conservation buffer requirement5 3.5% 66 of which: ADI-specific countercyclical buffer requirements 0.049% 67 of which: G-SIB buffer requirement (not applicable) n/a 68 Common Equity Tier 1 available to meet buffers (as a percentage of risk-weighted assets) 6.9% National minima (if different from Basel III) - 69 National Common Equity Tier 1 minimum ratio (if different from Basel III minimum) n/a 70 National Tier 1 minimum ratio (if different from Basel III minimum) n/a 71 National total capital minimum ratio (if different from Basel III minimum) n/a Amount below thresholds for deductions (not risk-weighted) - 72 Non-significant investments in the capital of other financial entities 147 73 Significant investments in the ordinary shares of financial entities 4,270 Table I 74 Mortgage servicing rights (net of related tax liability) n/a 75 Deferred tax assets arising from temporary differences (net of related tax liability) 1,367 Table J Applicable caps on the inclusion of provisions in Tier 2 - 76 Provisions eligible for inclusion in Tier 2 in respect of exposures subject to standardised
approach (prior to application of cap) 135
77 Cap on inclusion of provisions in Tier 2 under standardised approach 281 78 Provisions eligible for inclusion in Tier 2 in respect of exposures subject to internal ratings-
based approach (prior to application of cap) 160
79 Cap for inclusion of provisions in Tier 2 under internal ratings-based approach 2,014 Capital instruments subject to phase-out arrangements (only application between 1
January 2018 to 1 January 2022) -
80 Current cap on CET1 instruments subject to phase out arrangements n/a 81 Amount excluded from CET1 due to cap (excess over cap after redemptions and maturities) n/a 82 Current cap on AT1 instruments subject to phase out arrangements n/a 83 Amount excluded from AT1 instruments due to cap (excess over cap after redemptions and
maturities) -
84 Current cap on T2 instruments subject to phase out arrangements n/a 85 Amount excluded from T2 due to cap (excess over cap after redemption and maturities) -
Counter Cyclical Capital Buffer
Geographic breakdown of Private Sector Credit Exposures
Hong Kong
Sweden Norway United Kingdom
France Other Total
$M $M $M $M $M $M $M
RWA for all private sector credit exposures 3,532 353 408 5,394 1,142 320,059 330,888 Jurisdictional buffer set by national authorities 2.500% 2.500% 2.000% 1.000% 0.250% - - Countercyclical buffer requirement 0.027% 0.003% 0.002% 0.016% 0.001% - 0.049%
5 Includes 1.0% buffer applied by APRA to ADIs deemed as domestic systemically important.

ANZ Basel III Pillar 3 Disclosure September 2019
12
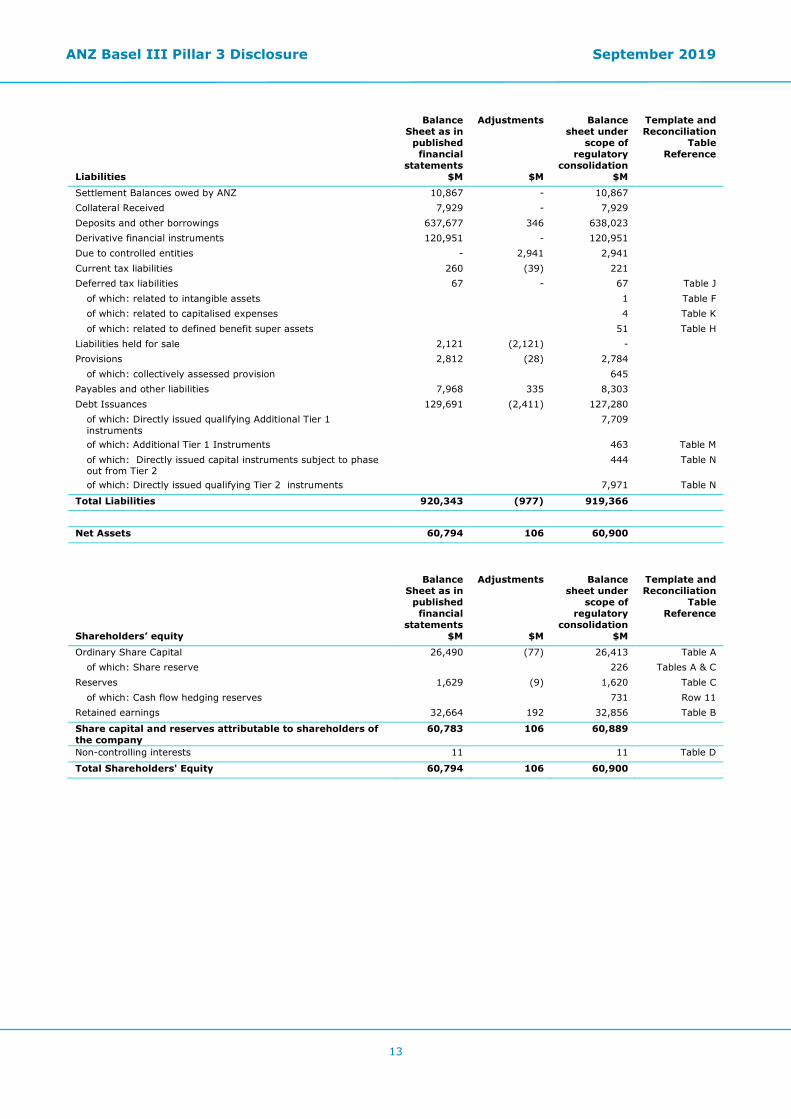
The following table shows ANZ's consolidated balance sheet and the adjustments required to derive the Level 2 Balance Sheet. The adjustments remove the external assets and liabilities of the entities deconsolidated for prudential purposes and reinstate any intragroup assets and liabilities, treating them as external to the Level 2 Group.
Balance Sheet as in
published financial
statements
Adjustments Balance sheet under
scope of regulatory
consolidation
Template and Reconciliation
Table Reference
Assets $M $M $M
Cash and Cash Equivalents 81,621 78 81,699 Settlement Balances owed to ANZ 3,739 - 3,739 Collateral Paid 15,006 - 15,006 Trading securities 43,169 - 43,169
of which: Financial Institutions capital instruments 85 Table N Derivative financial instruments 120,667 - 120,667 Investment Securities 83,709 (581) 83,128
of which: significant investments in financial institutions equity instruments
1,105 Table I
of which: non-significant investment in financial institutions equity instruments
83 Table I
of which: Other entities equity investments 29 Table L of which: collectively assessed provision (13)
Net loans and advances 615,258 (2,370) 612,888 of which: deferred fee income (108) Row 26c of which: collectively assessed provision (2,718) Table G of which: individually assessed provisions (814) Table G of which: capitalised brokerage 870 Table K of which: CET1 margin lending adjustment 24 Row 26j of which: AT1 margin lending adjustment 1 Table M
Regulatory deposits 879 - 879 Assets held for sale 1,831 (1,831) - Due from controlled entities - 2,599 2,599
of which: Significant investments in the Tier 2 "capital of banking, financial and insurance entities" that are outside the scope of regulatory consolidation
blank 85 Table N
Shares in controlled entities Bla1---- 1,153 1,153 of which: Investment in deconsolidated financial subsidiaries 996 Table I of which: AT1 significant investment in banking, financial and insurance entities that are outside the scope of regulatory consolidation
blank 155 Table M
Investment in associates 2,957 - 2,957 of which: Financial Institutions 2,954 Table I of which: Other Entities 3 Table L
Current tax assets 265 1 266 Deferred tax assets 1,356 15 1,371 Table J Goodwill and other intangible assets 4,861 5 4,866
of which: Goodwill 3,543 Table E of which: Software 1,322 Table F
Premises and equipment 1,924 1 1,925 Other assets 3,895 59 3,954
of which: Defined benefit superannuation fund net assets 255 Table H of which: Capitalised Costs of disposal 248 Table K
Total Assets 981,137 (871) 980,266
ANZ Basel III Pillar 3 Disclosure September 2019
13
Balance Sheet as in
published financial
statements
Adjustments Balance sheet under
scope of regulatory
consolidation
Template and Reconciliation
Table Reference
Liabilities $M $M $M
Settlement Balances owed by ANZ 10,867 - 10,867 Collateral Received 7,929 - 7,929 Deposits and other borrowings 637,677 346 638,023 Derivative financial instruments 120,951 - 120,951 Due to controlled entities - 2,941 2,941 Current tax liabilities 260 (39) 221 Deferred tax liabilities 67 - 67 Table J
of which: related to intangible assets 1 Table F of which: related to capitalised expenses 4 Table K of which: related to defined benefit super assets 51 Table H
Liabilities held for sale 2,121 (2,121) - Provisions 2,812 (28) 2,784
of which: collectively assessed provision 645 Payables and other liabilities 7,968 335 8,303 Debt Issuances 129,691 (2,411) 127,280
of which: Directly issued qualifying Additional Tier 1 instruments
7,709
of which: Additional Tier 1 Instruments 463 Table M of which: Directly issued capital instruments subject to phase out from Tier 2
444 Table N
of which: Directly issued qualifying Tier 2 instruments 7,971 Table N
Total Liabilities 920,343 (977) 919,366
Net Assets 60,794 106 60,900
Balance
Sheet as in published financial
statements
Adjustments Balance sheet under
scope of regulatory
consolidation
Template and Reconciliation
Table Reference
Shareholders’ equity $M $M $M
Ordinary Share Capital 26,490 (77) 26,413 Table A of which: Share reserve 226 Tables A & C
Reserves 1,629 (9) 1,620 Table C of which: Cash flow hedging reserves 731 Row 11
Retained earnings 32,664 192 32,856 Table B
Share capital and reserves attributable to shareholders of the company
60,783 106 60,889
Non-controlling interests 11 11 Table D
Total Shareholders' Equity 60,794 106 60,900

ANZ Basel III Pillar 3 Disclosure September 2019
14
The following reconciliation tables provide additional information on the difference between Table 1 Capital Disclosure Template and the Level 2 Balance Sheet.
Sep 19 Table 1 Table A $M Reference
Issued capital 26,413 Less Reclassification to Reserves (226) Table C
Regulatory Directly Issued qualifying ordinary shares 26,187 Row 1 Sep 19 Table 1
Table B $M Reference
Retained earnings 32,856
Retained earnings 32,856 Row 2 Sep 19 Table 1
Table C $M Reference
Reserves 1,620 Add Reclassification from Issued Capital 226 Table A Less Non qualifying reserves (87)
Reserves for Regulatory capital purposes (amount allowed in group CET1) 1,759 Row 3 Sep 19 Table 1
Table D $M Reference
Non-controlling interests 11 Less Surplus capital attributable to minority shareholders (8)
Ordinary share capital issued by subsidiaries and held by third parties 3 Row 5 Sep 19 Table 1
Table E $M Reference
Goodwill 3,543 Add Goodwill component of investments in financial associates 229 Table I
Goodwill (net of related tax liability) 3,772 Row 8 Sep 19 Table 1
Table F $M Reference
Software 1,322 Add Other intangible assets 1 Less Associated deferred tax liabilities (1) Add Regulatory reclassification from significant investments in the ordinary shares of banking,
financial and insurance entities outside the scope of regulatory consolidation 556 Table I
Other intangibles other than mortgage servicing rights (net of related tax liability) 1,878 Row 9
ANZ Basel III Pillar 3 Disclosure September 2019
15
Sep 19 Table 1
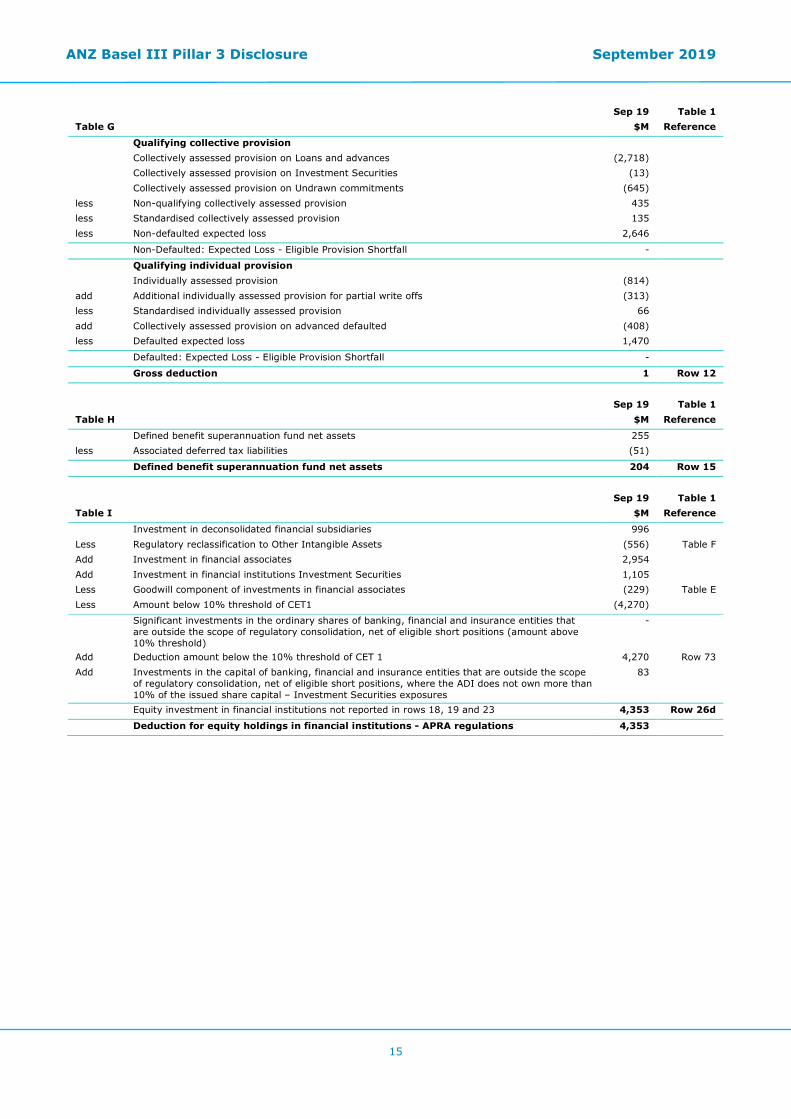
Table G $M Reference
Qualifying collective provision Collectively assessed provision on Loans and advances (2,718) Collectively assessed provision on Investment Securities (13) Collectively assessed provision on Undrawn commitments (645)
less Non-qualifying collectively assessed provision 435 less Standardised collectively assessed provision 135 less Non-defaulted expected loss 2,646
Non-Defaulted: Expected Loss - Eligible Provision Shortfall -
Qualifying individual provision Individually assessed provision (814)
add Additional individually assessed provision for partial write offs (313) less Standardised individually assessed provision 66 add Collectively assessed provision on advanced defaulted (408) less Defaulted expected loss 1,470
Defaulted: Expected Loss - Eligible Provision Shortfall -
Gross deduction 1 Row 12
Sep 19 Table 1
Table H $M Reference
Defined benefit superannuation fund net assets 255 less Associated deferred tax liabilities (51)
Defined benefit superannuation fund net assets 204 Row 15
Sep 19 Table 1
Table I $M Reference
Investment in deconsolidated financial subsidiaries 996 Less Regulatory reclassification to Other Intangible Assets (556) Table F Add Investment in financial associates 2,954 Add Investment in financial institutions Investment Securities 1,105 Less Goodwill component of investments in financial associates (229) Table E Less Amount below 10% threshold of CET1 (4,270)
Significant investments in the ordinary shares of banking, financial and insurance entities that are outside the scope of regulatory consolidation, net of eligible short positions (amount above 10% threshold)
-
Add Deduction amount below the 10% threshold of CET 1 4,270 Row 73 Add Investments in the capital of banking, financial and insurance entities that are outside the scope
of regulatory consolidation, net of eligible short positions, where the ADI does not own more than 10% of the issued share capital – Investment Securities exposures
83
Equity investment in financial institutions not reported in rows 18, 19 and 23 4,353 Row 26d
Deduction for equity holdings in financial institutions - APRA regulations 4,353
ANZ Basel III Pillar 3 Disclosure September 2019
16
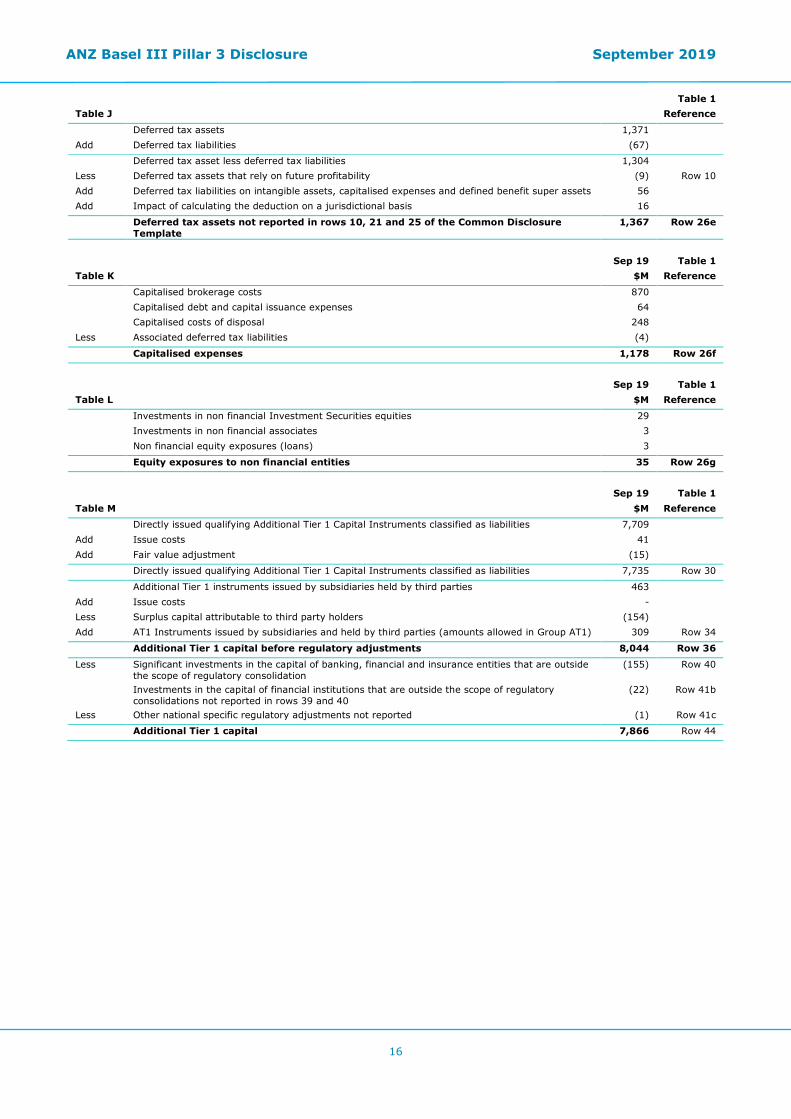
Table 1 Table J Reference
Deferred tax assets 1,371 Add Deferred tax liabilities (67)
Deferred tax asset less deferred tax liabilities 1,304 Less Deferred tax assets that rely on future profitability (9) Row 10 Add Deferred tax liabilities on intangible assets, capitalised expenses and defined benefit super assets 56 Add Impact of calculating the deduction on a jurisdictional basis 16
Deferred tax assets not reported in rows 10, 21 and 25 of the Common Disclosure Template
1,367 Row 26e
Sep 19 Table 1
Table K $M Reference
Capitalised brokerage costs 870 Capitalised debt and capital issuance expenses 64 Capitalised costs of disposal 248 Less Associated deferred tax liabilities (4)
Capitalised expenses 1,178 Row 26f
Sep 19 Table 1
Table L $M Reference
Investments in non financial Investment Securities equities 29 Investments in non financial associates 3 Non financial equity exposures (loans) 3
Equity exposures to non financial entities 35 Row 26g Sep 19 Table 1
Table M $M Reference
Directly issued qualifying Additional Tier 1 Capital Instruments classified as liabilities 7,709 Add Issue costs 41 Add Fair value adjustment (15)
Directly issued qualifying Additional Tier 1 Capital Instruments classified as liabilities 7,735 Row 30
Additional Tier 1 instruments issued by subsidiaries held by third parties 463 Add Issue costs - Less Surplus capital attributable to third party holders (154) Add AT1 Instruments issued by subsidiaries and held by third parties (amounts allowed in Group AT1) 309 Row 34
Additional Tier 1 capital before regulatory adjustments 8,044 Row 36
Less Significant investments in the capital of banking, financial and insurance entities that are outside the scope of regulatory consolidation
(155) Row 40
Investments in the capital of financial institutions that are outside the scope of regulatory consolidations not reported in rows 39 and 40
(22) Row 41b
Less Other national specific regulatory adjustments not reported (1) Row 41c
Additional Tier 1 capital 7,866 Row 44

ANZ Basel III Pillar 3 Disclosure September 2019
17
Sep 19 Table 1 Table N $M Reference
Directly issued capital instruments subject to phase out from Tier 2 444 Less Amortisation of Tier 2 Capital Instruments subject to Phase out - Less Fair value adjustment -
Directly issued capital instruments subject to phase out from Tier 2 444 Row 47
Add Surplus capital attributable to third party holders 63 Add Directly issued qualifying Tier 2 instruments 7,971 Row 46 Add Issue costs 7 Add Fair value adjustment (94) Add Provisions 296 Table G
Tier 2 capital before regulatory adjustments 8,687 Row 51
Less Investments in own Tier 2 instruments (trading limit) (10) Row 52 Less Significant investments in the Tier 2 capital of banking, financial and insurance entities that are
outside the scope of regulatory consolidation, net of eligible short positions (85) Row 55
Less Investments in the capital of financial institutions that are outside the scope of regulatory consolidation not reported in rows 54 and 55
(43) Row 56b
Tier 2 capital 8,549 Row 58

ANZ Basel III Pillar 3 Disclosure September 2019
18
The following table provides details of entities included within the accounting scope of consolidation but excluded from regulatory consolidation.
Total Assets Total Liabilities Entity Activity $M $M
ACN 008 647 185 Pty Ltd Holding Company - - ANZ ILP Pty Ltd Incorporated Legal Practice 2 - ANZ Investment Services (New Zealand) Limited Funds Management 27 9 ANZ Lenders Mortgage Insurance Pty Limited Mortgage insurance - - ANZ Pensions (UK) Limited Trustee/Nominee - - ANZ Life Assurance Company Pty Ltd Insurance - - ANZ New Zealand Investments Limited Funds Management 119 29 ANZ New Zealand Investments Nominees Limited Nominee - - ANZ Self Managed Super Ltd Investment - - ANZ Wealth Alternative Investments Management Pty Ltd
Investment 916 912
ANZ Wealth Australia Limited Holding Company / Corporate 229 36 ANZ Wealth New Zealand Limited Holding Company 120 - ANZcover Insurance Private Ltd Captive-Insurance 197 98 AUT Administration Pty Ltd Dormant - - Financial Planning Hotline Pty Ltd Advice - - Kingfisher Trust 2016-1 Securitisation Trust 1,003 1,003 Kingfisher Trust 2019-1 Securitisation Trust 1,419 1,419 Looking Together Pty Ltd Property Price Information - - OASIS Asset Management Limited Investment 16 2 OASIS Fund Management Limited Superannuation 13 3 OnePath Administration Pty Ltd Service Company 8 2 OnePath Custodians Pty Ltd Superannuation 217 51 OnePath Funds Management Limited Investment 32 7 OnePath Investment Holdings Pty Ltd Investment 7 - Shout for Good Pty Ltd Corporate 1 1 Tandem Financial Advice Pty Limited Advice - - Union Investment Company Pty Limited Advice - -

ANZ Basel III Pillar 3 Disclosure September 2019
19
Table 2 Main features of capital instruments As the main features of ANZ’s capital instruments are updated on an ongoing basis, ANZ has provided this information separately in the Regulatory Disclosures section of its website.
Table 3 Capital adequacy, Table 4 Credit risk, Table 5 Securitisation The above tables are produced at the quarters ending 30 June and 31 December.
Table 6 Capital adequacy Capital management ANZ pursues an active approach to capital management, which is designed to protect the interests of depositors, creditors and shareholders. This involves the on-going review and Board approval of the level and composition of ANZ’s capital base, assessed against the following key policy objectives: • Regulatory compliance such that capital levels exceed APRA’s, ANZ’s primary prudential supervisor, minimum
Prudential Capital Ratios (PCRs) both at Level 1 (the Company and specified subsidiaries) and Level 2 (ANZ consolidated under Australian prudential standards), along with US Federal Reserve’s minimum Level 2 requirements under ANZ’s Foreign Holding Company Licence in the United States of America;
• Capital levels are aligned with the risks in the business and to meet strategic and business development; and
• An appropriate balance between maximising shareholder returns and prudent capital management principles. ANZ achieves these objectives through an Internal Capital Adequacy Assessment Process (ICAAP) where by ANZ conducts detailed strategic and capital planning over a medium term time horizon. The Capital Plan is maintained and updated through a monthly review of forecast financial performance, economic conditions and development of business initiatives and strategies. The Board and senior management are provided with monthly updates of ANZ’s capital position. Any actions required to ensure ongoing prudent capital management are submitted to the Board for approval. ANZ annually conducts a detailed strategic planning process over a three year time horizon, the outcomes of which are embodied in the Strategic Plan. This process involves forecasting key economic variables which Divisions use to determine key financial data for their existing business. New strategic initiatives to be undertaken over the planning period and their financial impact are then determined. These processes are used for the following: • Review capital ratios, targets, and levels of different classes of capital against ANZ’s risk profile and risk appetite
outlined in the Strategic Plan. ANZ’s capital targets reflect the key policy objectives above, and the desire to ensure that under specific stressed economic scenarios that capital levels are sufficient to remain above PCR requirements;
• Stress tests are performed under different economic conditions to provide a comprehensive review of ANZ’s capital position both before and after mitigating actions. The stress tests determine the level of additional capital (i.e. the ‘stress capital buffer’) needed to absorb losses that may be experienced during an economic downturn; and
• Stress testing is integral to strengthening the predictive approach to risk management and is a key component in managing risks, asset writing strategies and business strategies. It creates greater understanding of the impacts on financial performance through modelling relationships and sensitivities between geographic, industry and Divisional exposures under a range of macro-economic scenarios. ANZ has a dedicated stress testing team within Risk Management that models and reports to management and the Board’s Risk Committee on a range of scenarios and stress tests.
Results are subsequently used to: • Recalibrate ANZ’s management targets for minimum and operating ranges for its respective classes of capital such
that ANZ will have sufficient capital to remain above regulatory requirements; and
• Identify the level of organic capital generation and hence determine current and future capital issuance requirements for Level 1 and Level 2.
From these processes, a Capital Plan is developed and approved by the Board which identifies the capital issuance requirements, capital securities maturity profile, and options around capital products, timing and markets to execute the Capital Plan under differing market and economic conditions. The Capital Plan is maintained and updated through a monthly review of forecast financial performance, economic conditions and development of business initiatives and strategies. The Board and senior management are provided with monthly updates of ANZ’s capital position. Any actions required to ensure ongoing prudent capital management are submitted to the Board for approval.

ANZ Basel III Pillar 3 Disclosure September 2019
20
Regulatory environment ANZ’s regulatory capital calculation is governed by APRA’s Prudential Standards which adopt a risk-based capital assessment framework based on the Basel III capital measurement standards. This risk-based approach requires eligible capital to be divided by total risk weighted assets (RWA), with the resultant ratio being used as a measure of an Authorised Deposit-taking Institution’s (ADIs) capital adequacy. APRA determines PCRs for Common Equity Tier 1 (CET1), Tier 1 and Total Capital, with capital as the numerator and RWAs as the denominator. Regulatory capital is divided into Tier 1, carrying the highest capital elements, and Tier 2, which has lower capital elements, but still adds to the overall strength of the ADI. Tier 1 capital is comprised of Common Equity Tier 1 capital less deductions and Additional Tier 1 capital instruments. Common Equity Tier 1 capital comprises shareholders’ equity adjusted for items which APRA does not allow as regulatory capital or classifies as lower forms of regulatory capital. Common Equity Tier 1 capital includes the following significant adjustments: • Reserves exclude the hedging reserve and reserves of insurance and funds management subsidiaries;
• Retained and current year earnings excluding those of insurance and funds management subsidiaries, but includes capitalised deferred fees forming part of loan yields that meet the criteria set out in the prudential standard;
• Inclusion of qualifying treasury shares.
Additional Tier 1 capital instruments are high quality components of capital that provide a permanent and unrestricted commitment of funds, are available to absorb losses, are subordinated to the claims of depositors and senior creditors in the event of the winding up of the issuer and provide for fully discretionary capital distributions.
Deductions from the capital base comprise mainly deductions to the Common Equity Tier 1 component. These deductions are largely intangible assets, investments in insurance and funds management entities and associates, capitalised expenses (including loan and origination fees), and net deferred tax assets.
Tier 2 capital mainly comprises perpetual subordinated debt instruments and dated subordinated debt instruments which have a minimum term of five years at issue date.
Total Capital is the sum of Tier 1 capital and Tier 2 capital.
In addition to the prudential capital oversight that APRA conducts over the Company and the Group, the Company’s branch operations and major banking subsidiary operations are overseen by local regulators such as the Reserve Bank of New Zealand, the US Federal Reserve, the UK Prudential Regulation Authority, the Monetary Authority of Singapore, the Hong Kong Monetary Authority and the China Banking Regulatory Commission who may impose minimum capitalisation rates on those operations.
Throughout the financial year, the Company and the Group maintained compliance with the minimum Common Equity Tier 1, Tier 1 and Total Capital ratios set by APRA and the US Federal Reserve (as applicable) as well as applicable capitalisation rates set by regulators in countries where the Company operates branches and subsidiaries.
Regulatory development There are a number of matters currently outstanding that may have an impact on ANZ’s regulatory capital in the future. Details of these matters are available in ANZ’s 2019 Full Year Results Announcement Group Results section, pages 50-51, available on ANZ’s website: shareholder.anz.com/pages/results-announcement-archive.

ANZ Basel III Pillar 3 Disclosure September 2019
21
Table 6 Capital adequacy - Capital Ratio and Risk Weighted Assets 6 7 The following table provides the composition of capital used for regulatory purposes and capital adequacy ratios.
Sep 19 Mar 19 Sep 18 Risk weighted assets $M $M $M
Subject to Advanced Internal Rating Based (IRB) approach Corporate 136,885 127,989 121,891 Sovereign 6,199 7,016 6,955 Bank 15,968 15,511 15,908 Residential Mortgage 105,491 101,469 97,764 Qualifying Revolving Retail 5,255 5,795 6,314 Other Retail 26,258 28,029 29,373
Credit risk weighted assets subject to Advanced IRB approach 296,056 285,809 278,205
Credit risk Specialised Lending exposures subject to slotting approach6 36,318 35,696 33,110
Subject to Standardised approach Corporate 11,645 12,252 13,760 Residential Mortgage 216 331 327 Other Retail 50 81 88
Credit risk weighted assets subject to Standardised approach 11,911 12,664 14,175
Credit Valuation Adjustment and Qualifying Central Counterparties 8,682 6,217 7,344
Credit risk weighted assets relating to securitisation exposures 1,859 1,558 1,600 Other assets 3,280 3,579 3,146
Total credit risk weighted assets 358,106 345,523 337,580
Market risk weighted assets 5,307 5,790 6,808 Operational risk weighted assets 46,626 37,733 37,618 Interest rate risk in the banking book (IRRBB) risk weighted assets 6,922 7,245 8,814
Total risk weighted assets 416,961 396,291 390,820
Capital ratios (%)7
Level 2 Common Equity Tier 1 capital ratio 11.4% 11.5% 11.4% Level 2 Tier 1 capital ratio 13.2% 13.4% 13.4% Level 2 Total capital ratio 15.3% 15.3% 15.2% Level 1: Extended licensed Common Equity Tier 1 capital ratio 11.4% 11.2% 11.6% Level 1: Extended licensed entity Tier 1 capital ratio 13.4% 13.2% 13.6% Level 1: Extended licensed entity Total capital ratio 15.7% 15.3% 15.6% Other significant Authorised Deposit-taking Institution (ADI) or overseas bank subsidiary: ANZ Bank New Zealand Limited – Common Equity Tier 1 capital ratio 10.8% 11.4% 11.1% ANZ Bank New Zealand Limited - Tier 1 capital ratio 13.6% 14.6% 14.4%
ANZ Bank New Zealand Limited - Total capital ratio 13.6% 14.6% 14.4%
6 Specialised Lending exposures subject to slotting approach are those where the main servicing and repayment is from the asset being financed, and includes specified commercial property development/investment lending, project finance and object finance. 7 ANZ Bank New Zealand Limited’s capital ratios have been calculated in accordance with Reserve Bank of New Zealand prudential standards.

ANZ Basel III Pillar 3 Disclosure September 2019
22
Credit Risk Weighted Assets (CRWA) Total CRWA increased $12.6 billion (3.6%) from March 2019 to $358.1 billion at September 2019. The increase was mainly attributable to Methodology Review changes with the implementation of the regulatory standard impacting derivative exposures, Standardised Approach to Counterparty Credit Risk (SA-CCR), and an increase from APRA risk weight floors on New Zealand residential mortgages and farm lending exposures.
Market Risk, Operational Risk and IRRBB RWA IRRBB RWA decreased $0.3 billion (4.5%) due to an improvement in embedded gains, partially offset by an increase in Repricing and Yield Curve risk. The Operational Risk RWA has increased $8.9 billion (23.6%) compared to March 2019 due to the update of Operational risk capital model parameters ($2.6 billion), and implementation of a regulatory capital overlay ($6.3 billion). Traded Market Risk RWA decreased $0.5 billion (8.3%) over the half year due to reduction in Stress VaR.

ANZ Basel III Pillar 3 Disclosure September 2019
23
Chapter 5 – Credit risk Table 7 Credit risk – General disclosures
Definition of credit risk Credit Risk is the risk of financial loss resulting from a counterparty failing to fulfil its credit obligations, or from a decrease in credit quality of a counterparty resulting in a loss in value.
Regulatory approval to use the Advanced Internal Ratings-based approach ANZ has been given approval by APRA to use the Advanced Internal Ratings (AIRB) based approach to credit risk, under APS 113 Capital Adequacy: Internal Ratings-based Approach to Credit Risk. As an AIRB bank, ANZ’s internal models generate the inputs into regulatory capital adequacy to determine the risk weighted exposure calculations for both on and off-balance sheet exposures, including undrawn portions of credit facilities, committed and contingent exposures and expected loss (EL) calculations. ANZ’s internal models are used to generate three key risk components that serve as inputs to the IRB approach to credit risk: • Probability of Default (PD) is an estimate of the level of the risk of borrower default • Exposure at Default (EAD) is defined as the expected facility exposure at the date of default • Loss Given Default (LGD) is an estimate of the potential economic loss on a credit exposure, incurred as a
consequence of obligor default. There are however several small portfolios (mainly retail and local corporates in Pacific, and local corporates in Asia) where ANZ applies the Standardised approach to credit risk, under APS 112 Capital Adequacy: Standardised Approach to Credit Risk.
Credit risk management framework and policies ANZ has a comprehensive framework to manage Wholesale Credit Risk. The framework is top down, being defined by credit principles and policies. Credit policies, requirements and procedures cover all aspects of the credit life cycle such as transaction structuring, risk grading, initial approval, ongoing management and problem debt management, as well as specialist policy topics. The effectiveness of the credit risk management framework is assessed through various compliance and monitoring processes. These, together with portfolio selection and risk appetite setting, define and guide the credit process, organisation and staff.
Organisation The Credit and Market Risk Committee (CMRC) is a senior executive level committee responsible for the oversight and control of credit, market, insurance and material financial risks across the ANZ Group. The Credit Rating System Oversight Committee (CRSOC) supports the CMRC, by providing oversight and control of the internal ratings system for credit risk in the wholesale and retail sectors, including credit model approvals and performance monitoring. The primary responsibility for prudent and profitable management of credit risk assets and customer relationships rests with the business units. An independent credit risk management function is staffed by risk specialists. Independence is achieved by having all credit risk staff ultimately report to the Chief Risk Officer (CRO), even where they are embedded in business units. Risk performs key roles in portfolio management such as development and validation of credit risk measurement systems, loan asset quality reporting, and development of credit policies and requirements. In ANZ’s wholesale businesses, Risk also provides independent credit assessment and approval on lending decisions. The authority to make credit decisions is delegated by the Board to the CEO who in turn delegates authority to the CRO. The CRO in turn delegates some of their credit discretion to individuals as part of a ‘cascade’ of authority from senior to the most junior credit officers. Within ANZ, credit approval for material wholesale lending is judgementally made on a ‘dual approval’ basis, jointly by the business writer in the business unit and the respective independent credit risk officer. Individuals must be suitably skilled and accredited in order to be granted and retain credit discretion. Credit discretions are reviewed on an annual basis, and may be varied based on the holder’s performance. Programmed credit assessment typically covers retail and some small business lending, and refers to the automated assessment of credit applications using a combination of scoring (application and behavioural), policy rules and external credit reporting information. Where an application does not meet the automated assessment criteria it will be referred out for manual assessment, with assessors considering the decision tool recommendation.

ANZ Basel III Pillar 3 Disclosure September 2019
24
Portfolio direction and performance The credit risk management framework contains several portfolio direction and performance tools which enable Risk to play a fundamental role in monitoring the direction and performance of the portfolio. These include: • Group and divisional level risk appetite strategies, business writing strategies and segment transaction guidelines
are prepared by the businesses and set out appetite, planned portfolio growth, capital usage and risk/return profile, and also identify areas that may require attention to mitigate and improve risk management;
• Regular portfolio reviews; and • Exposure concentration limits, covering single customers, industries and cross border risk, to ensure a diversified
portfolio. ANZ uses portfolio monitoring and analysis tools, technologies and techniques to assist with portfolio risk assessment and management. These assist in: • Monitoring, analysing and reporting ANZ’s credit risk profile and progress in meeting portfolio objectives;
• Calculating and reporting ANZ’s collectively assessed provision, economic capital, expected loss, regulatory risk weighted assets (RWA) and regulatory expected loss;
• Assessing impact of emerging issues, and conducting ad-hoc investigations and analysis;
• Validating rating/scoring tools and credit estimates; and
• Ongoing review and refinement of ANZ's credit risk measurement and policy framework.
Credit Risk Reporting Credit risk management information systems, reporting and analysis are managed centrally and at the divisional and business unit level. Periodic reporting assists in analysing the effectiveness of strategies and processes identifying emerging issues and monitoring of portfolio trends by all levels of management and the Board. Examples of reports include EAD, portfolio mix, risk grade profiles and migrations, RWAs, large exposure reporting, credit watch and control lists, impaired assets and provisions.
Exposure at default EAD is defined as the expected facility exposure at the date of default. Unless otherwise stated, throughout this disclosure EAD represents credit exposure net of offsets for credit risk mitigation such as guarantees, credit derivatives, netting and financial collateral.
Past due facilities Facilities where a contractual payment has not been met or the customer is outside of contractual arrangements for a material length of time are deemed past due. Past due facilities include those operating in excess of approved arrangements or where scheduled repayments are outstanding, but do not include impaired assets. Impaired assets8 A facility for which there is doubt about timely payment of principal, interest and fees being achieved and / or a material credit obligation is 90 days or more past due and is not well secured. It includes all problem assets, off-balance sheet exposures (including derivatives) and assets brought to ANZ’s balance sheet through the enforcement of security. Impaired derivatives have a credit valuation adjustment, which is a market assessment of the credit risk of the relevant counterparties.
Restructured items Restructured items comprise facilities in which the original contractual terms have been modified for reasons related to the financial difficulties of the customer. Restructuring may consist of reduction of interest, principal or other payments legally due, or an extension in maturity materially beyond those typically offered to new facilities with similar risk.
8 The definition of Impaired Assets for accounting purposes is a default occurs when there are indicators that a debtor is unlikely to fully satisfy contractual credit obligations to the Group, or the exposure is 90 days past due. Financial assets, including those that are well secured, are considered credit impaired for financial reporting purposes when they are in default.

ANZ Basel III Pillar 3 Disclosure September 2019
25
Collectively Assessed Provisions for Credit Impairment Collectively assessed provisions for credit impairment represent the Expected Credit Loss (ECL) calculated in accordance with AASB 9 Financial Instruments (AASB 9) which commenced 1 October 2018. These incorporate forward looking information and do not require an actual loss event to have occurred for an impairment provision to be recognised. Under AASB 9, ECL is either measured over 12 months or the expected lifetime of the financial asset, depending on the credit deterioration since origination, according to the following three-stage approach: • Stage 1: At the origination of a financial asset, and where there has not been a significant increase in credit risk
since origination, a provision equivalent to 12 months ECL is recognised. For instruments with a remaining maturity of less than 12 months, a provision calculated on the remaining term of the maturity is recognised.
• Stage 2: Where there has been a significant increase in credit risk (SICR) since origination, a provision equivalent to lifetime ECL is recognised.
• Stage 3: Where there is objective evidence of impairment, a provision equivalent to lifetime ECL is recognised.
In determining what constitutes a SICR, ANZ considers both qualitative and quantitative information, including CCR at origination and at the reporting date. ECL is calculated as the product of PD, LGD and EAD at a facility level, discounted for incorporating the effect of time value of money. These credit risk factors are adjusted for current and forward looking information through the use of macro-economic variables in the model.
Individually Assessed Provisions for Credit Impairment Individually assessed provisions for credit impairment are calculated in accordance with AASB 9. They are assessed on a case-by-case basis for all individually managed impaired assets taking into consideration factors such as the realisable value of security (or other credit mitigants), the likely return available upon liquidation or bankruptcy, legal uncertainties, estimated costs involved in recovery, the market price of the exposure in secondary markets and the amount and timing of expected receipts and recoveries. Write-offs Facilities are written off against the related provision for impairment when they are assessed as partially or fully uncollectable, and after proceeds from the realisation of any collateral have been received. Where individually assessed provisions recognised in previous periods have subsequently decreased or are no longer required, such impairment losses are reversed in the current period income statement. Definition of default ANZ uses the following definition of default: • ANZ considers that the customer is unlikely to pay its credit obligations in full, without recourse to actions such as
realising security, or • the customer is at least 90 days past due on a credit obligation, or • the customer’s overdraft or other revolving facility(ies) have been continuously outside approved limits for 90 or
more consecutive days.
Specific Provision and General Reserve for Credit Losses Due to definitional differences, there is a difference in the split between ANZ’s individually assessed provision and collectively assessed provision for accounting purposes and the specific provision and general reserve for credit losses (GRCL) for regulatory purposes. This does not impact total provisions, and essentially relates to the classification of collectively assessed provisions on defaulted accounts. The disclosures in this document are based on individually assessed provision and collectively assessed provision, for ease of comparison with other published results. APRA has flagged that the adoption of the forward looking ECL approach means that a GRCL will no longer be required. This is likely to take effect at the commencement of the revised APS 220 prudential standard expected in mid 2020. Exposure at Default in Table 7 represents credit exposure net of offsets for credit risk mitigation such as guarantees, credit derivatives, netting and financial collateral. It includes Advanced IRB, Specialised Lending and Standardised exposures, and excludes Securitisation, Equities or Other Assets exposures.

ANZ Basel III Pillar 3 Disclosure September 2019
26
Table 7(b) part (i): Period end and average Exposure at Default 9
Sep 19
Advanced IRB approach Risk
Weighted Assets
$M
Exposure at Default
$M
Average Exposure
at Default for half year
$M
Individual provision
charge for half year
$M
Write-offs for half year
$M Corporate 136,885 276,599 267,302 75 89 Sovereign 6,199 152,940 151,300 - - Bank 15,968 55,145 55,087 - - Residential Mortgage 105,491 373,376 376,444 37 67 Qualifying Revolving Retail 5,255 16,647 17,118 87 126 Other Retail 26,258 36,322 37,432 187 264
Total Advanced IRB approach 296,056 911,029 904,683 386 546
- -
Specialised Lending 36,318 43,348 43,005 (2) 1
- - Standardised approach - -
Corporate 11,645 12,998 13,258 11 26 Residential Mortgage 216 445 581 3 1 Other Retail 50 49 65 - 4
Total Standardised approach 11,911 13,492 13,904 14 31
Credit Valuation Adjustment and Qualifying Central Counterparties
8,682 9,348 10,939 - -
Total 352,967 977,217 972,531 398 578
9 Average Exposure at Default for half year is calculated as the simple average of the balances at the start and the end of each six month period.

ANZ Basel III Pillar 3 Disclosure September 2019
27
Table 7(b) part (i): Period end and average Exposure at Default (continued)
Mar 19
Advanced IRB approach Risk
Weighted Assets
$M
Exposure at Default
$M
Average Exposure
at Default for half year
$M
Individual provision
charge for half year
$M
Write-offs for half year
$M Corporate 127,989 258,005 251,815 51 68 Sovereign 7,016 149,660 147,615 - - Bank 15,511 55,029 53,196 - - Residential Mortgage 101,469 379,512 378,043 45 50 Qualifying Revolving Retail 5,795 17,589 18,018 85 123 Other Retail 28,029 38,542 39,181 197 232
Total Advanced IRB approach 285,809 898,337 887,868 378 473
Specialised Lending 35,696 42,661 41,062 1 2
Standardised approach
Corporate 12,252 13,519 14,291 1 19 Residential Mortgage 331 716 710 (1) 1 Other Retail 81 80 84 1 3
Total Standardised approach 12,664 14,315 15,085 1 23
Credit Valuation Adjustment and Qualifying Central Counterparties
6,217 12,530 11,966 - -
Total 340,386 967,843 955,981 380 498
Sep 18
Advanced IRB approach Risk
Weighted Assets
$M
Exposure at Default
$M
Average Exposure
at Default for half year
$M
Individual provision
charge for half year
$M
Write-offs for half year
$M Corporate 121,891 245,625 241,708 1 90 Sovereign 6,955 145,569 143,426 (3) - Bank 15,908 51,363 50,016 - - Residential Mortgage 97,764 376,573 376,328 56 41 Qualifying Revolving Retail 6,314 18,447 18,889 93 140 Other Retail 29,373 39,819 40,700 211 277
Total Advanced IRB approach 278,205 877,396 871,067 358 548
Specialised Lending 33,110 39,462 38,661 2 4
Standardised approach
Corporate 13,760 15,064 15,646 (19) 15 Residential Mortgage 327 704 693 1 3 Other Retail 88 87 94 1 3
Total Standardised approach 14,175 15,855 16,433 (17) 21
Credit Valuation Adjustment and Qualifying Central Counterparties
7,344 11,402 10,997 - -
Total 332,834 944,115 937,158 343 573

ANZ Basel III Pillar 3 Disclosure September 2019
28
Table 7(b) part (ii): Exposure at Default by portfolio type10
Sep 19 Mar 19 Sep 18
Average for half year
Sep 19 Portfolio Type $M $M $M $M
Cash 55,083 61,314 57,604 58,199 Contingents liabilities, commitments, and other off-balance sheet exposures 160,293 157,005 153,021 158,649 Derivatives 53,716 43,924 42,752 48,820 Settlement Balances 26 8 16 17 Investment Securities 82,289 77,158 73,296 79,724 Net Loans, Advances & Acceptances 597,084 600,846 592,967 598,964 Other assets 4,627 5,348 4,387 4,988 Trading Securities 24,099 22,240 20,072 23,170
Total exposures 977,217 967,843 944,115 972,531
10 Average for half year is calculated as the simple average of the balances at the start and the end of each six month period.

ANZ Basel III Pillar 3 Disclosure September 2019
29
Table 7(c): Geographic distribution of Exposure at Default
Sep 19
Australia New Zealand
Asia Pacific, Europe and
Americas
Total Portfolio Type $M $M $M $M
Corporate 148,488 47,747 93,362 289,597 Sovereign 53,287 12,984 86,669 152,940 Bank 23,630 4,108 27,407 55,145 Residential Mortgage 290,239 83,137 445 373,821 Qualifying Revolving Retail 16,647 - - 16,647 Other Retail 24,734 11,588 49 36,371 Qualifying Central Counterparties 4,717 1,735 2,896 9,348 Specialised Lending 31,328 11,907 113 43,348
Total exposures 593,070 173,206 210,941 977,217
Mar 19
Australia New Zealand
Asia Pacific, Europe and
Americas
Total Portfolio Type $M $M $M $M
Corporate 137,863 47,503 86,158 271,524 Sovereign 50,526 12,732 86,402 149,660 Bank 27,287 4,124 23,618 55,029 Residential Mortgage 295,444 84,068 716 380,228 Qualifying Revolving Retail 17,589 - - 17,589 Other Retail 26,335 12,207 80 38,622 Qualifying Central Counterparties 8,826 1,222 2,482 12,530 Specialised Lending 30,225 12,294 142 42,661
Total exposures 594,095 174,150 199,598 967,843
Sep 18
Australia New Zealand
Asia Pacific, Europe and
Americas
Total Portfolio Type $M $M $M $M
Corporate 134,113 44,608 81,968 260,689 Sovereign 48,311 12,402 84,856 145,569 Bank 22,215 4,041 25,107 51,363 Residential Mortgage 298,367 78,206 704 377,277 Qualifying Revolving Retail 18,447 - - 18,447 Other Retail 27,956 11,863 87 39,906 Qualifying Central Counterparties 7,763 1,293 2,346 11,402 Specialised Lending 27,993 11,321 148 39,462
Total exposures 585,165 163,734 195,216 944,115
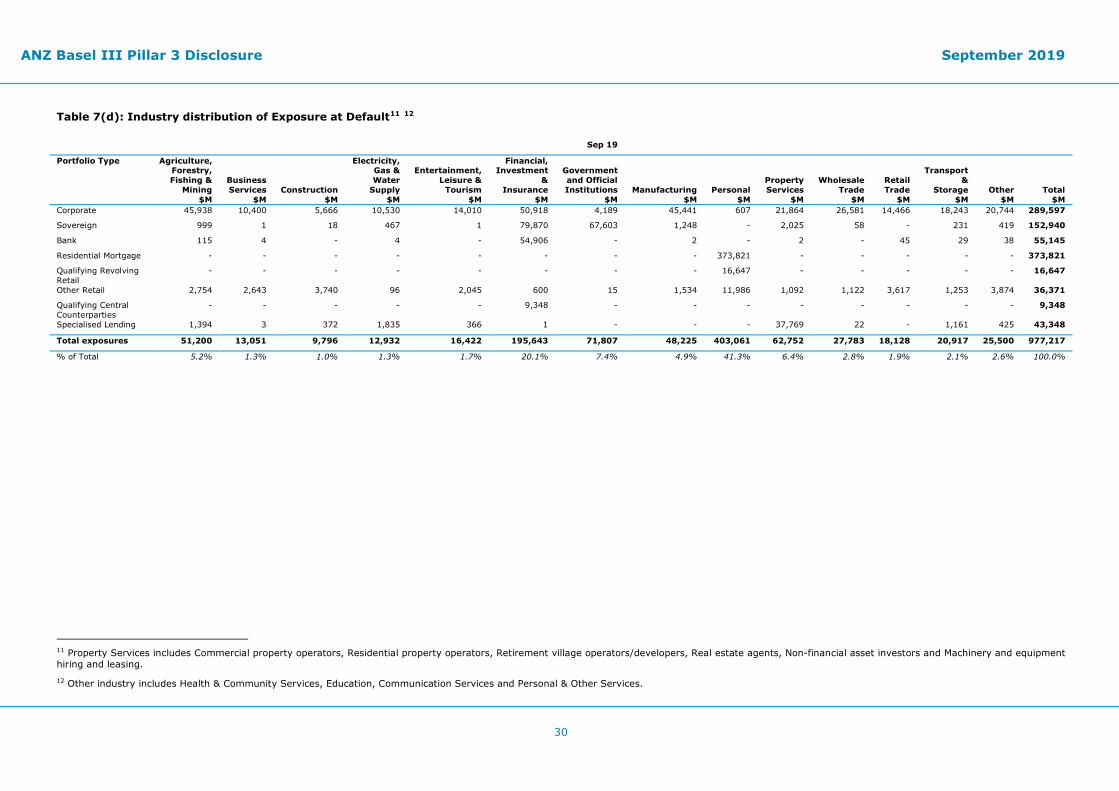
ANZ Basel III Pillar 3 Disclosure September 2019
30
Table 7(d): Industry distribution of Exposure at Default11 12 Sep 19
Portfolio Type Agriculture, Forestry, Fishing &
Mining $M
Business Services
$M Construction
$M
Electricity, Gas & Water
Supply $M
Entertainment, Leisure &
Tourism $M
Financial, Investment
& Insurance
$M
Government and Official Institutions
$M Manufacturing
$M Personal
$M
Property Services
$M
Wholesale Trade
$M
Retail Trade
$M
Transport &
Storage $M
Other $M
Total $M
Corporate 45,938 10,400 5,666 10,530 14,010 50,918 4,189 45,441 607 21,864 26,581 14,466 18,243 20,744 289,597
Sovereign 999 1 18 467 1 79,870 67,603 1,248 - 2,025 58 - 231 419 152,940
Bank 115 4 - 4 - 54,906 - 2 - 2 - 45 29 38 55,145
Residential Mortgage - - - - - - - - 373,821 - - - - - 373,821
Qualifying Revolving Retail
- - - - - - - - 16,647 - - - - - 16,647
Other Retail 2,754 2,643 3,740 96 2,045 600 15 1,534 11,986 1,092 1,122 3,617 1,253 3,874 36,371
Qualifying Central Counterparties
- - - - - 9,348 - - - - - - - - 9,348
Specialised Lending 1,394 3 372 1,835 366 1 - - - 37,769 22 - 1,161 425 43,348
Total exposures 51,200 13,051 9,796 12,932 16,422 195,643 71,807 48,225 403,061 62,752 27,783 18,128 20,917 25,500 977,217
% of Total 5.2% 1.3% 1.0% 1.3% 1.7% 20.1% 7.4% 4.9% 41.3% 6.4% 2.8% 1.9% 2.1% 2.6% 100.0%
11 Property Services includes Commercial property operators, Residential property operators, Retirement village operators/developers, Real estate agents, Non-financial asset investors and Machinery and equipment hiring and leasing. 12 Other industry includes Health & Community Services, Education, Communication Services and Personal & Other Services.

ANZ Basel III Pillar 3 disclosure September 2019
31
Table 7(d): Industry distribution of Exposure at Default (continued) Mar 19
Portfolio Type Agriculture, Forestry, Fishing &
Mining $M
Business Services
$M Construction
$M
Electricity, Gas & Water
Supply $M
Entertainment, Leisure &
Tourism $M
Financial, Investment
& Insurance
$M
Government and Official Institutions
$M Manufacturing
$M Personal
$M
Property Services
$M
Wholesale Trade
$M
Retail Trade
$M
Transport &
Storage $M
Other $M
Total $M
Corporate 45,087 10,230 5,777 9,385 13,754 44,455 3,178 40,719 680 21,220 26,539 14,321 16,360 19,819 271,524
Sovereign 1,015 2 17 495 - 81,015 62,735 1,415 - 2,035 64 - 254 613 149,660
Bank 1 1 - - - 54,921 - 2 - 2 6 42 54 - 55,029
Residential Mortgage - - - - - - - - 380,228 - - - - - 380,228
Qualifying Revolving Retail
- - - - - - - - 17,589 - - - - - 17,589
Other Retail 2,954 2,764 3,891 99 2,156 631 15 1,590 13,109 1,163 1,179 3,824 1,312 3,935 38,622
Qualifying Central Counterparties
- - - - - 12,530 - - - - - - - - 12,530
Specialised Lending 1,329 4 373 1,524 164 1 - 2 - 37,511 19 16 1,310 408 42,661
Total exposures 50,386 13,001 10,058 11,503 16,074 193,553 65,928 43,728 411,606 61,931 27,807 18,203 19,290 24,775 967,843
% of Total 5.2% 1.3% 1.0% 1.2% 1.7% 20.0% 6.8% 4.5% 42.5% 6.4% 2.9% 1.9% 2.0% 2.6% 100.0%
Sep 18
Portfolio Type Agriculture, Forestry, Fishing &
Mining $M
Business Services
$M
Construction $M
Electricity, Gas & Water
Supply $M
Entertainment, Leisure &
Tourism $M
Financial, Investment
& Insurance
$M
Government and Official Institutions
$M
Manufacturing $M
Personal $M
Property Services
$M
Wholesale Trade
$M
Retail Trade
$M
Transport &
Storage $M
Other $M
Total $M
Corporate 43,262 9,676 5,621 9,390 13,119 41,966 2,989 39,260 710 21,199 25,351 13,988 15,171 18,987 260,689
Sovereign 1,095 1 16 604 - 77,790 62,555 1,018 - 1,600 11 - 445 434 145,569
Bank 14 9 35 57 27 50,956 - 17 - 83 31 30 78 26 51,363
Residential Mortgage - - - - - - - - 377,277 - - - - - 377,277
Qualifying Revolving Retail
- - - - - - - - 18,447 - - - - - 18,447
Other Retail 3,046 2,887 4,000 104 2,239 663 16 1,634 13,567 1,212 1,213 4,013 1,353 3,959 39,906
Qualifying Central Counterparties
- - - - - 11,402 - - - - - - - - 11,402
Specialised Lending 1,283 5 367 1,212 77 1 - 3 - 34,868 14 16 1,054 562 39,462
Total exposures 48,700 12,578 10,039 11,367 15,462 182,778 65,560 41,932 410,001 58,962 26,620 18,047 18,101 23,968 944,115
% of Total 5.2% 1.3% 1.1% 1.2% 1.6% 19.5% 6.9% 4.4% 43.5% 6.2% 2.8% 1.9% 1.9% 2.5% 100.0%
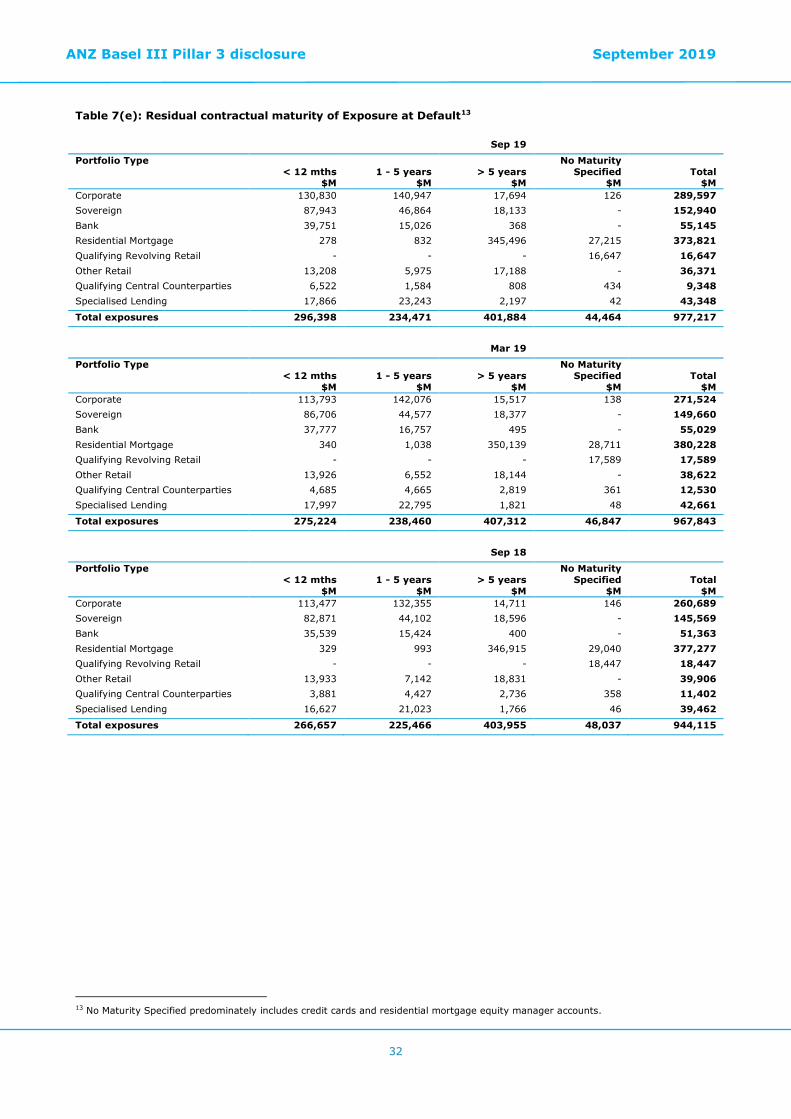
ANZ Basel III Pillar 3 disclosure September 2019
32
Table 7(e): Residual contractual maturity of Exposure at Default13
Sep 19
Portfolio Type < 12 mths
$M 1 - 5 years
$M > 5 years
$M
No Maturity Specified
$M Total
$M Corporate 130,830 140,947 17,694 126 289,597 Sovereign 87,943 46,864 18,133 - 152,940 Bank 39,751 15,026 368 - 55,145 Residential Mortgage 278 832 345,496 27,215 373,821 Qualifying Revolving Retail - - - 16,647 16,647 Other Retail 13,208 5,975 17,188 - 36,371 Qualifying Central Counterparties 6,522 1,584 808 434 9,348 Specialised Lending 17,866 23,243 2,197 42 43,348
Total exposures 296,398 234,471 401,884 44,464 977,217
Mar 19
Portfolio Type < 12 mths
$M 1 - 5 years
$M > 5 years
$M
No Maturity Specified
$M Total
$M Corporate 113,793 142,076 15,517 138 271,524 Sovereign 86,706 44,577 18,377 - 149,660 Bank 37,777 16,757 495 - 55,029 Residential Mortgage 340 1,038 350,139 28,711 380,228 Qualifying Revolving Retail - - - 17,589 17,589 Other Retail 13,926 6,552 18,144 - 38,622 Qualifying Central Counterparties 4,685 4,665 2,819 361 12,530 Specialised Lending 17,997 22,795 1,821 48 42,661
Total exposures 275,224 238,460 407,312 46,847 967,843
Sep 18
Portfolio Type < 12 mths
$M 1 - 5 years
$M > 5 years
$M
No Maturity Specified
$M Total
$M Corporate 113,477 132,355 14,711 146 260,689 Sovereign 82,871 44,102 18,596 - 145,569 Bank 35,539 15,424 400 - 51,363 Residential Mortgage 329 993 346,915 29,040 377,277 Qualifying Revolving Retail - - - 18,447 18,447 Other Retail 13,933 7,142 18,831 - 39,906 Qualifying Central Counterparties 3,881 4,427 2,736 358 11,402 Specialised Lending 16,627 21,023 1,766 46 39,462
Total exposures 266,657 225,466 403,955 48,037 944,115
13 No Maturity Specified predominately includes credit cards and residential mortgage equity manager accounts.
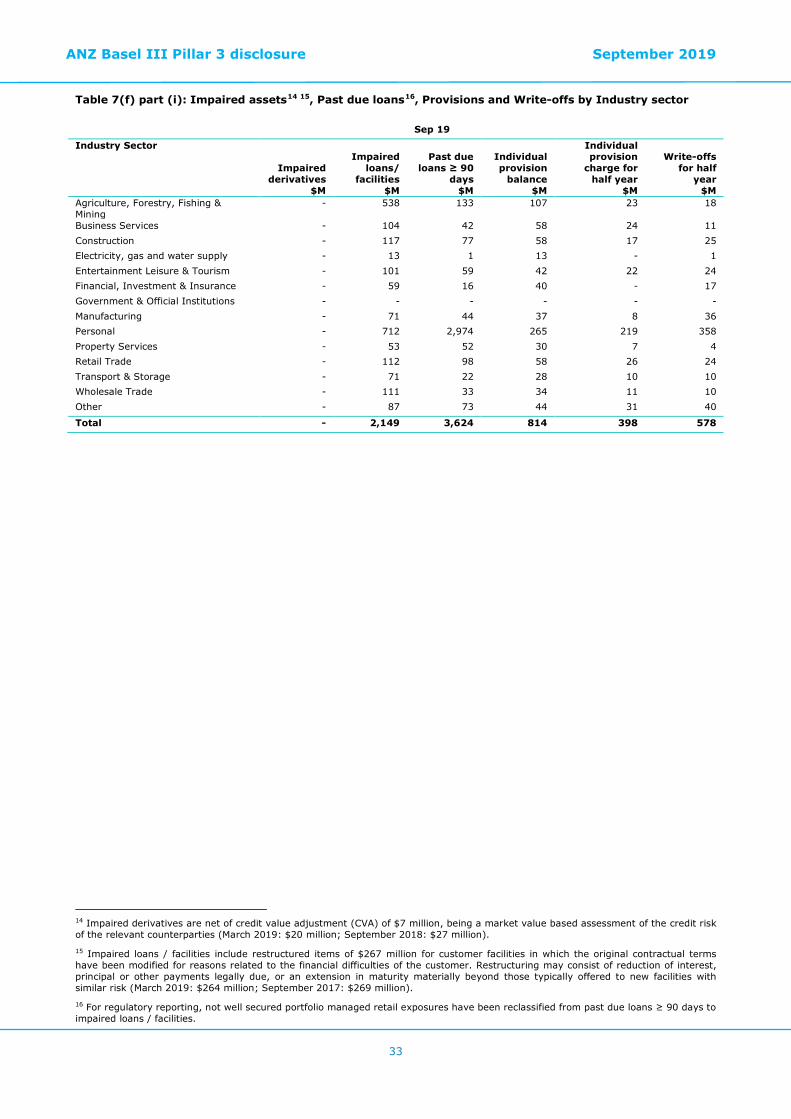
ANZ Basel III Pillar 3 disclosure September 2019
33
Table 7(f) part (i): Impaired assets14 15, Past due loans16, Provisions and Write-offs by Industry sector
Sep 19
Industry Sector
Impaired derivatives
$M
Impaired loans/
facilities $M
Past due loans ≥ 90
days $M
Individual provision
balance $M
Individual provision
charge for half year
$M
Write-offs for half
year $M
Agriculture, Forestry, Fishing & Mining
- 538 133 107 23 18
Business Services - 104 42 58 24 11 Construction - 117 77 58 17 25 Electricity, gas and water supply - 13 1 13 - 1 Entertainment Leisure & Tourism - 101 59 42 22 24 Financial, Investment & Insurance - 59 16 40 - 17 Government & Official Institutions - - - - - - Manufacturing - 71 44 37 8 36 Personal - 712 2,974 265 219 358 Property Services - 53 52 30 7 4 Retail Trade - 112 98 58 26 24 Transport & Storage - 71 22 28 10 10 Wholesale Trade - 111 33 34 11 10 Other - 87 73 44 31 40
Total - 2,149 3,624 814 398 578
14 Impaired derivatives are net of credit value adjustment (CVA) of $7 million, being a market value based assessment of the credit risk of the relevant counterparties (March 2019: $20 million; September 2018: $27 million). 15 Impaired loans / facilities include restructured items of $267 million for customer facilities in which the original contractual terms have been modified for reasons related to the financial difficulties of the customer. Restructuring may consist of reduction of interest, principal or other payments legally due, or an extension in maturity materially beyond those typically offered to new facilities with similar risk (March 2019: $264 million; September 2017: $269 million). 16 For regulatory reporting, not well secured portfolio managed retail exposures have been reclassified from past due loans ≥ 90 days to impaired loans / facilities.

ANZ Basel III Pillar 3 disclosure September 2019
34
Table 7(f) part (i): Impaired assets, Past due loans, Provisions and Write-offs by Industry sector (continued)17
Mar 19
Industry Sector
Impaired derivatives
$M
Impaired loans/
facilities $M
Past due loans ≥ 90
days $M
Individual provision
balance $M
Individual provision
charge for half year
$M
Write-offs for half
year $M
Agriculture, Forestry, Fishing & Mining
- 551 122 117 - 21
Business Services - 100 39 45 23 14 Construction - 130 61 59 21 18 Electricity, gas and water supply - 2 1 2 - - Entertainment Leisure & Tourism - 114 62 47 22 20 Financial, Investment & Insurance - 102 14 60 14 5 Government & Official Institutions - - - - - - Manufacturing - 105 27 65 1 36 Personal - 778 2,591 320 235 301 Property Services - 73 75 24 5 6 Retail Trade - 116 75 60 28 44 Transport & Storage - 70 16 25 10 8 Wholesale Trade - 48 25 29 4 9 Other - 77 82 38 17 16
Total - 2,266 3,190 891 380 498
Sep 18
Industry Sector
Impaired derivatives
$M
Impaired loans/
facilities $M
Past due loans ≥ 90
days $M
Individual provision
balance $M
Individual provision
charge for half year
$M
Write-offs for half
year $M
Agriculture, Forestry, Fishing & Mining
- 567 90 136 (12) 31
Business Services - 72 39 32 3 14 Construction - 118 62 53 6 26 Electricity, gas and water supply - 2 1 1 - - Entertainment Leisure & Tourism - 102 54 42 17 25 Financial, Investment & Insurance - 86 19 48 2 22 Government & Official Institutions - - - - - - Manufacturing - 140 23 102 (13) 23 Personal - 763 2,272 311 271 351 Property Services - 75 36 21 (3) 7 Retail Trade - 136 73 74 36 31 Transport & Storage - 72 20 22 12 10 Wholesale Trade - 65 20 33 2 16 Other - 77 66 45 22 17
Total - 2,275 2,775 920 343 573
17 In the September 2019 half, ANZ implemented a revised process for the identification of impaired assets, and a more market responsive collateral valuation methodology for the home loan portfolio in Australia which increased the number of home loans being classified as impaired rather than past due. Comparative information has not been restated for the change in methodology. Additional refinement to underlying processes and associated data resulted in the transfer of loans from past due and sub-standard categories into impaired assets. Comparative information has been restated with a transfer of $106 million at March 2019 and $126 million at September 2018.

ANZ Basel III Pillar 3 disclosure September 2019
35
Table 7(f) part (ii): Impaired asset, Past due loans, Provisions and Write-offs
Sep 19
Impaired derivatives
$M
Impaired loans/
facilities $M
Past due loans ≥ 90 days
$M
Individual provision
balance $M
Individual provision
charge for half year
$M
Write-offs
for half year
$M Portfolios subject to Advanced IRB approach
Corporate - 1,038 248 369 75 89 Sovereign - - - - - - Bank - - - - - - Residential Mortgage - 438 2,943 137 37 67 Qualifying Revolving Retail - 69 - - 87 126 Other Retail - 442 379 221 187 264
Total Advanced IRB approach - 1,987 3,570 727 386 546
Specialised Lending - 31 33 5 (2) 1
Portfolios subject to Standardised approach
Corporate - 106 14 75 11 26 Residential Mortgage - 10 6 7 3 1 Other Retail - 15 1 - - 4
Total Standardised approach - 131 21 82 14 31
Qualifying Central Counterparties - - - - - -
Total - 2,149 3,624 814 398 578

ANZ Basel III Pillar 3 disclosure September 2019
36
Table 7(f) part (ii): Impaired asset, Past due loans, Provisions and Write-offs (continued)18
Mar 19
Impaired derivatives
$M
Impaired loans/
facilities $M
Past due loans ≥ 90 days
$M
Individual provision
balance $M
Individual provision
charge for half year
$M
Write-offs
for half year
$M Portfolios subject to Advanced IRB approach
Corporate - 1,050 167 375 51 68 Sovereign - - - - - - Bank - - - - - - Residential Mortgage - 441 2,587 156 45 50 Qualifying Revolving Retail - 76 - - 85 123 Other Retail - 491 369 256 197 232
Total Advanced IRB approach - 2,058 3,123 787 378 473
Specialised Lending - 38 32 6 1 2
Portfolios subject to Standardised approach
Corporate - 138 14 87 1 19 Residential Mortgage - 19 13 9 (1) 1 Other Retail - 13 8 2 1 3
Total Standardised approach - 170 35 98 1 23
Qualifying Central Counterparties - - - - - -
Total - 2,266 3,190 891 380 498
Sep 18
Impaired derivatives
$M
Impaired loans/
facilities $M
Past due loans ≥ 90 days
$M
Individual provision
balance $M
Individual provision
charge for half year
$M
Write-offs
for half year
$M Portfolios subject to Advanced IRB approach
Corporate - 1,051 161 394 1 90 Sovereign - - - - (3) - Bank - - - - - - Residential Mortgage - 430 2,204 160 56 41 Qualifying Revolving Retail - 76 - - 93 140 Other Retail - 490 353 247 211 277
Total Advanced IRB approach - 2,047 2,718 801 358 548
Specialised Lending - 43 22 7 2 4
Portfolios subject to Standardised approach
Corporate - 150 17 101 (19) 15 Residential Mortgage - 20 12 9 1 3 Other Retail - 15 6 2 1 3
Total Standardised approach - 185 35 112 (17) 21
Qualifying Central Counterparties - - - - - -
Total - 2,275 2,775 920 343 573
18 In the September 2019 half, ANZ implemented a revised process for the identification of impaired assets, and a more market responsive collateral valuation methodology for the home loan portfolio in Australia which increased the number of home loans being classified as impaired rather than past due. Comparative information has not been restated for the change in methodology. Additional refinement to underlying processes and associated data resulted in the transfer of loans from past due and sub-standard categories into impaired assets. Comparative information has been restated with a transfer of $106 million at March 2019 and $126 million at September 2018.

ANZ Basel III Pillar 3 disclosure September 2019
37
Table 7(g): Impaired assets19 20 21, Past due loans22 and Provisions23 by Geography
Sep 19
Geographic region Impaired
derivatives $M
Impaired loans/
facilities $M
Past due loans
≥ 90 days $M
Individual provision
balance $M
Collective provision
balance $M
Australia - 1,678 3,312 598 2,470 New Zealand - 301 292 101 451 Asia Pacific, Europe and America - 170 20 115 455
Total - 2,149 3,624 814 3,376
Mar 19
Geographic region Impaired
derivatives $M
Impaired loans/
facilities $M
Past due loans
≥ 90 days $M
Individual provision
balance $M
Collective provision
balance $M
Australia - 1,743 2,898 656 2,484 New Zealand - 313 256 108 437 Asia Pacific, Europe and America - 210 36 127 457
Total - 2,266 3,190 891 3,378
Sep 18
Geographic region Impaired
derivatives $M
Impaired loans/
facilities $M
Past due loans
≥ 90 days $M
Individual provision
balance $M
Collective provision
balance $M
Australia - 1,716 2,557 650 1,796 New Zealand - 328 183 121 352 Asia Pacific, Europe and America - 231 35 149 375
Total - 2,275 2,775 920 2,523
19 Impaired derivatives are net of credit value adjustment (CVA) of $7 million, being a market value based assessment of the credit risk of the relevant counterparties (March 2019: $20 million; September 2018: $27 million). 20 Impaired loans / facilities include restructured items of $267 million for customer facilities in which the original contractual terms have been modified for reasons related to the financial difficulties of the customer. Restructuring may consist of reduction of interest, principal or other payments legally due, or an extension in maturity materially beyond those typically offered to new facilities with similar risk (March 2019: $264 million; September 2017: $269 million). 21 In the September 2019 half, ANZ implemented a revised process for the identification of impaired assets, and a more market responsive collateral valuation methodology for the home loan portfolio in Australia which increased the number of home loans being classified as impaired rather than past due. Comparative information has not been restated for the change in methodology. Additional refinement to underlying processes and associated data resulted in the transfer of loans from past due and sub-standard categories into impaired assets. Comparative information has been restated with a transfer of $106 million at March 2019 and $126 million at September 2018. 22 For regulatory reporting, not well secured portfolio managed retail exposures have been reclassified from past due loans ≥ 90 days to impaired loans / facilities. 23 Due to definitional differences, there is a variation in the split between ANZ’s Individual Provision and Collective Provision for accounting purposes and the Specific Provision and General Reserve for Credit Losses (GRCL) for regulatory purposes. This does not impact total provisions, and essentially relates to the classification of collectively assessed provisions on defaulted accounts. The disclosures in this document are based on Individual Provision and Collective Provision, for ease of comparison with other published results.

ANZ Basel III Pillar 3 disclosure September 2019
38
Table 7(h): Provision for Credit Impairment
Half year
Sep 19 Half year
Mar 19 Half year
Sep 18 Collectively Assessed Provision $M $M $M
Balance at start of period 3,378 3,336 2,579 Charge/(Release) to Income Statement 4 12 (63) Adjustment for exchange rate fluctuations and transfers 6 30 7 Asia divestment24 (11) - - less: Investment securities at FVOCI25 1 - -
Total Collectively Assessed Provision 3,376 3,378 2,523
1 October Transition to AASB 9 813
Total Collectively Assessed Provision 3,336
Individually Assessed Provision
Balance at start of period 891 920 1,016 New and increased provisions 750 625 716 Write-backs (233) (152) (234) Adjustment for exchange rate fluctuations and transfers 2 7 5 Discount unwind (12) (11) (10) Bad debts written off (578) (498) (573) Asia divestment24 (6) - -
Total Individually Assessed Provision 814 891 920
Total Provisions for Credit Impairment 4,190 4,269 3,443
1 October Transition to AASB 9 Total Provisions for Credit Impairment 4,256
24 Sale of ANZ Royal Bank (Cambodia) Ltd and Papua New Guinea Retail, Commercial and Small-Medium Sized Enterprise businesses. 25 The allowance for ECL on Investment Securities at FVOCI is recognised in the FVOCI reserve in equity with a corresponding charge to profit or loss.
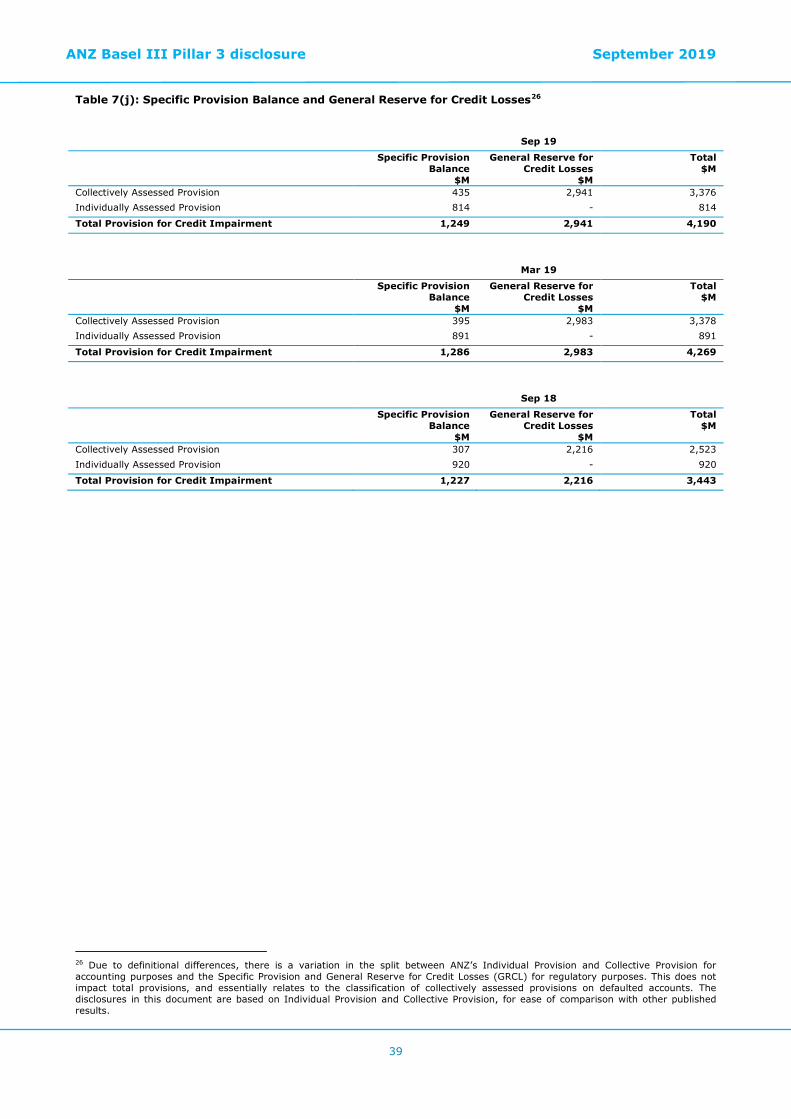
ANZ Basel III Pillar 3 disclosure September 2019
39
Table 7(j): Specific Provision Balance and General Reserve for Credit Losses26 S
Sep 19
Specific Provision Balance
$M
General Reserve for Credit Losses
$M
Total $M
Collectively Assessed Provision 435 2,941 3,376 Individually Assessed Provision 814 - 814
Total Provision for Credit Impairment 1,249 2,941 4,190
Mar 19
Specific Provision Balance
$M
General Reserve for Credit Losses
$M
Total $M
Collectively Assessed Provision 395 2,983 3,378 Individually Assessed Provision 891 - 891
Total Provision for Credit Impairment 1,286 2,983 4,269
Sep 18
Specific Provision Balance
$M
General Reserve for Credit Losses
$M
Total $M
Collectively Assessed Provision 307 2,216 2,523 Individually Assessed Provision 920 - 920
Total Provision for Credit Impairment 1,227 2,216 3,443
26 Due to definitional differences, there is a variation in the split between ANZ’s Individual Provision and Collective Provision for accounting purposes and the Specific Provision and General Reserve for Credit Losses (GRCL) for regulatory purposes. This does not impact total provisions, and essentially relates to the classification of collectively assessed provisions on defaulted accounts. The disclosures in this document are based on Individual Provision and Collective Provision, for ease of comparison with other published results.

ANZ Basel III Pillar 3 disclosure September 2019
40
Table 8 Credit risk – Disclosures for portfolios subject to the Standardised approach and supervisory risk weights in the IRB approach
Table 8(b): Exposure at Default by risk bucket27 Sep 19 Mar 19 Sep 18 Standardised approach exposures $M $M $M
0% 1 - - 20% 277 383 487 35% 195 362 359 50% 2,680 2,589 2,351 75% - - - 100% 10,152 10,658 12,467 150% 184 320 188 >150% 3 3 3 Capital deductions - - -
Total 13,492 14,315 15,855
Other Asset exposures
0% - - - 20% 767 818 865 35% - - - 50% - - - 75% - - - 100% 3,127 3,415 2,974 150% - - - >150% - - - Capital deductions - - -
Total 3,894 4,233 3,839
Specialised Lending exposures
0% 181 201 193 70% 20,691 20,389 18,225 90% 19,869 19,369 18,402 115% 1,900 2,046 2,084 250% 707 656 558
Total 43,348 42,661 39,462
27 Table 8(b) shows exposure at default after credit risk mitigation in each risk category.
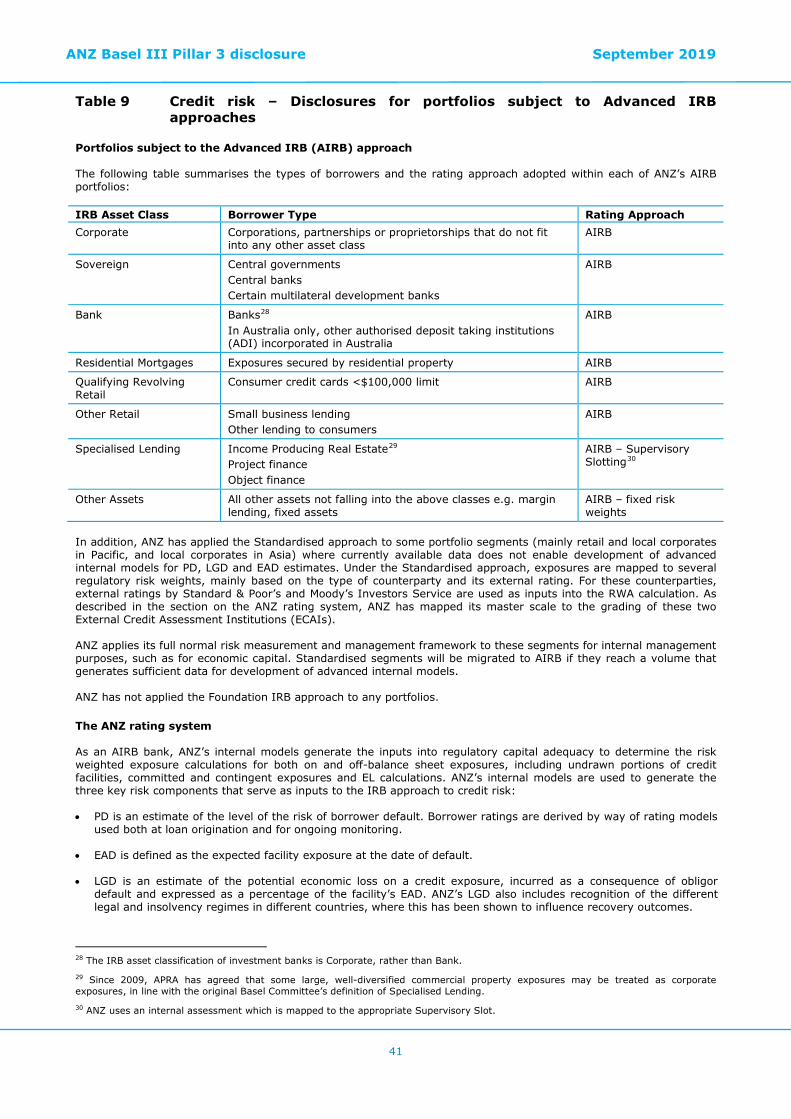
ANZ Basel III Pillar 3 disclosure September 2019
41
Table 9 Credit risk – Disclosures for portfolios subject to Advanced IRB approaches
Portfolios subject to the Advanced IRB (AIRB) approach The following table summarises the types of borrowers and the rating approach adopted within each of ANZ’s AIRB portfolios: IRB Asset Class Borrower Type Rating Approach Corporate Corporations, partnerships or proprietorships that do not fit
into any other asset class AIRB
Sovereign Central governments Central banks Certain multilateral development banks
AIRB
Bank Banks28 In Australia only, other authorised deposit taking institutions (ADI) incorporated in Australia
AIRB
Residential Mortgages Exposures secured by residential property AIRB
Qualifying Revolving Retail
Consumer credit cards <$100,000 limit AIRB
Other Retail Small business lending Other lending to consumers
AIRB
Specialised Lending Income Producing Real Estate29 Project finance Object finance
AIRB – Supervisory Slotting30
Other Assets All other assets not falling into the above classes e.g. margin lending, fixed assets
AIRB – fixed risk weights
In addition, ANZ has applied the Standardised approach to some portfolio segments (mainly retail and local corporates in Pacific, and local corporates in Asia) where currently available data does not enable development of advanced internal models for PD, LGD and EAD estimates. Under the Standardised approach, exposures are mapped to several regulatory risk weights, mainly based on the type of counterparty and its external rating. For these counterparties, external ratings by Standard & Poor’s and Moody’s Investors Service are used as inputs into the RWA calculation. As described in the section on the ANZ rating system, ANZ has mapped its master scale to the grading of these two External Credit Assessment Institutions (ECAIs). ANZ applies its full normal risk measurement and management framework to these segments for internal management purposes, such as for economic capital. Standardised segments will be migrated to AIRB if they reach a volume that generates sufficient data for development of advanced internal models. ANZ has not applied the Foundation IRB approach to any portfolios.
The ANZ rating system As an AIRB bank, ANZ’s internal models generate the inputs into regulatory capital adequacy to determine the risk weighted exposure calculations for both on and off-balance sheet exposures, including undrawn portions of credit facilities, committed and contingent exposures and EL calculations. ANZ’s internal models are used to generate the three key risk components that serve as inputs to the IRB approach to credit risk: • PD is an estimate of the level of the risk of borrower default. Borrower ratings are derived by way of rating models
used both at loan origination and for ongoing monitoring.
• EAD is defined as the expected facility exposure at the date of default.
• LGD is an estimate of the potential economic loss on a credit exposure, incurred as a consequence of obligor default and expressed as a percentage of the facility’s EAD. ANZ’s LGD also includes recognition of the different legal and insolvency regimes in different countries, where this has been shown to influence recovery outcomes.
28 The IRB asset classification of investment banks is Corporate, rather than Bank. 29 Since 2009, APRA has agreed that some large, well-diversified commercial property exposures may be treated as corporate exposures, in line with the original Basel Committee’s definition of Specialised Lending. 30 ANZ uses an internal assessment which is mapped to the appropriate Supervisory Slot.

ANZ Basel III Pillar 3 disclosure September 2019
42
Effective maturity is also calculated as an input to the risk weighted exposure calculation for bank, sovereign and corporate IRB asset classes. ANZ’s rating system has two separate and distinct dimensions that:
• Measure the PD, which is expressed by the Customer Credit Rating (CCR), reflecting the ability to service and repay debt.
• Measure the LGD as expressed by the Security Indicator (SI) ranging from A to G. The SI is calculated by reference to the percentage of a loan covered by security which can be realised in the event of default. This calculation uses standard ratios to adjust the current market value of collateral items to allow for historical realisation outcomes. The security-related SIs are supplemented with a range of other SIs which cover such factors as cash cover, mezzanine finance, intra-group guarantees and sovereign backing as ANZ’s LGD research indicates that these transaction characteristics have different recovery outcomes. ANZ’s LGD also includes recognition of the different legal and insolvency regimes in different countries, where this has been shown to influence recovery outcomes.
ANZ’s corporate PD master scale is APRA approved, and is made up of 27 rating grades. Each level/grade is separately defined and has a range of default probabilities attached to it. The PD master scale enables ANZ’s rating system to be mapped to the grading’s of external rating agencies, using the PD as a common element after ensuring that default definitions and other key attributes are aligned. The following table demonstrates this alignment (for one year PDs): ANZ CCR Moody’s Standard & Poor’s PD Range 0+ to 1- Aaa to Aa3 AAA to AA- 0.0000 - 0.0346% 2+ to 3+ A1 to Baa1 A+ to BBB+ 0.0347 - 0.1636% 3= to 4+ Baa2 to > Baa3 BBB to > BB+ 0.1637 - 0.4004% 4= to 6= Ba1 to B1 BB+ to B+ 0.4005 – 2.7550% 6- to 7= B2 to B3 B to B- 2.7551 – 9.7980% 7- to 8+ Caa CCC 9.7981 – 27.1109% 8= Ca, C CC, C 27.1110 – 99.9999% 8-, 9 and 10 Default Default 100% In the retail asset classes, most facilities utilise credit rating scores. The scores are calibrated to PDs, and used to allocate exposures to homogenous pools, along with LGD and EAD. Use of internal estimates other than for regulatory capital purposes ANZ’s rating system is a fundamental part of credit management and plays a key role in: • Lending discretions, • Minimum origination standards, • Concentration limits, • Portfolio reporting, • Customer profitability measurement, • Collectively assessed provision measurement, • Management of deteriorating customers (where certain CCR/SI combinations trigger increasing
scrutiny), and • Pricing decisions.
ANZ Basel III Pillar 3 disclosure September 2019
43
PD, LGD and EAD are used in the calculation of capital and in the collectively assessed provisioning process. Regulatory and economic capital are calculated from the same data sources and starting from the same basis, however there are some differences between the factors used because several aspects of ANZ’s rating system are adjusted in accordance with APRA requirements for regulatory capital purposes. The most significant of these adjustments are the use for regulatory capital purposes of downturn LGDs; the imposition of a 20% LGD floor for exposures secured by Australian residential real estate and the mandatory use of the supervisory slotting approach for project finance and most commercial real estate exposures. Controls surrounding the ratings system ANZ’s rating system and credit risk estimates are governed by the Board Risk Committee and several executive management committees, and are underpinned by a comprehensive framework of controls that operate throughout ANZ. All policies, methodologies, model designs, model reviews, validations, responsibilities, systems and processes supporting the ratings systems are documented, and subject to review by Global Internal Audit. The design, build and implementation of credit rating models resides with a specialist Group-level team. Credit rating models are owned by central Risk teams. The use (including overrides) and performance of credit rating models is monitored by the relevant business and their counterparts in Risk, and validated regularly by a separate specialist Group-level function. This cycle of design, build, implementation, monitoring and validation is overseen by the CRSOC, and informs the need for new models or recalibration of existing models. Group Credit Assurance (within Global Internal Audit) provides third line independent credit related assurance activities, including providing an independent assessment of both the asset quality in the portfolio and the quality of credit decision making. It also assesses management controls from a “top down” portfolio oversight perspective as well as credit risk processes from a “bottom up” perspective based on individual customer file reviews. Risk grades are an integral part of reporting to the Board and executives. In addition, the use of the rating system’s outputs in key business unit performance measures in processes such as provisioning and the allocation of capital ensure that the rating system receives robust input from the business units, not just the specialist modelling teams. Rating process by asset class Building reliable and accurate rating tools requires balancing of many factors including data availability (external data may be used in some circumstances, where it is relevant), the size of the segment (the more customers within the segment, the more likely that statistically reliable models can be built), and the need to be able to validate the model. Rating tool approaches include: • Statistical models producing a PD or a LGD, which are developed from internal or external data on defaults. • Statistical models producing an internal rating, which involve calibrating ANZ’s models to external rating data
where data on defaults is insufficient for statistical purposes (such as banks). • Hybrid statistical and expert models producing an internal rating, which use a mixture of default data and expert
input. • Expert models/processes that produce an internal rating, including external rating agency replication models. Ongoing data collection and testing processes ensure enhanced or new models are introduced as required to maintain and improve the accuracy and reliability of rating processes.
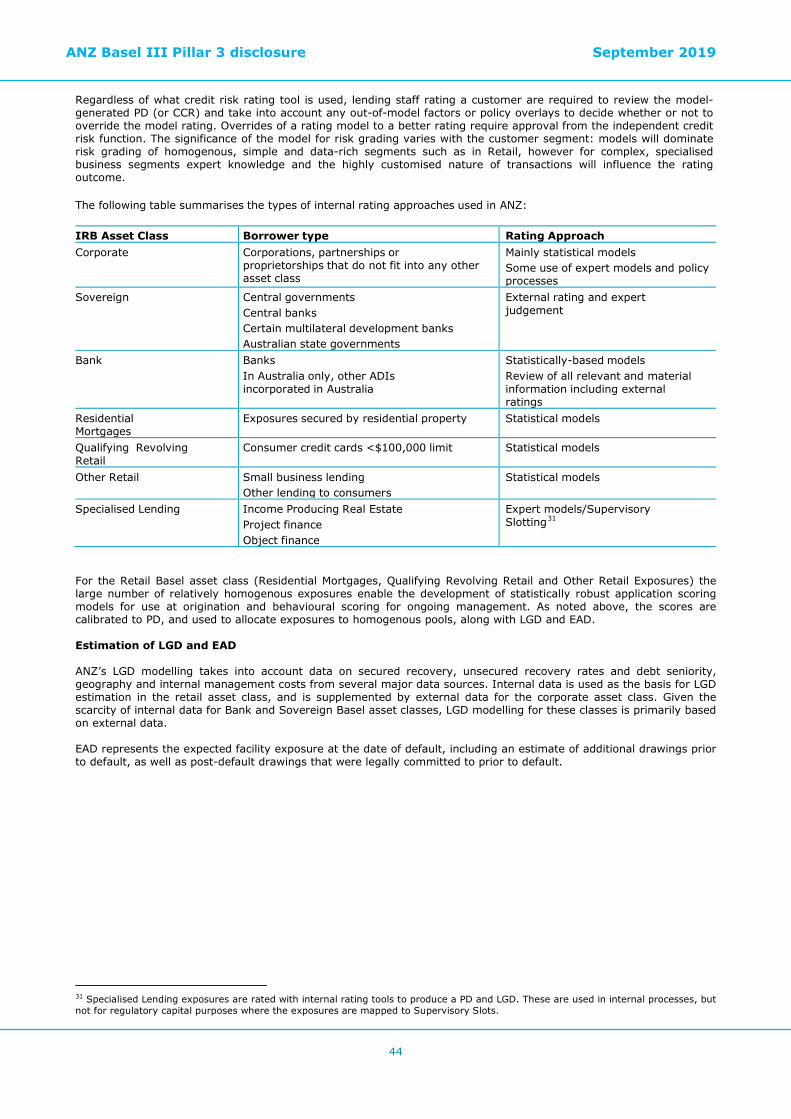
ANZ Basel III Pillar 3 disclosure September 2019
44
Regardless of what credit risk rating tool is used, lending staff rating a customer are required to review the model-generated PD (or CCR) and take into account any out-of-model factors or policy overlays to decide whether or not to override the model rating. Overrides of a rating model to a better rating require approval from the independent credit risk function. The significance of the model for risk grading varies with the customer segment: models will dominate risk grading of homogenous, simple and data-rich segments such as in Retail, however for complex, specialised business segments expert knowledge and the highly customised nature of transactions will influence the rating outcome. The following table summarises the types of internal rating approaches used in ANZ: IRB Asset Class Borrower type Rating Approach Corporate Corporations, partnerships or
proprietorships that do not fit into any other asset class
Mainly statistical models Some use of expert models and policy processes
Sovereign Central governments Central banks Certain multilateral development banks Australian state governments
External rating and expert judgement
Bank Banks In Australia only, other ADIs incorporated in Australia
Statistically-based models Review of all relevant and material information including external ratings
Residential Mortgages
Exposures secured by residential property Statistical models
Qualifying Revolving Retail
Consumer credit cards <$100,000 limit Statistical models
Other Retail Small business lending Other lending to consumers
Statistical models
Specialised Lending Income Producing Real Estate Project finance Object finance
Expert models/Supervisory Slotting31
For the Retail Basel asset class (Residential Mortgages, Qualifying Revolving Retail and Other Retail Exposures) the large number of relatively homogenous exposures enable the development of statistically robust application scoring models for use at origination and behavioural scoring for ongoing management. As noted above, the scores are calibrated to PD, and used to allocate exposures to homogenous pools, along with LGD and EAD. Estimation of LGD and EAD ANZ’s LGD modelling takes into account data on secured recovery, unsecured recovery rates and debt seniority, geography and internal management costs from several major data sources. Internal data is used as the basis for LGD estimation in the retail asset class, and is supplemented by external data for the corporate asset class. Given the scarcity of internal data for Bank and Sovereign Basel asset classes, LGD modelling for these classes is primarily based on external data. EAD represents the expected facility exposure at the date of default, including an estimate of additional drawings prior to default, as well as post-default drawings that were legally committed to prior to default.
31 Specialised Lending exposures are rated with internal rating tools to produce a PD and LGD. These are used in internal processes, but not for regulatory capital purposes where the exposures are mapped to Supervisory Slots.

ANZ Basel III Pillar 3 disclosure September 2019
45
Table 9(d): Non Retail Exposure at Default subject to Advanced Internal Ratings Based (IRB) approach32 33 34
Sep 19
AAA < A+
$M
A+ < BBB
$M
BBB < BB+
$M
BB+ < B+
$M
B+ < CCC
$M CCC $M
Default $M
Total $M
Exposure at Default Corporate 28,676 83,292 88,656 56,847 14,923 2,151 2,054 276,599 Sovereign 121,380 26,556 2,315 898 1,768 22 1 152,940 Bank 17,972 31,295 4,321 1,529 24 4 - 55,145
Total 168,028 141,143 95,292 59,274 16,715 2,177 2,055 484,684
% of Total 34.8% 29.1% 19.7% 12.2% 3.4% 0.4% 0.4% 100.0%
Undrawn commitments (included in above) Corporate 7,689 32,168 22,657 8,018 1,620 205 58 72,415 Sovereign 1,194 54 1 10 4 - - 1,263 Bank 47 442 28 - 2 - - 519
Total 8,930 32,664 22,686 8,028 1,626 205 58 74,197
Average Exposure at Default Corporate 12.281 10.124 1.790 0.698 0.133 0.217 0.730 1.039 Sovereign 166.960 491.771 38.586 11.662 21.047 5.615 0.204 151.426 Bank 6.600 6.072 4.163 4.444 0.654 0.240 - 5.922
Exposure-weighted average Loss Given Default (%) Corporate 54.6% 56.5% 46.8% 36.8% 33.8% 39.2% 41.2% 47.7% Sovereign 5.1% 12.9% 40.8% 42.5% 51.4% 58.3% 5.6% 7.7% Bank 63.9% 61.7% 64.3% 68.5% 67.7% 72.5% - 62.8%
Exposure-weighted average risk weight (%) Corporate 17.1% 32.9% 52.9% 62.6% 88.3% 190.5% 108.0% 48.5% Sovereign 0.9% 3.3% 42.0% 80.8% 138.1% 318.9% - 4.1% Bank 19.5% 25.3% 63.7% 113.7% 183.3% 391.1% - 29.0%
32 In accordance with APS 330, EAD in Table 9(d) includes Advanced IRB exposures and excludes Specialised Lending, Standardised, Securitisation, Equities or Other Assets exposures. Specialised Lending is excluded from Table 9(d) as it follows the Supervisory Slotting treatment, and a breakdown of risk weightings is provided in Table 8(b). 33 Average EAD is calculated as total EAD post risk mitigants divided by the total number of credit risk generating exposures. 34 Exposure-weighted average risk weight (%) is calculated as CRWA divided by EAD.

ANZ Basel III Pillar 3 disclosure September 2019
46
Table 9(d): Non Retail Exposure at Default subject to Advanced Internal Ratings Based (IRB) approach (continued)
Mar 19
AAA < A+
$M
A+ < BBB
$M
BBB < BB+
$M
BB+ < B+
$M
B+ < CCC
$M CCC $M
Default $M
Total $M
Exposure at Default Corporate 24,071 75,429 82,915 57,029 14,719 2,105 1,737 258,005 Sovereign 121,841 22,498 2,180 649 2,458 33 1 149,660 Bank 22,421 27,875 3,677 916 136 4 - 55,029
Total 168,333 125,802 88,772 58,594 17,313 2,142 1,738 462,694
% of Total 36.3% 27.2% 19.2% 12.7% 3.7% 0.5% 0.4% 100.0%
Undrawn commitments (included in above) Corporate 7,415 29,225 21,602 8,829 1,573 231 42 68,917 Sovereign 1,305 47 111 12 2 - - 1,477 Bank 1 587 28 - - - - 616
Total 8,721 29,859 21,741 8,841 1,575 231 42 71,010
Average Exposure at Default Corporate 10.996 8.165 1.639 0.688 0.131 0.217 0.628 0.958 Sovereign 168.289 368.813 31.597 9.136 30.727 11.051 0.277 148.032 Bank 10.800 5.413 8.755 3.878 4.401 0.158 - 6.931
Exposure-weighted average Loss Given Default (%) Corporate 54.5% 56.2% 45.8% 37.1% 34.1% 39.8% 46.1% 47.0% Sovereign 5.3% 11.8% 35.7% 45.8% 54.1% 60.0% 5.0% 7.7% Bank 63.8% 61.6% 64.3% 68.7% 66.1% 71.1% - 62.8%
Exposure-weighted average risk weight (%) Corporate 17.7% 32.4% 51.3% 63.5% 89.6% 187.6% 116.7% 49.1% Sovereign 1.0% 3.1% 38.1% 91.4% 147.0% 310.0% - 4.7% Bank 19.6% 27.2% 64.7% 115.2% 193.9% 376.2% - 28.5%
Sep 18
AAA < A+
$M
A+ < BBB
$M
BBB < BB+
$M
BB+ < B+
$M
B+ < CCC
$M
CCC $M
Default $M
Total $M
Exposure at Default Corporate 24,269 68,253 79,833 54,934 14,790 1,636 1,910 245,625 Sovereign 120,919 19,532 1,822 903 2,375 17 1 145,569 Bank 17,177 27,971 4,183 1,917 109 6 - 51,363
Total 162,365 115,756 85,838 57,754 17,274 1,659 1,911 442,557
% of Total 36.7% 26.2% 19.4% 13.1% 3.9% 0.4% 0.4% 100.0%
Undrawn commitments (included in above) Corporate 8,015 24,703 22,462 7,943 1,631 245 33 65,032 Sovereign 952 68 - 11 2 - - 1,033 Bank 6 450 28 131 3 - - 618
Total 8,973 25,221 22,490 8,085 1,636 245 33 66,683
Average Exposure at Default Corporate 11.109 8.117 1.603 0.651 0.130 0.172 0.714 0.911 Sovereign 161.225 542.567 31.972 9.219 30.444 5.712 0.653 142.296 Bank 12.013 7.359 11.951 6.223 0.998 0.209 - 8.514
Exposure-weighted average Loss Given Default (%) Corporate 55.7% 55.8% 46.5% 37.0% 33.8% 38.7% 43.6% 47.0% Sovereign 5.3% 11.5% 39.9% 46.7% 53.9% 60.0% 5.0% 7.6% Bank 63.5% 62.5% 65.0% 65.0% 34.8% 42.7% - 63.0%
Exposure-weighted average risk weight (%) Corporate 18.5% 32.3% 52.2% 63.2% 88.0% 180.6% 109.6% 49.2% Sovereign 1.0% 3.0% 43.0% 94.7% 146.5% 267.3% - 4.8% Bank 20.3% 26.4% 65.1% 113.1% 114.2% 251.7% - 31.0%

ANZ Basel III Pillar 3 disclosure September 2019
47
Table 9(d): Retail Exposure at Default subject to Advanced Internal Ratings Based (IRB) approach by risk grade
Sep 19
0.00% <0.11%
$M
0.11% <0.30%
$M
0.30% <0.51%
$M
0.51% <3.49%
$M
3.49% <10.09%
$M
10.09% <100.00%
$M Default
$M Total
$M Exposure at Default Residential Mortgage 71,738 98,315 59,839 129,754 6,916 3,383 3,431 373,376 Qualifying Revolving Retail 5,635 3,681 1,317 3,996 1,334 617 67 16,647 Other Retail 1,050 5,289 2,307 20,070 4,672 1,969 965 36,322
Total 78,423 107,285 63,463 153,820 12,922 5,969 4,463 426,345
% of Total 18.4% 25.2% 14.9% 36.1% 3.0% 1.4% 1.0% 100.0%
Undrawn commitments (included in above) Residential Mortgage 15,322 7,393 2,870 7,233 33 32 - 32,883 Qualifying Revolving Retail 4,106 2,757 819 1,463 290 53 2 9,490 Other Retail 803 3,354 1,488 2,666 488 76 9 8,884
Total 20,231 13,504 5,177 11,362 811 161 11 51,257
Average Exposure at Default Residential Mortgage 0.253 0.228 0.255 0.262 0.343 0.326 0.274 0.251 Qualifying Revolving Retail 0.009 0.008 0.008 0.010 0.010 0.006 0.009 0.009 Other Retail 0.008 0.016 0.011 0.024 0.009 0.011 0.027 0.016
Exposure-weighted average Loss Given Default (%) Residential Mortgage 19.7% 18.3% 19.2% 20.8% 20.3% 20.0% 19.9% 19.6% Qualifying Revolving Retail 75.6% 80.1% 77.7% 81.3% 84.9% 82.6% 83.5% 79.2% Other Retail 55.9% 54.0% 73.6% 45.4% 67.3% 54.8% 45.6% 52.1%
Exposure-weighted average risk weight (%) Residential Mortgage 5.9% 11.3% 19.0% 39.6% 93.9% 127.1% 197.0% 25.6% Qualifying Revolving Retail 3.5% 8.1% 16.2% 45.0% 105.5% 203.0% 230.7% 32.0% Other Retail 14.4% 22.7% 51.4% 59.1% 116.5% 170.9% 236.9% 70.2%

ANZ Basel III Pillar 3 disclosure September 2019
48
Table 9(d): Retail Exposure at Default subject to Advanced Internal Ratings Based (IRB) approach by risk grade
Mar 19
0.00% <0.11%
$M
0.11% <0.30%
$M
0.30% <0.51%
$M
0.51% <3.49%
$M
3.49% <10.09%
$M
10.09% <100.00%
$M Default
$M Total
$M Exposure at Default Residential Mortgage 72,179 101,882 62,220 129,353 7,357 3,477 3,044 379,512 Qualifying Revolving Retail 5,700 3,914 1,358 4,262 1,638 644 73 17,589 Other Retail 1,101 5,542 2,448 21,259 5,052 2,142 998 38,542
Total 78,980 111,338 66,026 154,874 14,047 6,263 4,115 435,643
% of Total 18.1% 25.6% 15.2% 35.6% 3.2% 1.4% 0.9% 100.0%
Undrawn commitments (included in above) Residential Mortgage 15,461 7,497 2,782 7,197 31 22 1 32,991 Qualifying Revolving Retail 4,178 2,943 828 1,587 446 60 2 10,044 Other Retail 833 3,575 1,577 2,809 513 77 8 9,392
Total 20,472 14,015 5,187 11,593 990 159 11 52,427
Average Exposure at Default Residential Mortgage 0.250 0.232 0.258 0.259 0.340 0.326 0.275 0.251 Qualifying Revolving Retail 0.009 0.008 0.008 0.011 0.010 0.006 0.009 0.009 Other Retail 0.008 0.016 0.013 0.024 0.009 0.012 0.026 0.017
Exposure-weighted average Loss Given Default (%) Residential Mortgage 19.7% 18.4% 19.2% 20.7% 20.3% 20.0% 19.9% 19.6% Qualifying Revolving Retail 75.6% 80.5% 77.6% 81.4% 84.6% 82.7% 83.6% 79.4% Other Retail 55.3% 54.7% 73.2% 45.6% 66.4% 56.6% 47.1% 52.3%
Exposure-weighted average risk weight (%) Residential Mortgage 5.9% 11.5% 19.1% 39.8% 94.1% 127.6% 188.2% 25.5% Qualifying Revolving Retail 3.5% 8.1% 16.2% 45.4% 105.0% 201.7% 230.3% 33.3% Other Retail 29.7% 37.0% 55.6% 59.5% 115.7% 170.2% 221.7% 72.7%
Sep 18
0.00% <0.11%
$M
0.11% <0.30%
$M
0.30% <0.51%
$M
0.51% <3.49%
$M
3.49% <10.09%
$M
10.09% <100.00%
$M Default
$M Total
$M Exposure at Default Residential Mortgage 72,571 100,911 61,451 127,212 7,944 3,830 2,654 376,573 Qualifying Revolving Retail 5,776 3,911 1,521 4,695 1,767 703 74 18,447 Other Retail 1,056 5,353 2,384 22,156 5,780 2,125 965 39,819
Total 79,403 110,175 65,356 154,063 15,491 6,658 3,693 434,839
% of Total 18.3% 25.3% 15.0% 35.4% 3.6% 1.5% 0.8% 100.0%
Undrawn commitments (included in above) Residential Mortgage 15,368 7,284 2,689 7,431 37 27 1 32,837 Qualifying Revolving Retail 4,225 2,957 982 1,948 507 79 1 10,699 Other Retail 811 3,418 1,544 2,945 546 81 8 9,353
Total 20,404 13,659 5,215 12,324 1,090 187 10 52,889
Average Exposure at Default Residential Mortgage 0.251 0.231 0.252 0.248 0.332 0.324 0.272 0.246 Qualifying Revolving Retail 0.009 0.008 0.009 0.011 0.010 0.006 0.009 0.009 Other Retail 0.008 0.015 0.012 0.025 0.010 0.011 0.027 0.017
Exposure-weighted average Loss Given Default (%) Residential Mortgage 19.7% 18.5% 19.2% 20.7% 20.3% 20.0% 19.9% 19.7% Qualifying Revolving Retail 75.5% 80.2% 77.5% 81.3% 84.7% 82.8% 83.5% 79.3% Other Retail 56.6% 54.5% 73.6% 45.2% 65.1% 57.7% 46.8% 52.0%
Exposure-weighted average risk weight (%) Residential Mortgage 5.9% 11.6% 19.3% 40.0% 94.1% 127.7% 190.5% 25.6% Qualifying Revolving Retail 3.5% 8.1% 16.3% 44.8% 105.1% 201.4% 232.6% 34.2% Other Retail 30.5% 36.9% 55.8% 59.1% 112.7% 172.4% 255.0% 73.8%

ANZ Basel III Pillar 3 disclosure September 2019
49
Table 9(e): Actual Losses by portfolio type Half year Sep 19
Basel Asset Class Individual provision charge $M
Write-offs $M
Corporate 75 89 Sovereign - - Bank - - Residential Mortgage 37 67 Qualifying Revolving Retail 87 126 Other Retail 187 264
Total Advanced IRB 386 546
Specialised Lending (2) 1
Standardised approach 14 31
Total 398 578
Half year Mar 19
Basel Asset Class Individual provision charge $M
Write-offs $M
Corporate 51 68 Sovereign - - Bank - - Residential Mortgage 45 50 Qualifying Revolving Retail 85 123 Other Retail 197 232
Total Advanced IRB 378 473
Specialised Lending 1 2
Standardised approach 1 23
Total 380 498
Half year Sep 18
Basel Asset Class Individual provision charge $M
Write-offs $M
Corporate 1 90 Sovereign (3) - Bank - - Residential Mortgage 56 41 Qualifying Revolving Retail 93 140 Other Retail 211 277
Total Advanced IRB 358 548
Specialised Lending 2 4
Standardised approach (17) 21
Total 343 573
Factors impacting the loss experience The individually assessed credit impairment charge increased by $18 million (+5%) driven by increased provisions in AIRB Corporate asset class. Write-offs increased $80 million over the half predominantly driven by AIRB Corporate and Standardised asset class.

ANZ Basel III Pillar 3 disclosure September 2019
50
Table 9(f): Average estimated vs. actual PD, EAD and LGD – Advanced IRB
Sep 19
Portfolio Type Average
Estimated PD %
Average Actual PD
%
Average estimated to
actual EAD ratio
Average Estimated
LGD %
Average Actual LGD
% Corporate 1.95 1.74 1.14 42.22 34.47 Sovereign 0.38 0.00 n/a n/a n/a Bank 0.67 0.07 1.02 46.00 58.30 Specialised Lending n/a 2.01 1.06 n/a 25.60 Residential Mortgage 0.73 0.82 1.01 20.55 1.78 Qualifying Revolving Retail 2.29 1.80 1.08 76.28 70.13 Other Retail 4.04 3.17 1.05 53.31 43.01 APS 330 Table 9(f) compares internal credit risk estimates used in calculating regulatory capital with realised outcomes by portfolio types. It covers the PD, EAD and LGD estimates for the IRB portfolios. Estimated PD and LGD for Specialised Lending exposures have not been provided, since APRA requires the use of supervisory slotting for Regulatory EL calculations. Actual PD, EAD ratio, Estimated LGD and Actual LGD for Sovereign exposures have not been provided, since there were no Sovereign defaults observed in ANZ Sovereign exposures for the observation period. Wholesale Portfolios The estimated PD is based on the average of the internally estimated long-run PD’s for obligors that are not in default at the beginning of each financial year over the period of observation being 2009 to 2018. The actual PD is based on the number of defaulted obligors up to August 2019 compared to the total number of obligors measured. The EAD ratio compares internally estimated EAD prior to default to realised EAD for defaulted obligors over the 10 years of observation being 2009 to August 2019. A ratio greater than 1.0 signifies that on average, the actual defaulted exposures are lower than the estimated exposures at the time of default. The estimated LGD is the downturn LGD for accounts that defaulted at the beginning of each year during the observation period being 2009 to September 2017. The actual LGD is based on the average realised losses over the period for the accounts observed at the beginning and defaulted during the observation period. For non-retail portfolios, the estimated and actual LGDs are based on accounts that defaulted up to September 2017. Defaults occurring after September 2017 have been excluded from the analysis to allow sufficient time for workout period. Actual LGD for defaults where workouts were not finalised have been estimated to approximate the final actual loss. Retail Portfolios The estimated PD is based on the average of the internally estimated long-run PD’s for obligors that are not in default at the beginning of each financial year over the period of observation being 2014 to 2018. The actual PD is based on the number of defaulted obligors up to March 2019 compared to the total number of obligors measured. The EAD ratio compares internally estimated EAD prior to default to realised EAD for defaulted obligors over the period of observation being 2014 to 2018. A ratio greater than 1.0 signifies that on average, the actual defaulted exposures are lower than the estimated exposures at the time of default. The estimated LGD is the downturn LGD for accounts that defaulted at the beginning of each year during the observation period being 2013 to 2017. The actual LGD is based on the average realised losses over the period for the accounts observed at the beginning and defaulted during the observation period. Defaults occurring after March 2017 have been excluded from the analysis to allow sufficient time for workout period.

ANZ Basel III Pillar 3 disclosure September 2019
51
Table 10 Credit risk mitigation disclosures Main types of collateral taken by ANZ
Collateral is used to mitigate credit risk, as the secondary source of repayment in case the counterparty cannot meet its contractual repayment obligations.35 Types of collateral typically taken by ANZ include:
• Charges over residential, commercial, industrial or rural property,
• Charges over business assets,
• Charges over specific plant and equipment,
• Charges over listed shares, bonds or securities,
• Charges over cash deposits, and
• Guarantees and pledges.
In some cases, such as where the customer risk profile is considered very sound or by the nature of the product, a transaction may not be supported by collateral. Our credit policy, requirements and processes set out the acceptable types of collateral, as well as a process by which additional instruments and/or asset types can be considered for approval. ANZ’s credit risk modelling teams use historical internal loss data and other relevant external data to assist in determining the discount that each type would be expected to incur in a forced sale. The discounted value is used in the determination of the SI. Policies and processes for collateral valuation and management
ANZ has well established policies, requirements and processes around collateral valuation and management, that are reviewed regularly. The concepts of legal enforceability, certainty and current valuation are central to collateral management.
In order to achieve legal enforceability and certainty, ANZ uses standard collateral instruments or has specific documentation drawn up by external legal advisers, and where applicable, security interests are registered. The use of collateral management systems also provides certainty that the collateral has been properly taken, registered and stored.
In order to rely on the valuation of collateral assets, ANZ has developed comprehensive rules around acceptable types of valuations (including who may value an asset), the frequency of revaluations and standard extension ratios for typical asset types. Upon receipt of a new valuation in wholesale lending, the information is used to recalculate the SI (or to reassess the adequacy of the provision, in the case of an impaired asset), thereby ensuring that the exposure has an updated LGD attached to it for risk quantification purposes.
Guarantee support
Within wholesale lending, guarantee support for lending proposals are an integral component in transaction structuring for ANZ. The guarantee of a financially stronger party can help improve the PD of a transaction through its explicit support of the weaker rated borrower.
Guarantees that are recognised for risk rating purposes may be provided by parties that include associated entities, banks, sovereigns or individuals. Credit requirements provide threshold parameters to determine acceptable counterparties in achieving risk grade enhancement of the transaction.
The suitability of the guarantor is determined by risk rating that guarantor. Not all guarantees or guarantors are recognised for risk grading purposes.
Use of credit derivatives for risk mitigation ANZ uses purchased credit derivatives to mitigate credit risk by lowering exposures to reference entities that generate high concentration risk exposures or to improve risk return performance. Only certain credit derivatives such as credit default swaps (CDS) are recognised for risk mitigation purposes in the determination of regulatory capital. Standard, legally enforceable documentation applies.
For regulatory capital purposes, ANZ only recognises protection using credit derivatives where they meet several policy and regulatory requirements around the strength of the protection offered such as being irrevocable.
35 For some products, the collateral provided is fundamental to its structuring so is not strictly the secondary source of repayment. For example, lending secured by trade receivables is typically repaid by the collection of those receivables.
ANZ Basel III Pillar 3 disclosure September 2019
52
A CDS may only be transacted with banks and non-bank financial institutions that have been credit assessed and approved by a designated specialist credit officer. All parties must meet minimum credit standards and be allocated a related credit limit. In the event that the creditworthiness of a credit protection provider falls below the minimum required to provide effective protection, the protection is no longer recognised as an effective risk mitigant for regulatory purposes.
The use of netting
Netting is a form of credit risk mitigation in that it reduces EAD, by offsetting a customer’s positive and negative balances with ANZ.
In order to apply on-balance sheet netting, the arrangement must be specifically documented with the customer and meet a number of legally enforceable requirements. Netting is also used where the credit exposure arises from off-balance sheet market related transactions. For close-out netting to be utilised with counterparties, a legally enforceable eligible netting agreement in an acceptable jurisdiction must be in place. This means that each transaction is aggregated into a single net amount and transactions are netted to arrive at a single overall sum. Transaction structuring to mitigate credit risk
Besides collateral, guarantee support and derivatives described above, credit risk mitigation can also be furthered by prudent transaction structuring. For example, the risk in project finance lending can be mitigated by lending covenants, loan syndication and political risk insurance.
Concentrations of credit risk mitigation
Taking collateral raises the possibility that ANZ may inadvertently increase its risk by becoming exposed to collateral concentrations. For example, in the same way that an over-exposure to a particular industry may mean that a bank is more sensitive to the fortunes of that industry, an over-exposure to a particular collateral asset type may make ANZ more sensitive to the performance of that asset type.
ANZ does not believe that it has any material concentrations of collateral types, given the well diversified nature of its portfolio and conservative asset extension ratios.

ANZ Basel III Pillar 3 disclosure September 2019
53
Table 10(b): Credit risk mitigation on Standardised approach portfolios – collateral 36 Sep 19
Exposure
$M
Eligible Financial Collateral
$M
Other Eligible Collateral
$M % Coverage Standardised approach Corporate 12,998 7,389 - 56.8% Residential Mortgage 445 - - 0.0% Other Retail 49 - - 0.0%
Total 13,492 7,389 - 54.8%
Mar 19
Exposure
$M
Eligible Financial Collateral
$M
Other Eligible Collateral
$M % Coverage Standardised approach Corporate 13,519 7,119 2,254 69.3% Residential Mortgage 716 - - 0.0% Other Retail 80 - - 0.0%
Total 14,315 7,119 2,254 65.5%
Sep 18
Exposure
$M
Eligible Financial Collateral
$M
Other Eligible Collateral
$M % Coverage Standardised approach Corporate 15,064 5,486 2,585 53.6% Residential Mortgage 704 - - 0.0% Other Retail 87 - - 0.0%
Total 15,855 5,486 2,585 50.9%
36 Eligible Collateral could include cash collateral (cash, certificates deposits and bank bills issued by the lending ADI), gold bullion and highly rated debt securities.

ANZ Basel III Pillar 3 disclosure September 2019
54
Table 10(c): Credit risk mitigation – guarantees and credit derivatives Sep 19
Exposure $M
Exposures covered by Guarantees
$M
Exposures covered by
Credit Derivatives $M % Coverage
Advanced IRB Corporate (incl. Specialised Lending) 319,947 4,217 1,029 1.6% Sovereign 152,940 5,957 - 3.9% Bank 55,145 - - 0.0% Residential Mortgage 373,376 - - 0.0% Qualifying Revolving Retail 16,647 - - 0.0% Other Retail 36,322 - - 0.0%
Total 954,377 10,174 1,029 1.2%
Standardised approach Corporate 12,998 23 - 0.2% Residential Mortgage 445 - - 0.0% Other Retail 49 - - 0.0%
Total 13,492 23 - 0.2%
Qualifying Central Counterparties 9,348 - - 0.0%
Mar 19
Exposure $M
Exposures covered by Guarantees
$M
Exposures covered by
Credit Derivatives $M % Coverage
Advanced IRB Corporate (incl. Specialised Lending) 300,666 5,979 1,051 2.3% Sovereign 149,660 6,171 - 4.1% Bank 55,029 11 - 0.0% Residential Mortgage 379,512 - - 0.0% Qualifying Revolving Retail 17,589 - - 0.0% Other Retail 38,542 - - 0.0%
Total 940,998 12,161 1,051 1.4%
Standardised approach Corporate 13,519 43 - 0.3% Residential Mortgage 716 - - 0.0% Other Retail 80 - - 0.0%
Total 14,315 43 - 0.3%
Qualifying Central Counterparties 12,530 - - 0.0%

ANZ Basel III Pillar 3 disclosure September 2019
55
Table 10(c): Credit risk mitigation – guarantees and credit derivatives (continued) Sep 18
Exposure $M
Exposures covered by Guarantees
$M
Exposures covered by
Credit Derivatives $M % Coverage
Advanced IRB Corporate (incl. Specialised Lending) 285,087 7,460 856 2.9% Sovereign 145,569 5,386 - 3.7% Bank 51,363 11 - 0.0% Residential Mortgage 376,573 - - 0.0% Qualifying Revolving Retail 18,447 - - 0.0% Other Retail 39,819 - - 0.0%
Total 916,858 12,857 856 1.5%
Standardised approach Corporate 15,064 58 - 0.4% Residential Mortgage 704 - - 0.0% Other Retail 87 - - 0.0%
Total 15,855 58 - 0.4%
Qualifying Central Counterparties 11,402 - - 0.0%

ANZ Basel III Pillar 3 disclosure September 2019
56
Table 11 General disclosures for derivatives and counterparty credit risk
Definition of Counterparty Credit Risk Counterparty credit risk in derivative transactions arises from the risk of counterparty default before settlement date of derivative contracts and the counterparty is unable to fulfil present and future contractual payment obligations. The amount at risk may change over time as a function of the underlying market parameters up to the positive value of the contract in favour of ANZ. Counterparty credit risk is present in market instruments (derivatives and forward contracts), and comprises: • Settlement risk, which arises where one party makes payment or delivers value in the expectation but without
certainty that the counterparty will perform the corresponding obligation in a bilateral contract at settlement date. • Market replacement risk (pre-settlement risk), which is the risk that a counterparty will default during the life of a
derivative contract and that a loss will be incurred in covering the position. ANZ transacts market instruments with the following counterparties: • End users – would typically use Over the Counter (OTC) derivative instruments provided by ANZ to manage price
movement risk associated with their core business activity. • Professional counterparties – ANZ may hedge price movement risks by entering into transactions with professional
counterparties that conduct two way (buy and sell) business.
Counterparty credit risk requires a different method to calculate exposure at default because actual and potential market movements impact ANZ’s exposure or replacement cost over the life of derivative contracts. The markets covered by this treatment include the derivative activities associated with interest rate, foreign exchange, CDS, equity, commodity and repurchase agreement (repo) products. Counterparty credit risk governance ANZ’s counterparty credit risk management is governed by its credit principles, policies and procedures. The Markets Risk function is responsible for determining the counterparty credit risk exposure methodology applied to market instruments, in the framework for counterparty credit limit management, measurement and reporting. The counterparty credit risk associated with derivative transactions is governed by credit limit setting consistent with all credit exposures to the ANZ Group. Counterparty credit limits are approved by the appropriate credit delegation holders. Counterparty credit risk measurement and reporting The approach to measure counterparty credit risk exposure is based on internal models. These measures are referred to as potential credit risk exposure (PCRE) and potential future exposure (PFE) and measure the maximum credit exposure of derivative transactions at future time points to ANZ. PFE is measured at the 97.5th percentile at future pre-described time points, and PCRE is a 97.5th percentile averaged over time points. PCRE factors recognise that prices may change over the remaining period to maturity, and that risk decreases as the contract’s remaining term to maturity decreases. In general terms PCRE is calculated by applying a risk weighting or volatility factor to the face value of the notional principal of individual trades. PFE simulates relevant risk factors in a portfolio by taking into account the relevant volatilities and correlations calibrated to historical market data.

ANZ Basel III Pillar 3 disclosure September 2019
57
Credit valuation adjustment (CVA) Over the life of a derivative instrument, ANZ uses a CVA model to adjust fair value to take into account the impact of counterparty credit quality. The methodology calculates the present value of expected losses over the life of the financial instrument as a function of PD, LGD, and expected credit risk exposure. APRA requires banks, including ANZ, to hold additional risk based capital to cover the risk of CVA mark to market losses associated with deterioration in counterparty credit worthiness when entering into derivatives transactions. Wrong way risk ANZ’s management of counterparty credit risk also considers the possibility of wrong way risk, which emerges when PD is adversely correlated with counterparty credit risk exposures. Counterparty credit risk mitigation and credit enhancements ANZ’s primary tools to mitigate counterparty credit risk include: • A bilateral netting master agreement (e.g. by International Swaps and Derivatives Association – (ISDA)) allowing
close-out netting of exposures in a portfolio with offsetting contracts, with a single net payment with the same legal counterparty.
• Use of collateral agreements in some transactions based on standard market documentation (i.e. ISDA master
agreement with credit support annex or CSA) that governs the amount of collateral required to be posted or received by ANZ throughout the life of the contract. Reasons for requiring collateral include:
• Variation Margin – reflects the current mark-to-market exposure.
• Initial Margin – covers the future potential exposure that could arise from future changes in market value
• Since March 2017, APRA’s CPS 226 “Margining and risk mitigation for non-centrally cleared derivatives” has
mandated Variation Margin and Initial Margin arrangements between covered entities, subject to trading volume thresholds. The operation of collateral agreements falls under a policy which establishes the control framework designed to ensure a robust and globally consistent approach to the management of collateralised exposures, as well as compliance with CPS 226 obligations.
• APRA’s CPS 226 also requires ADI’s to apply risk mitigation practices for un-cleared derivatives between
covered counterparties in the areas of trading relationship documentation, trade confirmation, portfolio reconciliation, portfolio compression, valuation processes and dispute resolution processes.
• Use of right to break clauses in master agreements or in trade confirmation to reduce term of long dated derivative
trades.
• Independent limit setting, credit exposure control, monitoring and reporting of excesses against approved credit limits.
• Additional termination triggers (close out of exposure) such as credit rating downgrade clauses and change in ownership clauses included in documentation.
• Linking covenants and events of default in existing loan facility agreements to master agreements.
• Settlement through Continuous Linked Settlement (CLS) to eliminate settlement risk for foreign exchange transactions with CLS members.
• Clearing certain derivative transactions through central counterparties clearing houses.
• A specific risk appetite for Credit Valuation Adjustment (CVA) exposures, approved by the Board.
• Design and implementation of limit framework and monitoring of CVA exposures, to ensure CVA exposure is within Risk appetite.
• Use of credit derivatives and market instruments to hedge CVA.
In the event of a downgrading of ANZ’s rating by one notch from AA- to A+, as at 30 September 2019, ANZ would not be required to lodge additional collateral with its counterparties.

ANZ Basel III Pillar 3 disclosure September 2019
58
Table 11(b): Counterparty credit risk – net derivative credit exposure
Sep 19 Mar 19 Sep 18 $M $M $M
Gross positive fair value of contracts37 120,667 79,376 68,426 Netting benefits (106,003) (66,767) (54,251)
Netted current credit exposure 14,664 12,609 14,175 Collateral held (6,277) (4,566) (5,507)
Net derivatives credit exposure 8,387 8,043 8,668
Counterparty credit risk exposure - by portfolio type
Sep 19 Sep 19 Mar 19
Portfolio Type $M $M $M
Corporate 23,276 14,096 14,286 Sovereign 2,863 1,816 1,478 Bank 16,733 14,853 15,199 Qualifying Central Counterparties 9,348 12,530 11,402 Specialised Lending 1,496 629 387
Total exposures 53,716 43,924 42,752
Notional Value of Credit Derivative Hedges
Sep 19 Mar 19 Sep 18
Product Type $M $M $M
Credit Default Swaps 344 349 342 Interest Rate Swaps - - - Currency Swaps - - - Other - - -
Total exposures 344 349 342
37 The half on half increase is driven by the mark to market position, interest rate and foreign exchange market movements over the period.

ANZ Basel III Pillar 3 disclosure September 2019
59
Table 11(c): Counterparty credit risk exposure – credit derivative transactions
Sep 19
Protection Bought
$M
Protection Sold
$M
Total $M
Credit derivative products used for own credit portfolio Credit default swaps 7,091 4,940 12,031
Total notional value 7,091 4,940 12,031
Credit derivative products used for intermediation Credit default swaps 344 344 688 Total return swaps - - -
Total notional value 344 344 688
Total credit derivative notional value 7,435 5,284 12,719
Mar 19
Protection Bought
$M
Protection Sold
$M
Total $M
Credit derivative products used for own credit portfolio Credit default swaps 4,451 2,702 7,153
Total notional value 4,451 2,702 7,153
Credit derivative products used for intermediation Credit default swaps 349 349 698 Total return swaps - - -
Total notional value 349 349 698
Total credit derivative notional value 4,800 3,051 7,851
Sep 18
Protection Bought
$M
Protection Sold
$M
Total $M
Credit derivative products used for own credit portfolio Credit default swaps 2,347 1,794 4,141
Total notional value 2,347 1,794 4,141
Credit derivative products used for intermediation Credit default swaps 342 342 684 Total return swaps - - -
Total notional value 342 342 684
Total credit derivative notional value 2,689 2,136 4,825
ANZ Basel III Pillar 3 disclosure September 2019
60
Chapter 6 – Securitisation Table 12 Securitisation disclosures Definition of securitisation A securitisation is a financial structure where the cash flow from a pool of assets is used to service obligations to at least two different tranches or classes of creditors, typically holders of debt securities, with each class or tranche reflecting a different degree of credit risk. This stratification of credit risk means that one class of creditors is entitled to receive payments from the pool before another class. Securitisation of ANZ originated assets Securitisations may be categorised as: • Traditional securitisations, where legal ownership of the underlying asset pool is transferred to investors, with
principal and interest paid from realisation of or regular cash flows from the assets. The Special Purpose Vehicle (SPV) assets are insulated from bankruptcy of the seller or servicer.
• Synthetic securitisations, where credit risk is transferred to a third party but legal ownership of the underlying
assets remain with the originator e.g. by using credit derivatives or guarantees. Covered bond transactions, whereby bonds issued by ANZ are secured by assets held in a special purpose vehicle, are not securitisation exposures. ANZ adopts securitisation as a funding, capital and liquidity management tool using assets it has originated. This may involve the transfer of credit risk i.e. may provide regulatory capital relief. ANZ also operates a self-securitisation program, backed by a pool of residential mortgages, which forms part of the Bank’s contingent liquidity arrangements. For these securitisation programs, ANZ will undertake roles including as the originator, sponsor, servicer and trust manager. ANZ may retain an exposure to these securitisation programs (including as facility provider and swap provider), consistent with the roles described below in ‘Third Party Securitisation Activities’ and facilities provided as described below in ‘Risk Management’. Third Party Securitisation Activities ANZ’s involvement with securitisation of third-party originated assets, including residential mortgages, auto and equipment loans and trade receivables, comprises of: • Provision of facilities – this may include providing facilities to securitisation vehicles in the form of funding facility
provider and interest rate swap provider. Funding may be provided via an ANZ-sponsored securitisation vehicle which is consolidated onto the Bank’s financial statements, to certain clients wishing to access securitisation.
• Services to securitisation programs may include structuring and arranging services and acting as bond manager. • Investment in securities – ANZ may purchase notes issued by securitisation programs. For any assets ANZ has securitised or for SPVs that ANZ sponsors, any role provided by ANZ or its subsidiaries is subject to market based terms and conditions, and ANZ’s normal approval and review processes. Further, any securitisation exposures retained by ANZ or its affiliated entities are subject to ANZ’s normal approval and review processes as well as satisfying the requirements under APS 120: Securitisation. Governance and Risk Management Similar to other exposures, securitisation exposures are subject to credit, market, operational liquidity and compliance risks. Governance of securitisation activities is managed in accordance with ANZ’s established risk management framework, including the credit risk and market risk frameworks described in Chapters 5 and 7. Roles and responsibilities are clearly outlined in the Bank’s policies and procedures, including: • Appropriate risk management systems to identify, measure, monitor and manage the risks arising from its
involvement in securitisation exposures; • Impact of ANZ’s involvement in securitisation exposures on its risk profile; and

ANZ Basel III Pillar 3 disclosure September 2019
61
• How ANZ ensures that it does not provide any implicit support to securitisations with ANZ originated assets. Funding third party originated exposures and investment in securities are via balance sheet funded arrangements where such arrangements satisfy ANZ’s credit, due diligence and other business requirements. Many functions within ANZ are involved in securitisation activities given the range of activities undertaken and risks that need to be managed. For origination and structuring of securitisation transactions, ANZ has a specialist securitisation team with independent Risk personnel overseeing operations. Credit decisions require joint approval by Risk business unit and respective independent credit risk officer. The securitisation team must be involved in all non-trading securitisation transactions across ANZ, which ensures consistent expert treatment. Where ANZ invests in instruments issued by securitisation programs, the relevant business unit manages these exposures until the securitisation exposures are repaid in full or sold. All facilities provided to our investments in securitisation programs (across both the banking and trading books) undergo initial and ongoing due diligence requirements as outlined by APRA. This includes analysing the structure of the transaction and monitoring performance of the underlying assets of the transaction. In addition, such securitisation exposures are formally reviewed at least annually with credit discretions being exercised. Risk reporting of securitisation exposures Credit risk management information systems, reporting and analysis are managed centrally for all securitisation exposures. In addition to the formal credit review process for ANZ’s securitisation exposures, internal reporting to the appropriate Risk and management functions provides oversight at the portfolio level. These reports include securitisation program performance, EAD, portfolio mix, and RWA. The use and treatment of Credit Risk Mitigation (CRM) techniques with respect to securitisation exposures is assessed on a case-by-case basis in a manner consistent with the bank-wide CRM methodology38. Regulatory capital approaches For securitisation exposures held in ANZ’s banking book39, ANZ adopts a Standardised approach (as outlined in APS 120: Securitisation) to determine the credit risk regulatory capital charge via a hierarchy of approaches. The primary rating approach is the External Ratings Based Approach (ERBA). For externally rated securitisation exposures that satisfy the operational requirements for external credit assessments, ANZ calculates credit risk regulatory capital based upon the ratings assigned by Standard & Poor’s, Moody’s Investor Services and/or Fitch Ratings as appropriate, seniority of the securitisation exposure and the tenor of the securitisation exposure. If ERBA is not applicable, ANZ adopts the Supervisory Formula Approach (SFA) for securitisation exposures. In this case, the credit risk regulatory capital calculation takes into account the type and performance of the underlying assets of the securitisation and the credit support provided to the securitisation exposure. In relation to securitisation of ANZ originated assets, where: • the significant credit risk transfer requirements have been satisfied under APS 120, ANZ is not required to hold
credit risk regulatory capital for the underlying assets of the securitisation, however credit risk regulatory capital is calculated for the facilities provided to the securitisation;
• in absence of significant credit risk transfer being satisfied under APS 120, ANZ holds credit risk regulatory capital
for the underlying assets of the securitisation however the credit risk regulatory capital for facilities provided to the securitisation is not calculated.
Chapter 6 outlines regulatory capital treatment for securitisation exposures held in ANZ’s trading book. In addition, the operational requirements for the recognition of external credit assessments outlined in APS 120 also apply to these exposures.
38 For example, various types of analysis including quantitative analysis of credit enhancements are performed for non-externally rated transactions. Factors such as geography, facility/transaction type and ANZ’s role will determine the applicable CRM techniques to apply. 39 Exposures are classified into either the trading book or the banking book. In general terms, the trading book consists of positions in financial instruments and commodities held with trading intent or in order to hedge other elements of the trading book, and the banking book contains all other exposures. Banking book exposures are typically held to maturity, in contrast to the shorter term, trading nature of the trading book.

ANZ Basel III Pillar 3 disclosure September 2019
62
Accounting policies A key consideration in determining the treatment of transactions involving ANZ assets is whether the securitisation special purpose vehicles (SPVs) should be consolidated under AASB 10: Consolidated Financial Statements. If these SPVs meet the criteria for consolidation, the assets remain on ANZ’s balance sheet and are classified and valued in accordance with AASB 9: Financial Instruments. Currently, transactions with all of ANZ’s securitisation SPVs are treated as financing transactions. Securitisation services based on customer’s generated assets include warehouse and term fund facilities which are treated as loans. For synthetic securitisations of ANZ originated assets, any transferred credit exposure is recognised through the fair value measurement of the credit derivative established within the structure. For full details of the principal accounting policies governing ANZ’s securitisation activities are outlined in ANZ’s 2019 Annual Report, Notes to the Financial Statements. These include the valuation, derecognition, consolidation and income recognition principles outlined in the accounting policies and key judgements and estimates disclosures in each relevant note. Note 27 – Structured Entities and Note 28 – Transfers of Financial Assets also provides details about the nature of ANZ’s securitisation activities and certain accounting policies as they specifically apply to these activities. The impact of the application of these policies to securitisation activities have not changed since the prior year, notwithstanding the introduction of AASB 9: Financial Instruments which replaces AASB 139: Financial Recognition and Measurement from 1 October 2018. To the extent that ANZ has exposures intended to be securitised, they could reside in either the banking or trading book. To the extent that ANZ has entered into contractual arrangements that could require it to provide financial support for securitised assets e.g. liquidity facilities, these are recognised in accordance with the accounting policies set out in ANZ’s 2019 Annual Report. Significant changes in quantitative information since the last reporting period
During the year, ANZ executed a $1.5 billion residential mortgage-backed securitisation which settled on 19 June 2019.

ANZ Basel III Pillar 3 disclosure September 2019
63
Banking Book
Table 12(g): Banking Book: Traditional and synthetic securitisation exposures
Sep 19
Traditional securitisations Underlying asset ANZ Originated
$M ANZ Self Securitised
$M ANZ Sponsored
$M Residential mortgage 2,369 70,863 - Credit cards and other personal loans - - - Auto and equipment finance - - - Commercial loans - - - Other - - -
Total 2,369 70,863 -
Synthetic securitisations Underlying asset ANZ Originated
$M ANZ Self Securitised
$M ANZ Sponsored
$M Residential mortgage - - - Credit cards and other personal loans - - - Auto and equipment finance - - - Commercial loans - - - Other - - -
Total - - -
Aggregate of traditional and synthetic securitisations Underlying asset ANZ Originated
$M ANZ Self Securitised
$M ANZ Sponsored
$M Residential mortgage 2,369 70,863 - Credit cards and other personal loans - - - Auto and equipment finance - - - Commercial loans - - - Other - - -
Total 2,369 70,863 -
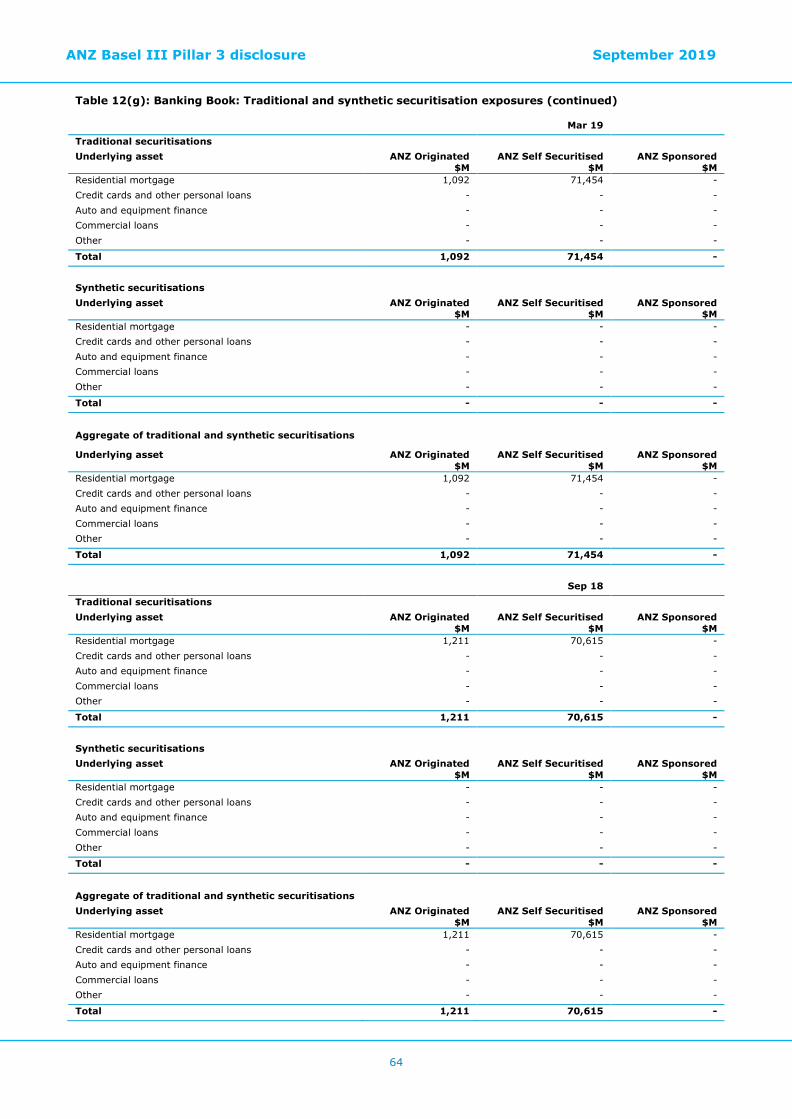
ANZ Basel III Pillar 3 disclosure September 2019
64
Table 12(g): Banking Book: Traditional and synthetic securitisation exposures (continued)
Mar 19
Traditional securitisations Underlying asset ANZ Originated
$M ANZ Self Securitised
$M ANZ Sponsored
$M Residential mortgage 1,092 71,454 - Credit cards and other personal loans - - - Auto and equipment finance - - - Commercial loans - - - Other - - -
Total 1,092 71,454 -
Synthetic securitisations Underlying asset ANZ Originated
$M ANZ Self Securitised
$M ANZ Sponsored
$M Residential mortgage - - - Credit cards and other personal loans - - - Auto and equipment finance - - - Commercial loans - - - Other - - -
Total - - -
Aggregate of traditional and synthetic securitisations
Underlying asset ANZ Originated $M
ANZ Self Securitised $M
ANZ Sponsored $M
Residential mortgage 1,092 71,454 - Credit cards and other personal loans - - - Auto and equipment finance - - - Commercial loans - - - Other - - -
Total 1,092 71,454 -
Sep 18
Traditional securitisations Underlying asset ANZ Originated
$M ANZ Self Securitised
$M ANZ Sponsored
$M Residential mortgage 1,211 70,615 - Credit cards and other personal loans - - - Auto and equipment finance - - - Commercial loans - - - Other - - -
Total 1,211 70,615 -
Synthetic securitisations Underlying asset ANZ Originated
$M ANZ Self Securitised
$M ANZ Sponsored
$M Residential mortgage - - - Credit cards and other personal loans - - - Auto and equipment finance - - - Commercial loans - - - Other - - -
Total - - -
Aggregate of traditional and synthetic securitisations Underlying asset ANZ Originated
$M ANZ Self Securitised
$M ANZ Sponsored
$M Residential mortgage 1,211 70,615 - Credit cards and other personal loans - - - Auto and equipment finance - - - Commercial loans - - - Other - - -
Total 1,211 70,615 -
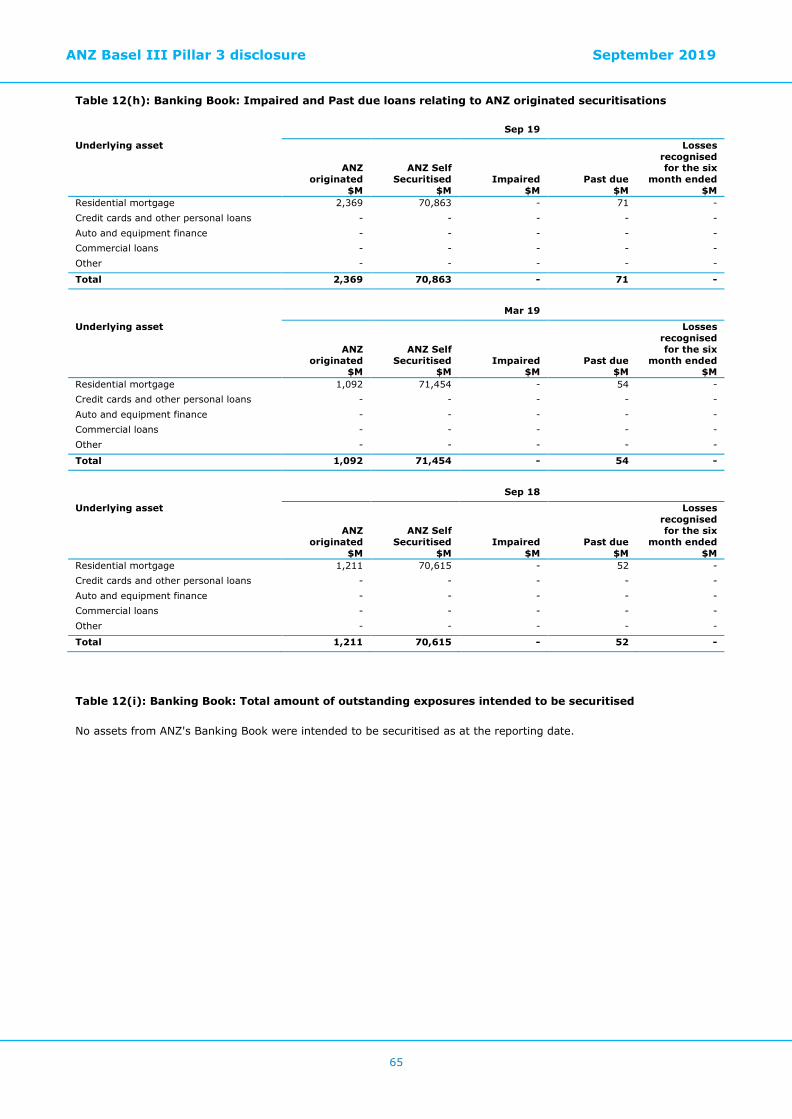
ANZ Basel III Pillar 3 disclosure September 2019
65
Table 12(h): Banking Book: Impaired and Past due loans relating to ANZ originated securitisations
Sep 19
Underlying asset
ANZ originated
$M
ANZ Self Securitised
$M Impaired
$M Past due
$M
Losses recognised for the six
month ended $M
Residential mortgage 2,369 70,863 - 71 - Credit cards and other personal loans - - - - - Auto and equipment finance - - - - - Commercial loans - - - - - Other - - - - -
Total 2,369 70,863 - 71 -
Mar 19
Underlying asset
ANZ originated
$M
ANZ Self Securitised
$M Impaired
$M Past due
$M
Losses recognised for the six
month ended $M
Residential mortgage 1,092 71,454 - 54 - Credit cards and other personal loans - - - - - Auto and equipment finance - - - - - Commercial loans - - - - - Other - - - - -
Total 1,092 71,454 - 54 -
Sep 18
Underlying asset
ANZ originated
$M
ANZ Self Securitised
$M Impaired
$M Past due
$M
Losses recognised for the six
month ended $M
Residential mortgage 1,211 70,615 - 52 - Credit cards and other personal loans - - - - - Auto and equipment finance - - - - - Commercial loans - - - - - Other - - - - -
Total 1,211 70,615 - 52 -
Table 12(i): Banking Book: Total amount of outstanding exposures intended to be securitised No assets from ANZ's Banking Book were intended to be securitised as at the reporting date.

ANZ Basel III Pillar 3 disclosure September 2019
66
Table 12(j): Banking Book: Securitisation - Summary of current period’s activity by underlying asset type and facility 40
Sep 19 Original value securitised Securitisation activity by underlying asset type
ANZ Originated $M
ANZ Self Securitised
$M ANZ Sponsored
$M
Recognised gain
or loss on sale $M
Residential mortgage 1,277 (591) - - Credit cards and other personal loans - - - - Auto and equipment finance - - - - Commercial loans - - - - Other - - - -
Total 1,277 (591) - -
Securitisation activity by facility provided Notional
amount $M
Liquidity facilities 15 Funding facilities 1,135 Underwriting facilities - Lending facilities - Credit enhancements - Holdings of securities (excluding trading book) 163 Other 153
Total 1,466
Mar 19
Original value securitised Securitisation activity by underlying asset type
ANZ Originated $M
ANZ Self Securitised
$M ANZ Sponsored
$M
Recognised gain
or loss on sale $M
Residential mortgage (119) 839 - - Credit cards and other personal loans - - - - Auto and equipment finance - - - - Commercial loans - - - - Other - - - -
Total (119) 839 - -
Securitisation activity by facility provided Notional
amount $M
Liquidity facilities - Funding facilities (650) Underwriting facilities - Lending facilities - Credit enhancements - Holdings of securities (excluding trading book) 39 Other -
Total (611)
40 Activity represents net movement in outstandings.
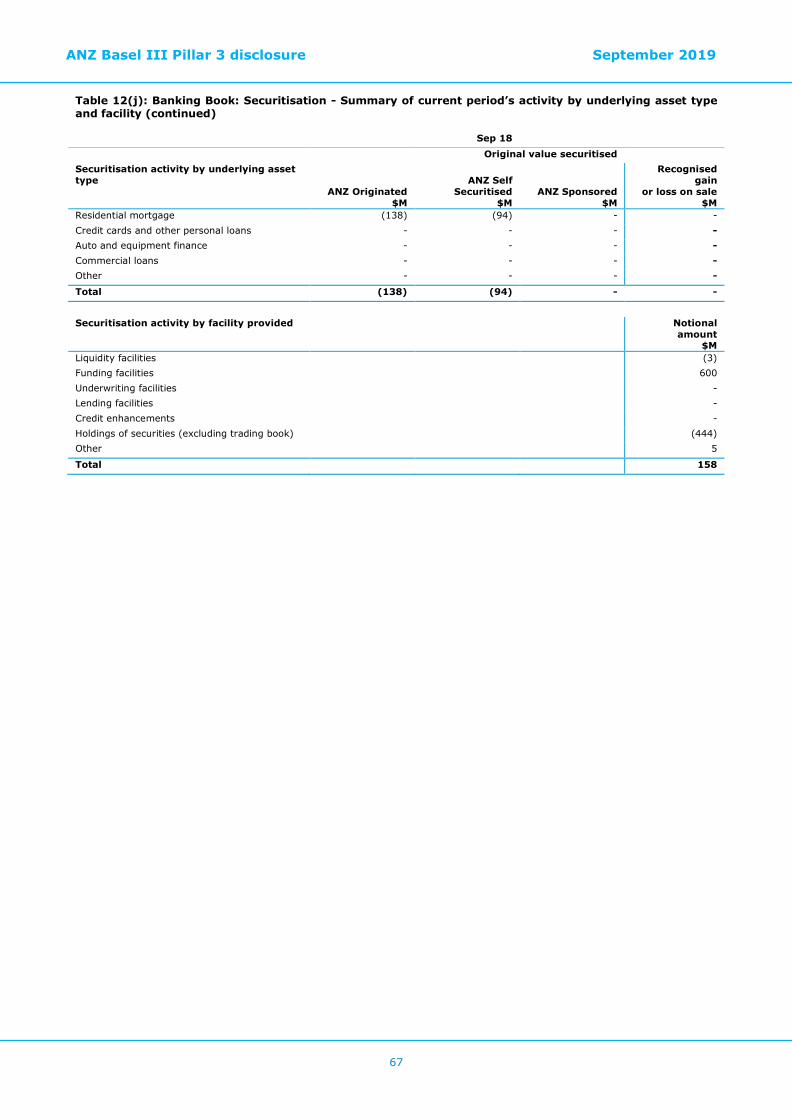
ANZ Basel III Pillar 3 disclosure September 2019
67
Table 12(j): Banking Book: Securitisation - Summary of current period’s activity by underlying asset type and facility (continued)
Sep 18 Original value securitised Securitisation activity by underlying asset type
ANZ Originated $M
ANZ Self Securitised
$M ANZ Sponsored
$M
Recognised gain
or loss on sale $M
Residential mortgage (138) (94) - - Credit cards and other personal loans - - - - Auto and equipment finance - - - - Commercial loans - - - - Other - - - -
Total (138) (94) - -
Securitisation activity by facility provided Notional
amount $M
Liquidity facilities (3) Funding facilities 600 Underwriting facilities - Lending facilities - Credit enhancements - Holdings of securities (excluding trading book) (444) Other 5
Total 158

ANZ Basel III Pillar 3 disclosure September 2019
68
Table 12(k): Banking Book: Securitisation - Regulatory credit exposures by exposure type
Sep 19 Mar 19 Sep 18 Securitisation exposure type - On balance sheet $M $M $M
Liquidity facilities - - - Funding facilities 7,679 6,574 6,924 Underwriting facilities - - - Lending facilities - - - Credit enhancements - - - Holdings of securities (excluding trading book) 1,923 1,760 1,721 Protection provided - - - Other 437 141 104
Total 10,039 8,475 8,749
Sep 19 Mar 19 Sep 18
Securitisation exposure type - Off Balance Sheet $M $M $M
Liquidity facilities 25 12 13 Funding facilities 1,598 1,320 1,362 Underwriting facilities - - - Lending facilities - - - Credit enhancements - - - Holdings of securities (excluding trading book) - - - Protection provided - - - Other - - -
Total 1,623 1,332 1,375
Sep 19 Mar 19 Sep 18
Total Securitisation exposure type $M $M $M
Liquidity facilities 25 12 13 Funding facilities 9,277 7,894 8,286 Underwriting facilities - - - Lending facilities - - - Credit enhancements - - - Holdings of securities (excluding trading book) 1,923 1,760 1,721 Protection provided - - - Other 437 141 104
Total 11,662 9,807 10,124
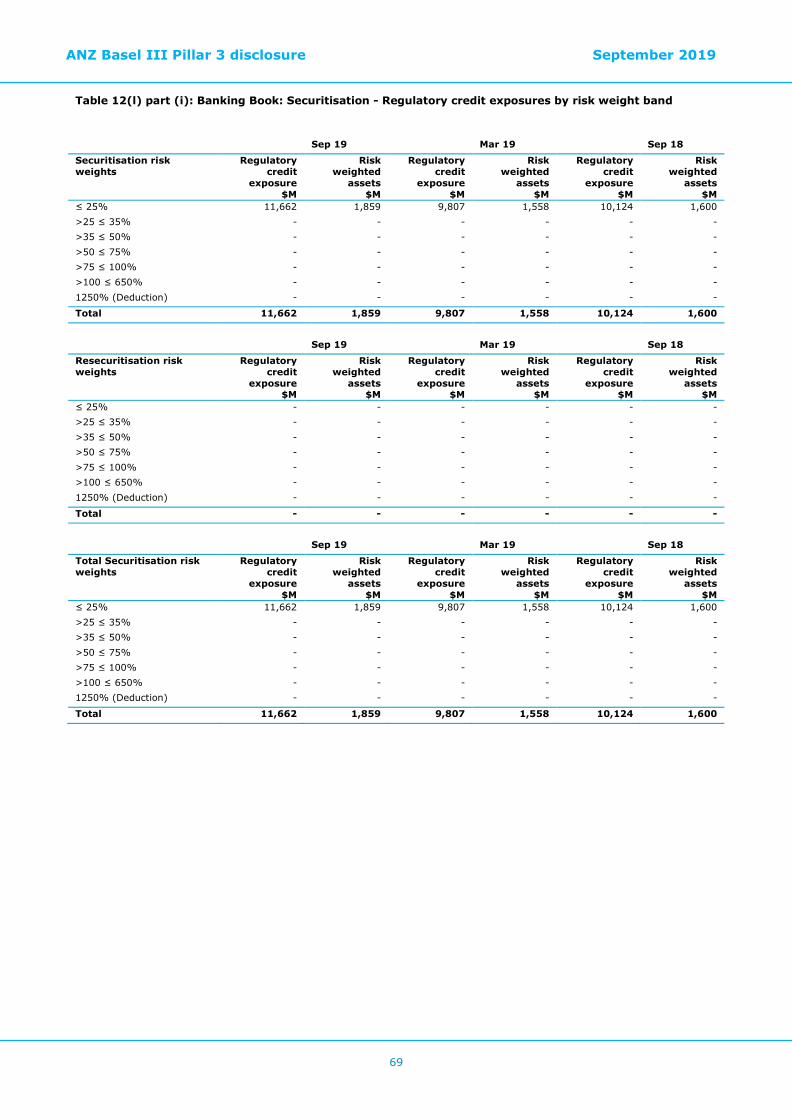
ANZ Basel III Pillar 3 disclosure September 2019
69
Table 12(l) part (i): Banking Book: Securitisation - Regulatory credit exposures by risk weight band
Sep 19 Mar 19 Sep 18
Securitisation risk weights
Regulatory credit
exposure $M
Risk weighted
assets $M
Regulatory credit
exposure $M
Risk weighted
assets $M
Regulatory credit
exposure $M
Risk weighted
assets $M
≤ 25% 11,662 1,859 9,807 1,558 10,124 1,600 >25 ≤ 35% - - - - - - >35 ≤ 50% - - - - - - >50 ≤ 75% - - - - - - >75 ≤ 100% - - - - - - >100 ≤ 650% - - - - - - 1250% (Deduction) - - - - - -
Total 11,662 1,859 9,807 1,558 10,124 1,600
Sep 19 Mar 19 Sep 18
Resecuritisation risk weights
Regulatory credit
exposure $M
Risk weighted
assets $M
Regulatory credit
exposure $M
Risk weighted
assets $M
Regulatory credit
exposure $M
Risk weighted
assets $M
≤ 25% - - - - - - >25 ≤ 35% - - - - - - >35 ≤ 50% - - - - - - >50 ≤ 75% - - - - - - >75 ≤ 100% - - - - - - >100 ≤ 650% - - - - - - 1250% (Deduction) - - - - - -
Total - - - - - -
Sep 19 Mar 19 Sep 18
Total Securitisation risk weights
Regulatory credit
exposure $M
Risk weighted
assets $M
Regulatory credit
exposure $M
Risk weighted
assets $M
Regulatory credit
exposure $M
Risk weighted
assets $M
≤ 25% 11,662 1,859 9,807 1,558 10,124 1,600 >25 ≤ 35% - - - - - - >35 ≤ 50% - - - - - - >50 ≤ 75% - - - - - - >75 ≤ 100% - - - - - - >100 ≤ 650% - - - - - - 1250% (Deduction) - - - - - -
Total 11,662 1,859 9,807 1,558 10,124 1,600

ANZ Basel III Pillar 3 disclosure September 2019
70
Table 12(l) part (ii): Banking Book: Securitisation - Aggregate securitisation exposures deducted from Capital No longer required under Basel III; defaulted exposures are given a risk weight of 1250% and no longer deducted from Capital.
Table 12(m): Banking Book: Securitisations subject to early amortisation treatment ANZ does not have any Securitisations subject to early amortisation treatment or using Standardised approach.
Table 12(n): Banking Book: Resecuritisation - Aggregate amount of resecuritisation exposures retained or purchased ANZ does not have any retained or purchased Resecuritisation exposures.

ANZ Basel III Pillar 3 disclosure September 2019
71
Trading Book
Table 12(o): Trading Book: Traditional and synthetic securitisation exposures No assets from ANZ's Trading Book were securitised during the reporting period.
Table 12(p): Trading Book: Total amount of outstanding exposures intended to be securitised No assets from ANZ's Trading Book were intended to be securitised as at the reporting date.
Table 12(q): Trading Book: Securitisation - Summary of current year's activity by underlying asset type and facility No assets from ANZ's Trading Book were securitised during the reporting period.
Table 12(r): Trading Book: Traditional and synthetic securitisation exposures
No assets from ANZ's Trading Book were securitised during the reporting period.
Table 12(s): Trading Book: Securitisation – Regulatory credit exposures by exposure type
ANZ does not have any Regulatory credit exposures by exposure type.
Table 12(t)(i) & Table 12(u)(i): Trading Book: Aggregate securitisation exposures subject to Internal Models Approach (IMA) and the associated Capital requirements ANZ does not have any Securitisation exposures subject to Internal Models Approach.
Table 12(t)(ii) & Table 12(u)(ii): Trading Book: Aggregate securitisation exposures subject to APS 120 and the associated Capital requirements ANZ does not have any aggregate Securitisation exposures subject to APS120 and the associated Capital requirements.
Table 12(u)(iii): Trading Book: Securitisation - Aggregate securitisation exposures deducted from Capital ANZ does not have any Securitisation exposures deducted from Capital.
Table 12(v): Trading Book: Securitisations subject to early amortisation treatment ANZ does not have any Securitisation exposures subject to early amortisation or using Standardised approach.
Table 12(w): Trading Book: Resecuritisation - Aggregate amount of resecuritisation exposures retained or purchased ANZ does not have any retained or purchased Resecuritisation exposures.

ANZ Basel III Pillar 3 disclosure September 2019
72
Chapter 7 – Market risk Table 13 Market risk – Standard approach ANZ uses the standard model approach to measure market risk capital for specific risk41 (APRA does not currently permit Australian banks to use an internal model approach for this).
Table 13(b): Market risk – Standard approach 42
Sep 19 Mar 19 Sep 18 $M $M $M
Interest rate risk 142 109 76 Equity position risk - - - Foreign exchange risk - - - Commodity risk - - -
Total 142 109 76
Risk Weighted Assets equivalent 1,775 1,363 950
41 Specific risk is the risk that the value of a security will change due to issuer-specific factors. It applies to interest rate and equity positions related to a specific issuer. 42 RWA equivalent is the capital requirement multiplied by 12.5 in accordance with APS 110.
ANZ Basel III Pillar 3 disclosure September 2019
73
Table 14 Market risk – Internal models approach Definition and scope of market risk Market Risk stems from ANZ’s trading and balance sheet activities and is the risk to ANZ’s earnings arising from changes in interest rates, foreign exchange rates, credit spreads, volatility, correlations or from fluctuations in bond, commodity or equity prices. Market risk management of IRRBB is described in Chapter 10 and is excluded from this Chapter. Regulatory approval to use the Internal Models Approach ANZ has been approved by APRA to use the Internal Models Approach (IMA) under APS 116 Capital Adequacy: Market Risk for general market risk and under APS 117 Capital Adequacy: Interest Rate Risk in the Banking Book (Advanced ADIs) for interest rate risk in the banking book (IRRBB). Governance of market risk The Board Risk Committee supervision of market risk is supported by the Credit and Market Risk Committee (CMRC). CMRC is responsible for the oversight and control of credit, market, insurance and material financial risks across the ANZ Group and meets at least monthly. The Market Risk function is a specialist risk management unit independent of the business that is responsible for: • Designing and implementing policies and procedures to ensure market risk exposures are managed within the
appetite and limit framework set by the Board. • Measuring and monitoring market risk exposures, and approving counterparty and associated risks. • The ongoing effectiveness and appropriateness of the risk management framework. Traded Market Risk Traded Market Risk is the risk of loss from changes in the value of financial instruments due to movements in price factors for both physical and derivative trading positions. Trading positions arise from transactions where ANZ acts as principal with customers, financial exchanges or inter-bank counterparties. The Traded, Foreign Exchange and Commodity Market Risk Policy and accompanying procedures (together the “TFC Framework”) governs the management of traded market risk and its key components include: • A clear definition of the trading book. • A comprehensive set of requirements that promote the proactive identification and communication of risk. • A robust Value at Risk (VaR) quantification approach supplemented by comprehensive stress testing. • A comprehensive limit framework that controls all material market risks. • An independent Market Risk function with specific responsibilities. • Regular and effective reporting of market risk to executive management and the Board. Non-Traded Market Risk Non-Traded Market Risk is the market risk associated with the management of non-traded interest rate risk, liquidity risk and foreign exchange exposures from the Group’s foreign currency capital and earnings. Included in Non-Traded Market risk is Interest Rate Risk in the Banking Book (IRRBB). This is the risk of loss arising from adverse changes in the overall and relative level of interest rates for different tenors, differences in the actual versus expected net interest margin, and the potential valuation risk associated with embedded options in financial instruments and bank products. In quantifying risk, all material market risk factors need to be identified and reflected within the risk measurement approach. Non-traded market risk (or balance sheet risk) comprises the management of non-traded interest rate risk, liquidity risk, and foreign exchange exposures from the Group’s foreign currency capital and earnings.

ANZ Basel III Pillar 3 disclosure September 2019
74
ANZ has a detailed market risk management and control framework, to support its trading and balance sheet activities, which incorporates an independent risk measurement approach to quantify the magnitude of market risk within the trading and balance sheet portfolios. This approach, along with related analysis, identifies the range of possible outcomes that can be expected over a given period of time, and establishes the likelihood of those outcomes and allocates an appropriate amount of capital to support these activities. Markets Risk is a specialist risk management unit independent of the business that is responsible for measuring and monitoring market risk. Markets Risk has implemented policies and procedures to keep ANZ’s market risk exposures managed within the appetite and limit framework set by the Board. Measurement of Traded Market Risk ANZ’s traded market risk management framework incorporates a risk measurement approach to quantify the magnitude of market risk within trading books. This approach and related analysis identifies the range of possible outcomes that can be expected over a given period of time and establishes the relative likelihood of those outcomes. ANZ’s key tools to measure and manage traded market risk on a daily basis are VaR, sensitivity measures and stress tests. VaR is calculated using a historical simulation with a 500 day observation period for standard VaR, and a one-year stressed period for stressed VaR. Traded VaR is calculated at a 99% confidence level for both standard VaR and Stressed VaR. Standard VaR is calculated over both a one-day and a ten-day holding period, while Stressed VaR is calculated over a ten-day holding period. ANZ also undertakes a wide range of stress tests on the Group trading portfolio and to individual trading portfolios. Standard stress tests are applied daily measuring the potential loss that could arise from the largest market movements observed since 2008 over specific holding periods. Holding periods used to calculate stress parameters differ and reflect the relative liquidity of each product type. Results from stress testing on plausible severe scenarios are also calculated daily. VaR and stress tests are supplemented by loss limits and detailed control limits. Loss limits are designed to ensure that in the event of continued losses from a trading activity, the trading activity is stopped and senior management reviews before trading resumed. Where necessary, detailed control limits such as sensitivity or position limits are also in place to ensure appropriate control is exercised over a specific risk or product. Comparison of VaR estimates to gains/losses Back testing involves comparing VaR calculations with corresponding profit and loss to identify how often trading losses exceed the calculated VaR. For APRA back testing purposes, VaR is calculated at the 99% confidence interval with a one-day holding period. Back testing is conducted daily, and outliers are analysed to determine whether they are the result of trading decisions, systemic changes in market conditions or issues related to the VaR model (historical data or model calibration). ANZ uses actual and hypothetical profit and loss data. Hypothetical data is designed to remove the impacts of intraday trading and sales margins. It is calculated as the difference between the value of the prior day portfolio at prior day closing rates and the value at current day closing rates. Markets Finance calculates actual profit and loss while Market Risk calculates hypothetical profit and loss.
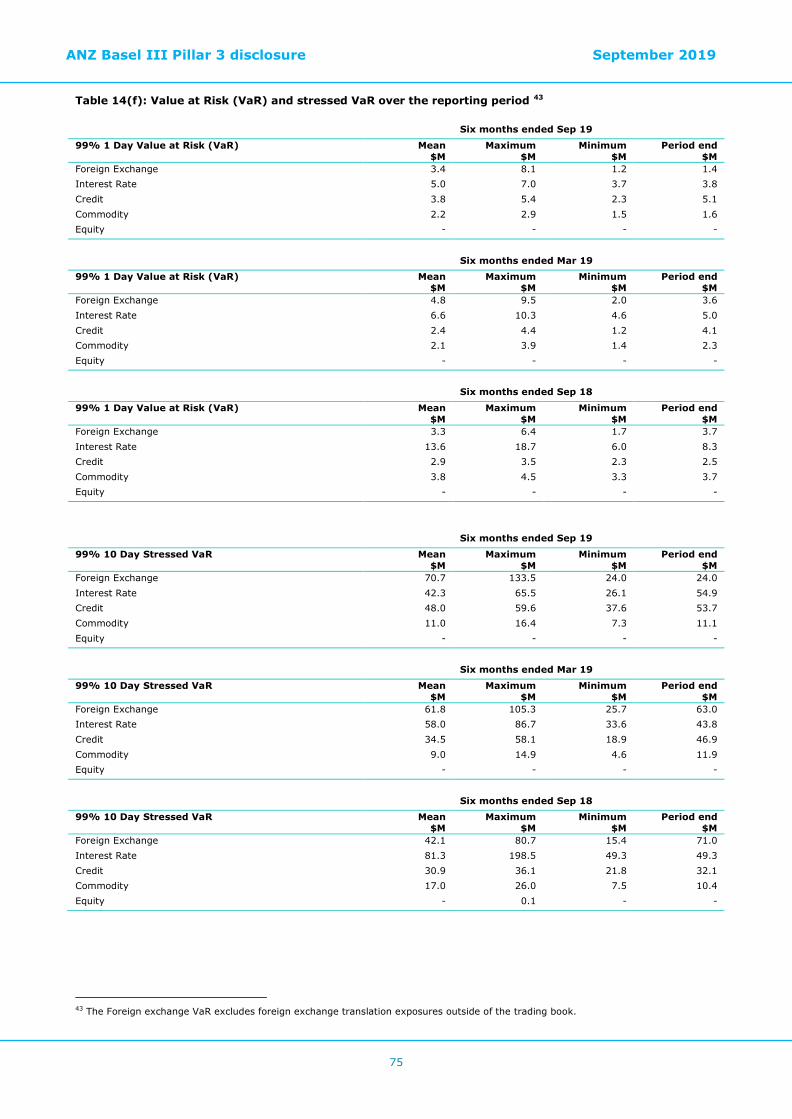
ANZ Basel III Pillar 3 disclosure September 2019
75
Table 14(f): Value at Risk (VaR) and stressed VaR over the reporting period 43
Six months ended Sep 19
99% 1 Day Value at Risk (VaR) Mean $M
Maximum $M
Minimum $M
Period end $M
Foreign Exchange 3.4 8.1 1.2 1.4 Interest Rate 5.0 7.0 3.7 3.8 Credit 3.8 5.4 2.3 5.1 Commodity 2.2 2.9 1.5 1.6 Equity - - - -
Six months ended Mar 19
99% 1 Day Value at Risk (VaR) Mean $M
Maximum $M
Minimum $M
Period end $M
Foreign Exchange 4.8 9.5 2.0 3.6 Interest Rate 6.6 10.3 4.6 5.0 Credit 2.4 4.4 1.2 4.1 Commodity 2.1 3.9 1.4 2.3 Equity - - - -
Six months ended Sep 18
99% 1 Day Value at Risk (VaR) Mean $M
Maximum $M
Minimum $M
Period end $M
Foreign Exchange 3.3 6.4 1.7 3.7 Interest Rate 13.6 18.7 6.0 8.3 Credit 2.9 3.5 2.3 2.5 Commodity 3.8 4.5 3.3 3.7 Equity - - - -
Six months ended Sep 19
99% 10 Day Stressed VaR Mean $M
Maximum $M
Minimum $M
Period end $M
Foreign Exchange 70.7 133.5 24.0 24.0 Interest Rate 42.3 65.5 26.1 54.9 Credit 48.0 59.6 37.6 53.7 Commodity 11.0 16.4 7.3 11.1 Equity - - - -
Six months ended Mar 19
99% 10 Day Stressed VaR Mean $M
Maximum $M
Minimum $M
Period end $M
Foreign Exchange 61.8 105.3 25.7 63.0 Interest Rate 58.0 86.7 33.6 43.8 Credit 34.5 58.1 18.9 46.9 Commodity 9.0 14.9 4.6 11.9 Equity - - - -
Six months ended Sep 18
99% 10 Day Stressed VaR Mean $M
Maximum $M
Minimum $M
Period end $M
Foreign Exchange 42.1 80.7 15.4 71.0 Interest Rate 81.3 198.5 49.3 49.3 Credit 30.9 36.1 21.8 32.1 Commodity 17.0 26.0 7.5 10.4 Equity - 0.1 - -
43 The Foreign exchange VaR excludes foreign exchange translation exposures outside of the trading book.

ANZ Basel III Pillar 3 disclosure September 2019
76
Comparison of VaR estimates with actual gains/losses experienced
Reporting of Traded Market Risk Market Risk reports daily VaR and stress testing results to senior management in Market Risk and the Markets business. Market Risk expediently escalates details of any limit breach to the appropriate discretion holder within Market Risk and to Group Risk, and reports to the CMRC each month. Market Risk monitors and analyses back testing results daily and reports results to the CMRC quarterly. Total traded market risks back testing exceptions were within the APS 116 green zone for the period. Mitigation of market risk The Market Risk team’s responsibilities, including the reporting and escalation processes described above, are fundamental to how market risk is managed. Market Risk has a presence in all the major dealing operations centres in Australia, New Zealand, Asia, Europe and America. Commodities risk Commodity price risk arises as a result of movement in prices or the implied volatilities of various commodities. All direct commodity price exposures are managed in the trading book by the Markets business and monitored by Market Risk in accordance with the TFC framework. Foreign exchange risk Foreign exchange risk arises as a result of movements in values or the implied volatilities of exchange rates. Exposures from ANZ’s normal operating business and trading activities are recorded in core multi-currency systems and managed within the trading book in accordance with the TFC framework. Structural exposures from foreign investments and capital management activities are managed in accordance with policies approved by the Board Risk Committee, with the main objective of ensuring that ANZ’s capital ratio is largely protected from changes in foreign exchange. As at 30 September 2019, ANZ’s investment in ANZ Bank New Zealand Limited is the main source of the structural foreign exchange exposure.
ANZ Basel III Pillar 3 disclosure September 2019
77
Chapter 8 – Operational risk Table 15 Operational risk Definition of operational risk Operational Risk is defined as the risk of loss and/or non-compliance with laws resulting from inadequate or failed internal processes, people and systems, and/or from external events. This definition includes legal risk, and the risk of reputation loss, or damage arising from inadequate or failed internal processes, people and systems, but excludes strategic risk. ANZ’s I.AM (Identify, Act, Monitor) - Operational Risk and Compliance Framework, taking into consideration the internal and external environment in which ANZ operates at any point in time, allows for more targeted focus on particular areas of operational risk. Currently, ANZ has identified the following types of operational risk as separate Key Material Risks:
• Compliance Risk: ANZ uses the same policies, governance, management and systems for Operational Risk and Compliance Risk. These are described below.
• Reputation Risk: ANZ uses some additional policies, governance, management and systems for managing Reputation Risk. These are described below.
• Technology Risk: ANZ uses some additional policies, governance, management and systems for managing Technology Risk.
ANZ has been authorised by APRA to use the advanced measurement approach (AMA) for calculation of Operational Risk capital requirements under APS 115 Capital Adequacy: Advanced Measurement Approaches to Operational Risk. This methodology applies across all of ANZ. For the purposes of RBNZ capital adequacy, ANZ Bank New Zealand Ltd uses Reserve Bank of New Zealand standardised approach to Operational risk capital calculation. Operational risk governance and structure The primary responsibilities for operational risk are vested by the Operational Risk Approach in the Board Risk Committee and Operational Risk Executive Committee. The Board Risk Committee:
• approve the Operational Risk Approach • identify, act on and monitor Operational Risk, at a group level • promote a culture that supports the organisation to identify, act on and monitor Operational Risk
Operational Risk Executive Committee:
• endorse the Operational Risk Approach • monitor the implementation of the Operational Risk Approach, at a group level • assist the Board Risk Committee to identify, act on and monitor Operational Risk, at a group level • promote a culture that supports the organisation to identify, act on and monitor Operational Risk
Risk management framework ANZ operates three lines of defence model for the management of Operational Risk. Each line of defence has defined roles, responsibilities and escalation paths to support effective two way communication and management of Operational Risk at ANZ. There are also on-going review mechanisms in place to ensure the I.AM - Operational Risk and Compliance Framework continues to meet organisational needs and regulatory requirements. First line The Business has first line of defence responsibility for managing Operational Risk including obligations to: • take primary accountability for the identification, measurement and management of key risks and the related
control environment.
ANZ Basel III Pillar 3 disclosure September 2019
78
Second line Operational Risk functions (Division and Group) form the second line of defence. Division Risk is accountable for: • undertaking review and challenge of business activities and ensuring that the strategy is maintained across the
division. Group Operational Risk is accountable for: • developing and maintaining relevant policies and procedures to ensure continuing appropriateness of the I.AM -
Operational Risk and Compliance Framework and to support its consistent execution, and • setting and monitoring compliance with the Group Operational Risk, Risk Appetite Statements (RAS). Third line Internal Audit forms the third line of defence and is accountable for: • providing independent and objective assurance to management and the ANZ Board regarding compliance with
policy and regulatory requirements; • performing objective assessments across all geographies, divisions, lines of business and processes, and • undertaking independent review of the adequacy of the I.AM - Operational Risk and Compliance Framework. Collectively Internal Audit, Operational Risk functions, Divisions and Business Units are responsible for monitoring and reporting to Executive Management, the Board, Regulators and others on all matters related to the measurement and management of Operational Risk. Operational Risk Framework ANZ’s I.AM - Operational Risk and Compliance Framework is delivered through: • Level 1 ANZ Board Operational Risk Approach (the policy) – approved by the Board Risk Committee, outlines the
core standards, roles and responsibilities and minimum requirements of the way in which operational risks and obligations are identified, acted on and monitored across ANZ sets the Operational Risk principles for governing the overall measurement and management of Operational Risk across ANZ.
• Level 2A Operational Risk Procedures (the Requirements, and Lifecycle, Roles and Responsibilities) – owned by
Group Operational Risk, provide the procedures to support the consistent application of Level 1 Policy across ANZ. The procedures are further augmented by tools, templates, systems and on-going training.

ANZ Basel III Pillar 3 disclosure September 2019
79
Operational risk mitigation In line with industry practice, ANZ obtains insurance to cover those Operational Risks where cost-effective premiums can be obtained. In conducting their business, Business Units are advised to act as if uninsured and not to use insurance as a guaranteed mitigants for operational risk. ANZ has business continuity, recovery and crisis management plans. The intention of the business continuity and recovery plans is to ensure critical business functions can be maintained, or restored in a timely fashion, in the event of material disruptions arising from internal or external events. Crisis management planning at Group and country levels supplement business continuity plans in the event of a broader group or country crisis. Crisis management plans include crisis team structures, roles, responsibilities and contact lists, and are subject to testing.
Operational risk reporting ANZ’s I.AM - Operational Risk and Compliance Framework includes a global, web-based Risk, Compliance and IT Governance tool that provides ANZ the source of truth and provides greater transparency and integrity of Risk, Controls, Obligations and Events information across ANZ. OREC’s role is to monitor and oversight at an enterprise level the state of Operational Risk and compliance management and to instigate any necessary corrective actions. ANZ has been authorised by APRA to use the advanced measurement approach (AMA) for calculation of operational risk capital requirements under APS 115 Capital Adequacy: Advanced Measurement Approaches to Operational Risk. This methodology applies across all of ANZ. However, for the purposes of RBNZ reporting, ANZ Bank New Zealand Ltd uses Reserve Bank of New Zealand standardised approach to Operational risk capital calculation.
Operational risk management
The objective of ANZ’s approach to Operational Risk is to ensure that risks are identified, assessed, measured, evaluated, treated, monitored and reported in a structured environment with appropriate governance oversight.
The I.AM - Operational Risk and Compliance Framework includes management and measurement of operational risks and compliance with laws, regulations, industry standards, codes and principles of good governance, and internal policies and procedures. It is founded on ANZ’s values and culture, which focus on doing what’s right and being ethical, accountable, trustworthy and transparent in our decisions.
ANZ takes a risk based approach to the management of Operational Risks and obligations. This enables ANZ to be consistent in proactively identifying, assessing, managing, reporting and escalating Operational Risk related risk exposures, while respecting the specific obligations of each jurisdiction in which we operate.
Day-to-day management of Operational Risk is the responsibility of business unit line management and staff. Risk management, supported by a strong Risk Culture, ensures all staff are thinking about and managing risk on a daily basis – “Risk is Everyone’s Responsibility”. However, Senior Management needs visibility of Key Risks. These are the risks that if they materialised, would adversely affect the achievement of business objectives, ANZ’s reputation, legal and regulatory compliance or impact key processes.
ANZ’s advanced measurement approach Group Operational Risk is responsible for maintaining ANZ’s AMA for the measurement and allocation of operational risk capital. Operational Risk Capital is held to protect depositors and shareholders of the bank from rare and severe unexpected losses. In order to quantify the overall Operational Risk profile, ANZ maintains and calculates Operational Risk Capital (including regulatory and economic capital), on at least a six monthly basis. The capital model uses the following data as inputs: • historical internal losses captured and reported in the bank wide Compliance and Operational Risk platform; • relevant external losses, sourced from the Operational Risk Data Exchange (ORX), an industry data base comprising
the anonymised loss data from over 90 member banks; • scenario analysis - unexpected potential loss estimates for severe but plausible risk events which are calculated
using exposure models developed using business data and inputs from subject matter experts. Once calculated, the capital is allocated to divisions based on the historic loss experience and exposure to scenarios. Understanding the divisional exposure to scenarios (and their underlying risk drivers) allows lines of business to consider capital impacts when making decisions. Accordingly, capital allocations are structured to encourage businesses to effectively manage their operational risk exposures e.g. improve controls, reduce losses etc.

ANZ Basel III Pillar 3 disclosure September 2019
80
Operational Risk Regulatory Capital to meet the regulatory capital soundness standard is based on a 99.9% confidence interval in accordance with APS 115. Operational Risk Economic Capital i based on 99.97% confidence interval. Definition of compliance risk Compliance Risk is a subset of Operational Risk. It covers the risk of failure to act in accordance with laws, regulations, industry standards and codes, internal policies and procedures and principles of good governance as applicable to ANZ’s businesses. Compliance The consequences of Compliance failure may include significant legal or regulatory sanctions, material financial loss (fines, civil penalties, damages) diminished reputation or restrictions on the ability of ANZ to do business. In order for the Business to be able to identify and manage Compliance Risk, they must identify their Regulatory Obligations and their impacted business activities, and maintain and monitor key controls. Compliance specific approaches include: • Centralised management of key obligations via a Global Obligations Library, enabling ANZ's change management
capability in relation to new and revised obligations.
• An emphasis on the identification of changing regulations and the business environment, to enable proactive assessment of emerging compliance risks.
• Recognition of incident management as a separate element to enhance ANZ's ability to identify, manage and report on incidents/breaches in a timely manner.
Management of the Whistle-blower Protection Policy ANZ will ensure there is an effective and fit for purpose channel, allowing employees and contractors to make confidential, anonymous submissions regarding concerns relating to accounting, internal control, compliance, audit and other matters.

ANZ Basel III Pillar 3 disclosure September 2019
81
Chapter 9 – Equities Table 16 Equities – Disclosures for banking book positions Definition and categorisation of equity investments held in the banking book Equity risk is the risk of financial loss arising from the unexpected reduction in value of equity investments not held in the trading book including those of the Group’s associates. ANZ’s equity exposures in the banking book are primarily categorised as follows: • Equity investments that are taken for strategic reasons - These transactions represent strategic business initiatives
and include ANZ’s investments in partnership arrangements with financial institutions in Asia. These investments are undertaken after extensive analysis and due diligence by Group Strategy, internal specialists and external advisors, where appropriate. Board approval is required prior to committing to any investments over delegated authorities, and all regulatory notification requirements are met. Performance of these investments is monitored by both the owning business unit and Group Strategy to ensure that it is within expectations and the values of the investments are tested at least six monthly for impairment.
• Equity investments made as the result of a work out of a problem exposure - From time to time, ANZ will take an equity stake in a customer as part of a work out arrangement for problem exposures. These investments are made only where there is no other viable option available and form an immaterial part of ANZ’s equity exposures.
Valuation of and accounting for equity investments in the banking book In line with Group Accounting Policy the accounting treatment of equity investments depends on whether ANZ has significant influence over the investee. Investments in associates Where significant influence exists, the investment is classified as an Investment in Associate in the financial statements. ANZ adopts the equity method of accounting for associates. ANZ’s share of the results of associates is included in the consolidated income statement. The associate investments are recognised at cost plus ANZ’s share of post-acquisition net assets. Interests in associates are reviewed bi-annually for impairment, using either market value, or a discounted cash flow methodology to assess value in-use. As at 30 September 2019 the carrying value of these investments were supported by value in use calculations. From 1 October 2018 – Investment Securities Where ANZ does not have significant influence over the investee, the instrument is categorised as an investment security and classified as fair value through profit and loss, with changes in fair value recognised in the income statement, unless designated irrevocably on acquisition as fair value through other comprehensive income (FVOCI). If this election is made, gains or losses are not reclassified from other comprehensive income to profit or loss on disposal of the investment. However, gains or losses may be reclassified within equity. Prior to 1 October 2018 - Available-for-Sale Investments Where ANZ does not have significant influence over the investee, the investment is classified as Available-for-Sale (AFS). The investment is initially recognised at fair value plus transaction costs. Changes in the fair value of the investments are recognised in an equity reserve with any impairment recognised in the income statement. When the asset is sold the cumulative gain or loss relating to the asset held in the AFS revaluation reserve was transferred to the income statement.

ANZ Basel III Pillar 3 disclosure September 2019
82
Table 16(b) and 16(c): Equities – Types and nature of Banking Book investments
Sep 19 Equity investments $M
Balance sheet value Fair value
Value of listed (publicly traded) equities 4,043 3,459 Value of unlisted (privately held) equities 135 135
Total 4,178 3,594
Mar 19
Equity investments $M
Balance sheet value Fair value
Value of listed (publicly traded) equities 3,937 3,683 Value of unlisted (privately held) equities 119 119
Total 4,056 3,802
Sep 18
Equity investments $M
Balance sheet value Fair value
Value of listed (publicly traded) equities 3,554 2,869 Value of unlisted (privately held) equities 86 86
Total 3,640 2,955
Table 16(d) and 16(e): Equities – gains (losses)
Half Year Half Year Half Year Sep 19 Mar 19 Sep 18
Realised gains (losses) on equity investments $M $M $M Cumulative realised gains (losses) from disposals and liquidations in the reporting period
- 42 124
Cumulative realised losses from impairment and writedowns in the reporting period
- - -
- 42 124
Half Year Half Year Half Year Sep 19 Mar 19 Sep 18
Unrealised gains (losses) on equity investments $M $M $M
Total unrealised gains (losses) (88) 160 36 Reversal of prior period unrealised gains (losses) from disposals and liquidations in the reporting period
- - -
Total unrealised gains (losses) included in Common Equity Tier 1, Tier 1 and/or Tier 2 capital
(88) 160 36
Table 16(f): Equities Risk Weighted Assets From 1 January 2013 all banking book equity exposures are deducted from Common Equity Tier 1 capital.
ANZ Basel III Pillar 3 disclosure September 2019
83
Chapter 10 – Interest Rate Risk in the Banking Book Table 17 Interest Rate Risk in the Banking Book Definition of Interest Rate Risk in the Banking Book (IRRBB) Interest rate risk in the banking book (IRRBB) relates to the potential adverse impact of changes in market interest rates on ANZ’s future net interest income. The risk generally arises from: • Repricing and yield curve risk - the risk to earnings or market value as a result of changes in the overall level of
interest rates and/or the relativity of these rates across the yield curve. • Basis risk - the risk to earnings or market value arising from volatility in the interest margin applicable to banking
book items. • Optionality risk – the risk to earnings or market value arising from the existence of stand-alone or embedded
options in banking book items. Regulatory capital approach ANZ has received approval from APRA to use the IMA for the calculation of regulatory capital for IRRBB, under APS 117 Capital Adequacy: Interest Rate Risk in the Banking Book (Advanced ADIs). Governance The Board Risk Committee has established a risk appetite for IRRBB and delegated authority to the Group Asset and Liability Committee (GALCO) to manage the strategic position (capital investment term) and oversee the interest rate risk arising from the repricing of asset and liabilities (mismatch risk) in the banking book. GALCO has delegated the management of this mismatch risk to the Markets business. Market Risk is the independent function responsible for: • Designing and implementing policies and procedures to ensure that IRRBB exposure is managed within the limit
framework set by the Board Risk Committee. • Monitoring and measuring IRRBB market risk exposure, compliance with limits and policies. • Ensuring ongoing effectiveness and appropriateness of the risk management framework. Risk Management framework IRRBB is managed under a comprehensive measurement and reporting framework, supported by an independent Market Risk function. Key components of the framework include: • A comprehensive set of policies that promote proactive risk identification and communication. • Funds Transfer Pricing framework to transfer interest rate risk from business units so it can be managed by the
Markets business and monitored by Market Risk. • Quantifying the magnitude of risks and controlling the potential impact that changes in market interest rates can
have on the net interest income and balance sheet market value of ANZ. • Regular and effective reporting of IRRBB to executive management and the Board.

ANZ Basel III Pillar 3 disclosure September 2019
84
Measurement of interest rate risk in the banking book ANZ uses the following principal techniques to quantify and monitor IRRBB: • Interest Rate Sensitivity - this is an estimate of the change in economic value of the banking book due to a 1 basis
point move in a specific part of the yield curve.
• Earnings at risk (EaR) - this is an estimate of the amount of income that is at risk from interest rate movements over a given holding period, expressed to a 97.5% level of statistical confidence.
• Value at risk (VaR) - this is an estimate of the impact of interest rate changes on the banking book’s market value,
expressed to a 99% level of statistical confidence for a given holding period. • Market Value loss limits - this mitigates the potential for embedded losses within the banking book. • Stress testing - standard extraordinary forward looking and repricing term assumptions tests are used to highlight
potential risk which may not be captured by VaR, and how the portfolio might behave under extraordinary circumstances.
The calculations used to quantify IRRBB require assumptions to be made about the repricing term of exposures that do not have a contractually defined repricing date, such as deposits with no set maturity dates, and prepayments. Changes to these assumptions require GALCO approval. Basis and optionality risks are measured using Monte Carlo simulation techniques, to generate a theoretical worst outcome at a specified confidence level (typically no less than at a 99% level of statistical confidence) less the average outcome. Reporting of interest rate risk in the banking book Market Risk analyses the output of ANZ’s VaR, EaR and Stress Testing calculations daily. Compliance with the risk appetite and limit framework is reported to CMRC, GALCO and the Board Risk Committee. ANZ’s interest rate risk in the banking book capital requirement The IRRBB regulatory capital requirements includes a value for repricing and yield curve risk, basis and optionality risks based on a 99% confidence interval, one year holding period and a six year historical data set. Embedded losses also contribute to make up the capital requirement and are calculated as the difference between the book value of banking book items and the current economic value taking hedge accounting aspects into account. Results of standard shock scenario The Basel II framework sets out a standard shock scenario of a 200 basis point parallel shift change in interest rates, in order to establish a comparable test across banks. Table 17(b) that follows shows the results of this test by currency of the exposures outside the trading book.

ANZ Basel III Pillar 3 disclosure September 2019
85
Table 17(b): Interest Rate Risk in the Banking Book
Change in Economic Value Standard Shock Scenario Stress Testing: Sep 19 Mar 19 Sep 18 Interest rate shock applied $M $M $M
AUD 200 basis point parallel increase (508) (336) (485) 200 basis point parallel decrease 527 327 497
NZD 200 basis point parallel increase (136) (76) (133) 200 basis point parallel decrease 126 64 129
USD 200 basis point parallel increase (34) - (76) 200 basis point parallel decrease 38 1 76
GBP 200 basis point parallel increase 18 33 21 200 basis point parallel decrease (19) (34) (21)
Other 200 basis point parallel increase (44) 24 (48) 200 basis point parallel decrease 50 (22) 52
IRRBB regulatory capital 554 580 705
IRRBB regulatory RWA 6,922 7,245 8,814
IRRBB stress testing methodology Stress tests within ANZ include standard extraordinary forward looking and repricing term assumptions tests. These tests are used to highlight potential risk which may not be captured by VaR, and how the portfolio might behave under extraordinary circumstances. Standard stress tests include statistically derived scenarios based on historical yield curve movements. These combine parallel shocks with twists and bends in the curve to produce a wide range of hypothetical scenarios at high statistical confidence levels, with the single worst scenario identified and reported. Other stress tests include interest rate moves from historical periods of stress possible future stress test as well as stresses to assumptions made about the repricing term of exposures. The extraordinary rate move scenarios include rate changes over the stressed periods in financial market history. Forward looking stress tests include interest rate moves from plausible future severe scenarios. Stresses of the repricing term assumptions investigate scenarios where actual repricing terms are significantly different to those modelled.

ANZ Basel III Pillar 3 disclosure September 2019
86
Chapter 11 – Leverage and Liquidity Coverage Ratio
Leverage Ratio The Leverage Ratio requirements are part of the Basel Committee on Banking Supervision (BCBS) Basel III capital framework. It is a simple, non-risk based supplement or backstop to the current risk based capital requirements and is intended to restrict the build-up of excessive leverage in the banking system. Consistent with the BCBS definition, APRA’s Leverage Ratio compares Tier 1 Capital to the Exposure Measure (expressed as a percentage) as defined by APS 110. APRA has not finalised a minimum Leverage Ratio requirement for Australian ADIs, although they have proposed a minimum of 3.5% for internal ratings based approach ADI. At 30 September 2019, the Group’s Leverage Ratio of 5.6% was above the 3% minimum currently required by the BCBS. Table 18 below shows the Group’s Leverage Ratio calculation as at 30 September 2019 and Table 19 summarises the reconciliation of accounting assets and leverage ratio exposure measure at 30 September 2019.
Table 18 Leverage Ratio
Sep 19 Mar 19 Sep 18 $M $M $M
On-balance sheet exposures 1 On-balance sheet items (excluding derivatives and SFTs, but including collateral) 823,620 824,997 799,199 2 (Asset amounts deducted in determining Basel III Tier 1 capital) (12,976) (14,082) (13,794)
3 Total on-balance sheet exposures (excluding derivatives and SFTs) 810,644 810,915 785,405
Derivative exposures
4 Replacement cost associated with all derivatives transactions (ie net of eligible cash variation margin)
11,565 8,074 8,702
5 Add-on amounts for PFE associated with all derivatives transactions 32,713 31,651 29,471 6 Gross-up for derivatives collateral provided where deducted from the balance sheet
assets pursuant to the operative accounting framework 1,384 - -
7 (Deductions of receivables assets for cash variation margin provided in derivatives transactions)
(11,893) (8,789) (8,106)
8 (Exempted CCP leg of client-cleared trade exposures) - - - 9 Adjusted effective notional amount of written credit derivatives 3,906 2,060 2,137 10 (Adjusted effective notional offsets and add-on deductions for written credit
derivatives) (3,417) (1,557) (1,528)
11 Total derivative exposures 34,258 31,439 30,676
Securities financing transaction exposures
12 Gross SFT assets (with no recognition of netting), after adjusting for sale accounting transactions
35,980 36,256 34,173
13 (Netted amounts of cash payables and cash receivables of gross SFT assets) (1,426) (1,344) (253) 14 CCR exposure for SFT assets 2,369 2,375 2,146 15 Agent transaction exposures - - -
16 Total securities financing transaction exposures 36,923 37,287 36,066
Other off-balance sheet exposures
17 Off-balance sheet exposure at gross notional amount 253,791 245,941 245,108 18 (Adjustments for conversion to credit equivalent amounts) (146,391) (139,999) (142,298)
19 Off-balance sheet items 107,400 105,942 102,810
Capital and Total Exposures 20 Tier 1 capital 55,221 53,075 52,218 21 Total exposures 989,225 985,583 954,957
Leverage ratio 22 Basel III leverage ratio 5.6% 5.4% 5.5%

ANZ Basel III Pillar 3 disclosure September 2019
87
Table 19 Summary comparison of accounting assets vs. leverage ratio exposure measure
Sep 19 Mar 19 Sep 18 $M $M $M
1 Total consolidated assets as per published financial statements 981,137 980,244 942,624 2 Adjustment for investments in banking, financial, insurance or commercial entities
that are consolidated for accounting purposes but outside the scope of regulatory consolidation.
(871) (39,618) (40,829)
3 Adjustment for assets held on the balance sheet in a fiduciary capacity pursuant - to the Australian Accounting Standards but excluded from the leverage ratio exposure measure
- -
4 Adjustments for derivative financial instruments. (86,409) (47,936) (37,747) 5 Adjustment for SFTs (i.e. repos and similar secured lending) 944 1,033 1,893 6 Adjustment for off-balance sheet exposures (i.e. conversion to credit equivalent
amounts of off-balance sheet exposures) 107,400 105,942 102,810
7 Other adjustments (12,976) (14,082) (13,794)
Leverage ratio exposure 989,225 985,583 954,957

ANZ Basel III Pillar 3 disclosure September 2019
88
Table 20 Liquidity Coverage Ratio disclosure template Sep 19 Jun 19 Mar 19
Total Unweighted
Value $M
Total Weighted
Value $M
Total Unweighted
Value $M
Total Weighted
Value $M
Total Unweighted
Value $M
Total Weighted
Value $M
Liquid assets, of which: 1 High-quality liquid assets (HQLA) - 144,200 - 137,770 - 141,966 2 Alternative liquid assets (ALA) - 41,400 - 41,815 - 41,999 3 Reserve Bank of New Zealand (RBNZ)
securities - 4,997 - 5,150 - 5,579
Cash outflows 4 Retail deposits and deposits from
small business customers 202,675 20,702 196,242 19,932 196,966 20,100
5 of which: stable deposits 78,262 3,913 76,070 3,804 75,599 3,780 6 of which: less stable deposits 124,413 16,789 120,172 16,128 121,367 16,320 7 Unsecured wholesale funding 208,233 114,820 199,950 110,313 198,225 110,546 8 of which: operational deposits (all
counterparties) and deposits in networks for cooperative banks
64,317 15,552 60,514 14,670 57,304 13,840
9 of which: non-operational deposits (all counterparties)
132,524 87,876 127,266 83,473 128,579 84,364
10 of which: unsecured debt 11,392 11,392 12,170 12,170 12,342 12,342 11 Secured wholesale funding 513 168 1,165 12 Additional requirements 143,054 40,181 139,289 37,855 136,570 35,619 13 of which: outflows related to
derivatives exposures and other collateral requirements
24,736 24,736 22,724 22,724 20,668 20,668
14 of which: outflows related to loss of funding on debt products
- - - - - -
15 of which: credit and liquidity facilities
118,318 15,445 116,565 15,131 115,902 14,951
16 Other contractual funding obligations 10,892 - 11,403 - 10,508 - 17 Other contingent funding obligations 66,370 3,985 67,841 4,795 70,505 4,292
18 Total cash outflows 180,201 173,063 171,722
Cash inflows 19 Secured lending (e.g. reverse repos) 30,556 1,901 28,145 1,732 28,676 1,542 20 Inflows from fully performing
exposures 37,335 26,443 37,147 25,744 33,223 22,715
21 Other cash inflows 18,235 18,235 16,680 16,680 15,336 15,336
22 Total cash inflows 86,126 46,579 81,972 44,156 77,235 39,593
23 Total liquid assets 190,597 184,735 189,544 24 Total net cash outflows 133,622 128,907 132,129
25 Liquidity Coverage Ratio (%) 142.6% 143.3% 143.5%
Number of data points used (simple average) 66 65 63
Liquidity Coverage Ratio (LCR) ANZ’s average LCR for the 3 months to 30 September 2019 was 142.6% with total liquid assets exceeding net outflows by an average of $56.9 billion. The main contributors to net cash outflows were modelled outflows associated with the bank’s corporate and retail deposit portfolios, offset by inflows from maturing loans. While cash outflows associated with derivatives are material, these are effectively offset by derivative cash inflows. The composition of the liquid asset portfolio has remained relatively stable through the quarter, with HQLA securities and cash making up on average 76% of total liquid assets. ANZ has a well-diversified deposit and funding base avoiding undue concentrations by investor type, maturity, market source and currency. ANZ monitors and manages its liquidity risk on a daily basis including LCR by geography and currency, ensuring ongoing compliance across the network.

ANZ Basel III Pillar 3 disclosure September 2019
89
Table 21 NSFR disclosure template
Sep 19 Unweighted value by residual maturity BLANK
No maturity
< 6 months
6 months
to < 1yr ≥ 1yr
Weighted value
Available Stable Funding (ASF) Item $M $M $M $M $M
1 Capital 60,928 - - 15,993 76,921 2 of which: regulatory capital 60,928 - - 15,993 76,921 3 of which: other capital instruments - - - - - 4 Retail deposits and deposits from small business customers 175,878 76,068 7,727 2,892 241,288 5 of which: stable deposits 75,312 18,486 - - 89,108 6 of which: less stable deposits 100,566 57,582 7,727 2,892 152,180 7 Wholesale funding 108,827 259,407 34,547 91,003 197,037 8 of which: operational deposits 64,325 - - - 32,162 9 of which: other wholesale funding 44,502 259,407 34,547 91,003 164,875 10 Liabilities with matching interdependent assets - - - - - 11 Other liabilities 16,116 6,620 - 295 295 12 of which: NSFR derivative liabilities 6,620 - - 13 of which: All other liabilities and equity not included in the above
categories 16,116 - - 295 295
14 Total ASF 515,541
Required Stable Funding (RSF) Item 15a Total NSFR (HQLA) 6,950 15b ALA 4,800 15c RBNZ securities 849 16 Deposits held at other financial institutions for operational purposes - - - - - 17 Performing loans and securities 17,218 120,967 49,663 419,824 389,062 18 of which: Performing loans to financial institutions secured by
Level 1 HQLA - 30,136 - - 3,014
19 of which: Performing loans to financial institutions secured by non-Level 1 HQLA and unsecured performing loans to financial institutions
395 34,549 11,725 11,413 22,853
20 of which: Performing loans to non- financial corporate clients, loans to retail and small business customers, and loans to sovereigns, central banks and public sector entities (PSEs)
15,945 50,602 32,031 115,171 152,732
21 of which: With a risk weight of less than or equal to 35% under APS 112
15 588 413 4,809 3,636
22 of which: Performing residential mortgages - 5,110 5,108 289,962 206,246 23 of which: With a risk weight equal to 35% under APS 112 - 4,543 4,545 253,429 174,628 24 of which: Securities that are not in default and do not qualify as
HQLA, including exchange-traded equities 878 570 799 3,278 4,217
25 Assets with matching interdependent liabilities - - - - - 26 Other assets: 21,899 32,725 565 4,167 33,660 27 of which: Physical traded commodities, including gold 1,794 1,525 28 of which: Assets posted as initial margin for derivative contracts and
contributions to default funds of central counterparties (CCPs) 1,571 - - 1,336
29 of which: NSFR derivative assets 11,565 - - 4,945 30 of which: NSFR derivative liabilities before deduction of variation
margin posted 18,541 - - 3,708
31 of which: All other assets not included in the above categories 20,105 1,048 565 4,167 22,146 32 Off-balance sheet items - - 182,367 7,664
33 Total RSF 442,985
34 Net Stable Funding Ratio (%) 116.38%
ANZ's NSFR as at 30 September 2019 was 116.4%, up 1.5% for the quarter. The main sources of Available Stable Funding (ASF) at September 2019 were deposits from Retail and SME customers, at 47%, with other wholesale funding at 32% and capital at 15% of the total ASF. The majority of ANZ's Required Stable Funding (RSF) at September 2019 was driven by mortgages at 47% and other lending to non-FI customers at 34% of the total RSF.

ANZ Basel III Pillar 3 disclosure September 2019
90
Table 21 NSFR disclosure template (continued)
Jun 19 Unweighted value by residual maturity BLANK
No maturity
< 6 months
6 months
to < 1yr ≥ 1yr
Weighted value
Available Stable Funding (ASF) Item $M $M $M $M $M
1 Capital 59,760 - - 14,045 73,806 2 of which: regulatory capital 59,760 - - 14,045 73,806 3 of which: other capital instruments - - - - - 4 Retail deposits and deposits from small business customers 169,611 76,165 9,549 2,926 237,315 5 of which: stable deposits 72,279 19,643 - - 87,326 6 of which: less stable deposits 97,332 56,522 9,549 2,926 149,989 7 Wholesale funding 121,249 259,674 31,039 92,185 198,684 8 of which: operational deposits 65,861 - - - 32,930 9 of which: other wholesale funding 55,388 259,674 31,039 92,185 165,754 10 Liabilities with matching interdependent assets - - - - - 11 Other liabilities 19,144 5,368 - 1,508 1,508 12 of which: NSFR derivative liabilities 5,368 - - 13 of which: All other liabilities and equity not included in the above
categories 19,144 - - 1,508 1,508
14 Total ASF 511,313
Required Stable Funding (RSF) Item 15(a) Total NSFR (HQLA) 5,725 15(b) ALA 4,800 15(c) RBNZ securities 649 16 Deposits held at other financial institutions for operational
purposes - - - - -
17 Performing loans and securities 17,667 129,925 39,091 423,280 392,194 18 of which: Performing loans to financial institutions secured by
Level 1 HQLA - 33,395 - - 3,339
19 of which: Performing loans to financial institutions secured by non-Level 1 HQLA and unsecured performing loans to financial institutions
513 35,889 7,976 10,092 19,977
20 of which: Performing loans to non- financial corporate clients, loans to retail and small business customers, and loans to sovereigns, central banks and public sector entities (PSEs)
16,227 55,257 25,542 115,068 152,186
21 of which: With a risk weight of less than or equal to 35% under APS 112
4 1,800 225 3,584 3,345
22 of which: Performing residential mortgages - 4,992 4,999 293,720 211,681 23 of which: With a risk weight equal to 35% under APS 112 - 4,430 4,437 250,777 174,617 24 of which: Securities that are not in default and do not qualify as
HQLA, including exchange-traded equities 927 392 574 4,400 5,011
25 Assets with matching interdependent liabilities - - - - - 26 Other assets: 25,431 27,228 1,347 3,980 34,670 27 of which: Physical traded commodities, including gold 2,045 1,738 28 of which: Assets posted as initial margin for derivative contracts and
contributions to default funds of central counterparties (CCPs) 1,577 - - 1,340
29 of which: NSFR derivative assets 9,088 - - 3,720 30 of which: NSFR derivative liabilities before deduction of variation
margin posted 16,147 - - 3,229
31 of which: All other assets not included in the above categories 23,386 416 1,347 3,980 24,643 32 Off-balance sheet items - - 177,176 7,116
33 Total RSF 445,154
34 Net Stable Funding Ratio (%) 114.86%

ANZ Basel III Pillar 3 disclosure September 2019
91
Glossary ADI Authorised Deposit-taking Institution.
Basel III Credit Valuation adjustment (CVA) capital charge
CVA charge is an additional capital requirement under Basel III for bilateral derivative exposures. Derivatives not cleared through a central exchange/counterparty are subject to this additional capital charge and also receive normal CRWA treatment under Basel II principles.
Collectively Assessed Provision for Credit Impairment
Collectively assessed provisions for credit impairment represent the Expected Credit Loss (ECL) calculated in accordance with AASB 9 Financial Instruments (AASB 9). These incorporate forward looking information and do not require an actual loss event to have occurred for an impairment provision to be recognised.
Credit exposure The aggregate of all claims, commitments and contingent liabilities arising
from on- and off-balance sheet transactions (in the banking book and trading book) with the counterparty or group of related counterparties.
Credit risk The risk of financial loss resulting from a counterparty failing to fulfil its
obligations, or from a decrease in credit quality of a counterparty resulting in a loss in value.
Credit Valuation Adjustment (CVA)
Over the life of a derivative instrument, ANZ uses a CVA model to adjust fair value to take into account the impact of counterparty credit quality. The methodology calculates the present value of expected losses over the life of the financial instrument as a function of probability of default, loss given default, expected credit risk exposure and an asset correlation factor. Impaired derivatives are also subject to a CVA.
Days past due
The number of days a credit obligation is overdue, commencing on the date that the arrears or excess occurs and accruing for each completed calendar day thereafter.
Exposure at Default (EAD) Exposure At Default is defined as the expected facility exposure at the date
of default. Impaired assets (IA) Facilities are classified as impaired when there is doubt as to whether the
contractual amounts due, including interest and other payments, will be met in a timely manner. Impaired assets include impaired facilities, and impaired derivatives. Impaired derivatives have a credit valuation adjustment (CVA), which is a market assessment of the credit risk of the relevant counterparties.
Impaired loans (IL) Impaired loans comprise of drawn facilities where the customer’s status is
defined as impaired. Individual provision charge (IPC)
Individual provision charge is the amount of expected credit losses on financial instruments assessed for impairment on an individual basis (as opposed to on a collective basis). It takes into account expected cash flows over the lives of those financial instruments.
Individually Assessed Provisions for Credit Impairment
Individually assessed provisions for credit impairment are calculated in accordance with AASB 9 Financial Instruments (AASB 9). They are assessed on a case-by-case basis for all individually managed impaired assets taking into consideration factors such as the realisable value of security (or other credit mitigants), the likely return available upon liquidation or bankruptcy, legal uncertainties, estimated costs involved in recovery, the market price of the exposure in secondary markets and the amount and timing of expected receipts and recoveries.

ANZ Basel III Pillar 3 disclosure September 2019
92
Internationally Comparable Basel III Capital Ratio
The Internationally Comparable Basel III CET1 ratios are ANZ’s interpretation of the regulations documented in the Basel Committee publications; “Basel 3: A global regulatory framework for more resilient banks and banking systems” (June 2011) and “International Convergence of Capital Measurement and Capital Standards” (June 2006). They also include differences identified in APRA’s information paper entitled International Capital Comparison Study (13 July 2015).
Market risk The risk to ANZ’s earnings arising from changes in interest rates, foreign
exchange rates, credit spreads, volatility, correlations or from fluctuations in bond, commodity or equity prices. ANZ has grouped market risk into two broad categories to facilitate the measurement, reporting and control of market risk:
Traded market risk - the risk of loss from changes in the value of financial
instruments due to movements in price factors for both physical and derivative trading positions. Trading positions arise from transactions where ANZ acts as principal with customers, financial exchanges or inter-bank counterparties.
Non-traded market risk (or balance sheet risk) - comprises interest rate
risk in the banking book and the risk to the AUD denominated value of ANZ’s capital and earnings due to foreign exchange rate movements.
Operational risk The risk of loss resulting from inadequate or failed internal processes,
people and systems, or from external events including legal risk but excluding reputation risk.
Past due facilities Facilities where a contractual payment has not been met or the customer is
outside of contractual arrangements are deemed past due. Past due facilities include those operating in excess of approved arrangements or where scheduled repayments are outstanding but do not include impaired assets.
Qualifying Central Counterparties (QCCP)
QCCP is a central counterparty which is an entity that interposes itself between counterparties to derivative contracts. Trades with QCCP attract a more favorable risk weight calculation.
Recoveries Payments received and taken to profit for the current period for the
amounts written off in prior financial periods. Restructured items Restructured items comprise facilities in which the original contractual
terms have been modified for reasons related to the financial difficulties of the customer. Restructuring may consist of reduction of interest, principal or other payments legally due, or an extension in maturity materially beyond those typically offered to new facilities with similar risk.
Risk Weighted Assets (RWA) Assets (both on and off-balance sheet) are risk weighted according to each
asset’s inherent potential for default and what the likely losses would be in the case of default. In the case of non-asset backed risks (i.e. market and operational risk), RWA is determined by multiplying the capital requirements for those risks by 12.5.
Securitisation risk The risk of credit related losses greater than expected due to a
securitisation failing to operate as anticipated, or of the values and risks accepted or transferred, not emerging as expected.
Write-Offs Facilities are written off against the related provision for impairment when
they are assessed as partially or fully uncollectable, and after proceeds from the realisation of any collateral have been received. Where individual provisions recognised in previous periods have subsequently decreased or are no longer required, such impairment losses are reversed in the current period income statement.

ANZ Basel III Pillar 3 disclosure September 2019
93
This page has been intentionally left blank

ANZ Basel III Pillar 3 Disclosure June 2017