2019 – 2024 Transit Development Plan - Wa
52
2019-2024 TRANSIT DEVELOPMENT PLAN 1 2019 – 2024 Transit Development Plan
Transcript of 2019 – 2024 Transit Development Plan - Wa

2019-2024 TRANSIT DEVELOPMENT PLAN
1
2019 – 2024 Transit Development Plan

2019-2024 TRANSIT DEVELOPMENT PLAN
2
Contents Executive Summary ........................................................................................................................ 4
BFTs Ongoing Role in the Community .......................................................................................... 6
Dial-A-Ride (DAR) .................................................................................................................... 6
Fixed Route ................................................................................................................................. 6
Loss of Taxi Contracted Services ............................................................................................... 6
General Demand ......................................................................................................................... 7
Vanpool ....................................................................................................................................... 7
Inter-Agency Coordination ......................................................................................................... 7
State and Federal Collaboration .................................................................................................. 7
Negotiating Access to Transit - Amenities Help Exemplify Pro-Transit Urban Design ................ 8
Technology – Gateway to Performance Based Monitoring and Evaluation ................................. 10
Employing Professional Manpower and Resources to Keep Projects Moving ............................ 10
Where We Want to Be .................................................................................................................. 11
BFT is Advocating for a New Land Use Paradigm; Focus on ‘Nodes and Corridors’ ............ 12
Actively Participate to Make Emerging Projects Work for Transit .......................................... 13
Budgeting and Finance Balance Sheet .......................................................................................... 13
Fleet Purchasing Schedule ............................................................................................................ 14
2020-2025 CIP .............................................................................................................................. 14
Appendix A: About Ben Franklin Transit .................................................................................... 17
Existing Strategic Plan .............................................................................................................. 17
Administrative Organization of BFT – Recruitment, Succession Planning and Contract Fulfillment ................................................................................................................................ 18
Appendix B.1: Review of Local and Regional Plans and Policies and Assessment of Public Transportation Requirements ........................................................................................................ 19
Subarea and Corridor Plans ...................................................................................................... 19
City of Kennewick Comprehensive Plan .................................................................................. 20
City of Richland Comprehensive Plan (2017) .......................................................................... 21
City of West Richland Comprehensive Plan (2016) ................................................................. 21
City of Pasco Comprehensive Plan (Draft 2019) ...................................................................... 22
Benton City Comprehensive Plan (2017) ................................................................................. 22
City of Prosser Comprehensive Plan (2018) ............................................................................. 22
Managing Regional Air Quality ............................................................................................... 23
WSDOT Regional Congestion Management ............................................................................ 23
Appendix B.2: Review of State Transportation Plans and Policies and Assessment of Public Transportation Requirements ........................................................................................................ 24

2019-2024 TRANSIT DEVELOPMENT PLAN
3
Appendix C.1: Equipment and Facilities Inventory Fleet and Asset Replacement Standards ..... 25
Transit Asset Management ....................................................................................................... 27
Appendix C.2: 2020-2025 CIP and Program of Projects .............................................................. 28
CIP Annual Work Programming for 2019 ................................................................................ 28
Appendix C.3: Inventory of Services............................................................................................ 34
Appendix C.4: Service Standards ................................................................................................. 35
Fixed Route Service Standard Statement .................................................................................. 35
Appendix C.5: Financial Report ................................................................................................... 36
2018 Basic Financial Statement ................................................................................................ 36
2019 Service Levels & Ridership Assumptions ....................................................................... 37
Department Budgets ................................................................................................................. 38
Budget Assumptions ................................................................................................................. 39
2020-2024 Budget Forecast ...................................................................................................... 41
Appendix C.6: Community Participation (General Overview and Policy) .................................. 42
Procedures ................................................................................................................................. 42
Appendix C.7: Specific Public Engagement for the 2019-2024 TDP .......................................... 44
A Compliant TDP Document Requires Earnest Community Participation .............................. 44
Appendix C.8: Operating Indicators by Mode/Group .................................................................. 45
BFT Operating Cost per Boarding ............................................................................................ 45
BFT Operating Expense / Revenue Hour ................................................................................. 46
BFT Boardings per Revenue Hour ........................................................................................... 47
BFT Boardings per Revenue Mile ............................................................................................ 48
BFT Fare Box vs Operating Cost ............................................................................................. 49
BFT Staff per Revenue Hour .................................................................................................... 50
BFT Park and Ride Performance Indicator – Average Daily Utilization ................................. 51
National Transit Database (NTD) Summary Statistics – Latest NTD system Profile is 2017 .......................................................................................................................................... 52

2019-2024 TRANSIT DEVELOPMENT PLAN
4
Executive Summary This TDP was assembled immediately after 18 months of stabilization following the system-wide fixed route service change of September 2017; e.g., the first major fixed route service update in the last decade, also referred to as the Comprehensive Service Plan or CSP. Simultaneously, a full suite of state-of-the-art onboard electronic equipment was activated. The rich data stream is only just being absorbed internally and has yet to be shared with our regional transportation partners.
With “stabilization” behind us, we can now focus our attention on “integrating” Ben Franklin Transit (BFT) services into jurisdictional development plans and policies. The Tri-Cities is not a cohesive metropolitan area, but instead an agglomeration of five small cities and two counties that are often competing for the same resources. This decentralized approach is embraced by the community in a way that makes the Tri-Cities unique. People here enjoy being in an adjacent city
with a different ambiance within a matter of minutes. However, the jurisdictions are aware that regionalization is the best path to: traffic congestion mitigation, air quality conformity, tourism, and to a lesser degree, collaborative economic development. Recent regional traffic and air quality discussions are already calling for multi-modal alternatives as practical solutions to new bridges and wider roads.
The BFT 2017 comprehensive fixed route service plan responded by building strong intercity routes that connect the Kennewick, Pasco, Richland Transit Centers (see map in Appendix C.3), which are the highest producing routes in the system. None of the cities have an urban core, so BFT struggles to capture rides along shallow commercial arterial strips backed by low-lying single-family housing on half acre lots. Post 2000 residential tract housing has replaced large swaths of agricultural land with walled subdivisions with minimal road networks that lack interconnectivity—making transit service almost impossible.
BFT needs more than an incremental approach to building on the CSP. Therefore, the 2019-2024 TDP will enabled a longer-range service plan, which will be based on solid demographic and land use analysis. This TDP helps define the resources needed to move closer to the paradigm shift aimed at transit-oriented development and subsequent increased ridership growth.
Connectivity Assessments
Measuring quality along the immediate path of a given route is valuable, as it reflects the end goal of connecting people and places. Useful assessments must consider the function of those facilities within the larger network. Transit agencies typically do not have jurisdiction over pedestrian and bicycle facilities beyond their stop and station sites, but can influence change through positive participation in local and regional forums.
https://www.fhwa.dot.gov/environment/bicycle_pedestrian/publications/multimodal_connectivity/#toc502339723
2019-2024 TRANSIT DEVELOPMENT PLAN
5
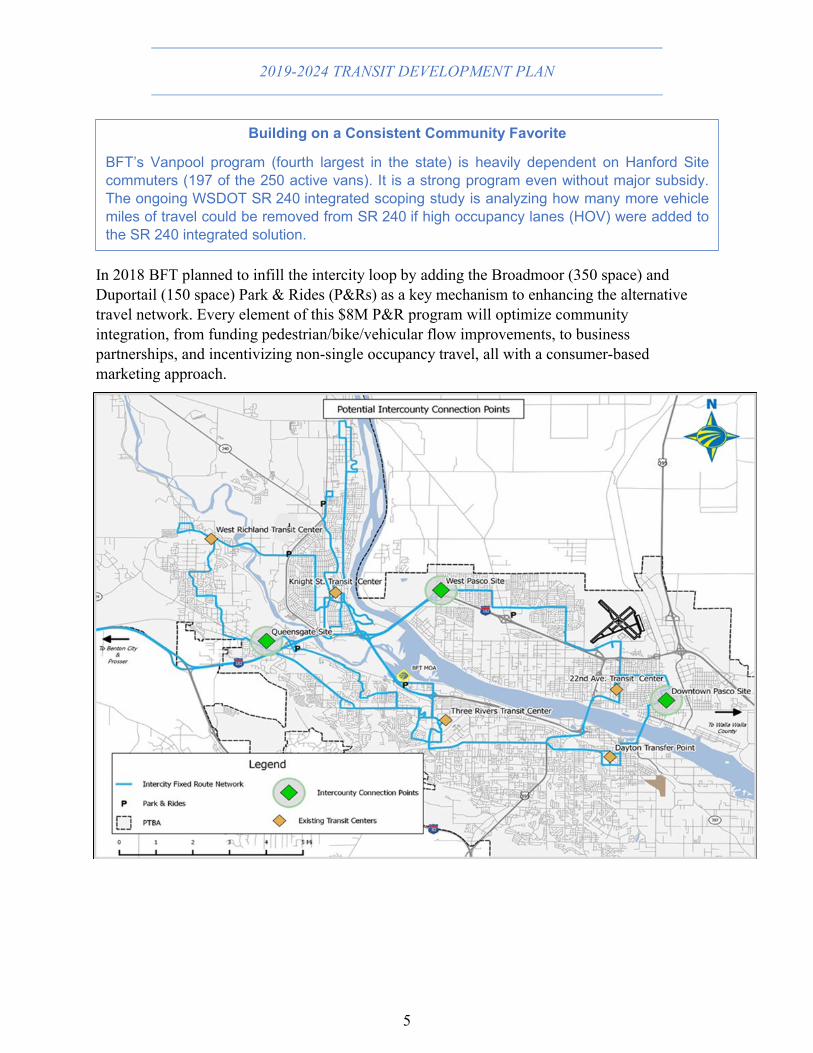
In 2018 BFT planned to infill the intercity loop by adding the Broadmoor (350 space) and Duportail (150 space) Park & Rides (P&Rs) as a key mechanism to enhancing the alternative travel network. Every element of this $8M P&R program will optimize community integration, from funding pedestrian/bike/vehicular flow improvements, to business partnerships, and incentivizing non-single occupancy travel, all with a consumer-based marketing approach.
Building on a Consistent Community Favorite
BFT’s Vanpool program (fourth largest in the state) is heavily dependent on Hanford Site commuters (197 of the 250 active vans). It is a strong program even without major subsidy. The ongoing WSDOT SR 240 integrated scoping study is analyzing how many more vehicle miles of travel could be removed from SR 240 if high occupancy lanes (HOV) were added to the SR 240 integrated solution.

2019-2024 TRANSIT DEVELOPMENT PLAN
6
BFTs Ongoing Role in the Community
Dial-A-Ride (DAR)
In 2018, DAR ran almost as many miles (1,749,500) and hours (118,200) as the entire fixed route fleet, to provide much appreciated door-to-door service to Americans with Disabilities Act (ADA) qualified individuals. DAR runs everywhere in the 616-square-mile Public Transit Benefit Area (PTBA), not just the FTA-required ¾ mile buffer surrounding the fixed route system. In 2018, a new three-year collaborative contract was negotiated with the Arc of Tri-Cities to provide transport for eligible persons with intellectual and developmental disabilities. BFT continues to adhere to a judicious ADA screening process that ensures only truly eligible people ride door-to-door service, thereby preserving the Tri-Cities community trust in the way BFT is spending tax dollars on public transportation.
Fixed Route
BFT’s flagship service is the 17 fixed bus routes that logged 2,032,773 boardings in 2018, with a priority to serve even more in 2019. According to an October 2018 rider survey the new fixed route network “works well” for the everyday riders (1/3 of the 1,550 surveyed were regulars who use the bus at least six times a week); 26% of those surveyed were traveling to work, 21% were traveling for recreation and 32% were traveling to school. BFT continues to provide overflow buses (trippers) to high schools during the school peak demand period. BFT fixed route serves the Columbia Basin College (CBC) campus every half hour with Route 225. The CBC/BFT college pass program offers students unlimited rides when they flash their valid student ID card with current term sticker affixed. In 2018, 131,626 CBC passes were honored, many coming directly from the high schools to campus while enrolled in the Running Start program, which encourages high school students to earn college credits.
Loss of Taxi Contracted Services
The BFT Board of Directors voted to issue a Request for Proposals (RFP) to recruit a new vendor to fill the void left by a loss of contracted taxi services due to sudden contractor closure on October 30, 2018. In the meantime, BFT restored service to previous riders principally through the General Demand service model and addition of two later hours of night service on fixed route. BFT replicated the Prosser General Demand Response model for the ‘last mile’ connection to fixed route to designated points in underserved pockets of the PTBA. The Arc of Tri-Cities agreed to transport even more people with intellectual and developmental disabilities, which freed up a BFT/DAR vehicle to provide General Demand service in Finley; Finley had been left with no public transportation options. BFT also extended the fixed route coverage from 8 p.m. Monday thru Friday and from 7 p.m. Saturday, to10 p.m. on all days across most routes beginning March 11, 2019, to help restore some degree of night service previously served by taxi. Due to the loss of a contracted taxi on Sundays, BFT offered eligible non-profit organizations a $250 retired vanpool vehicle via the ‘Van-Me-Down’ program and van rentals via the ‘Community Van’ program, which are both managed by BFT’s Vanpool team. To help resolve the loss of service dozens of calls were made by the executive and management staff to the group
2019-2024 TRANSIT DEVELOPMENT PLAN
7
homes and individuals who routinely made Sunday trips for jobs and church events, in hopes of helping fill the Sunday service void.
General Demand
Traveled 145,100 revenue miles, clocking 6,700 revenue hours, and provided 27,500 boardings in 2018.
Vanpool
BFT’s conventional Vanpool program continues to supply conscientious commuters with a popular alternative to commuting alone. BFT Vanpool delivered 646,200 trips traveling 3.4 million miles over 72,300 hours. In 2018, Vanpool operations installed software enabling commuters to provide digital records of their standard route to work to easily calculate the van group fares. All this gave BFT a detailed electronic record, which provides daily reports for National Transit Database (NTD) compilation. By Spring 2019, every Vanpool participant, driver, bookkeeper, and rider will have an individual account available for access online. Rideshare matching was also enhanced and will be managed at the local level.
Inter-Agency Coordination
BFT participated in many local government forums geared towards uplifting the conditions within which many of the disadvantaged populations often dwell. Participating in these forums allows BFT to reflect on the public transportation aspects of several emerging social topics, i.e., homelessness and serving the immigrant population. Over the last year BFT staff has consistently attended regular meetings of the various jurisdictional Planning Commissions and Port Authorities, and special local government Public Works open houses to stay abreast of the rapidly changing land use issues.
State and Federal Collaboration
BFT holds a seat as a voting member of the Benton-Franklin Council of Governments (BFCOG) Technical Advisory Committee, which was instrumental in both the 2018 TDP and the Transit Asset Management (TAM) Plan approvals. BFT participated in various Washington State Department of Transportation (WSDOT) studies including: collecting BFT Vanpool rider surveys for the WSDOT US-395 Corridor Safety Study, WSDOT Travel Washington Intercity Bus Program update, and the SR 240 Integrated Scoping Project1. BFT actively participated in the BFCOG-led Human Service Public Transportation Coordination Plan of 2018, which resulted in award of three regional WSDOT Consolidated Grants to organizations dedicated to transporting lower income individuals.
1 WSDOT integrates TDPs and transit long-range plans into baseline information for their new Corridor Sketch initiative and Practical Solutions.

2019-2024 TRANSIT DEVELOPMENT PLAN
8
Negotiating Access to Transit: Amenities Help Exemplify Pro-Transit Urban Design 2018 was the year that the ‘new’ Comprehensive Service Plan Study (CSPS) was put to the test, starting with adapting a consultant-designed run-cut into real life operations, then turning to bus stop safety relocation, time point adjustments and bus stop consolidation negotiation. BFT assembled an amenities inventory and used CSPS guidelines to equitably distribute on-street amenities (see technical analysis in the ‘2019 Title VI Analysis’). BFT established a point of contact within each jurisdiction to walk through a more formal bus stop siting and Right-of-Way permitting process.
BFT ordered 50 new modern glass and aluminum shelters at the end of 2018. In preparation for a May 2019 arrival, BFT developed RFPs for shelter pad repair, installation of shelters and construction of new shelter pads. Small business contractors were encouraged to apply. BFT used every opportunity to have private partners and government agencies build the shelter pads in lieu of bidding out each site. Thus far, eight new shelter pads were designed and/or constructed on behalf of BFT; half of these are completely paid for by the partners, while others are designed and contracted by the partner and reimbursed by BFT.

2019-2024 TRANSIT DEVELOPMENT PLAN
9
BFT has also expressed interest in improving infrastructure associated with access to bus stops and is building a participation program around the municipal “rapid flash” pedestrian crossing construction program. Our bond with the cities has been growing with every physical improvement that BFT helps to shape in the community.
• The sustainability coordinator with Pacific Northwest National Laboratory (PNNL) has devised a long-range sidewalk construction program specifically to accommodate ADA road-side requirements for three new bus stop locations.
• Washington State University in north Richland agreed to fund infrastructure to accommodate new shelters and has suggested placing electronic bus route/schedule information kiosks on campus, as well as introducing the college pass program to the student body.
• Benton County engineers tackled the engineering of a difficult bus stop pad on a very steep slope at the Benton County Annex Building.
• The City of Richland approved a temporary Transit Mall during planned Knight Street Transit Center reconstruction, which requires shutting down a public street for transit-only use.
• City of Pasco designed and constructed a bus pull-out and ADA compliant bus shelter pad during the Argent Road Widening Project at Tech Way (CBC).
• Tri-Cities Community Health poured a shelter pad and Trios Health designed a pad and windscreen walkway improvements to connect their newly constructed bus shelter pad to the Trios Care Center at Southridge on Plaza Way.
• Pizza Hut in Richland, at the corner of George Washington Way and McMurray, is an example of a private business that permitted use of their frontage for a relocated shelter, while BFT is hiring out the design and construction.
The new amenities have been an excellent tool for integrating transit into jurisdictional plans. BFT hopes to leverage these relationships to initiate several other Complete Street features that exemplify pro-transit urban design. These could be anything from openings in long linear walls to give access to a bus stop or protected pedestrian crossings up-to encouraging storefronts at the curb edge with parking in the rear. BFT proposes to make modest annual capital investment contributions along each high-capacity corridor to re-enforce excellence in transit-oriented design. The new six-year Capital Improvement Program (CIP) projects being recommended for funding include:
• New High Capacity Corridor Project – priming high frequency transit corridors for futureBus Rapid Transit service.
• New transit property reuse – preparing BFT holdings (i.e., Huntington) for joint ventureredevelopment.
• New expanded “neighborhood” vanpool program – adding five 50-100 space lots infive years.
• Rejuvenate Transit Signal Priority onboard integration - engineering and rules forreconsideration by the jurisdictions.

2019-2024 TRANSIT DEVELOPMENT PLAN
10
Technology – Gateway to Performance Based Monitoring and Evaluation Along with interacting with regional data to design transit services, BFT is also improving how it collects, analyzes and reports its own internal data. In the next six-years BFT plans to use data effectively to improve efficiency as well as attract new riders. Some of the tools envisioned include:
• Safety and Security – camera surveillance, gate and door access control.• Service performance measures on demand – i.e., real-time performance dashboards.• Operations workflow software (TBD) to complement Trapeze Streets/PASS system
performance data production.• Operationalizing the Transit Asset Management (TAM) study and framework – Avail
software.• Electronic bus route/schedule information kiosks at campus/shopping
mall/airport/clinic/transit center.• Mobile ticketing - pay with a variety of media such as mobile phone, smart wearables, or
a card as payment.• Moving forward on purchase of electric vehicles and charging stations for 25% bus fleet
and as required at P&Rs.• Ongoing bus stop amenities improvements – additional solar shelters, benches trash cans
and bus stop totems in the Tri-Cities and redistribution of newest blue shelters asappropriate (i.e., Benton City and Prosser).
• Onboard integrated technology system updates for Transit Signal Priority (TSP).• Actuating onboard automated passenger counters (APC) for NTD reporting purposes.• Customer comment software to replace current unsupported system.• Purchased map upgrades for the Trapeze/PASS software and updated polygons for those
maps.• A real-time bus location APP - requires Streets (Trapeze) module to link to Google Maps
(GTFS-RT).
Employing Professional Manpower and Resources to Keep Projects Moving A team of consultants and new systems have been instrumental in BFT’s recent achievements. As in any changing environment, resource investments and the subsequent recurrent expenses need monitoring, assessment and evaluation before being programmed into the six-year plan. Too often a consultant is considered the answer to a problem/deficiency rather than an instrument to get the needed change pointed in the right direction.
• Human Resources – hired new staff, expanded ArchBright support and continued usingNeoGov, SMART goals and Vivid Training.

2019-2024 TRANSIT DEVELOPMENT PLAN
11
• Safety and Security – hired new safety analyst in 2018 plus hiring OBS Solutions toconduct a safety and security gap analysis and recommend improvements.
• Ops – DAR consultant in 2018 and DAR manager appointed in 2019, new driverrecruited for expanded evening hours and general demand coverage, plus hiringorganizational development and documentation consultant.
• Administration – in-house data and records archive project.• Maintenance and Facilities – new maintenance supervisor position, MOA facilities
engineers recruited.• Planning - architectural engineering and service planning consultant recruited, mobility
as a service supplemental transport contract negotiated.• Vanpool – ongoing institutionalization of Ride-Pro to facilitate group ride recruiting,
management, and payments.• NTD – data scientist, Moss Adams audit and IBI Group integration support was all
dedicated to DAR data cleanup.
Where We Want to Be Consumers are calculating the tradeoffs between car ownership and transit in measures of time not just money. When a third of a transit commute is lost in waiting2 even a free fare ranks low on the Value of Reliability scale.
Three overarching best practices aimed at guiding transit policy3:
1. Pursuing partnerships with the private sector, when appropriate, to offer enhanced servicethat leverages existing infrastructure and caters to consumer preference;
2. Utilizing data to better understand consumer behaviors and movement;3. Catering to a consumer-centric transportation model.
Public-private partnerships with mobility service providers including transportation network companies (TNCs), bike-share systems, and e-Scooters can further result in more equitable, sustainable outcomes. Bike sharing, for example, has grown 25% between 2016 and 2017 (National Association of City Transportation officials, “Bike share in the U.S.”)
2 Moovit, “Public Transit Guide”, 2005. Locally verified with Time Travel Comparison – top ten stops, Keith Hall 2019. 3 KPMG LLP, Accelerating Mobility, 2019

2019-2024 TRANSIT DEVELOPMENT PLAN
12
BFT is Advocating for a New Land Use Paradigm; Focus on ‘Nodes and Corridors’
BFT is incorporating land-use/demographic analysis into service planning for amenities distribution, DAR service efficiencies, and annual fixed route improvements. Below are some of the tasks needed to shift transit from chasing growth:
• BFT is relying on the jurisdictions and economic development agencies to lead the way on pedestrian and bicycle travel continuity, with BFT contributing wherever and whenever possible (FTA funded4 bike access = 3 miles5).
• Support ‘form-based urban design’ with urban edge frontage, transitional heights between uses and parking in rear (maximum space ratios vs minimum space ratios). BFT could contribute to TOD development, in exchange for allocation of bus stop locations prior to driveway access assignment.
• Starting at the bus stop level – safe crossings, amenities, direct pathways to destinations, minimal conflict parking configuration, way-finding signage and context sensitive crosswalks – bus stop location at rapid flash crossings.
• Participate in annual City sidewalk improvement programs by getting on local subcommittees.
• Build ridership along the high capacity corridors. Add frequency to reduce wait time. Build a case to reactivate the Transit Signal Priority (TSP) for better on-time performance. Market the rider as a business customer.
• Participate in local government forums that encourage transit-oriented retail projects, especially those that revitalize the inner-city areas (i.e., purchase strategic parcels of land for the East Pasco transit hub).
• Host design charrettes - art in Transit – shelters, bike facilities, arcade from transit hubs to markets, interactive kiosks.
4 FTA 5307 Program - Bicycle projects can receive a 95% federal share for the first 1% of program funds in large urbanized areas. 5339 Facilities program 90%. 5 https://www.govinfo.gov/content/pkg/FR-2011-08-19/pdf/2011-21273.pdf
U.S. Department of Transportation Smart City Challenge and the Central Ohio Transit Authority compelled local employers to provide free bus service to 45,000 downtown workers until the end of 2020. Commuters scan a smartphone app to facilitate payment at the fare box and concurrently provide data. The initial pilot doubled the share of bus commuters from 6.4% to 12.2%.

2019-2024 TRANSIT DEVELOPMENT PLAN
13
Actively Participate to Make Emerging Projects Work for Transit
Advocate for roadway connectivity linkages
Lewis Street Overpass, SR 240 Integration, Chapel Hill Road connection, US395/Ridgeline/Clearwater intersections, Argent Road Widening, Road 100 Interchange, Center Parkway Extension, Columbia Park Boulevard, Tapteal connector.
Purchase Land Along Emerging Transit Markets
Urban Principal Arterial and high-volume corridors - N Center Parkway, W Gage Blvd, Steptoe Street, Bob Olsen Parkway/Hildebrand Blvd, East Columbia Drive, W 1st Street, Kennewick Ave, Keene Road, Stevens Drive, Road 68, Lewis & Clark, N 4th Avenue, SR 397, N10th Ave, Ridgeline Drive, Southridge Drive
Monitor Major Developments
Vista Fields, Queensgate Expansion, Osprey Point, Columbia Center Mall redevelopment.
Budgeting and Finance Balance Sheet BFT’s total net position increased about 18% from year end 2017, from $61.2M to the December 31, 2018 amount of $72.3M.
In 2018, BFT received $10.2M in capital grant contributions to replace older fleet vehicles. The 2018 amended budget for facilities was $4.97M to: complete the automatic fluid management system, MOA water diversion project, replace a hoist, order passenger amenities, fund a security plan and add campus security improvements and minor operations building renovations. The final 2018 actual operating expenditures of $36,918,227 did not exceed the budgeted amount of $40,057,655.
The Board of Directors met on October 11, 2018 and approved the Fiscal Year 2019 Operating Budget of $42,022,300 and Capital budget of $22,012,566. During the FY2019 Budget presentation the Board members were reminded that the new fixed route structure eliminated
2019-2024 TRANSIT DEVELOPMENT PLAN
14
many of the forced transfers of the past by offering convenient one seat rides, therefore ridership could appear to be decreasing. Along with this reminder, the Interim Service Development Director at the time also committed to make 2019 the beginning of a trend in increasing ridership.
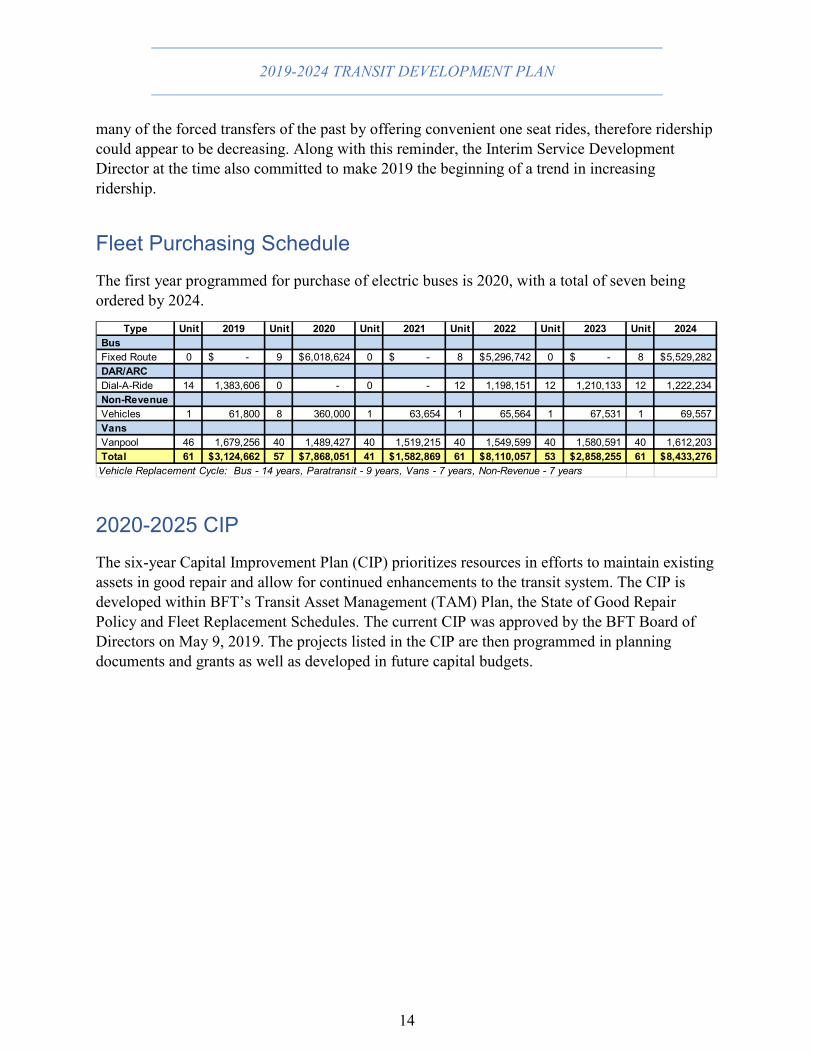
Fleet Purchasing Schedule The first year programmed for purchase of electric buses is 2020, with a total of seven being ordered by 2024.
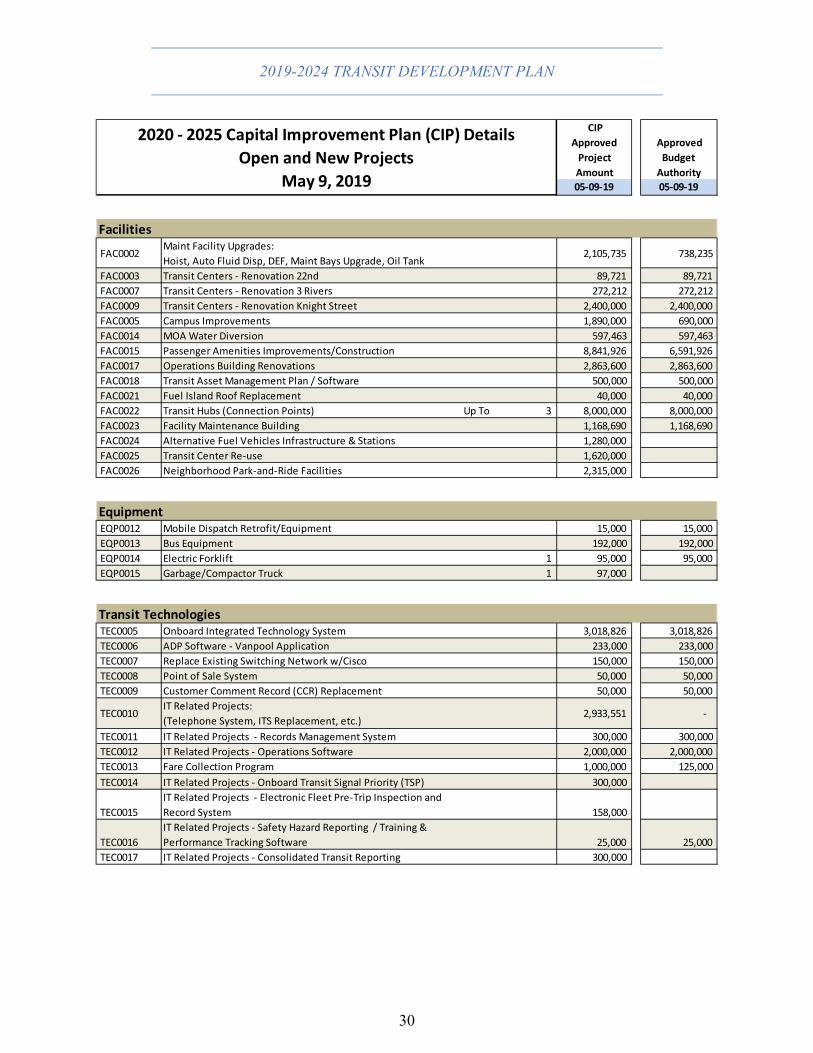
2020-2025 CIP The six-year Capital Improvement Plan (CIP) prioritizes resources in efforts to maintain existing assets in good repair and allow for continued enhancements to the transit system. The CIP is developed within BFT’s Transit Asset Management (TAM) Plan, the State of Good Repair Policy and Fleet Replacement Schedules. The current CIP was approved by the BFT Board of Directors on May 9, 2019. The projects listed in the CIP are then programmed in planning documents and grants as well as developed in future capital budgets.
Type Unit 2019 Unit 2020 Unit 2021 Unit 2022 Unit 2023 Unit 2024 Bus Fixed Route 0 -$ 9 6,018,624$ 0 -$ 8 5,296,742$ 0 -$ 8 5,529,282$ DAR/ARC Dial-A-Ride 14 1,383,606 0 - 0 - 12 1,198,151 12 1,210,133 12 1,222,234 Non-Revenue Vehicles 1 61,800 8 360,000 1 63,654 1 65,564 1 67,531 1 69,557 Vans Vanpool 46 1,679,256 40 1,489,427 40 1,519,215 40 1,549,599 40 1,580,591 40 1,612,203 Total 61 3,124,662$ 57 7,868,051$ 41 1,582,869$ 61 8,110,057$ 53 2,858,255$ 61 8,433,276$ Vehicle Replacement Cycle: Bus - 14 years, Paratransit - 9 years, Vans - 7 years, Non-Revenue - 7 years

2019-2024 TRANSIT DEVELOPMENT PLAN
15
Almost half (49%) of the $44M capital investment program is directed toward vehicle replacement. Infrastructure and development of underutilized assets is 20%. Facilities upgrade is 16% and ITS related purchases are 15%. Federal contribution is anticipated to be 56%, with 14% State and 30% local. Items include in the currently approved CIP:
• Fixed Route bus replacement - purchase up to eighteen (18) non-electric and up to (7)electric fixed route vehicles.
• DAR vehicle replacement - purchase up to twelve (12) Dial-A-Ride vehicles annually,beginning in FY2022. Up to eight (8) vehicles are scheduled for FY 2025.
• Non-revenue replacement vehicles – purchase one (1) vehicle per year.• Purchase a new small-scale garbage/compactor truck to handle the increase in trash cans
being placed throughout the PTBA.• Alternative fuel infrastructure to support electric vehicle charging, with analysis,
planning and engineering of power supply for future alternative fuel expansion.• Transit Asset Management (TAM) plan recommended equipment replacement in the
maintenance building (i.e., hoist, DEF Tank and dispenser, air compressors).• Campus building improvements for growth in administrative/support staff, as well as
common areas to be shared when staff are onsite (i.e., training rooms).• Professional evaluation of underutilized BFT property (i.e., unused transit centers) to
further stimulate TOD and land use stewardship.• Neighborhood scale P&R lots (approximately 50-100 parking spaces each) to serve
vanpools.• Annual ITS related upgrades (i.e., telephone system, computer hardware and software,
other support equipment). Immediate software includes:
25%16%
8% 7%
14%
10%
4%8% 8%
0
5,000,000
10,000,000
15,000,000
20,000,000
25,000,000
Vehicle Replacement Planning futuredevelopment
Facilities upgrades ITS related improvements
Capital Improvement Program 2020-2025
federal state local

2019-2024 TRANSIT DEVELOPMENT PLAN
16
o Electronic safety pre-trip inspectiono Hazard Reporting System/Ops Training & Performance Tracking.o Transit Signal Priority (TSP) onboard integration, engineering and rules needed to
present this project to the jurisdictions.o Consolidated data warehouse reporting module to merge existing and future
software packages.o Records management.

2019-2024 TRANSIT DEVELOPMENT PLAN
17
Appendix A: About Ben Franklin Transit BFT was formed under the authority of Chapter 36.57A of the Revised Code of Washington State, as a Public Transportation Benefit Area (PTBA). BFT is a separate entity and is fiscally independent of other state and local government entities, as a primary government for reporting and there are no additional entities or funds for which BFT has reporting responsibilities.
BFT is a special purpose government entity and provides Fixed Route, Paratransit, Vanpool, and General Demand Service to the public in portions of Benton and Franklin Counties and is supported primarily through locally generated sales tax and user charges.
BFT is governed by a nine-member Board of Directors comprised of two Franklin County Commissioners, one Benton County Commissioner and one City Council member from Benton City, City of Kennewick, City of Pasco, City of Prosser, City of Richland, and the City of West Richland. In 2010, a non-voting board member was added to represent the labor unions of BFT.
BFT is a member of the Washington State Transit Insurance Pool (WSTIP). WSTIP is a 25-member self-insurance program located in Olympia, Washington. WSTIP supplies BFT auto liability, general liability, public officials’ liability coverage, all risk property coverage, auto physical damage coverage, boiler and machinery coverage, employee fidelity/crime coverage, and cyber liability coverage.
Existing Strategic Plan
In January 2015, the Board approved the BFT Strategic Plan with primary and secondary objectives consistent with BFT’s Mission Statement and Core Values. The primary and secondary objectives are:
Primary
• Address Community Growth • Maximize Community Outreach & Involvement • Implement Succession Planning & Staff Development
Secondary
• Address Community Demographics • Participate in Economic Development • Plan for Para-Transit Demographic Shifts • Integrate Technology • Pursue Environmentally Friendly Buses

2019-2024 TRANSIT DEVELOPMENT PLAN
18
Administrative Organization of BFT – Recruitment, Succession Planning and Contract Fulfillment

2019-2024 TRANSIT DEVELOPMENT PLAN
19
Appendix B.1: Review of Local and Regional Plans and Policies and Assessment of Public Transportation Requirements As land parcels within the Urban Growth Area (UGA) are annexed into any of the PTBA members’ municipal boundaries, those parcels, businesses and residents are automatically incorporated into the PTBA service area.
• As of 2016, the City of Kennewick includes approximately 27 square miles and approximately 78,000 residents6. The City of Kennewick has been expanded primarily at the south end.
• Richland City limits had a 2016 population of 53,410 and 54,732 within the UGA boundary, the City is expected to add 23,699 persons in the next 20 years requiring 1,270 additional housing units. City of Richland has been growing to the north and west.
• The City of West Richland projected population in 2017 to be 16,845 and by Urban Growth Boundary requirements must accommodate 22,409 people by 2037; 2831 new households needing 8,069 units.
• By law the City of Pasco must provide 15,300 new housing units to prepare for a total population of 121,830 by 2027.
• Benton County’s countywide allocation and projected population for Benton City is 5,812 persons by the year 2040, which translates to a need for 893 new residential units to accommodate 2,142 additional people.
• Benton County’s countywide allocation and projected population for City of Prosser will grow by 2,467 residents to a total population of 8,407 people by the year 2037. There is adequate land in the UGA to accommodate the estimated addition of about 900 new units.
Subarea and Corridor Plans
Provide excellent source of future capital projects to address capacity and safety improvements as well as a “sense of place” for subareas and corridors.
• Vista Field Redevelopment Master Plan (2017) A collaboration between the Port and City of Kennewick, the Plan intends to transform the 103-acre former general aviation airfield into an urban, neighborhood-scaled destination with mixed-uses, vibrant public spaces, private amenities, and a focus on multi-modal access. The transportation network is envisioned as a permeable grid with low-speed zones. Circulation, street classifications, sidewalk standards, and streetscape elements are mentioned. Traffic-calming treatments are also encouraged.
• Bridge to Bridge – River to Railroad Revitalization (BB/RR) Plan (2015) The Plan is to create a short and long-term strategy for the BB/RR area and its seven distinct neighborhoods for the next 20 years. The BB/RR area is between the Blue Bridge (US 395) and the Cable Bridge and the Columbia River to the BNSF Railroad mainline
6 2012- 2016 American Community Survey Five-Year Estimates, US Census

2019-2024 TRANSIT DEVELOPMENT PLAN
20
tracks. Roadway reconfiguration, streetscape enhancements, transit route reconfiguration, and construction of sidewalks, curbs and gutters are discussed with recommended treatments at specified location within the BB/RR area.
• Clearwater Access Management Plan (2014) This plan identifies functional and safety improvements along the Clearwater Avenue corridor that runs from US 395 on the east to I-82 on the west. The plan identifies street widening, access relocation and consolidation, signal upgrades and pedestrian crossing improvements that will improve safety and levels of service along the corridor.
• Southridge Sub-Area Plan (2005) This sub-area spans 2,530 acres in south Kennewick. Access to this sub-area is from US 395 at Hildebrand Boulevard and Ridgeline Drive. Land use changes within the sub-area have substantially increased traffic volumes on US 395.
• Hansen Park Sub-Area Plan (2002) This sub-area reaches approximately 377 acres. It is generally bounded on the north by the current Kennewick city limits, on the south by the Highland drainage canal, to the east by Columbia Center Boulevard, and to the west by Clodfelter Road. Access roads to the sub-area include Columbia Center Boulevard, West 10th Avenue, and Clodfelter Road via West 10th Avenue and Clearwater Avenue. Circulation, access and roadway/sidewalk classifications and standards are addressed in the plan.
• US 395 I-82 to I-182 Corridor Study (Draft 2017) WSDOT is developing this study to identify current and future issues, identify strategies to maintain or enhance mobility in this corridor, as well as maintain efficient operations over the next 20 years. The study describes most of mainline US 395 congestion will continue to get worse within Kennewick and the Columbia River Crossing. US 395 is expected to serve as the major north-south arterial accommodating added volumes of future growth from the expanding Southridge Subarea community. The study stresses that new traffic controls or interchanges are needed to serve the Southridge Subarea growth. Improvements at major existing intersections in the US 395 Corridor within Kennewick will be needed to accommodate the future growth.
City of Kennewick Comprehensive Plan
The plan contains many tools for densification which could benefit transit. An indicative action is the May 2019 City Council adoption of parking standards specifically for the Urban Mixed Use (UMU) zoning district, which implements the Mixed Use Comprehensive Plan Map designation. The parking standards for the Urban Mixed-Use zone are contained in KMC 18.36.067. In May 2019 code revisions were enacted to addresses an issue brought up by the City Council last year when a request to change the land use designation of nearly 300 acres to Mixed Use, Council was not comfortable granting that “blank check” without some type of master plan similar to the Port of Kennewick did for the Vista Field redevelopment.

2019-2024 TRANSIT DEVELOPMENT PLAN
21
City of Richland Comprehensive Plan (2017)
The City has applied for an UGA expansion to add 1,184 acres of Hanford land to its UGA and remove 283 acres from the Richland UGA (for a net increase of 901 acres). According to the 2017 Plan 25% of all land is in residential use, of which 73% is low density, 20% is medium, and 7% is high density.
Badger Mountain South is a master‐planned community of 1,480 acres located in the southwest side of the City. The area is intended to be developed with 5,000 homes, businesses, and other community activities. Badger Mountain South area is creating the need for future schools in this area. The Richland School District is planning to expand service in this area on approximately 54 acres owned by the school district.
Southwest side near the City View area, abutting Kennedy Road to the south and Queensgate Drive to the east. The land use in the City View West area is re‐designated from Urban Reserve to a mix of low (71%), medium (12%), and high (17%) density residential, commercial, public facility, developed, and natural open space.
Long‐range improvements include the extension of Gage Boulevard and Queensgate Drive to serve the Badger Mountain South sub‐area, interchange improvements on both I‐182 and SR 240, as well as other collector road improvements to serve developing areas. A new arterial route is proposed to connect the existing north end of Queensgate Drive to SR 224 (with a Yakima River crossing) as well as an extension south from Kingsgate Way to connect to SR 224.
North side of the City abutting the Horn Rapids residential development. The land use in the Horn Rapids Northwest area is re‐designated from Urban Reserve to low (80%), and medium (15%) density residential uses (no high density). The 1,641‐acre industrial area has recently been transferred from the Department of Energy to the City, the Port of Benton, and Energy Northwest by an act of Congress. This 1,341‐acre Horn Rapids Industrial Area is specifically set aside for industrial development. The City and the Port plan to market the property to industrial developers as “mega‐sites” of 200 acres or larger. The proximity of this land to highways, rail, and utility services together with the large acreages available provide development opportunities for industries that exist in very few places throughout the Pacific Northwest.
City of West Richland Comprehensive Plan (2016)
The City has a robust comprehensive plan and was one of the first cities in the region to adopt a Complete Streets design strategy. However, land use is still predominantly agricultural (63%) with the rest of the land use dedicated to residential (33%), of which more than 90% is single family. The goals set in the comprehensive plan move the residential percentages to 24% with maxim of 2 single family dwellings per acre, 66% with 9 units per acre and 10% multifamily units with more than 9 units per acre.

2019-2024 TRANSIT DEVELOPMENT PLAN
22
City of Pasco Comprehensive Plan (Draft 2019)
After presenting an Urban Growth Boundary expansion that included 5 square miles of predominantly agricultural land needed to accommodate the expected growth using the traditional land use development pattern of 90% single family housing, the planning department was asked to produce an alternative “compact-growth” development model that focused on in-fill and permitting higher density cluster development. The hybrid proposal presented to City Council in May calls for 3,600 acres that includes several pockets of high density clusters in the northwest, a 1,600-acre master plan for the Broadmoor area, plus strategies for absorbing units via infill; single occupancy residences (SRO), minimum lot sizes adjustments, shared street frontages, increase dwelling height in residential zones.
Benton City Comprehensive Plan (2017)
Benton City is surrounded by agricultural land. The Red Mountain AVA is located on the east side of the City. To achieve the desired level of economic development, the City needs to provide capital investments for infrastructure and amenities, specifically:
• Downtown Area revitalization - transit facilities, downtown housing, and improvedstorefronts.
• Agritourism and Farm-to-Markets - wineries, seasonal produce, outlets.• Utilizing Vacant Lands - industrial land near the I-82 interchange and south of the City.• A subarea planning process to identify necessary infrastructure, and finance mechanisms.
City of Prosser Comprehensive Plan (2018)
Based on the City of Prosser’s OFM population projection and land needed to accommodate 6,125 people, a reduction of 483.96 acres of UGA land and an addition of 100.44 acres of industrial land (for a net reduction of 383.52 acres) has been incorporated into this Comprehensive Plan update.

2019-2024 TRANSIT DEVELOPMENT PLAN
23
Managing Regional Air Quality
BFCOG – May 1, 2019 Media Campaign - Ozone pollution is a significant air quality concern in the Tri-Cities area. Ground-level ozone is a toxic air pollutant and a health hazard. In the Tri-Cities area, high levels of ozone often form during the hottest days of the year. That’s why the Washington Department of Ecology, the Benton-Franklin Council of Governments, Benton Clean Air Agency, and the Washington State University, are working together to alert people when high ozone levels are predicted, and to inform residents of the Tri-Cities about what they can do to reduce ozone levels and protect their families from this form of air pollution.
WSDOT Regional Congestion Management
Strong participation by all the jurisdictions and affected agencies in the on-going WSDOT SR 240 Integrated Scoping Project is evidence that regional traffic congestion issues invoked a shared responsibility to reach consensus on a solution to the regions number one vehicular emissions problem. WSDOT stressed that the SR 240 integrated solutions must incorporate more trip-sharing along with the possibility of adding High Occupancy Vehicle (HOV) lanes to move people not just cars.
Overall, outside of publicly held lands, the current regional and local trend further threatens biological resources, air quality and wetland environments as development and land conversion escalate. Federal and State agencies are working to reduce greenhouse gas emissions 15% below 2005 levels by 2020. The battle of lowering emissions will impact economic development when Benton-Franklin Counties are classified as non-attainment for air quality standards. It behooves us all to modify our travel behavior, as soon as possible to prolong this decision for several years to come.

2019-2024 TRANSIT DEVELOPMENT PLAN
24
Appendix B.2: Review of State Transportation Plans and Policies and Assessment of Public Transportation Requirements WSDOT published the Washington State Public Transportation Plan in 2016. The plan established a 20-year vision that all transportation partners in Washington state will work together to provide a system of diverse and integrated public transportation options. The plan includes 5 goals:
• Thriving Communities - supporting health, equity, a prosperous economy, energyconservation, and a sustainable environment through transportation.
• Access Provide - for people of all ages, abilities, and geographic locations to access jobs,goods, services, schools, and community activities.
• Adaptive Transportation - new technologies and partnerships to make better use ofexisting transportation assets and meet changing customer needs.
• Customer Experience - public transportation that is safe, seamless, pleasant, convenient,reliable, relevant, and understandable.
• Guardianship - manage assets in a manner that maximizes and sustains their value to thepublic, public transportation, and to the statewide transportation system.
Near-term actions help maintain the momentum of the plan’s 20-year goals, highlights include:
• A Sugar Access software by Citilabs has progressed to highlight areas where fixed routetransit provides access to points of interest, including hospitals, grocery stores, and jobs.
• First-last-mile transportation continues to be a challenge for public transportation, theUW Taskar Center is identifying gaps in the sidewalk network.
• Uploading transit agency route and bus stop data into the general transit feedspecification for entire network of public transportation in Washington State.
• Pierce Transit HopThru, a smartphone fare payment system, rather than carrying aseparate transit pass. The contract was renewed for another four years.
• WSDOT performance framework ensures investments in bicycle/pedestrian connectivityand availability match other intermodal investments funded by Washington State.
Office of Transit Mobility - WSDOT’s Regional Transit Coordination division continues to work with its partners to develop park and ride agreements, support innovative programs, and share data and information. Regional Mobility Grant program funds construction and expansion of park and ride lots and coordinates with local jurisdictions on implementing transit-oriented development.
WSDOT Management of Mobility division recommends best practices to integrate transit and demand management strategies with regional and local land use plans to reduce traffic and improve mobility and access.

2019-2024 TRANSIT DEVELOPMENT PLAN
25
Appendix C.1: Equipment and Facilities Inventory Fleet and Asset Replacement Standards To strengthen internal controls over financial reporting BFT performed a comprehensive review of all capital assets in 2017. Depreciation is computed using the straight-line method over estimated useful lives as follows:
BFT Capital Items and useful life FTA Minimums BFT Minimums Type Years Mileage Years Mileage Buses (30' - 40') 12 500,000 14 550,000 DAR (Med-sized medium-duty chassis) 7 200,000 9 250,000 Light Duty (Vanpool, Non-Revenue) 4 100,000 7 150,000 Buildings and Structures 10 - 40 varies Equipment and Furnishings 5 - 20 varies Land Improvements 5 - 40 varies
BFT has embraced the concept of “right sizing” the fleet and has ordered several small 30’ foot coaches with tighter turning radius to carry lighter loads in various locations and during various times of the day (see graphic on next page).

2019-2024 TRANSIT DEVELOPMENT PLAN
26
2019-2024 TRANSIT DEVELOPMENT PLAN
27
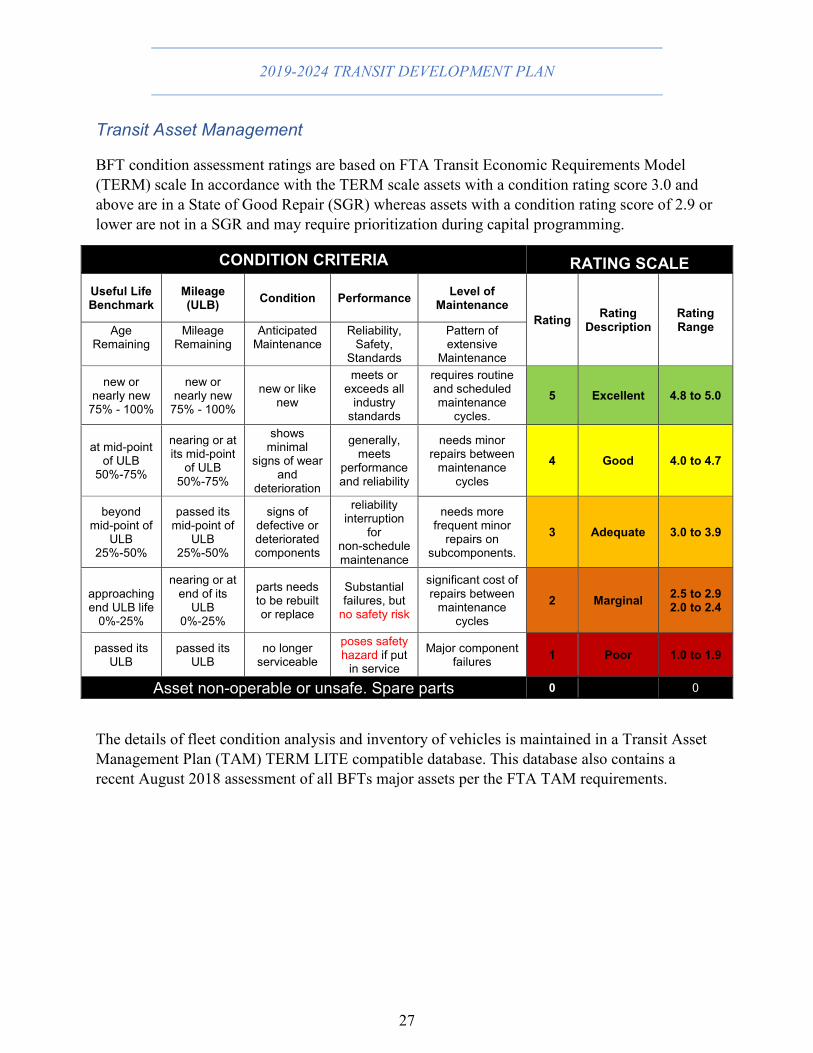
Transit Asset Management
BFT condition assessment ratings are based on FTA Transit Economic Requirements Model (TERM) scale In accordance with the TERM scale assets with a condition rating score 3.0 and above are in a State of Good Repair (SGR) whereas assets with a condition rating score of 2.9 or lower are not in a SGR and may require prioritization during capital programming.
CONDITION CRITERIA RATING SCALE Useful Life Benchmark
Mileage (ULB) Condition Performance Level of
Maintenance Rating Rating
Description Rating Range Age
Remaining Mileage
Remaining Anticipated
Maintenance Reliability,
Safety, Standards
Pattern of extensive
Maintenance
new or nearly new
75% - 100%
new or nearly new
75% - 100%
new or like new
meets or exceeds all
industry standards
requires routine and scheduled maintenance
cycles.
5 Excellent 4.8 to 5.0
at mid-point of ULB
50%-75%
nearing or at its mid-point
of ULB 50%-75%
shows minimal
signs of wear and
deterioration
generally, meets
performance and reliability
needs minor repairs between
maintenance cycles
4 Good 4.0 to 4.7
beyond mid-point of
ULB 25%-50%
passed its mid-point of
ULB 25%-50%
signs of defective or deteriorated components
reliability interruption
for non-schedule maintenance
needs more frequent minor
repairs on subcomponents.
3 Adequate 3.0 to 3.9
approaching end ULB life
0%-25%
nearing or at end of its
ULB 0%-25%
parts needs to be rebuilt or replace
Substantial failures, but
no safety risk
significant cost of repairs between
maintenance cycles
2 Marginal 2.5 to 2.9 2.0 to 2.4
passed its ULB
passed its ULB
no longer serviceable
poses safety hazard if put
in service
Major component failures 1 Poor 1.0 to 1.9
Asset non-operable or unsafe. Spare parts 0 0
The details of fleet condition analysis and inventory of vehicles is maintained in a Transit Asset Management Plan (TAM) TERM LITE compatible database. This database also contains a recent August 2018 assessment of all BFTs major assets per the FTA TAM requirements.

2019-2024 TRANSIT DEVELOPMENT PLAN
28
Appendix C.2: 2020-2025 CIP and Program of Projects
CIP Annual Work Programming for 2019
Date 2019 Call for Projects Calendar and Milestone 2-Feb First Call for Projects 16-Feb Submission of Capital Project Forms & Supporting Documents 21-Feb CIP Committee Review of Requested Capital Projects 26-Feb CIP Committee Review of Program of Projects for the TDP 27-Feb CIP Committee Recommendations to General Manager /EMT* 6-Mar GM/EMT Approval/Response to Recommendations 9-Mar Program of Projects (POP) Submitted to Planning/Service Development 15-Mar Planning Staff Develops Transit Development Plan (TDP) 2-May Board Committees: TDP Presented - 2 consecutive days 9-May Board: approve the recommended CIP program TBD TDP Presented to Citizens Advisory Network (CAN)
13-Jun Board: Release TDP for Public Review - TDP public comment period starts 1-Jul Due date for cities to adopt their TIP's (RCW 35.77.010) 12-Jul Board: Adopt TDP 17-Jul Submit TDP Benton Franklin Council of Governments (BFCOG) & Local Jurisdictions 18-Jul Enter POP into Washington State Department of Transportation (WSDOT) system 7-Aug Draft 2019-2024 MPO/RTPO TIP posted to BFCoG website
30-Aug 2019-2024 MPO/RTPO TIP Public Meeting - held in BFT Boardroom 5-Sep Second Call for Projects - sent as part of the Budget Kick-Off Email
28-Sep Submission of Capital Project Forms & Supporting Documents 2-Oct Capital Project Requests to Capital Improvement Plan (CIP) Committee for review 5-Oct CIP Reviews Proposed Capital Projects (Morning meeting) 5-Oct Recommendations to GM and EMT for final capital budget considerations 10-Oct GM/EMT Approval/Response to Recommendations 20-Oct 2019-2024 MPO/RTPO TIP submitted to WSDOT 8-Nov Board: Budget Retreat - including Capital Projects 8-Nov Board: Release Budget for Public Review - including Capital Projects
30-Nov 2019 Proposed Budget Presentation including Capital Projects to Employees 30-Nov 2019 Proposed Budget Presentation including Capital Projects to CAN 6-Dec Admin & Finance: Adopt 2018 Operating & Capital Budget
13-Dec Board: Adopt 2018 Operating & Capital Budget * EMT - Executive Management Team

2019-2024 TRANSIT DEVELOPMENT PLAN
29
05-09-19 05-09-19
Fleet FLT0007a DAR 10 991,087 991,087 FLT0007b DAR - 5310 Funds 6 584,117 584,117 FLT0008 BUS 13 6,389,500 6,389,500 FLT0009 VAN 15 Passenger 35 1,204,000 1,204,000 FLT0010 BUS 6 3,021,000 3,021,000 FLT0011 VAN 32 1,073,600 1,073,600 FLT0012 DAR - State Funding Up To 20 2,000,000 2,000,000 FLT0013 VAN - Reinvestment of Insurance/Auction Proceeds 1 38,802 38,802 FLT0014 DAR - Reinvestment of Insurance/Auction Proceeds 1 101,404 101,404 FLT0015 BUS 8 4,827,200 4,827,200 FLT0016 DAR 12 1,151,400 1,151,400 FLT0017 Non-Revenue: Service Truck 1 60,000 60,000 FLT0018 (2019) DAR Up To 10 969,095 969,095 FLT0019 (2019) DAR - 5310 Funds Up To 4 414,511 414,511 FLT0020 (2019) VAN Up To 22 787,380 787,380 FLT0021 (2019) VAN Up To 40 1,431,590 1,431,590 FLT0022 (2019) Non-Revenue: Service Truck 1 61,800 61,800 FLT0023 (2020) BUS Up To 6 3,183,624 FLT0024 (2020) BUS - Electric Up To 3 2,835,000 944,431 FLT0025 (2020) VAN Up To 40 1,460,222 FLT0026 (2020) Non-Revenue: OPS Supervisor Vehicles Up To 8 360,000 FLT0027 (2021) VAN Up To 40 1,489,427 FLT0028 (2021) Non-Revenue: Service Truck 1 63,654 FLT0029 (2022) BUS Up To 6 3,312,242 FLT0030 (2022) BUS - Electric Up To 2 1,984,500 FLT0031 (2022) DAR Up To 12 1,198,151 FLT0032 (2022) VAN Up To 40 1,519,215 FLT0033 (2022) Non-Revenue: Service Truck 1 65,564 FLT0034 (2023) DAR Up To 12 1,210,133 FLT0035 (2023) VAN Up To 40 1,549,599 FLT0036 (2023) Non-Revenue: Service Truck 1 67,531 FLT0037 (2024) BUS Up To 6 3,446,057 FLT0038 (2024) BUS - Electric Up To 2 2,083,225 FLT0039 (2024) DAR Up To 12 1,222,234 FLT0040 (2024) VAN Up To 40 1,580,591 FLT0041 (2024) Non-Revenue: Service Truck 1 69,557 FLT0042 (2025) DAR Up To 8 822,971 FLT0043 (2025) Non-Revenue: Service Truck Up To 1 71,644
2020 - 2025 Capital Improvement Plan (CIP) DetailsOpen and New Projects
May 9, 2019
CIPApproved
ProjectAmount
ApprovedBudget
Authority
2019-2024 TRANSIT DEVELOPMENT PLAN
30
05-09-19 05-09-19
Facilities
FAC0002 Maint Facility Upgrades:Hoist, Auto Fluid Disp, DEF, Maint Bays Upgrade, Oil Tank
2,105,735 738,235
FAC0003 Transit Centers - Renovation 22nd 89,721 89,721 FAC0007 Transit Centers - Renovation 3 Rivers 272,212 272,212 FAC0009 Transit Centers - Renovation Knight Street 2,400,000 2,400,000 FAC0005 Campus Improvements 1,890,000 690,000 FAC0014 MOA Water Diversion 597,463 597,463 FAC0015 Passenger Amenities Improvements/Construction 8,841,926 6,591,926 FAC0017 Operations Building Renovations 2,863,600 2,863,600 FAC0018 Transit Asset Management Plan / Software 500,000 500,000 FAC0021 Fuel Island Roof Replacement 40,000 40,000 FAC0022 Transit Hubs (Connection Points) Up To 3 8,000,000 8,000,000 FAC0023 Facility Maintenance Building 1,168,690 1,168,690 FAC0024 Alternative Fuel Vehicles Infrastructure & Stations 1,280,000 FAC0025 Transit Center Re-use 1,620,000 FAC0026 Neighborhood Park-and-Ride Facilities 2,315,000
Equipment EQP0012 Mobile Dispatch Retrofit/Equipment 15,000 15,000 EQP0013 Bus Equipment 192,000 192,000 EQP0014 Electric Forklift 1 95,000 95,000 EQP0015 Garbage/Compactor Truck 1 97,000
Transit Technologies TEC0005 Onboard Integrated Technology System 3,018,826 3,018,826 TEC0006 ADP Software - Vanpool Application 233,000 233,000 TEC0007 Replace Existing Switching Network w/Cisco 150,000 150,000 TEC0008 Point of Sale System 50,000 50,000 TEC0009 Customer Comment Record (CCR) Replacement 50,000 50,000
TEC0010 IT Related Projects:(Telephone System, ITS Replacement, etc.)
2,933,551 -
TEC0011 IT Related Projects - Records Management System 300,000 300,000 TEC0012 IT Related Projects - Operations Software 2,000,000 2,000,000 TEC0013 Fare Collection Program 1,000,000 125,000 TEC0014 IT Related Projects - Onboard Transit Signal Priority (TSP) 300,000
TEC0015 IT Related Projects - Electronic Fleet Pre-Trip Inspection and Record System 158,000
TEC0016 IT Related Projects - Safety Hazard Reporting / Training & Performance Tracking Software 25,000 25,000
TEC0017 IT Related Projects - Consolidated Transit Reporting 300,000
2020 - 2025 Capital Improvement Plan (CIP) DetailsOpen and New Projects
May 9, 2019
CIPApproved
ProjectAmount
ApprovedBudget
Authority

2019-2024 TRANSIT DEVELOPMENT PLAN
31
05-09-19 05-09-19
Transit Security & Safety TSS0001 Security Plan (consulting, campus imp., equipment) 1,750,000 750,000
Planning / Studies PLN0002 Passenger Amenities Study 125,000 125,000 PLN0005 2020-2025 Long Range Service Corridor & Infrastructure Study 7,000,000
Other OTH0001 ERP Needs Analysis/Project Scoping 1,075,000 75,000 Contingency 150,000
Totals 109,553,351 57,356,590
2020 - 2025 Capital Improvement Plan (CIP) DetailsOpen and New Projects
May 9, 2019
CIPApproved
ProjectAmount
ApprovedBudget
Authority
For unforeseen items meeting the Capital Project definition

2019-2024 TRANSIT DEVELOPMENT PLAN
32
Yr Type of Expenditure Unit Local State Federal Total Program of Projects (2019-2024) $ 33,896,419 $ 20,725,356 $ 18,578,705 $ 73,200,480
2019 Fixed Route 9 916,772 1,100,000 3,667,088 5,683,860 2019 Dial A Ride 4 - 414,511 - 414,511 2019 Vanpool 46 806,043 873,213 - 1,679,256 2019 Non-Revenue Support Vehicles 1 61,800 - - 61,800 2019 Transit Center Reno 240,000 - 960,000 1,200,000 2019 Facil ities Maintenance Building 233,738 - 934,952 1,168,690 2019 Maintenance Facil ity Upgrades 240,000 - - 240,000 2019 MOA campus improvements 500,000 - - 500,000 2019 Multimodal Hub(s) – Const. - 6,116,000 - 6,116,000 2019 Multimodal Hub(s) - Property 2,000,000 - - 2,000,000 2019 New Passenger Amenities 3,000,000 - - 3,000,000 2019 Operations Building Rehab. 300,000 - 1,200,000 1,500,000 2019 Support Equip.- i .e. Computers 2,642,000 - - 2,642,000 2019 System-wide Security upgrades 25,000 - 100,000 125,000 2019 Equipment 95,000 - - 95,000 2019 Total 11,060,353 8,503,724 6,862,040 26,426,117 2020 Fixed Route 0 - - - -
2020 Dial A Ride 10 - 935,000 - 935,000 2020 Vanpool 40 714,925 774,502 - 1,489,427 2020 Non-Revenue Support Vehicles 1 360,000 - - 360,000 2020 Maintenance Facil ity Upgrades 192,500 - - 192,500 2020 MOA campus improvements 200,000 - - 200,000 2020 Alternative Fuel Vehicles Infrastucutre 90,000 - 360,000 450,000 2020 Long Range Service Corridor & Infrastructure Study 400,000 - - 400,000 2020 TSP 7,000 - 28,000 35,000 2020 New Passenger Amenities 1,500,000 - - 1,500,000 2020 Support Equip.- i .e. Computers 1,400,000 - - 1,400,000 2020 System-wide Security upgrades 25,000 - 100,000 125,000 2020 Equipment 255,000 - - 255,000 2020 Total 5,144,425 1,709,502 488,000 7,341,927 2021 Fixed Route 8 869,691 600,000 3,478,763 4,948,454 2021 Dial A Ride 0 - - - - 2021 Vanpool 40 729,223 789,992 - 1,519,215 2021 Non-Revenue Support Vehicles 1 63,654 - - 63,654 2021 Maintenance Facil ity Upgrades 200,000 - - 200,000 2021 MOA campus improvements 200,000 - - 200,000 2021 Multimodal Hub(s) – Const. - 2,588,000 - 2,588,000 2021 Alternative Fuel Vehicles Infrastucutre 166,000 - 664,000 830,000 2021 Long Range Service Corridor & Infrastructure Study 400,000 - - 400,000 2021 New Passenger Amenities 750,000 - - 750,000 2021 TSP 46,000 - 184,000 230,000 2021 Support Equip.- i .e. Computers 276,865 - 400,000 676,865 2021 System-wide Security upgrades 25,000 - 100,000 125,000 2021 Total 3,726,433 3,977,992 4,826,763 12,531,188

2019-2024 TRANSIT DEVELOPMENT PLAN
33
Yr Type of Expenditure Unit Local State Federal Total 2022 Fixed Route 0 - - - - 2022 Dial A Ride 12 - 1,144,547 - 1,144,547 2022 Vanpool 40 743,808 805,792 - 1,549,600 2022 Non-Revenue Support Vehicles 1 65,564 - - 65,564 2022 Maintenance Facil ity Upgrades 225,000 - - 225,000 2022 MOA campus improvements 200,000 - - 200,000 2022 Alternative Fuel Vehicles Infrastucutre - - - - 2022 Neighborhood Park-and-Ride Facil ities 560,000 - - 560,000 2022 Long Range Service Corridor & Infrastructure Study 2,200,000 - - 2,200,000 2020 TSP 7,000 - 28,000 35,000 2022 Support Equip.- i .e. Computers 586,186 - 440,000 1,026,186 2022 System-wide Security upgrades 50,000 - 200,000 250,000 2022 Total 4,637,558 1,950,339 668,000 7,255,897 2023 Fixed Route 8 913,385 600,000 3,653,538 5,166,923 2023 Dial A Ride 12 - 1,155,993 - 1,155,993 2023 Vanpool 40 758,683 821,908 - 1,580,591 2023 Non-Revenue Support Vehicles 1 67,531 - - 67,531 2023 Maintenance Facil ity Upgrades 250,000 - - 250,000 2023 MOA campus improvements 200,000 - - 200,000 2023 Transit Center Re-use 108,000 - 432,000 540,000 2023 Neighborhood Park-and-Ride Facil ities 585,000 - - 585,000 2023 Long Range Service Corridor & Infrastructure Study 1,525,000 - - 1,525,000 2023 Support Equip.- i .e. Computers 620,000 - 480,000 1,100,000 2023 System-wide Security upgrades 50,000 - 200,000 250,000 2023 Total 5,077,599 2,577,901 4,765,538 12,421,038 2024 Fixed Route 0 - - - - 2024 Dial A Ride 12 - 1,167,552 - 1,167,552 2024 Vanpool 40 773,858 838,346 - 1,612,204 2024 Non-Revenue Support Vehicles 1 69,557 - - 69,557 2024 Maintenance Facil ity Upgrades 275,000 - - 275,000 2024 MOA campus improvements 200,000 - - 200,000 2024 Transit Center Re-use 108,000 - 432,000 540,000 2024 Neighborhood Park-and-Ride Facil ities 585,000 - - 585,000 2024 Long Range Service Corridor & Infrastructure Study 1,650,000 - - 1,650,000 2024 Support Equip.- i .e. Computers 563,636 - 436,364 1,000,000 2024 System-wide Security upgrades 25,000 - 100,000 125,000 2024 Total 4,250,051 2,005,898 968,364 7,224,313

2019-2024 TRANSIT DEVELOPMENT PLAN
34
Appendix C.3: Inventory of Services

2019-2024 TRANSIT DEVELOPMENT PLAN
35
Appendix C.4: Service Standards
Fixed Route Service Standard Statement
BFT route headways are adjusted based on ridership demand and market potential, using load factors, productivity, and development growth to inform the planning process. Current vehicle headways range from 30 to 60 minutes, apart from Route 170, which runs every 120 minutes. Portions of high-traffic commercial corridors such as Court St (Pasco) and Clearwater (Kennewick) experience 15-minute frequency by way of complementary routing and scheduling of routes 150 and 160. A 15-minute frequency corridor also exists between Three Rivers Transit Center (Kennewick) and Knight St Transit Center (Richland) by way of routes 120 and 126.
On-time performance varies by mode. Currently fixed route operates between 0 and 5 minutes before a fixed route bus is considered late.

2019-2024 TRANSIT DEVELOPMENT PLAN
36
Appendix C.5: Financial Report
2018 Basic Financial Statement
BFT participates in several Federal and State assisted programs. These grants are subject to audit by the grantors or their representatives. Such audits could result in requests for reimbursement to grantor agencies for expenditures disallowed under the terms of the grants. Washington State Auditor’s Office (SAO) began the 2018 Financial Statement and Federal Single Audit per Office of Management and Budget (OMB) Circular A-133, at Ben Franklin Transit on March 18, 2019. The BFT Board of Directors approved filing the report on May 9, 2019. The final 2018 actual operating expenditures of $36,918,227 (excluding depreciation) did not exceed the budgeted amount of $40,057,655 (excluding depreciation).
BFT’s main funding source is local sales tax dollars, which also serve as an economic barometer. The voter-approved 0.6% sales tax—or six cents per $10 taxable purchase—BFT receives to operate within its service area typically funds about 80% of the agency’s annual revenues. Rider fares, and state and federal grants (both discretionary and formula) make up the majority of the remaining revenues.
In recent years, BFT has experienced increases in sales tax revenue due to growth in the local economy, increases in construction projects, and healthy auto sales. Funds not used toward operating expenses are held for capital investments to support service enhancement and growth, and improve operational efficiency.
BFT pursued several competitive grant opportunities in 2018, some of which were still under review at year’s end, and received notice of the following grant awards:
• $1.2 million in federal funding allocated to support needed improvements to BFT’s operations facility.
• $500,000 in Volkswagen case settlement funds to be used toward the purchase of an all-electric bus.

2019-2024 TRANSIT DEVELOPMENT PLAN
37
2019 Service Levels & Ridership Assumptions
Service levels estimates are based on historical trends along with planned improvements roll-outs (initiated during the three shakeup/service run cuts) over the upcoming year.
Service Group yr. PAX Rev Miles Rev Hours Fixed Route 2019 2,029,750 2,502,996 166,515 ADA - DAR, Arc, Prosser, Taxi
2019 365,580 2,039,349 134,334
Vanpool 2019 650,518 3,401,515 70,703 Prosser - General Demand 2019 27,475 145,128 6,663 Night Service 2019 24,359 166,846 5,516 Sunday Service 2019 14,329 83,208 2,968 Taxi Feeder 2019 16,526 58,826 2,262
2019 3,128,537 8,397,868 388,961
Fixed Route Operations
Costs are budgeted to increase 7% due in part to: continued labor and benefit costs associated with demonstration service, addition of a Dispatcher, increase in benefits and compensation, expected parts usage for diesel engine replacements, fuel costs and improving operational technology. Revenue miles are budgeted at 2,503,000; revenue hours at 166,500; boardings at 2,029,800. In keeping with last year’s budget practice, wages and benefits have been budgeted with a utilization rate of 95% allowing for a 5% vacancy rate for Fixed Route and Dial-A-Ride Operators.
Taxi Feeder Services
The budgeted $312,000 represents a 25.2% increase or $62,700 increase over the 2018 forecast to increase utilization of and connect customers to the fixed route system. Revenue miles are budgeted at 58,800; revenue hours at 2,300; boardings at 16,500.
Dial-A-Ride Operations
Costs are budgeted to increase about 3.5% in 2019 due to increases in compensation and benefits, fuel cost, and cost associated with improving operational technology. Revenue miles are budgeted at 1,749,500; revenue hours at 118,200; boardings at 283,300.
Contracted Paratransit
The budgeted 1,653,100 represents a 2.7% decrease or $45,600 under the 2018 forecast and 6.7% under the 2018 budget due to changes in service levels. Revenue miles are budgeted at 289,900; revenue hours at 16,200; boardings at 82,300.

2019-2024 TRANSIT DEVELOPMENT PLAN
38
General Demand
Costs are budgeted to decrease almost 7% due to a change in staffing levels in Prosser. One FTE position will now work in the Tri-Cities office and performs work in Prosser as needed. Revenue miles are budgeted at 145,100; revenue hours at 6,700; boardings at 27,500.
Night Service
The budgeted $579,400 represents a 4.9% increase or $27,000 over the 2018 forecast. The budget will maintain the service level implemented as part of the system redesign and implementation in September 2017. Revenue miles are budgeted at 166,900; revenue hours at 5,500; and boardings at 24,400.
Sunday Service
The budgeted $338,000 represents a 5.2% increase or $16,700 increase over the 2018 forecast to support our regions Sunday Service needs. Revenue miles are budgeted at 83,200; revenue hours at 3,000; boardings at 16,500.
Vanpool Operations
Costs are budgeted to increase about 7% or $128,300 over the 2018 forecast and 3.9% over the 2018 budget due to increases in compensation and benefits, fuel and maintenance costs. Revenue miles are budgeted at 3,401,500; revenue hours at 70,700; boardings at 650,500.
Department Budgets
Maintenance Department
Costs are budgeted to increase due to labor and benefit costs associated with adding one Facilities Maintenance Worker and two Equipment Service Workers. A contingency fund of $120,000, has been set-aside for specific deficiencies identified in the 2018 Facilities Condition Assessment.
Human Resources/Safety/Training
Costs are budgeted to increase more than 28% due to labor and benefit costs associated with adding a Training Manager, Training Specialist, and Administrative Assistant. The increase also covers costs associated with the comprehensive employee program, development of employee policies and handbook; organizational design; improved training and staff development.
Executive/Administrative Services
Costs are budgeted to increase almost 10% due to the triennial review, a review of best practices, file archiving services, increases in software maintenance agreements, training and staff development.
2019-2024 TRANSIT DEVELOPMENT PLAN
39
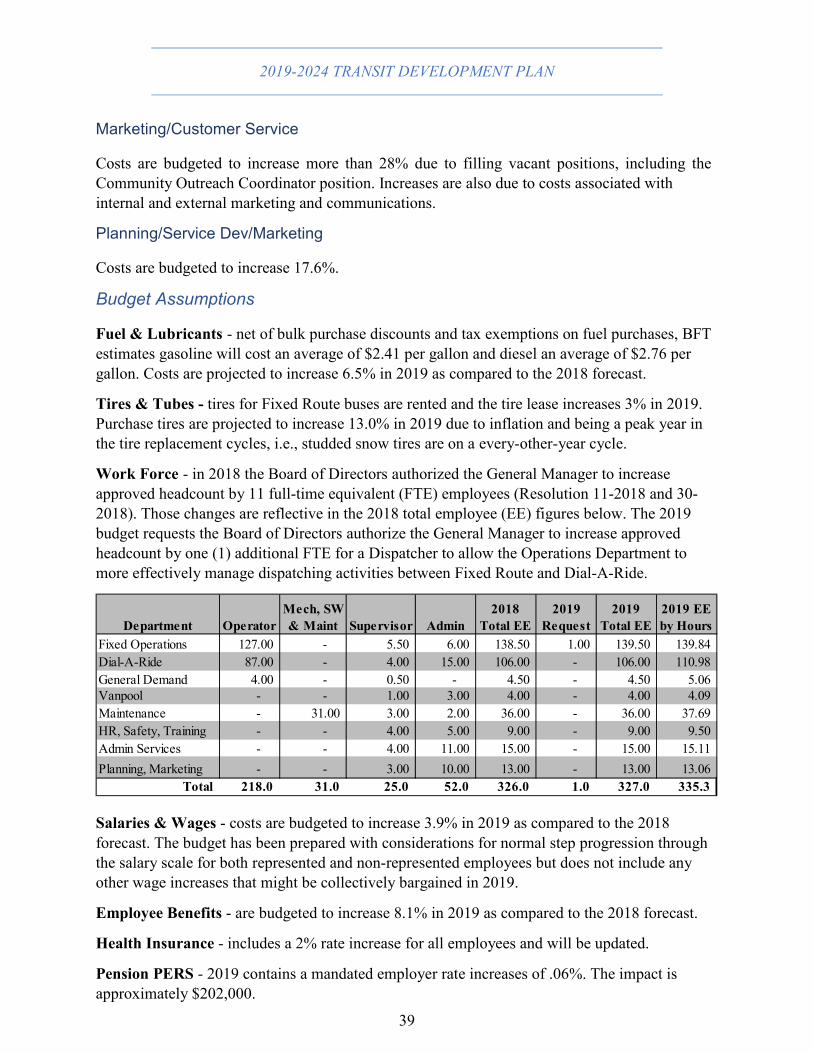
Marketing/Customer Service
Costs are budgeted to increase more than 28% due to filling vacant positions, including the Community Outreach Coordinator position. Increases are also due to costs associated with internal and external marketing and communications.
Planning/Service Dev/Marketing
Costs are budgeted to increase 17.6%.
Budget Assumptions
Fuel & Lubricants - net of bulk purchase discounts and tax exemptions on fuel purchases, BFT estimates gasoline will cost an average of $2.41 per gallon and diesel an average of $2.76 per gallon. Costs are projected to increase 6.5% in 2019 as compared to the 2018 forecast.
Tires & Tubes - tires for Fixed Route buses are rented and the tire lease increases 3% in 2019. Purchase tires are projected to increase 13.0% in 2019 due to inflation and being a peak year in the tire replacement cycles, i.e., studded snow tires are on a every-other-year cycle.
Work Force - in 2018 the Board of Directors authorized the General Manager to increase approved headcount by 11 full-time equivalent (FTE) employees (Resolution 11-2018 and 30-2018). Those changes are reflective in the 2018 total employee (EE) figures below. The 2019 budget requests the Board of Directors authorize the General Manager to increase approved headcount by one (1) additional FTE for a Dispatcher to allow the Operations Department to more effectively manage dispatching activities between Fixed Route and Dial-A-Ride.
Salaries & Wages - costs are budgeted to increase 3.9% in 2019 as compared to the 2018 forecast. The budget has been prepared with considerations for normal step progression through the salary scale for both represented and non-represented employees but does not include any other wage increases that might be collectively bargained in 2019.
Employee Benefits - are budgeted to increase 8.1% in 2019 as compared to the 2018 forecast.
Health Insurance - includes a 2% rate increase for all employees and will be updated.
Pension PERS - 2019 contains a mandated employer rate increases of .06%. The impact is approximately $202,000.
Fixed Operations 127.00 - 5.50 6.00 138.50 1.00 139.50 139.84 Dial-A-Ride 87.00 - 4.00 15.00 106.00 - 106.00 110.98 General Demand 4.00 - 0.50 - 4.50 - 4.50 5.06 Vanpool - - 1.00 3.00 4.00 - 4.00 4.09 Maintenance - 31.00 3.00 2.00 36.00 - 36.00 37.69 HR, Safety, Training - - 4.00 5.00 9.00 - 9.00 9.50 Admin Services - - 4.00 11.00 15.00 - 15.00 15.11 Planning, Marketing - - 3.00 10.00 13.00 - 13.00 13.06
Total 218.0 31.0 25.0 52.0 326.0 1.0 327.0 335.3
Department Operator2019 EE by Hours
2019 Total EE
2019 Request
2018 Total EEAdmin
Mech, SW & Maint Supervisor

2019-2024 TRANSIT DEVELOPMENT PLAN
40
Washington State Family Medical Leave (FML) Act - contributions begin in 2019 for a new 2020 expanded paid family and medical leave benefit. The impact is approximately $28,000 to cover the employer portion of the 2019 contribution.
Material & Supplies - in 2018, BFT implemented new technologies with most first-year software maintenance agreement costs being capitalized. In 2019, those second-year costs are properly accounted for as operating expense.
Liability Insurance - premium costs are budgeted to increase 5.0% over the 2018 forecast and is pending further information from WSTIP. The base rate is subject to increases based on (1) claims paid, (2) experience factors of those in the pool and (3) progress towards meeting theWSTIP strategic commitment to attain a $5M pool self-insurance retention by 2023.
Rental - costs are budgeted to increase 16.8% in 2019 as compared to the 2018 forecast and increase 31.5% over the 2018 budget due to additional training space needs.
Funding Source: Federal/State/Local/Reserves Total Budget: Operating $42,022,300
Capital $22,015,066 Total $64,037,366
Federal Grants - are budgeted in the amount of $4,983,828 and include 5307 and 5339 formula funding for Federal Fiscal Year 2018. Of these funds, 1,900,000 will be used for operating expenditures and $3,083,828 will be used for capital expenditures.

2019-2024 TRANSIT DEVELOPMENT PLAN
41
2020-2024 Budget Forecast
Operating 2018 2019 2020 2021 2022 2023 2024Total
2018-2024
Operating RevenuesTotal Sales Tax (Local) 36,600,000$ 36,950,000$ 38,150,875$ 39,581,533$ 40,867,933$ 42,400,480$ 43,778,496$ 278,329,316$
Total 'Other' Local (Fares, Contracted Services, Misc.) 4,590,269$ 4,789,950$ 4,866,330$ 4,944,155$ 5,060,006$ 5,179,187$ 5,301,799$ 34,731,696$
Total State Operating 1,680,627$ 837,654$ 837,654$ 161,150$ 161,150$ 349,536$ 349,536$ 4,377,308$
Total Federal Operating 1,900,000$ 4,854,467$ 4,866,603$ 4,878,770$ 4,890,967$ 4,903,194$ 4,915,452$ 31,209,453$
Total Operating Revenues 44,770,896$ 47,432,071$ 48,721,461$ 49,565,609$ 50,980,056$ 52,832,397$ 54,345,283$ 348,647,773$
Operating ExpenseTotal Labor 26,489,720$ 28,358,600$ 29,491,503$ 30,669,664$ 31,894,892$ 33,169,067$ 34,494,145$ 214,567,591$
Total Non-Labor 11,713,537$ 13,659,300$ 13,864,190$ 14,119,407$ 14,331,198$ 14,546,166$ 14,764,358$ 96,998,155$
Service Expansion -$ 2,301,000$ 2,500,000$ 2,537,500$ 2,575,563$ 2,614,196$ 2,653,409$ 15,181,667$
Total Operating Expense 38,203,257$ 44,318,900$ 45,855,692$ 47,326,571$ 48,801,653$ 50,329,429$ 51,911,912$ 326,747,414$
Operating Surplus/(Deficit) 6,567,639$ 3,113,171$ 2,865,769$ 2,239,038$ 2,178,403$ 2,502,968$ 2,433,371$ 21,900,359$
Capital 2018 2019 2020 2021 2022 2023 2024Total
2018-2024
Capital Grants 5,919,525$ 12,239,091$ 3,589,400$ 8,782,803$ 4,421,546$ 6,264,010$ 4,571,539$ 45,787,914$
Capital Expenses 8,949,491$ 23,562,347$ 7,658,792$ 13,125,056$ 7,846,156$ 12,207,598$ 6,842,908$ 80,192,347$
Capital Funds Surplus/(Deficit) (3,029,966)$ (11,323,256)$ (4,069,391)$ (4,342,253)$ (3,424,610)$ (5,943,588)$ (2,271,369)$ (34,404,433)$ Combined Operating & Capital Surplus/(Deficit) 3,537,672$ (8,210,085)$ (1,203,622)$ (2,103,216)$ (1,246,207)$ (3,440,619)$ 162,002$ (12,504,074)$
Reserves 2018 2019 2020 2021 2022 2023 2024Total
2018-2024
Beginning Reserves 36,340,809$ 39,878,482$ 31,668,397$ 30,464,775$ 28,361,559$ 27,115,352$ 23,674,733$ Current Year Surplus/(Deficit) 3,537,672$ (8,210,085)$ (1,203,622)$ (2,103,216)$ (1,246,207)$ (3,440,619)$ 162,002$
Subtotal Reserves 39,878,482$ 31,668,397$ 30,464,775$ 28,361,559$ 27,115,352$ 23,674,733$ 23,836,735$
Restricted Reserve Funds 22,341,814$ 23,870,725$ 24,431,788$ 24,979,026$ 25,530,007$ 26,096,895$ 26,680,234$ Total Surplus (Deficit) Funds 17,536,668$ 7,797,672$ 6,032,987$ 3,382,533$ 1,585,345$ (2,422,162)$ (2,843,499)$ (2,843,499)$

2019-2024 TRANSIT DEVELOPMENT PLAN
42
Appendix C.6: Community Participation (General Overview and Policy) It is the policy of BFT to encourage broad comment and input, including complaints, on proposed Program of Projects, Service Changes, Fare Changes and various policies. Title VI requires setting thresholds for this public comment process. The Disproportionate Burden and or Discriminatory Impact Policies are included in the Title VI documentation as they state required public input and BFT’s intention to resolve any concern regarding disparate impacts. In addition, BFT encourages broad comment on policies that may impact its customers and frequently carries out surveys, public forums and open houses in addition to this formal process. The Customer Comment Records document concerns or compliments received from the public. BFTs Customer Service group responds to customer comments within four days of initial contact. The request and follow up are logged in the BFT Customer Comment Records system. The record of 2018 complaints is shown below.
Department/Group 2018 Total
Complaint Commendation Service Requests
Bus Operations 444 384 86% 27 6% 33 7% Bus Stops 46 27 59% 0 0% 19 41% Contracted Services 65 59 91% 1 2% 5 8% Customer Service 8 5 63% 3 38% 0 0% Dial -a-Ride 75 52 69% 20 27% 3 4% Facilities / Maintenance
4 2 50% 0 0% 2 50%
Other 7 7 100% 0 0% 0 0% Prosser / Benton City 1 1 100% 0 0% 0 0% Public Information 1 1 100% 0 0% 0 0% Transit Centers 2 2 100% 0 0% 0 0% Vanpool 44 43 98% 1 2% 0 0%
In addition, BFT encourages broad comment on policies that may impact its customers and frequently carries out surveys, public forums and open houses in addition to this formal process.
Procedures
• Provide at least a 30-day advanced notice of public hearings regarding major servicechanges or fare increases in Spanish and English.
• Customers, the public and the community will be informed of the proposed change,comment process and public hearings by way of: newspaper display ads, multimedianews releases, onboard fliers, postings at BFT offices and the BFT website. All media arein both Spanish and English.

2019-2024 TRANSIT DEVELOPMENT PLAN
43
• Proposals for major service changes and fare increases will be submitted to the BFTCitizens Advisory Network (CAN) for discussion, review and comment. The CAN is agroup of citizens that includes representatives of the disabled, low income, educationalinstitutes, major employers and LEP portions of our customer base.
• All input and comment including minutes of public hearings, recommendations of theCAN and BFT staff recommendations shall be provided to the BFT Board of Directorsprior to any decision regarding changes to any program of projects, major service, fareand other policies. Interpreters are present at all public hearings to translate informationand take comments.
Ben Franklin Transit employs a variety of methods to communicate with customers and the public. These include printed schedule information, signs inside vehicles, transit centers and park and rides, the customer service Language Line, customer service outlets, headquarters reception, website, Facebook and Twitter, news releases, advertising, community meetings and presentations, and flyers through multiple media outlets. In 2016, Ben Franklin Transit implemented the use of Language Line flyers which are placed on all fixed route services. The Language Line Flyers contain easily recognized symbols and the phone number of BFTs Language Line translation services. The flyers are meant to be distributed by coach operators to any individual that appears to need assistance, but a language barrier exists.
All feedback from customers is valued. Information about the Customer Comment Policy, including how to submit a complaint, is made available to riders in our schedule book, on our website, at all sales outlets and on our vehicles. Anyone who submits a comment, complaint, or service suggestion to BFT and requests a response will receive an initial response within fifteen (15) working days provided they provide legible contact information.
Customers of BFT shall be able to submit complaints, feedback or participate in the public involvement process without fear of retribution from the agency. If a customer feels like they are being treated unfairly in response to the feedback that they provided, they should contact the BFT Office of the General Manager. BFT will appropriately discipline any employee or contractor that retaliates against a customer.

•
•
•
•
•
•
•
•
•
2019-2024 TRANSIT DEVELOPMENT PLAN
44
Appendix C.7: Specific Public Engagement for the 2019-2024 TDP
A Compliant TDP Document Requires Earnest Community Participation
BFT is pledged to “maximize outreach to the community and develop strategic partnerships within the region”. BFT adheres to the following practices as it aspires to fulfill the intent of the law:
All comments and responses were provided to BFT’s Board of Directors prior to any decision regarding any program of projects (POP) or policy modifications being finalized into the Transit Development Plan.
7 Also see the BFT Title VI Program & LEP Plan of xxx, xxx.
Provide maximum possible notice of public hearings in both Spanish and English (no less than between monthly Board meetings, e.g., 28-30 days).Use marketing expertise to invite and hopefully engage the Title VI protected populations7, e. g., minority, low income, persons with Limited English (LEP) proficiency, and senior citizens. The process includes multiple channels for two-way communication; postage free comment cards - on buses and at ticket outlets, mail, email, telephone, website, and social media. Limited English Proficiency participation is enhanced by providing interpretive services at the public meetings. Notice is needed for languages other than Spanish, so the‘language line’ can be activated. Sign language professionals have also been used. All BFT Board meetings are open and accessible to the public and a public comment period is always announced during the proceedings. TDP comments are welcome. BFT’s website contains a link to the TDP ‘Frequently Asked Question and Answers’. Response back from any unposted questions will be of received within 15 days of the request; BFT must receive legible/functional contact information to respond. Attendees of the public meeting are provided Title VI Complaint forms and made aware of the process for filing these forms, follow-up and appeal procedures. BFT held an afternoon and evening informational session on the Draft TDP on 6/26/19, at the Three Rivers Transit Center. The Citizens Advisory Network (CAN) received a presentation of the Draft TDP in late July 2019 and their discussion, review and comments were incorporated prior to the TIP meetings held by the Joint BFT and Benton Franklin Council of Governments. The final public hearing of the BFT Program of Projects contained in the TDP, will take place at the Joint BFT and Benton Franklin Council of Governments TIP open house held at BFTs Admin/Ops/Maintenance Center in late August 2017.

2019-2024 TRANSIT DEVELOPMENT PLAN
45
Appendix C.8: Operating Indicators by Mode/Group
BFT Operating Cost per Boarding
type 2018 up down 2017 Fixed Route $8.82 $1.67 $7.15 Van Pool $3.82 $-0.15 $3.97 FX Feeder $13.37 $2.37 $11.01 Prosser $27.84 $-2.66 $30.50 DAR BFT $46.40 $-0.87 $47.28 DAR Arc $16.58 $0.52 $16.06 DAR Taxi $37.74 $7.01 $30.73 Night $23.86 $3.33 $20.53 Sunday $22.19 $2.60 $19.58
,
$8.82 Van Pool, $3.82FX Feeder, $13.37
,
$46.40
DAR Arc, $16.58
,
$37.74

2019-2024 TRANSIT DEVELOPMENT PLAN
46
BFT Operating Expense / Revenue Hour
type 2018 up down 2017 Fixed Route $109.49 $-1.91 $111.40 Van Pool $34.13 $-2.06 $36.18 FX Feeder $95.83 $10.96 $84.87 Prosser $113.09 $-7.73 $120.83 DAR BFT $111.55 $-2.30 $113.85 DAR Arc $94.00 $1.88 $92.13 DAR Taxi $102.48 $15.24 $87.23 Night $104.81 $11.96 $92.85 Sunday $104.73 $12.96 $91.76
Fixed Route, $109.49
,
$34.13
FX Feeder, $95.83
,
$113.09
DAR BFT, $111.55
,
$94.00
DAR Taxi, $102.48

2019-2024 TRANSIT DEVELOPMENT PLAN
47
BFT Boardings per Revenue Hour
type 2018 up down 2017 Fixed Route 12.41 -3.17 15.57 Van Pool 8.94 -0.18 9.12 FX Feeder 7.16 -0.55 7.71 Prosser 4.06 0.10 3.96 DAR BFT 2.40 0.00 2.41 DAR Arc 5.67 -0.07 5.74 DAR Taxi 2.72 -0.12 2.84 Night 4.39 -0.13 4.52 Sunday 4.72 0.03 4.69
,
12.41
,
8.94
,
7.16
,
4.06
,
2.40
,
5.67
DAR Taxi, 2.72

2019-2024 TRANSIT DEVELOPMENT PLAN
48
BFT Boardings per Revenue Mile
type 2018 up down 2017 Fixed Route 0.79 -0.18 0.97 Van Pool 0.19 0.19 FX Feeder 0.28 -0.03 0.31 Prosser 0.19 -0.02 0.21 DAR BFT 0.16 0.00 0.17 DAR Arc 0.34 0.01 0.33 DAR Taxi 0.09 -0.02 0.11 Night 0.15 -0.01 0.16 Sunday 0.17 -0.01 0.17
,
0.79
,
0.19,
0.28
,
0.19
,
0.16
,
0.34
DAR Taxi, 0.09

2019-2024 TRANSIT DEVELOPMENT PLAN
49
BFT Fare Box vs Operating Cost
type 2018 up down 2017 Fixed Route 6.5% -0.01 7.7% Van Pool 70.2% 0.13 57.4% FX Feeder 1.6% 0.00 2.0% Prosser 2.6% 0.01 2.1% DAR BFT 2.2% 0.00 2.3% DAR Arc 10.9% -0.02 13.3% DAR Taxi 13.6% -0.05 18.6% Night 27.7% 0.03 25.0% Sunday 5.0% 0.00 5.3%
Fixed Route, 6.5%
Van Pool, 70.2%
,
1.6%Prosser, 2.6%
DAR BFT, 2.2%
,
10.9%
DAR Taxi, 13.6%
Sunday, 5.0%

2019-2024 TRANSIT DEVELOPMENT PLAN
50
BFT Staff per Revenue Hour
type 2018 FTE Fixed Route 0.10% 171.8
BFT drivers & support
Van Pool 0.02% 12.3 BFT drivers & support
FX Feeder 0.07% 1.3 BFT Staff time only
Prosser 0.24% 16.5 BFT drivers & support
DAR BFT 0.09% 112.2 BFT drivers & support
DAR Arc 0.06% 7.8 BFT Staff time only
DAR Taxi 0.08% 1.3 BFT Staff time only
Night 0.01% 0.4 BFT Staff time only
Sunday 0.02% 0.4 BFT Staff time only
Fixed Route, 0.10% Van Pool, 0.02%
FX Feeder, 0.07%
DAR BFT, 0.09%
DAR Arc, 0.06%
DAR Taxi, 0.08%Night, 0.01%
Sunday, 0.02%
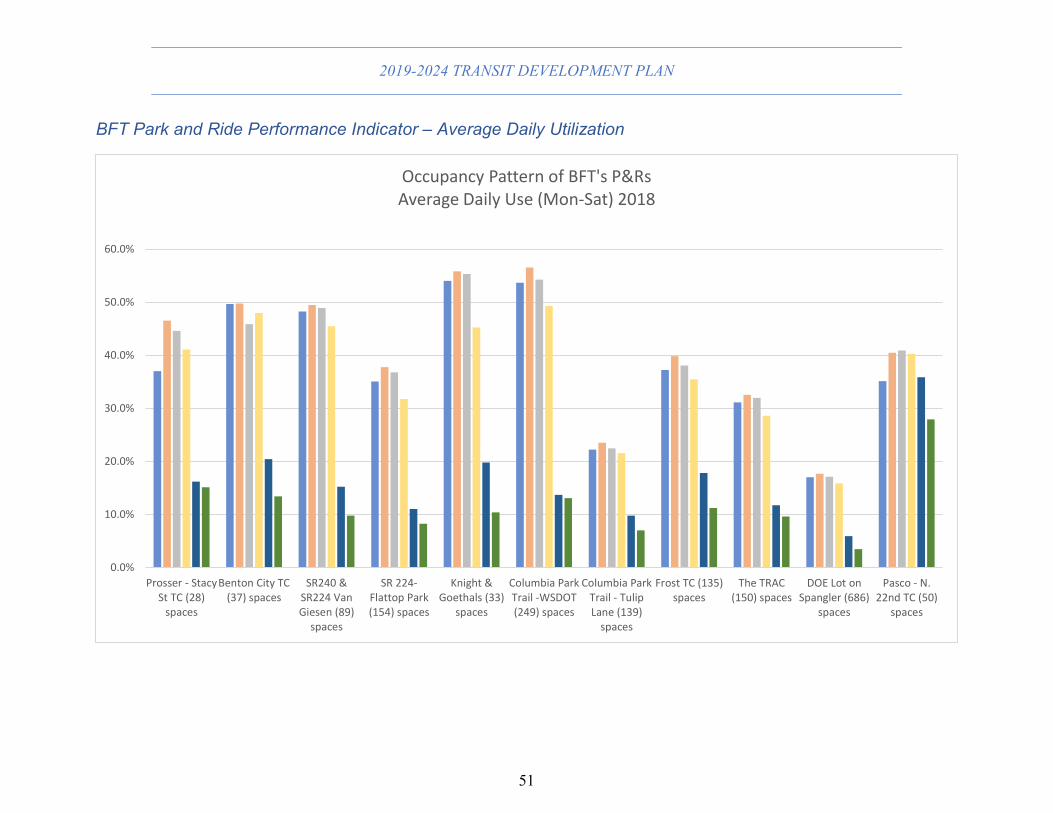
2019-2024 TRANSIT DEVELOPMENT PLAN
51
BFT Park and Ride Performance Indicator – Average Daily Utilization
0.0%
10.0%
20.0%
30.0%
40.0%
50.0%
60.0%
Prosser - StacySt TC (28)
spaces
Benton City TC(37) spaces
SR240 &SR224 VanGiesen (89)
spaces
SR 224-Flattop Park(154) spaces
Knight &Goethals (33)
spaces
Columbia ParkTrail -WSDOT(249) spaces
Columbia ParkTrail - TulipLane (139)
spaces
Frost TC (135)spaces
The TRAC(150) spaces
DOE Lot onSpangler (686)
spaces
Pasco - N.22nd TC (50)
spaces
Occupancy Pattern of BFT's P&RsAverage Daily Use (Mon-Sat) 2018
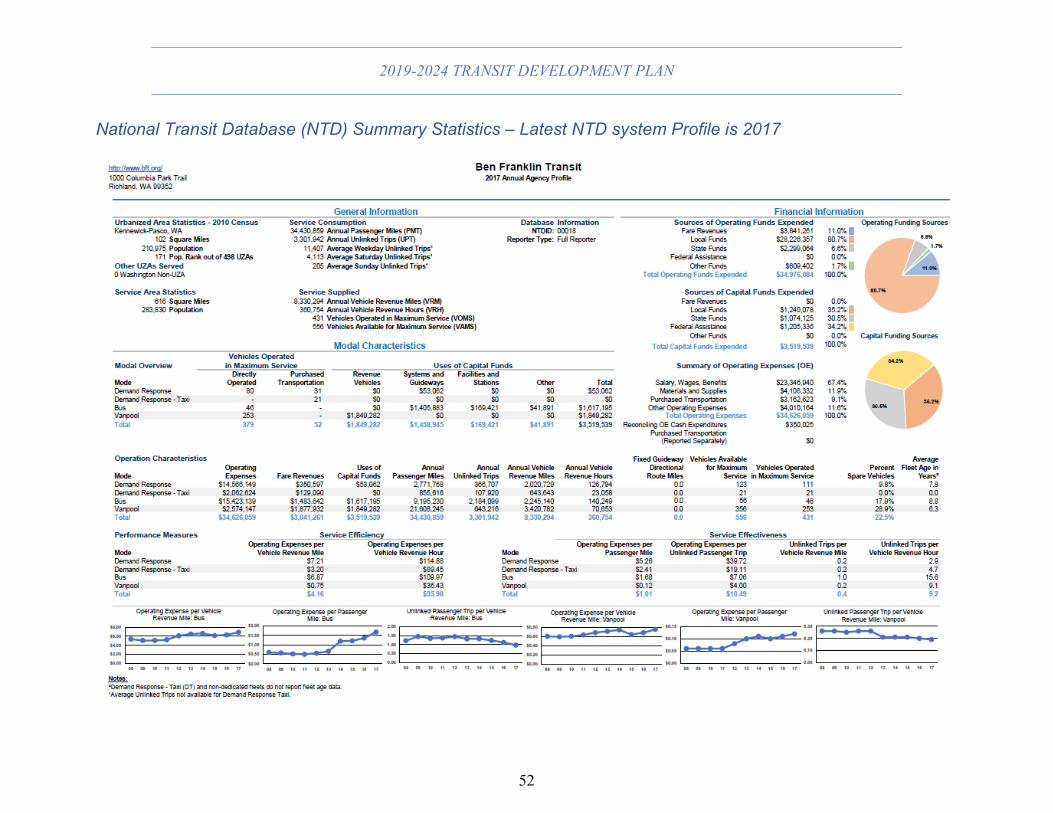
2019-2024 TRANSIT DEVELOPMENT PLAN
52
National Transit Database (NTD) Summary Statistics – Latest NTD system Profile is 2017