2019-20 Annual Report of State Finances
264
2019-20 ANNUAL REPORT ON STATE FINANCES September 2020
Transcript of 2019-20 Annual Report of State Finances

2019-20
ANNUAL REPORT ON STATE FINANCES
September 202020
19-20
AN
NU
AL R
EP
OR
T O
N STA
TE
FIN
AN
CE
S
2019-20_ARSF_Cover.indd 12019-20_ARSF_Cover.indd 1 23/09/2020 12:50:05 PM23/09/2020 12:50:05 PM

WESTERN A U S TRALIA
TH
E
GOV ERN MEN
OF
T2019 ‑20
Annual Report on State Finances
SEPTEMBER 2020
Enquiries related to this report should be directed by email to [email protected]
An electronic copy of this report may be obtained at http://www.treasury.wa.gov.au ISSN 1834-1101 (print) ISSN 1834-111X (on-line)
2019-20 Annual Report on State Finances© Government of Western Australia 2020

2019-20 Annual Report on State Finances
Table of Contents
FOREWORD ................................................................................................ i Statement of Responsibility ..................................................................................... ii
Opinion of the Auditor General ................................................................................ iv FINANCIAL RESULTS ................................................................................ 1
Introduction .............................................................................................................. 2
Results Compared to Estimated Outturn ................................................................. 5
General Government Sector ................................................................................. 5
Total Public Sector ................................................................................................ 14
Net Debt ................................................................................................................ 22
Financial Targets ...................................................................................................... 26 APPENDIX 1: FINANCIAL STATEMENTS ................................................. 33 APPENDIX 2: OPERATING REVENUE ..................................................... 169 APPENDIX 3: SPENDING BY CLASSIFICATION OF THE FUNCTIONS
OF GOVERNMENT-AUSTRALIA (COFOG-A) .......................................... 175 APPENDIX 4: COMPARISON OF FINAL OUTCOMES TO ORIGINAL
BUDGET FOR THE YEAR ENDING 30 JUNE 2020 .................................. 179 APPENDIX 5: SPECIAL PURPOSE ACCOUNTS ....................................... 205 APPENDIX 6: QUARTERLY FINANCIAL RESULTS – JUNE 2020 ............ 213 APPENDIX 7: PUBLIC LEDGER ................................................................ 223 APPENDIX 8: GENERAL GOVERNMENT SECTOR SALARIES .............. 237 APPENDIX 9: EXPENSE LIMIT OUTCOMES ............................................. 239 APPENDIX 10: KEY TECHNICAL TERMS USED IN THE FINANCIAL
REPORT ................................................................................................... 241


i
Foreword
This Annual Report on State Finances (ARSF) provides detail on the State’s public sector financial results for 2019-20. It includes disclosure of material differences between these outcomes and estimated outcomes contained in the 2019-20 Mid-year Review and in the original 2019-20 Budget.
The Government Financial Responsibility Act 2000 requires the release of audited whole-of-government financial results, consistent with external reporting requirements, within 90 days of the financial year-end.
For the purpose of this ARSF, ‘external reporting requirements’ are embodied in Australian Accounting Standards Board (AASB) 1049: Whole of Government and General Government Sector Financial Reporting.
All Australian State, Territory and Commonwealth governments publish financial disclosures consistent with AASB 1049, and with the requirements of the Uniform Presentation Framework (UPF). The UPF ensures consistent minimum levels of detail in whole-of-government disclosures. Western Australia’s disclosures in this ARSF are consistent with the requirements of AASB 1049, other applicable accounting standards, Government Finance Statistics concepts, sources and methods, and exceed the minimum requirements specified in the UPF.
Three new accounting standards took effect for reporting periods commencing on or after 1 January 2019, and their impact was included in the 2019-20 Budget, 2019-20 Mid-year Review, and has been reflected in the general government and whole-of-government quarterly series of reports released through 2019-20 and in this ARSF. These standards are:
• AASB 16: Leases, which brings operating leases and associated leased assets onto the balance sheet for the first time;
• AASB 15: Revenue From Contracts With Customers, which amends revenue recognition rules, particularly around the nature, amounts, timing and uncertainty of revenue arising from customer contracts; and
• AASB 1058: Income of Not-For-Profit Entities, which simplifies some of the new AASB 15 rules, particularly for public sector entities (where concepts of contracts with customers can be ambiguous).

2019-20 Annual Report on State F inances
ii
Further details about the impact of each standard can be found in Chapter 3: Fiscal Outlook and Strategy of the 2019-20 Budget Paper No. 3. The 2019-20 Budget included backcast data for the expected outturn for 2018-19 and for prior years to aid with comparisons and trend analysis. However, prior period results detailed in Appendix 1 of this report have not been restated for comparative purposes, in line with the transition provisions contained in paragraph C3(b) of AASB 15 and paragraph C3(b) of AASB 1058 and a Treasury Circular mandating those approaches for actuals reporting in State public sector reporting entities.
Where practical, general government sector revenue and expense movements discussed in the Financial Results chapter of this report abstract from the impact of the new standards to assist the user in understanding underlying changes in these aggregates between rounds of estimates and relative to 2018-19.
This ARSF contains information on the Western Australian whole-of-government (and its sub-sectors) for:
• the actual outturn for 2019-20, which is the focus of this report;
• movements in the 2019-20 outturn relative to the 2019-20 estimated outturn contained in the 2019-20 Mid-year Review, released on 18 December 2019;
• movements in the 2019-20 outturn relative to the 2019-20 Budget estimates, presented to the Legislative Assembly on 9 May 2019 (detailed in Appendix 4);
• material Special Purpose Accounts (Appendix 5);
• quarterly results for June 2020, completing the State’s quarterly reporting series for 2019-20 (Appendix 6); and
• the Public Ledger outcomes for the year ending 30 June 2020, which includes the Consolidated Account, the Treasurer’s Advance Account, and the Treasurer’s Special Purpose Accounts (Appendix 7).
General government sector salary outcomes and expense limit outcomes under Resource Agreements for appropriation-funded agencies are also included in Appendices 8 and 9 respectively.
Statement of Responsibility
This ARSF is a statutory requirement of the Government Financial Responsibility Act 2000. It contains whole-of-government financial information in the same format as the State’s Budget presentations, reflecting applicable Australian Accounting Standards and the Australian Bureau of Statistics’ (ABS’) accrual Government Finance Statistics standards.
The consolidated financial statements included in this report have been prepared by the Department of Treasury from information provided by State public sector agencies.
In our opinion, the financial information presented in this report:
• fairly represents the operating results and cash flows of the Government of Western Australia for the year ended 30 June 2020, and the public sector’s financial position at 30 June 2020; and

Foreword
iii
• has been prepared in accordance with Australian Accounting Standard AASB 1049: Whole of Government and General Government Sector Financial Reporting, other applicable Australian Accounting Standards (including the Australian Accounting Interpretations), and complies with statistical standards promulgated by the ABS.
At the date of signing, we are not aware of any circumstances which would cause any information included in the financial disclosures in this report to be misleading or inaccurate.
MICHAEL BARNES MAGDALENA WITTEK UNDER TREASURER MANAGER FINANCIAL REPORTING
24 September 2020

Foreword
iv
Opinion of the Auditor General

Foreword
v

2019-20 Annual Report on State F inances
vi
1
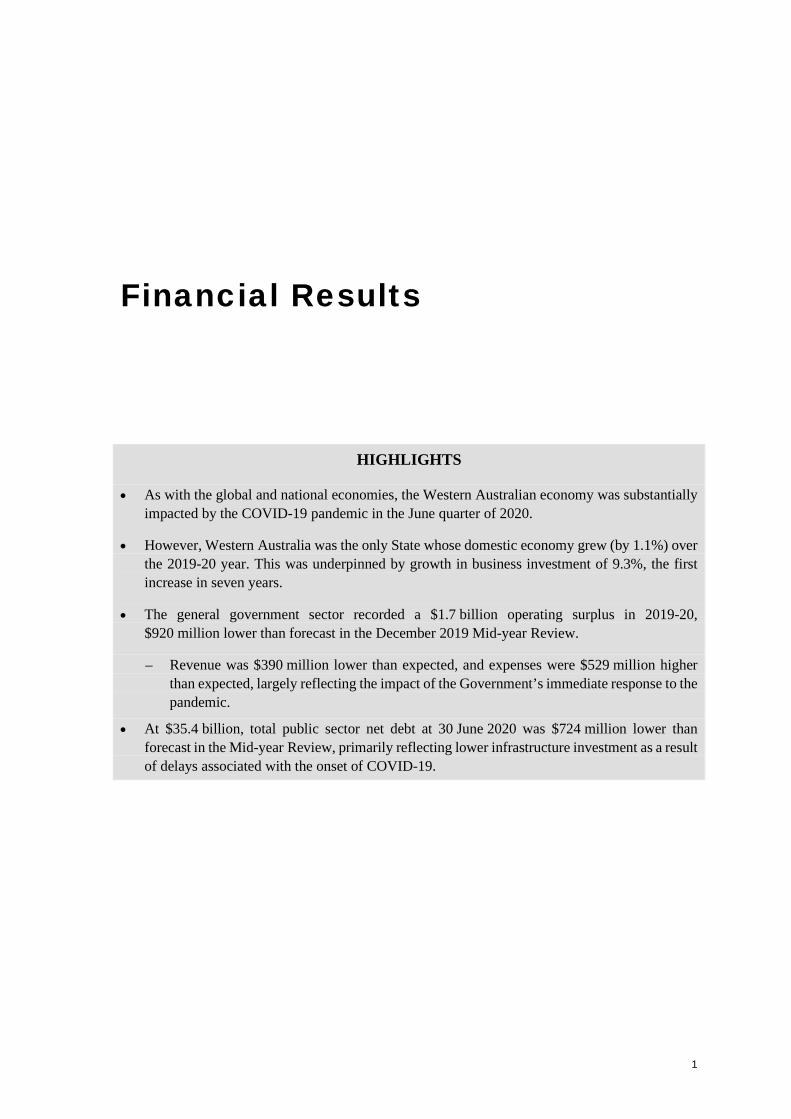
Financial Results
HIGHLIGHTS
• As with the global and national economies, the Western Australian economy was substantially impacted by the COVID-19 pandemic in the June quarter of 2020.
• However, Western Australia was the only State whose domestic economy grew (by 1.1%) over the 2019-20 year. This was underpinned by growth in business investment of 9.3%, the first increase in seven years.
• The general government sector recorded a $1.7 billion operating surplus in 2019-20, $920 million lower than forecast in the December 2019 Mid-year Review.
– Revenue was $390 million lower than expected, and expenses were $529 million higher than expected, largely reflecting the impact of the Government’s immediate response to the pandemic.
• At $35.4 billion, total public sector net debt at 30 June 2020 was $724 million lower than forecast in the Mid-year Review, primarily reflecting lower infrastructure investment as a result of delays associated with the onset of COVID-19.

2019-20 Annual Report on State F inances
2
Introduction 1
The general government sector recorded a $1.7 billion operating surplus in 2019-20. This outcome is $920 million lower than the $2.6 billion estimate included in the 2019-20 Mid-year Review, largely reflecting the net impact of:
• higher royalty income (up $945 million), primarily due to higher iron ore prices;
• lower revenue from public corporations (down $839 million, largely due to the deferral of interim dividend payments to 2020-21) and grants from the Commonwealth (down $533 million, mainly transport-related grants retimed to later years and accounting standards changes2); and
• higher recurrent spending (up $529 million), mainly reflecting the State’s immediate response to the COVID-19 pandemic.
Abstracting from accounting standards changes that took effect in 2019-20, general government revenue increased by 5.9% (or $1.8 billion) relative to 2018-19. This primarily reflects the impact of a higher iron ore price, a lower $US/$A exchange rate and higher iron ore volumes on iron ore royalty income.
After adjusting for new accounting standards changes, general government expenses increased by 5% (or $1.4 billion) in 2019-20 compared to 2018-19, slightly above the decade average of 4.8%. Relative to the Mid-year Review estimated growth of 3.1%, this increase mainly reflects unanticipated spending in relation to the COVID-19 pandemic response.
Capital spending on infrastructure in 2019-20 was $5.2 billion, $457 million lower than the Mid-year Review estimate. This lower outcome was largely attributed to construction delays, including as a result of COVID-19 pandemic restrictions and supply disruptions.
Total public sector net debt at 30 June 2020 was $35.4 billion, $724 million lower than estimated in the Mid-year Review. Net debt was largely unchanged from the $35.5 billion recorded at 30 June 2019, reflecting a stronger total public sector cash outcome for 2019-20, offset by new lease recognition arrangements under AASB 16: Leases.
1 This chapter mainly focuses on variations in outcomes between the mid-year revision published in the State’s
2019-20 Mid-year Review and the final outcomes for 2019-20 and, where important, comparisons to the previous financial year (2018-19). Comparisons to the original 2019-20 Budget projections (presented to the Legislative Assembly on 9 May 2019) are available in Appendix 4: Comparison of Final Outcomes to Original Budget for the Year Ending 30 June 2020.
2 Two new revenue standards came into effect for periods commencing on or after 1 January 2019. AASB 15: Revenue From Contracts With Customers and AASB 1058: Income of Not-For-Profit Entities include a number of changes to rules for revenue recognition. The key change from these standards for the 2019-20 Annual Report on State Finances is the removal of Commonwealth grants paid ‘through’ the State to local governments and non-government schools. To assist readers to understand movements in aggregates discussed in this report, explanatory information about changes since the 2018-19 outcomes removes $1.6 billion in grants revenue and expenses from 2018-19 data to present a consistent basis of comparison for annual movements. Readers should note that in line with accounting standards requirements, numerical data in tables throughout this chapter and the appendices to this report are unadjusted and remain in line with the applicable accounting standards for the periods reported.

Financ ia l Resu l t s
3
The following table summarises the key financial outcomes for 2019-20.
Table 1 KEY BUDGET AGGREGATES
Western Austra l ia
(a) As published in the 2018-19 Annual Report on State Finances (ARSF). Excludes new accounting standards applicable in 2019-20. (b) Budget, Mid-year Review and actual growth rates for 2019-20 abstract from the impact of new accounting standards which take effect
for reporting periods commencing on or after 1 January 2019. Annual growth in revenue and expenses in 2019-20 compared with the unadjusted outturn published in the 2018-19 ARSF was 0.5% and -0.6% respectively.
Note: Columns/rows may not add due to rounding.
2018-19 (a)
Budget MYRActual Estimate Revision Actual
GENERAL GOVERNMENT SECTORNet Operating Balance ($m) 1,317 1,533 2,589 1,669 Revenue ($m) 32,006 31,334 32,553 32,162Revenue Growth (%) (b) 9.1 4.7 6.9 5.9 Expenses ($m) 30,689 29,801 29,964 30,493Expense Growth (%) (b) 2.5 1.5 3.1 5.0Net Debt at 30 June ($m) 22,990 27,705 23,251 23,758General Government Net Debt as a Share of Total
Public Sector Net Debt (%) 64.8 70.1 64.3 67.0TOTAL PUBLIC SECTOR
Net Debt at 30 June ($m) 35,462 39,531 36,173 35,449Asset Investment Program ($m) 4,965 5,646 5,646 5,188Cash Surplus/Deficit ($m) -924 -248 1,961 2,217
2019-20

2019-20 Annual Report on State F inances
4
Key economic parameters for 2019-20 are summarised in the following table.
Table 2 KEY ECONOMIC PARAMETERS
Western Austra l ia
(a) Annual growth. (b) Based on 2018-19 annual State Accounts, updated with State Final Demand and Balance of Payments data published for the
June quarter 2020. Actual data for 2019-20 for Gross State Product, merchandise imports, and net exports is not available until 20 November 2020.
(c) Net exports refer to international trade in both goods and services. (d) Forecasts for ownership transfer costs, international trade in services and the balancing item are not separately reported. (e) Actual population figure for 2019-20 is not available until 17 December 2020. (f) Data expressed as annual average during the financial year. (g) 2019-20 actual based on preliminary data from the Real Estate Institute of Western Australia and is subject to revision. Note: Statistical outcomes sourced from the ABS are subject to periodic revision by that organisation.
2018-19
Demand and Output (%) (a)(b)
Household Consumption 1.0 1.75 1.25 -2.0
Dw elling Investment -3.8 -2.75 -7.0 -13.1
Business Investment -7.1 6.0 6.0 9.3
Government Consumption 1.8 1.75 1.5 5.2
Government Investment -1.4 10.5 10.5 3.2
State Final Demand -0.8 3.0 2.25 1.1
Merchandise Exports 1.6 4.0 4.0 0.7
Merchandise Imports -7.2 2.5 2.0 1.4
Net Exports (c) 4.9 4.5 4.5 3.8
Gross State Product (d) 1.0 3.5 3.0 2.0
Labour Market (%)
Population (a)(e) 1.0 1.3 1.3 1.3
Employment (a) 0.9 1.75 1.5 0.1
Unemployment Rate (f) 6.1 6.0 5.75 6.1
Participation Rate (f) 68.3 68.6 68.2 67.5
Prices (%) (a)
Consumer Price Index 1.3 1.75 1.75 1.3
Wage Price Index 1.6 2.25 2.0 1.7
Perth Median House Price (g) -2.3 1.1 -1.1 -2.5
Other Key Parameters (f)
Exchange Rate $US/$A (cents) 71.5 71.4 68.2 67.1
Iron Ore Price ($US/t) (CFR) 80.4 73.5 85.8 92.9
Iron Ore Volumes (million dry tonnes) 795 837 832 836
Crude Oil Price ($US/barrel) 68.6 67.1 61.8 51.3
Interest Rate Assumptions (%) (f)
Public Bank Account Earnings 2.2 2.1 1.2 1.1
Consolidated Account Borrow ings 3.1 3.0 2.8 2.8
Actual
2019-20
ActualBudget Estimate
MYRRevision

Financ ia l Resu l t s
5
Results Compared to Estimated Outturn
General Government Sector
Operating Statement
The general government sector recorded a $1.7 billion operating surplus in 2019-20, the second consecutive surplus after four years of operating deficits. The 2019-20 outcome was $920 million lower than estimated in the Mid-year Review, reflecting lower than projected revenue (down $390 million) and higher than expected expenses (up $529 million).
Table 3 GENERAL GOVERNMENT
Operat ing Statement
Note: Columns/rows may not add due to rounding.
2018-19Budget MYR Variation
Actual Estimate Revision Actual on MYR$m $m $m $m $m
(1) (2) (3) (4)=(3)-(2)REVENUETaxation 8,616 9,088 9,011 9,077 66 Current grants and subsidies 10,210 9,607 9,573 9,379 -194 Capital grants 873 943 980 642 -339 Sales of goods and services 2,734 2,724 2,796 2,754 -42 Interest income 168 160 148 124 -24 Revenue from public corporations
Dividends 1,350 1,203 1,334 392 -942 Tax equivalent income 642 641 628 732 103
Royalty income 6,713 6,375 7,505 8,450 945 Other 701 594 577 614 37 Total 32,006 31,334 32,553 32,162 -390
EXPENSESSalaries 12,269 12,520 12,595 12,887 293 Superannuation
Concurrent costs 1,213 1,228 1,242 1,276 34 Superannuation interest cost 135 138 79 89 10
Other employee costs 447 234 350 401 51 Depreciation and amortisation 1,445 1,865 1,852 1,751 -101 Services and contracts 2,538 2,751 2,877 2,590 -287 Other gross operating expenses 5,645 5,704 5,035 5,391 356 Interest
Interest on leases 89 194 168 142 -27 Other interest 859 811 745 737 -8
Current transfers 5,426 4,123 4,778 5,003 225 Capital transfers 625 235 243 228 -16 Total 30,689 29,801 29,964 30,493 529
NET OPERATING BALANCE 1,317 1,533 2,589 1,669 -920
2019-20

2019-20 Annual Report on State F inances
6
Key changes to the general government sector operating surplus for 2019-20 relative to the estimated outturn in the Mid-year Review are shown in the following table. Detail of key movements between the original 2019-20 Budget and the final outcome is available in Appendix 4 of this report.
Table 4
SUMMARY OF GENERAL GOVERNMENT REVENUE AND EXPENSE VARIATIONS SINCE THE 2019-20 MID-YEAR REVIEW
Note: Column may not add due to rounding.
$mNET OPERATING BALANCE - 2019-20 MID-YEAR REVIEW 2,589RevenueTaxation, comprising:
- Payroll tax -139.2- Total duty on transfers 146.1- Insurance duty 30.7- Motor vehicle registrations 15.5- All other taxes 12.8Sub-Total 65.9
Commonwealth grants, comprising:- GST grants -93.1- North West Shelf grants/condensate compensation -147.9- Health grants 247.0- Transport grants -414.9- All other grants -124.0Sub-Total -532.9
Revenue from public corporations -838.9Royalty income, comprising:
- Iron ore royalties 1,039.7- All other royalty income -95.1Sub-Total 944.6
All other revenue -29.1
TOTAL REVENUE -390.4
Expenses
WA Health 141.2Operating subsidies- Synergy 450.8- Public Transport Authority 38.3Transfer of Crown reserves to local governments 32.1Fire and Emergency Services 19.5Reversal of 2019-20 Budget underspend provision 300.0Fully offset by:Main Roads -323.4Primary Industries and Regional Development -63.7Education -37.4Training and Workforce Development -31.4Jobs, Tourism, Science and Innovation -29.8Justice -23.1Communities- Commonwealth-administered National Disability Insurance Scheme -320.8- State-administered disability services 253.8- Other expenses 57.9All other expenses 65.0
TOTAL EXPENSES 529.2
TOTAL VARIANCE -919.6
NET OPERATING BALANCE - 2019-20 ANNUAL REPORT ON STATE FINANCES 1,669

Financ ia l Resu l t s
7
Revenue
General government revenue in 2019-20 was $32.2 billion, $390 million (or 1.2%) lower than the estimated outturn in the 2019-20 Mid-year Review. This lower outcome mainly reflects the combined impact of:
• higher royalty income (up $945 million), primarily due to a higher benchmark iron ore price (which averaged $US92.9 per tonne through the year relative to the Mid-year Review assumption of $US85.8 per tonne);
• lower revenue from public corporations (down $839 million), largely driven by:
− lower dividend payments from the Water Corporation (down $592 million), Western Power (down $214 million), Pilbara Ports Authority (down $58 million), Fremantle Port Authority (down $29 million) and Southern Ports Authority (down $28 million), primarily reflecting the deferral of 2019-20 interim dividend payments to 2020-21 to reduce the need for new borrowing late in 2019-20 during a period of financial market uncertainty resulting from the COVID-19 pandemic; and
− higher income tax equivalent payments by the Insurance Commission of Western Australia (up $69 million, mainly due to higher than expected investment returns in 2018-19 that resulted in a higher final tax payment in December 2019) and the Water Corporation (up $35 million, largely as a result of increased volumetric water consumption and lower interest expenses);
• lower grants from the Commonwealth (down $533 million), largely reflecting:
− lower transport-related grants (down $329 million), mainly due to:
the retiming from 2019-20 to later years of road and METRONET project funding, including for Armadale Road Bridge - North Lake Road Flyover, Roe Highway - Kalamunda Road, Great Northern Highway - Muchea to Wubin and Kwinana Freeway - Russell to Roe (down $147 million); and
the inclusion in the 2019-20 Mid-year Review of retimed infrastructure grants expected under new Australian accounting standard AASB 15: Revenue from Contracts With Customers ($200 million) which did not emerge following clarification of the application of the new standard for 2019-20 annual reporting;
− higher health-related grants (up $247 million), mainly due to funding received under the National Partnership Agreement for COVID-19 Response, reflecting the Commonwealth’s financial contribution to increase the capacity of the health system to effectively respond to the COVID-19 pandemic, and increased funding under the National Health Reform Agreement following the annual reconciliation of prior year activity;
− lower North West Shelf grants, including Commonwealth compensation for crude oil excise arrangements (down $148 million), largely due to lower than forecast oil prices (benchmark Brent crude averaged $US51.3/bbl compared to the $US61.8/bbl Mid-year Review assumption) and lower Liquefied Natural Gas (LNG) prices;

2019-20 Annual Report on State F inances
8
− lower GST grants (down $93 million), mainly due to reduced national GST collections, in line with the Commonwealth’s forecast for the GST pool in its December 2019 Mid-Year Economic and Fiscal Outlook (further downward revisions as a result of the COVID-19 pandemic are expected to be made in arrears as an offset to the 2020-21 GST grant throughout 2020-21);
− lower transport-related recurrent grants (down $86 million), primarily reflecting timing of spending on remote projects including Tanami Road, Outback Way and Duncan and Gordon Downs Road, due in part to COVID-19 restrictions; and
− lower ‘other’ Commonwealth grants (down $124 million), mostly due to movement in the timing of National Partnership grants now expected to be received in later years; and
• higher taxation revenue (up $66 million), mainly due to:
− higher total duty on transfers (up $146 million), primarily reflecting a higher than forecast value of large one-off commercial transactions, the number and value of which tend to be infrequent and volatile;
− lower payroll tax (down $139 million), largely due to the Government’s payroll tax waiver for small to medium businesses from March to June 2020, an exemption for JobKeeper payments, and softer underlying labour market conditions due to the COVID-19 pandemic;
− higher insurance duty (up $31 million), consistent with increases in the volume and prices of dutiable insurance products and an unexpected lump sum payment received in January 2020; and
− higher motor vehicle registrations (up $16 million), largely due to an increase in the number of registrations for both light and heavy vehicles.
After adjustment for accounting standards changes, general government revenue increased by 5.9% (or $1.8 billion) relative to 2018-19.
Figure 1 GENERAL GOVERNMENT REVENUE ( a )
Annual Growth Components of Growth 2009-10 to 2019-20 2019-20 re lat ive to 2018-19
(a) Prior years adjusted for accounting changes for comparability.
5.9
-5
0
5
10
15
2010-11 2013-14 2016-17 2019-20
%
Decade average = 5.1% Iron ore
royalties $1,687m
Revenue from public
corporations-$868m
Taxation$460m
GST floor grant$380m
GST grants$267m
All other-$132m
-1,000
0
1,000
2,000
3,000$ Million
Total Increase = $1.8b

Financ ia l Resu l t s
9
Royalties, taxation and other own-source revenue accounted for just over two thirds of general government revenue in 2019-20, with the remaining almost one third comprised of Commonwealth grants (including the GST grant and Western Australia’s GST floor grant3, which together comprised 13.3% of total revenue in 2019-20).
Expenses
General government expenses totalled $30.5 billion in 2019-20, $529 million (or 1.8%) higher than the estimated outturn in the 2019-20 Mid-year Review. This higher outcome primarily relates to additional spending associated with the COVID-19 pandemic response, and includes:
• WA Health (up $141 million), mainly due to higher salaries (as the sector responded to the pandemic) and additional COVID-19 related expenditure (funded by both the State and the Commonwealth as part of the National Partnership on COVID-19 Response); and
• higher operating subsidies for:
− Synergy (up $451 million), mainly reflecting the funding of COVID-19 support and stimulus measures, including the Small Business and Charity Tariff Offset and one-off doubling of the Energy Assistance Payment. The higher than expected subsidy also funded a range of revenue shortfalls for costs for initiatives that Synergy is unable to recover, including in relation to the Tariff Equalisation Contribution, Renewable Energy Buyback Scheme and Feed-in Tariff scheme; and
− the Public Transport Authority (up $38 million), largely due to foregone revenue as a result of the impact of the COVID-19 pandemic on public transport patronage, and increased cleaning on the public transport fleet and facilities to reduce the risk of virus transmission.
Other material increases since the 2019-20 Mid-year Review include:
• higher than expected transfers of reserves by the Department of Planning, Lands and Heritage to various local governments (up $32 million), for care, management and control through Management Orders; and
• Fire and Emergency Services (up $20 million), primarily reflecting expenditure associated with bushfire suppression and natural hazard incidents.
3 Western Australia’s GST floor grant totalled $1,248 million for 2019-20 and reflects the difference between the
Commonwealth Grants Commission recommended GST relativity equivalent to 51.8% of the State’s population share of national GST collections, and the Commonwealth Government’s agreement with Western Australia for a 70% relativity floor. Of the total grant, the Commonwealth paid $434 million in April 2019 with the remaining $814 million received in 2019-20.

2019-20 Annual Report on State F inances
10
The 2019-20 Mid-year Review (and the original 2019-20 Budget) included a $300 million global provision for anticipated agency recurrent underspending for the year, based on the average recurrent underspend for the general government sector over the past five years. Actual outcomes for the following agencies more than offset this provision:
• Main Roads (down $323 million), mainly reflecting the reclassification of recurrent maintenance expenditure to capital investment, lower spending on grants for flood damage and on local government road works, underspending on remote road projects (partially due to COVID-19 regional travel restrictions) and lower depreciation and asset transfer expenses;
• Primary Industries and Regional Development (down $64 million), largely due to delays in various Royalties for Regions projects such as the Regional Telecommunications Project, State Agricultural Telecommunication Infrastructure Fund, Regional Development Leverage Unit and the Regional Aged Accommodation Program, reflecting later than expected submission of project proposals by proponents, travel restrictions during the COVID-19 pandemic, and grant recipients being unable to meet milestones and financial obligations due to the pandemic;
• Education (down $37 million), primarily due to the retiming of some maintenance expenditure from 2019-20 to 2020-21;
• Training and Workforce Development (down $31 million), largely reflecting a reduction in grants to training providers, due to lower than forecast training enrolments partly as a result of the onset of the pandemic;
• Jobs, Tourism, Science and Innovation (down $30 million), mainly due to lower tourism marketing and events expenditure as a result of COVID-19;
• Justice (down $23 million), mainly reflecting lower than forecast participation in the National Redress Scheme for Institutional Child Sexual Abuse and lower than expected services and contracts expenses, partly offset by higher salaries; and
• Communities (down $9 million), largely reflecting the combined impact of:
− lower payments to the National Disability Insurance Agency for the Commonwealth-administered National Disability Insurance Scheme (NDIS) (down $321 million), as a result of the slower than expected transition of State clients into the NDIS;
− higher spending for State-administered disability services (up $254 million), as a result of the continued provision of State-administered services to clients prior to their transition to the NDIS; and
− higher grants payments (up $34 million), primarily as a result of increased demand for front line child protection services, as well as high needs and specialised placements for children in care, and subsidy payments related to the COVID-19 response.
Adjusting 2018-19 data for the impacts of new accounting standards, growth in expenses was 5% in 2019-20, up from the Mid-year Review estimate of 3.1%. The increase mainly reflects additional spending in relation to the COVID-19 pandemic response, particularly by WA Health, Synergy and the Public Transport Authority.

Financ ia l Resu l t s
11
Figure 2 EXPENSE GROWTH ( a )
General Government Sector
(a) Prior years adjusted for accounting changes for comparability.
5.0
-2
0
2
4
6
8
10
12
14
2009-10 2011-12 2013-14 2015-16 2017-18 2019-20
%
Decade average = 4.8%

2019-20 Annual Report on State F inances
12
Figure 3 GENERAL GOVERNMENT EXPENSES ( a ) ( b )
2019-20
(a) Segments may not add due to rounding. (b) Excludes valuation decrement expenses brought to account in some agencies. Valuation changes represent the impact of accounting
remeasurement of assets and/or liabilities on the balance sheet and are not a recurrent cost of providing services or a component of general government expense transactions.
(c) The $2.5 billion for the Department of Communities in this chart represents the general government portion of the Department’s recurrent spending (with some expenditure from the former Housing Authority remaining within the public non-financial corporations sector for the purposes of whole-of government reporting).
(d) Rail component reflects operating subsidies paid to the Public Transport Authority.
At 42%, salaries expenditure remains the single largest component of general government recurrent spending in 2019-20. Growth in salaries expenditure in 2019-20 was 5%, up slightly on the average growth of 4.7% per annum over the last decade.
Health$9,370m
31%
All Other$5,210m
17%
Transport, Roads and Rail (d)
$2,706m9%
Communities (c)
$2,527m8%
Consolidated Account Interest
Costs$695m
2%
Law and Order$3,219m
10%
Training$558m
2%
Education$5,359m
18%Electricity Subsidies
$610m2%
Water Subsidies$241m
1%
TOTAL$30,493m

Financ ia l Resu l t s
13
Balance Sheet
The net worth4 of the general government sector (i.e. the value of total assets less total liabilities) increased by $1.8 billion between 30 June 2019 and 30 June 2020, to stand at $102.4 billion. This was $500 million higher than anticipated at the time of the 2019-20 Mid-year Review, mainly reflecting the net impact of:
• higher holdings of financial assets (up $1.6 billion), largely due to higher than expected liquid financial asset holdings (up $749 million, mainly for the Public Bank Account), and higher than expected receivables (up $635 million, mainly reflecting the timing of mining royalty receipts);
• lower general government sector holdings of non-financial assets (down $566 million), due largely to lower than forecast valuations of land under roads. Partly offsetting this decrease were small increases in other categories of non-financial assets, including property, plant and equipment, right-of-use assets (representing the value of leased assets under AASB 16) and biological assets; and
• higher liabilities (up $541 million), mainly higher borrowings (up $760 million) and higher deposits held on behalf of third parties (up $521 million), partially offset by lower than estimated ‘other’ liabilities (down $787 million, largely due to the inclusion in the 2019-20 Mid-year Review of liabilities expected under AASB 15: Revenue from Contracts With Customers which did not emerge following clarification of the application of the new standard for 2019-20 annual reporting).
Further information on the general government sector balance sheet position relative to the original 2019-20 Budget forecasts can be found in Appendix 4: Comparison of Final Outcomes to Original Budget for the Year Ending 30 June 2020.
Cash Flow Statement
A cash surplus of $2.1 billion was recorded for the general government sector in 2019-20, the first such surplus since 2007-08, and a $2.6 billion turnaround on the 2018-19 cash deficit result. This outcome is $1.2 billion lower than estimated in the 2019-20 Mid-year Review, primarily reflecting lower net cash from operating activities (down $1.1 billion)5, representing the impact on cash of the weaker than expected operating surplus discussed earlier in this chapter.
The cash surplus outcome included $1.41 billion in proceeds from the partial commercialisation of Landgate, received in October 2019.
4 Net worth represents the difference between total assets and total liabilities. Net worth of the total public sector is
equivalent to general government sector net worth. This is because the net worth of the public corporations sectors is recorded as an asset on the general government sector balance sheet.
5 The net cash flow from operating activities is the cash equivalent of the operating balance on the operating statement discussed earlier in this chapter. This cash flow aggregate is based on cash information only while the accrual operating balance includes non-cash transactions such as depreciation charges, and recognises costs (expenses) and benefits (revenue) as they occur rather than when cash is paid or received.

2019-20 Annual Report on State F inances
14
Total Public Sector 6
Summary
Reflecting modest improvements in each of the public corporations sectors, and the general government result noted earlier in this chapter, the total public sector operating balance was $194 million higher than estimated in the 2019-20 Mid-year Review.
Stronger cash results more than offset the implementation of AASB 16: Leases and other movements in the balance sheet to deliver a $724 million lower than expected outcome for total public sector net debt at 30 June 2020.
The following table summarises the key financial aggregates for the total public sector.
Table 5 TOTAL PUBLIC SECTOR
Summary Financia l Aggregates
Note: Columns may not add due to rounding.
6 The total public sector consolidates the general government, public non-financial corporations and public financial
corporations sectors. The total public sector is also known as the whole-of-government. Detailed financial disclosures for each of these sectors are contained in Appendix 1: Financial Statements.
2018-19Budget MYR Variation
Actual Estimate Revision Actual on MYR$m $m $m $m $m
(1) (2) (3) (4)=(3)-(2)OPERATING STATEMENTRevenue 51,214 62,297 66,136 65,706 -430 Expenses 50,498 61,203 64,283 63,659 -624 Net Operating Balance 716 1,094 1,853 2,047 194
BALANCE SHEETAssets 186,610 189,051 192,144 200,161 8,017 Liabilities 86,017 85,073 90,207 97,723 7,516 Net Worth 100,593 103,978 101,938 102,438 500
CASH FLOW STATEMENTChange in net cash held -1,863 -311 560 2,284 1,724 Cash surplus/-deficit -924 -248 1,961 2,217 257
Memorandum Item: Net Debt 35,462 39,531 36,173 35,449 -724
2019-20

Financ ia l Resu l t s
15
Operating Statement
The total public sector recorded a $2 billion operating surplus for 2019-20. Excluding dividend transfers (which are counted as revenue in the general government sector), this $194 million improvement on the surplus estimated in the 2019-20 Mid-year Review largely reflects better than expected results for the public non-financial corporations (PNFC) sector and public financial corporations (PFC) sector (up $87 million and $100 million respectively).
Table 6 TOTAL PUBLIC SECTOR OPERATING BALANCE
By Sector
(a) Dividends received from Keystart (a PFC) by the Housing Authority (a PNFC). (b) Depreciation costs incurred by agencies for right of use assets leased from other agencies within the same sub sector of government
are eliminated directly on consolidation. Equivalent costs between internal sectors of government contribute to expenses (and the operating balance) in the sector in which the lessee is classified, but is not matched by a ‘depreciation revenue’ by the sector in which the lessor is classified. This gives rise to an adjustment against equity for this unmatched internal cost when consolidating the total public sector.
Note: Columns/rows may not add due to rounding.
Public Non-Financial Corporations (PNFCs)
An operating surplus of $621 million was recorded in the PNFC sector in 2019-20, $87 million higher than estimated in the 2019-20 Mid-year Review. Revenue was $221 million (or 0.6%) lower than expected, while expenses were $308 million (or 0.8%) lower, primarily reflecting the net impact of:
• higher revenue (up $442 million) and expenses (up $423 million) for Synergy, largely driven by:
− operating subsidies provided to Synergy to:
meet the cost of COVID-19 stimulus measures (the Small Business and Charity Tariff Offset and a one-off doubling of the Energy Assistance Payment); and
2018-19Budget MYR Variation on
Actual Estimate Revision Actual MYR$m $m $m $m $m
(1) (2) (3) (4)=(3)-(2)
Net Operating BalanceGeneral government sector 1,317 1,533 2,589 1,669 -920 Public non-financial corporations sector 648 639 534 621 87 Public f inancial corporations sector 161 128 109 208 100
lessGeneral government dividend revenue 1,350 1,203 1,334 392 -942 Public non-financial corporations dividend
revenue (a) 61 57 70 63 -8 Agency depreciation costs on right of use assets
leased from other government sectors (b) - -54 -26 -3 23
Total public sector net operating balance 716 1,094 1,853 2,047 194
2019-20
2019-20 Annual Report on State F inances
16
fund a range of revenue shortfalls for costs that cannot be recovered including those associated with the Tariff Equalisation Contribution, Renewable Energy Buyback Scheme and Feed-in Tariff Scheme; and
− a higher than expected electricity cost of supply, including the impact of higher renewable energy obligations;
• lower revenue (down $424 million) and expenses (down $444 million) for the Gold Corporation, mainly reflecting marginally lower than anticipated metal volumes;
• lower revenue (down $202 million) and expenses (down $216 million) for Racing and Wagering Western Australia, primarily reflecting lower betting turnover, broadly matched by lower betting dividend payouts and other direct costs of sales due to the temporary closure of the retail network and reduction in sporting events during the COVID-19 pandemic;
• lower revenue (down $90 million) and expenses (down $54 million) for the Department of Communities (Housing Services), primarily due to:
− lower sales from the Affordable Housing Program, with a largely equivalent reduction in related expenses, due to softening market conditions and impacts of the COVID-19 pandemic;
− lower than forecast rent revenue from the Department’s housing portfolio; and
− movements in remote communities spending due to restrictions related to COVID-19, resulting in a slowdown in works;
• higher revenue (up $69 million) and expenses (up $71 million) for Lotterywest, primarily reflecting increased sales broadly matched by increased cost of goods sold, COVID-19 assistance to retailers ($15 million) and the reallocation of existing grants and additional new grants ($18 million) associated with the Lotterywest COVID-19 Relief Fund. Increased sales resulted in higher statutory grants to the health, arts and sports sectors (up $10 million);
• lower revenue (down $41 million) and expenses (down $36 million) for the Public Transport Authority, mainly reflecting the impact of the COVID-19 pandemic on Transperth and Transwa patronage, parking, and advertising revenues, and lower debt servicing costs due to lower than forecast interest rates and changes in the timing of asset investment spending; and
• lower revenue (down $35 million) and expenses (down $33 million) for DevelopmentWA, mainly reflecting a reduction in development contributions expense as a result of achieving exit outcomes in metropolitan precincts and delays in various regional projects, and underspends in other projects including Subi East and East Perth Power Station.
Public Financial Corporations
An operating surplus of $208 million was recorded by the PFC sector in 2019-20, $100 million stronger than the estimate in the 2019-20 Mid-year Review.

Financ ia l Resu l t s
17
This outcome was largely driven by the net impact of:
• lower revenue (down $156 million) and expenses (down $219 million) for the Western Australian Treasury Corporation, primarily due to the revenue and expense impact of lower interest rates;
• lower expenses (down $87 million) for the Insurance Commission of Western Australia, mainly due to a lower value of insurance claims to 30 June 2020 (arising from a decline in the forecast inflation rate), partially offset by higher tax expenses as a result of stronger profitability; and
• higher revenue (up $38 million) and expenses (up $51 million) for RiskCover, largely due to increased premiums, increases in the numbers of large claims and workers’ compensation costs.
Asset Investment
Infrastructure spending by the total public sector totalled $5.2 billion in 2019-20, $457 million lower than estimated in the 2019-20 Mid-year Review.
Both the general government sector and public corporations each spent $2.6 billion (or 50%) of the State’s Asset Investment Program (AIP) in 2019-20, with major areas of investment in roads and public transport ($1.9 billion), electricity ($971 million), water ($635 million), and schools ($428 million).

2019-20 Annual Report on State F inances
18
Figure 4 2019-20 ASSET INVESTMENT PROGRAM
Total Publ ic Sector
Note: Segments may not add due to rounding.
A significant factor in delivery of the 2019-20 AIP was the onset of the COVID-19 pandemic. Relative to the 2019-20 Mid-year Review, the lower than expected agency AIP outcomes in 2019-20 largely reflect the impact of the following changes:
• Public Transport Authority (including separate provisions for METRONET projects under development, down $434 million), primarily due to scheduling delays impacted by the COVID-19 pandemic for the Yanchep Rail Extension and Thornlie-Cockburn Link, the Railcar Program, and the Radio Systems Replacement project;
• WA Health (down $157 million), reflecting delays and timing changes associated with project design activity and procurement processes, mainly in relation to the Medical Equipment Replacement Program, Fiona Stanley Hospital (capital costs for information technology replacement), Perth Children’s Hospital (development and ICT projects), the Quadriplegic Centre Redevelopment, the Newman Health Service Redevelopment and other minor building works;
• DevelopmentWA (down $124 million), largely due to the impact on the Authority’s land development activities following reduced demand for land and softening in the land and property development market across the regional, metropolitan and industrial programs;
Public Transport Authority$642m13%
Other agencies$824m16%
DevelopmentWA$166m
3%
Education$428m
8%
Water Corporation$635m12%
Health$152m
3%
Electricity utilities$971m19%
Communities$113m
2%
Main Roads$1,256m
24%
TOTAL$5,188m

Financ ia l Resu l t s
19
• Communities (Housing Services), down $103 million, primarily due to continued soft housing market conditions and the COVID-19 pandemic which has impacted the agency’s land development and construction activities;
• Education (down $72 million), mainly reflecting the net impact of changes to timing of capital works expenditure to match construction progress across a number of projects including Harrisdale North Primary School, Balcatta Senior High School and the Infrastructure Power Upgrades program, combined with timing changes in the land acquisition program;
• Fremantle Port Authority (down $63 million), mainly for Land Acquisition at North Quay, plant and equipment purchases, the replacement of assets and minor works reflecting changes in port user requirements, the reprioritisation of projects, and delays due to COVID-19;
• Water Corporation (down $60 million), primarily driven by the deferral and reprofiling of capital projects impacted by the COVID-19 pandemic, and delays in approvals and resolving contractual issues;
• Finance (down $36 million), largely due to underspends in office accommodation fit-outs including new public sector offices in Fremantle, and lower vehicle purchases through State Fleet;
• Justice (down $29 million), mainly due to timing changes in relation to various projects including Greenough Prison Female Unit, Casuarina Prison Expansion Stage 2, Casuarina Security System Upgrade and Supreme Court Building Upgrades;
• Main Roads (down $25 million), mainly due to revised project schedules, partially offset by the capitalisation of some spending previously expected to be expensed;
• Western Power (down $24 million), largely due to COVID-19 pandemic impacts, and contractor and approval delays impacting various projects including the conductor management program and the State Underground Power Program;
• Primary Industries and Regional Development (down $24 million), primarily due to delays with spending on core systems and information management systems following slower than expected progress with finalising tender contracts. The Department’s Kensington site laboratory upgrades have been deferred pending the finalisation of revised planning and scope for the project. COVID-19 restrictions also delayed expenditure across various Royalties for Regions projects;
• Fire and Emergency Services (down $23 million), mainly due to delays in releasing tenders and awarding contracts, and from COVID-19 impacts including regional boundary and non-essential travel restrictions;
• Synergy (up $21 million), mainly due to higher than expected expenditure on Kwinana Power Station site rehabilitation works, refurbishment of the cooling tower at Collie Power Station and higher capital works that Synergy undertook on behalf of Western Power in accordance with a network control service arrangement between the entities;

2019-20 Annual Report on State F inances
20
• Western Australia Police Force (down $19 million), mainly due to delays in spending across a number of projects including the Armadale Courthouse and Police Complex, Capel Police Station, Multifunctional Police Facility Heating, Ventilation and Air-conditioning Systems Replacement, and the Helicopter Replacement Project;
• Horizon Power (down $15 million), largely due to delays arising from supplier deliveries, Cyclone Damien and the COVID-19 pandemic; and
• the inclusion in the 2019-20 Mid-year Review of an $858 million underspend provision for the total public sector in anticipation of lower actual spending that would emerge for infrastructure projects by 30 June 2020. This provisioned underspend was in anticipation of the financial impact of the agency movements noted above.

Financ ia l Resu l t s
21
The following table summarises the material agency movements in infrastructure investment for 2019-20 across the total public sector.
Table 7 INFRASTRUCTURE INVESTMENT
Balance Sheet
The net worth of the total public sector is identical to that of the general government sector (discussed earlier). This is because the net worth of public corporations is recorded as an asset on the general government sector balance sheet.
2018-19Budget MYR Variation
Actual Estimate Revision Actual on MYR$m $m $m $m $m
(1) (2) (3) (4)=(3)-(2)
General GovernmentCommissioner of Main Roads 1,281 1,265 1,281 1,256 -25 Education 417 453 500 428 -72 WA Health 205 340 309 152 -157 Finance 93 139 164 128 -36 Local Government, Sport and Cultural Industries 136 95 127 114 -14 Justice 74 110 135 106 -29 Primary Industries and Regional Development 16 46 37 13 -24 Western Australia Police Force 59 87 81 62 -19 Fire and Emergency Services 30 51 57 33 -23 Royalties for Regions underspending
provision - -30 -28 - 28 Provision for Asset Investment Program
Underspending and Slippage - -350 -415 - 415 All Other 228 299 314 260 -54 Total General Government 2,540 2,505 2,563 2,553 -10 Public CorporationsWestern Pow er 672 850 856 832 -24 Public Transport Authority 417 1,169 1,017 642 -375 METRONET Projects Under Development - 61 60 - -60 Water Corporation 658 700 695 635 -60 DevelopmentWA 144 246 290 166 -124 Port Authorities 204 139 220 132 -88 Communities (Housing Services) 154 216 213 111 -103 Horizon Pow er (Regional Pow er Corporation) 80 62 87 72 -15 Synergy (Electricity Generation and Retail 69 41 47 68 21 Provision for Asset Investment Program
Underspending and Slippage - -350 -415 - 415 All Other 50 69 93 29 -63 Total Public Corporations 2,448 3,203 3,162 2,687 -476
Internal purchases betw een sectors -24 -61 -79 -51 28 TOTAL PUBLIC SECTOR 4,965 5,646 5,646 5,188 -457
2019-20

2019-20 Annual Report on State F inances
22
Cash Flow Statement
A total public sector cash surplus of $2.2 billion was recorded for 2019-20, a $257 million improvement on the 2019-20 Mid-year Review forecast. This represents a substantial $3.1 billion turnaround on the $924 million cash deficit recorded in 2018-19, and is the first cash surplus result since 2007-08. The cash surplus includes $1.41 billion in proceeds from the partial commercialisation of Landgate (received in October 2019).
At $5.7 billion, net cash flows from operating activities were $52 million higher than estimated in the 2019-20 Mid-year Review. This reflects the weaker than expected cash operating outcomes for the general government sector discussed earlier (down $1.1 billion) and a softer cash operating outturn for the PFC sector (down $238 million), partially offset by higher cash outcomes in the PNC sector (up $478 million).
Net cash flows from infrastructure spending were $3.5 billion in 2019-20 (down $205 million relative to the 2019-20 Mid-year Review). This included $457 million in lower than expected spending on the State’s Asset Investment Program, partially offset by lower sales of non-financial assets (down $253 million, mainly due to lower land sales reflecting property market conditions).
Net Debt 7
Total public sector net debt at 30 June 2020 totalled $35.4 billion, $724 million lower than estimated in the 2019-20 Mid-year Review. This largely reflects the lower than expected Asset Investment Program and lower than expected lease liabilities (following implementation of AASB 16: Leases this year), along with other net changes to gross debt and liquid financial assets.
Net debt at 30 June 2020 was largely unchanged from the outcome reported in the 2018-19 ARSF. This follows over a decade of annual increases averaging $2.7 billion. Relative to 30 June 2019, the improving general government sector financial outlook (including the cumulative impact of recent Budget repair measures and higher than expected revenue from iron ore royalties) largely offset the impact of bringing the broader definition of leases to book as borrowings as a result of implementing AASB 16.
7 Net debt consists of the State’s gross debt liabilities (including borrowings, deposits held, leases, etc.), less cash
and other liquid assets (cash holdings and investments, loans and advances by government to other sectors, etc.).

Financ ia l Resu l t s
23
Figure 5 NET DEBT AT 30 JUNE
Total Publ ic Sector
General government sector net debt increased by $767 million during 2019-20, while net debt for the public corporations sectors decreased by $781 million. The proportion of net debt held by the general government sector increased from 64.8% at 30 June 2019 to 67% at 30 June 2020.
State borrowings held by the Consolidated Account reduced by $540 million during 2019-20, with $1.3 billion repaid through the Debt Reduction Account, partially offset by new borrowings undertaken as the COVID-19 pandemic commenced ($777 million). The $1.3 billion repayment of debt was sourced from the State’s GST floor grant for 2019-20 (totalling $1.2 billion) and surplus funds returned to the Consolidated Account by RiskCover ($69 million).
-5
0
5
10
15
20
25
30
35
40
2009 2010 2011 2012 2013 2014 2015 2016 2017 2018 2019 2020
General Government Public Corporations Total Public Sector
$ Billion

2019-20 Annual Report on State F inances
24
Table 8 TOTAL PUBLIC SECTOR NET DEBT
At 30 June
(a) Consists mainly of Special Purpose Accounts (such as the Royalties for Regions Fund and the Western Australian Future Fund) and
other cash investments. (b) Includes the Insurance Commission of Western Australia which holds significant liquid financial assets for the future payment of non-debt
insurance claims. (c) The increase in 2020 reflects the recognition of lease liabilities across the remainder of the public sector (net debt for the agencies listed
above includes lease remeasurements under AASB 16).
2019 2020$m $m
Consolidated Account borrow ings 25,966 25,426Other Public Bank Account net assets (a) -3,466 -4,158Western Pow er 7,383 7,587Water Corporation 6,177 5,623Public Transport Authority 1,924 1,834Horizon Pow er 934 930Housing Authority 639 663Public f inancial corporations (b) -4,340 -4,409All other (c) 245 1,953
Total Public Sector Net Debt at 30 June 35,462 35,449

Financ ia l Resu l t s
25
The table below reconciles movements in net debt at 30 June 2020 since the 2019-20 Mid-year Review.
Table 9
SUMMARY OF TOTAL PUBLIC SECTOR NET DEBT VARIATIONS SINCE THE 2019-20 MID-YEAR REVIEW
(a) Includes changes to lease liabilities, other valuation changes to applicable assets and liabilities, movements in nature of asset classes
(which includes changes in the mix of assets that contribute to the calculation of net debt and asset classes outside the debt calculation), restatement of agency net debt assets/liabilities, net acquisition of financial assets for liquidity purposes, etc. These transactions have no associated cashflow reflected in other items in this table. Lease valuations following adoption of AASB 16: Leases for the first time in 2019-20 are largely matched by changes in (non-debt) related right to use assets, and have no material operating or infrastructure cash flows reflected in other items in this table.
Note: Column may not add due to rounding.
$mNET DEBT AT 30 JUNE 2020 - 2019-20 MID-YEAR REVIEW 36,173
Less change in net cash flows from operating activities and dividends paid- General government -1,111.9- Public non-financial corporations 1,417.0- Public financial corporations -211.6Total 93.5
Plus purchases of non-financial assetsPublic Transport Authority -374.8METRONET Projects Under Development -59.6WA Health -156.7DevelopmentWA -123.9Communities (Housing Services) -102.7Port Authorities -88.2Education -72.0Water Corporation -59.9Finance -35.6Justice -29.3Commissioner of Main Roads -25.2Western Power -24.1Provision for Asset Investment Program Underspending and Slippage 830.0All other -135.3
Total purchases of non-financial assets -457.3
Less proceeds from sale of non-financial assetsCommunities (Housing Services) -119.4DevelopmentWA -71.2All other -62.0
Total proceeds from sale of non-financial assets -252.6
Plus: all other financing transactions (a) -426.1
Cumulative impact on net debt at 30 June -724
NET DEBT AT 30 JUNE 2020 - 2019-20 ANNUAL REPORT ON STATE FINANCES 35,449

2019-20 Annual Report on State F inances
26
Financial Targets
The Government Financial Responsibility Act 2000 requires that the Government report on performance against its medium-term financial targets each year in the Annual Report on State Finances.
The targets set out in the Government’s 2019-20 Budget were to:
• progress towards a net operating surplus for the general government sector, measured by a reduction in the operating deficit outcome relative to the previous year;
• progress towards a cash surplus for the total public sector;
• maintain disciplined general government expense management by:
− delivering public sector wages outcomes in line with Government wages policy; and
− ensuring key service delivery agency recurrent spending outcomes are in line with budgeted expense limits in Resource Agreements; and
• reduce the proportion of total public sector net debt held by the general government sector.
Notwithstanding the impact of COVID-19 on the State’s finances towards the end of the financial year, the 2019-20 outturn is consistent with achieving three of the Government’s five financial targets in 2019-20.
The following table summarises outcomes for the Government’s financial targets in 2019-20, with further detail in the section below.
Table 10 2019-20 FINANCIAL TARGETS
Compl iance
BudgetMid-year
Review ActualProgress towards a net operating surplus for the general government sector
- General government net operating balance ($m) 1,533 2,589 1,669- Compliance Yes Yes Yes
Progress towards a cash surplus for the total public sector- Total public sector cash surplus/deficit ($m) -248 1,961 2,217- Compliance Yes Yes Yes
Maintain disciplined general government expense management through:- delivering public sector wages outcomes in line with Government wages policy- Compliance Yes Yes Yes- ensuring key service delivery agency recurrent spending outcomes are in line with budgeted expense limits- Compliance Yes No No
Reduce the proportion of total public sector net debt held by the general government sector
- General government net debt as a share of TPS net debt (%) 70.1 64.3 67.0- Compliance No Yes No

Financ ia l Resu l t s
27
Performance Against Financial Targets
Progress Towards a Net Operating Surplus 8 for the General Government Sector
This target was met in 2019-20, with the general government sector recording its second consecutive operating surplus after four years of operating deficits. An operating surplus of $1.7 billion was recorded in 2019-20.
The 2019-20 outcome is $920 million lower than the $2.6 billion estimate included in the 2019-20 Mid-year Review, reflecting lower revenue and higher recurrent spending as a result of the State’s immediate response to the COVID-19 pandemic.
Figure 6 NET OPERATING BALANCE General Government Sector
8 The net operating balance is an accrual-based measure of the day to day operations of the general government sector
(excluding capital spending on infrastructure). An operating surplus indicates that the Government can deliver day to day services sustainably, financing them using revenue generated in that financial year.
-3,000
-2,000
-1,000
0
1,000
2,000
3,000
2011-12 2013-14 2015-16 2017-18 Budget Actual2019-20
$ Million
MYR

2019-20 Annual Report on State F inances
28
Progress Towards a Cash Surplus for the Total Public Sector 9
This target was met in 2019-20, with the $2.2 billion cash surplus being the State’s first such surplus since 2006-07.
The cash surplus outcome in 2019-20 represents a $3.1 billion turnaround on the 2018-19 result (a $924 million deficit), and includes $1.41 billion in proceeds from the partial commercialisation of Landgate. The result is a slight improvement on the $2 billion cash surplus estimated in the Mid-year Review, mainly reflecting lower than expected asset investment spending.
Figure 7 CASH SURPLUS/DEFICIT
Total Publ ic Sector
9 The cash surplus/deficit of the total public sector is a broad measure of financial performance, taking into account the
impact of both operating and investing activities across all sectors of government. It provides a comprehensive indication of the public sector’s borrowing requirement.
-6,000
-5,000
-4,000
-3,000
-2,000
-1,000
0
1,000
2,000
3,000
2009-10 2011-12 2013-14 2015-16 2017-18 Budget Actual
2019-20
$ Million
MYR

Financ ia l Resu l t s
29
Maintain Disciplined General Government Expense Management
This target was partially met in 2019-20. While wage outcomes were in line with the Government’s wages policy, three of the sector’s top spending agencies exceeded budgeted expense limits by more than 2%.
Deliver public sector wages outcomes in line with Government wages policy
Although a small number of agreements that expired in 2019-20 remain under negotiation, those agreements that have settled, or have been agreed in-principle in the year to 30 June 2020, were all in line with the Government’s wages policy (limiting annual increases in wages to $1,000).
Table 11 INDUSTRIAL AGREEMENTS ( a ) ( b )
(a) Employee numbers sourced from each current agreement. (b) Agreements covering 300 or more employees. (c) Covers multiple employee groups across a number of agencies.
Ensure key service delivery agency recurrent spending outcomes are in line with budgeted expense limits in Resource Agreements
This target is met when the 15 largest appropriation-funded agencies remain within 2% of their approved expense limits for the financial year. While the majority of these agencies achieved spending outcomes in line with, or significantly below, the target expense limits, three agencies exceeded the threshold, meaning the target was not met in 2019-20.
Agreement Employees Expiry Date StatusExpired in 2018-19Enrolled Nurses 2,100 6 Oct 2018 Agreement registered in Jul 2019Registered Nurses 15,470 11 Oct 2018 Agreement registered in Apr 2019PTA Salaried Officers 770 25 Oct 2018 Agreement registered in Feb 2019Education Assistants 10,605 31 Dec 2018 Agreement registered in Feb 2019Government Services (Miscellaneous) 4,572 31 Dec 2018 Agreement registered in Feb 2019VenuesWest General Agreement 455 31 Dec 2018 Agreement registered in Mar 2019Perth Theatre Trust Venues Management 300 31 Dec 2018 Agreement registered in May 2019Australian Workers’ Union (c) 500 25 Apr 2019 Agreement registered in Nov 2019Public Service and General Government Officers 31,845 12 Jun 2019 Agreement registered in Nov 2019Disability Services Social Trainers 564 12 Jun 2019 Agreement registered in Jan 2020Insurance Commission (Government Officers) 360 12 Jun 2019 Agreement registered in Jan 2020School Support Officers 4,212 12 Jun 2019 Agreement registered in Feb 2020Western Australia Police Officers 6,442 30 Jun 2019 Undergoing Arbitration
Expired in 2019-20Medical Practitioners 5,225 30 Sep 2019 Under Negotiation
Education - Teachers and Administrators 29,157 5 Dec 2019 Agreement registered in June 2020Main Roads 852 31 Jan 2020 Agreement registered in June 2020TAFE Lecturers 2,521 15 Dec 2019 Agreement registered in Aug 2020Western Australian Fire Service 1,236 9 Jun 2020 Under NegotiationPrison Officers 2,358 10 Jun 2020 Agreed in-principle as at 30 Aug 2020Health Professional, Administrative, Clerical, Technical and Supervisory 16,341 30 Jun 2020 Agreed in-principle as at 30 Aug 2020

2019-20 Annual Report on State F inances
30
Agencies exceeding their approved expense targets in 2019-20 were:
• Finance (up $40 million), primarily due to a change in accounting treatment of accommodation leases, with most agency office accommodation lease expense impacts (under AASB 16: Leases) now reflected directly in the Department’s accounts;
• Fire and Emergency Services (up $20 million), primarily relating to expenditure associated with bushfire suppression and natural hazard incidents; and
• Mines, Industry Regulation and Safety (up $6.3 million) due to an increase in accrued leave and other expenses (such as software licensing and services provided by other government agencies), partially offset by lower industry management costs ($10 million).
Overall, recurrent spending by the general government sector was $529 million (or 1.8%) higher than the estimated outturn in the 2019-20 Mid-year Review.
Table 12 AGENCY RECURRENT SPENDING OUTCOMES ( a )
2019-20
(a) The target is met when agencies’ recurrent spending outcomes are no more than 2% higher than the amount approved for Resource
Agreements for the year. (b) Included in Appendix 7: Public Ledger. (c) Excludes accounting remeasurement expenses brought to account in some agencies. Valuation decrements represent the accounting
remeasurement of assets on the balance sheet and are not a recurrent cost of providing services or a component of general government expenses.
(d) Amount less than $500,000.
Approved Resource
Agreement (MYR)
Functional Transfers
Since Approved Limit (b)
Revised Limit
Unadjusted Agency Outturn
Less Remeasurements
(c)Outcome for Target Variance
$m $m $m $m $m $m %(1) (2) (3)=(2)/(1)
WA Health 9,224 - 9,224 9,424 53.4 9,370 1.6Education 5,328 - 5,328 5,359 - 5,359 0.6Communities 3,351 6.5 3,358 3,305 - 3,305 -1.6Western Australia Police Force 1,610 - 1,610 1,595 - 1,595 -0.9Justice 1,646 - 1,646 1,623 - 1,623 -1.4Public Transport Authority 1,634 - 1,634 1,602 - 1,602 -2.0Finance 1,272 - 1,272 1,312 0.7 1,312 3.1Commissioner of Main Roads 1,550 - 1,550 1,244 - 1,244 -19.7Mental Health Commission 940 - 940 947 - (d) 947 0.7Training and Workforce Development 589 - 589 558 - 558 -5.3Primary Industries and Regional Development 501 -0.4 500 451 3.9 447 -10.7Biodiversity, Conservation and Attractions 404 - 404 618 215.5 402 -0.4Transport 562 - 562 560 - 560 -0.4Fire and Emergency Services 451 - 451 471 - 471 4.4Mines, Industry Regulation and Safety 280 - 280 287 - 287 2.3

Financ ia l Resu l t s
31
Reduce the Proportion of Total Public Sector Net Debt Held by the General Government Sector
This target was not met in 2019-20. The proportion of total public sector net debt held by the general government sector increased to 67% at 30 June 2020, up from 64.8% the previous year.
With total public sector net debt largely unchanged over 2019-20, the increase in the ratio largely reflects an increase in general government sector net debt, which increased by $767 million to $23.8 billion at 30 June 2020. Although the sector recorded a $2.1 billion cash surplus outcome in 2019-20, the increase in net debt is largely the result of the remeasurement of leases (which are reflected as borrowings following implementation of AASB 16: Leases in 2019-20). Abstracting from the impact of the remeasurement of leases, the ratio of general government sector net debt as a share of total public sector net debt would have remained at 64.8%, unchanged from 2018-19.
The largest component of general government sector net debt is State borrowings held by the Consolidated Account. Consolidated Account borrowings were $540 million lower at 30 June 2020 compared with a year earlier.
Figure 8
GENERAL GOVERNMENT NET DEBT AS A PERCENTAGE OF TOTAL PUBLIC SECTOR NET DEBT
At 30 June
-60
-40
-20
0
20
40
60
80
2009 2010 2011 2012 2013 2014 2015 2016 2017 2018 2019 Budget MYR Actual
Percent
2020
Percent

2019-20 Annual Report on State F inances
32
33
A P P E N D I X 1
Financial Statements
Contents Page Introduction .................................................................................................................................. 35 General Government Table 1.1: Operating Statement ........................................................................................................ 36 Table 1.2: Balance Sheet at 30 June ................................................................................................. 37 Table 1.3: Statement of Changes in Equity ....................................................................................... 38 Table 1.4: Cash Flow Statement ....................................................................................................... 39 Public Non-Financial Corporations Table 1.5: Operating Statement ........................................................................................................ 40 Table 1.6: Balance Sheet at 30 June ................................................................................................. 41 Table 1.7: Statement of Changes in Equity ....................................................................................... 42 Table 1.8: Cash Flow Statement ....................................................................................................... 43 Total Non-Financial Public Sector Table 1.9: Operating Statement ........................................................................................................ 44 Table 1.10: Balance Sheet at 30 June ............................................................................................... 45 Table 1.11: Statement of Changes in Equity ..................................................................................... 46 Table 1.12: Cash Flow Statement ..................................................................................................... 47 Public Financial Corporations Table 1.13: Operating Statement ...................................................................................................... 48 Table 1.14: Balance Sheet at 30 June ............................................................................................... 49 Table 1.15: Statement of Changes in Equity ..................................................................................... 50 Table 1.16: Cash Flow Statement ..................................................................................................... 51 Total Public Sector Table 1.17: Operating Statement ...................................................................................................... 52 Table 1.18: Balance Sheet at 30 June ............................................................................................... 53 Table 1.19: Statement of Changes in Equity ..................................................................................... 54 Table 1.20: Cash Flow Statement ..................................................................................................... 55

2019-20 Annual Report on State F inances
34
Contents - continued Page Notes to the Consolidated Financial Statements:
1 Mission Statement - The Government of Western Australia .................................................... 56 2 Statement of compliance .......................................................................................................... 56 3 Summary of significant accounting policies ............................................................................ 57 4 Convergence differences ........................................................................................................... 76 5 Classification of the Functions of Government ........................................................................ 77 6 Operating revenue .................................................................................................................... 79 7 Depreciation and amortisation expense .................................................................................... 79 8 Other gross operating expenses ................................................................................................ 80 9 Other interest ............................................................................................................................ 80
10 Transfer expenses ..................................................................................................................... 81 11 Receivables .............................................................................................................................. 82 12 Land ......................................................................................................................................... 83 13 Other property, plant and equipment ........................................................................................ 84 14 Reconciliation of land and other property, plant and equipment .............................................. 85 15 Fair value measurements .......................................................................................................... 87 16 Right-of-use assets .................................................................................................................... 102 17 Reconciliation of right-of-use assets ......................................................................................... 103 18 Biological assets ....................................................................................................................... 105 19 Inventories ............................................................................................................................... 107 20 Intangible assets ....................................................................................................................... 108 21 Assets classified as held for sale .............................................................................................. 110 22 Investment properties ............................................................................................................... 112 23 Other borrowings ..................................................................................................................... 113 24 Unfunded superannuation ........................................................................................................ 114 25 Other employee benefits .......................................................................................................... 119 26 Other liabilities ......................................................................................................................... 120 27 Reconciliation of net cash flows from operating activities to operating surplus for period....... 123 28 Closing cash balances .............................................................................................................. 124 29 Restricted financial assets ........................................................................................................ 124 30 Moneys held in trust ................................................................................................................. 124 31 Capital expenditure commitments ............................................................................................ 125 32 Contingent assets and liabilities ............................................................................................... 126 33 Financial instruments ............................................................................................................... 136 34 Other disaggregated information ............................................................................................. . 149 35 Initial application of Australian Accounting Standards ............................................................. 155 36 Related party disclosures .......................................................................................................... 160 37 Events occurring after the reporting period ............................................................................... 164 38 Composition of sectors ............................................................................................................. 165 39 Budgetary information - comparison of final outcomes to original budget .............................. 167
Appendix 1
35
Introduction
Financial information presented in this appendix has been prepared in accordance with Australian Accounting Standards and pronouncements, in particular AASB 1049: Whole of Government and General Government Sector Financial Reporting, and requirements under section 14A(3) of the Government Financial Responsibility Act 2000. The formats used in this report are the same as those used in 2019-20 Budget Papers presented to the Legislative Assembly on 9 May 2019, facilitating comparisons between estimates and outturns.
These financial statements (Operating Statement, Balance Sheet, Statement of Changes in Equity and Cash Flow Statement) also comply with Uniform Presentation Framework (UPF) disclosure requirements by reporting the finances of all sub-sectors of government. These sub-sectors are:
• the general government sector;
• the public non-financial corporations sector;
• the total non-financial public sector, representing the consolidation of the general government sector and the public non-financial corporations sector;
• the public financial corporations sector; and
• the total public sector (or whole-of-government).
Other UPF disclosure requirements are included in the notes to the financial statements, and in Appendices 2 and 3 of this report.
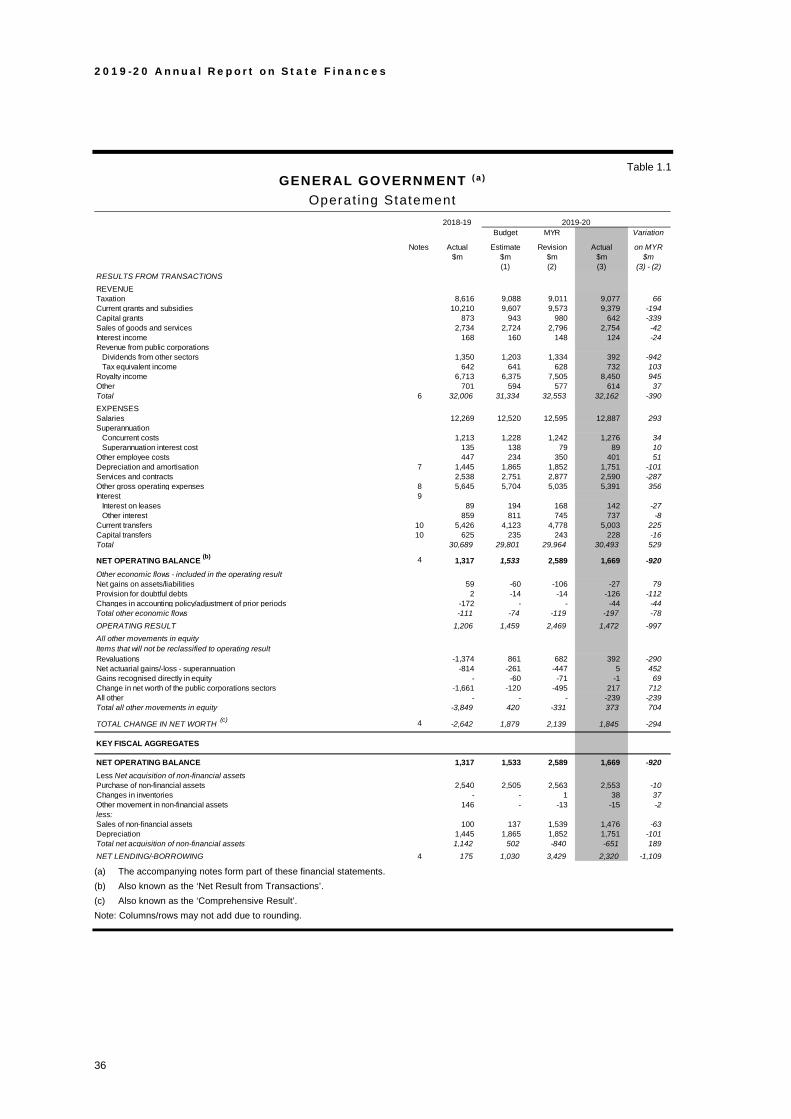
2019-20 Annual Report on State F inances
36
Table 1.1 GENERAL GOVERNMENT ( a )
Operat ing Statement
(a) The accompanying notes form part of these financial statements. (b) Also known as the ‘Net Result from Transactions’. (c) Also known as the ‘Comprehensive Result’. Note: Columns/rows may not add due to rounding.
2018-19Budget MYR Variation
Notes Actual Estimate Revision Actual on MYR$m $m $m $m $m
(1) (2) (3) (3) - (2)RESULTS FROM TRANSACTIONSREVENUETaxation 8,616 9,088 9,011 9,077 66 Current grants and subsidies 10,210 9,607 9,573 9,379 -194 Capital grants 873 943 980 642 -339 Sales of goods and services 2,734 2,724 2,796 2,754 -42 Interest income 168 160 148 124 -24 Revenue from public corporations
Dividends from other sectors 1,350 1,203 1,334 392 -942 Tax equivalent income 642 641 628 732 103
Royalty income 6,713 6,375 7,505 8,450 945 Other 701 594 577 614 37 Total 6 32,006 31,334 32,553 32,162 -390 EXPENSESSalaries 12,269 12,520 12,595 12,887 293 Superannuation
Concurrent costs 1,213 1,228 1,242 1,276 34 Superannuation interest cost 135 138 79 89 10
Other employee costs 447 234 350 401 51 Depreciation and amortisation 7 1,445 1,865 1,852 1,751 -101 Services and contracts 2,538 2,751 2,877 2,590 -287 Other gross operating expenses 8 5,645 5,704 5,035 5,391 356 Interest 9
Interest on leases 89 194 168 142 -27 Other interest 859 811 745 737 -8
Current transfers 10 5,426 4,123 4,778 5,003 225 Capital transfers 10 625 235 243 228 -16 Total 30,689 29,801 29,964 30,493 529
NET OPERATING BALANCE (b) 4 1,317 1,533 2,589 1,669 -920 Other economic flows - included in the operating resultNet gains on assets/liabilities 59 -60 -106 -27 79 Provision for doubtful debts 2 -14 -14 -126 -112 Changes in accounting policy/adjustment of prior periods -172 - - -44 -44 Total other economic flows -111 -74 -119 -197 -78 OPERATING RESULT 1,206 1,459 2,469 1,472 -997 All other movements in equityItems that will not be reclassified to operating resultRevaluations -1,374 861 682 392 -290 Net actuarial gains/-loss - superannuation -814 -261 -447 5 452 Gains recognised directly in equity - -60 -71 -1 69 Change in net worth of the public corporations sectors -1,661 -120 -495 217 712 All other - - - -239 -239 Total all other movements in equity -3,849 420 -331 373 704
TOTAL CHANGE IN NET WORTH (c) 4 -2,642 1,879 2,139 1,845 -294
KEY FISCAL AGGREGATES
NET OPERATING BALANCE 1,317 1,533 2,589 1,669 -920 Less Net acquisition of non-financial assetsPurchase of non-financial assets 2,540 2,505 2,563 2,553 -10 Changes in inventories - - 1 38 37 Other movement in non-financial assets 146 - -13 -15 -2 less:Sales of non-financial assets 100 137 1,539 1,476 -63 Depreciation 1,445 1,865 1,852 1,751 -101 Total net acquisition of non-financial assets 1,142 502 -840 -651 189 NET LENDING/-BORROWING 4 175 1,030 3,429 2,320 -1,109
2019-20

Appendix 1
37
Table 1.2 GENERAL GOVERNMENT ( a )
Balance Sheet at 30 June
(a) The accompanying notes form part of these financial statements.
Note: Columns/rows may not add due to rounding.
2019Budget MYR Variation
Notes Actual Estimate Revision Actual on MYR$m $m $m $m $m
(1) (2) (3) (3) - (2)ASSETSFinancial assetsCash and deposits 601 1,178 967 513 -454 Advances paid 713 775 740 715 -25 Investments, loans and placements 4,470 2,924 4,697 5,924 1,228 Receivables 11 3,999 3,127 3,303 3,938 635 Shares and other equity
Investments in other public sector entities - equity method 40,745 42,148 40,250 40,962 712 Investments in other public sector entities - direct injections 10,000 10,876 11,083 10,602 -482 Investments in other entities 20 15 20 22 2
Other financial assets 8 8 17 8 -9 Total financial assets 60,556 61,052 61,077 62,684 1,607 Non-financial assetsLand 12 35,600 36,155 36,279 35,238 -1,041 Property, plant and equipment 13,14 45,344 47,199 46,160 46,363 203 Right of use assets 16,17 - 3,865 2,407 2,484 77 Biological assets 18 3 3 3 109 106 Inventories 19
Land inventories - - - - - Other inventories 71 69 71 108 37
Intangibles 20 626 582 578 603 25 Assets classified as held for sale 21 43 34 43 21 -22 Investment property 22 7 7 - 7 7 Other 245 378 187 229 43 Total non-financial assets 81,940 88,291 85,728 85,162 -566 TOTAL ASSETS 142,496 149,343 146,805 147,847 1,041 LIABILITIESDeposits held 686 847 951 1,472 521 Advances received 343 377 351 326 -25 Borrowings
Lease liabilities - 3,809 2,405 2,722 317 Other borrowings 23 27,745 27,549 25,946 26,389 443
Superannuation 24 7,062 6,817 7,102 6,818 -284 Other employee benefits 25 3,197 3,103 3,237 3,543 306 Payables 1,425 1,301 1,412 1,463 51 Other liabilities 26 1,445 1,562 3,461 2,674 -787 TOTAL LIABILITIES 41,903 45,365 44,868 45,408 541 NET ASSETS 100,593 103,978 101,938 102,438 500 Of which:Contributed equity - - - - - Accumulated surplus 6,317 6,528 9,202 7,587 -1,615 Other reserves 94,276 97,450 92,736 94,851 2,115 NET WORTH 4 100,593 103,978 101,938 102,438 500
MEMORANDUM ITEMS
Net financial worth 18,653 15,687 16,210 17,276 1,066 Net financial liabilities 32,091 37,352 35,124 34,288 -836 Net debtGross debt liabilities 28,774 32,582 29,654 30,910 1,256 less: liquid financial assets 5,784 4,877 6,403 7,152 749 less: convergence differences impacting net debt - - - - - Net debt 22,990 27,705 23,251 23,758 507
2020

2019-20 Annual Report on State F inances
38
Table 1.3 GENERAL GOVERNMENT
Statement of Changes in Equity
(a) Adjustment to recognise the impact of the initial application of the new revenue and lease accounting standards on the operating result for 2019-20.
Note: Columns/rows may not add due to rounding.
Asset Revaluation
Surplus
Accumulatednet gain on equity
investments in other sector entities
AccumulatedSurplus/deficit Total Equity
$m $m $m $m
Balance at 1 July 2018 54,923 42,406 5,907 103,236 Operating result - - 1,206 1,206 All other movements in equity -1,392 -1,661 -796 -3,849 Total change in net worth -1,392 -1,661 411 -2,642
Balance at 30 June 2019 53,531 40,745 6,317 100,593
Balance at 1 July 2019 53,531 40,745 6,317 100,593 Initial application of AASB 16 - - -2 -2 Initial application of AASB 15/1058 - - -237 -237
Restated balance at 1 July 2019 53,531 40,745 6,078 100,354 Operating result - - 1,472 1,472 Movements in equity 392 217 -235 373 Total change in net worth 392 217 1,237 1,845
Other (a) -33 - 272 239 Balance at 30 June 2020 53,889 40,962 7,587 102,438

Appendix 1
39
Table 1.4 GENERAL GOVERNMENT ( a )
Cash Flow Statement
(a) The accompanying notes form part of these financial statements.
Note: Columns/rows may not add due to rounding.
2018-19Budget MYR Variation
Notes Actual Estimate Revision Actual on MYR$m $m $m $m $m
(1) (2) (3) (3) - (2)CASH FLOWS FROM OPERATING ACTIVITESCash receivedTaxes received 8,911 9,104 9,022 9,018 -4 Grants and subsidies received 11,082 11,762 11,788 11,825 37 Receipts from sales of goods and services 2,599 2,750 2,796 2,589 -207 Interest receipts 173 155 143 119 -24 Dividends and tax equivalents 2,092 1,863 2,002 1,071 -931 Other 7,659 8,519 10,099 10,825 727 Total cash received 32,517 34,153 35,850 35,447 -402 Cash PaidWages, salaries and supplements, and superannuation -13,766 -14,233 -14,285 -14,192 93 Payments for goods and services -8,473 -8,693 -8,361 -8,494 -133 Interest paid -950 -1,080 -936 -905 31 Grants and subsidies paid -5,635 -5,519 -6,166 -6,641 -476 Dividends and tax equivalents - - - - - Other payments -1,679 -1,574 -1,780 -2,004 -225 Total cash paid -30,503 -31,099 -31,527 -32,237 -709 NET CASH FLOWS FROM OPERATING ACTIVITIES 27 2,014 3,054 4,323 3,211 -1,112 CASH FLOWS FROM INVESTING ACTIVITESCash flows from investments in non-financial assetsPurchase of non-financial assets -2,540 -2,505 -2,563 -2,553 10 Sales of non-financial assets 100 137 1,539 1,476 -63 Total cash flows from investments in non-financial assets -2,441 -2,367 -1,024 -1,077 -53 Cash flows from investments in financial assetsCash receivedFor policy purposes 33 10 10 64 54 For liquidity purposes 308 65 117 56 -61 Cash paidFor policy purposes -790 -1,272 -1,285 -862 423 For liquidity purposes -66 -33 -38 -38 - Total cash flows from investments in financial assets -516 -1,230 -1,196 -780 416 NET CASH FLOWS FROM INVESTING ACTIVITIES -2,956 -3,598 -2,220 -1,857 363 CASH FLOWS FROM FINANCING ACTIVITIESCash receivedAdvances received 17 17 17 17 - Borrowings 61 1,750 166 845 680 Deposits received - - - - - Other financing receipts 253 181 140 312 171 Total cash receipts from financing activities 330 1,948 323 1,174 851 Cash paidAdvances paid -17 -17 -17 -17 - Borrowings repaid -513 -1,434 -1,443 -1,379 63 Deposits paid - - - - - Other financing payments -214 -564 -511 -492 19 Total payments for financing activities -744 -2,014 -1,970 -1,888 82 NET CASH FLOWS FROM FINANCING ACTIVITIES -414 -66 -1,647 -714 933 Net increase in cash and cash equivalents -1,355 -610 456 640 184 Cash and cash equivalents at the beginning of the year 6,360 4,276 5,005 5,005 - Cash and cash equivalents at the end of the year 28 5,005 3,666 5,460 5,645 184
KEY FISCAL AGGREGATES
Net cash flows from operating activities 2,014 3,054 4,323 3,211 -1,112 Net cash flows from investing in non-financial assets -2,441 -2,367 -1,024 -1,077 -53 Cash surplus/-deficit -426 687 3,299 2,134 -1,165
2019-20

2019-20 Annual Report on State F inances
40
Table 1.5 PUBLIC NON-FINANCIAL CORPORATIONS
Operat ing Statement
(a) Also known as the ‘Net Result from Transactions’. (b) Also known as the ‘Comprehensive Result’.
Note: Columns/rows may not add due to rounding.
2018-19Budget MYR Variation
Notes Actual Estimate Revision Actual on MYR$m $m $m $m $m
(1) (2) (3) (3) - (2)RESULTS FROM TRANSACTIONSREVENUECurrent grants and subsidies 1,824 1,992 1,958 2,446 488 Capital grants 338 76 59 64 5 Sales of goods and services 20,591 31,909 34,813 34,089 -723 Interest Income 181 193 137 126 -11 Other 478 489 446 468 21 Total 23,412 34,658 37,413 37,192 -221 EXPENSESSalaries 1,056 1,208 1,215 1,101 -114 Superannuation
Concurrent costs 104 118 120 110 -10 Superannuation interest cost - - - - -
Other employee costs 39 25 23 34 11 Depreciation and amortisation 1,982 2,153 2,128 2,152 24 Services and contracts 764 667 645 792 147 Other gross operating expenses 16,313 27,195 30,269 29,615 -654 Interest
Interest on leases 85 107 95 90 -6 Other interest 691 745 609 572 -37
Tax equivalents 577 599 579 609 30 Current transfers 1,134 1,195 1,196 1,482 286 Capital transfers 19 7 - 15 15 Total 22,764 34,019 36,879 36,571 -308
NET OPERATING BALANCE (a) 4 648 639 534 621 87
Other economic flows - included in the operating resultNet gains on assets/liabilities 47 16 15 -65 -80 Provision for doubtful debts -18 -34 -37 -72 -35 Changes in accounting policy/adjustment of prior periods -145 - - -44 -44 Total other economic flows -116 -17 -22 -181 -159 OPERATING RESULT 532 622 512 440 -72 Other non-owner movements in equityItems that will not be reclassified to operating resultRevaluations -1,070 127 224 459 234 Net actuarial gains/-loss - superannuation -38 1 -2 -27 -25 Gains recognised directly in equity 8 1 3 4 1 All other - - - -105 -105 Total other non-owner movements in equity -1,100 130 225 331 106 Movements in owner equityDividends -1,229 -1,113 -1,101 -162 939 Capital injections 758 1,158 1,109 652 -456 Total movements in owner equity -471 44 7 490 482
TOTAL CHANGE IN NET WORTH (b) 4 -1,039 796 744 1,261 517
KEY FISCAL AGGREGATES
NET OPERATING BALANCE 648 639 534 621 87 Less Net acquisition of non-financial assetsPurchase of non-financial assets 2,441 3,194 3,154 2,683 -472 Changes in inventories 614 74 83 2,050 1,967 Other movement in non-financial assets 127 175 153 109 -44 less:Sales of non-financial assets 578 628 528 311 -218 Depreciation 1,982 2,153 2,128 2,152 24 Total net acquisition of non-financial assets 622 662 734 2,380 1,645 NET LENDING/-BORROWING 4 26 -23 -200 -1,758 -1,558
2019-20

Appendix 1
41
Table 1.6 PUBLIC NON-FINANCIAL CORPORATIONS
Balance Sheet at 30 June
Note: Columns/rows may not add due to rounding.
2019Budget MYR Variation
Notes Actual Estimate Revision Actual on MYR$m $m $m $m $m
(1) (2) (3) (3) - (2)ASSETSFinancial assetsCash and deposits 1,391 1,613 1,694 2,938 1,244 Advances paid - - - - - Investments, loans and placements 5,003 5,670 5,604 5,407 -197 Receivables 1,804 1,968 1,813 2,026 213 Shares and other equity - -
Investments in other public sector entities - equity method - - - - - Investments in other public sector entities - direct injections - - - - - Investments in other entities 3 17 18 9 -9
Other financial assets 673 518 553 580 27 Total financial assets 8,874 9,786 9,682 10,960 1,278 Non-financial assetsLand 8,209 8,502 8,063 8,361 297 Property, plant and equipment 55,749 57,405 56,708 56,208 -501 Right of use assets - 201 210 494 284 Biological assets 342 319 197 209 12 Inventories
Land inventories 1,852 2,025 2,022 1,809 -213 Other inventories 4,275 3,801 4,358 6,325 1,967
Intangibles 395 381 381 445 64 Assets classified as held for sale 16 59 11 16 5 Investment property 60 54 53 26 -27 Other 134 122 138 190 52 Total non-financial assets 71,032 72,869 72,142 74,081 1,939 TOTAL ASSETS 79,906 82,655 81,823 85,041 3,218 LIABILITIESDeposits held - - - - - Advances received 343 327 326 326 - Borrowings
Lease liabilities - 617 364 815 451 Other borrowings 22,862 23,757 23,935 23,310 -624
Superannuation 98 66 86 97 11 Other employee benefits 368 364 367 423 56 Payables 5,875 5,479 5,937 8,488 2,551 Other liabilities 1,835 1,421 1,647 1,796 149 TOTAL LIABILITIES 31,381 32,030 32,661 35,255 2,594 NET ASSETS 48,525 50,625 49,162 49,786 624 Of which:Contributed equity 10,235 11,052 11,344 10,887 -456 Accumulated surplus 17,299 18,161 17,954 17,448 -506 Other reserves 20,990 21,413 19,864 21,450 1,586 NET WORTH 4 48,525 50,625 49,162 49,786 624
MEMORANDUM ITEMS
Net financial worth -22,507 -22,244 -22,980 -24,295 -1,316 Net debtGross debt liabilities 23,205 24,701 24,625 24,451 -174 less: liquid financial assets 6,393 7,282 7,298 8,345 1,047 less: convergence differences impacting net debt - - - - - Net debt 16,812 17,418 17,327 16,106 -1,221
2020
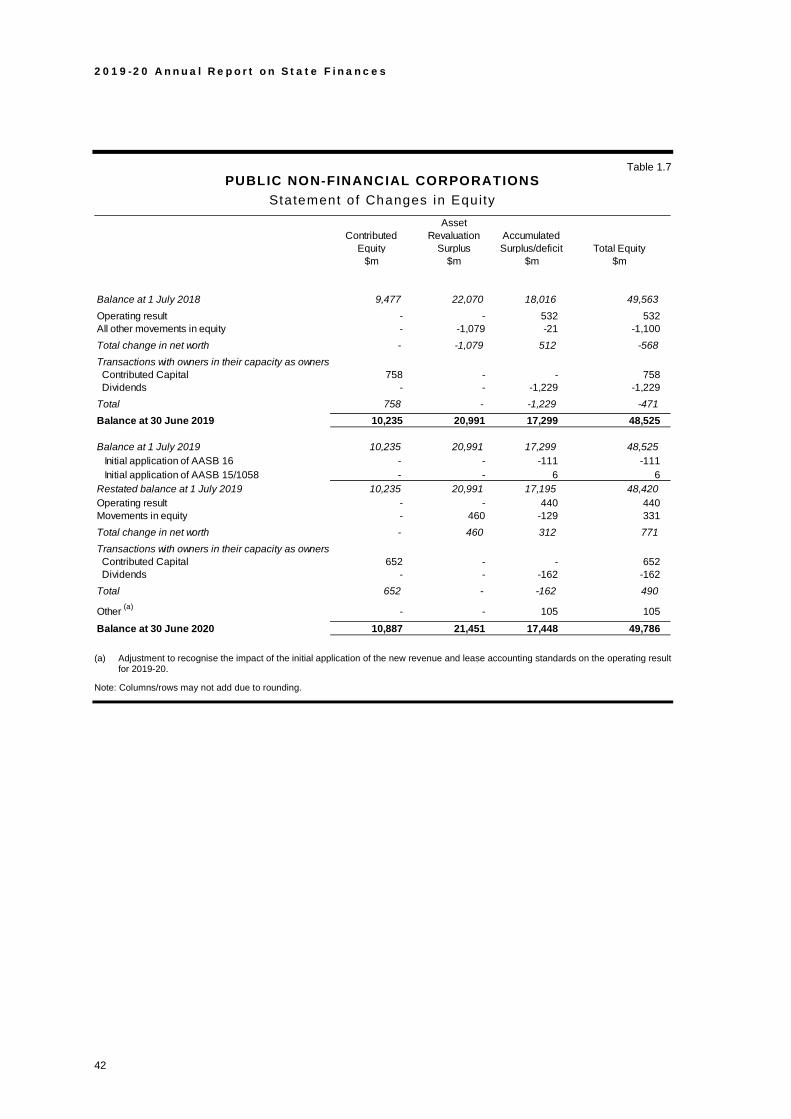
2019-20 Annual Report on State F inances
42
Table 1.7 PUBLIC NON-FINANCIAL CORPORATIONS
Statement of Changes in Equity
(a) Adjustment to recognise the impact of the initial application of the new revenue and lease accounting standards on the operating result for 2019-20.
Note: Columns/rows may not add due to rounding.
ContributedEquity
Asset Revaluation
SurplusAccumulatedSurplus/deficit Total Equity
$m $m $m $m
Balance at 1 July 2018 9,477 22,070 18,016 49,563 Operating result - - 532 532 All other movements in equity - -1,079 -21 -1,100 Total change in net worth - -1,079 512 -568 Transactions with owners in their capacity as owners Contributed Capital 758 - - 758 Dividends - - -1,229 -1,229 Total 758 - -1,229 -471 Balance at 30 June 2019 10,235 20,991 17,299 48,525
Balance at 1 July 2019 10,235 20,991 17,299 48,525 Initial application of AASB 16 - - -111 -111 Initial application of AASB 15/1058 - - 6 6
Restated balance at 1 July 2019 10,235 20,991 17,195 48,420 Operating result - - 440 440 Movements in equity - 460 -129 331 Total change in net worth - 460 312 771 Transactions with owners in their capacity as owners Contributed Capital 652 - - 652 Dividends - - -162 -162 Total 652 - -162 490
Other (a) - - 105 105 Balance at 30 June 2020 10,887 21,451 17,448 49,786

Appendix 1
43
Table 1.8 PUBLIC NON-FINANCIAL CORPORATIONS
Cash Flow Statement
Note: Columns/rows may not add due to rounding.
2018-19Budget MYR Variation
Actual Estimate Revision Actual on MYR$m $m $m $m $m
(1) (2) (3) (3) - (2)CASH FLOWS FROM OPERATING ACTIVITIESCash receivedGrants and subsidies received 2,171 2,082 2,033 2,507 475 Receipts from sales of goods and services 20,786 20,951 22,218 25,130 2,912 Interest receipts 166 196 134 129 -5 Dividends and tax equivalents 64 60 61 61 - Other 1,424 1,237 944 1,361 418 Total cash received 24,611 24,526 25,389 29,189 3,799
Cash paidWages, salaries and supplements, and superannuation -1,235 -1,340 -1,361 -1,184 178 Payments for goods and services -15,377 -15,097 -16,528 -19,602 -3,074 Interest paid -772 -852 -673 -689 -16 Grants and subsidies paid -689 -711 -712 -708 4 Tax equivalents -614 -618 -601 -614 -13 Other payments -3,319 -3,381 -3,228 -3,628 -400 Total cash paid -22,006 -21,999 -23,103 -26,424 -3,321 #NET CASH FLOWS FROM OPERATING ACTIVITIES 2,604 2,526 2,286 2,764 478
CASH FLOWS FROM INVESTING ACTIVITIESCash flows from investments in non-financial assetsPurchase of non-financial assets -2,441 -3,194 -3,154 -2,683 472 Sales of non-financial assets 578 628 528 311 -218 Total cash flows from investments in non-financial assets -1,863 -2,566 -2,626 -2,372 254
Cash flows from investments in financial assetsCash receivedFor policy purposes - - - - - For liquidity purposes 11 26 31 74 43 Cash paidFor policy purposes - -52 -21 -21 - For liquidity purposes -61 -32 -39 -30 9 Total cash flows from investments in financial assets -50 -58 -29 23 52
NET CASH FLOWS FROM INVESTING ACTIVITIES -1,913 -2,624 -2,655 -2,349 306
CASH FLOWS FROM FINANCING ACTIVITIESCash receivedAdvances received - - - - - Borrow ings 4,301 6,778 7,156 7,014 -142 Deposits received - - - - - Other f inancing receipts 849 1,417 1,396 902 -494 Total cash received 5,150 8,195 8,552 7,916 -636
Cash paidAdvances paid -29 -17 -17 -17 - Borrow ings repaid -4,583 -6,543 -6,699 -6,565 134 Deposits paid - - - - - Other f inancing payments -71 -154 -147 -172 -25 Dividends paid -1,229 -1,113 -1,101 -162 939 Total cash paid -5,912 -7,827 -7,963 -6,917 1,047
NET CASH FLOWS FROM FINANCING ACTIVITIES -762 368 589 1,000 411
Net increase in cash and cash equivalents -71 270 220 1,415 1,195 Cash and cash equivalents at the beginning of the year 1,889 1,683 1,818 1,818 - Cash and cash equivalents at the end of the year 1,818 1,953 2,038 3,233 1,195
KEY FISCAL AGGREGATES
Net cash f low s from operating activities 2,604 2,526 2,286 2,764 478 Net cash f low s from investing in non-financial assets -1,863 -2,566 -2,626 -2,372 254 Dividends paid -1,229 -1,113 -1,101 -162 939 Cash surplus/-deficit -487 -1,153 -1,441 230 1,671
2019-20

2019-20 Annual Report on State F inances
44
Table 1.9 TOTAL NON-FINANCIAL PUBLIC SECTOR
Operat ing Statement
(a) Also known as the ‘Net Result from Transactions’. (b) Also known as the ‘Comprehensive Result’.
Note: Columns/rows may not add due to rounding.
2018-19Budget MYR Variation
Notes Actual Estimate Revision Actual on MYR$m $m $m $m $m
(1) (2) (3) (3) - (2)RESULTS FROM TRANSACTIONSREVENUETaxation 8,100 8,565 8,488 8,554 66 Current grants and subsidies 10,210 9,607 9,573 9,379 -194 Capital grants 873 943 980 642 -339 Sales of goods and services 22,714 34,170 37,058 36,251 -807 Interest Income 323 318 261 229 -32 Royalty income 6,713 6,375 7,505 8,450 945 Dividends and tax equivalents 246 189 353 415 62 Other 1,079 1,001 927 980 53 Total 50,258 61,166 65,145 64,899 -246 EXPENSESSalaries 13,325 13,727 13,810 13,989 179 Superannuation
Concurrent costs 1,317 1,346 1,362 1,385 23 Superannuation interest cost 135 138 79 89 10
Other employee costs 348 258 293 355 62 Depreciation and amortisation 3,426 3,965 3,953 3,899 -54 Services and contracts 3,295 3,422 3,526 3,374 -152 Other gross operating expenses 21,261 32,220 34,616 34,286 -330 Interest
Interest on leases 174 291 262 230 -32 Other interest 1,524 1,532 1,332 1,289 -42
Other property expenses - - - - - Current transfers 4,410 2,989 3,680 3,693 13 Capital transfers 305 166 184 178 -6 Total 49,522 60,054 63,098 62,769 -329
NET OPERATING BALANCE (a) 4 737 1,112 2,048 2,131 83
Other economic flows - included in the operating resultNet gains on assets/liabilities 107 -44 -91 -92 -1 Provision for doubtful debts -16 -47 -51 -198 -147 Changes in accounting policy/adjustment of prior periods -46 - - 13 13 Total other economic flows 44 -92 -142 -277 -135 OPERATING RESULT 781 1,020 1,906 1,854 -52 All other movements in equityItems that will not be reclassified to operating resultRevaluations -2,444 667 850 850 1 Net actuarial gains/-loss - superannuation -852 -260 -449 -22 427 Gains recognised directly in equity 8 -112 -94 -1 93 Change in net worth of the public corporations sectors -136 80 -74 -493 -419 All other - - - -344 -344 Total all other movements in equity -3,424 375 233 -9 -242
TOTAL CHANGE IN NET WORTH (b) 4 -2,642 1,395 2,139 1,845 -294
KEY FISCAL AGGREGATES
NET OPERATING BALANCE 737 1,112 2,048 2,131 83 Less Net acquisition of non-financial assetsPurchase of non-financial assets 4,957 5,638 5,638 5,185 -453 Changes in inventories 614 74 84 2,088 2,004 Other movement in non-financial assets 273 175 139 94 -46 less:Sales of non-financial assets 654 704 1,988 1,735 -253 Depreciation 3,426 3,965 3,953 3,899 -54 Total net acquisition of non-financial assets 1,765 1,218 -80 1,732 1,812 NET LENDING/-BORROWING 4 -1,028 -106 2,128 399 -1,729
2019-20

Appendix 1
45
Table 1.10 TOTAL NON-FINANCIAL PUBLIC SECTOR
Balance Sheet at 30 June
Note: Columns/rows may not add due to rounding.
2019Budget MYR Variation
Notes Actual Estimate Revision Actual on MYR$m $m $m $m $m
(1) (2) (3) (3) - (2)ASSETSFinancial assetsCash and deposits 1,321 1,959 1,726 1,995 269 Advances paid 370 449 414 389 -25 Investments, loans and placements 9,470 8,342 10,161 11,270 1,108 Receivables 5,661 4,986 5,000 5,824 823 Shares and other equity
Investments in other public sector entities - equity method 2,220 2,399 2,171 1,778 -394 Investments in other public sector entities - direct injections - - - - - Investments in other entities 23 32 38 32 -7
Other financial assets 8 8 17 8 -9 Total financial assets 19,074 18,175 19,528 21,294 1,766 Non-financial assetsLand 43,809 44,657 44,342 43,599 -744 Property, plant and equipment 101,093 104,603 102,868 102,570 -298 Right of use assets - 2,946 2,365 2,973 608 Biological assets 345 322 200 317 117 Inventories
Land inventories 1,852 2,025 2,022 1,809 -213 Other inventories 4,345 3,870 4,429 6,433 2,004
Intangibles 1,022 963 958 1,047 89 Assets classified as held for sale 59 93 54 37 -17 Investment property 67 61 53 33 -20 Other 378 499 324 419 95 Total non-financial assets 152,971 160,040 157,617 159,238 1,621 TOTAL ASSETS 172,045 178,215 177,145 180,532 3,387 LIABILITIESDeposits held 13 12 13 14 1 Advances received 343 377 351 326 -25 Borrowings
Lease liabilities - 3,027 2,632 3,471 839 Other borrowings 50,607 51,306 49,881 49,700 -181
Superannuation 7,160 6,883 7,188 6,915 -273 Other employee benefits 3,564 3,467 3,604 3,966 362 Payables 7,161 6,673 7,236 9,812 2,576 Other liabilities 2,603 2,493 4,301 3,889 -411 TOTAL LIABILITIES 71,452 74,237 75,207 78,094 2,887 NET ASSETS 100,593 103,978 101,938 102,438 500 Of which:Contributed equity - - - - - Accumulated surplus 23,624 24,671 26,912 25,043 -1,869 Other reserves 76,970 79,307 75,026 77,396 2,369 NET WORTH 4 100,593 103,978 101,938 102,438 500
MEMORANDUM ITEMS
Net financial worth -52,377 -56,062 -55,679 -56,800 -1,121 Net financial liabilities 54,598 58,494 57,851 58,578 727 Net debtGross debt liabilities 50,963 54,722 52,878 53,511 633 less: liquid financial assets 11,161 10,749 12,301 13,653 1,352 less: convergence differences impacting net debt - - - - - Net debt 39,802 43,973 40,577 39,858 -719
2020

2019-20 Annual Report on State F inances
46
Table 1.11 TOTAL NON-FINANCIAL PUBLIC SECTOR
Statement of Changes in Equity
(a) Adjustment to recognise the impact of the initial application of the new revenue and lease accounting standards on the operating result for 2019-20.
Note: Columns/rows may not add due to rounding.
Asset Revaluation
Surplus
Accumulatednet gain on equity
investments in other sector
entitiesAccumulatedSurplus/deficit Total Equity
$m $m $m $m
Balance at 1 July 2018 77,085 2,221 23,930 103,236 Operating result - - 781 781 All other movements in equity -2,336 1 -1,089 -3,424 Total change in net worth -2,336 1 -307 -2,642 Balance at 30 June 2019 74,748 2,220 23,624 100,593
Balance at 1 July 2019 74,748 2,220 23,624 100,593 Initial application of AASB 16 - - -112 -112 Initial application of AASB 15/1058 - - -231 -231
Restated balance at 1 July 2019 74,748 2,220 23,280 100,249 Operating result - - 1,854 1,854 Movements in equity 850 -493 -366 -9 Total change in net worth 850 -493 1,488 1,845
Other (a) 18 50 275 344 Balance at 30 June 2020 75,617 1,778 25,043 102,438

Appendix 1
47
Table 1.12 TOTAL NON-FINANCIAL PUBLIC SECTOR
Cash Flow Statement
Note: Columns/rows may not add due to rounding.
2018-19Budget MYR Variation
Actual Estimate Revision Actual on MYR$m $m $m $m $m
(1) (2) (3) (3) - (2)CASH FLOWS FROM OPERATING ACTIVITIESCash receivedTaxes received 8,395 8,574 8,495 8,496 - Grants and subsidies received 11,082 11,762 11,788 11,825 37 Receipts from sales of goods and services 22,790 23,184 24,404 27,051 2,647 Interest receipts 314 316 253 226 -27 Dividends and tax equivalents 313 191 361 355 -6 Other 8,658 9,393 10,678 11,808 1,129 Total cash received 51,553 53,420 55,980 59,760 3,781
Cash paidWages, salaries and supplements, and superannuation -15,002 -15,573 -15,646 -15,375 271 Payments for goods and services -22,858 -23,037 -24,003 -27,194 -3,191 Interest paid -1,697 -1,897 -1,585 -1,572 13 Grants and subsidies paid -4,129 -4,128 -4,824 -4,809 14 Dividends and tax equivalents - - - - - Other payments -4,478 -4,425 -4,481 -5,105 -625 Total cash paid -48,163 -49,060 -50,539 -54,056 -3,517
NET CASH FLOWS FROM OPERATING ACTIVITIES 3,390 4,360 5,441 5,704 263
CASH FLOWS FROM INVESTING ACTIVITIESCash flows from investments in non-financial assetsPurchase of non-financial assets -4,957 -5,638 -5,638 -5,185 453 Sales of non-financial assets 654 704 1,988 1,735 -253 Total cash flows from investments in non-financial assets -4,304 -4,934 -3,650 -3,449 201
Cash flows from investments in financial assetsCash receivedFor policy purposes 21 10 10 64 54 For liquidity purposes 318 70 127 130 3 Cash paidFor policy purposes -19 -10 -10 -63 -53 For liquidity purposes -128 -44 -56 -67 -12 Total cash flows from investments in financial assets 193 26 72 64 -8
NET CASH FLOWS FROM INVESTING ACTIVITIES -4,111 -4,907 -3,578 -3,386 193
CASH FLOWS FROM FINANCING ACTIVITIESCash receivedAdvances received - - - - - Borrow ings 4,362 8,528 7,322 7,859 537 Deposits received - - - - - Other f inancing receipts 261 129 119 300 181 Total cash received 4,623 8,657 7,441 8,159 718
Cash paidAdvances paid -17 -17 -17 -17 - Borrow ings repaid -5,097 -7,977 -8,141 -7,944 197 Deposits paid - - - - - Other f inancing payments -215 -456 -470 -462 8 Total cash paid -5,329 -8,450 -8,629 -8,424 205
NET CASH FLOWS FROM FINANCING ACTIVITIES -706 207 -1,188 -264 923
Net increase in cash and cash equivalents -1,426 -340 675 2,055 1,379 Cash and cash equivalents at the beginning of the year 8,248 5,958 6,822 6,822 - Cash and cash equivalents at the end of the year 6,822 5,618 7,497 8,876 1,379
KEY FISCAL AGGREGATES
Net cash f low s from operating activities 3,390 4,360 5,441 5,704 263 Net cash f low s from investing in non-financial assets -4,304 -4,934 -3,650 -3,449 201 Cash surplus/-deficit -913 -573 1,791 2,255 464
2019-20

2019-20 Annual Report on State F inances
48
Table 1.13 PUBLIC FINANCIAL CORPORATIONS
Operat ing Statement
(a) Also known as the ‘Net Result from Transactions’. (b) Also known as the ‘Comprehensive Result’. Note: Columns/rows may not add due to rounding.
2018-19Budget MYR Variation
Notes Actual Estimate Revision Actual on MYR$m $m $m $m $m
(1) (2) (3) (3) - (2)RESULTS FROM TRANSACTIONSREVENUECurrent grants and subsidies - - - - - Capital grants - - - - - Sales of goods and services 1,136 1,191 1,169 1,186 17 Interest Income 1,882 1,998 1,787 1,626 -160 Other 113 100 107 100 -8 Total 3,130 3,290 3,063 2,912 -151 EXPENSESSalaries 57 60 62 62 1 Superannuation
Concurrent costs 6 6 6 6 - Superannuation interest cost - - - - -
Other employee costs 2 3 3 1 -2 Depreciation and amortisation 4 10 9 8 -1 Services and contracts 11 11 12 11 - Other gross operating expenses 1,182 1,217 1,223 1,127 -96 Interest
Interest on leases - 1 1 1 - Other interest 1,623 1,800 1,574 1,344 -230
Tax equivalents 65 42 49 123 73 Current transfers 4 5 5 4 - Capital transfers 14 8 12 16 4 Total 2,969 3,161 2,955 2,704 -251
NET OPERATING BALANCE (a) 4 161 128 109 208 100
Other economic flows - included in the operating resultNet gains on assets/liabilities 147 155 177 -316 -493 Provision for doubtful debts - - - - - Changes in accounting policy/adjustment of prior periods 7 - - 8 8 Total other economic flows 155 155 177 -307 -484 OPERATING RESULT 315 283 286 -99 -384 Other non-owner movements in equityItems that will not be reclassified to operating resultRevaluations - -2 -6 - 6 Net actuarial gains/-loss - superannuation 1 - - - - Gains recognised directly in equity - - - 1 1 All other - - - -2 -2 Total other non-owner movements in equity 1 -1 -6 -1 5 Movements in owner equityDividends -181 -147 -303 -292 11 Capital injections -136 -27 -25 -50 -25 Total movements in owner equity -317 -174 -328 -343 -14
TOTAL CHANGE IN NET WORTH (b) 4 - 108 -49 -443 -394
KEY FISCAL AGGREGATES
NET OPERATING BALANCE 161 128 109 208 100 Less Net acquisition of non-financial assetsPurchase of non-financial assets 7 8 8 4 -4 Changes in inventories - - - - - Other movement in non-financial assets - - - - - less:Sales of non-financial assets - - - - - Depreciation 4 10 9 8 -1 Total net acquisition of non-financial assets 3 -1 -1 -5 -3 NET LENDING/-BORROWING 4 158 129 110 213 103
2019-20

Appendix 1
49
Table 1.14 PUBLIC FINANCIAL CORPORATIONS
Balance Sheet at 30 June
Note: Columns/rows may not add due to rounding.
2019Budget MYR Variation
Notes Actual Estimate Revision Actual on MYR$m $m $m $m $m
(1) (2) (3) (3) - (2)ASSETSFinancial assetsCash and deposits 198 271 165 354 189 Advances paid 4,415 4,927 4,982 4,873 -109 Investments, loans and placements 62,777 60,235 62,693 67,860 5,167 Receivables 690 727 694 651 -43 Shares and other equity
Investments in other public sector entities - equity method - - - - - Investments in other public sector entities - direct injections - - - - - Investments in other entities 1,897 2,051 2,048 1,812 -236
Other financial assets 5 5 5 7 2 Total financial assets 69,982 68,216 70,588 75,558 4,970 Non-financial assetsLand - - - - - Property, plant and equipment 5 7 6 4 -2 Right of use assets - 25 25 24 -1 Biological assets - - - - - Inventories
Land inventories - - - - - Other inventories - - - - -
Intangibles 7 11 9 7 -2 Assets classified as held for sale - - - - - Investment property - - - - - Other 3 10 3 5 3 Total non-financial assets 15 53 43 41 -2 TOTAL ASSETS 69,997 68,269 70,631 75,599 4,968 LIABILITIESDeposits held - - - - - Advances received 3 2 3 3 - Borrowings - -
Lease liabilities - 28 30 29 -1 Other borrowings 63,047 60,962 63,405 68,646 5,241
Superannuation 5 8 6 5 -1 Other employee benefits 13 12 13 15 2 Payables 129 69 85 319 234 Other liabilities 4,580 4,790 4,917 4,803 -114 TOTAL LIABILITIES 67,776 65,870 68,459 73,821 5,362 NET ASSETS 2,220 2,399 2,171 1,778 -394 Of which:Contributed equity -236 -176 -260 -286 -25 Accumulated surplus 2,433 2,513 2,423 2,041 -382 Other reserves 23 62 9 23 14 NET WORTH 4 2,220 2,399 2,171 1,778 -394
MEMORANDUM ITEMS
Net financial worth 2,205 2,346 2,129 1,737 -392 Net debtGross debt liabilities 63,050 60,992 63,438 68,678 5,240 less: liquid financial assets 67,390 65,433 67,841 73,088 5,247 less: convergence differences impacting net debt - - - - - Net debt -4,340 -4,441 -4,403 -4,409 -7
2020

2019-20 Annual Report on State F inances
50
Table 1.15 PUBLIC FINANCIAL CORPORATIONS
Statement of Changes in Equity
(a) Adjustment to recognise the impact of the initial application of the new revenue and lease accounting standards on the operating result
for 2019-20.
Note: Columns/rows may not add due to rounding.
ContributedEquity
Asset Revaluation
SurplusAccumulatedSurplus/deficit Total Equity
$m $m $m $m
Balance at 1 July 2018 -100 23 2,297 2,221 Operating result - - 315 315 All other movements in equity - - 1 1 Total change in net worth - - 317 318 Transactions with owners in their capacity as owners Contributed Capital -136 - - -136 Dividends - - -181 -181 Total -136 - -181 -317 Balance at 30 June 2019 -236 23 2,433 2,220
Balance at 1 July 2019 -236 23 2,433 2,220 Initial application of AASB 16 - - -2 -2 Initial application of AASB 15/1058 - - - -
Restated balance at 1 July 2019 -236 23 2,431 2,219 Operating result - - -99 -99 Movements in equity - - -1 -1 Total change in net worth - - -100 -100 Transactions with owners in their capacity as owners Contributed Capital -50 - - -50 Dividends - - -292 -292 Total -50 - -292 -343
Other (a) - - 2 2 Balance at 30 June 2020 -286 23 2,041 1,778

Appendix 1
51
Table 1.16 PUBLIC FINANCIAL CORPORATIONS
Cash Flow Statement
Note: Columns/rows may not add due to rounding.
2018-19Budget MYR Variation
Actual Estimate Revision Actual on MYR$m $m $m $m $m
(1) (2) (3) (3) - (2)CASH FLOWS FROM OPERATING ACTIVITIES
Cash receivedGrants and subsidies received - 5 5 - -5 Receipts from sales of goods and services 1,196 1,294 1,301 1,203 -98 Interest receipts 1,901 1,998 1,787 1,712 -75 Dividends and tax equivalents - - - - - Other 155 162 162 163 1 Total cash received 3,253 3,460 3,255 3,078 -177
Cash paidWages, salaries and supplements, and superannuation -60 -64 -66 -66 - Payments for goods and services -857 -906 -912 -866 46 Interest paid -1,874 -1,801 -1,575 -1,665 -90 Grants and subsidies paid - - - - - Tax equivalents -128 -42 -67 -88 -21 Other payments -152 -163 -163 -160 3 Total cash paid -3,072 -2,976 -2,784 -2,845 -61 NET CASH FLOWS FROM OPERATING ACTIVITIES 181 483 471 233 -238
CASH FLOWS FROM INVESTING ACTIVITIES
Cash flows from investments in non-financial assetsPurchase of non-financial assets -7 -8 -8 -4 4 Sales of non-financial assets - - - - - Total cash flows from investments in non-financial assets -7 -8 -8 -4 4
Cash flows from investments in financial assetsCash receivedFor policy purposes - - - - - For liquidity purposes 6,177 7,148 6,580 11,914 5,333 Cash paidFor policy purposes -164 -80 -70 -70 - For liquidity purposes -8,656 -7,884 -7,362 -14,128 -6,766 Total cash flows from investments in financial assets -2,643 -815 -852 -2,284 -1,432
NET CASH FLOWS FROM INVESTING ACTIVITIES -2,650 -824 -859 -2,287 -1,428
CASH FLOWS FROM FINANCING ACTIVITIES
Cash receivedAdvances received - - - - - Borrow ings 26,539 27,875 26,621 28,790 2,169 Deposits received - - - - - Other f inancing receipts 28 19 19 19 - Total cash received 26,567 27,895 26,640 28,809 2,169
Cash paidAdvances paid - - - - - Borrow ings repaid -24,350 -27,375 -26,072 -26,254 -182 Deposits paid - - - - - Other f inancing payments - -1 -1 -4 -3 Dividends paid -185 -149 -294 -267 26 Total cash paid -24,535 -27,526 -26,367 -26,526 -158 NET CASH FLOWS FROM FINANCING ACTIVITIES 2,032 369 273 2,283 2,011
Net increase in cash and cash equivalents -437 29 -116 229 345 Cash and cash equivalents at the beginning of the year 2,326 2,247 1,890 1,890 - Cash and cash equivalents at the end of the year 1,890 2,275 1,774 2,119 345
KEY FISCAL AGGREGATES
Net cash f low s from operating activities 181 483 471 233 -238 Net cash f low s from investing in non-financial assets -7 -8 -8 -4 4 Dividends paid -185 -149 -294 -267 26 Cash surplus/-deficit -11 326 170 -38 -208
2019-20

2019-20 Annual Report on State F inances
52
Table 1.17 TOTAL PUBLIC SECTOR ( a )
Operat ing Statement
(a) The accompanying notes form part of these financial statements. (b) Also known as the ‘Net Result from Transactions’. (c) Also known as the ‘Comprehensive Result’.
Note: Columns/rows may not add due to rounding.
2018-19Budget MYR Variation
Notes Actual Estimate Revision Actual on MYR$m $m $m $m $m
(1) (2) (3) (3) - (2)RESULTS FROM TRANSACTIONSREVENUETaxation 8,097 8,561 8,485 8,550 66 Current grants and subsidies 10,210 9,607 9,573 9,379 -194 Capital grants 873 943 980 642 -339 Sales of goods and services 23,488 35,028 37,887 37,054 -833 Interest income 639 685 674 555 -119 Royalty income 6,713 6,375 7,505 8,450 945 Other 1,193 1,099 1,032 1,077 45 Total 6 51,214 62,297 66,136 65,706 -430 EXPENSESSalaries 13,382 13,787 13,872 14,051 180 Superannuation
Concurrent costs 1,323 1,352 1,368 1,392 24 Superannuation interest cost 135 138 79 89 10
Other employee costs 350 261 296 356 60 Depreciation and amortisation 7 3,431 3,974 3,962 3,908 -54 Services and contracts 3,306 3,422 3,526 3,385 -141 Other gross operating expenses 8 22,084 33,114 35,509 35,027 -481 Interest 9
Interest on leases 174 291 262 231 -32 Other interest 1,583 1,700 1,533 1,333 -200
Other property expenses - - - - - Current transfers 10 4,411 2,989 3,680 3,693 13 Capital transfers 10 319 174 196 194 -2 Total 50,498 61,203 64,283 63,659 -624
NET OPERATING BALANCE (b) 4 716 1,094 1,853 2,047 194
Other economic flows - included in the operating resultNet gains on assets/liabilities 254 111 86 -408 -494 Provision for doubtful debts -16 -47 -51 -198 -147 Changes in accounting policy/adjustment of prior periods -310 - - -79 -79 Total other economic flows -72 63 35 -685 -720 OPERATING RESULT 644 1,157 1,888 1,362 -526 All other movements in equityItems that will not be reclassified to operating resultRevaluations -2,444 988 794 850 56 Net actuarial gains/-loss - superannuation -850 -260 -449 -22 427 Gains recognised directly in equity 8 -113 -95 - 94 All other - - - -345 -345 Total all other movements in equity -3,286 615 250 483 233
TOTAL CHANGE IN NET WORTH (c) 4 -2,642 1,773 2,139 1,845 -294
KEY FISCAL AGGREGATES
NET OPERATING BALANCE 716 1,094 1,853 2,047 194 Less Net acquisition of non-financial assetsPurchase of non-financial assets 4,965 5,646 5,646 5,188 -457 Changes in inventories 614 74 84 2,088 2,004 Other movement in non-financial assets 273 175 139 94 -46 less:Sales of non-financial assets 654 705 1,988 1,736 -253 Depreciation 3,431 3,974 3,962 3,908 -54 Total net acquisition of non-financial assets 1,767 1,217 -81 1,727 1,808 NET LENDING/-BORROWING 4 -1,051 -123 1,935 320 -1,615
2019-20

Appendix 1
53
Table 1.18 TOTAL PUBLIC SECTOR ( a )
Balance Sheet at 30 June
(a) The accompanying notes form part of these financial statements.
Note: Columns/rows may not add due to rounding.
2019Budget MYR Variation
Notes Actual Estimate Revision Actual on MYR$m $m $m $m $m
(1) (2) (3) (3) - (2)ASSETSFinancial assetsCash and deposits 1,517 2,229 1,889 2,346 457 Advances paid 4,782 5,373 5,393 5,259 -134 Investments, loans and placements 19,567 14,034 19,840 25,495 5,655 Receivables 11 5,825 5,225 5,255 5,923 667 Equity - Investments in other entities 1,920 2,084 2,087 1,844 -243 Other financial assets 13 13 22 15 -7 Total financial assets 33,624 28,959 34,486 40,882 6,396 Non-financial assetsLand 12 43,809 44,657 44,342 43,599 -744 Property, plant and equipment 13,14 101,099 104,610 102,874 102,575 -299 Right of use assets 16,17 - 2,969 2,388 2,997 608 Biological assets 18 345 322 200 317 117 Inventories 19
Land inventories 1,852 2,025 2,022 1,809 -213 Other inventories 4,345 3,870 4,429 6,433 2,004
Intangibles 20 1,028 974 968 1,054 87 Assets classified as held for sale 21 59 93 54 37 -17 Investment property 22 67 61 53 33 -20 Other 381 510 327 424 98 Total non-financial assets 152,985 160,092 157,658 159,279 1,621 TOTAL ASSETS 186,610 189,051 192,144 200,161 8,017 LIABILITIESDeposits held 11 11 11 12 1 Advances received 343 377 351 326 -25 Borrowings
Lease liabilities - 3,054 2,661 3,500 839 Other borrowings 23 60,974 57,725 60,272 64,711 4,439
Superannuation 24 7,165 6,891 7,194 6,920 -274 Other employee benefits 25 3,577 3,478 3,617 3,981 364 Payables 7,211 6,612 7,260 9,978 2,718 Other liabilities 26 6,736 6,925 8,840 8,294 -546 TOTAL LIABILITIES 86,017 85,073 90,207 97,723 7,516 NET ASSETS 100,593 103,978 101,938 102,438 500 Of which:Contributed equity - - - - - Accumulated surplus 26,056 27,184 29,334 27,083 -2,251 Other reserves 74,537 76,794 72,604 75,355 2,751 NET WORTH 4 100,593 103,978 101,938 102,438 500
MEMORANDUM ITEMS
Net financial worth -52,392 -56,114 -55,720 -56,841 -1,121 Net financial liabilities 52,392 56,114 55,720 56,841 1,121 Net debtGross debt liabilities 61,329 61,167 63,295 68,549 5,254 less: liquid financial assets 25,867 21,636 27,122 33,100 5,978 less: convergence differences impacting net debt - - - - - Net debt 35,462 39,531 36,173 35,449 -724
2020
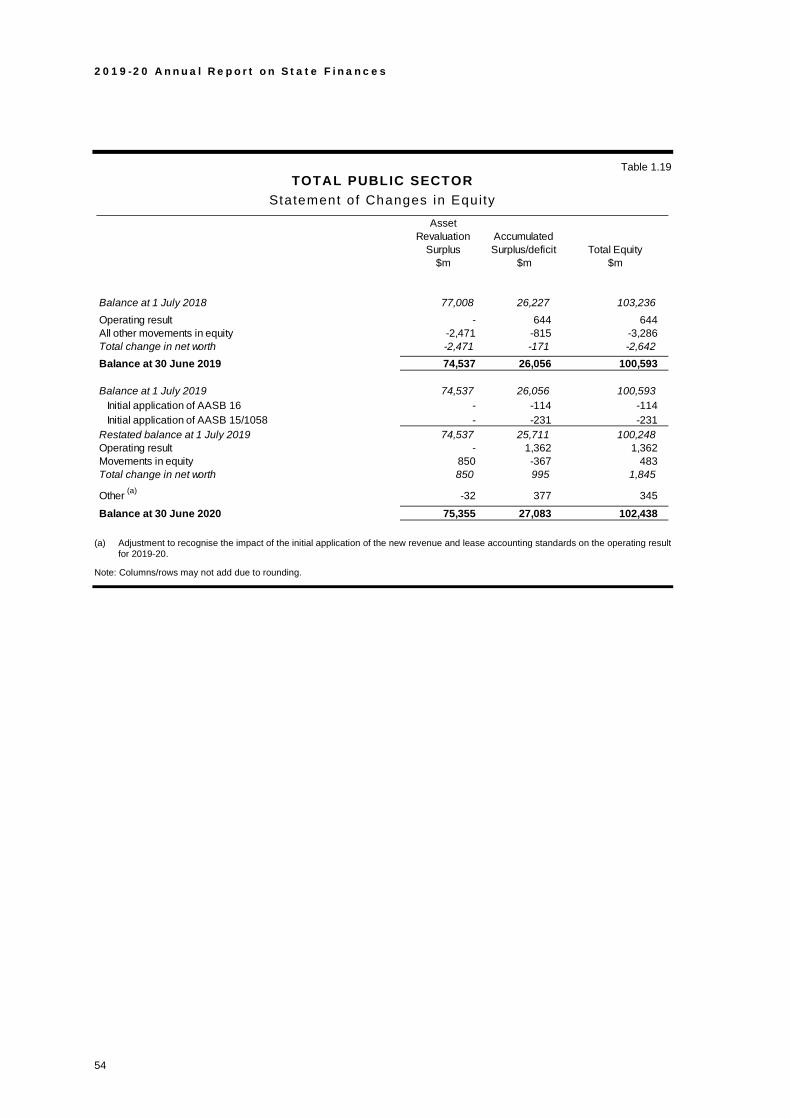
2019-20 Annual Report on State F inances
54
Table 1.19 TOTAL PUBLIC SECTOR
Statement of Changes in Equity
(a) Adjustment to recognise the impact of the initial application of the new revenue and lease accounting standards on the operating result for 2019-20.
Note: Columns/rows may not add due to rounding.
Asset Revaluation
SurplusAccumulatedSurplus/deficit Total Equity
$m $m $m
Balance at 1 July 2018 77,008 26,227 103,236 Operating result - 644 644 All other movements in equity -2,471 -815 -3,286 Total change in net worth -2,471 -171 -2,642 Balance at 30 June 2019 74,537 26,056 100,593
Balance at 1 July 2019 74,537 26,056 100,593 Initial application of AASB 16 - -114 -114 Initial application of AASB 15/1058 - -231 -231
Restated balance at 1 July 2019 74,537 25,711 100,248 Operating result - 1,362 1,362 Movements in equity 850 -367 483 Total change in net worth 850 995 1,845
Other (a) -32 377 345 Balance at 30 June 2020 75,355 27,083 102,438

Appendix 1
55
Table 1.20 TOTAL PUBLIC SECTOR ( a )
Cash Flow Statement
(a) The accompanying notes form part of these financial statements.
Note: Columns/rows may not add due to rounding.
2018-19Budget MYR Variation
Notes Actual Estimate Revision Actual on MYR$m $m $m $m $m
(1) (2) (3) (3) - (2)CASH FLOWS FROM OPERATING ACTIVITIES
Cash receivedTaxes received 8,392 8,565 8,486 8,492 5 Grants and subsidies received 11,082 11,762 11,788 11,825 37 Receipts from sales of goods and services 23,693 24,145 25,365 27,956 2,591 Interest receipts 661 689 647 565 -82 Dividends and tax equivalents - - - - - Other 8,807 9,548 10,833 11,965 1,132 Total cash received 52,635 54,711 57,119 60,802 3,683 Cash paidWages, salaries and supplements, and superannuation -15,062 -15,637 -15,712 -15,441 271 Payments for goods and services -23,421 -23,610 -24,575 -27,762 -3,187 Interest paid -2,017 -2,073 -1,767 -1,864 -97 Grants and subsidies paid -4,129 -4,123 -4,819 -4,810 9 Dividends and tax equivalents - - - - - Other payments -4,620 -4,573 -4,629 -5,256 -627 Total cash paid -49,248 -50,017 -51,501 -55,132 -3,631 NET CASH FLOWS FROM OPERATING ACTIVITIES 27 3,386 4,694 5,618 5,670 52 CASH FLOWS FROM INVESTING ACTIVITIESCash flows from investments in non-financial assetsPurchase of non-financial assets -4,965 -5,646 -5,646 -5,188 457 Sales of non-financial assets 654 705 1,988 1,736 -253 Total cash flows from investments in non-financial assets -4,310 -4,942 -3,658 -3,453 205 Cash flows from investments in financial assetsCash receivedFor policy purposes 21 10 10 64 54 For liquidity purposes 6,495 7,219 6,708 12,044 5,336 Cash paidFor policy purposes -19 -10 -10 -63 -53 For liquidity purposes -8,784 -7,928 -7,418 -14,195 -6,777 Total cash flows from investments in financial assets -2,286 -709 -710 -2,150 -1,441 NET CASH FLOWS FROM INVESTING ACTIVITIES -6,597 -5,651 -4,367 -5,603 -1,236 CASH FLOWS FROM FINANCING ACTIVITIESCash receivedAdvances received - - - - - Borrowings 21,444 19,900 18,481 20,848 2,366 Deposits received - - - - - Other financing receipts 98 49 49 231 182 Total cash received 21,542 19,949 18,530 21,078 2,548 Cash paidAdvances paid -17 -17 -17 -17 - Borrowings repaid -19,990 -18,849 -18,752 -18,397 355 Deposits paid - - - - - Other financing payments -188 -438 -452 -448 5 Total cash paid -20,194 -19,303 -19,221 -18,862 360 NET CASH FLOWS FROM FINANCING ACTIVITIES 1,348 646 -691 2,217 2,908 Net increase in cash and cash equivalents -1,863 -311 560 2,284 1,724 Cash and cash equivalents at the beginning of the period 10,573 8,203 8,710 8,710 - Cash and cash equivalents at the end of the period 28 8,710 7,892 9,270 10,994 1,724
KEY FISCAL AGGREGATES
Net cash flows from operating activities 3,386 4,694 5,618 5,670 52 Net cash flows from investing in non-financial assets -4,310 -4,942 -3,658 -3,453 205 Cash surplus/-deficit -924 -248 1,961 2,217 257
2019-20

2019-20 Annual Report on State F inances
56
Notes to the Financial Statements
NOTE 1: MISSION STATEMENT THE GOVERNMENT OF WESTERN AUSTRALIA
The Government of Western Australia (the reporting entity hereafter referred to as ‘the public sector’) is created by the Western Australian Constitution Act 1889.
The Executive Council is the governing body responsible for the control and management of the operations, affairs, concerns and property of the public sector. The Executive Council consists of the Governor, the Premier, and Ministers of the Crown, and is hereafter referred to as ‘the Government’.
The principal office of the Government is situated at Parliament House, Harvest Terrace, West Perth, Western Australia.
The Government’s mission comprises four key goals, to:
• achieve sustainable finances, including responsible financial management and better public sector service delivery;
• grow and diversify the economy, create jobs and support skills development;
• promote strong and safe communities, and support for families; and
• ensure that Western Australia has liveable and affordable communities, and that the environment is protected and enhanced.
The public sector is a not-for-profit entity funded primarily through Commonwealth grants, State taxation, territorial revenue (i.e. mining royalties, user charges and other own-source revenue).
NOTE 2: STATEMENT OF COMPLIANCE
Compliance Framework
The financial statements of the general government sector and the total public sector for the year ended 30 June 2020 have been prepared in accordance with applicable Australian Accounting Standards (AASs) and Interpretations, in particular AASB 1049: Whole of Government and General Government Sector Financial Reporting.
Appendix 1
57
NOTE 2: STATEMENT OF COMPLIANCE (CONT.)
The Standard under which the general government sector financial statements are prepared does not require full application of AASB 127: Consolidated and Separate Financial Statements and AASB 139: Financial Instruments: Recognition and Measurement. Assets, liabilities, income, expenses and cash flows of government-controlled entities that are in the public non-financial corporations sector and the public financial corporations sector are not separately recognised in the general government sector financial statements. Instead, the general government sector financial statements recognise an asset, being the controlling equity investment in those entities, and recognise a gain or loss relating to changes in the carrying amount of that asset, measured in accordance with AASB 1049.
In compliance with AASB 1049, where consistent with accounting standards, Government Financial Statistics (GFS) concepts, sources and methods are used. In Australia, GFS standards are promulgated by the Australian Bureau of Statistics (ABS).
NOTE 3: SUMMARY OF SIGNIFICANT ACCOUNTING POLICIES
(a) General Statement
The whole-of-government financial statements of the Government of Western Australia constitute general purpose financial statements.
The financial statements presented in this Annual Report on State Finances are required under section 14A(3) of the Government Financial Responsibility Act 2000 and the regulations of that Act.
(b) Reporting Entity
The reporting entities are the Government of Western Australia (also referred to as the total public sector and/or whole-of-government) and the general government sector, and include entities under their control.
The general government sector is a component of the total public sector reporting entity. The purpose of the general government sector financial statements is to provide users with information about the Government’s stewardship of central government, and accountability for the resources entrusted to it. The statements also provide information about the financial position, changes in net assets/liabilities, performance and cash flows of the general government sector.
The statistical framework classifies the sub-sectors in accordance with the principles and rules contained in the ABS’ Australian System of Government Finance Statistics: Concepts, Sources and Methods, Australia 2015 (ABS GFS Manual). The entities forming part of each sector are referred to as agencies in these financial statements and Note 38: Composition of sectors contains a full list of agencies forming each of the sectors listed below.

2019-20 Annual Report on State F inances
58
General government sector
The general government sector comprises public sector agencies that are engaged mainly in the provision of services outside the normal market mechanism, or that provide for the transfer of income for public policy purposes. Costs are financed predominantly from centrally collected revenue such as taxes, Commonwealth grants and mining royalties.
Public non-financial corporation sector
The public non-financial corporation sector comprises those non-financial public sector agencies engaged mainly in the production of goods and services for sale in the market and whose objective is to recover at least a significant proportion of operating costs through charges for their goods and services.
Public financial corporation sector
The public financial corporation sector comprises those public sector agencies engaged primarily in financial activities, such as providing central borrowing authority and public sector insurance services.
Control
The control of an agency by the Government is taken to exist where the:
• agency is accountable to the Government;
• the Government, through the public sector, has a residual financial interest in the net assets of that agency; and
• the Government has the power to control the financial and operating policies of an agency so as to obtain benefits for the State from its activities.
Where control of an agency is obtained during a financial year, results are included in the Operating Statement from the date on which control commenced. Where control of an agency ceased during a financial year, results are included for that part of the year for which control existed.
Specific details of agencies controlled by the Government and consolidated in the public sector are shown in Note 38: Composition of sectors. A detailed list of other entities nominally referred to as public sector agencies that are not included in the consolidated financial statements, is also shown in Note 38. Exclusion of these agencies is based on the criteria of control noted above.
Most agencies have 30 June reporting dates. Where agencies have reporting dates other than 30 June, the data incorporated in this appendix are based on either:
• management accounts to 30 June; or
• the latest financial statements.
The use of management financial data or the latest financial statements in these cases does not have a material effect on these consolidated financial statements.

Appendix 1
59
(c) Basis of Preparation
The financial statements of the total public sector and the general government sector have been prepared in accordance with applicable Australian Accounting Standards and other authoritative pronouncements of the Australian Accounting Standards Board (AASB) in particular, AASB 1049-Whole of Government and General Government Sector Financial Reporting.
AASB 1049 harmonises Government Finance Statistics (GFS) with Generally Accepted Accounting Principles (GAAP) to the extent that GFS does not conflict with GAAP. This requires the selection of options within the Australian Accounting Standards that harmonise with the ABS GFS Manual. Further details are contained in Note 4: Convergence Differences.
The Balance Sheet and Operating Statement have been prepared on an accrual basis of accounting, and assets and liabilities are shown at fair value unless otherwise stated.
The accounting policies applied in the preparation of the financial statements have been consistently applied throughout all periods presented.
Assets and liabilities are recognised in the Balance Sheet when and only when it is probable that future economic benefits or financial obligations will flow to or from the reporting entity and the amounts of the assets or liabilities can be reliably measured.
Accounting policies are selected and applied in a manner that ensures the resulting financial information satisfies the concepts of relevance and reliability. The judgements made in the process of applying accounting policies consistent with AASs that had the most significant effect on the amounts recognised in the financial statements are disclosed, where applicable, in the relevant notes to the financial statements.
(d) Accounting Judgements, Estimates and Assumptions
In the preparation of the consolidated financial statements, public sector entities are required to make judgements, estimates and assumptions that affect the reported amounts of assets and liabilities and the disclosure of contingent assets and liabilities at reporting date and the reported revenue and expenses during the reporting period.
On an ongoing basis, the public sector and its controlled entities evaluate estimates and judgements in relation to assets, liabilities, contingent assets and liabilities, revenue and expenses, based on historical experience and various other factors (such as discount rates used in estimating provisions and estimating the useful life of key assets) that are believed to be reasonable under the circumstance, the results of which form the basis of making judgements about the carrying values of assets and liabilities. Actual results may differ from these estimates.
Contingent assets and liabilities are not recognised in the Balance Sheet but are discussed in a note to the consolidated financial statements. They may arise through uncertainty as to the existence, settlement or measurement of an asset or liability and are recognised once this uncertainty is removed.

2019-20 Annual Report on State F inances
60
Judgements, estimates and assumptions that have significant effects on the financial statements are disclosed in the notes to the financial statements. These judgements and assumptions relate to:
• the fair value of land, buildings, infrastructure, plant and equipment (refer to Note 15: Fair Value Measurements);
• identifying leases within contracts, estimation of the lease term, determination of the appropriate discount rate to discount the lease payments and assessing whether the right-of-use assets need to be impaired (refer to Note 16: Right-of-use assets);
• superannuation expense and liability (refer to Note 24: Unfunded superannuation);
• actuarial assumptions for employee benefit provisions based on likely tenure of existing staff, patterns of leave claims, future salary movements and future discount rates (refer to Note 25: Other employee benefits); and
• provisions for outstanding insurance claims (refer Note 26 Other liabilities).
(e) Presentation and Rounding of Amounts
The consolidated financial statements are presented in Australian dollars and all amounts are rounded to the nearest million dollars ($m). As a consequence, columns and rows may not always add due to rounding.
(f) Foreign Currency
Transactions in currencies other than Australian dollars are recorded at the rates of exchange prevailing on the settlement date of the transactions. At each reporting date, monetary assets and liabilities that are denominated in foreign currencies are retranslated at the rates prevailing at that date.
In order to hedge its exposure to certain foreign exchange risks, the public sector enters into forward contracts and options (see Note 33: Financial instruments for details of the public sector accounting policies in respect of such derivative financial instruments).
(g) Basis of Consolidation
The consolidated financial statements of the reporting entity include the assets and the liabilities of the public sector and its controlled agencies at the end of the financial year and the revenue and expenses of the public sector and its controlled agencies for the year.
The consolidated financial statements include the information and results of each controlled agency from the date on which the State Government obtained control and until such time as the Government ceased to control the agency.
For the purposes of reporting the public sector as a single economic entity, all material transactions and balances and unrealised gains between agencies under the Government’s control are eliminated in full on consolidation. Unrealised losses are also eliminated unless the transaction provides evidence of an impairment of the asset transferred.

Appendix 1
61
Where necessary, the accounting policies and reporting periods of controlled agencies have been aligned with those adopted by the public sector as a whole, to achieve consistency. This approach has not materially affected the revenue and expenses or the assets and liabilities at the reporting date.
(h) Revenue Recognition
Revenue is measured at the fair value of the consideration received or receivable net of the amount of goods and services tax payable and net of discounts, rebates, concessions and allowances.
The policies adopted for the recognition of significant categories of revenue are as follows.
Taxation revenue
Revenue is recognised for each type of taxation revenue when the taxable event occurs and the receivables arising from the taxable event can be reliably measured. Taxes such as casino tax insurance duty, payroll tax, and landfill levy are recognised as income when the taxable event occurs, if they can be reliably measured. Vehicle licence duty is recognised when payment is received. Taxes such as transfer duty, land tax and the emergency services levy are recognised as income when the notice/assessment is issued. Licences such as the Perth parking levy and vehicle licence charges are recognised as revenue when the licence is issued and payment is received.
Grants and subsidies income
Revenue from the Commonwealth, including GST grants, Specific Purpose and National Partnership grants are recognised when payment is received unless a contract (that creates enforceable rights and obligations) exists. From 2019-20, capital grants are recognised as income when agencies achieve the milestones specified in the grant agreements in line with AASB 15: Revenue from Contracts with Customers.
Sale of goods and services
Revenue from the sale of goods and services, including regulatory fees, is recognised (net of returns, discounts, rebates, concessions and allowances) when performance obligations are satisfied through transferring a promised good or service to a customer and is based upon the transfer of control rather than transfer of significant risks and benefits. The performance obligations may be satisfied over time or at a point in time.
Interest income
Interest revenue is accrued on a time proportion basis, by reference to the principal outstanding and taking into account the effective yield on the financial asset.
Revenue from public corporations
Dividends, income tax equivalent revenue and local government rate equivalent revenue for the general government sector represents income from the other sectors of government. Dividends are recognised as revenue when the right to receive payment is established (i.e. when the dividend is declared). Tax and rate equivalent revenue is recognised when assessment notices are issued or payment is received.

2019-20 Annual Report on State F inances
62
Royalty income
Mineral and petroleum royalties from companies operating under Western Australian legislation are recognised when the taxable event occurs and the receivables arising from the taxable event can be measured reliably. Royalties are calculated in accordance with the substance of the relative agreements considering the base on which the royalty is calculated. Under current systems, the base can be production, royalty value, net cash flows or profit.
(i) Expense Recognition
Expenses are recognised when incurred and are reported in the financial year to which they relate. The policies adopted for the recognition of significant categories of expenses are as follows.
Salaries
Salaries include wages and salaries, leave entitlements, redundancy payments and district allowances.
Superannuation concurrent costs
The superannuation expense (concurrent cost) of the defined benefit plans relates to current service cost which is the cost of employer financed benefits that are expected to accrue for defined benefit members during the reporting period.
The superannuation expense (concurrent cost) of the defined contribution plans is recognised as and when the contributions fall due.
Actuarial gains or losses relating to remeasurement adjustments and changes in actuarial assumptions of the defined benefit plans are reported separately as ‘other movements in equity’.
Superannuation interest cost
The carrying cost of superannuation liabilities is recognised as an interest cost. This cost is estimated by an actuary based on the discount rate used to value the gross superannuation liability, less the expected return on plan assets.
Depreciation and amortisation
Depreciation of non-financial physical assets (excluding inventories) is generally provided on a straight-line basis at rates based on the expected useful lives of those assets. The expected useful life for each class of depreciable asset is provided at Note 3(k).
Amortisation is provided on leasehold improvements and intangible assets, and is calculated on a straight-line basis, generally over the expected useful lives of the underlying assets.
Other interest
Interest costs include interest charges and borrowing costs. Interest costs are expensed in the period in which they are incurred. Interest expense is recognised as it accrues and includes items of a similar nature realised in managing portfolios. Borrowing costs are recognised immediately as an expense, even when they are directly attributable to the acquisition, construction or production of a qualifying asset.
Appendix 1
63
Current and capital transfers
Current and capital transfers include grants and subsidies and other payments made to other sectors of government and to non-government organisations for the delivery of services. They are recognised as an expense to the extent when the grantee meets conditions such as grant eligibility criteria, or has provided the service or facilities required under the grant agreement.
(j) Other Economic Flows
Other economic flows are changes in volume or value of an asset or liability that do not result from transactions.
Net gains on assets/liabilities
Realised gains (or losses) on disposal of non-financial assets
Net gains (or losses) arising on the disposal or retirement of a non-current asset are recognised when control of the asset and the significant risks and benefits incidental to ownership have passed to the buyer.
Impairment - non-financial assets
Impairment losses are recognised as a non-transaction cost when an asset’s carrying amount exceeds its recoverable amount.
Net actuarial gains (or losses) - superannuation
Actuarial gains (or losses) on superannuation defined benefit plans are recognised in the period in which they occur.
(k) Land, and Other Property, Plant and Equipment
Initial recognition and measurement
All items of land and other property, plant and equipment are initially recognised at cost.
Subsequent recognition and measurement
After initial recognition, the public sector has adopted the following measurement models.
Class of Asset Subsequent Measurement
Land (including land under roads) Fair value Buildings Fair value less accumulated depreciation and
accumulated impairment losses Infrastructure - road network Fair value less accumulated depreciation and
accumulated impairment losses Infrastructure - water storage and distribution
- electricity generation and transmission - other
Fair value less accumulated depreciation and accumulated impairment losses
Plant, equipment and other Fair value less accumulated depreciation and accumulated impairment losses

2019-20 Annual Report on State F inances
64
Revaluations
Non-financial physical assets are revalued with sufficient regularity to ensure that the carrying amount of an asset does not differ materially from its fair value at the end of the reporting period. Revaluation increases or decreases arise from differences between an asset’s carrying value and fair value.
Net revaluation movements are recognised in ‘all other non-owner movements in equity’ and accumulated in equity under ‘Other Reserves’.
Land
The fair value attributed to the land component of government owned non-current real estate assets (excluding land under roads) for financial reporting purposes is determined on the basis of highest and best use taking into consideration the legal, physical and economic restrictions affecting the sites ability to realise that potential.
Fair value is defined in AASB 116: Property, Plant and Equipment as the amount for which an asset could be exchanged, between knowledgeable parties in an ‘arm’s length’ transaction. There is a going concern presumption and it is assumed that an asset is exchanged after an adequate period of marketing.
The fair value of land under roads (i.e. land within road reserves) is based on the market value of the land adjoining the road reserve. The land values are provided by geographic location on an annual basis by the Western Australian Land Information Authority (Valuation Services) as follows:
• Metropolitan area - median value for single residential land for each Local Government Area. Land parcels up to 899 square metres are assumed to have a single residential zoning;
• South West region - nominal unimproved valuation rates covering the south west of the State from Geraldton to Esperance; and
• Balance of State - nominal unimproved valuation rates based on leasehold rates for Crown land.
Buildings
The fair value of buildings is based on current market values determined by reference to recent market transactions. Where market evidence is not available, the fair value of buildings is determined on the basis of existing use where buildings are specialised. Fair value for existing use assets is determined by reference to the cost of replacing the remaining future economic benefits embodied in the asset (i.e. the depreciated replacement cost).
Building valuations are provided by the Western Australian Land Information Authority (Valuation Services), or by other independent professional valuers, with sufficient regularity, such that the carrying amount does not differ materially from that which would be determined using fair values at the reporting date.
Buildings in the course of construction are carried at cost, less any recognised impairment loss. Depreciation of these assets commences when the asset is ready for its intended use.

Appendix 1
65
Infrastructure
The fair value of Infrastructure - Road Network, has been determined by reference to the current depreciated replacement cost (existing use basis) as the assets are specialised and no market evidence of value is available. The replacement cost is determined by Main Roads every three years by reference to the cost of a new asset and adjusted in the intervening years by reference to a cost index (ABS Road and Bridge Construction Cost Index) to ensure asset values do not materially differ from fair value. The value of roads and principal shared paths (earthworks, drainage, pavements and seals), bridges and road furniture at 30 June 2020 is based on the current depreciated replacement cost determined at 30 June 2020 by Main Roads and the ABS Road and Bridge Construction Cost Index has been applied to ensure asset values do not materially differ from fair value. When Infrastructure - Road Network is revalued, the accumulated depreciation is restated proportionately with the change in the gross carrying amount of the asset so that the carrying amount of the asset after revaluation equals its revalued amount.
Infrastructure in the course of construction is carried at cost, less any recognised impairment loss. Depreciation of these assets commences when the asset is ready for its intended use.
Plant, equipment and other assets
Plant, equipment and other assets are stated at fair value which approximates carrying value (cost less accumulated depreciation and accumulated impairment losses).
Art collections and artefacts classified as heritage assets are stated at fair value. The revaluation of art works and artefacts is an independent valuation, provided by independent professional valuers, by reference to the current replacement cost as the assets are specialised and no market evidence of value is available.
Depreciation
All property, plant and equipment assets having a limited useful life are systematically depreciated over the asset’s estimated useful life in a manner that reflects the consumption of its future economic benefits.
Land is not depreciated as it is deemed to have an indefinite life.
Depreciation is generally calculated using the straight-line method (as adjusted for any impairment), over the estimated useful lives of the assets. The assets’ residual values, useful lives and depreciation methods are reviewed, and adjusted if appropriate, at each financial year end.
The following table summarises the expected useful lives for each class of depreciable asset in both the current and prior years used in compiling these financial statements.

2019-20 Annual Report on State F inances
66
Class of Asset Depreciation (Years)
Buildings 20 - 80 years
Infrastructure - Road network
Seals
Pavements and drainage
Road furniture
Bridges
Earthworks
12- 19 years
15 - 50 years
25 - 40 years
60 - 100 years
Up to 173 years
Infrastructure - Water, storage and distribution
Pipelines and fittings
Drains and channels
Dams and reservoirs
30 - 110 years
20 - 150 years
50 - 120 years
Infrastructure - Electricity generation and transmission 2 - 50 years
Infrastructure - Other
Public transport
Harbour and ports
Plant, equipment and other
5 - 75 years
10 - 100 years
3 - 100 years
Disposal
The gain or loss arising on disposal or retirement of an asset (calculated as the difference between the carrying amount of the asset at the time of disposal and the net disposal proceeds), is included in the Operating Statement in the period the item is disposed.
Where an asset that has been previously revalued is disposed of, any balance remaining in the asset revaluation reserve in respect of that asset is retained in ‘Other Reserves’.
(l) Right-of-use Assets
Initial recognition
Right-of-use assets are measured at cost including the following:
• the amount of the initial measurement of lease liability;
• any lease payments made at or before the commencement date less any lease incentives received;
• any initial direct costs; and
• restoration costs, including dismantling and removing the underlying asset.
This includes all leased assets other than investment property right-of-use assets, which are measured in accordance with AASB 140: Investment Property.

Appendix 1
67
In line with AASB 16: Leases, Western Australia’s public sector agencies do not recognise right-of-use assets and lease liabilities for short-term leases (with a lease term of 12 months or less) and low value leases (with an underlying value of $5,000 or less). Lease payments associated with these leases are expensed over a straight-line basis over the lease term.
Subsequent Measurement
The cost model is applied for subsequent measurement of right-of-use assets, requiring the asset to be carried at cost less any accumulated depreciation and accumulated impairment losses and adjusted for any remeasurement of lease liability.
Depreciation and impairment of right-of-use assets
Right-of-use assets are depreciated on a straight-line basis over the shorter of the lease term and the estimated useful lives of the underlying assets.
If ownership of the leased asset transfers to an agency at the end of the lease term or the cost reflects the exercise of a purchase option, depreciation is calculated using the estimated useful life of the asset.
Right-of-use assets are tested for impairment when an indication of impairment is identified. The policy in connection with testing for impairment is outlined in Note 3(r): Impairment of Assets.
(m) Infrastructure Assets Financed by the Private Sector
Certain private sector financed infrastructure arrangements provide for a private sector entity to design, construct, operate and maintain certain infrastructure assets for a specified concession period, after which the infrastructure is transferred back to the public sector.
(n) Biological Assets
Biological assets in the form of standing trees in native and plantation forests are stated at fair value less estimated point-of-sale costs and costs necessary to get the assets to market. Standing trees are physically attached to land located within forest plantations which are measured separately from land.
The fair value of the biological asset is based on its present location and condition and is measured as the present value of expected net cash flows of the harvest based on the productive forestland, discounted at a current market-determined pre-tax rate.
Gains or losses arising from changes in the fair value of standing trees, are taken to account as ‘net gains on assets/liabilities’ in the Operating Statement.
(o) Investment Properties
Initial recognition and measurement
Investment properties are held for rental yield and capital appreciation and are initially recognised at cost.
2019-20 Annual Report on State F inances
68
Subsequent recognition and measurement
After initial recognition, the public sector has adopted the fair value model. Investment properties are carried at fair value and no depreciation is provided in respect of buildings.
The fair value of investment properties is determined by reference to market-based evidence, having regard to current economic and market conditions at reporting date. Valuations are performed annually by an independent professional valuer.
Gains and losses arising from changes in the fair value of investment properties are included in the Operating Statement in the year in which they arise.
(p) Intangible Assets
Acquired and internally developed intangible assets are initially measured at cost. The cost model is applied for subsequent measurement requiring the asset to be carried at cost less any accumulated amortisation and accumulated impairment losses.
The carrying value of intangible assets is reviewed for impairment annually when the asset is not yet in use, or more frequently when an indicator of impairment arises during the reporting year indicating that the carrying value may not be recoverable.
Amortisation is calculated for the period of the expected benefit (estimated useful life) on a straight-line basis using rates which are reviewed annually. All intangible assets controlled by the public sector have a finite useful life and zero residual value.
Expected useful lives for all classes of intangible asset are assumed to be between 3 to 5 years.
(q) Assets Held for Sale
Assets held for sale are recognised at the lower of carrying amount and fair value less costs to sell and are presented separately from other assets in the Balance Sheet. These assets are not depreciated or amortised while they are classified as held for sale.
(r) Impairment of Assets
Property, plant, equipment, infrastructure and intangible assets are tested for any indication of impairment at each reporting period. Where there is an indication of impairment, the recoverable amount is estimated. Where the recoverable amount is less than the carrying amount, the asset is considered impaired and is written down to the recoverable amount and an impairment loss is recognised as a revaluation decrement through ‘All other movements in equity’ in the Operating Statement. As the public sector is a not-for-profit entity, unless an asset has been identified as a surplus asset, the recoverable amount is the higher of an asset’s fair value less costs to sell and depreciated replacement cost.
The risk of impairment is generally limited to circumstances where an asset’s depreciation is materially understated, where the replacement cost is falling or where there is a significant change in useful life. Each relevant class of asset is reviewed annually to verify that the accumulated depreciation/amortisation reflects the level of consumption or expiration of asset’s future economic benefits and to evaluate any impairment risk from declining replacement costs.

Appendix 1
69
Intangible assets not yet available for use or with an indefinite useful life are tested for impairment each reporting period irrespective of whether there is any indication of impairment. Tests are undertaken by agencies at each reporting period.
The recoverable amount of assets identified as surplus assets is the higher of fair value less costs to sell and the present value of future cash flows expected to be derived from the asset. Surplus assets carried at fair value have no risk of material impairment where fair value is determined by reference to market-based evidence. Where fair value is determined by reference to depreciated replacement cost, surplus assets are at risk of impairment and the recoverable amount is measured. Surplus assets at cost are tested for indications of impairment at the end of each reporting period.
(s) Leases
Effective 1 January 2019, AASB 16: Leases supersedes AASB 117: Leases. The main changes introduced by the new Standard includes a comprehensive model for the identification of lease arrangements and requires lessees to recognise most leases (operating and finance leases) on the Balance Sheet as right-of-use assets and lease liabilities. This change excludes short-term leases (lease terms of 12 months or less at commencement date) and low-value assets (valued less than $5,000). Under transitional arrangements, the new Standard preserves a small number of finance leases as ‘other borrowings’ on the Balance Sheet, where these leases are associated with social concession arrangements which will be subject to AASB 1059: Service Concession Arrangements: Grantors in the 2020-21 reporting year.
(t) Lease Liabilities
Lease liabilities at commencement date, are measured at present value of lease payments that are not paid at that date. Lease payments are discounted using the interest rate implicit in the lease. If the rate cannot be readily determined, then the incremental borrowing rate provided by Western Australia Treasury Corporation is applied.
The lease payments that form part of the present value calculation of lease liabilities include:
• fixed payments (including in-substance fixed payments), less any lease incentives receivable;
• variable lease payments that depend on an index or a rate initially measured using the index or rate as at the commencement date;
• amounts expected to be payable by the lessee under residual value guarantees;
• the exercise of purchase options (where these are reasonably certain to be exercised); and
• payments for penalties for terminating a lease, where the lease term reflects the exercising of options to terminate leases.
Interest on lease liabilities is recognised in the Operating Statement over the lease term so as to produce a constant periodic rate of interest on the remaining balance of the liability for each period. Lease liabilities do not include any future changes in variable lease payments (that depend on an index or rate) until they take effect, in which case the lease liability is reassessed and adjusted against the right-of-use asset.

2019-20 Annual Report on State F inances
70
Periods covered by extension or termination options are only included in the lease term if the lease is reasonably certain to be extended (or not terminated).
Variable lease payments, not included in the measurement of lease liabilities, that are dependent on sales are recognised by agencies in the profit and loss in the period in which the condition that triggers those payments occurs.
Subsequent measurement
Lease liabilities are measured by increasing the carrying amount to reflect interest on the lease liabilities, reducing the carrying amount to reflect the lease payments made, and remeasuring the carrying amount at amortised cost (subject to adjustments to reflect any reassessment or lease modifications).
(u) Inventories
Inventories, other than inventories held for distribution, are measured at the lower of cost and net realisable value. Costs are assigned using the weighted average cost or the ‘first in first out’ method.
Inventories consisting of land held for development and resale are valued at the lower of cost and net realisable value. Costs include the cost of acquisition and development.
Inventories held for distribution are measured at cost, adjusted when applicable for any loss of service potential.
Precious metal inventories are valued at fair value, being market prices ruling at reporting date.
(v) Cash and Cash Equivalents
For the purposes of the Cash Flow Statement, cash and cash equivalents also comprise restricted cash and cash equivalents (which includes cash held for specific purposes). These include cash on hand and short-term deposits with original maturities of three months or less that are readily convertible to a known amount of cash and which are subject to insignificant risk of changes in value, and bank overdrafts.
(w) Financial Instruments
Financial assets and liabilities are recognised on the Balance Sheet when the public sector becomes a party to the contractual provisions of the financial instrument. The public sector has the following categories of financial instruments:
• cash and deposits;
• receivables/payables;
• investments, loans and placements;
• advances paid/received;
• shares and other equity;
• deposits held;

Appendix 1
71
• borrowings;
• other employee benefits; and
• other financial assets/liabilities.
Financial assets are measured at amortised cost, fair value through other comprehensive income or fair value through profit or loss. The classification is based on two criteria:
• the business model for managing the assets; and
• whether the assets’ contractual cash flows represent solely payments of principal and interest on the principal amount outstanding.
The following classifications are applied to financial assets and liabilities.
• Financial assets are measured at amortised cost if they are held to collect the contractual cash flows and those cash flows are solely payments of principal and interest.
• Financial assets are measured at fair value through other comprehensive income:
(a) for debt instruments - if the assets are held both to collect contractual cash flows, comprising solely payments of principal and interest, and to sell the financial assets; and
(b) for equity instruments - if they have been irrevocably elected to be measured at fair value through other comprehensive income.
• Other financial assets are measured at fair value through profit or loss unless they are measured at amortised cost or fair value through other comprehensive income as explained above.
• Payables are recognised when the public sector becomes obliged to make future payments as a result of a purchase of assets or services. The carrying amount is equivalent to fair value, as they are usually settled within 30 days. Payables are measured at either amortised cost or at fair value through profit or loss.
• Borrowings are initially recognised at the fair value of the net proceeds received. Subsequent fair value measurements are calculated using current lending rates for similar borrowings with remaining maturities consistent with the debt being valued. Unrealised gains or losses arising from changes in fair value are recognised in the Operating Statement. With the exclusion of leases, borrowings are predominantly conducted by the Western Australian Treasury Corporation, which operates within the capital markets as the central borrowing authority of the public sector. Borrowings are measured at either amortised cost, at fair value through profit or loss, or at fair value through other comprehensive income.
• Derivative financial instruments are recognised in the Balance Sheet and measured at fair value. The fair values for derivative financial instruments are obtained from quoted market prices. Application of hedge accounting will only be available where specific designation and effectiveness criteria are satisfied. Where hedge accounting cannot be achieved for ongoing risk mitigation activity, the changes in the fair value of derivative financial instruments are recognised in the Operating Statement as they arise. Derivative financial instruments are measured at fair value through profit or loss.
2019-20 Annual Report on State F inances
72
(x) Provisions
Provisions are liabilities of uncertain timing and amount and are recognised where there is a present legal or constructive obligation as a result of a past event and when the outflow of resources embodying economic benefits is probable to settle the obligation and a reliable estimate can be made of the amount of the obligation. Provisions are reviewed at the end of each reporting period.
Superannuation
The public sector provides superannuation benefits under two types of schemes: defined benefit plans and defined contribution plans.
In accordance with legislative requirements, the Government Employees Superannuation Board (GESB) administers, the following State public sector plans:
• Defined Benefit Plans:
− Pension Scheme, which was closed to new members on 15 August 1986; and
− Gold State Superannuation (GSS) Scheme, which was closed to new members on 29 December 1995; and
• Defined Contribution Plans:
− West State Superannuation (WSS) Scheme which was closed to new members on 16 April 2007; and
− GESB Super Scheme which commenced on 16 April 2007.
From 30 March 2012, existing members of the WSS, GESB Super Scheme and new employees have been able to choose their preferred superannuation fund provider. Agencies make contributions to GESB or other fund providers on behalf of employees in compliance with the Commonwealth Government’s Superannuation Guarantee (Administration) Act 1992. Contributions to these accumulation schemes extinguish agency liabilities for superannuation charges in respect of employees who are not members of the Pension Scheme or GSS.
The defined benefit plans are superannuation plans that define the benefit amount that an employee will be entitled to receive upon retirement taking into account expected future salary increases and other actuarial assumptions such as mortality and retirement rates. Defined benefit plan contributions are calculated based upon regulatory requirements and/or plan terms. The defined benefit obligations and the related services costs are determined separately for each plan at each reporting date by a qualified actuary, using the Projected Unit Credit method.
The expected future payments are discounted to present value using market yields at the reporting date on Commonwealth government bonds with terms to maturity that match, as closely as possible, the estimated future cash outflows.
Actuarial gains and losses of the defined benefits superannuation plans are immediately recognised in the Operating Statement.

Appendix 1
73
The amounts recognised in the Balance Sheet represent the present value of the defined benefit obligations, reduced by the fair value of the associated plan assets. The assets of these plans are held separately from the public sector’s general assets.
The value of unfunded liabilities reported in the ARSF will differ to the liabilities reported by GESB due to the application of different accounting standards which result in the application of different measurement methodologies1.
The defined contribution plans are superannuation plans in which the employer pays a defined contribution amount into a separate fund. Contributions to defined contribution plans are charged to the Operating Statement as incurred. The public sector has no further obligation to the plans as scheme members assume the investment risk. The unfunded portion of the WSS scheme, left over after full-funding arrangements were put in place in 2001, is being amortised over the period to 2021.
See also Note 3(i): Expense Recognition.
Other employee benefits
Annual Leave and Long Service Leave
Annual leave is not expected to be settled wholly within 12 months after the end of the reporting period and is therefore considered to be ‘other long-term employee benefits’. The annual leave liability is recognised and measured at the present value of amounts expected to be paid when the liabilities are settled using the remuneration rate expected to apply at the time of settlement.
When assessing expected future payments, consideration is given to expected future wage and salary levels including non-salary components such as employer superannuation contributions. In addition, the long service leave liability also considers experience of employee departures and periods of service.
The expected future payments are discounted using market yields at the end of the reporting period on national government bonds with terms to maturity that match as closely as possible the estimated future cash payments.
All annual leave and unconditional long service leave provisions are classified as current liabilities as the public sector does not have an unconditional right to defer settlement of the liability for at least 12 months after the reporting period.
Other compensated absences
Liabilities for sick leave are recognised when it is probable that sick leave paid in the future will be greater than the entitlement that will accrue in the future.
1 Since 2016-17, GESB has valued and reported unfunded superannuation liabilities in accordance with the
requirements of AASB 1056: Superannuation Entities, while for the purposes of the Annual Report on State Finances, the liabilities will continue to be valued in line with AASB 119: Employee Benefits. The two standards allow for the use of different discount factors which will result in a different valuation for the two entities. In addition, GESB reports an employer-sponsored receivable (being the difference between the defined benefit liability and the assets available to meet the liability). The employer sponsored receivable is not reciprocated in a separately identifiable payable in the Annual Report on State Finances.

2019-20 Annual Report on State F inances
74
Past experience indicates that on average, sick leave taken each reporting period is less than the entitlement accrued. This is expected to continue in future periods. Accordingly, it is unlikely that existing accumulated entitlements will be used by employees and no liability for unused sick leave entitlements is recognised. As sick leave is non-vesting, an expense is recognised in the Operating Statement for this leave as it is taken.
Other provisions
Employment On-costs
Employment on-costs, including workers’ compensation insurance, are not employee benefits and are recognised separately as liabilities and expenses when the employment to which they relate has occurred. Employment on-costs are not included as part of the salaries expense and the related on-cost liability is recognised separately from the employee benefit provision.
Decommissioning, Restoration and Rehabilitation
A provision is recognised where the public sector has a legal or constructive obligation in respect of plant decommissioning, restoration and site rehabilitation works. Estimates are based on the present value of expected future cash payments.
Where leased premises are required to be restored to their original condition at the end of their respective lease terms, a provision is recognised for the present value of the estimated expenditure required to remove any leasehold improvements. These costs are capitalised as part of the cost of leasehold improvements or right-of-use assets and are amortised over the shorter of the lease term and the useful life of the assets.
A restoration provision is recognised when:
(a) there is a present obligation as a result of agencies’ activities undertaken;
(b) it is probable that an outflow of economic benefits will be required to settle the obligation; and
(c) the amount of the provision can be measured reliably.
(y) Future Impact of Australian Accounting Standards Not Yet Operative
The public sector and general government sector have not applied the following Australian Accounting Standards that have been issued but are not yet effective. These will be applied from their application date:
• AASB 1059: Service Concession Arrangements: Grantors. This Standard addresses the accounting for a service concession arrangement (a type of public private partnership) by a grantor that is a public sector agency by prescribing the accounting for the arrangement from the grantor’s perspective. Timing and measurement for the recognition of a specific asset class occurs on commencement of the arrangement and the accounting for associated liabilities is determined by whether the grantee is paid by the grantor or users of the public service provided. The mandatory effective date of this Standard is currently 1 January 2020 following amendment by AASB 2018-5. The full impact of this standard is still being assessed.

Appendix 1
75
• AASB 2018-5: Amendments to Australian Accounting Standards - Deferral of AASB 1059. This Standard amends the mandatory effective date of AASB 1059 so that AASB 1059 is required to be applied for annual reporting periods beginning on or after 1 January 2020 instead of 1 January 2019. There is no financial impact from this Amendment.
• AASB 2018-6: Amendments to Australian Accounting Standards - Definition of a Business. The standard amends AASB 3 to clarify the definition of a business, assisting entities to determine whether a transaction should be accounted for as a business combination or as an asset acquisition. There is no financial impact from this Amendment.
• AASB 2018-7: Amendments to Australian Accounting Standards - Definition of Material. The Standard principally amends AASB 101 and AASB 108. The amendments refine the definition of material and its application by improving the wording and aligning the definition across AASB Standards and other publications. The amendment also includes some supporting requirements in AASB 101 in the definition to give it more prominence and clarifies the explanation accompanying the definition of material. There is no financial impact from this Amendment.
• AASB 2019-1: Amendments to Australian Accounting Standards - References to the Conceptual Framework. This Standard sets out amendments to Australian Accounting Standards, Interpretations and other pronouncements to reflect the issuance of the Conceptual Framework for Financial Reporting (Conceptual Framework) by the AASB. There is no financial impact from this Amendment.
• AASB 2019-2: Amendments to Australian Accounting Standards - Implementation of AASB 1059. This Standard makes amendments to AASB 16 and AASB 1059 to: (a) amend the modified retrospective method set out in paragraph C4 of AASB 1059; (b) modify AASB 16 to provide a practical expedient to grantors of service concession arrangements so that AASB 16 would not need to be applied to assets that would be recognised as service concession assets under AASB 1059; and (c) include editorial amendments to the application guidance and implementation guidance accompanying AASB 1059. The full impact of this standard is still being assessed.
• AASB 2020-1: Amendments to Australian Accounting Standards - Classification of Liabilities as Current or Non-current. This Standard amends AASB 101 to clarify requirements for the presentation of liabilities in the statement of financial position as current or non-current. There is no financial impact from this Amendment.
All other Australian Accounting Standards and Interpretations with future commencement dates are either not applicable or have no material impact on the total public sector or the general government sector.
(z) Comparative Figures
The modified retrospective approach has been adopted on transition to AASB 15, AASB 16 and AASB 1058. No comparative information is restated under this approach and the cumulative effect of initially applying the Standards is recognised as an adjustment to the opening balance of accumulated surplus/(deficit) at the date of initial application (1 July 2019).
Other comparative figures are, where appropriate, reclassified to be comparable with the figures presented in the current financial year.

2019-20 Annual Report on State F inances
76
NOTE 4: CONVERGENCE DIFFERENCES
Where possible, AASB 1049 harmonises GFS and accounting concepts into a single presentation. Where harmonisation cannot be achieved as a result of differences in definition, recognition, measurement, classification and consolidation principles and rules, a convergence difference arises.
Full convergence on GFS and Generally Accepted Accounting Principles (GAAP) has not been achieved. This means that there are some differences between AASB 1049 aggregates in this report and the GFS information that the ABS reports.
The following key convergence differences relate to the 30 June 2020 results.
• GFS recognises dividends to owners by the PNFC and PFC sectors as a GFS expense, whereas under GAAP they are treated as a distribution to owners and therefore a direct reduction of accumulated funds. This difference does not flow through to the total public sector as dividends are eliminated on consolidation.
• GFS does not recognise an allowance for doubtful debts as the statistical framework only recognises bad debts when they are written off. Under GAAP, an allowance for doubtful debts is recognised in the balance sheet and doubtful debts are recognised in the Operating Statement as ‘other economic flows’.
• Transactions with owners as owners (such as equity injections) are excluded from the ‘total change in net worth’. However, these transactions are included in the movement in GFS net worth. These types of transactions result in a convergence difference as the total change in net worth under GAAP is disclosed before such transactions, while under GFS, these transactions are included in the movement in GFS net worth.
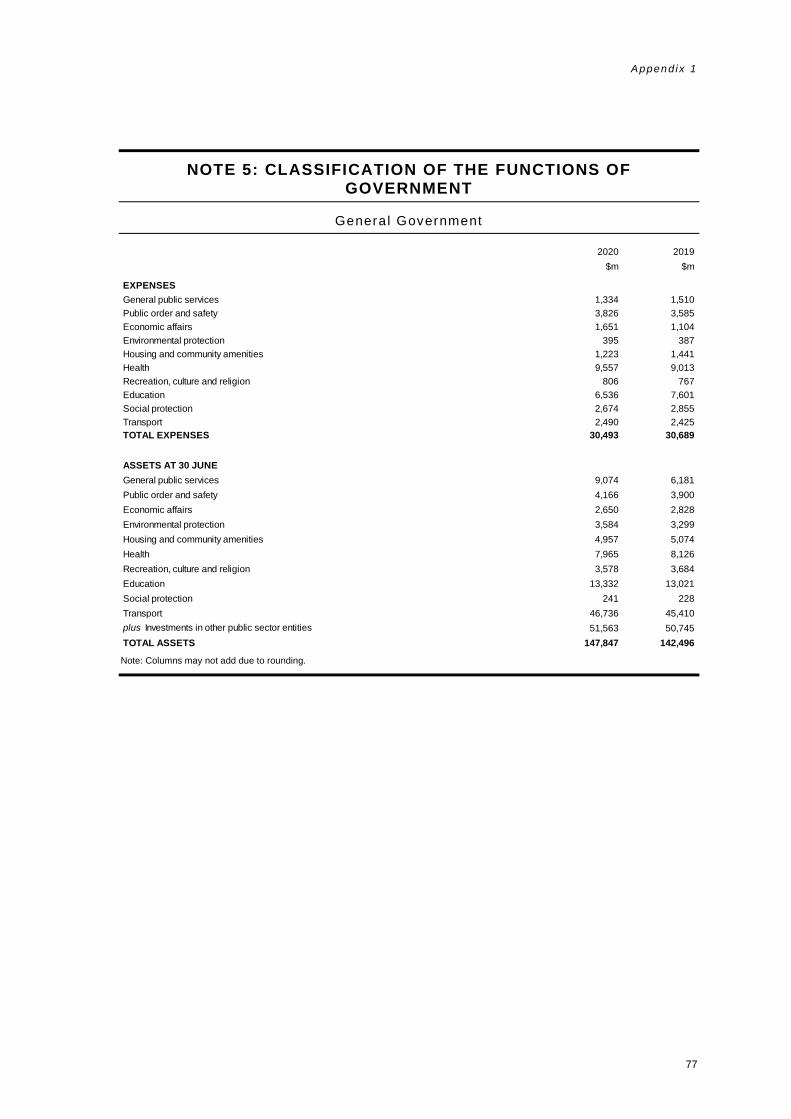
Appendix 1
77
NOTE 5: CLASSIFICATION OF THE FUNCTIONS OF GOVERNMENT
General Government
Note: Columns may not add due to rounding.
2020 2019$m $m
EXPENSESGeneral public services 1,334 1,510Public order and safety 3,826 3,585Economic affairs 1,651 1,104Environmental protection 395 387Housing and community amenities 1,223 1,441Health 9,557 9,013Recreation, culture and religion 806 767Education 6,536 7,601Social protection 2,674 2,855Transport 2,490 2,425TOTAL EXPENSES 30,493 30,689
ASSETS AT 30 JUNEGeneral public services 9,074 6,181Public order and safety 4,166 3,900Economic affairs 2,650 2,828Environmental protection 3,584 3,299Housing and community amenities 4,957 5,074Health 7,965 8,126Recreation, culture and religion 3,578 3,684Education 13,332 13,021Social protection 241 228Transport 46,736 45,410plus Investments in other public sector entities 51,563 50,745TOTAL ASSETS 147,847 142,496
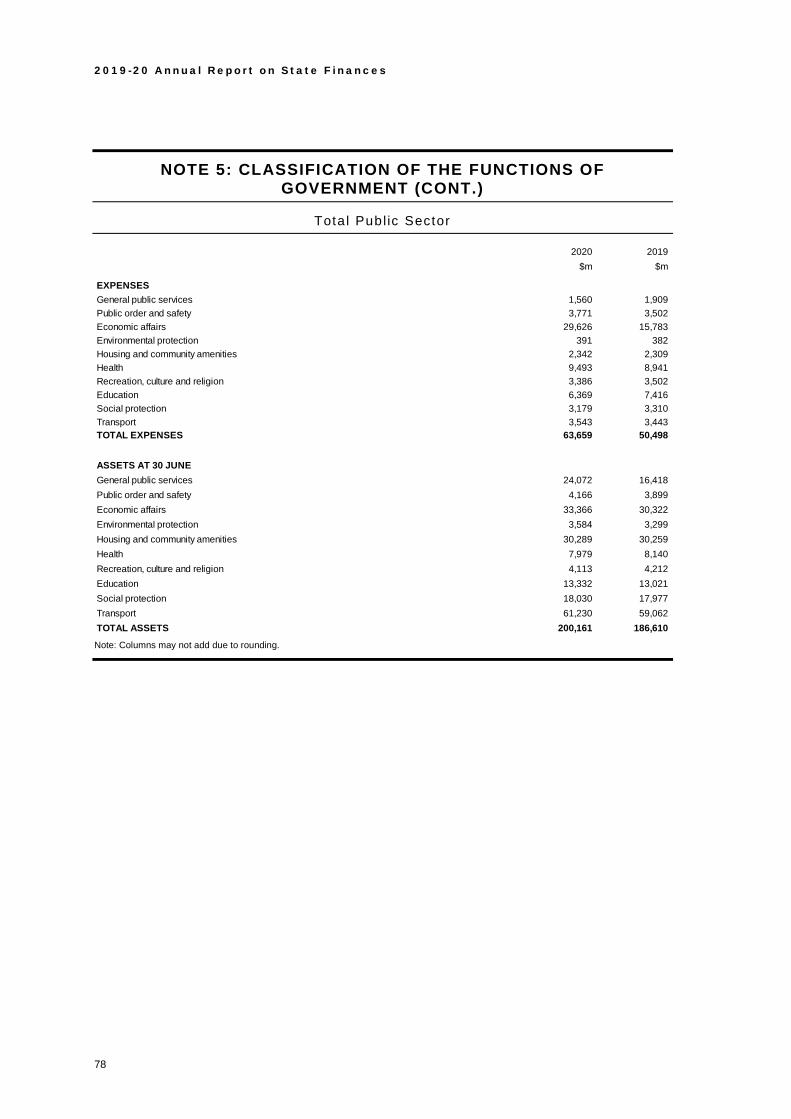
2019-20 Annual Report on State F inances
78
NOTE 5: CLASSIFICATION OF THE FUNCTIONS OF GOVERNMENT (CONT.)
Total Publ ic Sector
Note: Columns may not add due to rounding.
2020 2019$m $m
EXPENSESGeneral public services 1,560 1,909Public order and safety 3,771 3,502Economic affairs 29,626 15,783Environmental protection 391 382Housing and community amenities 2,342 2,309Health 9,493 8,941Recreation, culture and religion 3,386 3,502Education 6,369 7,416Social protection 3,179 3,310Transport 3,543 3,443TOTAL EXPENSES 63,659 50,498
ASSETS AT 30 JUNEGeneral public services 24,072 16,418Public order and safety 4,166 3,899Economic affairs 33,366 30,322Environmental protection 3,584 3,299Housing and community amenities 30,289 30,259Health 7,979 8,140Recreation, culture and religion 4,113 4,212Education 13,332 13,021Social protection 18,030 17,977Transport 61,230 59,062TOTAL ASSETS 200,161 186,610
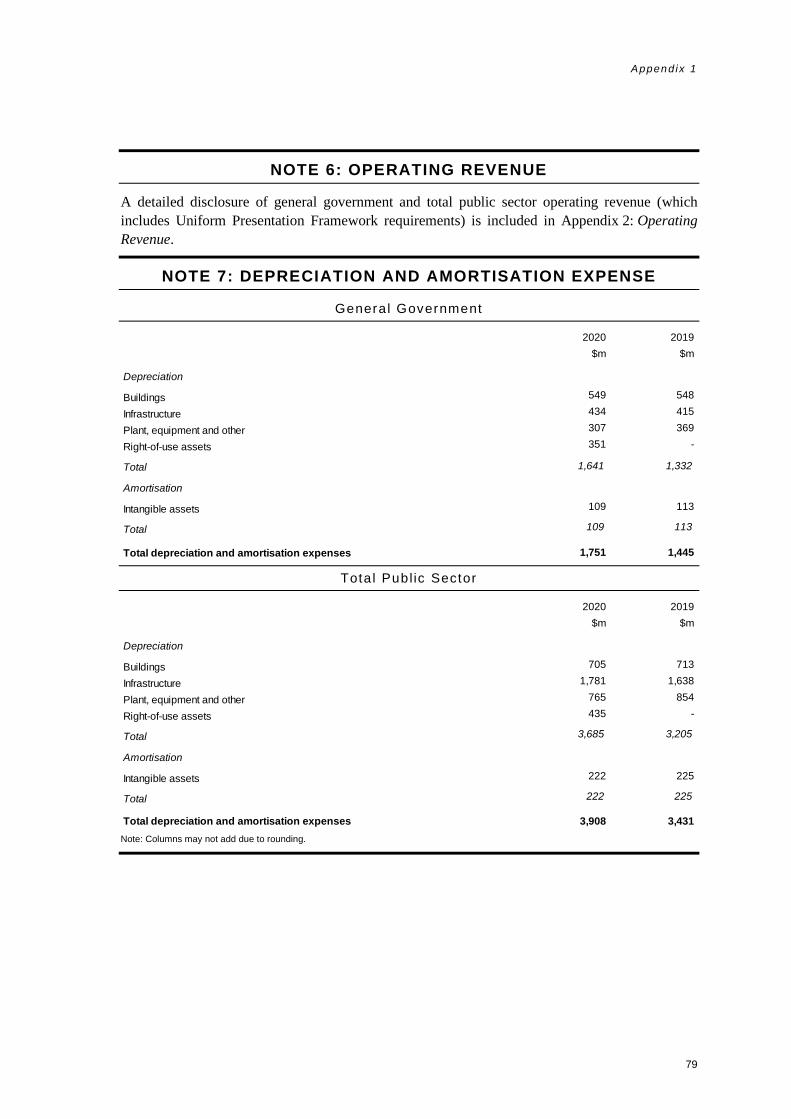
Appendix 1
79
NOTE 6: OPERATING REVENUE
A detailed disclosure of general government and total public sector operating revenue (which includes Uniform Presentation Framework requirements) is included in Appendix 2: Operating Revenue.
NOTE 7: DEPRECIATION AND AMORTISATION EXPENSE
General Government
Tota l Publ ic Sector
Note: Columns may not add due to rounding.
2020 2019$m $m
Depreciation
Buildings 549 548
Infrastructure 434 415
Plant, equipment and other 307 369
Right-of-use assets 351 -
Total 1,641 1,332
Amortisation
Intangible assets 109 113
Total 109 113
Total depreciation and amortisation expenses 1,751 1,445
2020 2019$m $m
Depreciation
Buildings 705 713
Infrastructure 1,781 1,638
Plant, equipment and other 765 854
Right-of-use assets 435 -
Total 3,685 3,205
Amortisation
Intangible assets 222 225
Total 222 225
Total depreciation and amortisation expenses 3,908 3,431

2019-20 Annual Report on State F inances
80
NOTE 8: OTHER GROSS OPERATING EXPENSES
General Government
Tota l Publ ic Sector
Note: Columns may not add due to rounding.
NOTE 9: OTHER INTEREST
General Government
Tota l Publ ic Sector
Note: Columns may not add due to rounding.
2020 2019$m $m
Services purchased from non-government agencies 1,458 1,794
Health sector specific expenses 1,488 1,380
Other 1,213 1,302
Education sector specific expenses 734 687
Consumable expenses 498 482
Total 5,391 5,645
2020 2019$m $m
Gold Corporation inventories 24,578 11,018
Other 2,438 2,519
Betting dividends payouts 1,549 1,680
Health sector specific expenses 1,488 1,380
Services purchased from non-government agencies 1,473 1,807
Electricity, gas and other direct costs 1,455 1,628
Insurance claims expenses 982 1,056
Education sector specific expenses 734 687
Consumable expenses 330 309
Total 35,027 22,084
2020 2019$m $m
Other Interest 737 859 Interest on Leases 142 89 Total 878 948
2020 2019$m $m
Other Interest 1,333 1,583 Interest on Leases 231 174 Total 1,564 1,756

Appendix 1
81
NOTE 10: TRANSFER EXPENSES
Transfer expenses are defined as the provision of something of value for no specific return or consideration, such as grants, subsidies, donations, transfers of assets free of charge.
The following tables provide detail of current and capital transfer expenses of the general government sector and the total public sector, in line with Uniform Presentation Framework disclosure requirements.
TRANSFER EXPENSES (a)
General Government
Tota l Publ ic Sector
(a) Includes grants, subsidies and other transfer expenses. Note: Columns may not add due to rounding.
2020 2019$m $m
CURRENT TRANSFERSLocal government 323 384Local government on-passing - 181Private and not-for-profit sector 1,609 1,377Private and not-for-profit sector on-passing - 1,323Other sectors of government 3,071 2,161Total Current Transfers 5,003 5,426
CAPITAL TRANSFERSLocal government 96 64Local government on-passing - 118Private and not-for-profit sector 68 87Private and not-for-profit sector on-passing - 18Other sectors of government 64 338Total Capital Transfers 228 625
2020 2019$m $m
CURRENT TRANSFERSLocal government 323 385Local government on-passing - 181Private and not-for-profit sector 2,744 2,185Private and not-for-profit sector on-passing - 1,323Other sectors of government 626 337Total Current Transfers 3,693 4,411
CAPITAL TRANSFERSLocal government 96 65Local government on-passing - 118Private and not-for-profit sector 99 119Private and not-for-profit sector on-passing - 18Total Capital Transfers 194 319

2019-20 Annual Report on State F inances
82
NOTE 11: RECEIVABLES
General Government
Tota l Publ ic Sector
Note: Columns may not add due to rounding.
2020 2019$m $m
Receivables 4,195 4,195Provision for impairment of receivables -257 -196Total receivables 3,938 3,999
Reconciliation of changes in the allowance for impairment of receivables:Balance at start of year 196 265Expected credit losses expense 126 -2Amounts w ritten off during the year -66 -61Amounts recovered during the year - -6Balance at the end of year 257 196
2020 2019$m $m
Receivables 6,329 6,117Provision for impairment of receivables -406 -293Total receivables 5,923 5,825
Reconciliation of changes in the allowance for impairment of receivables:Balance at start of year 293 352Expected credit losses expense 198 16Amounts w ritten off during the year -90 -82Amounts recovered during the year 5 7Balance at the end of year 406 293

Appendix 1
83
NOTE 12: LAND
General Government
Tota l Publ ic Sector
Land valuations are provided by the Western Australian Land Information Authority (Valuation Services Branch) each financial year with
an effective date of 1 July. The valuation is based on information on the stock of land as at 30 June 2019. Land vested in local authorities of $1,960 million (2019: $1,976 million) is not recognised in the consolidated Balance Sheet, as it is not under State public sector control.
Land under roads valuations are provided by the Western Australian Land Information Authority (Valuation Services) each financial year with an effective date of 1 July. The valuation is based on information on the stock of land at 30 June 2019.
Note: Columns may not add due to rounding.
2020 2019$m $m
Land, at fair value(a) 12,374 12,424
Land under roads, at fair value(b) 22,864 23,177
Total 35,238 35,600
2020 2019$m $m
Land, at fair value(a) 20,735 20,633
Land under roads, at fair value(b) 22,864 23,177
Total 43,599 43,809

2019-20 Annual Report on State F inances
84
NOTE 13: OTHER PROPERTY, PLANT AND EQUIPMENT
General Government
Tota l Publ ic Sector
Building valuations are provided by Western Australian Land Information Authority (Valuation Services) and by other independent
professional valuers. Revaluations are made with sufficient regularity to ensure that the carrying amount does not materially differ from fair value at reporting date.
Electricity generation and transmission includes the cost of decommissioning of property, plant and equipment including the cost of dismantling and removing the asset and restoring the site on which it is located, to the extent that these costs are also recognised as a provision.
Road infrastructure comprising roads, bridges and road furniture was valued at fair value by the Commissioner of Main Roads’ Engineer at 30 June 2020.
Water storage and distribution, comprising pipelines, outfalls and fittings, dams, reservoirs, bores and tanks, ocean outfalls, pump stations and treatment plants, drains and channels and other structures, are reported at deemed cost being a revalued amount prior to transition that approximates the fair value as at date of valuation.
Note: Columns may not add due to rounding.
2020 2019$m $m
Buildings, at fair value (a) 19,438 19,843Accumulated Depreciation and impairment losses -522 -473Total 18,917 19,369
Electricity generation and transmission, at fair value (b) - 1Accumulated Depreciation - -1Total - -
Road networks, at fair value (c) 32,801 30,519Accumulated Depreciation -12,150 -11,421Total 20,652 19,098
Other infrastructure, at fair value 1,615 1,545Accumulated Depreciation -315 -267Total 1,300 1,278
Plant, equipment and other, at fair value 4,354 4,511Accumulated Depreciation and impairment losses -1,876 -1,825Total 2,478 2,685
Fixed Assets under construction 3,016 2,914
Total Property, Plant and Equipment 46,363 45,344
2020 2019$m $m
Buildings, at fair value (a) 26,881 27,619Accumulated Depreciation and impairment losses -1,428 -1,381Total 25,453 26,238
Electricity generation and transmission, at fair value (b) 20,625 19,924Accumulated Depreciation -7,339 -6,929Total 13,286 12,995
Road networks, at fair value (c) 32,801 30,519Accumulated Depreciation -12,150 -11,421Total 20,652 19,098
Water storage and distribution, at fair value (d) 30,937 30,443Accumulated Depreciation -12,572 -12,134Total 18,364 18,309
Other infrastructure, at fair value 24,902 23,501Accumulated Depreciation -15,938 -14,815Total 8,964 8,686
Plant, equipment and other, at fair value 17,900 18,363Accumulated Depreciation and impairment losses -8,647 -8,726Total 9,254 9,637
Fixed Assets under construction 6,601 6,136
Total Property, Plant and Equipment 102,575 101,099

NOTE 14: RECONCILIATION OF LAND AND OTHER PROPERTY, PLANT AND EQUIPMENT (a)
General Government
30 June 2020 Land
Land under Roads Buildings
Electricitygeneration
and transmission
Roadnetw orks
Other Infra-
structure
Plant, equip &
other
Fixed Assets
under Construction Total
$m $m $m $m $m $m $m $m $m
Carrying amount at beginning of year 12,424 23,177 19,369 - 19,098 1,278 2,685 2,914 80,945Adjustment for change in accounting policy - AASB 16(a) -8 - -593 - - - -145 - -746Restated carrying amount at beginning of year 12,415 23,177 18,777 - 19,098 1,278 2,540 2,914 80,199
Assets classif ied as held for sale 14 - 2 - - - - - 17Additions 205 19 80 - - 4 230 2,084 2,621Disposals -40 - -11 - -98 -6 -82 -12 -249Transfers in/-out -7 22 549 - 1,199 64 69 -1,955 -60Revaluation increments/-decrements -212 -353 68 - 845 3 24 - 376Depreciation - - -549 - -385 -49 -307 - -1,290Other -1 - 2 - -7 6 4 -15 -11Carrying amount at end of year 12,374 22,864 18,917 - 20,652 1,300 2,478 3,016 81,601
30 June 2019 Land
Land under Roads Buildings
Electricitygeneration
and transmission
Roadnetw orks
Other Infra-
structure
Plant, equip &
other
Fixed Assets
under Construction Total
$m $m $m $m $m $m $m $m $m
Carrying amount at beginning of year 12,866 23,540 19,576 1 18,630 1,252 2,806 2,444 81,115Assets classif ied as held for sale 69 - - - - - - - 69Additions 127 - 157 - - 4 246 2,101 2,635Disposals -93 - -16 - -86 -5 -38 -1 -240Transfers in/-out -5 22 673 - 914 55 37 -1,630 67Revaluation increments/-decrements -538 -386 -456 -1 14 14 2 - -1,352Depreciation - - -548 - -367 -48 -369 - -1,332Other -2 - -17 - -7 6 1 1 -18Carrying amount at end of year 12,424 23,177 19,369 - 19,098 1,278 2,685 2,914 80,945
Ap
pe
nd
ix 1
85
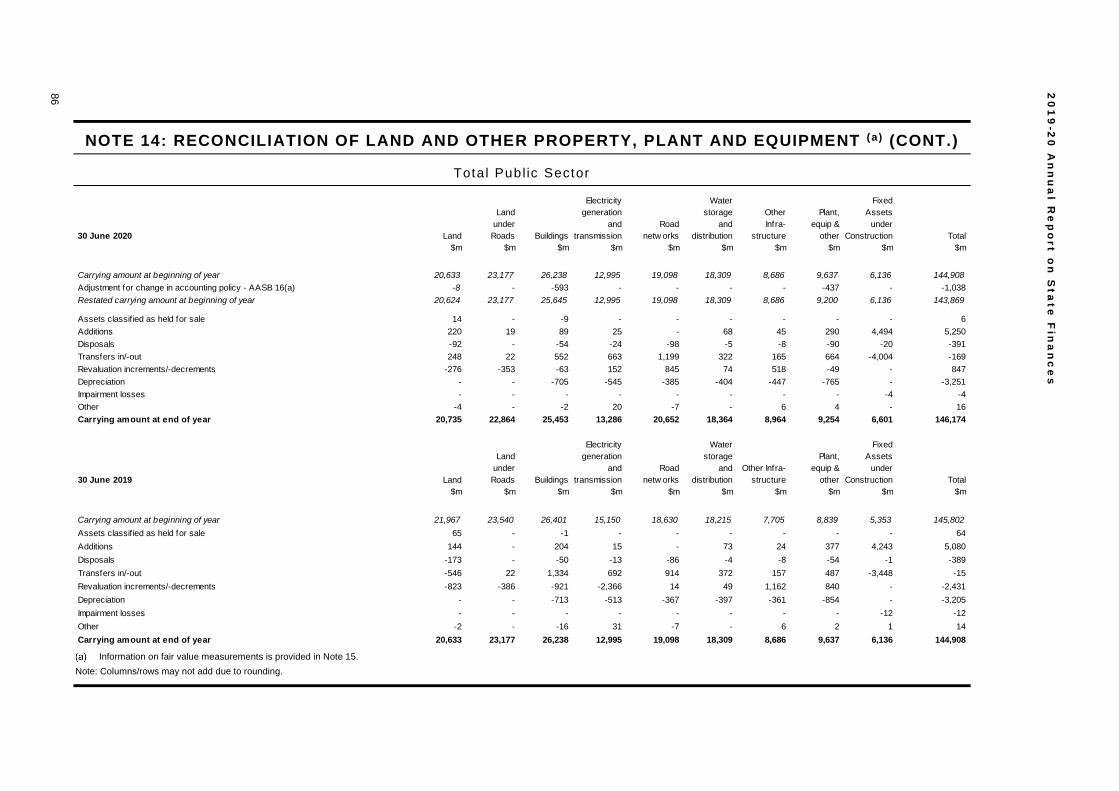
NOTE 14: RECONCILIATION OF LAND AND OTHER PROPERTY, PLANT AND EQUIPMENT (a) (CONT.)
Total Publ ic Sector
Information on fair value measurements is provided in Note 15.
Note: Columns/rows may not add due to rounding.
30 June 2020 Land
Land under Roads Buildings
Electricitygeneration
and transmission
Roadnetw orks
Water storage
and distribution
Other Infra-
structure
Plant, equip &
other
Fixed Assets
under Construction Total
$m $m $m $m $m $m $m $m $m $m
Carrying amount at beginning of year 20,633 23,177 26,238 12,995 19,098 18,309 8,686 9,637 6,136 144,908Adjustment for change in accounting policy - AASB 16(a) -8 - -593 - - - - -437 - -1,038Restated carrying amount at beginning of year 20,624 23,177 25,645 12,995 19,098 18,309 8,686 9,200 6,136 143,869
Assets classif ied as held for sale 14 - -9 - - - - - - 6Additions 220 19 89 25 - 68 45 290 4,494 5,250Disposals -92 - -54 -24 -98 -5 -8 -90 -20 -391Transfers in/-out 248 22 552 663 1,199 322 165 664 -4,004 -169Revaluation increments/-decrements -276 -353 -63 152 845 74 518 -49 - 847Depreciation - - -705 -545 -385 -404 -447 -765 - -3,251Impairment losses - - - - - - - - -4 -4Other -4 - -2 20 -7 - 6 4 - 16Carrying amount at end of year 20,735 22,864 25,453 13,286 20,652 18,364 8,964 9,254 6,601 146,174
30 June 2019 Land
Land under Roads Buildings
Electricitygeneration
and transmission
Roadnetw orks
Water storage
and distribution
Other Infra-structure
Plant, equip &
other
Fixed Assets
under Construction Total
$m $m $m $m $m $m $m $m $m $m
Carrying amount at beginning of year 21,967 23,540 26,401 15,150 18,630 18,215 7,705 8,839 5,353 145,802Assets classif ied as held for sale 65 - -1 - - - - - - 64Additions 144 - 204 15 - 73 24 377 4,243 5,080Disposals -173 - -50 -13 -86 -4 -8 -54 -1 -389Transfers in/-out -546 22 1,334 692 914 372 157 487 -3,448 -15Revaluation increments/-decrements -823 -386 -921 -2,366 14 49 1,162 840 - -2,431Depreciation - - -713 -513 -367 -397 -361 -854 - -3,205Impairment losses - - - - - - - - -12 -12Other -2 - -16 31 -7 - 6 2 1 14Carrying amount at end of year 20,633 23,177 26,238 12,995 19,098 18,309 8,686 9,637 6,136 144,908
86
20
19
-20
An
nu
al R
ep
ort o
n S
tate
Fin
an
ce
s

Appendix 1
87
NOTE 15: FAIR VALUE MEASUREMENTS
General Government
Assets measured at fair value
Assets valued using quoted prices (unadjusted) in active markets for identical assets. Assets valued using inputs based on observable market data (either directly or indirectly). Assets valued using inputs not based on observable market data.
Note: Columns/rows may not add due to rounding.
Measurement of fair values
Transfers between Level 1, 2 and 3
The following transfers between fair value hierarchy levels have been identified for agencies with significant asset values within the general government sector for the period ending 30 June 2020.
• The Department for Local Government, Sport and Cultural Industries transferred $374 million of museum collection from level 2 to level 3 in 2019-20.
Level 1(a) Level 2 (b) Level 3 (c)Fair value
at end of period$m $m $m $m
30 June 2020
Assets classif ied as held for sale (Note 21) - 17 4 21Land (Note 12,14) 3 3,008 9,363 12,374Land under roads (Note 12,14) - - 22,864 22,864Buildings (Note 13,14) - 459 18,458 18,917Electricity generation and transmission (Note 13,14) - - - -
Road netw orks (Note 13,14) - - 20,652 20,652Other infrastructure (Note 13,14) - - 1,300 1,300Plant, equipment and other (Note 13,14) - 1 2,477 2,478Biological assets (Note 18) 2 - 106 109Investment property (Note 22) - 7 - 7
Total 5 3,492 75,224 78,721
Level 1(a) Level 2 (b) Level 3 (c)Fair value
at end of period$m $m $m $m
30 June 2019
Assets classif ied as held for sale (Note 21) - 33 10 43Land (Note 12,14) 24 2,843 9,557 12,424Land under roads (Note 12,14) - - 23,177 23,177Buildings (Note 13,14) 53 454 18,862 19,369Electricity generation and transmission (Note 13,14) - - - - Road netw orks (Note 13,14) - - 19,098 19,098Other infrastructure (Note 13,14) - 166 1,112 1,278Plant, equipment and other (Note 13,14) - 374 2,311 2,685Biological assets (Note 18) - 2 1 3Investment property (Note 22) - 7 - 7
Total 78 3,879 74,128 78,084

Appendix 1
89
NOTE 15: FAIR VALUE MEASUREMENTS (CONT.)
Valuation techniques to derive Level 2 fair values
There were no significant changes in valuation techniques during the period.
The following valuation techniques to derive Level 2 fair values have been identified for agencies with significant asset values within the general government sector.
• Level 2 fair values of assets classified as held for sale, land, buildings and investment property are derived using the market approach. Market evidence of sales prices of comparable assets is used to determine price per square metre for land and buildings, with adjustments made for differences in key attributes.
• Level 2 fair values of biological assets are derived using the market rates less costs to sell.
• Assets held for sale have been written down to fair value less costs to sell. Fair value has been determined by reference to market evidence of sales prices of comparable assets.

Ap
pe
nd
ix 1
NOTE 15: FAIR VALUE MEASUREMENTS (CONT.)
General Government
Fair value measurements using significant unobservable inputs (Level 3) (a)(b)
There were no gains or losses for the period included in Operating Result for assets held at the end of the reporting period, under ‘Net gains on assets/liabilities’. There was no change in unrealised gains or loss for the period included in the Operating Result for assets held at the end of the reporting period.
Note: Columns may not add due to rounding.
Assets classified as held for sale Land
Land under Roads Buildings
Electricitygeneration
and transmission
Roadnetworks
Other Infra-
structure
Plant, equip &
otherBiological
assets$m $m $m $m $m $m $m $m $m
30 June 2020Fair value at start of period 10 9,557 23,177 18,862 - 19,098 1,112 2,311 1
Adjustment for change in accounting policy - AASB 16(a) - - - -559 - - - -145 -
Restated fair value at the start of period 10 9,557 23,177 18,303 - 19,098 1,112 2,166 1
Transfers - - - - - - - - 134
Additions - 154 41 614 - 1,189 27 331 -
Revaluation increments/-decrements recognised in All other movements in equity - -326 -353 74 - 845 - 24 -29
Transfers from/-to Level 2 -4 47 - 8 - - 177 374 -
Transfers between asset classes - - - - - - 26 -26 -
Disposals -2 -61 - -10 - -89 -6 -82 -
Depreciation - - - -523 - -392 -45 -307 -
Other - -8 - -9 - - 8 -4 -
Fair value at end of period 4 9,363 22,864 18,458 - 20,652 1,300 2,477 106
Assets classified as held for sale Land
Land under Roads Buildings
Electricitygeneration
and transmission
Roadnetworks
Other Infra-
structure
Plant, equip &
otherBiological
assets$m $m $m $m $m $m $m $m $m
30 June 2019Fair value at start of period 91 8,613 23,540 18,977 1 18,630 1,252 2,437 1
Additions - 21 22 694 - 950 51 286 -
Revaluation increments/-decrements recognised in All other movements in equity - -536 -386 -441 -1 14 10 -1 -
Transfers from/-to Level 2 - 1,458 - 155 - - -162 -2 -
Transfers between asset classes -84 53 - 32 - - - - -
Disposals -1 -49 - -20 - -122 - -38 -
Depreciation - - - -521 - -373 -44 -369 -
Other 4 -3 - -14 - - 5 -2 -
Fair value at end of period 10 9,557 23,177 18,862 - 19,098 1,112 2,311 1
89

2019-20 Annual Report on State F inances
90
NOTE 15: FAIR VALUE MEASUREMENTS (CONT.)
Valuation processes
Transfers in and out of a fair value level are recognised on the date of the event or change in circumstances that caused the transfer. Transfers are generally limited to assets newly classified as assets held for sale as the State’s Treasurer’s Instructions require valuations of land, buildings and infrastructure to be categorised within Level 3 where the valuations will utilise significant Level 3 inputs on a recurring basis.
Valuation techniques to derive Level 3 fair values
There were no significant changes in valuation methodologies within the general government sector for the period ending 30 June 2020.
The following valuation techniques have been identified for agencies with significant Level 3 asset values within the general government sector, reflecting the accounting policy of the agencies with such assets.
• Fair value for restricted-use land is based on comparison with market evidence for land with low level utility (high restricted-use land). The relevant comparators of land with low level utility is selected by Valuation Services and represents the application of a significant Level 3 input in this valuation methodology. The fair value measurement is sensitive to values of comparator land, with higher values of comparator land correlating with higher estimated fair values of land.
• Fair value for current-use land assets, is measured firstly by establishing the opportunity cost of public purpose land, which is termed the hypothetical alternate land use value. This approach assumes unencumbered land use based upon potential highest and best alternative use as represented by surrounding land uses and market analysis. Fair value of the land is then determined on the assumption that the site is rehabilitated to a vacant marketable condition. This requires costs associated with rehabilitation to be deducted from the hypothetical alternate land use value of the land. Costs may include building demolition, clearing, planning approvals and time allowances associated with realising that potential. In some instances the legal, physical, economic and socio political restrictions on a land results in a minimal or negative current use land value. In this situation the land value adopted is the higher of the calculated rehabilitation amount or the amount determined on the basis of comparison to market-corroborated evidence of land with low level utility. Land of low-level utility is considered to be grazing land on the urban fringe of the metropolitan area with no economic farming potential or foreseeable development or redevelopment potential at the measurement date.

Appendix 1
91
NOTE 15: FAIR VALUE MEASUREMENTS (CONT.)
• Fair value for existing use specialised buildings, other infrastructure, road networks, and plant, equipment and ‘other’ is determined by reference to the cost of replacing the remaining future economic benefits embodied in the asset (i.e. the current replacement cost). Current replacement cost is the current cost of an asset less accumulated depreciation calculated on the basis of such cost to reflect the already consumed or expired economic benefit, or obsolescence, and optimisation (where applicable) of the asset. Current replacement cost is generally determined by reference to the market observable replacement cost of a substitute asset of comparable utility and the gross project size specifications.
• Current replacement cost for road networks is determined every three years by reference to the cost of a new asset and adjusted in the intervening years by reference to a cost index (ABS Road and Bridge Construction Cost index or rates obtained by professional estimators specialising in road infrastructure works) to ensure asset values do not materially differ from fair value.
• Fair value for assets classified as held for sale or for distribution to owners has been written down to fair value less costs to sell. Fair value has been determined by reference to market evidence of sales prices of comparable assets.
The Level 3 inputs used are derived and evaluated as follows.
Selection of land with similar approximate utility
Fair value for restricted-use land is determined by comparison with market evidence for land with low level utility. Relevant comparators of land with low level utility are selected by Valuation Services.
Difference between hypothetical alternate land use value and current-use land value
For current-use land assets, fair value is measured firstly by establishing the opportunity cost of public purpose land, which is termed the hypothetical alternate land use value.
Selection of land adjoining road reserve
The fair value of road infrastructure comprising of land under roads is determined by comparison with the unimproved land values for land tax purposes maintained by Valuation Services.
Consumed economic benefit/obsolescence of assets
This is estimated by Valuation Services and applies to the majority of the asset classes.
Effective age
The effective age is determined by Valuation Services for buildings and by the Department of Education’s valuer for its building sub-classes, after taking into account factors such as planned routine maintenance, building improvements and upgrades.
2019-20 Annual Report on State F inances
92
NOTE 15: FAIR VALUE MEASUREMENTS (CONT.)
Percentage rate of add-on cost - buildings and building sub-classes
Valuation Services has determined that the costs relating to contingencies, headworks, demolition costs, professional and project fees are inherent in the building valuations and therefore should not be added to its valuations. This also applies to the building sub-classes.
Average installation costs - transportable
The cost of transportation and connection of services is determined by a quantity surveyor.
Residual value of 25% of current replacement cost
The straight-line method of depreciation is applied to derive the depreciated replacement cost, assuming a uniform pattern of consumption over the initial 37 years of asset life (up to 75% of current replacement costs). All specialised buildings are assumed to have a residual value of 25% of their current replacement costs.
Historical cost per cubic metre - Road networks
The fair value of road infrastructure comprising of earthworks, pavements (including drainage and seals), bridges and road furniture is calculated using construction unit rates determined by a professional quantity surveying firm and multiplying these by the units that form the infrastructure asset.
The fair value of road infrastructure comprising of principal shared paths and certain road furniture are extracted from financial records of the Commissioner of Main Roads and indexed by movements in the ABS Road and Bridge Construction cost index.
Application of a cost construction index to historical cost
The application of a construction index for some buildings and infrastructure is applied to the construction cost to derive fair value.
Historical cost per library and artwork collection
The cost approach is based on the principle that the price that a buyer in the market would pay no more for an asset than the cost to obtain an asset of equal utility or similar characteristics, whether by purchase, by construction or by fieldwork. The cost of works of art and fieldworks for collections is extracted from financial records of the State Library of Western Australia and the Western Australian Museum.

Appendix 1
93
NOTE 15: FAIR VALUE MEASUREMENTS (CONT.)
Information about significant unobservable inputs (Level 3) in fair value measurements
The following table shows the valuation techniques used in measuring Level 3 fair values for significant asset classes, including the significant unobservable inputs used.
General Government ( a )
(a) Reconciliations of the opening and closing balances are provided in Notes 14 and 21.
Basis of valuation
In the absence of market-based evidence, due to the specialised nature of some non-financial assets, these assets are valued at Level 3 of the fair value hierarchy on an existing use basis. The existing use basis recognises that restrictions or limitations have been placed on the use and disposal of these assets when they are not determined to be surplus to requirements. These restrictions are imposed by virtue of the assets being held to deliver a specific community service.
Asset Measured at Fair Value Valuation Technique(s) Unobservable inputs
Assets classified as held for sale Current Replacement Cost
Consumed economic benefit/obsolescence of assetPercentage rate of add-on cost - buildings andbuilding sub-classesAverage installation costs - transportables
Market Approach Selection of land with similar approximate utility
Land Market Approach Selection of land with similar approximate utilitySelection of land with restricted utility
Value in Use Difference between hypothetical alternate land use value and current use land value
Land under roads Market Approach Selection of land adjoining road reserve
Buildings Current Replacement Cost Effective Age Percentage rate add-on costAverage installation costsResidual value of 25% of current replacement costApplication of a cost of construction index to historical costConsumed economic benefit/obsolescence of asset
Road networks Current Replacement Cost Historical cost per cubic metre (m3)
Other infrastructure Current Replacement Cost Consumed economic benefit/obsolescence of assetApplication of a cost of construction index to historical cost
Plant, equipment and other Current Replacement Cost Historical cost per library and artwork collection

2019-20 Annual Report on State F inances
94
NOTE 15: FAIR VALUE MEASUREMENTS (CONT.)
Total Publ ic Sector
Assets measured at fair value
Assets valued using quoted prices (unadjusted) in active markets for identical assets.
(b) Assets valued using inputs based on observable market data (either directly or indirectly). (c) Assets valued using inputs not based on observable market data. Note: Columns/rows may not add due to rounding.
Measurement of fair values
Transfers between Level 1, 2 and 3
All significant transfers that apply to the total public sector for the periods ending 30 June 2020 have been disclosed in the general government sector above.
Level 1(a) Level 2 (b) Level 3 (c)Fair value
at end of period$m $m $m $m
30 June 2020
Assets classified as held for sale (Note 21) - 33 4 37Land (Note 12,14) 24 9,004 11,707 20,735Land under roads (Note 12,14) - - 22,864 22,864Buildings (Note 13,14) 10 5,998 19,445 25,453Electricity generation and transmission (Note 13,14) - - 13,286 13,286Road networks (Note 13,14) - - 20,652 20,652Water storage and distribution (Note 13,14) - - 18,364 18,364Other infrastructure (Note 13,14) - - 8,964 8,964Plant, equipment and other (Note 13,14) - 1,252 8,002 9,254Biological assets (Note 18) 2 - 315 317Investment property (Note 22) - 33 - 33
Total 36 16,321 123,603 139,960
Level 1(a) Level 2 (b) Level 3 (c)Fair value
at end of period$m $m $m $m
30 June 2019
Assets classified as held for sale (Note 21) - 49 10 59Land (Note 12,14) 45 8,827 11,760 20,633Land under roads (Note 12,14) - - 23,177 23,177Buildings (Note 13,14) 64 6,385 19,788 26,238Electricity generation and transmission (Note 13,14) - - 12,995 12,995Road networks (Note 13,14) - - 19,098 19,098Water storage and distribution (Note 13,14) - - 18,309 18,309Other infrastructure (Note 13,14) - 166 8,520 8,686Plant, equipment and other (Note 13,14) - 1,697 7,940 9,637Biological assets (Note 18) - 2 343 345Investment property (Note 22) - 67 - 67
Total 111 17,193 121,939 139,243

Appendix 1
95
NOTE 15: FAIR VALUE MEASUREMENTS (CONT.)
Valuation techniques to derive Level 2 fair values
There were no significant changes in valuation techniques during the period.
The valuation techniques to derive Level 2 fair values disclosed in the general government sector above also applies to the total public sector. In addition, the disclosure below is specific to the total public sector.
The fair values of Level 2 plant, equipment and ‘other’ are derived using the market approach. These assets include rollingstock and buses, which are owned by the Public Transport Authority. Market evidence of sales prices of rollingstock and bus contracts held by the Public Transport Authority are used to determine price per railcar and bus respectively. It should be noted that rollingstock is classified as both Level 2 and Level 3 on the fair value hierarchy as market information is available for urban railcars. However, regional rollingstock has been valued by an independent third party as no observable inputs are available.

NOTE 15: FAIR VALUE MEASUREMENTS (CONT.) Total Publ ic Sector
Fair value measurements using significant unobservable inputs (Level 3) (a)(b)
There was no change in unrealised gains or loss for the period included in the Operating Result for assets held at the end of the reporting period. Represents gains or losses for the period included in the Operating Result for assets held at the end of the reporting period, under ‘Net gains on assets/liabilities’.
Note: Columns may not add due to rounding
Assets classified as held for sale Land
Land under Roads Buildings
Electricitygeneration
and transmission
Water storage and
distributionRoad
networks
Other Infra-
structure
Plant, equip &
otherBiological
assets$m $m $m $m $m $m $m $m $m $m
30 June 2020Fair value at start of period 10 11,760 23,177 19,788 12,995 19,098 18,309 8,520 7,940 343
Adjustment for change in accounting policy - AASB 16(a) - - - -559 - - - - -437 -
Restated fair value at the start of period 10 11,760 23,177 19,229 12,995 19,098 18,309 8,520 7,503 343
Additions - 216 41 690 701 1189 390 176 905 -
Revaluation increments/-decrements recognised in All other movements in equity - -242 -353 81 153 845 74 508 5 -28
Transfers from/-to Level 2 -4 47 - 8 6 - - 168 374 -
Transfers between asset classes - - - - - - - 26 -26 -
Disposals -2 -66 - -11 -25 -89 -5 -8 -90 -
Depreciation - - - -569 -545 -392 -404 -434 -666 -
Other - -8 - 16 - - - 8 -4 -
Fair value at end of period 4 11,707 22,864 19,445 13,286 20,652 18,364 8,787 8,002 315
Assets classified as held for sale Land
Land under Roads Buildings
Electricitygeneration
and transmission
Roadnetworks
Water storage and
distribution
Other Infra-
structure
Plant, equip &
otherBiological
assets$m $m $m $m $m $m $m $m $m $m
30 June 2019Fair value at start of period 91 10,960 23,540 20,118 15,150 18,630 18,215 7,705 7,299 330
Additions - 54 22 771 707 950 445 174 729 6
Revaluation increments/-decrements recognised in All other movements in equity - -704 -386 -685 -2,366 14 49 1,159 838 7
Transfers from/-to Level 2 - 1,466 - 156 - - - -162 -115 -
Transfers between asset classes -84 53 - 32 - - - - - -
Disposals -1 -67 - -21 -13 -122 -4 -3 -53 -
Depreciation - - - -570 -513 -373 -397 -358 -758 -
Other 4 -3 - -13 31 - - 6 - -
Fair value at end of period 10 11,760 23,177 19,788 12,995 19,098 18,309 8,520 7,940 343
96
20
19
-20
An
nu
al R
ep
ort o
n S
tate
Fin
an
ce
s

Appendix 1
97
NOTE 15: FAIR VALUE MEASUREMENTS (CONT.)
Valuation processes
Transfers in and out of a fair value level are recognised on the date of the event or change in circumstances that caused the transfer. Transfers are generally limited to assets newly classified as non-current assets held for sale as the State’s Treasurer’s Instructions require valuations of land, buildings and infrastructure to be categorised within Level 3 where the valuations will utilise significant Level 3 inputs on a recurring basis.
Valuation techniques to derive Level 3 fair values
There were no significant changes in valuation techniques during the period. In addition, the following valuation techniques have been identified for public corporations with significant Level 3 asset values within the total public sector.
• Fair value for restricted-use land is based on comparison with market evidence for land with low level utility (high restricted-use land). The relevant comparators of land with low level utility is selected by Valuation Services and represents the application of a significant Level 3 input in this valuation methodology. The fair value measurement is sensitive to values of comparator land, with higher values of comparator land correlating with higher estimated fair values of land.
• Fair value for existing use specialised buildings, electricity generation and transmission, water storage and distribution, other infrastructure, road networks, and plant, equipment and ‘other’ is determined by reference to the cost of replacing the remaining future economic benefits embodied in the asset (i.e. the current replacement cost). Current replacement cost is the current cost of an asset less accumulated depreciation calculated on the basis of such cost to reflect the already consumed or expired economic benefit, or obsolescence, and optimisation (where applicable) of the asset. Current replacement cost is generally determined by reference to the market observable replacement cost of a substitute asset of comparable utility and the gross project size specifications.
• Fair value for existing use specialised infrastructure assets is calculated by reference to the historical cost indexed by a combination of the following price indices as published by the ABS:
− Producer Price Index for building construction in Western Australia (approximately 81% weighting).
− Labour Price Index for total hourly rates of pay excluding bonuses using the index covering Australia; private industry; electricity, gas, water and waste supply; and all occupations (approximately 15% weighting).
− Consumer Price Index for all groups in Perth (approximately 4% weighting).

2019-20 Annual Report on State F inances
98
NOTE 15: FAIR VALUE MEASUREMENTS (CONT.)
• Fair value for biological assets is determined using the discounted cash flow method to measure fair values of standing timber and plantations. The valuation model for standing timber considers the present value of the net cash flows to be generated from the forest. The cash flows projections include specific estimates for Sandalwood Plantations of 17 years, standing timber Plantations of 38 years. The expected net cash flows are discounted using a risk adjusted discounted rate.
The Level 3 inputs disclosed in the general government sector above also applies to the total public sector. In addition, the disclosures below are specific to the total public sector.
Historical cost of electricity infrastructure per square kilometre
Historical cost of electricity infrastructure per square kilometre is extracted from the financial records of Western Power, then indexed by a combination of observable price indices for electricity related goods and services. That is, electricity infrastructure equates to plant and equipment, communications equipment, lines, sub-stations, transformers and switch yards.
Freight, Railway and Bus Infrastructure
Independent valuations were obtained by the Public Transport Authority for the following unobservable inputs.
Unobservable input
Input from independent valuation
report obtained in
Replacement cost per kilometre of rail network 2019 Replacement cost per cubic metre of railway ballast 2019 Replacement cost per sleeper (other rail) 2020 Replacement cost per sleeper (freight) Replacement cost per kilometre of overhead railway traction wiring Railway station replacement cost per square metre floor area Replacement cost per kilometre of rail line (freight) Replacement cost per kilometre of rail line (other rail) Replacement cost per railway signalling system Railway tunnel replacement cost per individual tunnel Replacement cost per square metre floor area (bus stations) Replacement cost per individual bus infrastructure items Replacement cost per individual systems infrastructure items Replacement cost per kilometre of systems infrastructure cabling
2019 2020 2020 2019 2020 2020 2020 2018 2018 2017 2017

Appendix 1
99
NOTE 15: FAIR VALUE MEASUREMENTS (CONT.)
Estimated variables associated with biological assets
The unobservable variables are mainly represented by estimated future timber market price per cubic metre and estimated average volume per annum, discounted at the rate for 2018 provided by an independent valuation obtained by the Forest Products Commission.
Information about significant unobservable inputs (Level 3) in fair value measurements
The following table shows the valuation techniques used in measuring Level 3 fair values, for significant asset classes, including the significant unobservable inputs used.

2019-20 Annual Report on State F inances
100
NOTE 15: FAIR VALUE MEASUREMENTS (CONT.)
Total Publ ic Sector ( a )
Asset Measured at Fair Value Valuation Technique(s) Unobservable inputsAssets classified as held for sale Current Replacement Cost Consumed economic benefit/obsolescence of asset
Market Approach Selection of land with similar approximate utility
Land Market Approach Selection of land with similar approximate utilitySelection of land with restricted utility
Value in UseDifference between hypothetical alternate land use value and current use land value
Land under roads Market Approach Selection of land adjoining road reserve
Buildings Current Replacement Cost Effective Age Percentage rate add-on costAverage installation costsResidual value of 25% of current replacement costApplication of a cost of construction index to historical costConsumed economic benefit/obsolescence for asset
Electricity generation and transmission Current Replacement CostConsumed economic benefit/obsolescence of electricity infrastructureHistorical cost of electricity infrastructure per km2
Road networks Current Replacement Cost Historical cost per cubic metre (m3)
Water storage and distribution Current Replacement Cost Consumed economic benefit/ obsolescence of asset
Other infrastructure Freight Network Infrastructure -
Consumed economic benefit/ obsolescence of assetReplacement cost per kilometre of networkReplacement cost per kilometre of railReplacement cost per cubic metres of ballastReplacement cost per sleeper
Railway Infrastructure - Current
Consumed economic benefit/ obsolescence of assetReplacement cost per individual tunnelReplacement cost per station structureReplacement cost per kilometre of rail lineReplacement cost per signalReplacement cost per sleeperReplacement cost per kilometre of overhead traction wiring
Systems Infrastructure - Current
Consumed economic benefit/obsolescence of assetReplacement cost per individual itemsReplacement cost per kilometre of cabling
Bus Infrastructure- Current
Consumed economic benefit/ obsolescence of assetReplacement cost per square metre floor area (m2)Replacement cost per individual items
Plant, equipment and other Current Replacement Cost Consumed economic benefit/ obsolescence of assetHistorical cost per library and artwork collection

Appendix 1
101
NOTE 15: FAIR VALUE MEASUREMENTS (CONT.)
Total Publ ic Sector ( a ) (Cont .)
(a) Reconciliations of the opening and closing balances are provided in Notes 14, 18 and 21.
Basis of valuation
In the absence of market-based evidence, due to the specialised nature of some non-financial assets, these assets are valued at Level 3 of the fair value hierarchy on an existing use basis. The existing use basis recognises that restrictions or limitations have been placed on the use and disposal of these assets when they are not determined to be surplus to requirements. These restrictions are imposed by virtue of the assets being held to deliver a specific community service.
Asset Measured at Fair Value Valuation Technique(s) Unobservable inputs
Biological assetsEstimated weighted average selling price per cubic meter
Estimated average volume per annum
Estimated variable and fixed costs to harvest over the forecast horizon
Estimated future timber market prices
Average selling price for pruductsEstimated average volume per annum
Estimated cost per tonne to harvest, produce and sell the volume over the forecast horizon
The area stockedEstimated future timber market prices per cubic metreFuture wood flow projections
Estimated future timber market prices based on $US/$A forward exchange rates to 2037 provided by Western Australian Treasury Corporation.The weighted average price for productsEstimated average volume per annumEstimated cost per tonne to harvest, produce and sell the volume over the forecast horizon
The area stockedEstimated future timber average market proces per hectareEstimated average volume per annumEstimated cost per hectare to harvest, produce and sell the volumn over the forecast horizon
Esperance pine Plantations - Discounted Cash Flow
Standing Timber (Native Forests) - Discounted Cash Flow
Standing Timber (Sandlewood) - Discounted Cash Flow
Standing Timber (Plantations) - Discounted Cash Flow
Sandalwood Plantations - Discounted Cash Flow

2019-20 Annual Report on State F inances
102
NOTE 16: RIGHT-OF-USE ASSETS
General Government
Tota l Publ ic Sector
Note: Columns may not add due to rounding.
2020 2019
$m $m
Depreciation expense of right-of-use assets 351 -
Lease interest expense 114 -
Expenses relating to variable lease payments not included in lease liabilities 94 -
Short-term leases 38 -
Low -value leases 2 -
Total amount recognised in the Operating Statement 600 -
Total cash outf low for leases 423 -
2020 2019
$m $m
Depreciation expense of right-of-use assets 435 -
Lease interest expense 182 -
Expenses relating to variable lease payments not included in lease liabilities 95 -
Short-term leases 46 -
Low -value leases 3 -
Total amount recognised in the Operating Statement 760 -
Total cash outf low for leases 519 -

NOTE 17: RECONCILIATION OF RIGHT-OF-USE ASSETS
General Government
Land Buildings
Plant, Equipment and Other Vehicles Total
$m $m $m $m $m
At 30 June 2019Opening net carrying amount - - - - -Recognition of right-of-use assets on initial application of AASB 16 16 2,392 176 22 2,607Restated opening carrying amount 16 2,392 176 22 2,607
1 July 2019Gross carrying amount 16 2,394 202 25 2,637Accumulated depreciation and impairment loss - -2 -26 -2 -30Carrying amount at beginning of year 16 2,392 176 22 2,607
Additions - 441 16 1 458Disposals - -229 - - -229Depreciation - -272 -68 -11 -351Carrying amount at end of year 30 June 2020 16 2,333 124 12 2,484
Gross carrying amount 16 2,581 217 24 2,838Accumulated depreciation and impairment loss - -248 -93 -13 -354
103
Ap
pe
nd
ix 1

NOTE 17: RECONCILIATION OF RIGHT-OF-USE ASSETS (CONT.)
Total Publ ic Sector
Land Buildings
Plant, Equipment and Other Vehicles
Pow er purchase
agreements Total$m $m $m $m $m $m
At 30 June 2019Opening net carrying amount - - - - - -Recognition of right-of-use assets on initial application of AASB 16 36 2,506 423 61 94 3,120Restated opening carrying amount 36 2,506 423 61 94 3,120
1 July 2019Gross carrying amount 40 2,525 726 65 247 3,602Accumulated depreciation and impairment loss -4 -19 -303 -4 -153 -482Carrying amount at beginning of year 36 2,506 423 61 94 3,120
Additions - 477 58 14 - 550Disposals - -229 - -9 - -238Depreciation -1 -297 -106 -21 -10 -435Carrying amount at end of year 30 June 2020 35 2,457 375 46 84 2,997
Gross carrying amount 40 2,746 785 76 247 3,894Accumulated depreciation and impairment loss -6 -289 -410 -31 -162 -898
104
20
19
-20
An
nu
al R
ep
ort o
n S
tate
Fin
an
ce
s

Appendix 1
105
NOTE 18: BIOLOGICAL ASSETS (a )
General Government
(a) Information on fair value measurements is provided in Note 15. (b) Native and plantation standing trees consist of mature and maturing standing trees stated at fair value less estimated selling costs,
based on discounted cash flow models using a pre-tax weighted average cost of capital, supported by market evidence. Note: Columns/rows may not add due to rounding.
2020 2019$m $m
Native and plantation standing trees (b) 105 -
Livestock and other 4 3
Total Biological Assets 109 3
Reconciliation of Biological Assets
30 June 2020 StandingTrees
Livestock and Other Total
$m $m $mCarrying amount at beginning of year - 3 3Transfers 134 - 134Gain/-loss from changes in fair value -29 1 -28 Other - - -
Carrying amount at end of year 105 4 109
30 June 2019 StandingTrees
Livestock and Other Total
$m $m $mCarrying amount at beginning of year - 3 3Gain/-loss from changes in fair value - - -Purchases - - -Other - - -
Carrying amount at end of year - 3 3
Reconciliation of changes in the carrying amount of biological assets at the beginning and the end of the year areset out below .

2019-20 Annual Report on State F inances
106
NOTE 18: BIOLOGICAL ASSETS (a ) (CONT.)
Total Publ ic Sector
(a) Information on fair value measurements is provided in Note 15. (b) Native and plantation standing trees consist of mature and maturing standing trees stated at fair value less estimated selling costs,
based on discounted cash flow models using a pre-tax weighted average cost of capital, supported by market evidence. Note: Columns/rows may not add due to rounding.
2020 2019$m $m
Native and plantation standing trees (b) 314 342
Livestock and other 4 3 Total Biological Assets 317 345
Reconciliation of Biological Assets
30 June 2020 StandingTrees
Livestock and Other Total
$m $m $mCarrying amount at beginning of year 342 3 345
Gain/-loss from changes in fair value -33 1 -33
Purchases 6 - 6
Other -1 - -1 Carrying amount at end of year 314 4 317
30 June 2019 StandingTrees
Livestock and Other Total
$m $m $mCarrying amount at beginning of year 329 3 332
Gain/-loss from changes in fair value 3 - 3
Purchases 6 - 6
Other 4 - 4 Carrying amount at end of year 342 3 345
Reconciliation of changes in the carrying amount of biological assets at the beginning and the end of the year are set outbelow.

Appendix 1
107
NOTE 19: INVENTORIES
General Government
Tota l Publ ic Sector
Note: Columns may not add due to rounding.
2020 2019$m $m
Other InventoriesOther materials and stores 98 61
Other 10 10
Total Other inventories 108 71
Total Inventories 108 71
2020 2019$m $m
Land InventoriesLand acquisition and development 1,809 1,852
Total Land inventories 1,809 1,852
Other InventoriesPrecious metals 5,982 3,913
Power station fuel stocks 124 119
Other materials and stores 295 282
Other 33 31
Total Other inventories 6,433 4,345
Total Inventories 8,242 6,197

2019-20 Annual Report on State F inances
108
NOTE 20: INTANGIBLE ASSETS
General Government
Note: Columns/rows may not add due to rounding.
2020 2019$m $m
Computer softw are 1,239 1,265Accumulated amortisation and impairment losses -864 -818Total 374 446
Softw are in progress 110 93
Commercialised assets 68 -Accumulated Amortisation and impairment losses -33 -Total 35 -
Other 160 156Accumulated amortisation and impairment losses -77 -70Total 84 87
Total Intangible Assets 603 626
Reconciliation of Intangibles
30 June 2020
ComputerSoftware
Software inprogress
Commer-cialisedassets
Other Total
$m $m $m $m $mCarrying amount at beginning of year 446 93 - 87 626Additions 20 76 13 4 113Disposals -11 -13 - -3 -27Transfers in/-out 13 -45 28 6 1Amortisation -95 - -6 -9 -109Accumulated amortisation w ritten back 10 - - 1 11Other -10 -1 - -2 -13
Carrying amount at end of year 374 110 35 84 603
30 June 2019
ComputerSoftware
Software inprogress
Commer-cialisedassets
Other Total
$m $m $m $m $mCarrying amount at beginning of year 482 62 - 83 627Additions 19 57 - 1 77Disposals -10 -2 - - -12Transfers in/-out 51 -22 - 12 41Impairment losses - - - - -Amortisation -104 - - -8 -113Accumulated amortisation w ritten back 8 - - - 8Other - -1 - - -2
Carrying amount at end of year 446 93 - 87 626

Appendix 1
109
NOTE 20: INTANGIBLES ASSETS (CONT.)
Total Publ ic Sector
Note: Columns/rows may not add due to rounding.
2020 2019$m $m
Computer softw are 2,639 2,530Accumulated amortisation and impairment losses -1,918 -1,782Total 721 748
Softw are in progress 131 110
Commercialised assets 68 -Accumulated Amortisation and impairment losses -33 -Total 35 -
Renew able Energy Certif icates 23 31
Other 261 235Accumulated amortisation and impairment losses -117 -96Total 144 139
Total Intangible Assets 1,054 1,028
Reconciliation of Intangibles
30 June 2020
ComputerSoftware
Software inprogress
Commer-cialisedassets
Renewable Energy
Certificate
Other Total
$m $m $m $m $m $mCarrying amount at beginning of year 748 110 - 31 139 1,028Additions 37 86 13 117 4 257Disposals -12 -13 - -125 -3 -153Transfers in/-out 136 -50 28 - 28 142Amortisation -193 - -6 - -24 -222Accumulated amortisation w ritten back 14 - - - 1 15Other -10 -1 - - -2 -12
Carrying amount at end of year 721 131 35 23 144 1,054
30 June 2019
ComputerSoftware
Software inprogress
Commer-cialisedassets
Renewable Energy
Certificate
Other Total
$m $m $m $m $m $mCarrying amount at beginning of year 811 80 - 49 145 1,085Additions 41 58 - 134 30 263Disposals -14 -2 - -152 -61 -229Transfers in/-out 130 -24 - - 14 119Impairment losses -21 - - - - -21Amortisation -210 - - - -15 -225Accumulated amortisation w ritten back 8 - - - 27 35Other 3 -2 - - - 1
Carrying amount at end of year 748 110 - 31 139 1,028

2019-20 Annual Report on State F inances
110
NOTE 21: ASSETS CLASSIFIED AS HELD FOR SALE (a)
General Government
Assets held for sale primarily relates to: the Western Australian Planning Commission ($7 million land held for sale), the Commissioner of Main Roads ($5 million land and buildings held for sale and $5 million of land sold during the year), the Mental Health Commission ($4 million land and buildings held for sale), the Department of Planning, Lands and Heritage (reclassified $18 million of land held for sale to property, plant and equipment), and the Department of Transport (reclassified $8 million land and buildings to property, plant and equipment, relating to the Welshpool Vehicle Examination Centre which has been temporarily re-opened to cater for the additional demand from learner drivers whose non-essential Practical Driving Assessment bookings were deferred during the COVID-19 restrictions).
(a) Information on fair value measurements is provided in Note 15. Note: Columns/rows may not add due to rounding.
2020 2019$m $m
Land 17 30Other 5 13Total 21 43
Reconciliation of Assets classified as held for sale
30 June 2020 Land Other Total$m $m $m
Carrying amount at beginning of year 30 13 43Assets reclassif ied as held for sale -10 -7 -17Write Dow n less cost to sell - -1 -1Assets sold -5 - -6Transfers out/other 2 - 2
Carrying amount at end of year 17 5 21
30 June 2019 Land Other Total$m $m $m
Carrying amount at beginning of year 113 12 125Assets reclassif ied as held for sale -73 3 -69Assets sold -8 -1 -9Impairment losses - - -2Transfers out/other -2 - -2
Carrying amount at end of year 30 13 43
Reconciliation of changes in the carrying amount of assets classif ied as held for sale at the beginning and the end ofthe year are set out below .

Appendix 1
111
NOTE 21: ASSETS CLASSIFIED AS HELD FOR SALE (CONT.) (a)
Total Publ ic Sector
In addition to those disclosed for the general government sector, assets held for sale by the total public sector primarily comprise of the Department of Communities (Housing Authority, $12 million rental properties held for sale, during the year there was $6 million sold).
(a) Information on fair value measurements is provided in Note 15. Note: Columns/rows may not add due to rounding.
2020 2019$m $m
Land 20 36Other 17 23Total 37 59
Reconciliation of Assets classified as held for sale
30 June 2020 Land Other Total$m $m $m
Carrying amount at beginning of year 36 23 59Assets reclassif ied as held for sale -10 3 -6Write Dow n less cost to sell - -1 -1Assets sold -8 -7 -15Impairment losses - -1 -2Transfers out/other 2 - 2
Carrying amount at end of year 20 17 37
30 June 2019 Land Other Total$m $m $m
Carrying amount at beginning of year 116 68 183Assets reclassif ied as held for sale -69 5 -64Write Dow n less cost to sell - - -1Assets sold -8 -48 -56Impairment losses - -1 -1Transfers out/other -2 -1 -2
Carrying amount at end of year 36 23 59
Reconciliation of changes in the carrying amount of assets classif ied as held for sale at the beginning and the end ofthe year are set out below .
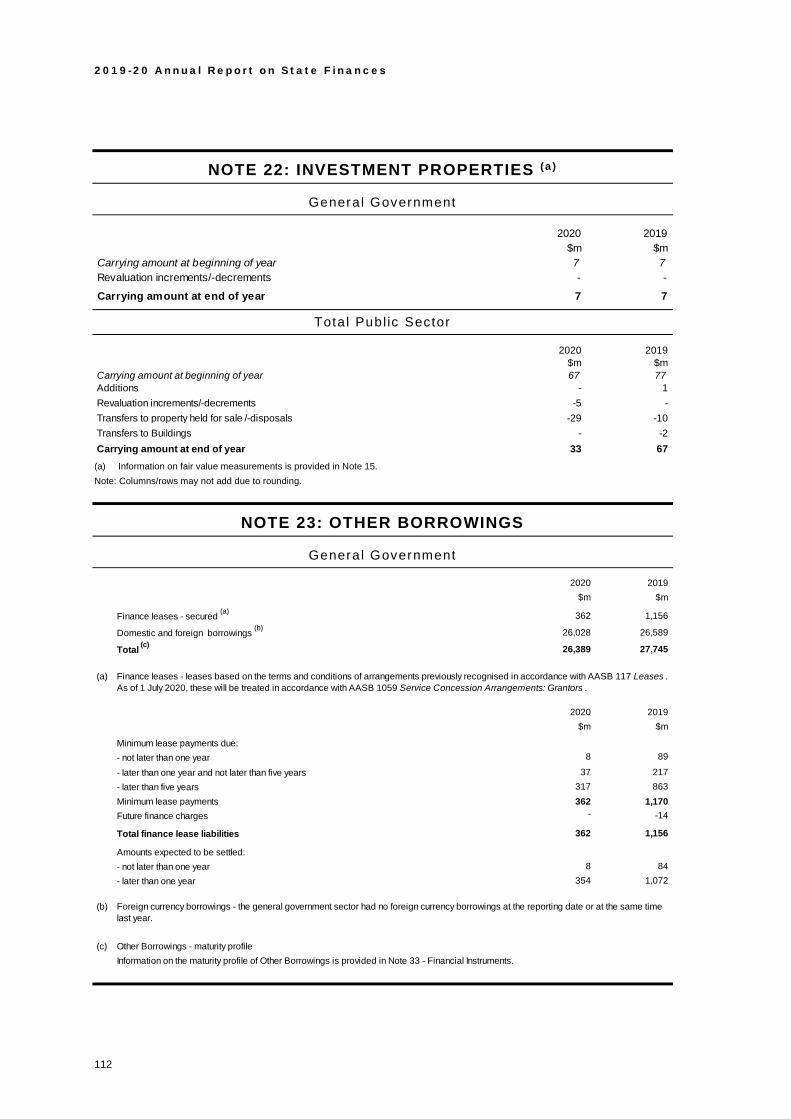
2019-20 Annual Report on State F inances
112
NOTE 22: INVESTMENT PROPERTIES (a )
General Government
Tota l Publ ic Sector
(a) Information on fair value measurements is provided in Note 15. Note: Columns/rows may not add due to rounding.
NOTE 23: OTHER BORROWINGS
General Government
2020 2019$m $m
Carrying amount at beginning of year 7 7Revaluation increments/-decrements - -
Carrying amount at end of year 7 7
2020 2019$m $m
Carrying amount at beginning of year 67 77Additions - 1Revaluation increments/-decrements -5 -Transfers to property held for sale /-disposals -29 -10Transfers to Buildings - -2Carrying amount at end of year 33 67
2020 2019$m $m
Finance leases - secured (a) 362 1,156
Domestic and foreign borrowings (b) 26,028 26,589
Total (c) 26,389 27,745
(a)
2020 2019$m $m
Minimum lease payments due:- not later than one year 8 89
- later than one year and not later than five years 37 217 - later than five years 317 863 Minimum lease payments 362 1,170 Future finance charges - -14
Total finance lease liabilities 362 1,156
Amounts expected to be settled:- not later than one year 8 84 - later than one year 354 1,072
(b)
(c) Other Borrowings - maturity profileInformation on the maturity profile of Other Borrowings is provided in Note 33 - Financial Instruments.
Finance leases - leases based on the terms and conditions of arrangements previously recognised in accordance with AASB 117 Leases . As of 1 July 2020, these will be treated in accordance with AASB 1059 Service Concession Arrangements: Grantors .
Foreign currency borrowings - the general government sector had no foreign currency borrowings at the reporting date or at the same time last year.

Appendix 1
113
NOTE 23: OTHER BORROWINGS (CONT.)
Total Publ ic Sector
Note: Columns may not add due to rounding.
2020 2019$m $m
Finance leases - secured (a) 577 1,902
Domestic and foreign borrowings (b) 64,134 59,072
Total (c) 64,711 60,974
(a)
2020 2019$m $m
Minimum lease payments due:- not later than one year 17 133
- later than one year and not later than five years 69 398 - later than five years 491 1,386 Minimum lease payments 577 1,916
Future finance charges - -14
Total finance lease liabilities 577 1,902
Amounts expected to be settled:- not later than one year 17 127 - later than one year 560 1,775
(b)
2020 Current Non-currentUnited States Dollar 650 -
650 -
2019 Current Non-currentUnited States Dollars - -
(c) Other Borrowings - maturity profileInformation on the maturity profile of Other Borrowings is provided in Note 33 - Financial Instruments.
At the reporting date, any foreign currency loans are either economically hedged, swapped or covered forward specifically or invested inthe foreign currency. Consequently, any gain or loss on the translation of the overseas borrowing is matched by a corresponding loss orgain made on the foreign currency contract, the overseas investment or the back to back lending and the net exchange gain or loss istherefore zero.
Finance leases - leases based on the terms and conditions of arrangements previously recognised in accordance with AASB 117 Leases . As of 1 July 2020, these will be treated in accordance with AASB 1059 Service Concession Arrangements: Grantors .
The following foreign currency borrowings are reported at Australian dollar equivalents applicable at the reporting date and the amounts inforeign currency included.

2019-20 Annual Report on State F inances
114
NOTE 24: UNFUNDED SUPERANNUATION
General Government
The superannuation liability for the general government sector at 30 June 2020 was $6,818 million (2019 $7,062 million). The liability represents 98.5% (2019: 98.6%) of the whole-of-government total superannuation liability of $6,920 million at 30 June 2020 (2019: $7,166 million).
The disclosure information included in the total public sector note below also applies to the general government sector.
Tota l Publ ic Sector
The Government Employee Superannuation Board (GESB) administers a range of defined benefit superannuation schemes (see Note 3 (Superannuation)). Note: Columns may not add due to rounding.
2020 2019$m $m
Defined Benefit superannuation schemes:Pension Scheme 1,933 2,013 Gold State Super Scheme 3,963 4,153 Judges' Pension Scheme 645 569 Parliamentary Superannuation Scheme 220 212 Total Defined Benefit superannuation schemes 6,761 6,947
Defined contribution superannuation scheme: West State Superannuation Scheme 58 115
Total 6,818 7,062
2020 2019$m $m
Defined Benefit superannuation schemes:Pension Scheme 2,036 2,116 Gold State Super Scheme 3,963 4,154 Judges' Pension Scheme 644 569 Parliamentary Superannuation Scheme 220 212 Total Defined Benefit superannuation schemes 6,864 7,051
Defined contribution superannuation scheme: West State Superannuation Scheme 58 115
Total 6,920 7,166

Appendix 1
115
NOTE 24: UNFUNDED SUPERANNUATION (CONT.) The actuary has applied the following principal assumptions in assessing the defined benefit superannuation liabilities at the reporting date and for following year expense.
2020 %
2019 %
Discount rate (gross of tax) (a) 0.9 1.3 Salary rate (b) 2.8 4.2 Inflation (pensions) 2.5 2.5
(a) The discount rate is based on the average term of liabilities. (b) Assumed rate of salary inflation is 1.5% per annum for the first two years and 2.75% per annum thereafter.
Major categories of defined benefit plan assets as a percentage of total fund assets are as follows (c). Class 1 (d)
2020 %
Class 2 (e)
2020 %
Class 3 (f) 2020
%
Total 2020
% Equities 58 - - 58 Cash and Investment funds 5 2 - 7 Others - 33 2 35
Class 1 (d)
2019 %
Class 2 (e)
2019 %
Class 3 (f) 2019
%
Total 2019
% Equities 58 - - 58 Cash and Investment funds 6 3 - 9 Others - 31 2 33
(c) Only the Pension Scheme and Gold State Super Scheme have plan assets. The Judges’ Pension and Parliamentary Superannuation Schemes are unfunded with no employer/employee contributions.
(d) Quoted in active markets. (e) Significant observable inputs. (f) Unobservable inputs.
Movement in net liability.
The net liability of defined benefit plans recognised in the balance sheet is as follows.
(g) Based on the actuarial valuation, the net liabilities fall due with the following profile.
Note: Columns/rows may not add due to rounding.
2020 2019$m $m
Net liability/-asset in balance sheet at end of prior year 7,051 6,468Expense recognised in profit and loss 281 318Employer contributions -487 -586Remeasurements 19 852Net liability/-asset in balance sheet at end of year 6,864 7,051
2020 2019$m $m
Total defined benefit obligations 9,619 10,014Scheme assets -2,755 -2,963Net liability(g) 6,864 7,051
Not later than one year 26 25Later than one year 6,838 7,026Total 6,864 7,051

2019-20 Annual Report on State F inances
116
NOTE 24: UNFUNDED SUPERANNUATION (CONT.) Details of the deficit of the defined benefit plans measured in accordance with AAS 25: Financial Reporting by Superannuation Plans as determined from the plans’ most recent financial report are shown below.
The amounts recorded for the Gold State Super Scheme relate to the scheme as a whole (i.e. the pre-transfer benefit component plus the concurrently funded benefit component). The funding policy in respect of the defined benefit plans is directed at ensuring that benefits accruing to members and beneficiaries are fully funded at the time the benefits become payable. As such, the actuary has considered long-term trends in such factors as scheme membership, salary growth and average market value of the schemes’ assets when advising on employer and employee contribution rates.
The amounts recognised in the operating statement in respect of the defined benefit plans are as follows.
Reconciliation of the fair value of defined benefit superannuation assets at the beginning and at the end of the year are set out below.
Note: Columns/rows may not add due to rounding.
Pension Scheme
Gold State Super
Scheme
Judges'PensionScheme
ParliamentarySuperannuation
Scheme Total2020 2020 2020 2020 2020
$m $m $m $m $m
Gross accrued benefits 2,130 6,624 645 220 9,619Net market value of plan assets -93 -2,661 - - -2,755Net liability 2,036 3,963 645 220 6,864
Pension Scheme
Gold State Super
Scheme
Judges'PensionScheme
ParliamentarySuperannuation
Scheme Total2019 2019 2019 2019 2019
$m $m $m $m $m
Gross accrued benefits 2,210 7,023 569 212 10,014Net market value of plan assets -94 -2,869 - - -2,963Net liability 2,116 4,154 569 212 7,051
2020 2019$m $m
Total employer current service cost 192 180Net interest cost 89 134Recognised actuarial -gains/losses 19 852Total 300 1,165
2020 2019
$m $mFair value plan assets at beginning of year 2,962 2,957Employer contributions 487 586Actual participant contributions 8 9Actual benefit payments -631 -789Interest income 37 74Expected plan assets at end of year 2,863 2,836Return in excess of interest income -108 125Fair value of plan assets at end of year 2,755 2,962

Appendix 1
117
NOTE 24: UNFUNDED SUPERANNUATION (CONT.) Reconciliation of the fair value of defined benefit superannuation obligations at the beginning and at the end of the year are set out in the following table.
Reconciliation of actuarial gain/loss on assets and liabilities are set out below.
Liabilities for defined benefit scheme at 30 June for the last five years are as follows.
Sensitivity analysis for the defined benefit obligation is presented on the following scenarios (h).
Note: Columns/rows may not add due to rounding.
2020 2019$m $m
Defined benefit obligation at beginning of year 10,014 9,425Employer service cost plus operating costs 190 178Interest cost 126 207Actual participant contributions 8 9Actual benefit payments -631 -789Expected defined benefit obligations at end of year 9,706 9,030Actuarial -gain/loss on liabilities -87 984Defined benefit obligation at end of year 9,619 10,014
2020 2019
$m $mActuarial -gain/loss due to demographic assumptions 2 -72Actuarial -gain/loss due to f inancial assumptions 77 1,138Actuarial -gain/loss arising from experience -159 -88Return in excess of interest income 99 -126
19 852Amount recognised during year in 'other changes in equity'
2020 2019 2018 2017 2016$m $m $m $m $m
Total defined benefit obligations 9,619 10,014 9,425 9,861 10,647Actual assets -2,755 -2,963 -2,957 -2,917 -2,857Deficit/-surplus 6,864 7,051 6,468 6,944 7,790
Sensitivity to discount rate 2020 2020+1.0
percentage point
discount rate
-1.0 percentage
point discount
rateDiscount rate (%) 1.4 0.4Defined benefit obligation ($m) 9,169 10,013Changes in obligation ($m) -406 439Percentage changes in obligation (%) -4.0 5.0
Sensitivity to discount rate 2019 2019
+1.0 percentage
point discount
rate
-1.0 percentage
point discount
rateDiscount rate (%) 2.3 0.3Defined benefit obligation ($m) 9,149 10,930Changes in obligation ($m) -820 961Percentage changes in obligation (%) -8.0 10.0

2019-20 Annual Report on State F inances
118
NOTE 24: UNFUNDED SUPERANNUATION (CONT.)
(h) Sensitivity figures do not include Gold State Super Scheme reserves amounting to $44.2 million (30 June 2019 $44.5 million). Note: Columns may not add due to rounding.
Sensitivity to future salary increase 2020 2020
Future salary increases
Defined benefit obligation ($m) 9,768 9,396Changes in obligation ($m) 194 -179Percentage changes in obligation (%) 2.0 -2.0
Sensitivity to future salary increase 2019 2019
Future salary increases
Defined benefit obligation ($m) 10,406 9,584Changes in obligation ($m) 437 -385Percentage changes in obligation (%) 4.0 -4.0
+1.0% future salary increase -1.0% future salary increase
2.5% for the first four years and 5.2% thereafter
0.5% for the first four years and 3.2% thereafter
2.0% for the first two years and 3.25% thereafter
1.0% for the first two years and 2.25% thereafter
+1.0% future salary increase rate
-1.0% future salary increase rate
Sensitivity to pension indexation rate 2020 2020
Pension increases (%) 3.0 2.0Defined benefit obligation ($m) 9,862 9,311Changes in obligation ($m) 287 -263Percentage changes in obligation (%) 3.0 -3.0
Sensitivity to pension indexation rate 2019 2019
Pension increases (%) 3.5 1.5Defined benefit obligation ($m) 10,562 9,459Changes in obligation ($m) 593 -510Percentage changes in obligation (%) 6.0 -5.0
+1.0% pension indexation rate
-1.0% pension indexation rate
+1.0% pension indexation rate
-1.0% pension indexation rate
Sensitivity to mortality 2020 2020
Defined benefit obligation ($m) 9,711 9,424Changes in obligation ($m) 137 -150Percentage changes in obligation (%) 1.0 -2.0
Sensitivity to mortality 2019 2019
Defined benefit obligation ($m) 10,153 9,816Changes in obligation ($m) 184 -153Percentage changes in obligation (%) 2.0 -2.0
1 year increase in future life expectancy
1 year decrease in future life expectancy
1 year increase in future life expectancy
1 year decrease in future life expectancy

Appendix 1
119
NOTE 25: OTHER EMPLOYEE BENEFITS
General Government
Tota l Publ ic Sector
Note: Columns may not add due to rounding.
2020 2019$m $m
Annual leave 1,042 928
Long service leave 1,929 1,795
Other 572 473
Total 3,543 3,197
2020 2019
$m $m
Within 12 months of reporting date 760 626More than 12 months after reporting date 282 302Total 1,042 928
2020 2019
$m $m
Within 12 months of reporting date 455 600More than 12 months after reporting date 1,473 1,195
Total 1,929 1,795
Assessments indicate that actual settlement of the annual leave liabilities is expected to occur as follow s.
Assessments indicate that actual settlement of the long service leave liabilities is expected to occur as follow s.
2020 2019$m $m
Annual leave 1,197 1,064Long service leave 2,146 2,002Other 639 511Total 3,981 3,577
2020 2019
$m $m
Within 12 months of reporting date 885 741More than 12 months after reporting date 312 323Total 1,197 1,064
2020 2019
$m $m
Within 12 months of reporting date 563 699More than 12 months after reporting date 1,583 1,303Total 2,146 2,002
Assessments indicate that actual settlement of the long service leave liabilities is expected to occur as follow s.
Assessments indicate that actual settlement of the annual leave liabilities is expected to occur as follow s.

2019-20 Annual Report on State F inances
120
NOTE 26: OTHER LIABILITIES General Government
Note: Columns/rows may not add due to rounding.
2020 2019$m $m
C tDeferred revenue 1,424 489 Grant liabilities (a) 228 - Interest payable 141 172 Contract liabilities (b) 83 - Insurance claims 24 25 Other provisions 46 45 Other liabilities 728 714 Total Other Liabilities 2,674 1,445
Reconciliation of Other Provisions30 June 2020
Employmenton-costs
Restorationcosts
Other Total
$m $m $m $mCarrying amount at beginning of year 12 4 29 45Additional provisions recognised 7 8 8 23Amounts used -4 -5 -13 -21Unused amounts reversed -1 -1 - -Other -2 - 1 -2Carrying amount at end of year 13 8 25 46
30 June 2019Employment
on-costsRestoration
costsOther Total
$m $m $m $mCarrying amount at beginning of year 19 4 27 50Additional provisions recognised 3 2 1 6Amounts used -3 -2 -1 -4Other -7 - 1 -6Carrying amount at end of year 12 4 29 45
2020 2019$m $m
(a) Grant liabilitiesReconciliation of changes in grant liabilities:Opening balance - -Additions 926 -Income recognised in the reporting period -699 -Balance at the end of period 228 -
Income recognition: - not later than one year 227 - - later than one year and not later than five years 1 - - later than five years - -Total 228 -
(b) Contract liabilitiesReconciliation of changes in contract liabilities:Opening balance - -Additions 241 -Revenue recognised in the reporting period -157 -Balance at the end of period 83 -

Appendix 1
121
NOTE 26: OTHER LIABILITIES (CONT.) Total Publ ic Sector
Note: Columns/rows may not add due to rounding.
2020 2019$m $m
Insurance claims (a) 3,847 3,604Deferred revenue 1,912 687Interest payable 579 576Grant liabilities (b) 232 - Contract liabilities (c) 299 - Other provisions 928 989Other liabilities 495 879Total Other Liabilities 8,292 6,736
Reconciliation of Other Provisions
30 June 2020
Employmenton-costs
Decommiss-ioningcosts
Restorationcosts
Other Total
$m $m $m $m $mCarrying amount at beginning of year 19 351 50 568 989Additional provisions recognised 10 - 17 221 249Amounts used -6 -16 -12 -294 -329Unused amounts reversed -1 -2 -4 -3 -9Unwinding of the discount - 6 - 5 10Other -2 19 - - 17Carrying amount at end of year 21 357 52 497 928
30 June 2019Employment
on-costsDecommiss-
ioningcosts
Restorationcosts
Other Total
$m $m $m $m $mCarrying amount at beginning of year 25 328 50 395 798Additional provisions recognised 6 6 19 408 439Amounts used -5 -21 -10 -240 -277Unused amounts reversed - - -9 -2 -12Unwinding of the discount - 8 - 7 16Other -6 31 - - 25Carrying amount at end of year 19 351 50 568 989
2020 2019$m $m
(a) Insurance claimsThe liabilities for outstanding insurance claims comprise:Third Party Insurance Fund 2,437 2,412Government Insurance Fund 89 71RiskCover 606 561Motor Vehicle (Catastrophic Injuries) Fund 612 451Other 104 108Total 3,847 3,604
Liability for outstanding claims (undiscounted) 4,255 4,039Discount to present value -406 -435Total liability for outstanding claims (undiscounted) 3,847 3,604

2019-20 Annual Report on State F inances
122
NOTE 26: OTHER LIABILITIES (CONT.) Total Publ ic Sector
Note: Columns/rows may not add due to rounding.
2020 2019% %
Claims expected to be paid:Not later than one yearInflation rate 1.00 2.30Discount rate 0.20 1.00Later than one yearInflation rate 2.30 2.79Discount rate 1.00 0.90
2020 2019$m $m
(b) Grant liabilitiesReconciliation of changes in grant liabilities:Opening balanceAdditions 930 -Income recognised in the reporting period -699 -Balance at the end of period 232 -
Income recognition: - not later than one year 230 - - later than one year and not later than five years 1 - - later than five years - -Total 232 -
(c) Contract liabilitiesReconciliation of changes in contract liabilities:Opening balance - -Additions 688 -Revenue recognised in the reporting period -390 -Balance at the end of period 299 -

Appendix 1
123
NOTE 27: RECONCILIATION OF NET CASH FLOWS FROM OPERATING ACTIVITIES TO OPERATING SURPLUS
FOR THE PERIOD
General Government
Tota l Publ ic Sector
Note: Columns may not add due to rounding.
2020 2019 $m $m
Surplus /-deficit for period 1,669 1,317Non-cash movementsDepreciation 1,751 1,445Increase/-decrease in accrual in employees benefits 60 -152-Increase/decrease in inventories -37 -1-Increase/decrease in receivables 12 -718-Increase/decrease in prepayments and other assets 3 3Increase/-decrease in payables 38 148Increase/-decrease in other liabilities and accruals -358 16Net GST receipts/-payments -13 19Other non-cash net asset transfers -6 11Adjustment for other non-cash items 92 -74Net cash flows from operating activities as shown in the Cash Flow Statement 3,211 2,014
2020 2019$m $m
Surplus /-deficit for period 2,047 716Non-cash movementsDepreciation 3,908 3,431Premium discount amortisation -236 -254Increase/-decrease in accrual in employees benefits 91 -227-Increase/decrease in inventories -2,088 -614-Increase/decrease in receivables -192 -773-Increase/decrease in prepayments and other assets -45 14Increase/-decrease in payables 2,767 738Increase/-decrease in other liabilities and accruals -131 716Net GST receipts/-payments -84 -54Other non-cash net asset transfers -84 -62Adjustment for other non-cash items -284 -245Net cash flows from operating activities as shown in the Cash Flow Statement 5,670 3,386

2019-20 Annual Report on State F inances
124
NOTE 28: CLOSING CASH BALANCES
For the purposes of the Cash Flow Statement, cash includes cash on hand, cash at bank and investments in highly liquid money market instruments, net of outstanding bank overdrafts.
Cash for the purposes of the Cash Flow Statement is defined differently to ‘Cash’ for the purposes of the consolidated Balance Sheet (which only includes cash holdings at the balance date and not other liquid assets included in the Cash Flow Statement). As a result, the Cash reported on the Cash Flow Statement does not equal ‘Cash’ in the Balance Sheet.
General Government
Tota l Publ ic Sector
`
Note: Columns may not add due to rounding.
NOTE 29: RESTRICTED FINANCIAL ASSETS
There are restrictions on the uses of specific purpose Commonwealth grants. Funding received and not yet spent total $161 million (2019: $109 million).
NOTE 30: MONEYS HELD IN TRUST
Moneys held in a trustee capacity are not controlled by the State and are excluded from assets and liabilities. An amount of $449 million was held as at 30 June 2020, compared with $455 million at 30 June 2019.
2020 2019$m $m
Cash assets as per the Balance Sheet 513 601Investments included as cash on the Cash Flow Statement 5,132 4,404
Total closing cash balance 5,645 5,005
2020 2019$m $m
Cash assets as per the Balance Sheet 2,346 1,517Investments included as cash on the Cash Flow Statement 8,648 7,193
Total closing cash balance 10,994 8,710

Appendix 1
125
NOTE 31: CAPITAL EXPENDITURE COMMITMENTS (a )
General Government
Capital expenditure commitments, being contracted capital expenditure additional to the amounts reported in the financial statements, are expected to require payment as follows.
(a) The capital commitments include the following material amounts:
• road infrastructure spending of $707 million (30 June 2019: $716 million), including the Design and Construct Tonkin Highway gap Collier Road to Stanton Road ($392 million), Armadale Road Bridge over Kwinana Freeway ($100 million), High Street upgrade Stirling Highway to Carrington Street ($35 million), Design and Construct of a grade separated interchange for Roe Highway and Kalamunda Road ($26 million);
• school infrastructure of $433 million (30 June 2019: $458 million) for the building of new schools, and additions and improvements to primary and high schools; and
• major health infrastructure totalling $65 million (30 June 2019: $53 million) including spending for the HealthNext Project, PathWest Laboratory Information System, medical imaging equipment, information and communication technology upgrades, and the medical equipment replacement program across the health sector.
Note: Columns may not add due to rounding.
Tota l Publ ic Sector
Capital expenditure commitments, being contracted capital expenditure additional to the amounts reported in the financial statements, are expected to require payment as follows.
(b) In addition to the major commitments for the general government sector disclosed above, the following material commitments are
included for the total public sector: • rail and bus infrastructure of $3 billion (30 June 2019: $1.3 billion), due to the award of the Railcar purchase contract for
METRONET and ‘A’ series replacement and the award of an alliance contract to build the Yanchep Rail Extension and Thornlie-Cockburn Link; and
• waste and wastewater projects of $269 million (30 June 2019: $230 million) including Merredin new 42ML water storage tank. Note: Columns may not add due to rounding.
2020 2019$m $m
Capital expenditure commitments(a) 1,506 1,538
2020 2019$m $m
Capital expenditure commitments(b) 5,325 3,649
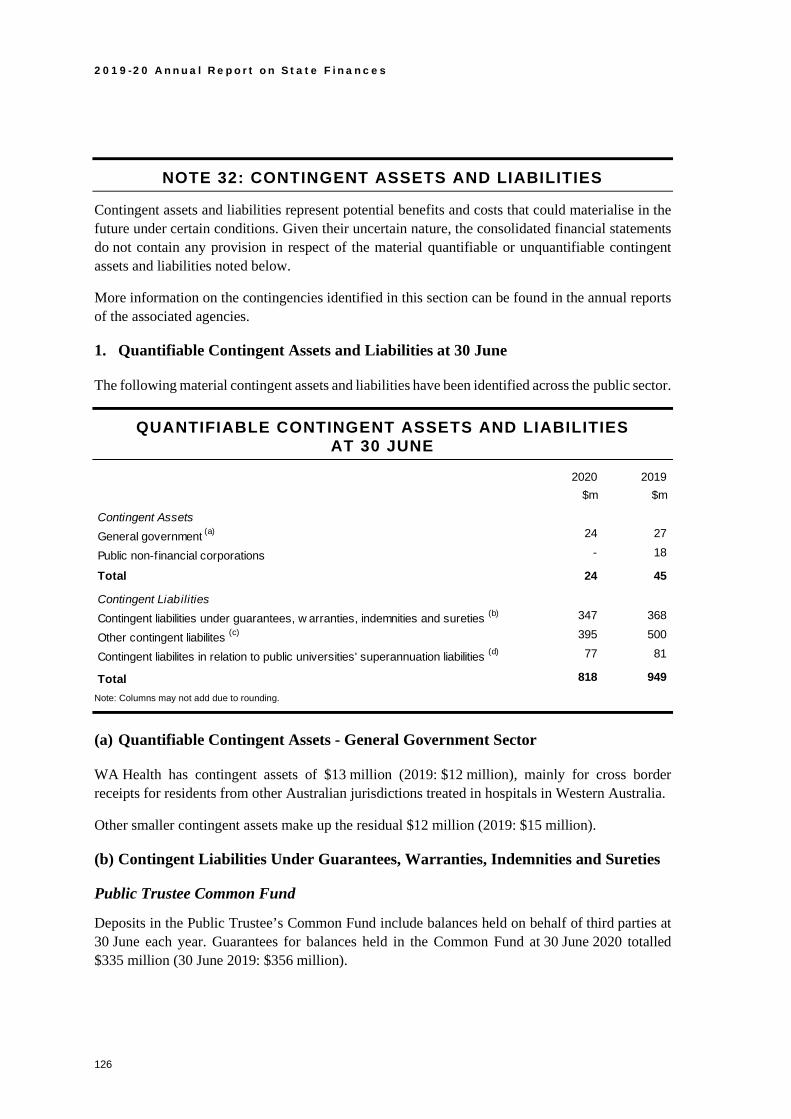
2019-20 Annual Report on State F inances
126
NOTE 32: CONTINGENT ASSETS AND LIABILITIES
Contingent assets and liabilities represent potential benefits and costs that could materialise in the future under certain conditions. Given their uncertain nature, the consolidated financial statements do not contain any provision in respect of the material quantifiable or unquantifiable contingent assets and liabilities noted below.
More information on the contingencies identified in this section can be found in the annual reports of the associated agencies.
1. Quantifiable Contingent Assets and Liabilities at 30 June
The following material contingent assets and liabilities have been identified across the public sector.
QUANTIFIABLE CONTINGENT ASSETS AND LIABILITIES AT 30 JUNE
Note: Columns may not add due to rounding.
(a) Quantifiable Contingent Assets - General Government Sector
WA Health has contingent assets of $13 million (2019: $12 million), mainly for cross border receipts for residents from other Australian jurisdictions treated in hospitals in Western Australia.
Other smaller contingent assets make up the residual $12 million (2019: $15 million).
(b) Contingent Liabilities Under Guarantees, Warranties, Indemnities and Sureties
Public Trustee Common Fund
Deposits in the Public Trustee’s Common Fund include balances held on behalf of third parties at 30 June each year. Guarantees for balances held in the Common Fund at 30 June 2020 totalled $335 million (30 June 2019: $356 million).
2020 2019$m $m
Contingent AssetsGeneral government (a) 24 27
Public non-financial corporations - 18
Total 24 45
Contingent LiabilitiesContingent liabilities under guarantees, w arranties, indemnities and sureties (b) 347 368
Other contingent liabilites (c) 395 500
Contingent liabilites in relation to public universities' superannuation liabilities (d) 77 81
Total 818 949

Appendix 1
127
Water Corporation
The Water Corporation issues bank guarantees in the normal course of business to guarantee the Corporation’s performance under contracts. At 30 June 2020, the value of these guarantees was $12 million (unchanged from 30 June 2019).
(c) Other Contingent Liabilities
Asbestos Injuries Compensation Fund
On 16 October 2015, the Commonwealth Treasurer and all State and Territory Treasurers agreed on an approach for sharing the default risk of the Asbestos Injuries Compensation Fund (AICF). Each State’s and Territory’s share of the total default risk will reflect the proportion of claims paid in each jurisdiction since the inception of the Fund (after the Commonwealth takes responsibility for one-third of the default risk as it has agreed to do). From 2007-08 until 2019-20, approximately 15% of all filed claims were in Western Australia, which equates to an estimated contingent liability of $32 million. The arrangement for sharing the default risk is only triggered if James Hardie Pty Ltd, which is directly responsible for the AICF, went into receivership and was no longer able to contribute to the Fund to pay for compensation claims.
Commissioner of Main Roads
Claims have been lodged by owners of property acquired for road construction purposes and services provided under roadwork contracts. A contingent liability of $231 million at 30 June 2020 (30 June 2019: $294 million) reflects the difference between the owners’ claims and estimated settlement prices determined by Main Roads in accordance with independent valuations, and also includes claims that have been submitted by contractors in relation to services provided under roadwork contracts.
WA Health
WA Health has contingent liabilities of $39 million (30 June 2019: $44 million), which is mainly comprised of cross border charges for Western Australian residents treated in hospitals in other Australian jurisdictions ($22 million), and facilities management matters under negotiation for South Metropolitan Health Service ($16 million, which are an ongoing part of contract management processes invoking formal contractual dispute mechanisms).
Home Indemnity Insurance
The contingent liability for Home Indemnity Insurance (HII) is administered by the Department of Mines, Industry Regulation and Safety. Future claims liability (FCL) of the HII have been actuarially assessed as at 30 June 2020. The FCL is an estimation of the future claims costs which may arise as a result of events which may occur in the future for currently in-force HII policies. The FCL has been assessed at an approximate value of $19 million (2019: $20 million). An unquantifiable contingent liability for HII is also disclosed later in this note.

2019-20 Annual Report on State F inances
128
Communities
There are currently a number of legal cases pending for which the outcomes are not certain. The State Solicitor’s Office has estimated that a total amount of $13 million (30 June 2019: $6 million) may be payable as compensation to claimants at some future point in time. Whilst this is acknowledged as a contingent liability of the Department, it has yet to be determined whether the Department will ultimately be responsible for funding the actual amounts paid as compensation, if any.
Western Australian Planning Commission
Under the operation of the Metropolitan, Peel and Greater Bunbury Region Schemes, reservations exist on properties that may result in compensation being paid to the landholder or the property being acquired for the Western Australian Planning Commission’s (WAPC) estate. The Commission sets such compensation and acquisition priorities on an annual basis. In some cases, the landholder disputes the compensation offered by the WAPC, either through arbitration or through Court action. Resolving such disputes forms part of the ordinary business of the WAPC and any additional payments that arise are managed within the resources of the Metropolitan Region Improvement Fund and the Regional Land Acquisition appropriation. The current estimate of this contingent liability is approximately $10 million (30 June 2019: $74 million).
Various Agencies
Other quantifiable contingent liabilities include various legal and contractual claims against individual agencies totalling $47 million (30 June 2019: $31 million), as reported in the annual reports of those agencies.
(d) Contingent Liabilities in Relation to Public Universities’ Superannuation Liabilities
The State Superannuation Act 2000 (SSA) repealed the Government Employees Superannuation Act 1987 and the Superannuation and Family Benefits Act 1938. The schemes operating under those Acts continue under the SSA. The State guarantees the benefits payable under those schemes. Entitlements for State government employees under this guarantee are recognised as part of unfunded superannuation liabilities on the face of the balance sheet. However, public university employees are not employees of the State for the purposes of this Annual Report on State Finances (in recognition of the national control of higher education institutions exercised by the Commonwealth).
The guarantee for public universities’ superannuation liabilities is $77 million based on the actuarially assessed value of these entitlements at 30 June 2020 (30 June 2019: $81 million).
2. Non-quantifiable Contingent Assets
Bell Recovery Action
At 30 June 2020, the Insurance Commission of Western Australia considered that it had a contingent asset that would eventually materialise from the Bell Liquidation distribution process. At the time the total amount of the recoveries it will ultimately receive and the timing of receipt could not yet be ascertained.

Appendix 1
129
The Commission has a potential exposure to costs of litigation and indemnities associated with funding the Liquidator’s action. Due to the uncertainty of litigation recommencing, it is not feasible to estimate potential costs upon the Commission at the end of the reporting period.
This matter was settled in August 2020 and further information is available in Note 36: Events occurring after the reporting period.
WA Health
Cross border receipts are anticipated to be received for residents from other Australian jurisdictions staying in hotels in Western Australia for hotel quarantine in response to the COVID-19 pandemic. These receipts are yet to be determined.
Other - litigation in progress
A number of government agencies are currently involved with different legal proceedings, all at varying stages. Due to the wide variety and nature of the claims and the uncertainty around the likely outcomes of these cases, it is not possible to reliably quantify the potential benefits that may flow to agencies should favourable outcomes emerge.
3. Non-quantifiable Contingent Liabilities
Litigation
A number of government agencies are currently involved with different legal proceedings, all at varying stages. Due to the wide variety and nature of the claims and uncertainty around the likely outcomes of these cases, it is not possible to reliably quantify the potential impact should the State be found liable.
Claims by Mr Clive Palmer, Mineralogy and International Minerals
A legal dispute between Mineralogy Pty Ltd and International Minerals Pty Ltd, and the Western Australian Government has been reported extensively in the media.
The dispute relates to a State Agreement originally made in 2002 and the subsequent impact of Ministerial decisions. The entities are claiming compensation of around $28 billion (including interest penalties).
Given the size of the claim and to address the potential financial risk to Western Australia, the Western Australian Parliament passed the Iron Ore Processing (Mineralogy Pty. Ltd.) Agreement Amendment Bill 2020 on 13 August 2020. The Act removes the capacity for Mr Clive Palmer, Mineralogy and International Minerals to pursue litigation and damages claims connected with this dispute and prevent future damages claims in relation to the consideration of future proposals that might be submitted under the State Agreement. The Act is specific and precisely targeted at this dispute and the associated parties noted above.
It is anticipated that the Act will withstand scrutiny should a challenge be taken to the High Court.
The Government has stated that the claims will be vigorously defended by Western Australia.

2019-20 Annual Report on State F inances
130
Contaminated Sites
Under the Contaminated Sites Act 2003, agencies are required to report known and suspected contaminated sites to the Department of Water and Environmental Regulation (DWER). In accordance with the Act, DWER classifies these sites on the basis of risk to human health, the environment and environmental issues. Where sites are classified as ‘contaminated - remediation required’, or ‘possibly contaminated - investigation required’, the agency may have a liability in respect of investigation or remediation expenses. DWER has not yet finalised the classification of sites that have been reported by agencies. As agencies are unable to assess the likely outcome of the classification process, it is not possible to estimate the potential financial effect or to identify the uncertainties relating to the amount or timing of any outflows. Agencies are required to have ongoing management plans to remediate contaminated sites as they are identified.
Forrestfield-Airport Link Project - Poly-fluoroalkyl Substances
Contaminated soil is a risk to the approved budget of the Forrestfield-Airport Link project. Spoil (i.e. excavated soil) from tunnelling has been found to contain minor concentrations of poly-fluoroalkyl substances. There is a risk that some of this spoil may be unable to be reused and instead must be disposed of in landfill at an additional cost to the project.
Forestry Contracts
The FPC has identified a potential shortfall of current pine resources that would be available to meet future contracted supply commitments. As at the date of the financial statements, there is a high degree of uncertainty regarding the likelihood, timing and amount of any potential shortfall and the Commission is therefore unable to determine a reliable estimate of the magnitude of any potential obligation that may arise in the future. The Commission is undertaking further analysis to develop and implement mitigation strategies.
In addition, as the responsible Minister under the Industry and Technology Development Act of 1998 (ITD Act), the Minister for State Development (or his predecessors) is a signatory to one Investment Security Guarantee (ISG). ISGs are signed by the Minister, General Manager of the Forest Products Commission (FPC) and timber processors. Under an ISG, the Minister is liable to pay compensation under circumstances where the FPC is unable to supply contracted amounts of hardwood timber.
Gold Corporation
In prior years, ground water contamination occurred at the Newburn site of the AGR Matthey refinery. The AGR Joint Venture partners (Western Australian Mint and Australian Gold Alliance Pty Ltd) were responsible for any remediation and restoration of the site. Pursuant to the dissolution of the AGR Matthey Partnership on 29 March 2010, Western Australian Mint has assumed full responsibility for any future liabilities. Expenses incurred to date have been recorded in the financial statements. The Corporation is still assessing the estimated potential financial effects, if any, of remediation. Hence it is not possible to quantify these as at 30 June 2020.
WA Health
Cross-border charges are anticipated to emerge for Western Australian residents staying in hotels in other Australian jurisdictions for hotel quarantine in response to the COVID-19 pandemic. These charges are yet to be determined.

Appendix 1
131
Home Indemnity Insurance
Since 1 November 2013, the State has wholly underwritten the provision of new Home Indemnity Insurance (HII) policies to provide cover on an emerging cost basis for financial loss resulting from the death, insolvency or disappearance of a builder or building group. This arrangement was recently extended until 31 December 2025 to provide additional time to develop a longer-term market-based HII solution. From 1 July 2015, premiums for HII policies have been paid into the HII Reinsurance Account administered by the Department of Mines, Industry Regulation and Safety, with any claims arising from these policies being met from the Account.
Investigation by the Economic Regulatory Authority
In April 2019, the Economic Regulation Authority (ERA) concluded its investigations of Synergy’s pricing in balancing submissions made in the Western Australian Wholesale Electricity Market (WEM) between March 2016 and July 2017. The ERA considered that Synergy had breached a provision in the WEM rules prohibiting a market participant from offering prices in its balancing submissions that are above its reasonable expectation of the short run marginal cost of generating electricity, when such behaviour relates to market power. The ERA has referred Synergy to the Electricity Review Board (ERB) to establish whether Synergy has breached the WEM Rules and, if so, to seek orders for monetary penalties.
At 30 June 2020, no provision had been made as Synergy denies any wrongdoing or liability in this regard, and is defending the ERA’s claims before the ERB. In the event the ERB finds that Synergy has breached the WEM rules, the ERB has discretion to set the amount of any penalty, and hence it is not possible at this stage to estimate any potential liability.
Lotteries Commission
A recent decision handed down by the Industrial Appeal Court (IAC) changed the way voluntary separation payments are calculated. IAC found that the definition of ‘continuous service’ in the Regulations includes time served in the employment of the Commonwealth or another State public sector.
Lotterywest is reviewing staff records to identify any individuals who were paid under this scheme in the past and have served in the employment of the Commonwealth or another State public sector. Any potential liabilities cannot be reliably measured at this time, and may only emerge as and when individual claimants come forward.

2019-20 Annual Report on State F inances
132
DevelopmentWA (Metropolitan Redevelopment Authority)
The Metropolitan Redevelopment Authority (now trading as DevelopmentWA) is in dispute in relation to construction works undertaken on its behalf within the Central Perth Redevelopment Area. In accordance with the contract’s dispute resolution process, the parties commenced mediation which is continuing. DevelopmentWA’s objective is for an outcome which will safeguard the Authority from any ongoing financial risk and liability associated with outstanding defects and incomplete works. In addition, potential excessive settlement risk within a separate Central Perth Redevelopment Area is currently under investigation. The parties are progressing this matter in accordance with the contract provisions. The termination of the sale of a parcel of land within the Central Perth Redevelopment Area has resulted in the implementation of the dispute resolution clause in the sale contract, with a court-appointed mediation having been held. As the parties were not able to achieve a resolution of the dispute at mediation, court orders have been made requiring the parties to finalise their pleadings and give discovery.
Native Title
The Commomwealth’s Native Title Act 1993, as amended, creates a potential liability for all jurisdictions for compensation for the loss or impairment of Native Title rights and interests that occurred after 31 October 1975. There are currently 65 Native Title claimant applications, and 117 Native Title determinations in Western Australia. The extent of the State’s liability is difficult to quantify but the Timber Creek decision awarded $2.53 million to the Native Title holders for the impairment and extinguishment of their Native Title over 1.19 km2. There is currently 1,826,997 km2 of land in Western Australia where Native Title is determined.
Timber Creek High Court Decision
The High Court’s 2019 Timber Creek decision provided some guidance to parties as to how compensation for economic and non-economic loss might be evaluated.
The State is continuing to negotiate agreements with Native Title holders that better support their economic and social development aspirations, and to provide full and final settlement of any compensation liability for the State. These are preferred to Court-determined settlements, which can be costly and time consuming for all parties. The Tjiwarl Native Title holders have recently filed two compensation claims in the Federal Court which will provide further guidance on the legal principles of compensation.
South West Native Title Settlement
In July 2013, the then Government announced a final offer to resolve Native Title to be made to Noongar Native Title claimants across the South West of Western Australia. In December 2015, six South West Native Title Settlement Indigenous Land Use Agreements (ILUAs) were executed and lodged for registration with the National Native Title Tribunal (NNTT). Since execution, the ILUAs have been subject to a number of legal proceedings which have resulted in a delay to the final registration of the ILUAs and the commencement of the Settlement.
A contingent liability exists until the six agreements are registered with the NNTT and the final legal proceedings are resolved.

Appendix 1
133
The Settlement, which comprises the full and final resolution of all Native Title claims in the State’s South West, includes a number of components including cash, property transfers and capital works. It also provides Noongar people with assets including a ‘future fund’ of $50 million each year for 12 years, $10 million each year for 12 years into an operations fund and up to 320,000 hectares of Crown land. The cash component has been provided for in the forward estimates in the State Budget. A Trustee company (Perpetual Trustee Company Limited) has been selected as the initial Trustee to manage the Noongar Boodja Trust. However, the Trustee will only be appointed at the ‘Trust effective date’ which will be after conclusive registration of the ILUAs.
Public Transport Authority
Litigation in progress
A former contractor has commenced action in the Supreme Court against the Public Transport Authority (PTA) relating to a claim for breach of contractual obligations and the Australian Consumer Law. The PTA has denied all liability and is defending the action. The plaintiff is still to quantify the claim and it is not possible to estimate the amount of any potential payments in relation to this claim at balance sheet date.
A claim has been lodged by a third party with the Supreme Court in relation to taking orders for the acquisition of land for the construction of public transport infrastructure. A trial will be scheduled to be heard in the next financial year. It is not possible to disclose the amount of the claim as it could compromise settlement negotiation.
The PTA has entered into a contractual agreement with two parties for the delivery of Transport Infrastructure assets. It is anticipated that one of the parties to the agreement will cease to participate in the delivery of the project and PTA is currently negotiating with the party for a release from the contract (in the form of a deed of settlement and release). The right to terminate for an event of force majeure accrued in February 2020. It is not possible to disclose the amount of the claim as it could compromise settlement negotiation.
Perth Airport Pty Ltd
In April 2016, the PTA granted an indemnity to Perth Airport Pty Ltd for any loss or liability it suffers or incurs due to personal injury, third party property damage and consequential losses arising in connection with the construction of the Forrestfield-Airport Link project on and underneath Perth Airport. The PTA has put in place insurance to reduce the State’s exposure to claims under the indemnity.
Southern Ports Authority Bulk Loader
The Southern Ports Authority has a contract to load bulk nickel for BHP Billiton Nickel West. BHP Billiton Nickel West currently does not export its bulk nickel from Esperance. However, this situation may change. The status of the Authority’s obligations is not determined and insufficient information is currently available to determine the financial impact, if any, in the event of a claim under the contract arrangements.

2019-20 Annual Report on State F inances
134
Synergy (Electricity Generation and Retail Corporation)
Synergy operates a portfolio of thermal power stations that utilised asbestos for its insulation and fire resistant qualities prior to the awareness of the dangers of this material. Synergy has a current asbestos management process in place and addresses these risks on an ongoing basis. However, diseases which emanate from asbestos, such as asbestosis, may take many years to develop. As such, Synergy may have a liability to those workers and other contractors who came in contact with asbestos at one of its power stations in the past. Synergy has a contingent liability for undiagnosed illnesses which may arise from exposure to asbestos at one of Synergy’s sites. The magnitude of this liability is extremely uncertain and cannot be quantified with any accuracy.
Horizon Power
A number of the properties, including power stations and residential accommodations, owned by Horizon Power have asbestos containing materials. Horizon Power has a robust management and monitoring process in place for the on-going identification and risk assessment of asbestos hazards and implements safe systems of works during any repair, maintenance and demolition works at these sites. Horizon Power complies with the relevant regulations, including the Code of Practice for the Management and Control of Asbestos in Workplaces and commissions compliance surveys on a regular basis and has a long-term objective to remove asbestos materials from all its sites.
There is currently no claim against Horizon Power from current or past employees and contractors for illnesses arising from exposure to asbestos that is not covered by RiskCover. Should any claim arise in the future, Horizon Power is likely to be appropriately covered by its workers’ compensation and public liability insurance, or RiskCover.
Removal of Statutory Limitation Periods for Civil Litigation by Victims of Child Sexual Abuse - the Civil Liability Legislation Amendment (Child Sexual Abuse Actions) Act 2018
The Civil Liability Legislation Amendment (Child Sexual Abuse Actions) Act 2018 to remove statutory limitation periods for victims of historical child sexual abuse came into operation on 1 July 2018. The removal of statutory limitation periods potentially exposes organisations in which abuse occurred (including State-based institutions) to claims for damages and compensation. The implementation of this reform represents an unquantified liability to the State.
The Insurance Commission of Western Australia (ICWA), through the Government Insurance Fund, Insurance Commission General Fund and the RiskCover Fund, is exposed to claims arising from this legislative change.
For these insurable claims, the number and size is highly uncertain. Based on the evidence available it has been determined that a reliable estimate cannot be made and included with known claims recorded in ICWA’s outstanding Balance Sheet liabilities at 30 June 2020. An actuarial assessment has estimated that the range of these claims may lie between $25.6 million and $77.3 million.
Further claims under this reform may arise that are not insurable and which will be assessed and funded on an emerging basis, in line with the settlement of resulting claims. The State Government has also established an account to hold funds for any future claims under the National Redress Scheme and Civil Litigation for Survivors of Institutional Child Sexual Abuse (see Appendix 5 of this ARSF).
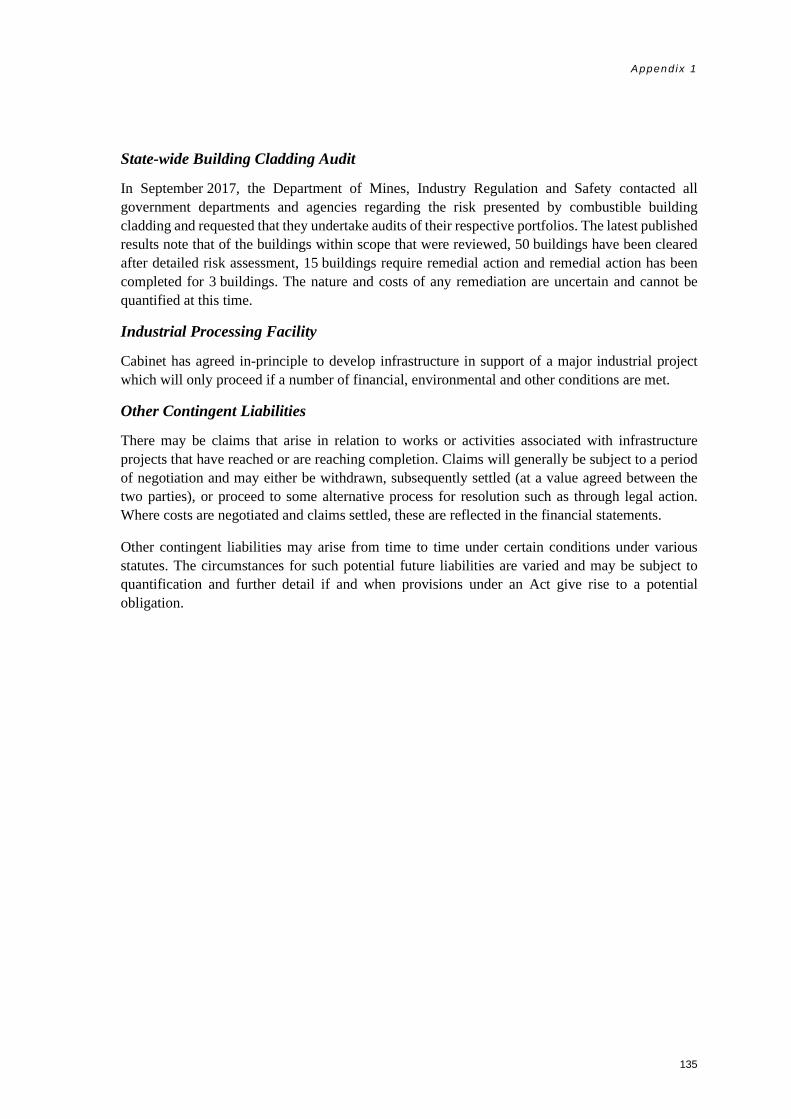
Appendix 1
135
State-wide Building Cladding Audit
In September 2017, the Department of Mines, Industry Regulation and Safety contacted all government departments and agencies regarding the risk presented by combustible building cladding and requested that they undertake audits of their respective portfolios. The latest published results note that of the buildings within scope that were reviewed, 50 buildings have been cleared after detailed risk assessment, 15 buildings require remedial action and remedial action has been completed for 3 buildings. The nature and costs of any remediation are uncertain and cannot be quantified at this time.
Industrial Processing Facility
Cabinet has agreed in-principle to develop infrastructure in support of a major industrial project which will only proceed if a number of financial, environmental and other conditions are met.
Other Contingent Liabilities
There may be claims that arise in relation to works or activities associated with infrastructure projects that have reached or are reaching completion. Claims will generally be subject to a period of negotiation and may either be withdrawn, subsequently settled (at a value agreed between the two parties), or proceed to some alternative process for resolution such as through legal action. Where costs are negotiated and claims settled, these are reflected in the financial statements.
Other contingent liabilities may arise from time to time under certain conditions under various statutes. The circumstances for such potential future liabilities are varied and may be subject to quantification and further detail if and when provisions under an Act give rise to a potential obligation.

2019-20 Annual Report on State F inances
136
NOTE 33: FINANCIAL INSTRUMENTS
(a) Financial Risk Management Objectives and Policies
Exposure to credit risk, liquidity risk, interest rate risk and other financial risks arise in the normal course of public sector activity. Public sector agencies adopt various programs for managing market risk, which include derivative financial instruments. The two main sources of market risk are fluctuations in interest and foreign exchange rates. Derivatives in use include interest rate swaps, interest rate futures, cross-currency swaps and forward foreign exchange contracts. Whenever derivative positions are created, cash or an underlying physical security is held to cover any potential liability.
Credit risk
Credit risk in relation to financial assets is the risk that a third party will not meet its obligation in accordance with agreed terms. The maximum exposure to credit risk at balance date in relation to each class of recognised financial assets, is the carrying amount of those assets as indicated in the Balance Sheet. Credit risk in relation to cash assets and fixed interest securities is mitigated by investing in counter-parties that have acceptable credit ratings. Credit risk concentration is minimised in relation to financial assets and hedging instruments, and public sector agencies do not have significant exposures to any concentrations of credit risk. Generally, agencies exposures are to a large number of customers or highly rated counter-parties and their credit risks are very low. There is a high degree of geographically-based concentrations of recognised financial assets in Australia. Provision for impairment of financial assets is calculated based on past experience, and current and expected changes in client credit ratings. For financial assets that are either past due or impaired, refer to Note 11: Receivables.
Liquidity risk
Liquidity management is undertaken by the Western Australian Treasury Corporation (WATC) on behalf of public sector agencies. WATC maintains a minimum prudent level of highly liquid quality assets at all times to ensure that commitments are met. The risk is minimised through the diversification of its funding activity across domestic and offshore markets and across the maturity spectrum.
Currency risk
Currency risk is the risk that the fair value of future cash flows of a financial instrument will fluctuate because of changes in foreign exchange rates. Foreign currency exposures are managed through the use of foreign exchange contracts and derivatives.
Market risk
Exposure to market risk for changes in interest rates relates primarily to long-term debt obligations. The risk is managed by WATC through portfolio diversification and maturity spread.

Appendix 1
137
Interest rate risk
Interest rate risk is the risk that the value of financial instrument will fluctuate due to changes in market interest rates. The interest rate risk by class of recognised financial asset and financial liability at 30 June 2020 is shown in the tables below. The interest rate shown is the effective interest rate or weighted average effective interest rate in respect of a class of assets or liabilities. For ‘floating’ instruments, the rate is the current market rate. The bands reflect the earlier of the next contractual repricing date or the maturity date of the asset or liability.
(b) Fair Value of Financial Assets and Liabilities
The carrying amount of financial assets and financial liabilities recorded in the consolidated Balance Sheet are not materially different from their fair value.
(c) Derivative Financial Instruments
The public sector limits dealings in derivatives to only those counter-parties that are recognised financial intermediaries and possess a credit rating of ‘A’ or better. The public sector does not have a material exposure to any individual counter-party. The following table provides details of outstanding derivatives used for hedging purposes at 30 June 2020.
NOTE 33: FINANCIAL INSTRUMENTS (CONT.)
General Government
Note: Columns may not add due to rounding.
2020 2019$m $m
Financial Assets at amortised costCash and deposits 513 601
Receivables 3,589 3,775
Investments, loans and placements 5,924 4,470
Advances paid 715 713
Shares and other equity 51,586 50,765
Other f inancial assets 8 8
Financial Liabilities at amortised costDeposits held 1,472 686 Advances received 326 343 Lease liabilities 2,722 - Other borrow ings 26,389 27,746 Payables 1,463 1,438 Other employee benefits 241 146 Other f inancial liabilities 784 903
Categories of Financial InstrumentsThe carrying amounts of each of the follow ing categories of f inancial assets and f inancial liabilities at balance date are as follow s.

2019-20 Annual Report on State F inances
138
NOTE 33: FINANCIAL INSTRUMENTS (CONT.)
Total Publ ic Sector
Note: Columns may not add due to rounding.
2020 2019$m $m
Financial assets at amortised costCash and deposits 2,346 1,517
Receivables 4,836 5,110
Investments, loans and placements 8,194 9,288
Advances paid 5,259 4,782
Shares and other equity 105 23
Other f inancial assets 15 8
Financial assets at fair value through profit or lossReceivables 887 536
Investments, loans and placements 17,301 10,302
Shares and other equity 1,739 1,897
Other f inancial assets
Financial Liabilities at amortised costDeposits held 12 11
Advances received 326 343
Lease liabilities 3,500 -
Other borrow ings 4,125 3,189
Payables 3,575 3,993
Guarantees 347 368
Other employee benefits 290 168
Other f inancial liabilities 4,469 4,182
Financial liabilities at fair value through profit or lossBorrow ings 60,502 57,713
Payables 6,398 3,228
Financial liabilites at fair value through other comprehensive incomeBorrow ings 84 69
Categories of Financial InstrumentsThe carrying amounts of each of the follow ing categories of f inancial assets and financial liabilities at the balance sheet date are asfollow s.

Appendix 1
139
NOTE 33: FINANCIAL INSTRUMENTS (CONT.)
General Government
Fair ValuesNotional face
ValueNet fair
ValueCredit
Exposure2020 2020 2020
$m $m $m
Interest rate contracts - - - Forw ard exchange contracts - - - Futures contracts - - - Commodity contracts - - - Total - - -
Fair ValuesNotional face
ValueNet fair
ValueCredit
Exposure2019 2019 2019
$m $m $m
Interest rate contracts - - - Forw ard exchange contracts - - - Futures contracts - - - Commodity contracts - - -
Total - - -
Financial assets and liabilities exclude GST receivable/payable to the Australian Taxation Office and National TaxEquivalent arrangements.

2019-20 Annual Report on State F inances
140
NOTE 33: FINANCIAL INSTRUMENTS (CONT.)
Total Publ ic Sector
Fair ValuesNotional face
ValueNet fair
ValueCredit
Exposure2020 2020 2020
$m $m $m
Interest rate contracts 12,763 763 802Forw ard exchange contracts 19 19 19 Equity Contracts - -15 - Other commodity contracts 1,267 72 53
Total 14,049 839 873
Fair ValuesNotional face
ValueNet fair
ValueCredit
Exposure2019 2019 2019
$m $m $m
Interest rate contracts 12,661 520 754Forw ard exchange contracts 7 7 - Equity Contracts - -42 - Other commodity contracts 522 - -
Total 13,190 485 754

NOTE 33: FINANCIAL INSTRUMENTS (CONT.) General Government
(a) The amount of receivables excludes GST recoverable from the Australian Taxation Office (statutory receivable) and National Tax Equivalent Regimes. (b) The amount of payables excludes GST payable to the Australian Taxation Office (statutory payable). (c) Excludes non-financial assets and liabilities that are reported on the face of the balance sheet. Note: Columns/rows may not add due to rounding.
Floating interest rate
up to 3 months
3 to 12months
1 year to5 years
Over 5 years
Total Fixed interest rate
Non-interestbearing
Totalcarryingamount
Weightedaverage
effective interest rate
$m $m $m $m $m $m $m $m %
325 91 21 17 - 128 59 513
1 - - - - - 3,588 3,589
6 3,139 1,299 1,255 171 5,865 54 5,924
Financial assets
Cash and deposits
Receivables(a)
Investments, loans and placements
Advances paid:
Non-government schools - 9 26 139 160 333 - 333
26 - - - - - 356 382
- - - - - - 51,586 51,586
- - - - - - 8 8
Other advances
Shares and other equity
Other financial assets
Total financial assets(c) 359 3,238 1,347 1,410 331 6,326 55,651 62,335
1 983 368 110 - 1,460 11 1,472 1.0
- - - - - - 326 326 -
- 77 215 805 1,625 2,722 - 2,722 4.2
532 1,484 2,603 13,006 8,755 25,847 10 26,389 3.1
2 - - - - - 1,461 1,463 -
- - - - - - 241 241 -
26 - - - - - 758 784 -
Financial liabilities
Deposits held
Advances received
Lease Liabilities
Other borrowings
Payables(b)
Other employee benefits
Other financial liabilities
Total financial liabilities(c) 561 2,544 3,186 13,920 10,380 30,030 2,807 33,397
Interest rate risk exposureThe general governemnt sector’s exposure to interest rate risk and the effective interest rate by class of recognised f inancial asset and f inancial liability are show n below .
30 June 2020
Fixed Interest Maturing in
141
Ap
pe
nd
ix 1
-
-
0.4
0.4
1.4
4.9
3.0

NOTE 33: FINANCIAL INSTRUMENTS (CONT.) General Government
(a) The amount of receivables excludes GST recoverable from the Australian Taxation Office (statutory receivable) and National Tax Equivalent Regimes. (b) The amount of payables excludes GST payable to the Australian Taxation Office (statutory payable). (c) Excludes non-financial assets and liabilities that are reported on the face of the balance sheet. Note: Columns/rows may not add due to rounding.
Floating interest rate
up to 3 months
3 to 12months
1 year to5 years
Over 5 years
Total Fixed interest rate
Non-interestbearing
Totalcarryingamount
Weightedaverage
effective interest rate
$m $m $m $m $m $m $m $m %
290 98 19 25 - 141 169 601 1.31 - - - - 1 3,775 3,777 2.2
25 2,021 939 1,094 362 4,415 29 4,470 3.4
Financial assets
Cash and deposits
Receivables(a)
Investments, loans and placements
Advances paid:
Non-government schools - 8 24 131 148 311 - 311 5.3- 7 5 12 5 29 373 402 4.0- - - 5 - 5 50,760 50,765
- - - - - - 8 8
Other advances
Shares and other equity
Other financial assets
Total financial assets(c) 317 2,134 988 1,267 515 4,903 55,114 60,334
1 313 135 170 57 675 11 686 3.2
- - - - - - 343 343
1,006 560 3,514 13,214 9,439 26,727 12 27,746 3.2
- - - - - - 1,438 1,438
- - - - - - 146 146
Financial liabilities
Deposits held
Advances received
Other borrowings
Payables(b)
Other employee benefits
Other financial liabilities - 4 - - - 4 899 903
Total financial liabilities(c) 1,007 877 3,650 13,384 9,495 27,407 2,849 31,263
30 June 2019
Fixed Interest Maturing in
142
20
19
-20
An
nu
al R
ep
ort o
n S
tate
Fin
an
ce
s
-
-
-
-
-
-

NOTE 33: FINANCIAL INSTRUMENTS (CONT.) Total Publ ic Sector
(a) The amount of receivables excludes GST recoverable from the Australian Taxation Office (statutory receivable). (b) The amount of payable excludes GST payable to the Australian Taxation Office (statutory payable). (c) Includes guarantees, warranties indemnities and sureties. See Note 32: Contingent Assets and Liabilities. (d) Excludes non-financial assets and liabilities that are reported on the face of the balance sheet. Note: Columns/rows may not add due to rounding.
Floating interest rate
up to 3 months
3 to 12months
1 year to5 years
Over 5 years
Total Fixed interest rate
Non-interestbearing
Totalcarryingamount
Weightedaverage
effective interest rate
$m $m $m $m $m $m $m $m %
1,795 429 21 17 - 466 84 2,346 0.7
1 545 0 - - 545 5,177 5,723 1.0
651 11,397 2,933 4,142 3,177 21,649 3,194 25,495 1.7
Financial assetsCash and depositsReceivables(a)
Investments, loans and placements Advances paid:
Homebuyers 4,873 - - - - - - 4,873 4.5Non-government schools - 9 26 139 160 333 - 333 4.9
Other 26 - - - - - 27 53 -
Shares and other equity - - - - - - 1,844 1,844 - Other financial assets - - - - - - 15 15 -
Total financial assets(d) 7,348 12,380 2,980 4,297 3,337 22,994 10,341 40,682
1 - - - - - 11 12 1.1
- - 17 71 238 326 - 326 4.6
- 91 299 1,143 1,967 3,500 - 3,500 - 514 15,848 400 22,158 22,369 60,775 3,423 64,711 2.2
1 1,721 - - - 1,721 8,252 9,974 0.3
347 347 - 0 - - - - - 290 290 -
Financial liabilities Deposits held Advances received Lease liabilitiesOther borrowings Payables(b) Guarantees(c)
Other employee benefits Other financial liabilities 11 - - - - - 4,458 4,469 -
Total financial liabilities(d) 527 17,660 717 23,372 24,574 66,323 16,779 83,629
The total public sector’s exposure to interest rate risk and the effective interest rate by class of recognised f inancial asset and f inancial liability are show n below .Interest rate risk exposure
30 June 2020
Fixed Interest Maturing in
143

NOTE 33: FINANCIAL INSTRUMENTS (CONT.)
Total Publ ic Sector
(a) The amount of receivables excludes GST recoverable from the Australian Taxation Office (statutory receivable). (b) The amount of payables excludes GST payable to the Australian Taxation Office (statutory payable). (c) Includes guarantees, warranties, indemnities and sureties. See Note 32: Contingent Assets and Liabilities. (d) Excludes non-financial assets and liabilities that are reported on the face of the balance sheet. Note: Columns/rows may not add due to rounding.
Floating interest rate
up to 3 months
3 to 12months
1 year to5 years
Over 5 years
Total Fixed interest rate
Non-interestbearing
Totalcarryingamount
Weightedaverage
effective interest rate
$m $m $m $m $m $m $m $m %
Financial assetsCash and deposits 1,106 178 19 25 - 221 190 1,517 1.6Receivables(a) 1 333 - - - 333 5,312 5,646 1.4Investments, loans and placements 692 5,190 5,200 3,508 1,946 15,845 3,053 19,590 2.7Advances paid:
Homebuyers 4,415 - - - - - - 4,415 5.0Non-government schools - 8 24 131 148 311 - 311 5.3Other - 7 5 12 5 29 27 56 4.0
Shares and other equity - - - 5 - 5 1,915 1,920 - Other financial assets - - - - - - 8 8 -
Total financial assets(d) 6,214 5,716 5,249 3,681 2,099 16,744 10,505 33,464
Financial liabilitiesDeposits held 1 - - - - - 11 11 2.0Advances received - - 17 71 256 343 - 343 4.8Borrowings 1,591 10,847 5,184 23,007 20,089 59,126 253 60,971 2.9Payables(b) - 1,226 - - - 1,226 5,994 7,221 0.3Guarantees(c) - - - - - - 368 368 -Other employee benefits - - - - - - 168 168 - Other financial liabilities - 2 - - - 2 4,181 4,182 -
Total financial liabilities(d) 1,591 12,074 5,201 23,077 20,344 60,697 10,975 73,263
30 June 2019
Fixed Interest Maturing in
144
20
19
-20
An
nu
al R
ep
ort o
n S
tate
Fin
an
ce
s

Appendix 1
145
NOTE 33: FINANCIAL INSTRUMENTS (CONT.)
General Government
Tota l Publ ic Sector
Note: Columns/rows may not add due to rounding.
Carrying amount Profit Equity Profit Equity
Carrying amount Profit Equity Profit Equity
Interest rate sensitivity analysis $m $m $m $m $m $m $m $m $m $m
Financial AssetsCash and deposits 416 -4 -4 4 4 388 -4 -4 4 4Receivables 1 - - - - 1 - - - -Investments, loans and placements 3,145 -31 -31 31 31 2,046 -20 -20 20 20Advances paid 35 - - - - 15 - - - -
Financial LiabilitiesDeposits held 984 10 10 -10 -10 313 3 3 -3 -3Borrowings 2,016 20 20 -20 -20 1,566 16 16 -16 -16
Total Increase/-Decrease -6 -6 6 6 -6 -6 6 6
-1% change +1% change-1% change
30 June 201930 June 2020
+1% change
Carrying amount Profit Equity Profit Equity
Carrying amount Profit Equity Profit Equity
Interest rate sensitivity analysis $m $m $m $m $m $m $m $m $m $m
Financial AssetsCash and deposits 2,224 -22 -22 22 22 1,284 -13 -13 13 13Receivables 546 -5 -5 5 5 334 -3 -3 3 3Investments, loans and placements 12,049 -120 -120 120 120 5,883 -59 -59 59 59Advances paid 4,908 -49 -49 49 49 4,430 -44 -44 44 44
Financial Liabilities
Borrowings 16,361 -160 -160 160 160 12,437 124 124 -124 -124
Payables 1,722 17 17 -17 -17 1,226 12 12 -12 -12
Total Increase/-Decrease -340 -340 340 340 17 17 -17 -17
30 June 2019
-1% change +1% change -1% change +1% change
30 June 2020

2019-20 Annual Report on State F inances
146
NOTE 33: FINANCIAL INSTRUMENTS (CONT.)
General Government
Tota l Publ ic Sector
(a) Assets/liabilities valued using quoted prices (unadjusted) in active markets for identical assets or liabilities. (b) Assets/liabilities valued using inputs based on observable market data (either directly using prices or indirectly derived from prices. (c) Assets/liabilities valued using inputs not based on observable market data. Note: Columns/rows may not add due to rounding.
Level 1(a) Level 2(b) Level 3(c)
$m $m $m $m
Financial AssetsInvestments, loans and placements 5,903 2,963 2,918 22 Shares and other equity 51,586 22 - 51,563 Other f inancial assets 8 - - 8
Financial LiabilitiesBorrow ings 58 - - 58
Level 1(a) Level 2(b) Level 3(c)
$m $m $m $m
Financial AssetsInvestments, loans and placements 4,454 156 4,282 15 Shares and other equity 50,765 17 - 50,747 Other f inancial assets 8 - - 8
Financial LiabilitiesBorrow ings 57 - - 57
Carryingamount as at
30 June 2020
Fair value measurement at end of reporting period using:
Carryingamount as at
30 June 2019
Fair value measurement at end of reporting period using:
Level 1(a) Level 2(b) Level 3(c)
$m $m $m $m
Financial AssetsInvestments, loans and placements 18,116 5,762 11,460 894 Shares and other equity 1,844 1,761 73 9 Other f inancial assets 8 - - 8
Financial LiabilitiesBorrow ings 60,603 47,327 13,276 - Payables 6,398 6,398 - -
Level 1(a) Level 2(b) Level 3(c)
$m $m $m $m
Financial AssetsInvestments, loans and placements 14,950 3,663 10,318 969 Shares and other equity 1,920 1,894 23 3 Other f inancial assets 8 - - 8
Financial LiabilitiesBorrow ings 57,782 45,763 12,019 - Payables 4,454 4,454 - -
Carryingamount as at
30 June 2020
Fair value measurement at end of reporting period using:
Carryingamount as at
30 June 2019
Fair value measurement at end of reporting period using:
Appendix 1
147
NOTE 34: OTHER DISAGGREGATED INFORMATION
The total public sector (or whole-of-government) includes agencies classified into general government, public non-financial corporation and public financial corporation sectors in accordance with the Australian Bureau of Statistics’ (ABS’) coverage for Government Finance Statistics purposes. Details of the classification of State agencies are provided in Note 38: Composition of Sectors.
Revenue, expenses, assets and liabilities that are reliably attributable to each of the above sectors are set out in the following tables. For the purpose of this disclosure, effects of transactions and balances between sectors have not been eliminated, but those between agencies within each sector have been eliminated.

NOTE 34: OTHER DISAGGREGATED INFORMATION (CONT.)
Operat ing Statement for the year ended 30 June
Note: Columns/rows may not add due to rounding.
2020 2019 2020 2019 2020 2019 2020 2019 2020 2019$m $m $m $m $m $m $m $m $m $m
RESULTS FROM TRANSACTIONS
REVENUETaxation 9,077 8,616 - - - - -526 -520 8,550 8,097 Current grants and subsidies 9,379 10,210 2,446 1,824 - - -2,446 -1,824 9,379 10,210 Capital grants 642 873 64 338 - - -64 -338 642 873 Sales of goods and services 2,754 2,734 34,089 20,591 1,186 1,136 -975 -972 37,054 23,488 Interest Income 124 168 126 181 1,626 1,882 -1,320 -1,591 555 639 Revenue from public corporations
Dividends 392 1,350 - - - - -392 -1,350 - - Tax equivalent income 732 642 - - - - -732 -642 - -
Royalty income 8,450 6,713 - - - - - - 8,450 6,713 Other 614 701 468 478 100 113 -105 -99 1,077 1,193 Total 32,162 32,006 37,192 23,412 2,912 3,130 -6,560 -7,335 65,706 51,214
EXPENSESSalaries 12,887 12,269 1,101 1,056 62 57 - - 14,051 13,382 Superannuation
Concurrent costs 1,276 1,213 110 104 6 6 - - 1,392 1,323 Superannuation interest cost 89 135 - - - - - - 89 135
Other employee costs 401 447 34 39 1 2 -80 -138 356 350 Depreciation and amortisation 1,751 1,445 2,152 1,982 8 4 -3 - 3,908 3,431 Services and contracts 2,590 2,538 792 764 11 11 -8 -7 3,385 3,306 Other gross operating expenses 5,391 5,645 29,615 16,313 1,127 1,182 -1,105 -1,056 35,027 22,084 Interest
Interest on leases 142 89 90 85 1 - -1 - 231 174 Other interest 737 859 572 691 1,344 1,623 -1,319 -1,591 1,333 1,583
Tax equivalents - - 609 577 123 65 -732 -642 - - Current transfers 5,003 5,426 1,482 1,134 4 4 -2,796 -2,153 3,693 4,411 Capital transfers 228 625 15 19 16 14 -64 -338 194 319 Total 30,493 30,689 36,571 22,764 2,704 2,969 -6,109 -5,924 63,659 50,498
NET OPERATING BALANCE 1,669 1,317 621 648 208 161 -452 -1,410 2,047 716
General GovernmentPublic Non-Financial
CorporationsPublic FinancialCorporations
Inter-sectorEliminations
TotalPublic Sector
148
20
19
-20
An
nu
al R
ep
ort o
n S
tate
Fin
an
ce
s

NOTE 34: OTHER DISAGGREGATED INFORMATION (CONT.) Operat ing Statement for the year ended 30 June (cont .)
Note: Columns/rows may not add due to rounding.
2020 2019 2020 2019 2020 2019 2020 2019 2020 2019$m $m $m $m $m $m $m $m $m $m
Other economic flows - included in the operating resultNet gains on assets/liabilities -27 59 -65 47 -316 147 - - -408 254 Provision for doubtful debts -126 2 -72 -18 - - - - -198 -16 Changes in accounting policy/adjustment of prior periods -44 -172 -44 -145 8 7 1 - -79 -310 Total other economic flows -197 -111 -181 -116 -307 155 - - -685 -72 OPERATING RESULT 1,472 1,206 440 532 -99 315 -451 -1,410 1,362 644 All other movements in equity - - Items that will not be reclassified to operating result - - Revaluations 392 -1,374 459 -1,070 - - - - 850 -2,444 Net actuarial gains - superannuation 5 -814 -27 -38 - 1 - - -22 -850 Gains recognised directly in equity -1 - 4 8 1 - -3 - - 8 Change in net w orth of the public corporations sectors 217 -1,661 - - - - -217 1,661 - - All other -239 - -105 - -2 - 1 - -345 - Total all other movements in equity 373 -3,849 331 -1,100 -1 1 -220 1,661 483 -3,286
Movements in owner equityDividends - - -162 -1,229 -292 -181 455 1,410 - - Capital injections - - 652 758 -50 -136 -602 -622 - - Total movements in owner equity - - 490 -471 -343 -317 -147 788 - - 292 181 2,339 898 2,047 716 TOTAL CHANGE IN NET WORTH 1,845 -2,642 1,261 -1,039 -443 - -819 1,039 1,845 -2,642
KEY FISCAL AGGREGATES
NET OPERATING BALANCE 1,669 1,317 621 648 208 161 -452 -1,410 2,047 716
Less Net acquisition of non-financial assetsPurchase of non-financial assets 2,553 2,540 2,683 2,441 4 7 -51 -24 5,188 4,965 Changes in inventories 38 - 2,050 614 - - - - 2,088 614 Other movement in non-financial assets -15 146 109 127 - - - - 94 273 less: - - - - - - - - - - Sales of non-financial assets 1,476 100 311 578 - - -51 -23 1,736 654 Depreciation 1,751 1,445 2,152 1,982 8 4 -3 - 3,908 3,431 Total net acquisition of non-financial assets -651 1,142 2,380 622 -5 3 3 - 1,727 1,767 NET LENDING/-BORROWING 2,320 175 -1,758 26 213 158 -455 -1,410 320 -1,051
General GovernmentPublic Non-Financial
CorporationsPublic FinancialCorporations
Inter-sectorEliminations
TotalPublic Sector
149
Ap
pe
nd
ix 1

NOTE 34: OTHER DISAGGREGATED INFORMATION (CONT.)
Balance Sheet as at 30 June
Note: Columns/rows may not add due to rounding.
2020 2019 2020 2019 2020 2019 2020 2019 2020 2019$m $m $m $m $m $m $m $m $m $m
ASSETSFinancial assetsCash and deposits 513 601 2,938 1,391 354 198 -1,459 -672 2,346 1,517 Advances paid 715 713 - - 4,873 4,415 -329 -346 5,259 4,782 Investments, loans and placements 5,924 4,470 5,407 5,003 67,860 62,777 -53,697 -52,683 25,495 19,567 Receivables 3,938 3,999 2,026 1,804 651 690 -692 -668 5,923 5,825 Shares and other equity -
Investments in other public sector entities - equity method 40,962 40,745 - - - - -40,962 -40,745 - - Investments in other public sector entities - direct injections 10,602 10,000 - - - - -10,602 -10,000 - - Investments in other entities 22 20 9 3 1,812 1,897 - - 1,844 1,920
Other f inancial assets 8 8 580 673 7 5 -580 -673 15 13 Total financial assets 62,684 60,556 10,960 8,874 75,558 69,982 -108,320 -105,788 40,882 33,624
Non-financial assetsLand 35,238 35,600 8,361 8,209 - - - - 43,599 43,809 Property, plant and equipment 46,363 45,344 56,208 55,749 4 5 - - 102,575 101,099 Right-of-use assets 2,484 - 494 - 24 - -5 - 2,997 - Biological assets 109 3 209 342 - - - - 317 345 Inventories - - - - - - - -
Land inventories - - 1,809 1,852 - - - - 1,809 1,852 Other inventories 108 71 6,325 4,275 - - - - 6,433 4,345
Intangibles 603 626 445 395 7 7 - - 1,054 1,028 Assets held for sale 21 43 16 16 - - - - 37 59 Investment property 7 7 26 60 - - - - 33 67 Other 229 245 190 134 5 3 - -1 424 381 Total non-financial assets 85,162 81,940 74,081 71,032 41 15 -5 -1 159,279 152,985
TOTAL ASSETS 147,847 142,496 85,041 79,906 75,599 69,997 -108,325 -105,788 200,161 186,610
General GovernmentPublic Non-Financial
CorporationsPublic FinancialCorporations
Inter-sectorEliminations
TotalPublic Sector
150
20
19
-20
An
nu
al R
ep
ort o
n S
tate
Fin
an
ce
s

NOTE 34: OTHER DISAGGREGATED INFORMATION (CONT.)
Balance Sheet as at 30 June (cont.)
Note: Columns/rows may not add due to rounding.
2020 2019 2020 2019 2020 2019 2020 2019 2020 2019$m $m $m $m $m $m $m $m $m $m
LIABILITIESDeposits held 1,472 686 - - - - -1,460 -675 12 11 Advances received 326 343 326 343 3 3 -329 -346 326 343 Borrow ings - - - - - - - - - -
Lease Liabilities 2,722 - 815 - 29 - -66 - 3,500 - Other borrow ings 26,389 27,745 23,310 22,862 68,646 63,047 -53,635 -52,680 64,711 60,974
Superannuation 6,818 7,062 97 98 5 5 0 -0 6,920 7,165 Other employee benefits 3,543 3,197 423 368 15 13 0 0 3,981 3,577 Payables 1,463 1,425 8,488 5,875 319 129 -292 -219 9,978 7,211 Other liabilities 2,674 1,445 1,796 1,835 4,803 4,580 -979 -1,124 8,294 6,736 TOTAL LIABILITIES 45,408 41,903 35,255 31,381 73,821 67,776 -56,762 -55,044 97,723 86,017 NET ASSETS 102,438 100,593 49,786 48,525 1,778 2,220 -51,563 -50,745 102,438 100,593 Of which: - - - - - - - - Contributed equity - - 10,887 10,235 -286 -236 -10,602 -10,000 - - Accumulated surplus 7,587 6,317 17,448 17,299 2,041 2,433 7 7 27,083 26,056 Other reserves 94,851 94,276 21,450 20,990 23 23 -40,969 -40,752 75,355 74,537 NET WORTH 102,438 100,593 49,786 48,525 1,778 2,220 -51,563 -50,745 102,438 100,593
General GovernmentPublic Non-Financial
CorporationsPublic FinancialCorporations
Inter-sectorEliminations
TotalPublic Sector
151
Ap
pe
nd
ix 1
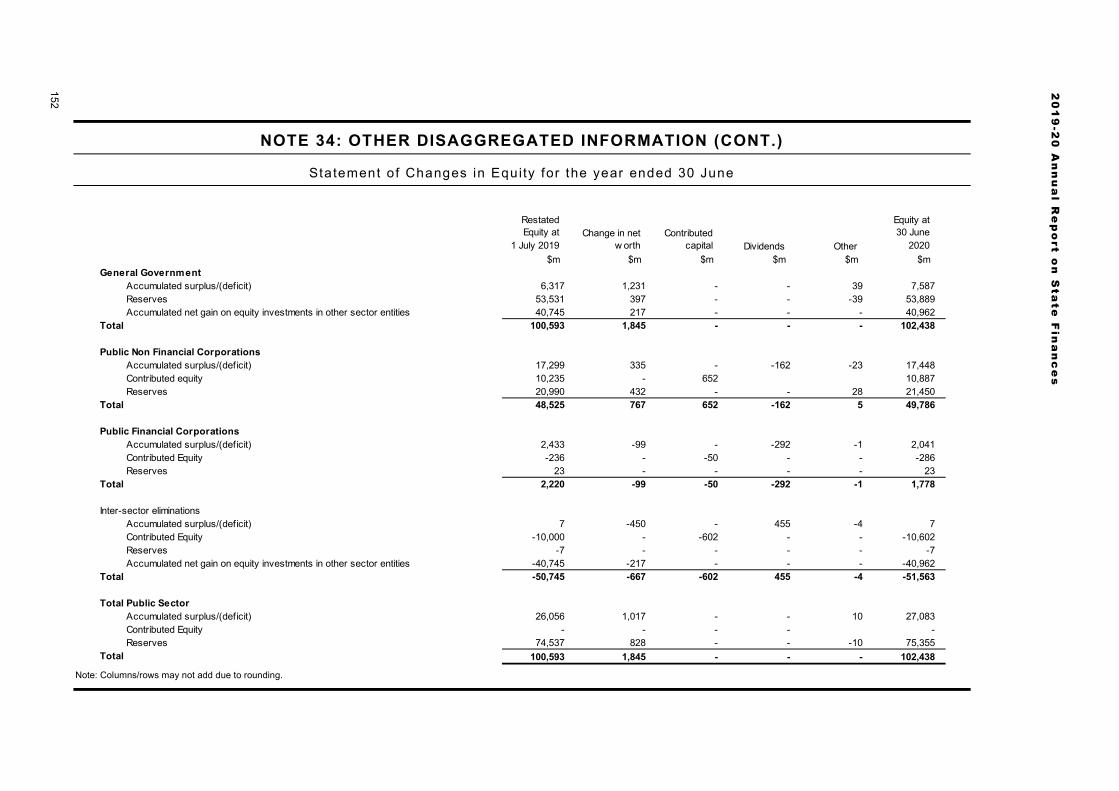
NOTE 34: OTHER DISAGGREGATED INFORMATION (CONT.)
Statement of Changes in Equity for the year ended 30 June
Note: Columns/rows may not add due to rounding.
RestatedEquity at
1 July 2019Change in net
w orthContributed
capital Dividends Other
Equity at30 June
2020$m $m $m $m $m $m
General GovernmentAccumulated surplus/(deficit) 6,317 1,231 - - 39 7,587 Reserves 53,531 397 - - -39 53,889 Accumulated net gain on equity investments in other sector entities 40,745 217 - - - 40,962
Total 100,593 1,845 - - - 102,438
Public Non Financial CorporationsAccumulated surplus/(deficit) 17,299 335 - -162 -23 17,448 Contributed equity 10,235 - 652 10,887 Reserves 20,990 432 - - 28 21,450
Total 48,525 767 652 -162 5 49,786
Public Financial CorporationsAccumulated surplus/(deficit) 2,433 -99 - -292 -1 2,041 Contributed Equity -236 - -50 - - -286 Reserves 23 - - - - 23
Total 2,220 -99 -50 -292 -1 1,778
Inter-sector eliminationsAccumulated surplus/(deficit) 7 -450 - 455 -4 7 Contributed Equity -10,000 - -602 - - -10,602 Reserves -7 - - - - -7 Accumulated net gain on equity investments in other sector entities -40,745 -217 - - - -40,962
Total -50,745 -667 -602 455 -4 -51,563
Total Public SectorAccumulated surplus/(deficit) 26,056 1,017 - - 10 27,083 Contributed Equity - - - - - Reserves 74,537 828 - - -10 75,355
Total 100,593 1,845 - - - 102,438
152
20
19
-20
An
nu
al R
ep
ort o
n S
tate
Fin
an
ce
s

NOTE 34: OTHER DISAGGREGATED INFORMATION (CONT.)
Cash Flow Statement for the year ended 30 June
Note: Columns/rows may not add due to rounding.
2020 2019 2020 2019 2020 2019 2020 2019 2020 2019$m $m $m $m $m $m $m $m $m $m
CASH FLOWS FROM OPERATING ACTIVITES
Cash receivedTaxes received 9,018 8,911 - - - - -526 -520 8,492 8,392 Grants and subsidies received 11,825 11,082 2,507 2,171 - - -2,507 -2,171 11,825 11,082 Receipts from sales of goods and services 2,589 2,599 25,130 20,786 1,203 1,196 -966 -889 27,956 23,693 Interest receipts 119 173 129 166 1,712 1,901 -1,395 -1,580 565 661 Dividends and tax equivalents 1,071 2,092 61 64 - - -1,132 -2,156 - - Other 10,825 7,659 1,361 1,424 163 155 -385 -432 11,965 8,807 Total cash received 35,447 32,517 29,189 24,611 3,078 3,253 -6,912 -7,746 60,802 52,635
Cash PaidWages, salaries and supplements, and superannuation -14,192 -13,766 -1,184 -1,235 -66 -60 - - -15,441 -15,062 Payments for goods and services -8,494 -8,473 -19,602 -15,377 -866 -857 1,200 1,285 -27,762 -23,421 Interest paid -905 -950 -689 -772 -1,665 -1,874 1,395 1,580 -1,864 -2,017 Grants and subsidies paid -6,641 -5,635 -708 -689 - - 2,539 2,195 -4,810 -4,129 Dividends and tax equivalents - - -614 -614 -88 -128 702 742 - - Other payments -2,004 -1,679 -3,628 -3,319 -160 -152 537 531 -5,256 -4,620 Total cash paid -32,237 -30,503 -26,424 -22,006 -2,845 -3,072 6,374 6,333 -55,132 -49,248
NET CASH FLOWS FROM OPERATING ACTIVITIES 3,211 2,014 2,764 2,604 233 181 -538 -1,414 5,670 3,386
CASH FLOWS FROM INVESTING ACTIVITES
Cash flows from investments in non-financial assetsPurchase of non-financial assets -2,553 -2,540 -2,683 -2,441 -4 -7 51 24 -5,188 -4,965 Sales of non-financial assets 1,476 100 311 578 - - -51 -23 1,736 654 Total cash flows from investments in non-financial assets -1,077 -2,441 -2,372 -1,863 -4 -7 - - -3,453 -4,310
Cash flows from investments in financial assetsCash receivedFor policy purposes 64 33 - - - - - -13 64 21 For liquidity purposes 56 308 74 11 11,914 6,177 - - 12,044 6,495 Cash paidFor policy purposes -862 -790 -21 - -70 -164 890 935 -63 -19 For liquidity purposes -38 -66 -30 -61 -14,128 -8,656 - - -14,195 -8,784 Total cash flows from investments in financial assets -780 -516 23 -50 -2,284 -2,643 890 922 -2,150 -2,286
NET CASH FLOWS FROM INVESTING ACTIVITIES -1,857 -2,956 -2,349 -1,913 -2,287 -2,650 890 922 -5,603 -6,597
General GovernmentPublic Non-Financial
CorporationsPublic FinancialCorporations
Inter-sectorEliminations
TotalPublic Sector
153
Ap
pe
nd
ix 1

NOTE 34: OTHER DISAGGREGATED INFORMATION (CONT.)
Cash Flow Statement for the year ended 30 June (cont .)
Note: Columns/rows may not add due to rounding.
2020 2019 2020 2019 2020 2019 2020 2019 2020 2019$m $m $m $m $m $m $m $m $m $m
CASH FLOWS FROM FINANCING ACTIVITIES
Cash receivedAdvances received 17 17 - - - - -17 -17 - - Borrow ings 845 61 7,014 4,301 28,790 26,539 -15,801 -9,457 20,848 21,444 Deposits received - - - - - - - - - - Other f inancing receipts 312 253 902 849 19 28 -1,002 -1,032 231 98 Total cash receipts from financing activities 1,174 330 7,916 5,150 28,809 26,567 -16,821 -10,506 21,078 21,542
Cash paidAdvances paid -17 -17 -17 -29 - - 17 29 -17 -17 Borrow ings repaid -1,379 -513 -6,565 -4,583 -26,254 -24,350 15,801 9,457 -18,397 -19,990 Deposits paid - - - - - - - - - - Other f inancing payments -492 -214 -172 -71 -4 -0 221 97 -448 -188 Dividends paid - - -162 -1,229 -267 -185 430 1,414 - - Total payments for financing activities -1,888 -744 -6,917 -5,912 -26,526 -24,535 16,469 10,997 -18,862 -20,194
NET CASH FLOWS FROM FINANCING ACTIVITIES -714 -414 1,000 -762 2,283 2,032 -352 491 2,217 1,348
Net increase in cash and cash equivalents 640 -1,355 1,415 -71 229 -437 - - 2,284 -1,863 Cash and cash equivalents at the beginning of the year 5,005 6,360 1,818 1,889 1,890 2,326 -2 -2 8,710 10,573 Cash and cash equivalents at the end of the year 5,645 5,005 3,233 1,818 2,119 1,890 -2 -2 10,994 8,710
Net cash f low s from operating activities 3,211 2,014 2,764 2,604 233 181 -538 -1,414 5,670 3,386 Net cash f low s from investing in non-financial assets -1,077 -2,441 -2,372 -1,863 -4 -7 - - -3,453 -4,310 Dividends paid - - -162 -1,229 -267 -185 430 1,414 - - 30 8 38 , 9 Cash surplus/-deficit 2,134 -426 230 -487 -38 -11 - - 2,217 -924
General GovernmentPublic Non-Financial
CorporationsPublic FinancialCorporations
Inter-sectorEliminations
TotalPublic Sector
20
19
-20
An
nu
al R
ep
ort o
n S
ate
Fin
an
ce
s
154

Appendix 1
155
NOTE 35: INITIAL APPLICATION OF AUSTRALIAN ACCOUNTING STANDARDS
(a) AASB 15: Revenue from Contract with Customers and AASB 1058: Income of Not-for-Profit Entities
AASB 15: Revenue from Contracts with Customers replaces AASB 118: Revenue and AASB 111: Construction Contracts for annual reporting periods on or after 1 January 2019. Under the new model, an entity shall recognise revenue when (or as) the entity satisfies a performance obligation by transferring a promised good or service and is based upon the transfer of control rather than transfer of risks and rewards.
AASB 15 focuses on providing sufficient information to the users of financial statements about the nature, amount, timing and uncertainty of revenue and cash flows arising from the contracts with customers. Revenue is recognised by applying the following five steps:
• identifying contracts with customers;
• identifying separate performance obligations;
• determine the transaction price of the contract;
• allocating the transaction price to each of the performance obligations; and
• recognising revenue as each performance obligation is satisfied.
Revenue is recognised over time or at a point in time. Any distinct goods or services are separately identified and any discounts or rebates in the contract price are allocated to the separate elements.
When either party to the contract has performed the obligation, the agency shall present the contract in the balance sheet as a contract asset or a contract liability. The agency shall present any unconditional rights to consideration separately as a receivable.
a) A receivable is the agency’s right to consideration that is unconditional and only passage of time is required before payment of the consideration is due.
b) A contract asset is recognised if the agency transfers goods or services to a customer before the customer pays consideration or the payment is due.
c) A contract liability is recognised if a customer pays consideration before the agency transfers a good or service to the customer.
In addition, income other than from contracts with customers are subject to AASB 1058: Income of Not-for-Profit Entities. Income recognition under AASB 1058 depends on whether such a transaction gives rise to liabilities or a contribution by owners related to an asset (such as cash or another asset) recognised by an agency.

2019-20 Annual Report on State F inances
156
NOTE 35: INITIAL APPLICATION OF AUSTRALIAN ACCOUNTING STANDARDS (CONT.)
The modified retrospective approach has been adopted on transition to AASB 15 and AASB 1058. No comparative information will be restated under this approach, and the cumulative effect of initially applying the standards has been recognised as an adjustment to the opening balance of accumulated surplus/(deficit) at the date of initial application (1 July 2019).
Under this transition method, the Standard has been applied retrospectively only to contracts and transactions that are not completed contracts at the date of initial application.
Refer to Note 3(h) for the revenue and income accounting policies adopted from 1 July 2019.

Appendix 1
157
NOTE 35: INITIAL APPLICATION OF AUSTRALIAN ACCOUNTING STANDARDS (CONT.)
The effects of adopting AASB 15 and AASB 1058 are as follows.
Actual Adjustments
Actual under AASB 118 and 1004
$m $m $mREVENUE Taxation 9,077 -1 9,076All Grants and Subsidies (Recurrent and Capital) 10,020 3,427 13,447Sales of goods and services 2,754 -7 2,747All Other 10,311 -(a) 10,311
Net result 32,162 3,419 35,581
EXPENSESTransfers (Current and Capital) 5,230 3,573 8,803Other gross operating expenses 5,391 - 5,391
Net result 10,621 3,573 14,194
LIABILITIESOther liabilities 2,674 158 2,832
Net result 2,674 158 2,832
Actual Adjustments
Actual under AASB 118 and 1004
$m $m $mREVENUE Taxation 8,550 -1 8,549All Grants and Subsidies (Recurrent and Capital) 10,020 3,437 13,458Sales of goods and services 37,054 -9,055 27,999All Other 10,082 30 10,112
Net result 65,706 -5,588 60,118
EXPENSESTransfers (Current and Capital) 3,887 3,573 7,460Other gross operating expenses 35,027 -9,048 25,980
Net result 38,915 -5,475 33,439
LIABILITIESOther liabilities 8,291 158 8,449
Net result 8,291 158 8,449
General Government
Total Public Sector

2019-20 Annual Report on State F inances
158
NOTE 35: INITIAL APPLICATION OF AUSTRALIAN ACCOUNTING STANDARDS (CONT.)
(b) AASB 16: Leases
AASB 16: Leases supersedes AASB 117: Leases and introduces a single lessee accounting treatment for annual reporting periods beginning on or after 1 January 2019. The new standard removes the distinction between most finance and operating leases and instead introduces a single lessee accounting model. It requires lessees to recognise most leases (operating and finance leases) on the Balance Sheet as a right-of-use asset and lease liability, except for short term leases (lease terms of 12 months or less at the commencement date) and low-value assets (valued less than $5,000). For the 2019-20 reporting year, the transitional arrangements in the new Standard preserves a small number of finance leases as ‘other borrowings’ on the Balance Sheet, where these leases are associated with social concession arrangements which will be subject to AASB 1059: Service Concession Arrangements: Grantors in the 2020-21 reporting year
The modified retrospective approach has been applied on initial adoption. The cumulative effect of initially applying this Standard has been recognised as an adjustment to the opening balance of accumulated surplus as permitted under the AASB 16.C5(b). Lease liabilities recognised are measured at present value of the remaining lease payments (where previously classified as an operating lease), discounted using the incremental borrowing rate as per AASB16.C8(a).
Under AASB 116, agencies take into consideration all operating leases that were off balance sheet under AASB 117 and recognises:
a) right-of-use assets and lease liabilities in the Balance Sheet, initially measured at the present value of future lease payments, discounted using the incremental borrowing rate of 1 July 2019;
b) depreciation of right-of-use assets and interest on lease liabilities in the Operating Statement; and
c) the total amount of cash paid as principal amount, which is presented in the cash flows from financing activities, and interest paid, which is presented in the cash flows from operating activities, in the Cash Flow Statement.
In relation to leased vehicles that were previously classified as finance leases, their carrying amount before transition is used as the carrying amount of the right-of-use assets and the lease liabilities at the date of initial application.
Agencies that are in possession of concessionary leases that are of low value terms and conditions at the date of transition, measure these leases at cost at inception.
The right-of-use assets are assessed for impairment at the date of transition.

Appendix 1
159
NOTE 35: INITIAL APPLICATION OF AUSTRALIAN ACCOUNTING STANDARDS (CONT.)
On transition, agencies have elected to apply the following practical expedients in the assessment of their leases that were previously classified as operating leases under AASB 117:
a) a single discount rate has been applied to a portfolio of leases with reasonably similar characteristics;
b) agencies have relied on their assessment of whether existing leases were onerous in applying AASB 137: Provisions, Contingent Liabilities and Contingent Assets immediately before the date of initial application as an alternative to performing an impairment review. Agencies have adjusted the ROU asset at 1 July 2019 by the amount of any provisions included for onerous leases recognised in the balance sheet at 30 June 2019;
c) where the lease term at initial application ended within 12 months, agencies have accounted for these leases as short-term leases;
d) initial direct costs have been excluded from the measurement of the right-of-use assets; and
e) hindsight has been used to determine if the contracts contained options to extend or terminate the lease.
Agencies have not reassessed whether existing contracts are or contained a lease at 1 July 2019. The requirements of paragraphs 9-11 of AASB 16 are applied to contracts that came into existence after 1 July 2019.
(a) Applicable WATC incremental borrowing rates were used for the purposes of measuring leases that were previously classified as
operating leases.
Measurement of lease liabilities$m
Operating lease commitments disclosed as at 30 June 2019 772Discounted using incremental borrowing rate at date of initial application (a) 245
Finance lease liabilities recognised as at 30 June 2019 368Other lease commitments not previously disclosed 1,504
Short-term leases not recognised as liability -15Low value leases not recognised as liability -1
Lease liability recognised at 1 July 2019 2,100
Measurement of lease liabilities$m
Operating lease commitments disclosed as at 30 June 2019 2,081Discounted using incremental borrowing rate at date of initial application (a) 539
Finance lease liabilities recognised as at 30 June 2019 682Other lease commitments not previously disclosed 1,536
Short-term leases not recognised as liability -19Low value leases not recognised as liability -7Extension options reasonably certain to be exercised 7
Lease liability recognised at 1 July 2019 2,738
General Government
Total Public Sector

2019-20 Annual Report on State F inances
160
NOTE 36: RELATED PARTY DISCLOSURES
General Government
Parent and controlling entity
The general government sector comprises public sector agencies that are wholly-owned and controlled by the Government of Western Australia and which are largely funded by centrally collected revenue such as taxes, royalties and Commonwealth grants. The agencies are engaged mainly in the provision of services outside the normal market mechanism, or that provide for the transfer of income for public policy purposes. Related parties of the general government sector include:
• all Ministers and their close family members, and their controlled or jointly controlled entities;
• all public non-financial and public financial corporations, included in Note 38: Composition of sectors;
• all associates and joint ventures; and
• the Government Employees Superannuation Board (GESB).
Key Management Personnel (KMP)
KMP Compensation
KMP are those people having authority and responsibility for planning, directing and controlling the activities of the State. As the Western Australian Cabinet is the decision making body for the State, all State Cabinet Ministers are considered to be KMP of the State.
Compensation of all Ministers is disclosed later in this note.
Significant transactions with government-related entities
Transactions between general government agencies are eliminated on consolidation and are not included in this disclosure. The transactions below represent those between the general government sector and public corporations.
Significant transactions and balances include:
• taxation revenue:
a) loan guarantee fees ($151 million, 2019: $145 million);
b) payroll tax ($92 million, 2019: $86 million);
c) land tax ($65 million, 2019: $62 million); and
d) betting tax ($41 million, 2019: $40 million).

Appendix 1
161
NOTE 36: RELATED PARTY DISCLOSURES (CONT.)
• current grants and subsidies revenue ($33 million, 2019: $26 million);
• sales of goods and services:
a) services rendered ($47 million, 2019: $34 million);
b) service delivery agreement ($198 million, 2019: $191 million); and
c) other revenue ($48 million, 2019: $48 million);
• dividend revenue ($1,387 million, 2019: $1,494 million);
• Tax Equivalent Regime revenue ($1,134 million, 2019: $672 million);
• current transfers:
a) operating subsidies ($1,841 million, 2019: $1,442 million);
b) Royalties for Regions grants ($279 million, 2019: $25 million); and
c) recurrent transfers ($170 million, 2019: $166 million);
• capital appropriations ($492 million, 2019: $477 million);
• Government Regional Officers’ Housing expenses ($80 million, 2019: $138 million);
• Public Bank Account interest expense ($3 million, 2019: $10 million);
• capital transfers ($43 million, 2019: $45 million);
• insurance premiums ($292 million, 2019: $263 million);
• water and electricity expenses ($238 million, 2019: $236 million);
• lease liabilities ($60 million); and
• borrowings ($26 billion, 2019: $26 billion).
Material transactions with other related parties
General government agencies make superannuation contributions for their staff to GESB. In 2019-20, these payments totalled $1 billion (2019: $1 billion).
The Department of Primary Industries and Regional Development has a number of joint venture arrangements. Further details of these arrangements can be found in the Department’s annual report. There were no other related party transactions (including general citizen-type transactions1) with Ministers or their close family members or their controlled (or jointly controlled) entities that are material for disclosure.
1 General citizen-type transactions are transactions where Ministers/senior officers or their close family members
interact with a public sector entity under the same terms and conditions as a public citizen, such as paying taxes, levies or other statutory fees/charges and using public services such as hospitals, schools or public transport.

2019-20 Annual Report on State F inances
162
NOTE 36: RELATED PARTY DISCLOSURES (CONT.)
Total Publ ic Sector
Parent and controlling entity
The total public sector (or whole-of-government) includes agencies across the general government, public non-financial and financial corporations sectors. These agencies are wholly owned or controlled by the Government of Western Australia and are consolidated to form the total public sector financial statements contained in this report. Details of agencies controlled by the Government and consolidated in the total public sector are shown in Note 38: Composition of sectors.
Related parties of the total public sector include:
• all Ministers and their close family members, and their controlled or jointly controlled entities;
• all associates and joint ventures; and
• GESB.
Significant transactions with government-related entities
Transactions between public sector agencies are eliminated on consolidation and are not included in this disclosure. The significant transactions below represent transactions between public sector agencies and their associates and joint ventures.
Material transactions with other related parties
A number of government agencies procured legal services from a service provider totalling approximately $3.4 million during the financial year. The KMP of the service provider is related to a Minister, who was not the Minister responsible for the agencies. This entity also provided services to the agencies in prior years.
During the financial year, Synergy purchased goods and services from its associate to the value of $162 million (2019: $137 million) and sold goods and services to related parties to the value of $3 million (2019: $189 million).
Government Employees Superannuation Board
Public sector agencies make superannuation contributions for their staff to GESB. In 2019-20, these payments totalled $1.1 billion (2019: $1.1 billion).
There were no other related party transactions (including general citizen-type transactions) with Ministers or their close family members or their controlled (or jointly controlled) entities that are material for disclosure.

Appendix 1
163
NOTE 36: RELATED PARTY DISCLOSURES (CONT.)
KMP Compensation
Total public sector KMP include all Ministers. Total compensation for the State’s KMP for the reporting period is presented in the following bands.
(a) Short-term employee benefits include salaries, electorate allowances, motor vehicle allowances and accommodation allowances paid
to Ministers.
2019-20 2018-19
(number) (number)
Remuneration ($)
350,000-400,000 2 2
400,000-450,000 9 10
450,000-500,000 5 4
500,000-550,000 1 1
2019-20 2018-19
$m $m
Short-term employee benefits(a) 7.0 6.9
Post-employment benefits 0.6 0.6
Total compensation of Ministers 7.6 7.5

2019-20 Annual Report on State F inances
164
NOTE 37: EVENTS OCCURRING AFTER THE REPORTING PERIOD
Bell Recovery Action
On 12 August 2020, various Bell Group companies and their creditors agreed to liquidation settlement scheme arrangements. On 20 August 2020, the Supreme Court of Western Australia made orders approving the settlement. Those orders were lodged with the Australian Securities and Investments Commission on 21 August 2020 at which point the scheme became effective. On 11 September 2020, the Insurance Commission of Western Australia (ICWA) received a settlement amount of $665.4 million.
Whilst ICWA’s exposure under the indemnities cannot be eliminated entirely, discontinuance of the Bell-related litigation following settlement completion is likely to significantly reduce such exposure.
Aboriginal Stolen Wages
The State Solicitor’s Office has received a representative complaint from the Australian Human Rights Commission (AHRC) against the State of Western Australia in relation to wages held in trust for Aboriginal workers over the period from December 1939 to June 1972, but not distributed to them. The complaint precedes a potential legal class action on behalf of claimants, and as such, represents an as yet unquantified liability.
Yamatji Nation Indigenous Land Use Agreement
The State Government has settled Native Title compensation liability with respect to approximately 49,000 hectares of land in the Mid-West region through the Yamatji Nation Indigenous Land Use Agreement. This Agreement was registered by the National Native Title Tribunal on 30 July 2020 and is anticipated to be conclusively registered by late October 2020. Sale of Western Australian TAB
The market process for the sale of the Western Australian TAB has been suspended due to uncertainty associated with the impacts of COVID-19. The status of the sale process will be reassessed in the second half of 2020-21.

Appendix 1
165
NOTE 38: COMPOSITION OF SECTORS
The following diagram shows the financial relationship between sectors within which agencies are classified using the Australian Bureau of Statistics’ GFS manual, which are included in the consolidated financial statements and described in Note 3 to these financial statements.
TOTAL PUBLIC SECTOR
Each agency produces its own annual report. All controlled agencies, regardless of funding source or sector classification, have been included in these consolidated financial statements.
The agencies included within each sector are listed below and are wholly owned or controlled by the Government of Western Australia.
General Government Sector Public Non-Financial Corporations
Consolidated Account
Public Financial Corporations

2019-20 Annual Report on State F inances
166
NOTE 38: COMPOSITION OF SECTORS (CONT.)
General Government
Agricultural Produce Commission Building and Construction Industry Training Board Botanical Gardens and Parks Authority Central Regional TAFE Chemistry Centre (WA) Child and Adolescent Health Service Combat Sports Commission Commissioner for Children and Young People Commissioner for Equal Opportunity Commissioner of Main Roads Corruption and Crime Commission Department of Biodiversity Conservation and Attractions Department of Community Services Department of Education Department of Finance Department of Fire and Emergency Services Department of Health (including public hospitals) Department of Jobs, Tourism, Science and Innovation Department of Justice Department of Local Government, Sport and Cultural
Industries Department of Mines, Industry Regulation and Safety Department of Planning, Lands and Heritage Department of Primary Industries and Regional Development Department of Training and Workforce Development Department of Transport Department of Treasury Department of the Legislative Assembly Department of the Legislative Council Department of the Premier and Cabinet Department of the Registrar, Western Australian Industrial
Relations Commission Department of Water and Environmental Regulation Disability Services Commission East Metropolitan Health Service Economic Regulation Authority Energy Policy WA Gascoyne Development Commission Gaming and Wagering Commission of Western Australia Goldfields Development Commission Governor’s Establishment Great Southern Development Commission Health and Disability Services Complaints Office Health Support Services Heritage Council of Western Australia Infrastructure WA Keep Australia Beautiful Council (W.A.) Kimberley Development Commission Law Reform Commission of Western Australia Legal Aid Commission of Western Australia Legal Costs Committee Local Health Authorities Analytical Committee Mental Health Commission Mid-West Development Commission Minerals Research Institute of Western Australia
North Metropolitan TAFE North Metropolitan Health Service North Regional TAFE Office of the Auditor Genera Office of the Director of Public Prosecutions Office of the Information Commissioner Office of the Inspector of Custodial Services Office of the Parliamentary Inspector of the Corruption and
Crime Commission Parliamentary Commissioner for Administrative Investigations Parliamentary Services Department Peel Development Commission Perth Theatre Trust Pilbara Development Commission Professional Standards Council Public Sector Commission Quadriplegic Centre Board Racing Penalties Appeal Tribunal of Western Australia Rural Business Development Corporation Salaries and Allowances Tribunal School Curriculum and Standards Authority ScreenWest Inc. Small Business Development Corporation South Metropolitan TAFE South Metropolitan Health Service South Regional TAFE South West Development Commission The Aboriginal Affairs Planning Authority The ANZAC Day Trust The Board of the Art Gallery of Western Australia The Burswood Park Board The Coal Miners’ Welfare Board of Western Australia The Library Board of Western Australia The National Trust of Australia (W.A.) The Queen Elizabeth II Medical Centre Trust The Western Australia Museum Trustees of the Public Education Endowment Western Australia Police Force
Western Australian Country Health Service Western Australian Building Management Authority Western Australian Electoral Commission Western Australian Energy Disputes Arbitrator Western Australian Greyhound Racing Association Western Australian Health Promotion Foundation Western Australian Institute of Sport Western Australian Land Information Authority Western Australian Meat Industry Authority Western Australian Planning Commission Western Australian Sports Centre Trust WorkCover Western Australia Authority Wheatbelt Development Commission Zoological Parks Authority

Appendix 1
167
NOTE 38: COMPOSITION OF SECTORS (CONT.)
Public Non-Financial Corporations
Animal Resources Authority Bunbury Water Corporation
Busselton Water Corporation
Electricity Networks Corporation (Western Power) Electricity Generation and Retail Corporation (Synergy)
Forest Products Commission Fremantle Port Authority Gold Corporation and its subsidiaries Housing Authority Kimberly Ports Authority Lotteries Commission Metropolitan Cemeteries Board
Metropolitan Redevelopment Authority Mid West Ports Authority Pilbara Ports Authority Public Transport Authority of Western Australia Racing and Wagering Western Australia Regional Power Corporation (Horizon Power) Rottnest Island Authority Southern Ports Authority Water Corporation Western Australian Coastal Shipping Commission Western Australian Land Authority
Public Financial Corporations
Country Housing Authority Insurance Commission of Western Australia Keystart Housing Scheme, comprising
Keystart Bonds Ltd Keystart Loans Ltd Keystart Support Pty Ltd Keystart Support (Subsidiary) Pty Ltd Keystart Housing Scheme Trust Keystart Support Trust
RiskCover Western Australian Treasury Corporation
Agencies outside the State Public Sector
Some State agencies are not covered by the whole-of-government reporting framework as defined under Australian Accounting Standards and/or the GFS framework. The entities listed below, which administer superannuation and like funds and/or hold private funds in trust or fidelity type funds, are examples of such agencies not included in the definition of the public sector used in the budget. This is because the assets are not available for the benefit of, and/or are not controlled by, the State.
Construction Industry Long Service Leave Payments Board Curtin University and its subsidiaries Edith Cowan University Fire and Emergency Services Superannuation Board Government Employees Superannuation Board
Legal Contribution Trust Murdoch University and its subsidiaries Public Trustee Parliamentary Superannuation Board The University of Western Australia and its subsidiaries
NOTE 39: BUDGETARY INFORMATION - COMPARISON OF FINAL OUTCOMES TO ORIGINAL BUDGET
Explanations of significant variances between actual results for 2019-20 and the original Budget (presented to the Legislative Assembly on 9 May 2019) for the general government sector and the total public sector are included in Appendix 4 of this report. For the purposes of these financial statements, and the associated notes to the financial statements, the discussion in Appendix 4 meets the requirements of paragraphs 59(f) and 61 of AASB 1049: Whole of Government and General Government Financial Reporting.
The Financial Results chapter of this report details variations from the estimated outturn contained in the 2019-20 Mid-year Review, released on 18 December 2019.

2019-20 Annual Report on State F inances
168

169
A P P E N D I X 2
Operating Revenue
The tables in this appendix detail operating revenue of the general government and total public sectors. They provide detailed revenue information consistent with the operating statements presented in Appendix 1: Financial Statements.
The total public sector consolidates internal transfers between the general government sector and agencies in the public corporations sectors.
Accordingly, some total public sector revenue aggregates may be smaller than the general government equivalent. For example, the general government sector collects payroll tax from some public corporations. These internal collections are not shown in the total public sector taxation revenue data which is thus smaller than the general government taxation revenue aggregate.
Users of this report should note that two new accounting standards became effective from 1 January 2019. These are AASB 15: Revenue From Contracts With Customers and AASB 1058: Income of Not-For-Profit Entities. The key changes from these two standards are in the timing of some revenue recognised over time, and the ‘grossing up’ of some revenue and expenses. These changes are broadly neutral for the operating balance over time (although individual years may move up or down in line with the timing of the spending for which revenue is received, such as Commonwealth infrastructure funding paid in advance of project works carried out by the State in future periods).
Under these standards, revenue is to be recognised when (or as) the entity satisfies a performance obligation by transferring a promised good or service (i.e. an asset) to a customer. An asset is transferred when (or as) the customer obtains control of that asset. In practical terms, material consequences of these changes for the State’s whole-of-government financial statements will be to:
• remove revenue and expenses where the State acts only as an agent of a third party in a relationship and exerts no control over the underlying assets (for example, general government operating revenue and expenses will be reduced by equivalent amounts to remove on-passed Commonwealth funding for local governments and non-government schools);

2019-20 Annual Report on State F inances
170
• de-recognise Commonwealth revenue paid in advance in earlier years (such as recent transport and hospital infrastructure funding) and then recognise it in future years in line with spending on the works which may be in a different reporting period to the receipt of the grant; and
• recognise revenue as or when an entitlement to consideration emerges or when a good or service is delivered to a customer (in particular, this grosses up Gold Corporation revenue and expenses in the public non-financial corporations sector in recognition of both non-cash precious metal transactions (mainly gold inventory) as well as cash transactions).
Table 2.1 OPERATING REVENUE
General Government
Note: Columns/rows may not add due to rounding.
2018-19Budget MYR Variation
Actual Estimate Revision Actual on MYR$m $m $m $m $m
(1) (2) (3) (3) - (2)TAXATIONTaxes on employers' payroll and labour force
Payroll tax 3,565 3,750 3,781 3,642 -139
Property taxesLand tax 807 789 773 792 18
Transfer Duty 1,073 1,161 1,152 1,190 38 Foreign Buyers Surcharge - - - 19 19 Landholder Duty 32 100 31 120 89 Total duty on transfers 1,105 1,261 1,183 1,329 146
Metropolitan Region Improvement Tax 89 89 88 88 -1 Perth Parking Levy 59 59 59 56 -3 Emergency Services Levy 374 385 386 387 1 Loan guarantee fees 152 160 158 157 -1 Building and Construction Industry Training Fund Levy 27 36 37 39 2 Total other property taxes 702 730 728 726 -1
Taxes on provision of goods and servicesLotteries Commission 180 164 164 174 10 Video lottery terminals - - - - - Casino Tax 59 71 71 40 -31 Betting tax 25 - - - - Point of Consumption tax 30 78 78 77 -2 Other - - - - - Total taxes on gambling 294 313 313 291 -22
Insurance Duty 645 677 664 694 31 Other 17 19 19 19 - Total taxes on insurance 662 696 683 713 31
On-demand Transport Levy 5 30 30 41 12
Taxes on use of goods and performance of activitiesVehicle Licence Duty 363 373 368 375 7 Permits - Oversize Vehicles and Loads 8 8 8 9 1 Motor Vehicle registrations 995 1,027 1,029 1,045 16 Total motor vehicle taxes 1,367 1,407 1,405 1,429 24
Mining Rehabilitation Levy 31 30 32 33 1
Landfill Levy 79 83 83 80 -3
Total Taxation 8,616 9,088 9,011 9,077 66
2019-20

Appendix 2
171
Table 2.1 (cont.) OPERATING REVENUE
General Government
Note: Columns/rows may not add due to rounding.
2018-19Budget MYR Variation
Actual Estimate Revision Actual on MYR$m $m $m $m $m
(1) (2) (3) (3) - (2)CURRENT GRANTS AND SUBSIDIESGeneral Purpose Grants
GST grants 3,200 3,581 3,559 3,466 -93 Commonwealth-funded 70% floor 434 814 814 814 - North West Shelf grants 886 817 767 629 -138 Commonwealth compensation for changed crude oil
excise arrangements 30 45 31 21 -10
Grants Through the State (a)
Schools assistance – non-government schools 1,323 - - - - Local government financial assistance grants 181 - - - - Local government roads 118 - - - -
National Specific Purpose Payment Agreement GrantsNational Agreement for Skills and Workforce Development 157 159 158 158 - National Disability Agreement 167 173 173 176 3 National Housing and Homelessness Agreement 164 167 166 166 -
National School Reform Agreement - Quality Schools 739 826 826 829 3
National Health Reform Agreement 2,269 2,375 2,342 2,402 61
National Partnerships/Other GrantsHealth 194 128 178 365 187 Housing - - 1 - -1 Transport 54 153 174 88 -86 Disability Services 55 54 82 62 -20 Other 239 316 303 203 -100
Total Current Grants and Subsidies (a) 10,210 9,607 9,573 9,379 -194
CAPITAL GRANTSGrants Through the State (a)
Schools assistance – non-government schools 18 - - - -
National Partnerships/Other GrantsHousing 251 - - - - Transport 593 913 950 621 -329 Other 11 29 30 20 -10
Total Capital Grants (a) 873 943 980 642 -339
2019-20

2019-20 Annual Report on State F inances
172
Table 2.1 (cont.) OPERATING REVENUE
General Government
(a) Reporting aggregates impacted by new accounting standards in 2019-20 (see introduction to the appendix).
Note: Columns/rows may not add due to rounding.
2018-19Budget MYR Variation
Actual Estimate Revision Actual on MYR$m $m $m $m $m
(1) (2) (4) (3) - (2)SALES OF GOOD AND SERVICES (a)
WA Health 784 760 760 748 -11 Department of Transport 221 223 224 226 2 Department of Education 209 188 205 194 -11 State Training Providers/TAFE Colleges 115 122 117 121 4 Department of Training and Workforce Development 32 36 35 29 -6 Western Australian Land Information Authority 99 118 182 183 1 Department of Biodiversity, Conservation and Attractions 109 107 110 99 -10 Department of Justice 140 142 145 153 7 Department of Mines, Industry Regulation and Safety 235 161 157 155 -2 All Other 789 867 862 845 -17
Total Sales of Goods and Services (a) 2,734 2,724 2,796 2,754 -42
INTEREST INCOME 168 160 148 124 -24
REVENUE FORM PUBLIC CORPORATIONSDividends 1,350 1,203 1,334 392 -942 Tax Equivalent Regime 642 641 628 732 103
Total Revenue from Public Corporations 1,991 1,844 1,962 1,123 -839
ROYALTY INCOME 6,713 6,375 7,505 8,450 945
OTHERLease Rentals 107 105 105 115 10 Fines 224 201 200 192 -9 Revenue not elsewhere counted 370 288 272 308 36
Total Other 701 594 577 614 37
GRAND TOTAL 32,006 31,334 32,553 32,162 -390
2019-20

Appendix 2
173
Table 2.2 OPERATING REVENUE
Total Publ ic Sector
Note: Columns/rows may not add due to rounding.
2018-19Budget MYR Variation
Actual Estimate Revision Actual on MYR$m $m $m $m $m
(1) (2) (3) (3) - (2)TAXATIONTaxes on employers' payroll and labour force
Payroll tax 3,479 3,658 3,689 3,550 -139
Property taxesLand tax 744 720 703 727 24
Transfer Duty 1,073 1,161 1,152 1,190 38 Foreign Buyers surcharge - - 19 19 Landholder Duty 32 100 31 120 89 Total duty on transfers 1,105 1,261 1,183 1,329 146
Metropolitan Region Improvement Tax 89 89 88 88 -1 Perth Parking Levy 59 59 59 56 -3 Emergency Services Levy 369 380 380 382 2 Loan guarantee fees 8 7 7 7 - Building and Construction Industry Training Fund Levy 27 36 37 39 2 Total other property taxes 552 571 571 570 -1
Taxes on provision of goods and servicesVideo lottery terminals - - - - - Casino Tax 59 71 71 40 -31 Betting tax - - - - Point of Consumption tax 13 35 35 37 2 Other - - - - Total taxes on gambling 73 106 106 77 -29
Insurance Duty 645 677 664 694 31 Other 17 19 19 19 Total taxes on insurance 662 696 683 713 31
On-demand Transport Levy 5 30 30 41 12
Taxes on use of goods and performance of activitiesVehicle Licence Duty 363 373 368 375 7 Permits - Oversize Vehicles and Loads 8 8 8 9 1 Motor Vehicle registrations 995 1,027 1,029 1,045 16
Total motor vehicle taxes 1,367 1,407 1,405 1,429 24
Mining Rehabilitation Levy 31 30 32 33 1
Landfill Levy 79 83 83 80 -3
Total Taxation 8,097 8,561 8,485 8,550 66
2019-20

2019-20 Annual Report on State F inances
174
Table 2.2 (cont.) OPERATING REVENUE
Total Publ ic Sector
(a) Reporting aggregates impacted by new accounting standards in 2019-20 (see introduction to the appendix).
Note: Columns/rows may not add due to rounding.
2018-19Budget MYR Variation
Actual Estimate Revision Actual on MYR$m $m $m $m $m
(1) (2) (3) (3) - (2)CURRENT GRANTS AND SUBSIDIESGeneral Purpose Grants
GST grants 3,200 3,581 3,559 3,466 -93 Commonw ealth-funded 70% floor 434 814 814 814 - North West Shelf grants 886 817 767 629 -138 Commonw ealth compensation for changed crude oil
excise arrangements 30 45 31 21 -10
Grants Through the State (a)
Schools assistance – non-government schools 1,323 - - - - Local government f inancial assistance grants 181 - - - - Local government roads 118 - - - -
National Specific Purpose Payment Agreement GrantsNational Agreement for Skills and Workforce Development 157 159 158 158 - National Disability Agreement 167 173 173 176 3 National Housing and Homelessness Agreement 164 167 166 166 -
National School Reform Agreement - Quality Schools 739 826 826 829 3
National Health Reform Agreement 2,269 2,375 2,342 2,402 61
National Partnerships/Other GrantsHealth 194 128 178 365 187 Housing - - 1 - -1 Transport 54 153 174 88 -86 Disability Services 55 54 82 62 -20 Other 239 316 303 203 -100
Total Current Grants and Subsidies (a) 10,210 9,607 9,573 9,379 -194
CAPITAL GRANTSGrants Through the State (a)
Schools assistance – non-government schools 18 - - - -
National Partnerships/Other GrantsHousing 251 - - - - Transport 593 913 950 621 -329 Other 11 29 30 20 -10
Total Capital Grants 873 943 980 642 -339
SALES OF GOOD AND SERVICES (a) 23,488 35,028 37,887 37,054 -833
INTEREST INCOME 639 685 674 555 -119
ROYALTY INCOME 6,713 6,375 7,505 8,450 945
OTHERLease Rentals 107 105 105 115 10 Fines 224 201 200 195 -5 Revenue not elsew here counted 862 793 727 767 40
Total Other 1,193 1,099 1,032 1,077 45
GRAND TOTAL 51,214 62,297 66,136 65,706 -430
2019-20

175
A P P E N D I X 3
Spending by Classification of the Function of Government
Under an intergovernmental agreement between the States, Territories and the Commonwealth in the early 1990s, all jurisdictions release whole-of-government and other public sector financial information in a consistent format. This Uniform Presentation Framework (UPF) supports transparency and interjurisdictional comparisons.
Western Australia’s whole-of-government financial disclosures, found in its annual Budget Papers, Mid-year Review, Pre-election Financial Projections Statements and quarterly and annual outturn reporting, including this Annual Report on State Finances (ARSF), are consistent with the UPF disclosure requirements.
In particular, UPF information in this ARSF includes:
• financial statements by sector of government and for the consolidated total public sector (see Appendix 1: Financial Statements);
• information on grants and transfer payments which are available in the notes to the financial statements (see Notes to the Financial Statements, Appendix 1);
• detailed operating revenue information (disclosed in Appendix 2: Operating Revenue); and
• detailed general government expenses and purchases of non-financial assets by function (detailed in this appendix).

2019-20 Annual Report on State F inances
176
Table 3.1
CLASSIFICATION OF THE FUNCTIONS OF GOVERNMENT General Government
Note: Columns/rows may not add due to rounding.
2018-19
ActualBudget
EstimateMYR
Revision ActualVariation on
MYR$m $m $m $m $m
(1) (2) (3) (3) - (2)EXPENSESGeneral public services 1,510 1,953 1,853 1,334 -519
Executive and legislative organs, f inancial and f iscal affairs, external affairs 215 327
General services 23 27Public debt transactions 1,083 968Transfers of a general character betw een different
levels of government 181 -General public services n.e.c. 9 13
Public order and safety 3,585 3,534 3,542 3,826 284Police services 1,251 1,312Civil and f ire protection services 435 492Law courts 989 969Prisons 855 993Research and development — public order and safety 27 29Public order and safety n.e.c. 27 31
Economic Affairs 1,104 1,336 1,226 1,651 425General economic, commercial and labour affairs 317 315
General economic and commercial affairs 226 219General labour affairs 90 96
Agriculture, forestry, f ishing and hunting 159 179Agriculture 83 94Forestry 20 18Fishing and hunting 57 67
147 636Electricity 125 610Fuel and energy n.e.c. 22 26
Mining, manufacturing and construction 273 297Mining of mineral resources and other than mineral fuels 246 269Construction 27 28
Other industries 115 119Distributive trades, storage and w arehousing 5 5Hotel and restaurants 11 11Tourism 99 104
Research and development — agriculture, forestry, f ishingand hunting 67 63
Research and development — mining, manufacturing and construction 27 42
Environmental protection 387 397 400 395 -5Pollution abatement 2 2Protection of biodiversity and landscape 306 300Environmental protection n.e.c. 79 94
Housing and community amenities 1,441 1,204 1,252 1,223 -28Housing development 53 44Community development 880 661
Indigenous community development 345 87Community development n.e.c. 535 573
Water supply 508 519
Fuel and energy
2019-20
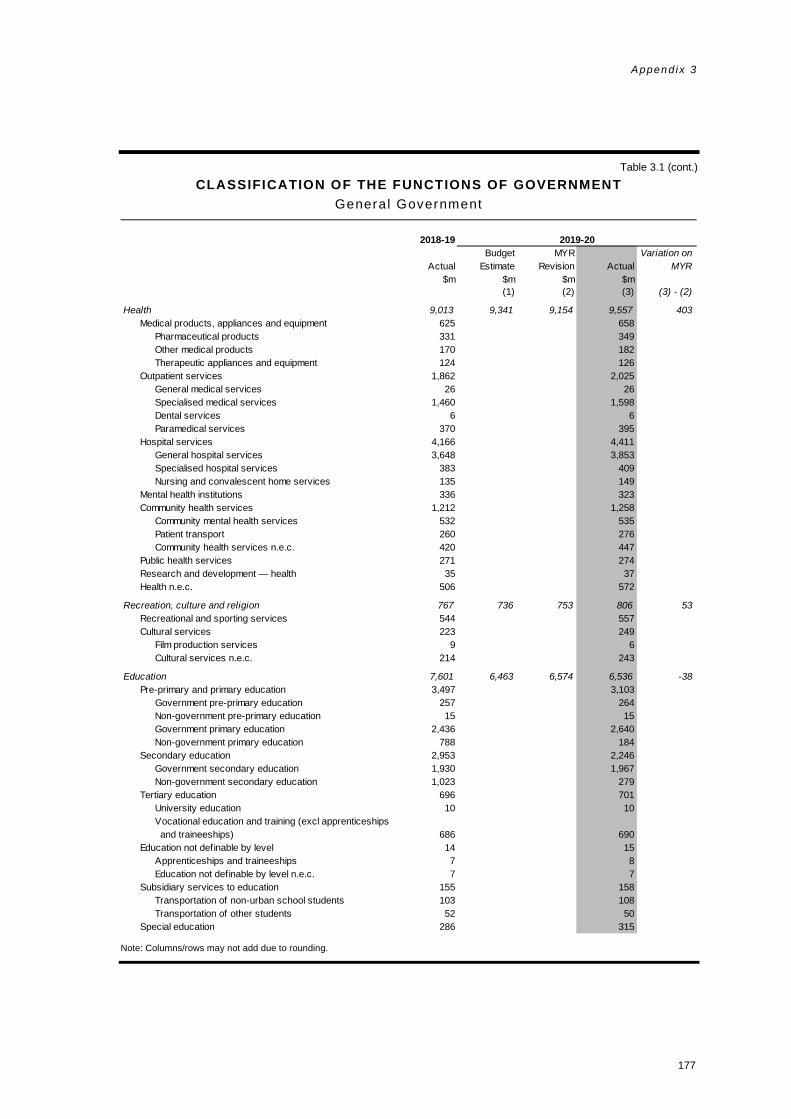
Appendix 3
177
Table 3.1 (cont.)
CLASSIFICATION OF THE FUNCTIONS OF GOVERNMENT General Government
Note: Columns/rows may not add due to rounding.
2018-19
ActualBudget
EstimateMYR
Revision ActualVariation on
MYR$m $m $m $m
(1) (2) (3) (3) - (2)
Health 9,013 9,341 9,154 9,557 403Medical products, appliances and equipment 625 658
Pharmaceutical products 331 349Other medical products 170 182Therapeutic appliances and equipment 124 126
Outpatient services 1,862 2,025General medical services 26 26Specialised medical services 1,460 1,598Dental services 6 6Paramedical services 370 395
Hospital services 4,166 4,411General hospital services 3,648 3,853Specialised hospital services 383 409Nursing and convalescent home services 135 149
Mental health institutions 336 323Community health services 1,212 1,258
Community mental health services 532 535Patient transport 260 276Community health services n.e.c. 420 447
Public health services 271 274Research and development — health 35 37Health n.e.c. 506 572
Recreation, culture and religion 767 736 753 806 53Recreational and sporting services 544 557Cultural services 223 249
Film production services 9 6Cultural services n.e.c. 214 243
Education 7,601 6,463 6,574 6,536 -38Pre-primary and primary education 3,497 3,103
Government pre-primary education 257 264Non-government pre-primary education 15 15Government primary education 2,436 2,640Non-government primary education 788 184
Secondary education 2,953 2,246Government secondary education 1,930 1,967Non-government secondary education 1,023 279
Tertiary education 696 701University education 10 10Vocational education and training (excl apprenticeships and traineeships) 686 690
Education not definable by level 14 15Apprenticeships and traineeships 7 8Education not definable by level n.e.c. 7 7
Subsidiary services to education 155 158Transportation of non-urban school students 103 108Transportation of other students 52 50
Special education 286 315
2019-20

2019-20 Annual Report on State F inances
178
Table 3.1 (cont.)
CLASSIFICATION OF THE FUNCTIONS OF GOVERNMENT General Government
(a) Budget provisions. Note: Columns/rows may not add due to rounding.
2018-19
ActualBudget
EstimateMYR
Revision ActualVariation on
MYR$m $m $m $m
(1) (2) (3) (3) - (2)
Social protection 2,855 2,747 3,047 2,674 -372Sickness and disability 1,269 1,232Old age 472 232Family and children 695 748Housing 312 325Social exclusion n.e.c. 54 56Research and development — social protection 3 3Social protection n.e.c. 50 79
Natural disaster relief 4 1Social protection n.e.c. 46 78
Transport 2,425 2,690 2,764 2,490 -274Road transport 1,673 1,645
Road maintenance 900 781Road rehabilitation 77 89Road construction 341 266Road transport n.e.c. 355 510
Bus transport 386 416Urban bus transport 351 381Non-urban bus transport 35 36
Water transport 61 85Urban w ater transport passenger services 1 1Non-urban w ater transport services 60 85
Railw ay transport 296 338Urban railw ay transport services 271 310Non-urban railw ay transport freight services 8 10Non-urban railw ay transport passenger services 17 18
Air transport 10 5
Other (a) - -300 -300 - 300
TOTAL EXPENSES 30,689 29,801 29,964 30,493 529
PURCHASES OF NON-FINANCIAL ASSETSGeneral public services 113 146 173 137 -36Public order and safety 165 246 270 203 -67Economic affairs 19 57 35 18 -17Environmental protection 38 48 54 41 -13Housing and community amenities 89 102 111 125 13Health 199 342 303 152 -151Recreation, culture and religion 152 115 148 131 -17Education 443 481 530 450 -80Social protection 13 8 20 5 -16Transport 1,308 1,308 1,334 1,292 -42Other (a) - -350 -415 - 415
TOTAL PURCHASE OF NON-FINANCIAL ASSETS 2,540 2,505 2,563 2,553 -10
2019-20

179
A P P E N D I X 4
Comparison of Final Outcomes to Original Budget for the Year Ending 30 June 2020
This appendix contains explanations for material variations in general government and total public sector financial aggregates compared to the original 2019-20 Budget presented to the Legislative Assembly on 9 May 2019, in line with the requirements of AASB 1055: Budgetary Reporting1.
For the general government operating statement, explanations are provided in this appendix for the three largest revenue sources (taxation, Commonwealth grants and royalties) and the three largest categories of expense (salaries, transfers and ‘other gross operating expenses’). Explanations are also provided for other revenue and expense items where the variance since the 2019-20 Budget is greater than or equal to $10 million and 10%, and for key line items that appear on the face of the operating statement.
High-level explanations are also provided for the other financial statements (the general government balance sheet and cash flow statement, and the three financial statements for the total public sector).
Detailed explanations of key variations to the estimates for 2019-20 can also be reviewed in:
• the 2019-20 Government Mid-year Financial Projections Statement (or Mid-year Review, released in December 2019), describing changes since the original Budget during the first half of 2019-20; and
• Chapter 1 of this report (detailing final outcomes since the 2019-20 Mid-year Review estimates were finalised).
• The Mid-year Review can be accessed online at www.wa.gov.au/organisation/department-of-treasury.
1 Paragraph 6(f) of this standard indicates that major variances between the original Budget estimates and outcomes
need to be explained in the financial statements. Paragraph 9 indicates that the original Budget is the first Budget presented to Parliament in respect of the reporting period.

2019-20 Annual Report on State F inances
180
Table 4.1 GENERAL GOVERNMENT
Operat ing Statement
Budget Variation VariationNotes Estimate Actual on Budget on Budget
$m $m $m %RESULTS FROM TRANSACTIONS
REVENUETaxation a 9,088 9,077 -11 -0.1 Current grants and subsidies b 9,607 9,379 -228 -2.4 Capital grants b 943 642 -301 -31.9 Sales of goods and services 2,724 2,754 29 1.1 Interest Income c 160 124 -36 -22.5 Revenue from public corporations
Dividends from other sectors d 1,203 392 -811 -67.4 Tax equivalent income d 641 732 91 14.1
Royalty income e 6,375 8,450 2,075 32.6 Other 594 614 20 3.3 Total 31,334 32,162 828 2.6
EXPENSESSalaries f 12,520 12,887 368 2.9 Superannuation
Concurrent costs 1,228 1,276 48 3.9 Superannuation interest cost g 138 89 -48 -35.1
Other employee costs h 234 401 167 71.4 Depreciation and amortisation 1,865 1,751 -114 -6.1 Services and contracts 2,751 2,590 -161 -5.9 Other gross operating expenses i 5,704 5,391 -313 -5.5 Interest
Interest on leases j 194 142 -53 -27.2 Other interest j 811 737 -74 -9.1
Current transfers k 4,123 5,003 880 21.3 Capital transfers k 235 228 -8 -3.2 Total 29,801 30,493 692 2.3
NET OPERATING BALANCE l 1,533 1,669 136 8.9 Other economic flows - included in the operating resultNet gains on assets/liabilities -60 -27 33 -55.1 Provision for doubtful debts -14 -126 -113 826.1 Changes in accounting policy/adjustment of prior periods - -44 -44 - Total other economic flows m -74 -197 -123 167.9 OPERATING RESULT 1,459 1,472 13 0.9
All other movements in equityItems that will not be reclassified to operating resultRevaluations 861 392 -469 -54.5 Net actuarial gains - superannuation -261 5 266 -102.0 Gains recognised directly in equity -60 -1 59 -97.6 Change in net w orth of the public corporations sectors -120 217 336 -281.2 All other - -239 -239 - Total all other movements in equity n 420 373 -47 -11.2
TOTAL CHANGE IN NET WORTH o 1,879 1,845 -34 -1.8
KEY FISCAL AGGREGATES
NET OPERATING BALANCE 1,533 1,669 136 8.9
Less Net acquisition of non-financial assetsPurchase of non-financial assets 2,505 2,553 49 1.9 Changes in inventories - 38 38 - Other movement in non-financial assets - -15 -15 - less:Sales of non-financial assets 137 1,476 1,339 976.7 Depreciation 1,865 1,751 -114 -6.1 Total net acquisition of non-financial assets 502 -651 -1,153 -229.6
NET LENDING/-BORROWING p 1,030 2,320 1,290 125.2
2019-20
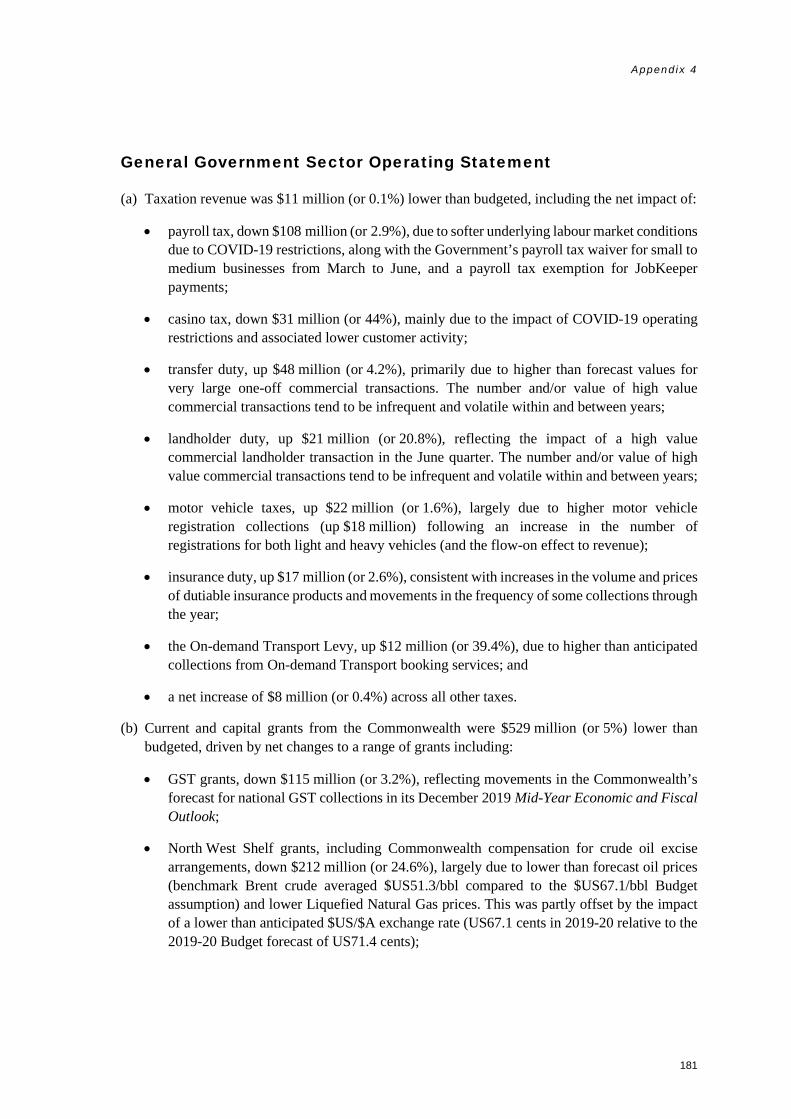
Appendix 4
181
General Government Sector Operating Statement
(a) Taxation revenue was $11 million (or 0.1%) lower than budgeted, including the net impact of:
• payroll tax, down $108 million (or 2.9%), due to softer underlying labour market conditions due to COVID-19 restrictions, along with the Government’s payroll tax waiver for small to medium businesses from March to June, and a payroll tax exemption for JobKeeper payments;
• casino tax, down $31 million (or 44%), mainly due to the impact of COVID-19 operating restrictions and associated lower customer activity;
• transfer duty, up $48 million (or 4.2%), primarily due to higher than forecast values for very large one-off commercial transactions. The number and/or value of high value commercial transactions tend to be infrequent and volatile within and between years;
• landholder duty, up $21 million (or 20.8%), reflecting the impact of a high value commercial landholder transaction in the June quarter. The number and/or value of high value commercial transactions tend to be infrequent and volatile within and between years;
• motor vehicle taxes, up $22 million (or 1.6%), largely due to higher motor vehicle registration collections (up $18 million) following an increase in the number of registrations for both light and heavy vehicles (and the flow-on effect to revenue);
• insurance duty, up $17 million (or 2.6%), consistent with increases in the volume and prices of dutiable insurance products and movements in the frequency of some collections through the year;
• the On-demand Transport Levy, up $12 million (or 39.4%), due to higher than anticipated collections from On-demand Transport booking services; and
• a net increase of $8 million (or 0.4%) across all other taxes.
(b) Current and capital grants from the Commonwealth were $529 million (or 5%) lower than budgeted, driven by net changes to a range of grants including:
• GST grants, down $115 million (or 3.2%), reflecting movements in the Commonwealth’s forecast for national GST collections in its December 2019 Mid-Year Economic and Fiscal Outlook;
• North West Shelf grants, including Commonwealth compensation for crude oil excise arrangements, down $212 million (or 24.6%), largely due to lower than forecast oil prices (benchmark Brent crude averaged $US51.3/bbl compared to the $US67.1/bbl Budget assumption) and lower Liquefied Natural Gas prices. This was partly offset by the impact of a lower than anticipated $US/$A exchange rate (US67.1 cents in 2019-20 relative to the 2019-20 Budget forecast of US71.4 cents);
2019-20 Annual Report on State F inances
182
• transport-related grants, down $357 million (or 33.5%), largely due to the retiming from 2019-20 to later years of road and METRONET project funding, including for Armadale Road Bridge – North Lake Road Flyover, Roe Highway – Kalamunda Road, and Great Northern Highway – Muchea to Wubin. The 2019-20 Budget also included adjustment for revised timing of infrastructure grants paid in earlier reporting periods in line with the expected impact of Australian Accounting Standard AASB 15: Revenue from Contracts With Customers ($231 million), which was not ultimately required following clarification of the application of the new Standard;
• health-related grants, up $264 million (or 10.6%), primarily reflecting the post-budget signing of a new agreements with the Commonwealth to ensure a rapid health response to the COVID-19 pandemic, and to improve access to aged care services, along with an increase in Commonwealth funding paid to Health Service Providers; and
• a net decrease of $109 million (or 6.3%) across all other Commonwealth grants, mainly reflecting changes in timing (to later years) for a number of National Partnership grants.
(c) Interest income was $36 million (or 22.5%) lower than budgeted. This largely reflects lower than expected average interest rates applying to Public Bank Account (PBA) investment balances (at an average 1.1% compared with an estimated average of 2.1% at budget-time).
(d) Revenue from public corporations, comprising dividends and tax equivalent regime (TER) collections were $720 million (or 39.1%) lower than budgeted, with dividends down $811 million (or 67.4%) and TERs up $91 million (or 14.1%).
• For dividends, the large decrease reflects the Government’s decision to defer 2019-20 interim dividends to 2020-21 (reducing pressure for new borrowings as the COVID-19 pandemic began to impact financial markets in March/April 2020). Material reductions were recorded for the Water Corporation (down $616 million), Western Power (down $197 million), Pilbara Ports Authority (down $66 million), Southern Ports Authority (down $26 million) and Fremantle Port Authority (down $24 million). These lower than forecast outcomes were partly offset by a higher dividend from the Insurance Commission of Western Australia (up $134 million), largely reflecting higher than expected investment returns in 2018-19 which resulted in the final 2018-19 dividend payment in December 2019 being significantly above budget.
• For TERs, higher revenue from the Insurance Commission of Western Australia (up $77 million) was the largest individual movement, largely reflecting higher than expected investment returns in 2018-19, resulting in a higher than estimated final tax payment in December 2019.
(e) Royalty income was $2,075 million (or 32.6%) higher relative to the 2019-20 Budget forecast. This was primarily due to higher projected iron ore royalties, which were $2,199 million (or 40.5%) higher than budget, largely reflecting the combination of:
• higher iron ore prices, which averaged $US92.9 per tonne through the year, 26.4% above the 2019-20 Budget price assumption of $US73.5 per tonne (see Financial Results and the Mid-year Review for further detail on this significant movement); and

Appendix 4
183
• a lower than expected average $US/$A exchange rate of US67.1 cents relative to the 2019-20 Budget forecast of US71.4 cents.
Material variances in other royalty collections were also recorded for gold (up $45 million), lithium (down $98 million), copper (down $22 million), and alumina (down $15 million).
(f) Salaries expenses were $368 million (or 2.9%) higher than budgeted. The largest increases were for:
• WA Health ($97 million), mainly due to an increase in accrued leave entitlements driven by the sector’s response to the pandemic;
• Department of Justice (up $68 million), primarily due to additional overtime and full-time equivalents (FTEs) to meet demand in the prison system;
• Communities (up $61 million), primarily due to resourcing required to meet increased demand, including for frontline child protection services and Communities’ welfare incident response to the COVID-19 pandemic, along with increases in accrued leave entitlements;
• Education (up $55 million), mainly due to schools allocating more of their one-line budgets to staffing (which was previously budgeted against other gross operating expenses), and additional staffing costs resulting from the implementation of enhanced cleaning regimes across the Department’s sites (including schools) in response to the COVID-19 pandemic; and
• Western Australia Police Force (up $45 million), mainly due to higher levels of temporary employees, overtime and related expenditure as part of the COVID-19 response, additional overtime expenditure for a summer crime campaign (Operation Heat Shield), and higher than anticipated accrued leave expenses, including higher accrued leave hours resulting from the COVID-19 pandemic.

2019-20 Annual Report on State F inances
184
(g) Superannuation interest costs were $48 million (or 35.1%) lower than budgeted, reflecting the impact on the whole-of-government superannuation liability of a lower than expected discount rate used by the actuary to value unfunded superannuation entitlements (down from the Budget estimate of 1.95% to 0.9%, reflecting movements in bond markets). The lower discount rate results in a significant increase in the value of superannuation liabilities at 30 June 2020, but also reduces the carrying cost (or notional interest charge) for the liability, which is recorded in this line item.
(h) Other employee costs were $167 million (or 71.4%) higher than budgeted, with this outcome incorporating the reclassification of $63 million of these costs by WA Health from ‘other gross operating expenses’ into this category of expenses. Education reported a $69 million higher than budgeted spend for these costs related to reclassification of Government Regional Officers’ Housing (GROH) lease costs under AASB 16: Leases while workers’ compensation benefits for Justice were $11 million higher than budgeted due largely to higher FTE levels.
(i) ‘Other gross operating expenses’ (largely made up of the day-to-day non-salaries operating costs of agencies, such as office accommodation costs, building and maintenance costs, electricity and water costs, and administration costs, along with services purchased from non-government organisations) were $313 million (or 5.5%) lower than budgeted. This was largely due to the following net movements:
• lower (net) spending in this category by the Department of Communities (Disability Services, down $690 million), largely due to the reclassification (to transfer expenses) of $611 million related to State-funded NDIS spending;
• higher than budgeted spending by WA Health (up a net $94 million), including for electricity and water, equipment repairs and maintenance expenditure, direct and indirect patient support costs, including drug supplies, medical and surgical instruments, and prostheses costs, offset by the reclassification of RiskCover insurance premiums to ‘other employee costs’ (noted above), and on services purchased from the non-government sector;
• higher than budgeted spending by the Department of Finance (up $75 million), reflecting higher than expected variable costs (such as energy and cleaning costs) as part of implementing AASB 16, which were originally classified as services and contracts expense;
• higher than budgeted spending by the Department of Transport (up $47 million), largely reflecting settlement of a claim against the State;
• the inclusion in the original budget of an $89 million Royalties for Regions recurrent underspend provision in anticipation of lower spending that would emerge across the general government sector by 30 June 2020; and
• a $72 million (or 3.5%) increase across the remainder of the general government sector.

Appendix 4
185
(j) Interest expenses were $127 million (or 12.6%) lower than budget, with both interest on leases and on borrowing costs lower than anticipated, down by $53 million and $74 million respectively.
• For interest on leases, the lower than anticipated result reflects lower outcomes for the Department of Finance (down $22 million) and WA Health (down $18 million) as part of the implementation of AASB 16.
• For other interest costs (i.e. interest paid on debt), largely due to lower than expected new borrowings by the Consolidated Account in 2019-20 ($777 million compared with a forecast $2 billion at the time of the original Budget), and lower than expected average interest rates (with an average 2.8% rate applying in 2019-20 compared with the Budget assumption of 3%).
(k) Transfer expenses (mainly current and capital grant payments) were $872 million (or 20%) higher than budgeted, with higher current transfers (up $880 million) marginally offset by lower capital transfers (down $8 million)2. Material changes impacting 2019-20 outcomes include:
• grants paid by the Department of Communities (Disability Services) to the NDIS (up $611 million), reflecting the reclassification noted earlier;
• higher operating subsidies to the State’s public corporations (up $459 million), predominantly for Synergy and Horizon (up $451 million and $18 million respectively), mainly reflecting the cost of COVID-19 stimulus measures and funding for a range of non-recoverable revenue shortfalls;
• higher than budgeted grants by the Department of Communities (up $26 million), primarily due to increased demand for frontline child protection services and the Department’s welfare incident response to the COVID-19 pandemic;
• higher than anticipated grants by the Department of Local Government, Sport and Cultural Industries (up $24 million), largely reflecting the impact of a reclassification of costs associated with the public library collection (up $43 million), partially offset by lower than expected payments (down $19 million) due to COVID-19 impacts and timing issues;
• lower than budgeted grant expenses by the Department of Justice (down a net $56 million), with $72 million of forecast National Redress Scheme grants for survivors of institutional child sexual abuse reflowed to later years reflecting the timing of actual applications, partly offset by higher spending on a range of court-related grants (up $16 million), largely for payments under the Criminal Injuries Compensation Act 2003;
2 Grant programs are typically volatile due to changes in timing of grants on-passed on behalf of the Commonwealth,
milestones in grant agreements, funding parameters, and other issues.
2019-20 Annual Report on State F inances
186
• lower than anticipated grants by Main Roads (down a net $35 million), with lower than expected grants to the local government sector under the Disaster Recovery Funding Arrangements Western Australia (down $58 million), partly offset by higher road assets transferred to local governments (up $14 million) and higher grants to the Public Transport Authority reflecting payments for road works related to the Bayswater Station (up $9 million);
• lower than budgeted grants by WA Health (down $34 million), largely reflecting classification and timing issues;
• lower than budgeted grants paid by the Department of Primary Industries and Regional Development to the local government sector (down $33 million), primarily due to spending deferred into 2020-21 and across the forward estimates for various Royalties for Regions projects such as the Regional Telecommunications Project, State Agricultural Telecommunication Infrastructure Fund, Regional Development Leverage Unit and the Regional Aged Accommodation Program (following delays for matters such as proponents submitting project proposals, travel restrictions during the pandemic and grant recipients being unable to meet milestones and financial obligations due to COVID-19);
• lower Royalties for Regions grants to DevelopmentWA3 (a public corporation, down $30 million), mainly reflecting delays in various regional projects including Transforming Bunbury’s Waterfront, Transform Peel and Moonamang Road; and
• the inclusion in the original budget of a $60 million provision for costs associated with resolution of Native Title in the South West of Western Australia, with these costs now expected to be incurred after conclusive registration of the South West Native Title Settlement Indigenous Land Use Agreements (ILUAs);
(l) The net operating balance in 2019-20 was in a $1.7 billion surplus position at 30 June 2020, a $136 million increase from the Budget projection. Revenue was $828 million (or 2.6%) higher than budgeted while expenses were $692 million (or 2.3%) higher than forecast, as detailed above.
(m) ‘Other economic flows’4 resulted in an aggregate decrease in net worth of $197 million, a $123 million variance from that expected at the time of the Budget. The revised outcome is primarily driven by changes in accounting policies/adjustment of prior periods5, revisions to valuation increments across the range of other general government sector assets/liabilities, and provisions for doubtful debts.
3 From September 2019, the Metropolitan Redevelopment Authority and the Western Australian Land Authority were
restructured under the trading name DevelopmentWA. 4 Changes in the value of assets or liabilities that do not result from transactions are referred to as ‘other economic
flows’. They include net gains on assets/liabilities, changes in accounting policy/adjustment of prior periods (which are not forecast in the Budget) and provisions for doubtful debts.
5 Movements in the value of the public sector balance sheet that result from a revaluation or restatement of assets and liabilities are included in equity as reserves. These reserves are used to account for any unrealised gains or losses that would otherwise be recognised in the operating statement.
Appendix 4
187
(n) All other movements in equity equated to an aggregate increase in net worth of $373 million, a $47 million decrease on 2019-20 Budget expectations. This item accounts for all changes in the net worth of the public sector balance sheet that are not accounted for on the general government sector operating statement, including the operations and valuation changes of public corporations, valuation changes across the sector’s other assets and liabilities (including superannuation), and the impact of investing and financing activities. These other sources of variance are discussed throughout the following sections of this appendix.
(o) Net worth at 30 June 2020 increased by $1.8 billion on the final outcome for 30 June 2019, broadly unchanged from the $1.9 billion increase forecast in the original Budget. The higher rise in net worth is comprised of the changes in the net operating balance, ‘other economic flows’ and ‘all other movements in equity’ variances, noted above. The $1.8 billion rise in net worth over 2019-20 is the first such increase since 2014-15.
(p) A $2.3 billion surplus outcome for net lending/borrowing (which includes the net operating balance from transactions, less non-cash depreciation costs plus the net cost of infrastructure investment activities) compares with the original $1 billion surplus forecast at the time of the 2019-20 Budget.
Changes in general government sector purchases and sales of non-financial assets relative to Budget are discussed later in this appendix (as part of the cash flow statement).
Inventory levels were budgeted to remain unchanged in 2019-20 Budget forecasts but increased by $38 million over the year mainly due to the stockpiling of personal protective equipment by WA Health in response to COVID-19. Depreciation costs were $114 million lower than budgeted (mostly reflecting lower than anticipated expenses for the Department of Education, WA Health, and the Western Australia Police Force, and related to final asset valuations for 2019-20 and for the impact of implementation of AASB 16: Leases).
Other movements in non-financial assets were $15 million lower than Budget, largely reflecting movements in net assets transferred in and out of the sector.

2019-20 Annual Report on State F inances
188
Table 4.2 GENERAL GOVERNMENT
Balance Sheet ( a )
Budget Variation VariationNotes Estimate Actual on Budget on Budget
$m $m $m %ASSETSFinancial assetsCash and deposits 1,178 513 -665 -56.5 Advances paid 775 715 -60 -7.8 Investments, loans and placements 2,924 5,924 3,000 102.6 Receivables 3,127 3,938 811 25.9 Shares and other equity
Investments in other public sector entities - equity method 42,148 40,962 -1,186 -2.8 Investments in other public sector entities - direct injections 10,876 10,602 -274 -2.5 Investments in other entities 15 22 7 48.7
Other f inancial assets 8 8 - -2.7 Total financial assets a 61,052 62,684 1,632 2.7
Non-financial assetsLand 36,155 35,238 -916 -2.5 Property, plant and equipment 47,199 46,363 -836 -1.8 Right-of-use assets 3,865 2,484 -1,381 -35.7 Biological assets 3 109 106 3,414.2 Inventories
Land inventories - - - - Other inventories 69 108 39 56.2
Intangibles 582 603 21 3.6 Assets classif ied as held for sale 34 21 -13 -37.5 Investment property 7 7 - -4.6 Other 378 229 -148 -39.3 Total non-financial assets b 88,291 85,162 -3,129 -3.5
TOTAL ASSETS c 149,343 147,847 -1,497 -1.0
LIABILITIESDeposits held 847 1,472 625 73.9 Advances received 377 326 -50 -13.4 Borrow ings
Lease liabilities 3,809 2,722 -1,087 -28.5 Other borrow ings 27,549 26,389 -1,160 -4.2
Superannuation 6,817 6,818 1 - Other employee benefits 3,103 3,543 440 14.2 Payables 1,301 1,463 162 12.4 Other liabilities 1,562 2,674 1,112 71.2 TOTAL LIABILITIES d 45,365 45,408 44 0.1
NET ASSETS 103,978 102,438 -1,540 -1.5 Of which:Contributed equity - - - - Accumulated surplus 6,528 7,587 1,059 16.2 Other reserves 97,450 94,851 -2,599 -2.7 NET WORTH e 103,978 102,438 -1,540 -1.5 MEMORANDUM ITEMS
Net financial worth 15,687 17,276 1,589 10.1 Net financial liabilities 37,352 34,288 -3,064 -8.2
Net debtGross debt liabilities 32,582 30,910 -1,672 -5.1 less: liquid f inancial assets 4,877 7,152 2,275 46.6 less: convergence differences impacting net debt - - - - Net debt f 27,705 23,758 -3,947 -14.2
2019-20

Appendix 4
189
General Government Sector Balance Sheet
(a) General government sector financial assets totalled $62.7 billion at 30 June 2020, up $1.6 billion (or 2.7%) from the original Budget. This reflected higher than budgeted holdings of liquid financial assets which were up $2.3 billion (or 46.6%), mainly due to higher PBA investment holdings6, and a higher than expected outturn for receivables7 (up $811 million), mainly due to the timing of transactions. These increases were partly offset by a $1.5 billion (or 2.8%) decrease in the value of investments in other public sector entities (i.e. public corporations), mainly reflecting lower valuation effects in the public non-financial corporations sector (largely due to the lower than expected outcome for the year ending 30 June 2019 discussed in the 2018-19 ARSF).
(b) Non-financial assets (such as land and infrastructure holdings) totalled $85.2 billion at 30 June 2020, down $3.1 billion (or 3.5%) from Budget. This primarily reflects lower than forecast right-of-use assets reported under AASB 16: Leases implemented during 2019-20 (down $1.4 billion), along with lower than anticipated property, plant and equipment (down $836 million) and lower valuation of the sector’s land holdings (down $916 million), both due mainly to last year’s outcome reported in the 2018-19 ARSF.
(c) Total assets were $147.8 billion at 30 June 2020, down $1.5 billion (or 1%) compared to the original Budget, reflecting the movements outlined above.
(d) Total liabilities were $45.4 billion at 30 June 2020, broadly unchanged from the original Budget. Key movements included:
• debt liabilities (down $1.7 billion), which include deposits held, advances from the Commonwealth and borrowings (both lease liabilities and other borrowings). Lease liabilities were $1.1 billion lower than anticipated, largely due to changes in treatment of GROH leases following implementation of AASB 16 in 2019-20, while other borrowings were $1.2 billion lower reflecting a smaller borrowing program for the Consolidated Account. These lower outcomes were partly offset by higher cash deposits held by the PBA on behalf of public non-financial corporations; and
• non-debt liabilities (up $1.7 billion), with higher than budget outcomes for employee benefits such as accruing leave entitlements (up $440 million), payables8 (up $162 million, which are subject to the timing of cash payments by the sector), and ‘other’ liabilities (up $1.1 billion) which is dominated by a deferred revenue liability following the transaction to partially commercialise Landgate (which was completed in October 2019).
6 The PBA is the central bank account of the Western Australian public sector. Divisions of the PBA include
the Consolidated Account, agency and Treasurer’s Special Purpose Accounts and other centrally managed bank accounts. The PBA is administered by the Treasury with funds management provided by the Western Australian Treasury Corporation. Key components of the PBA are discussed further in Appendix 7: Public Ledger.
7 Accounts for goods and services that have been invoiced but for which cash is still to be received. 8 Payables include short and long-term trade creditors, and accounts payable.

2019-20 Annual Report on State F inances
190
(e) Net worth (the difference between total assets and total liabilities) was $102.4 billion at 30 June 2020. This outcome is $1.5 billion (or 1.5%) lower than the forecast $104 billion in the 2019-20 Budget and reflects the net impact of the outcomes noted above.
(f) General government sector net debt was $23.8 billion at 30 June 2020, $3.9 billion (or 14.2%) lower than the $27.7 billion estimated in the original Budget. This largely reflected the better than expected cash outcome for 2019-20, detailed in the next section, and the lower net debt final outturn for 30 June 2019 (reported in the 2018-19 ARSF).

Appendix 4
191
Table 4.3 GENERAL GOVERNMENT
Cash Flow Statement
Budget Variation VariationNotes Estimate Actual on Budget on Budget
$m $m $m %CASH FLOWS FROM OPERATING ACTIVITES
Cash receivedTaxes received 9,104 9,018 -86 -0.9 Grants and subsidies received 11,762 11,825 63 0.5 Receipts from sales of goods and services 2,750 2,589 -161 -5.9 Interest receipts 155 119 -35 -22.8 Dividends and tax equivalents 1,863 1,071 -792 -42.5 Other 8,519 10,825 2,306 27.1 Total cash received 34,153 35,447 1,295 3.8
Cash PaidWages, salaries and supplements, and superannuation -14,233 -14,192 42 -0.3 Payments for goods and services -8,693 -8,494 198 -2.3 Interest paid -1,080 -905 175 -16.2 Grants and subsidies paid -5,519 -6,641 -1,122 20.3 Dividends and tax equivalents - - - - Other payments -1,574 -2,004 -430 27.4 Total cash paid -31,099 -32,237 -1,138 3.7
NET CASH FLOWS FROM OPERATING ACTIVITIES a 3,054 3,211 157 5.1
CASH FLOWS FROM INVESTING ACTIVITES
Cash flows from investments in non-financial assetsPurchase of non-financial assets b -2,505 -2,553 -49 1.9 Sales of non-financial assets c 137 1,476 1,339 976.7 Total cash flows from investments in non-financial assets d -2,367 -1,077 1,290 -54.5
Cash flows from investments in financial assetsCash receivedFor policy purposes 10 64 54 536.3 For liquidity purposes 65 56 -8 -13.0 Cash paidFor policy purposes -1,272 -862 410 -32.2 For liquidity purposes -33 -38 -5 14.7 Total cash flows from investments in financial assets -1,230 -780 451 -36.6
NET CASH FLOWS FROM INVESTING ACTIVITIES -3,598 -1,857 1,741 -48.4
CASH FLOWS FROM FINANCING ACTIVITIES
Cash receivedAdvances received 17 17 - 2.2 Borrow ings 1,750 845 -905 -51.7 Deposits received - - - - Other f inancing receipts 181 312 131 72.2 Total cash receipts from financing activities 1,948 1,174 -774 -39.7
Cash paidAdvances paid -17 -17 - 2.2 Borrow ings repaid -1,434 -1,379 55 -3.8 Deposits paid - - - - Other f inancing payments -564 -492 72 -12.7 Total payments for financing activities -2,014 -1,888 126 -6.3
NET CASH FLOWS FROM FINANCING ACTIVITIES -66 -714 -648 979.3
Net increase in cash and cash equivalents -610 640 1,250 -204.9 Cash and cash equivalents at the beginning of the year 4,276 5,005 729 17.0 Cash and cash equivalents at the end of the year 3,666 5,645 1,979 54.0
KEY FISCAL AGGREGATES
Net cash f low s from operating activities 3,054 3,211 157 5.1 Net cash f low s from investing in non-financial assets -2,367 -1,077 1,290 -54.5
Cash surplus/-deficit e 687 2,134 1,447 210.8
2019-20

2019-20 Annual Report on State F inances
192
General Government Sector Cash Flow Statement
(a) Net cash flows from operating activities (i.e. the receipts and payments of day-to-day operating activities of general government agencies) were in a net $3.2 billion cash surplus position in 2019-20, a $157 million improvement on the $3.1 billion cash operating surplus forecast in the 2019-20 Budget9. Total operating cash received in 2019-20 was $35.5 billion, $1.3 billion (or 3.8%) higher than Budget, while total cash paid in 2019-20 was $32.2 billion, $1.1 billion (or 3.7%) higher than Budget.
The $157 million improvement in the cash operating result reflects similar factors to the improvement for the accrual operating balance on the operating statement (discussed earlier in this appendix). In particular, improvements in revenue were matched with broadly similar increases in operating receipts while, at the same time, the cash flow equivalents to the higher than budgeted accrual expenses.
Other changes in non-cash transactions such as depreciation and superannuation interest on the operating statement (which were lower than the original Budget and discussed earlier in this appendix) do not appear on the cash flow statement, and also contribute to the difference in outcomes for accrued operating expenses compared to cash operating payments.
(b) Purchases of non-financial assets (i.e. largely land and infrastructure investment) totalled $2.6 billion in 2019-20, $49 million (or 1.9%) higher than the 2019-20 Budget, with key changes including:
• WA Health (down $188 million), reflecting delays or changes in timing associated with project design activity and procurement processes, mainly in relation to Fiona Stanley Hospital Information and Communications Technology (ICT) Capital Replacement, the Newman Health Service Redevelopment Project, the Quadriplegic Centre Redevelopment, the Small Hospital and Nursing Post Refurbishment Program, the Primary Health Centres Demonstration Program, Royal Perth Hospital Fire Risk, the Carnarvon Aged and Palliative Care Facility, the Royal Perth Hospital Mental Health Observation Area, Replacement of the Medical Imaging System and Perth Children’s Hospital ICT and project closure arrangements;
• Department of Primary Industries and Regional Development (down $33 million), primarily due to the deferral of spending on core systems and information management systems following delays in finalising tender contracts. The Department’s laboratory upgrades project has been deferred pending the finalisation of revised planning and scope for the project. Expenditure on the North West Aboriginal Housing Initiative has also been delayed;
9 The net cash flow from operating activities is the cash equivalent of the operating balance on the operating statement
discussed earlier in this appendix and in the Financial Results chapter of this report. This cash flow aggregate is based on cash information only while the accrual operating balance includes non-cash transactions such as depreciation charges, and recognises costs (expenses) and benefits (revenue) as they occur rather than only when cash is paid or received.

Appendix 4
193
• Department of Education (down $25 million), reflecting the net impact of timing changes across both primary and secondary school works, the reflow of project tender savings to the Mount Lockyer Primary School rebuild, movements in the timing of elements of the primary schools land acquisition program, and additional spending on the construction of new primary schools;
• Western Australia Police Force (down $25 million), primarily due to delays with the Multifunctional Police Facility Heating, Ventilation and Air-conditioning Systems Replacement, Capel Police Station, Armadale Courthouse and Police Complex, the Helicopter Replacement Project, the Fleet and Equipment Replacement Program, and the Speed Camera Replacement Program;
• Department of Fire and Emergency Services (down $17 million), due largely to underspends in key infrastructure projects such as the Bushfire Fire Centre of Excellence and Koolinup Emergency Services Centre and the appliance replacement program (reflecting delays in releasing tenders and the awarding of contracts), and the impact of COVID-19 pandemic regional boundary and non-essential travel restrictions. The appliance replacement program was also impacted by COVID-19 related interruptions to the supply of cab chassis and other parts, with many vehicle manufacturers temporarily ceasing production during the State restrictions;
• Department of Finance (down $10 million), mainly due to lower vehicle purchases through State Fleet reflecting both impacts from COVID-19 and the deferral of some major special build vehicles into 2020-21; and
• the inclusion in the original Budget of a $350 million general government underspend provision, in anticipation of lower actual spending that would emerge for infrastructure projects across the general government sector by 30 June 2020.
(c) Sales of non-financial assets were $1.5 billion in 2019-20, $1.3 billion higher than Budget.
This was largely due to the receipt of $1.4 billion of upfront proceeds from the partial commercialisation of Landgate received from Land Services WA following its appointment (on 10 September 2019) as the successful service provider to deliver, improve and maintain systems that facilitate automated land titling services. On 22 October 2019, Landgate entered into a commercialised arrangement with Land Services WA over a contract term of 40 years.
Other key sales movements included:
• lower land sales recorded by the Department of Planning, Lands and Heritage (down $56 million), mainly reflecting a $30 million Land Asset Sales Program target that was included in the 2019-20 Budget as a notional provision for the sale of freehold land owned by other agencies. Freehold land sales totalling $17 million were achieved in 2019-20, and these sales are included in individual agency statements. The remaining $26 million variance reflects lower than forecast high value land sales expected to settle in the 2019-20 financial year that were subsequently postponed by extended negotiations and uncertainty in the property market as a result of COVID-19; and
• the Department of Finance (down $18 million), attributable to lower than anticipated vehicle sales.

2019-20 Annual Report on State F inances
194
(d) Net cash flows from investments in non-financial assets totalled $1.1 billion in 2019-20, a $1.3 billion variance from Budget, reflecting the combined effect of changes in purchases and sales outlined above.
(e) The general government sector recorded a $2.1 billion cash surplus in 2019-20, $1.4 billion larger than the $687 million cash surplus forecast in the original Budget. This reflects the combination of net cash receipts from operations and net investment in non-financial assets described above. The cash deficit is the key driver of movements in net debt (discussed above and in the Financial Results chapter of this ARSF).

Appendix 4
195
Table 4.4 TOTAL PUBLIC SECTOR
Operat ing Statement
Budget Variation VariationNotes Estimate Actual on Budget on Budget
$m $m $m %RESULTS FROM TRANSACTIONS
REVENUETaxation 8,561 8,550 -11 -0.1 Current grants and subsidies 9,607 9,379 -228 -2.4 Capital grants 943 642 -301 -31.9 Sales of goods and services 35,028 37,054 2,026 5.8 Interest income 685 555 -129 -18.9 Royalty income 6,375 8,450 2,075 32.6 Other 1,099 1,077 -22 -2.0 Total a 62,297 65,706 3,410 5.5
EXPENSESSalaries 13,787 14,051 264 1.9 Superannuation
Concurrent costs 1,352 1,392 39 2.9 Superannuation interest cost 138 89 -48 -35.1
Other employee costs 261 356 95 36.6 Depreciation and amortisation 3,974 3,908 -66 -1.7 Services and contracts 3,422 3,385 -37 -1.1 Other gross operating expenses 33,114 35,027 1,913 5.8 Interest
Interest on leases 291 231 -61 -20.9 Other interest 1,700 1,333 -367 -21.6
Current transfers 2,989 3,693 703 23.5 Capital transfers 174 194 20 11.8 Total b 61,203 63,659 2,457 4.0
NET OPERATING BALANCE c 1,094 2,047 953 87.1 Other economic flows - included in the operating resultNet gains on assets/liabilities 111 -408 -519 -468.0 Provision for doubtful debts -47 -198 -151 318.8 Changes in accounting policy/adjustment of prior periods - -79 -79 - Total other economic flows d 63 -685 -748 -1,184.1
OPERATING RESULT 1,157 1,362 205 17.7
All other movements in equityItems that will not be reclassified to operating resultRevaluations 988 850 -138 -13.9 Net actuarial gains - superannuation -260 -22 238 -91.5 Gains recognised directly in equity -113 - 113 -99.9 All other - -345 -345 - Total all other movements in equity e 615 483 -132 -21.5
TOTAL CHANGE IN NET WORTH f 1,773 1,845 72 4.1
KEY FISCAL AGGREGATES
NET OPERATING BALANCE 1,094 2,047 953 87.1 Less Net acquisition of non-financial assetsPurchase of non-financial assets 5,646 5,188 -458 -8.1 Changes in inventories 74 2,088 2,014 2,734.1 Other movement in non-financial assets 175 94 -81 -46.5 less:Sales of non-financial assets 705 1,736 1,031 146.3 Depreciation 3,974 3,908 -66 -1.7 Total net acquisition of non-financial assets 1,217 1,727 510 41.9
NET LENDING/-BORROWING g -123 320 443 -360.5
2019-20

2019-20 Annual Report on State F inances
196
Total Public Sector10 Operating Statement
(a) Operating revenue in 2019-20 was $65.7 billion, $3.4 billion (or 5.5%) higher than budgeted, with a lower outcome for Commonwealth grants, interest income, taxation and ‘other’ income more than offset by higher outcomes for royalties and sales of goods and services. Movements for taxation, royalties and Commonwealth grants (which also appear on the general government operating statement with most of this income received by that sector) have been outlined earlier in this appendix11.
Sales of goods and services were $2 billion (or 5.8%) higher than Budget, with material changes attributable to:
• the Gold Corporation (up $2.6 billion), mainly due to higher than budgeted gold prices through the year, which also increased significantly during the COVID-19 pandemic. This significant increase in forecast revenue is broadly matched by an equivalent increase in related expenses (see (b) later in this section);
• the Lotteries Commission (up $66 million), as a result of a higher than expected level of first division jackpots with an associated increase in related expenditure on prize distributions;
• Racing and Wagering Western Australia (down $220 million), due largely to lower betting turnover as a result of reduced racing activity caused by the COVID-19 pandemic. Lower than expected betting revenue is broadly matched by reduced betting dividend payouts and other direct costs of sales;
• the Department of Communities (Housing Services, down $117 million), mostly reflecting lower sales mainly from the Affordable Housing Program due to softening market conditions and COVID-19 restrictions, and lower rent revenue (reflecting a decline in market rents across the State). This lower than expected revenue is broadly matched by an equivalent reduction in related expenses; and
• the Public Transport Authority (down $49 million), mostly due to the decline in patronage on Transperth services and reductions in advertising revenue as a result of the COVID-19 pandemic;
Interest income was $129 million (or 18.9%) lower than budgeted, largely reflecting lower interest revenue from the Western Australian Treasury Corporation, the Insurance Commission of Western Australia, Keystart, and the Public Bank Account.
10 The total public sector (also known as the whole-of-government) consolidates the general government sector
(discussed earlier), the public non-financial corporations sector (which includes entities delivering non-financial services on a predominantly cost recovery basis, like the State’s ports, and the electricity and water utilities), and the public financial corporations sector (which includes agencies mainly engaged in financial activities such as the Western Australian Treasury Corporation and the Insurance Commission of Western Australia).
11 Internal transfers between the general government sector and agencies in the public corporations sectors are eliminated in the whole-of-government consolidation process. Accordingly, some total public sector financial aggregates may be smaller than the general government equivalent. For example, the general government sector collects payroll tax from some public corporations. These internal collections are not shown in the total public sector taxation revenue data which is thus smaller than the general government taxation revenue aggregate.

Appendix 4
197
(b) Operating expenses in 2019-20 were $63.7 billion, $2.5 billion (or 4%) higher than Budget, with higher outcomes for ‘other’ gross operating expenses and transfers (current and capital) in particular, along with salaries and employee costs only partly offset by lower outcomes across all other line items.
‘Other’ gross operating expenses were $1.9 billion (or 5.8%) higher than Budget, due largely to the (broadly equivalent) impact on expenses of the revenue issues outlined above for the Gold Corporation (up $2.6 billion), Lotteries Commission (up $44 million), and Racing and Wagering Western Australia (down $203 million).
Expenses in this category incurred by the Department of Communities (Housing Services) and the Water Corporation were up $39 million and down $92 million respectively, with higher expenses for Housing reflecting additional maintenance expenses, and the lower outcome for the Water Corporation due to reclassifications with other expense categories such as services and contracts.
Claims expenses for the public insurance corporations were a net $80 million lower than budgeted, with:
• the Insurance Commission of Western Australia (down $132 million), mainly due to a lower annual valuation of insurance claims reflecting a decline in forecast inflation rates and other actuarial assumptions; and
• RiskCover (up $52 million), mainly reflecting an increase in the number of new large claims and higher costs in the workers’ compensation class of insurance.
Excluding these specific agencies, and the reclassification of State-funded NDIS spending outlined earlier in this appendix, ‘other’ gross operating expenses for all other agencies were $226 million (or 3.3%) higher than budgeted.
Salaries were $264 million higher than forecast in the 2019-20 Budget, with a $107 million lower salaries outcome for the State’s public non-financial corporations, attributable to Water Corporation (down $89 million), offset by higher than budgeted salaries outcomes for the general government sector (up $368 million, see earlier discussion in this appendix). Public financial corporations’ salary costs were largely unchanged from Budget (up $3 million).
Across the other classes of expense, higher than budgeted outcomes were recorded for concurrent superannuation costs (up $39 million or 2.9%), other employee costs (up $95 million or 36.6%), and transfers (abstracting from the NDIS reclassification discussed earlier, up $113 million or 3%). These increases were partly offset by lower than budgeted outcomes for interest expenses (covering both interest on leases and other interest, down $428 million or 21.5%), depreciation and amortisation (down $66 million or 1.7%), superannuation interest (down $48 million or 35.1%), and services and contracts (down $37 million or 1.1%),
(c) The total public sector recorded a $2 billion operating surplus in 2019-20, a $953 million increase on the $1.1 billion surplus projected at the time of the 2019-20 Budget. Revenue was $3.4 billion (or 5.5%) higher than forecast while expenses were $2.5 billion (or 4%) higher. The main drivers of these movements have been outlined above.

2019-20 Annual Report on State F inances
198
(d) ‘Other’ economic flows resulted in an aggregate decrease in net worth of $685 million, a $748 million turnaround on the forecast increase of $63 million in the 2019-20 Budget. This was predominantly due to a $408 million decrement in the value of net gains on assets/liabilities (compared with a $111 million forecast increase in the Budget), a $198 million reduction in net worth driven by provisions for doubtful debts, and a $79 million change in accounting policies/adjustment of prior periods12 (which are not forecast in the Budget).
(e) All other movements in equity total to an aggregate increase in net worth of $483 million in 2019-20, down $132 million from expectations at the time of the Budget (up $615 million). Net actuarial gains on superannuation (up $238 million) along with gains recognised directly in equity (up $113 million) were offset by lower than expected valuations (e.g. for land) in 2019-20 (down $138 million), and “all other” changes (down $345 million) reflecting the impact of the initial adoption of new accounting standards.
(f) The total change in net worth at 30 June 2020 was an increase of $1.8 billion, broadly unchanged from the change forecast at Budget. This change is comprised of the changes in the net operating balance, other economic flows and all other movements in equity variances outlined above and in the equivalent general government sector discussion earlier in this appendix.
(g) Net lending/borrowing was in a $320 million surplus position in 2019-20, a $443 million turnaround on the net lending deficit projected in the original Budget.
This includes changes in total public sector purchases and sales of non-financial assets detailed later in this appendix (under the cash flow statement).
Inventories were budgeted to rise by $74 million but instead increased by $2.1 billion, primarily due to the value of the Gold Corporation’s holdings of precious metals.
Depreciation expenses were $66 million (or 1.7%) lower than budgeted, while other movements in non-financial assets (which comprises the value of assets transferred in and out of the sector) were $81 million lower than budgeted.
12 Movements in the value of the public sector balance sheet that result from a revaluation or restatement of assets and
liabilities are included in equity as reserves. These reserves are used to account for any unrealised gains or losses that would otherwise be recognised in the operating statement.

Appendix 4
199
Table 4.5 TOTAL PUBLIC SECTOR
Balance Sheet
Budget Variation VariationNotes Estimate Actual on Budget on Budget
$m $m $m %ASSETSFinancial assetsCash and deposits 2,229 2,346 117 5.2 Advances paid 5,373 5,259 -114 -2.1 Investments, loans and placements 14,034 25,495 11,461 81.7 Receivables 5,225 5,923 697 13.3 Equity - Investments in other entities 2,084 1,844 -240 -11.5 Other f inancial assets 13 15 2 12.1 Total financial assets 28,959 40,882 11,923 41.2
Non-financial assetsLand 44,657 43,599 -1,058 -2.4 Property, plant and equipment 104,610 102,575 -2,035 -1.9 Right-of-use assets 2,969 2,997 28 0.9 Biological assets 322 317 -5 -1.5 Inventories
Land inventories 2,025 1,809 -216 -10.7 Other inventories 3,870 6,433 2,563 66.2
Intangibles 974 1,054 80 8.3 Assets classif ied as held for sale 93 37 -56 -60.2 Investment property 61 33 -28 -46.1 Other 510 424 -85 -16.7 Total non-financial assets 160,092 159,279 -813 -0.5
TOTAL ASSETS 189,051 200,161 11,110 5.9
LIABILITIESDeposits held 11 12 - 1.8 Advances received 377 326 -50 -13.4 Borrow ings
Lease liabilities 3,054 3,500 446 14.6 Other borrow ings 57,725 64,711 6,986 12.1
Superannuation 6,891 6,920 30 0.4 Other employee benefits 3,478 3,981 503 14.4 Payables 6,612 9,978 3,367 50.9 Other liabilities 6,925 8,294 1,369 19.8 TOTAL LIABILITIES 85,073 97,723 12,650 14.9
NET ASSETS 103,978 102,438 -1,540 -1.5 Of which:Contributed equity - - - - Accumulated surplus 27,184 27,083 -101 -0.4 Other reserves 76,794 75,355 -1,439 -1.9 NET WORTH a 103,978 102,438 -1,540 -1.5 MEMORANDUM ITEMS
Net financial worth -56,114 -56,841 -727 1.3 Net financial liabilities 56,114 56,841 727 1.3 Net debtGross debt liabilities 61,167 68,549 7,382 12.1 less: liquid f inancial assets 21,636 33,100 11,464 53.0 less: convergence differences impacting net debt - - - - Net debt b 39,531 35,449 -4,082 -10.3
2019-20

2019-20 Annual Report on State F inances
200
Total Public Sector Balance Sheet13
(a) Net worth of the total public sector was $102.4 billion at 30 June 2020 (down $1.5 billion, or 1.5% on the Budget-time forecast).
Movements since the original Budget for these balance sheet items largely reflect variances in the final results for the year ending 30 June 2019 compared to the then expected outcome for that year, changes due to operating and investing operations through 2019-20 (discussed in cash flow terms below), and movements in the valuation of assets (particularly land and other physical assets).
• Assets were $11.1 billion (or 5.9%) higher than Budget with lower holdings of non-financial assets (down $813 million) more than offset by a higher stock of financial assets (up $11.9 billion).
− For financial assets, liquid cash holdings were $11.5 billion higher than forecast with higher holdings for the Western Australian Treasury Corporation and the PBA, due in part to a higher than expected outcome for the year ending 30 June 2019 discussed in the 2018-19 ARSF. Receivables were $697 million higher reflecting timing issues for a range of transactions, including an increase in mining revenue receivables on the back of significant price movements noted earlier.
− Lower than budgeted non-financial asset outcomes were recorded for a range of asset classes, predominantly for property, plant and equipment (down $2 billion), and land (down $1.1 billion), reflecting valuation movements in 2018-19 and 2019-20. These were partly offset by upward variations for ‘other’ inventories (up $2.6 billion), reflecting a higher than budgeted outcome for the Gold Corporation’s holdings of precious metals.
• Liabilities were $12.7 billion (or 14.9%) higher than Budget, with higher gross debt liabilities (up $7.4 billion), largely held by the Western Australian Treasury Corporation and mainly reflecting the impacts of the prior year actual. Higher than anticipated outcomes were recorded for payables (up $3.4 billion), ‘other’ liabilities (up $1.4 billion), and ‘other employee benefits’ (up $503 million).
(b) Total public sector net debt was $35.5 billion at 30 June 2020, $4.1 billion (or 10.3%) lower than the $39.5 billion estimated in the 2019-20 Budget. Gross debt liabilities were $7.4 billion higher while holdings of liquid financial assets were up $11.5 billion. These variances include a $819 million lower than expected outcome for the year ending 30 June 2019, as detailed in the 2018-19 ARSF, and movements in assets and liabilities detailed above.
13 Net worth of the total public sector is equivalent to general government sector net worth discussed earlier in this
appendix. This is because the net worth of the public corporations is recorded as an asset on the general government sector balance sheet. Accordingly, the variance from original Budget is also the same as for the general government sector. However, total public sector assets and liabilities are different to the general government sector disclosure as the assets and liabilities of the public corporations are disclosed in more detail than the net asset holding in public corporations recorded on the general government sector balance sheet.

Appendix 4
201
Table 4.6 TOTAL PUBLIC SECTOR
Cash Flow Statement
Budget Variation VariationNotes Estimate Actual on Budget on Budget
$m $m $m %CASH FLOWS FROM OPERATING ACTIVITIES
Cash receivedTaxes received 8,565 8,492 -74 -0.9 Grants and subsidies received 11,762 11,825 63 0.5 Receipts from sales of goods and services 24,145 27,956 3,811 15.8 Interest receipts 689 565 -125 -18.1 Dividends and tax equivalents - - - - Other 9,548 11,965 2,417 25.3 Total cash received 54,711 60,802 6,091 11.1
Cash paidWages, salaries and supplements, and superannuation -15,637 -15,441 196 -1.3 Payments for goods and services -23,610 -27,762 -4,152 17.6 Interest paid -2,073 -1,864 210 -10.1 Grants and subsidies paid -4,123 -4,810 -687 16.7 Dividends and tax equivalents - - - - Other payments -4,573 -5,256 -683 14.9 Total cash paid -50,017 -55,132 -5,115 10.2
NET CASH FLOWS FROM OPERATING ACTIVITIES a 4,694 5,670 976 20.8
CASH FLOWS FROM INVESTING ACTIVITIES
Cash flows from investments in non-financial assetsPurchase of non-financial assets b -5,646 -5,188 458 -8.1 Sales of non-financial assets c 705 1,736 1,031 146.3 Total cash flows from investments in non-financial assets d -4,942 -3,453 1,489 -30.1
Cash flows from investments in financial assetsCash receivedFor policy purposes 10 64 54 536.3 For liquidity purposes 7,219 12,044 4,825 66.8 Cash paidFor policy purposes -10 -63 -53 529.1 For liquidity purposes -7,928 -14,195 -6,267 79.0 Total cash flows from investments in financial assets -709 -2,150 -1,441 203.1
NET CASH FLOWS FROM INVESTING ACTIVITIES -5,651 -5,603 48 -0.8
CASH FLOWS FROM FINANCING ACTIVITIES
Cash receivedAdvances received - - - - Borrow ings 19,900 20,848 948 4.8 Deposits received - - - - Other f inancing receipts 49 231 182 370.6 Total cash received 19,949 21,078 1,129 5.7
Cash paidAdvances paid -17 -17 - 2.2 Borrow ings repaid -18,849 -18,397 452 -2.4 Deposits paid - - - - Other f inancing payments -438 -448 -10 2.2 Total cash paid -19,303 -18,862 441 -2.3
NET CASH FLOWS FROM FINANCING ACTIVITIES 646 2,217 1,571 243.2
Net increase in cash and cash equivalents -311 2,284 2,595 -833.5 Cash and cash equivalents at the beginning of the period 8,203 8,710 507 6.2 Cash and cash equivalents at the end of the period 7,892 10,994 3,102 39.3
KEY FISCAL AGGREGATES
Net cash f low s from operating activities 4,694 5,670 976 20.8 Net cash f low s from investing in non-financial assets -4,942 -3,453 1,489 -30.1
Cash surplus/-deficit e -248 2,217 2,465 -995.0
2019-20

2019-20 Annual Report on State F inances
202
Total Public Sector Cash Flow Statement
(a) Net cash flows from operating activities were in a surplus position of $5.7 billion in 2019-20, a $976 million improvement from the $4.7 billion cash operating surplus forecast in the 2019-20 Budget. Total cash receipts in 2019-20 were $60.8 billion, $6.1 billion (or 11.1%) higher than forecast, while total cash payments in 2019-20 were $55.1 billion, up $5.1 billion (or 10.2%) since Budget. Movements for key cash aggregates including taxes, Commonwealth grants, wages and salaries are broadly consistent with the equivalent items on the operating statement, discussed earlier in this appendix.
(b) Purchases of non-financial assets were $5.2 billion in 2019-20, $458 million (or 8.1%) lower than forecast. In addition to the general government sector variations noted earlier in this appendix (up $49 million), net changes in infrastructure spending by key public corporations include:
• the Public Transport Authority, including separate provisions for METRONET projects under development, (down $588 million), primarily reflecting scheduling changes following the tender results of the Yanchep Rail Extension and Thornlie-Cockburn Link, and the Railcar Program, delays with the Forrestfield-Airport Link and the Radio Systems Replacement project and schedule changes across a range of other projects;
• the Department of Communities (Housing Services, down $105 million), due largely to continued soft housing market conditions and the impact of COVID-19 on the agency’s land development and construction activities;
• DevelopmentWA (down $80 million), due to delayed spending across several major projects in the metropolitan region, including Subi East and Forrestdale Business Park, and timing delays across a number of regional projects, and delayed spending on central Perth redevelopment works (Riverside and Perth City Link). Some forecast spending was also subject to reclassification to operating costs;
• the Water Corporation (down $65 million), mainly due to the deferral of the Onslow Water Infrastructure Upgrade project from 2019-20, to accommodate additional project investigation work;
• the Fremantle Port Authority (down $24 million), reflecting changes in port user requirements and changed assumptions on the timing and prioritisation of projects together with delays due to the impact of COVID-19;
• Western Power (down $18 million), largely due to COVID-19 impacts and contractor and approval delays resulting in a shift in timing to 2020-21. The underspend applies to various projects including the conductor program and the State Underground Power Program;
• Racing and Wagering WA (down $11 million), reflecting the changing ICT requirements for wagering and other business systems and products;
• Horizon Power (up $10 million), reflecting the post-Budget approval of the Karratha - Dampier Transmission Line Upgrade;
Appendix 4
203
• the Pilbara Ports Authority (up $21 million), predominantly driven by the earlier than forecast completion of projects funded by the Port Improvement Rate. These projects delivered a range of improvements to the Port of Port Hedland and were completed in early 2019-20;
• Synergy (up $27 million), reflecting higher than expected investment on Kwinana Power Station site rehabilitation works and the refurbishment of the cooling tower at Collie Power Station, investment in hardware to support a new energy market trading function, site works at generator facilities and investment in ICT systems, and capital spending that Synergy undertook on behalf of Western Power in accordance with a network control service arrangement between the entities; and
• the inclusion in the original Budget of a $350 million underspend provision for the public corporations sector in anticipation of lower actual spending that would emerge for infrastructure projects by 30 June 2020 (now reflected in the outcomes for the agencies described above).
(c) Sales of non-financial assets were $1.7 billion in 2019-20, $1 billion higher than Budget. In addition to the general government sector variations noted earlier in this appendix (up $1 billion), net changes in sales include:
• Department of Communities (Housing Services, down $158 million), primarily due to lower than expected land and property sales as a result of continued soft housing market conditions and the impact of COVID-19; and
• DevelopmentWA (down $131 million), due to delayed sales completions, primarily in the central Perth precincts such as Elizabeth Quay (as a consequence of a more challenging economic environment), and the impact of more subdued economic conditions, with lower buyer activity, particularly in the North West corridor of Perth.
(d) Net cash flows from investments in non-financial assets were $3.5 billion in 2019-20, $1.5 billion (or 30.1%) lower than Budget, with movements in purchases and sales outlined above.
(e) The total public sector recorded a $2.2 billion cash surplus in 2019-20, a $2.5 billion turnaround on the $248 million deficit forecast in the 2019-20 Budget. This reflects the combination of the better than expected net cash surplus on operations (up $976 million) and the lower net cash out-flow in non-financial assets (down $1.5 billion) discussed above.

2019-20 Annual Report on State F inances
204

205
A P P E N D I X 5
Special Purpose Accounts
Special Purpose Accounts (SPAs) are established under various sections of the Financial Management Act 2006 (FMA) or by specific legislation (e.g. the Royalties for Regions Fund). Accounts established by legislation are governed by the relevant provisions of the statute, while accounts that are established administratively are governed by a special purpose statement (operating accounts) or a trust statement (trust accounts) that outline the purpose of the account.
This appendix details balances for the year ending 30 June 2020 for key SPAs established to deliver specific Government policy outcomes. The focus of this Appendix is on major/material SPAs that were in existence at 30 June 2020. The SPA balances, and transactions in and out of these accounts, form part of the overall consolidated outcomes outlined elsewhere in this report.
Debt Reduction Account
In line with the Government’s election commitment for responsible financial management, a Debt Reduction Account was established in 2017-18 to apply windfall funds to the repayment of Consolidated Account borrowings. Receipts of $1,318 million in 2019-20 were sourced from Western Australia’s 2019-20 GST top-up payment ($1,248 million) and surplus capital returned to the Consolidated Account by RiskCover ($69 million). These funds were applied to debt repayment through the Western Australian Treasury Corporation during the same period.
Table 5.1 DEBT REDUCTION ACCOUNT
2019-20 $m
2018-19 $m
Balance at 1 July - - Receipts 1,318 437 Payments 1,318 437 Closing Balance - -
Note: Columns may not add due to rounding.
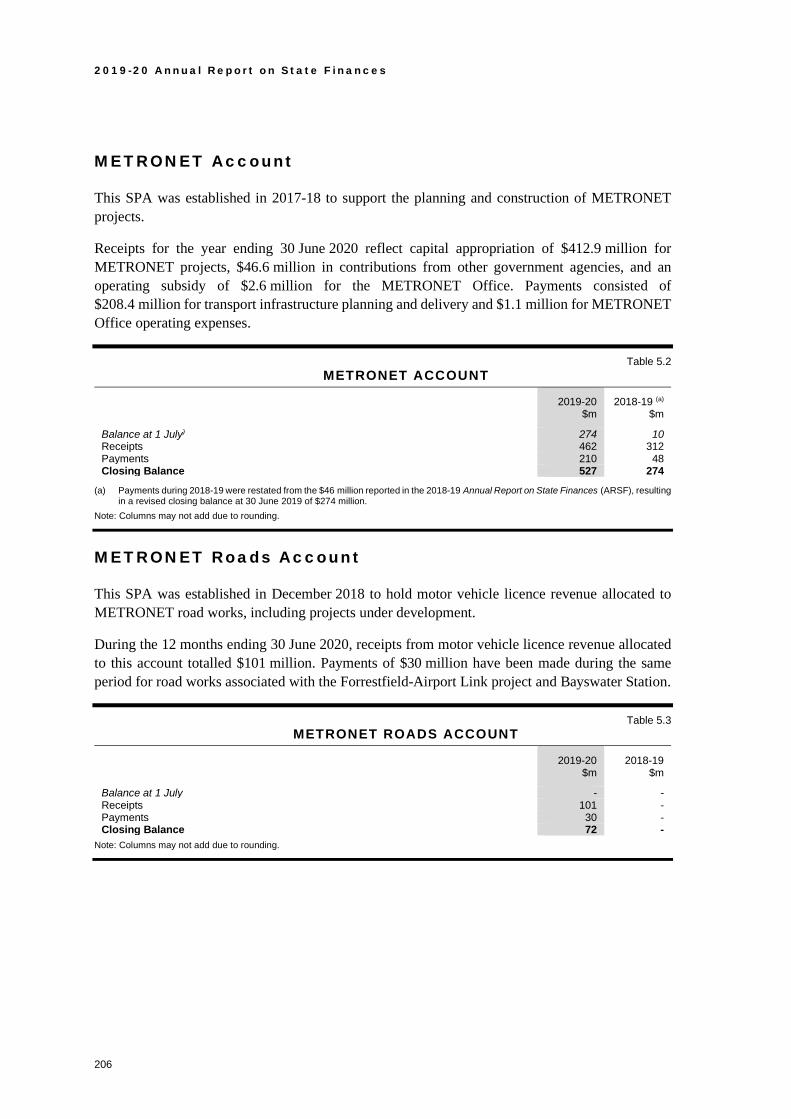
2019-20 Annual Report on State F inances
206
METRONET Account
This SPA was established in 2017-18 to support the planning and construction of METRONET projects.
Receipts for the year ending 30 June 2020 reflect capital appropriation of $412.9 million for METRONET projects, $46.6 million in contributions from other government agencies, and an operating subsidy of $2.6 million for the METRONET Office. Payments consisted of $208.4 million for transport infrastructure planning and delivery and $1.1 million for METRONET Office operating expenses.
Table 5.2 METRONET ACCOUNT
2019-20 $m
2018-19 (a) $m
Balance at 1 July) 274 10 Receipts 462 312 Payments 210 48 Closing Balance 527 274
(a) Payments during 2018-19 were restated from the $46 million reported in the 2018-19 Annual Report on State Finances (ARSF), resulting in a revised closing balance at 30 June 2019 of $274 million.
Note: Columns may not add due to rounding.
METRONET Roads Account
This SPA was established in December 2018 to hold motor vehicle licence revenue allocated to METRONET road works, including projects under development.
During the 12 months ending 30 June 2020, receipts from motor vehicle licence revenue allocated to this account totalled $101 million. Payments of $30 million have been made during the same period for road works associated with the Forrestfield-Airport Link project and Bayswater Station.
Table 5.3 METRONET ROADS ACCOUNT
2019-20 $m
2018-19 $m
Balance at 1 July - - Receipts 101 - Payments 30 - Closing Balance 72 -
Note: Columns may not add due to rounding.

Appendix 5
207
Metropolitan Region Improvement Fund
This account was established under the Metropolitan Region Improvement Tax Act 1959 to hold funds for the management of the Metropolitan Region Scheme, including receipts from the Metropolitan Region Improvement Tax (MRIT).
Receipts in 2019-20 reflect MRIT collections ($87.7 million), proceeds from the sale of land and buildings ($16.5 million), rental revenue ($6.2 million), interest revenue ($5.8 million) and receipts from the Australian Taxation Office for refunds of GST on purchases ($4.8 million).
Payments from the account during 2019-20 were for the acquisition of land and buildings ($64.7 million), contribution to the METRONET Yanchep Rail Extension (for improvement works on the rail corridor and Yanchep, Eglinton and Alkimos stations, $30 million), service delivery costs associated with the Metropolitan Region Improvement Fund ($28.5 million), compensation authorised by the Planning and Development Act 2005 ($3 million), and funding for a range of smaller infrastructure projects ($1.4 million).
Table 5.4 METROPOLITAN REGION IMPROVEMENT ACCOUNT
2019-20 $m
2018-19 $m
Balance at 1 July 440 399 Receipts 122 125 Payments 128 84 Closing Balance 434 440
Note: Columns may not add due to rounding.
Mining Rehabilitation Fund
The Mining Rehabilitation Fund was established in July 2013 to hold levy collections under the Mining Rehabilitation Fund Act 2012. Receipts for the year ending 30 June 2020 reflect levy contributions by mining operators ($33.4 million) and interest earnings ($2.1 million).
Payments for the year ending 30 June 2020 were for administration costs ($0.5 million) and mine rehabilitation costs in line with the Act ($0.3 million).
Table 5.5 MINING REHABILITATION FUND
2019-20 $m
2018-19 $m
Balance at 1 July 150 122 Receipts 36 34 Payments 1 6 Closing Balance 185 150
Note: Columns may not add due to rounding.

2019-20 Annual Report on State F inances
208
National Redress Scheme and Civil Litigation for Survivors of Institutional Child Sexual Abuse Account
This account was established in December 2018, to meet the cost of payments associated with the State’s participation in the National Redress Scheme and for civil litigation claims by victims of historical institutional child sexual abuse.
Payments totalling $10.6 million for both the National Redress Scheme and for civil litigation claims were made in 2019-20.
Table 5.6 NATIONAL REDRESS SCHEME AND CIVIL LITIGATION FOR
SURVIVORS OF INSTITUTIONAL CHILD SEXUAL ABUSE ACCOUNT 2019-20
$m 2018-19
$m
Balance at 1 July 151 - Receipts - 153 Payments 11 2 Closing Balance 141 151
Note: Columns may not add due to rounding.
Perth Children’s Hospital Account
This SPA was established in October 2010 to hold money for the construction and establishment of Perth Children’s Hospital.
The hospital achieved practical completion in April 2017 and fully opened on 10 June 2018. A total of $5.5 million was paid from the SPA during 2019-20 to fund residual works. Any remaining funds in the account will be returned to the Consolidated Account following the end of the defect liability period.
Table 5.7 PERTH CHILDREN’S HOSPITAL ACCOUNT
2019-20 $m
2018-19 $m
Balance at 1 July 13 13 Receipts - - Payments 5 - Closing Balance 7 13
Note: Columns may not add due to rounding.
Perth Parking Licensing Account
This SPA was established in July 1999 under section 23(1) of the Perth Parking Management Act 1999 to set aside funds to be used to encourage a balanced transport system for gaining access to the Perth city area. Money credited to the account reflects licence fees, penalties and money appropriated by Parliament for the purposes of the Act.

Appendix 5
209
Funds drawn from the account are used to support the Central Area Transit bus system, the Free Transit Zone public transport services in the Perth Central Business District, improvements to public transport access, enhancements to the pedestrian environment, support for bicycle access, other transport system initiatives and for the administration of the Act.
Table 5.8 PERTH PARKING LICENSING ACCOUNT
2019-20 $m
2018-19 $m
Balance at 1 July 93 54 Receipts 57 59 Payments 19 19 Closing Balance 131 93
Note: Columns may not add due to rounding.
Perth Stadium Account
This SPA was established in October 2011 to hold funds in support of the construction of Optus Stadium and associated transport infrastructure. The stadium commenced operations in early 2018.
There were no receipts or payments during the 12 months to 30 June 2020.
Table 5.9 PERTH STADIUM ACCOUNT
2019-20 $m
2018-19 (a) $m
Balance at 1 July 12 13 Receipts - 1 Payments - 3 Closing Balance 12 12
(a) Comparative information for 2019-20 has been restated since the 2018-19 Annual Report on State Finances to reflect minor changes in rounding.
Note: Columns may not add due to rounding.
Road Trauma Trust Account
This account was established to provide for road safety initiatives on Western Australian roads. Receipts during 2019-20 reflect collections from prescribed penalties ($96.7 million), interest revenue on the account balance ($1 million) and other miscellaneous funds collected during 2019-20 under the Road Traffic (Administration) Act 2008 ($0.1 million).
Projects funded from the account are focused on achieving reductions in serious road trauma. The majority of funds drawn during 2019-20 supported initiatives to reduce:
• run-off crashes on regional roads by applying treatments such as shoulder sealing and audible edge lines ($35.9 million);
• speed management ($32.9 million);
• death and serious injury of vulnerable road users ($10.5 million) and of drivers who are impaired by alcohol and/or drugs ($8.5 million); and
• serious crashes at intersections ($3.4 million).

2019-20 Annual Report on State F inances
210
Funding of $12.8 million was also drawn for the operating costs of the Road Safety Commission, including a range of road safety initiatives and support programs (such as community education campaigns).
Table 5.10 ROAD TRAUMA TRUST ACCOUNT
2019-20 $m
2018-19 (a) $m
Balance at 1 July 60 53 Receipts 98 97 Payments 104 90 Closing Balance 54 60
(a) Comparative information for 2018-19 has been restated since the 2018-19 Annual Report on State Finances to reflect minor changes in rounding.
Note: Columns may not add due to rounding.
Royalties for Regions Fund
The Royalties for Regions Fund was established in December 2008 to set aside a share of the State’s annual royalty income to fund investment in regional Western Australia. Under the Royalties for Regions Act 2009, the balance held in the Fund at any time cannot exceed $1 billion.
Receipts during 2019-20 reflect the draw down of moneys appropriated by the Parliament ($882.1 million), interest earned on the account balance ($10.5 million), and unused funds from associated projects returned to the Fund by agencies ($17.2 million). A total of $909.7 million was disbursed from the Fund to support infrastructure, business and economic development, and other regional initiatives (detailed in the 2019-20 Budget Paper No. 3 and updated in the 2019-20 Mid-year Review).
Table 5.11 ROYALTIES FOR REGIONS FUND
2019-20 $m
2018-19 $m
Balance at 1 July 1,000 1,000 Receipts 910 729 Payments 910 729 Closing Balance 1,000 1,000
Note: Columns may not add due to rounding.
Royalties for Regions Regional Reform Fund
This SPA was established in June 2015 to fund strategic reform initiatives in regional Western Australia. Payments from the SPA totalled $10.7 million in 2019-20. This included $5.9 million paid to the Department of Communities for the funding of essential and municipal services for remote Aboriginal communities and contributions to the North West Aboriginal Housing Fund. A further $4.7 million was paid to the Department of Education for the Kimberley Schools Project.

Appendix 5
211
Table 5.12 ROYALTIES FOR REGIONS REGIONAL REFORM FUND
2019-20 $m
2018-19 $m
Balance at 1 July 80 96 Receipts - - Payments 11 16 Closing Balance 69 80
Note: Columns may not add due to rounding.
Waste Avoidance and Resource Recovery Account
The Waste Avoidance and Resource Recovery Account was established under the Waste Avoidance and Resource Recovery Act 2007 to hold revenue allocated from the landfill levy. Funds are drawn from the account to support programs and other initiatives related to the management, reduction, reuse, recycling, monitoring or measurement of waste.
Landfill levy collections totalled $78 million in 2019-20, of which $20.7 million was allocated to the account by Ministerial determination under the Act. Draw downs totalling $21.5 million were for waste programs and the payment of administration costs incurred by the Department of Water and Environmental Regulation.
Table 5.13
WASTE AVOIDANCE AND RESOURCE RECOVERY ACCOUNT
2019-20 $m
2018-19 $m
Balance at 1 July 40 39 Receipts 21 21 Payments 21 20 Closing Balance 40 40
Note: Columns may not add due to rounding.
Western Australian Future Health Research and Innovation Fund
The Western Australian Future Fund was established under the Western Australian Future Fund Act 2012. The Western Australian Future Fund Amendment (Future Health Research and Innovation Fund) Bill 2019 received Royal Assent in late May 2020 and took effect from 24 June 2020. This Act discontinued the Future Fund and created the Western Australian Future Health Research and Innovation Fund into which 1% of forecast annual royalties are to be paid each year. From 2020-21, this Act also applies forecast annual investment income from the new fund to a new account (administered by the Minister for Health) that provides long term support for medical and health research, innovation and commercialisation activities in Western Australia.
Receipts in 2019-20 included appropriation of 1% of annual forecast royalty revenue in the 2019-20 Budget ($63.7 million) and interest receipts ($31.2 million).

2019-20 Annual Report on State F inances
212
Table 5.14 WESTERN AUSTRALIAN FUTURE HEALTH RESEARCH AND
INNOVATION FUND 2019-20
$m 2018-19
$m
Balance at 1 July 1,313 1,215 Receipts 95 98 Payments - - Closing Balance 1,408 1,313
Note: Columns may not add due to rounding.

213
A P P E N D I X 6
Quarterly Financial Results – June 2020
This appendix completes the quarterly data series for the 2019-20 year. Consolidated financial outcomes for the general government sector and for the whole-of-government are published in Quarterly Financial Results Reports for the September, December and March quarters in accordance with the requirements of the Government Financial Responsibility Act 20001.
Information on the full-year outcomes for the general government and whole-of-government are available in the Financial Results chapter of this report.
1 These publications can be accessed on the Treasury website at www.wa.gov.au/organisation/department-of-treasury.
June quarterly data presented in this appendix are subject to year-end finalisation of audited accounts by agencies submitting source data. They may contain final year-end accruals that differ from estimated accruals submitted by agencies through the year, and reclassification of some aggregates in previously reported, unaudited data. Accordingly, quarterly outcomes for June 2020 may include one-off movements in items relative to previous reports, to move them into line with final audited outcomes.

2019-20 Annual Report on State F inances
214
Table 6.1 GENERAL GOVERNMENT
Operat ing Statement
Note: Columns/rows may not add due to rounding.
Three Three Months to Months to
30 June Actual 30 June Actual$m $m $m $m
RESULTS FROM TRANSACTIONS
REVENUETaxation 1,875 9,077 1,865 8,616Current grants and subsidies 2,322 9,379 2,738 10,210Capital grants 358 642 250 873Sales of goods and services 616 2,754 747 2,734Interest Income 26 124 39 168Revenue from public corporations
Dividends from other sector entities 53 392 1,001 1,350Tax equivalent income 223 732 220 642
Royalty income 2,307 8,450 2,362 6,713Other 146 614 238 701Total 7,928 32,162 9,461 32,006
EXPENSESSalaries 3,389 12,887 3,172 12,269Superannuation
Concurrent costs 336 1,276 317 1,213Superannuation interest cost 49 89 48 135
Other employee costs 116 401 132 447Depreciation and amortisation 440 1,751 378 1,445Services and contracts 741 2,590 744 2,538Other gross operating expenses 1,366 5,391 1,448 5,645Interest
Interest on leases 36 142 26 89Other interest 174 737 212 859
Current transfers 1,911 5,003 1,532 5,426Capital transfers 142 228 197 625Total 8,698 30,493 8,206 30,689
NET OPERATING BALANCE -770 1,669 1,255 1,317Other economic flows - included in the operating resultNet gains on assets/liabilities -31 -27 -71 59Provision for doubtful debts -122 -126 7 2Changes in accounting policy/adjustment of prior periods 104 -44 179 -172Total other economic flows -48 -197 116 -111OPERATING RESULT -819 1,472 1,371 1,206All other movements in equityItems that will not be reclassified to operating resultRevaluations 463 392 -1,049 -1,374Net actuarial gains - superannuation 835 5 -143 -814Gains recognised directly in equity 9 -1 - -Change in net worth of the public corporations sectors 1,187 217 -1,850 -1,661All other -239 -239 - -Total all other movements in equity 2,255 373 -3,042 -3,849TOTAL CHANGE IN NET WORTH 1,436 1,845 -1,671 -2,642
KEY FISCAL AGGREGATES
NET OPERATING BALANCE -770 1,669 1,255 1,317Less Net acquisition of non-financial assetsPurchase of non-financial assets 799 2,553 870 2,540Changes in inventories 28 38 -4 -Other movement in non-financial assets -35 -15 81 146less:Sales of non-financial assets 21 1,476 49 100Depreciation 440 1,751 378 1,445Total net acquisition of non-financial assets 331 -651 521 1,142NET LENDING/-BORROWING -1,101 2,320 735 175
2018-192019-20

Appendix 6
215
Table 6.2 GENERAL GOVERNMENT
Operat ing Revenue
Note: Columns/rows may not add due to rounding.
Three Monthsto 30 June Actual
Three Monthsto 30 June Actual
$m $m $m $mTaxationTaxes on employers' payroll and labour force
Payroll tax 805 3,642 896 3,565
Property taxesLand tax 15 792 2 807
Transfer duty 280 1,190 260 1,073Foreign Buyers Surcharge 19 19 - -Landholder duty 60 120 12 32Total duty on transfers 358 1,329 272 1,105
Metropolitan Region Improvement Tax 1 88 - 89Perth Parking Levy - 56 2 59Emergency Services Levy 32 387 32 374Loan guarantee fees 39 157 37 152Building and Construction Industry Training Fund Levy 5 39 8 27Total other property taxes 78 726 79 702
Taxes on provision of goods and servicesLotteries Commission 40 174 41 180Video lottery terminals - - - -Casino tax 1 40 20 59Betting tax - - 3 25Point of Consumption Tax 18 77 15 30Total taxes on gambling 59 291 79 294
Insurance duty 162 694 155 645Other 5 19 4 17Total taxes on insurance 166 713 159 662
On-demand Transport Levy 7 41 5 5
Taxes on use of goods and performance of activitiesVehicle licence duty 90 375 93 363Permits - Oversize Vehicles and Loads 2 9 1 8Motor vehicle registrations 275 1,045 260 995Total motor vehicle taxes 367 1,429 354 1,367
Mining Rehabilitation Levy 1 33 - 31
Landfill Levy 18 80 18 79
Total Taxation 1,875 9,077 1,865 8,616
2019-20 2018-19

2019-20 Annual Report on State F inances
216
Table 6.2 (cont.) GENERAL GOVERNMENT
Operat ing Revenue
Note: Columns/rows may not add due to rounding.
Three Months Three Monthsto 30 June Actual to 30 June Actual
$m $m $m $m
Current Grants and SubsidiesGeneral Purpose Grants
GST grants 849 3,466 752 3,200Commonw ealth-funded 70% floor - 814 434 434North West Shelf grants 95 629 186 886Commonw ealth compensation for changed crude oilexcise arrangements 4 21 5 30
Grants through the StateSchools assistance – non-government schools - - 29 1,323Local government f inancial assistance grants - - 114 181Local government roads - - 74 118
National Specific Purpose Payment Agreement GrantsNational Agreement for Skills and Workforce Development 40 158 39 157National Disability Agreement 44 176 61 167National Housing and Homelessness Agreement 42 166 41 164
National School Reform Agreement - Quality Schools 215 829 193 739
National Health Reform Agreement 630 2,402 583 2,269
National Partnerships/Other GrantsHealth 234 365 75 194Housing - - - -Transport 42 88 4 54Disability Services 62 62 55 55Other 66 203 95 239
Total Current Grants and Subsidies 2,322 9,379 2,738 10,210
Capital GrantsGrants Through the State
Schools assistance – non-government schools - - 5 18
National Partnerships/Other GrantsHousing - - - 251Transport 341 621 234 593Other 17 20 11 11
Total Capital Grants 358 642 250 873
Sales of Goods and Services 616 2,754 747 2,734
Interest Income 26 124 39 168
Revenue from Public CorporationsDividends 53 392 1,001 1,350Tax Equivalent Regime 223 732 220 642
Total Revenue from Public Corporations 277 1,123 1,221 1,991
Royalty Income 2,307 8,450 2,362 6,713
OtherLease Rentals 26 115 25 107Fines 49 192 50 224Revenue not elsew here counted 71 308 164 370
Total Other 146 614 238 701TOTAL REVENUE 7,928 32,162 9,461 32,006
2019-20 2018-19

Appendix 6
217
Table 6.3 GENERAL GOVERNMENT
Cash Flow Statement
Note: Columns/rows may not add due to rounding.
Three ThreeMonths to Months to
30 June Actual 30 June Actual$m $m $m $m
CASH FLOWS FROM OPERATING ACTIVITIES
Cash receivedTaxes received 2,149 9,018 2,125 8,911Grants and subsidies received 2,960 11,825 2,988 11,082Receipts from sales and goods and services 546 2,589 771 2,599Interest receipts 29 119 54 173Dividends and tax equivalents 221 1,071 1,202 2,092Other receipts 2,450 10,825 2,037 7,659Total cash received 8,355 35,447 9,176 32,517
Cash paidWages, salaries and supplements, and superannuation -3,809 -14,192 -3,673 -13,766Payments for goods and services -2,062 -8,494 -1,983 -8,473Interest paid -215 -905 -245 -950Grants and subsidies paid -2,202 -6,641 -1,659 -5,635Dividends and tax equivalents - - - -Other payments -504 -2,004 -434 -1,679Total cash paid -8,791 -32,237 -7,993 -30,503
NET CASH FLOWS FROM OPERATING ACTIVITIES -436 3,211 1,183 2,014
CASH FLOWS FROM INVESTING ACTIVITIES
Cash flow from investment in non-financial assetsPurchase of non-financial assets -799 -2,553 -870 -2,540Sales of non-financial assets 21 1,476 49 100Total cash flows from investments in financial assets -778 -1,077 -821 -2,441
Cash flows from investments in financial assetsCash receivedFor policy purposes 47 64 4 33For liquidity purposes 20 56 62 308Cash paidFor policy purposes -445 -862 -187 -790For liquidity purposes -18 -38 -25 -66Total cash flows from investments in financial assets -397 -780 -146 -516
NET CASH FLOWS FROM INVESTING ACTIVITIES -1,175 -1,857 -967 -2,956
CASH FLOWS FROM FINANCING ACTIVITIES
Cash receivedAdvances received 17 17 17 17Borrowings 800 845 14 61Deposit received - - - -Other financing receipts 114 312 59 253Total cash received 931 1,174 90 330
Cash paidAdvances paid -17 -17 -17 -17Borrowings repaid -23 -1,379 -229 -513Deposits paid - - - -Other financing payments -133 -492 -27 -214Total cash paid -173 -1,888 -272 -744
NET CASH FLOWS FROM FINANCING ACTIVITIES 758 -714 -182 -414
Net increase in cash and cash equivalents -854 640 34 -1,355Cash and cash equivalents at beginning of the period 6,498 5,005 4,971 6,360Cash and cash equivalents at end of the period 5,645 5,645 5,005 5,005
KEY FISCAL AGGREGATES
Net cash flows from operating activities -436 3,211 1,183 2,014Net cash flows from investing in non-financial assets -778 -1,077 -821 -2,441Cash surplus/-deficit -1,215 2,134 361 -426
2018-192019-20

2019-20 Annual Report on State F inances
218
Table 6.4 TOTAL PUBLIC SECTOR
Operat ing Statement
Note: Columns/rows may not add due to rounding.
Three ThreeMonths to Months to
30 June Actual 30 June Actual$m $m $m $m
RESULTS FROM TRANSACTIONS
REVENUETaxation 1,748 8,550 1,741 8,097Current grants and subsidies 2,322 9,379 2,738 10,210Capital grants 358 642 250 873Sales of goods and services 8,201 37,054 5,519 23,488Interest Income 145 555 188 639Royalty income 2,307 8,450 2,362 6,713Other 309 1,077 366 1,193Total revenue 15,390 65,706 13,165 51,214
EXPENSESSalaries 3,650 14,051 3,413 13,382Superannuation
Concurrent costs 363 1,392 318 1,323Superannuation interest cost 49 89 48 135
Other employee costs 86 356 111 350Depreciation and amortisation 1,015 3,908 858 3,431Services and contracts 1,011 3,385 1,019 3,306Other gross operating expenses 7,947 35,027 5,504 22,084Interest
Interest on leases 57 231 47 174Other interest 310 1,333 414 1,583
Current transfers 1,344 3,693 1,189 4,411Capital transfers 103 194 170 319Total expenses 15,933 63,659 13,091 50,498NET OPERATING BALANCE -543 2,047 74 716Other economic flows - included in the operating resultNet gains on assets/liabilities 111 -408 130 254Provision for doubtful debts -177 -198 14 -16Changes in accounting policy/adjustment of prior periods 153 -79 170 -310Total other economic flows 87 -685 314 -72OPERATING RESULT -456 1,362 388 644All other movements in equityItems that will not be reclassified to operating resultRevaluations 1,411 850 -1,889 -2,444Net actuarial gains - superannuation 815 -22 -380 -850Gains recognised directly in equity 12 - 2 8All other -345 -345 - -Total all other movements in equity 1,893 483 -2,267 -3,286TOTAL CHANGE IN NET WORTH 1,436 1,845 -1,879 -2,642
KEY FISCAL AGGREGATES
NET OPERATING BALANCE -543 2,047 74 716Less Net acquisition of non-financial assetsPurchase of non-financial assets 1,524 5,188 1,617 4,965Changes in inventories 288 2,088 230 614Other movement in non-financial assets 6 94 115 273less:Sales of non-financial assets 53 1,736 380 654Depreciation 1,015 3,908 858 3,431Total net acquisition of non-financial assets 750 1,727 724 1,767NET LENDING/-BORROWING -1,293 320 -650 -1,051
2018-192019-20

Appendix 6
219
Table 6.5 TOTAL PUBLIC SECTOR
Operat ing Revenue
Note: Columns/rows may not add due to rounding.
Three Monthsto 30 June Actual
Three Monthsto 30 June Actual
$m $m $m $mTaxationTaxes on employers' payroll and labour force
Payroll tax 781 3,550 874 3,479
Property taxesLand tax -1 727 -11 744
Transfer Duty 280 1,190 260 1,073Foreign Buyers surcharge 19 19Landholder Duty 60 120 12 32Total duty on transfers 358 1,329 272 1,105
Metropolitan Region Improvement Tax 1 88 - 89Perth Parking Levy - 56 2 59Emergency Services Levy 32 382 29 369Loan guarantee fees 1 7 1 8Building and Construction Industry Training Fund Levy 5 39 8 27Total other property taxes 39 570 40 552
Taxes on provision of goods and servicesVideo lottery terminals - - - -Casino Tax 1 40 20 59Betting tax - - - -Point of Consumption Tax 11 37 9 13Total taxes on gambling 11 77 28 73
Insurance Duty 162 694 155 645Other 5 19 4 17Total taxes on insurance 166 713 159 662
On-demand Transport Levy 7 41 5 5
Taxes on use of goods and performance of activitiesVehicle Licence Duty 90 375 93 363Permits - Oversize Vehicles and Loads 2 9 1 8Motor Vehicle registrations 275 1,045 260 995Total motor vehicle taxes 367 1,429 354 1,367
Mining Rehabilitation Levy 1 33 - 31
Landfill Levy 18 80 18 79
Total Taxation 1,748 8,550 1,741 8,097
2019-20 2018-19

2019-20 Annual Report on State F inances
220
Table 6.5 (cont.) TOTAL PUBLIC SECTOR
Operat ing Revenue
Note: Columns/rows may not add due to rounding.
Three Months Three Monthsto 30 June Actual to 30 June Actual
$m $m $m $m
Current Grants and SubsidiesGeneral Purpose Grants
GST grants 849 3,466 752 3,200Commonwealth-funded 70% floor grant - 814 434 434North West Shelf grants 95 629 186 886Commonwealth compensation for changed crude oilexcise arrangements 4 21 5 30
Grants through the StateSchools assistance – non-government schools - - 29 1,323Local government financial assistance grants - - 114 181Local government roads - - 74 118
National Specific Purpose Payment Agreement GrantsNational Agreement for Skills and Workforce Development 40 158 39 157National Disability Agreement 44 176 45 167National Housing and Homelessness Agreement 42 166 41 164
National School Reform Agreement - Quality Schools 215 829 193 739
National Health Reform Agreement 630 2,402 583 2,269
National Partnerships/Other GrantsHealth 234 365 75 194Housing - - - -Transport 42 88 4 54Disability Services 62 62 55 55Other 66 203 110 239
Total Current Grants and Subsidies 2,322 9,379 2,738 10,210
Capital GrantsGrants Through the State
Schools assistance – non-government schools - - 5 18
National Partnerships/Other GrantsHousing - - - 251Transport 341 621 234 593Other 17 20 11 11
Total Capital Grants 358 642 250 873
Sales of Goods and Services 8,201 37,054 5,519 23,488
Interest Income 145 555 188 639
Royalty Income 2,307 8,450 2,362 6,713
OtherLease Rentals 26 115 25 107Fines 50 195 47 224Revenue not elsewhere counted 233 767 295 862
Total Other 309 1,077 366 1,193
TOTAL REVENUE 15,390 65,706 13,165 51,214
2019-20 2018-19

Appendix 6
221
Table 6.6 TOTAL PUBLIC SECTOR
Cash Flow Statement
Note: Columns/rows may not add due to rounding.
Three ThreeMonths to Months to
30 June Actual 30 June Actual$m $m $m $m
CASH FLOWS FROM OPERATING ACTIVITIES
Cash receivedTaxes received 1,870 8,492 1,863 8,392Grants and subsidies received 2,960 11,825 2,988 11,082Receipts from sales and goods and services 8,107 27,956 5,889 23,693Interest receipts 123 565 190 661Dividends and tax equivalents - - - -Other receipts 2,705 11,965 2,290 8,807Total cash received 15,765 60,802 13,220 52,635
Cash paidWages, salaries and supplements, and superannuation -4,065 -15,441 -4,003 -15,062Payments for goods and services -8,199 -27,762 -5,721 -23,421Interest paid -400 -1,864 -514 -2,017Grants and subsidies paid -1,189 -4,810 -1,119 -4,129Dividends and tax equivalents - - - -Other payments -1,464 -5,256 -1,162 -4,620Total cash paid -15,318 -55,132 -12,519 -49,248
NET CASH FLOWS FROM OPERATING ACTIVITIES 447 5,670 701 3,386
CASH FLOWS FROM INVESTING ACTIVITIES
Cash flow from investment in non-financial assetsPurchase of non-financial assets -1,524 -5,188 -1,617 -4,965Sales of non-financial assets 53 1,736 380 654Total cash flows from investments in financial assets -1,470 -3,453 -1,237 -4,310
Cash flows from investments in financial assetsCash receivedFor policy purposes 47 64 4 21For liquidity purposes 2,034 12,044 1,094 6,495Cash paidFor policy purposes -47 -63 -3 -19For liquidity purposes -3,558 -14,195 -3,471 -8,784Total cash flows from investments in financial assets -1,524 -2,150 -2,376 -2,286
NET CASH FLOWS FROM INVESTING ACTIVITIES -2,995 -5,603 -3,613 -6,597
CASH FLOWS FROM FINANCING ACTIVITIES
Cash receivedAdvances received - - - -Borrowings 5,139 20,848 4,985 21,444Deposit received - - - -Other financing receipts 115 231 60 98Total cash received 5,254 21,078 5,045 21,542
Cash paidAdvances paid -17 -17 -17 -17Borrowings repaid -3,191 -18,397 -3,285 -19,990Deposits paid - - - -Other financing payments -106 -448 -9 -188Total cash paid -3,314 -18,862 -3,311 -20,194NET CASH FLOWS FROM FINANCING ACTIVITIES 1,940 2,217 1,734 1,348Net increase in cash and cash equivalents -608 2,284 -1,178 -1,863Cash and cash equivalents at beginning of the period 11,601 8,710 9,888 10,573Cash and cash equivalents at end of the period 10,994 10,994 8,710 8,710
KEY FISCAL AGGREGATES
Net cash flows from operating activities 447 5,670 701 3,386Net cash flows from investing in non-financial assets -1,470 -3,453 -1,237 -4,310Cash surplus/-deficit -1,024 2,217 -536 -924
2018-192019-20

2019-20 Annual Report on State F inances
222

223
A P P E N D I X 7
Public Ledger
The Public Ledger, established by section 7 of the Financial Management Act 2006 (FMA), includes those transactions and operations that are conducted through the Consolidated Account, the Treasurer’s Advance Account and the Treasurer’s Special Purpose Accounts (TSPAs). Together with agency cash balances held at Treasury, the total of these accounts form the Public Bank Account.
Table 7.1 PUBLIC LEDGER BALANCES AT 30 JUNE
(a) The balance of the Consolidated Account at 30 June 2020 includes non-cash appropriations of $14,342 million
(30 June 2019: $13,128 million), representing the non-cash cost of agency services. These appropriations are credited to agency Holding Accounts that are included in the TSPAs balance. In cash terms, the Consolidated Account was in a $3,292 million deficit position at 30 June 2020 (compared with a deficit position of $3,502 million at 30 June 2019).
Note: Columns/rows may not add due to rounding.
Consolidated Account
The Constitution Act 1889 requires that all revenue of the Crown that is not permanently appropriated by legislation to another entity, shall be credited to the Consolidated Account. The Act also requires that payments out of the Account must be appropriated by the Parliament.
Accordingly, Consolidated Account revenue is not available for use by agencies that collect it, and such receipts must be paid directly to the credit of the Account. Expenditure is authorised by the Parliament, with both the amount and the expressed purpose of the associated appropriation clearly specified.
2020 2019 Variance$m $m $m
THE PUBLIC LEDGER
Consolidated Account (a) -17,634 -16,630 -1,003Treasurer's Special Purpose Accounts 17,156 15,838 1,318Treasurer’s Advance Account – Net Advances and Overdraw n Trusts -6 -15 9TOTAL -484 -807 323
Agency Special Purpose Accounts 6,726 5,641 1,085TOTAL PUBLIC BANK ACCOUNT 6,242 4,833 1,408

2019-20 Annual Report on State F inances
224
The Consolidated Account was in an accumulated accrual deficit position of $17,634 million at 30 June 2020, an increase of $1 billion on the accumulated deficit at 30 June 2019. This included $14,342 million associated with accrual (non-cash) appropriations for depreciation and leave entitlements, matched by equivalent non-cash balances in agency Holding Accounts (see following table).
In cash terms, the Consolidated Account had an accumulated deficit of $3,292 million at 30 June 2020. This compares with a $3,502 million deficit cash balance at 30 June 2019. Receipts totalled $25.9 billion in 2019-20, up $4,310 million on 2018-19, mainly due to higher iron ore royalty collections (up $2,917 million) and proceeds of borrowing (up $777 million). Consolidated Account spending (including accrual appropriations and other cash transactions) totalled $26.9 billion in 2019-20, an increase of $2,551 million on 2018-19 (mainly due to higher service appropriations (up $1,039 million) and debt repayments (up $881 million)).
State borrowings held by the Consolidated Account decreased by a net $540 million in 2019-20 and totalled $25.4 billion at 30 June 2020 (compared with $26 billion in June 2019). New borrowings increased by $777 million in the year while a total of $1,318 million was repaid (comprising $1,248 million in GST ‘top-up’ funding and $70 million in surplus capital returned to the Consolidated Account by RiskCover). Total proceeds from gross borrowings (i.e. excluding repayments of borrowings) stood at $27.4 billion at 30 June 2020 and remain below the $34.5 billion cumulative limit approved by the Loan Act 2017 and preceding Loan Acts1.
Further detail on the broader impact of these issues on the whole-of-government is available in the Financial Results chapter.
1 Proceeds of borrowings by the Consolidated Account (i.e. gross borrowings excluding debt repayments) cannot
exceed the cumulative limit authorised by the Loan Acts.

Appendix 7
225
Table 7.2 CONSOLIDATED ACCOUNT TRANSACTIONS
(a) Amount less than $500,000.
Note: Columns/rows may not add due to rounding.
2020 2019 Variance$m $m $m
REVENUEOperating Activities
Taxation 6,971 6,995 -24Commonw ealth grants 4,991 4,605 386Government enterprises 2,494 2,290 203Revenue from other agencies 9,960 6,909 3,051Other receipts 716 795 -80
Total Operating Activities 25,131 21,595 3,536
Financing ActivitiesRepayments of recoverable advances 7 7 -(a)
Borrow ings 777 - 777Other receipts 8 12 -4
Total Financing Activities 793 19 774
TOTAL REVENUE 25,924 21,614 4,310EXPENDITURERecurrent
Authorised by other statutes 2,594 2,602 -8Appropriation Act (No. 1) 20,019 18,981 1,039Recurrent expenditure under the Treasurer’s Advance 795 372 423
Total Recurrent Expenditure 23,409 21,955 1,454
Investing ActivitiesAuthorised by other statutes 259 301 -42Appropriation Act (No. 2) 1,913 1,659 254Investing expenditure under the Treasurer’s Advance 23 14 9
Total Investing Activities 2,194 1,974 220
Financing ActivitiesLoan repayments 1,318 437 881Other f inancing 7 11 -4
Total Financing Activities 1,324 447 877
TOTAL EXPENDITURE 26,927 24,376 2,551NET MOVEMENT (REVENUE LESS EXPENDITURE) -1,003 -2,763 1,759Consolidated Account Balance
Opening balance at 1 July -16,630 -13,868 -2,763Closing balance at 30 June -17,634 -16,630 -1,003
Of w hich:Appropriations payable -14,342 -13,128 -1,214Cash balance at 30 June -3,292 -3,502 210

2019-20 Annual Report on State F inances
226
Treasurer’s Special Purpose Accounts
The Treasurer’s Special Purpose Accounts (TSPAs) consist of:
• any account established by the Treasurer as a TSPA for the purposes determined by the Treasurer;
• suspense accounts established for the purposes of section 26 of the FMA;
• any account established to hold money transferred under section 39(5) of the FMA;
• the Public Bank Account Interest Earned Account, established for the purpose of holding money credited to that account under section 38(9) of the FMA pending its allocation and payment as required or permitted under the FMA or another written law;
• any account established under written law and determined by the Treasurer to be a TSPA; and
• any other account established to hold money and determined by the Treasurer to be a TSPA.
Relative to 30 June 2019, an aggregate increase of $1,318 million in TSPA balances at 30 June 2020 mainly reflects:
• higher Holding Account balances for non-cash accrual appropriations to agencies for depreciation and accrued leave entitlements (up $1,214 million);
• an increase in the balance of the Western Australian Future Health Research and Innovation Fund (previously the Western Australian Future Fund, see Appendix 5), reflecting appropriation of 1% of forecast annual royalty receipts ($64 million) and interest earnings on the balance of the Fund for the year to date ($31 million); and
• an increase in the balance of agency accounts that hold cash for the cost of an extra pay period which falls due every 11 years (up $50 million).
A number of these TSPAs and other agency accounts are discussed in Appendix 5: Special Purpose Accounts.
The following table summarises the position of TSPAs at 30 June 2020 and 2019.
Table 7.3 TREASURER’S SPECIAL PURPOSE ACCOUNTS AT 30 JUNE
Note: Columns/rows may not add due to rounding.
2020 2019 Variance$m $m $m
Agency Holding Accounts 14,342 13,128 1,214Royalties for Regions Fund 1,000 1,000 -Western Australian Future Health Research and Innovation Fund 1,408 1,313 95Agency 27th Pay Accounts 180 130 50National Redress Scheme and Civil Litigation for Survivors of Institutional Child Sexual 141 151 -11 Abuse AccountOther Special Purpose Accounts 85 116 -30
TREASURER'S SPECIAL PURPOSE ACCOUNTS AT 30 JUNE 17,156 15,838 1,318

Appendix 7
227
Treasurer’s Advance
The Treasurer’s Advance allows for repayable advances to agencies for working capital purposes (known as ‘net recoverable advances’), a short-term advance for any overdrawn agency Special Purpose Accounts, and the provision of supplementary appropriation funding for unforeseen and/or extraordinary events during the year (known as ‘excesses and new items’).
A total of $1,658.4 million was authorised for the year ended 30 June 2020. The original $658.4 million authority (established by section 29 of the FMA) was increased by $1 billion through the passage of the Treasurer’s Advance Authorisation Amendment Act 2020 which provided for additional spending expected to emerge as a result of the COVID-19 pandemic response.
Of the revised authorised limit, $824.5 million was drawn down in 2019-20. This included $818.3 million for excesses and new items (which are included in the Consolidated Account outcome detailed earlier in this appendix). The remaining $6.2 million was drawn against net recoverable advances as shown in the following table.
Table 7.4 TREASURER’S ADVANCE AT 30 JUNE
Note: Columns/rows may not add due to rounding.
Transfers, Excesses and New Items
The following table summarises transfers of appropriations between agencies (and which have no impact on the Treasurer’s Advance), and excesses and/or new items approved by the Treasurer under the authority of section 27 of the FMA.
2020 2019 Variance$m $m $m
AUTHORISED LIMIT 1,658.4 652.2 1,006.2Total Drawn Against Treasurer’s Advance Account 824.5 401.6 422.9Comprising:
Net recoverable advances as at 30 June (see below ) 6.2 15.0 -8.8Overdraw n Special Purpose Accounts - - -Excesses and New Items - recurrent 795.4 372.4 423.0- capital 22.9 14.2 8.7
NET RECOVERABLE ADVANCESMines Safety - 8.0 -8.0Petroleum and Geothermal Energy Safety 2.0 2.0 -Sport and Recreation 1.0 1.1 -0.1Suitors Fund 2.5 2.5 -Sundry Debtors 0.7 1.4 -0.7TOTAL RECOVERABLE TREASURER’S ADVANCES 6.2 15.0 -8.8

2019-20 Annual Report on State F inances
228
Table 7.5 TRANSFERS, EXCESSES AND NEW ITEMS
For the Twelve Months to 30 June 2020
Note: Columns/rows may not add due to rounding.
NewItems
$m $m $m $m $m $mRecurrent Appropriations
Parliamentary Commissioner for Administrative InvestigationsItem 4: Delivery of Services 7.4 0.6 - - 8.1 -
Premier and CabinetItem 5: Delivery of Services 142.5 - - 1.9 144.4 1.7
TreasuryItem 14: Delivery of Services 79.6 -20.3 - 1.9 61.1 -Item 15: Bunbury Water Corporation 0.7 - - 0.1 0.8 0.1Item 17: Electricity Generation and Retail 129.9 - - 486.4 616.4 443.2 Corporation (Synergy)Item 19: Public Transport Authority 872.0 - - 30.6 902.6 29.6Item 20: Regional Pow er Corporation 18.9 - - 18.7 37.5 17.5 (Horizon Pow er)Item 21: Southern Ports Authority 27.8 - - 2.6 30.4 2.6Item 23: Western Australian Land Authority 79.1 - - 7.5 86.6 -Item 27: Metropolitan Redevelopment Authority 20.9 - - 0.7 21.6 0.4Item 30: Provision for Voluntary Targeted 15.5 -6.5 - - 9.0 - Separation SchemeItem 36: WA Health 0.9 - - 2.8 3.7 2.8
Office of the Auditor GeneralItem 39: Delivery of Services 7.8 - - 0.6 8.4 0.6
Jobs, Tourism, Science and Innovation Item 42: Delivery of Services 152.4 0.4 - 3.6 156.4 3.6
Primary Industries and Regional DevelopmentItem 44: Delivery of Services 163.6 -0.4 - 29.6 192.9 27.0
Mines, Industry Regulation and SafetyItem 46: Delivery of Services 124.3 - - 10.6 134.9 10.6
WA HealthItem 51: Delivery of Services 4,979.4 -0.6 - 89.0 5,067.7 89.0
Western Australia Police ForceItem 59: Delivery of Services 1,384.5 - - 19.3 1,403.8 19.3Item 60: Amount Provided for Administered 16.1 - - 0.1 16.2 0.1 Grants, Subsidies and Other Transfer PaymentsJusticeItem 61: Delivery of Services 1,255.6 - - 24.1 1,279.7 24.1
Fire and Emergency ServicesItem 62: Delivery of Services 23.7 - - 26.4 50.1 26.4
Office of the Director of Public ProsecutionsItem 64: Delivery of Services 37.7 - - 0.5 38.3 0.5
Chemistry Centre (WA)Item 66: Delivery of Services 5.0 - - 2.7 7.8 2.7
CommunitiesItem 69: Delivery of Services 1,768.0 6.5 - - 1,774.4 -
Local Government, Sport and Cultural IndustriesItem 72: Art Gallery of Western Australia 8.1 - - 0.2 8.3 0.2Item 75: Perth Theatre Trust 9.3 - - 2.5 11.7 2.5Item 76: Western Australian Museum 24.1 - - 0.7 24.8 -Item 77: Amount Provided for Administered 38.4 - - 26.3 64.7 24.1
Budget Transfers (a)
Treasurer's Advance
Revised Appropriation
Approved Excesses
Draw n against
Treasurer's Advance to
date

Appendix 7
229
Table 7.5 (cont.) TRANSFERS, EXCESSES AND NEW ITEMS
For the Twelve Months to 30 June 2020
(a) Authorised under section 25 of the FMA. (b) Amount less than $50,000.
Note: Columns/rows may not add due to rounding.
NewItems
$m $m $m $m $m $m
Western Australian Sports Centre TrustItem 78: Delivery of Services 95.2 - - 21.8 117.0 21.5
TransportItem 79: Delivery of Services 204.7 - - 35.0 239.7 20.6
Biodiversity, Conservation and AttractionsItem 83: Delivery of Services 238.2 - - 26.2 264.3 20.4
Western Australian Land Information AuthorityItem 86: Delivery of Services 33.4 - - 0.5 33.9 0.5
National Trust of Australia (WA)Item 88: Delivery of Services 3.1 - - 0.3 3.4 0.3
Energy Policy WANew Item: Delivery of Services - 20.3 - - 20.3 -
Infrastructure WANew Item: Delivery of Services - - 4.1 - 4.1 3.9
Total Recurrent - 4.1 873.0 795.4
Capital Appropriations
Governor's EstablishmentItem 95: Capital Appropriation - (b) - - 0.2 0.2 0.2
TreasuryItem 101: Capital Appropriation 0.3 -0.1 - - 0.3 -Item 102: Animal Resources Authority 0.8 - - 0.5 1.3 0.5Item 106: Department of Justice 65.0 - - 12.7 77.8 7.2Item 110: Kimberley Ports Authority 5.9 - - 3.3 9.2 3.3
Jobs, Tourism, Science and Innovation Item 121: Capital Appropriation 0.2 - - 0.1 0.3 0.1
Primary Industries and Regional DevelopmentItem 122: Capital Appropriation 16.5 - - 3.7 20.2 -
WA HealthItem 125: Capital Appropriation 202.2 - - 5.8 208.0 5.8
Local Government, Sport and Cultural IndustriesItem 137: Capital Appropriation 87.9 - - 1.4 89.3 1.4
Western Australian Land Information AuthorityNew Item : Capital Appropriation - - 4.4 - 4.4 4.4
Energy Policy WANew Item : Capital Appropriation - 0.1 - - 0.1 -
Infrastructure WANew Item : Capital Appropriation - - 0.1 - 0.1 -
Total Capital - 4.5 27.7 22.9
TOTAL 818.3
Budget Transfers (a)
Treasurer's Advance
Revised Appropriation
Approved Excesses
Draw n against
Treasurer's Advance to
date

2019-20 Annual Report on State F inances
230
Transfers
Transfers of appropriation funds are for the provision of an approved service which is now delivered by an alternative agency. These transfers are authorised under section 25 of the FMA or by specific enabling legislation, and do not impact the Treasurer’s Advance.
In 2019-20, appropriation transfers included:
• $20.4 million (including both recurrent and capital appropriation) transferred from the Department of Treasury to Energy Policy WA (EPWA), involving functions of the former Public Utilities Office and the Energy Transformation Implementation Unit being transferred from Treasury to EPWA. EPWA was established as a sub-department of the Department of Mines, Industry Regulation and Safety on 5 September 2019;
• $6.5 million from the provision for the Voluntary Targeted Separation Scheme (VTSS, administered by Treasury) to the Department of Communities, as a result of the State’s ongoing transition to the Commonwealth-administered National Disability Insurance Scheme;
• $0.6 million from WA Health to the Parliamentary Commissioner for Administrative Investigations (the Ombudsman) to enable the Ombudsman to undertake the Expanded Child Death Review Function in 2019-20; and
• $0.4 million from the Department of Primary Industries and Regional Development to the Department of Jobs, Tourism, Science and Innovation for the transfer of the Renewable Hydrogen Fund and associated Unit and Strategy.
Excesses and New Items
Funds drawn against the Treasurer’s Advance for excesses and new items were for the purposes outlined below. Further detail is available in the annual reports of the listed agencies. Unless otherwise stated, the approved funding was drawn in full by 30 June 2020.
Premier and Cabinet
Item 5: Delivery of Services ($1.9 million), reflecting funding for the COVID-19 pandemic communication campaign ($3 million), increased funding for the annual Telethon donation ($2.5 million), an adjustment to realign general salaries (funded from the department’s service appropriation) and Salaries and Allowances Act 1975 funding ($0.5 million), grant funding for the Activate Perth initiative ($0.2 million) and the Remote Communities Economic Transformation project ($0.2 million). These costs were partially offset by the reallocation of appropriation funding to Infrastructure WA following its establishment as a statutory authority on 25 July 2019 ($3.5 million) and lower than expected costs under AASB 16: Leases ($1.1 million). Of the approved excess, only $1.7 million was drawn as the approved Remote Communities Economic Transformation project funding was delayed due to the COVID-19 pandemic.

Appendix 7
231
Treasury
Item 14: Delivery of Services ($1.9 million), approved mainly for costs associated with the transaction to partially commercialise Landgate ($5.2 million), partially offset by lower funding due to delays with the proposed sale of the TAB ($1.8 million) and reflows of other projects ($1.5 million). The approved increase was not subsequently required as a result of lower than expected costs for the Landgate transaction ($1.1 million) and lower costs related to the implementation of AASB 16: Leases ($2.9 million).
Item 15: Bunbury Water Corporation ($0.1 million), reflecting additional operating subsidy totalling $60,000 to meet higher than expected customer rebates incurred in 2018-19. The final outcome for customer rebates is not known until the accounts for the financial year are prepared after 30 June each year.
Item 17: Electricity Generation and Retail Corporation (Synergy) ($486.4 million), primarily to meet the cost of COVID-19 response measures (being the WA Government Small Business and Charity Tariff Offset and a one-off doubling of the Energy Assistance Payment). Funding was also provided for a range of cost recovery shortfalls that Synergy is currently unable to collect. The operating subsidy was not fully drawn down due to a reduction to the overall cost of the Tariff Offset measure (down $32.2 million).
Item 19: Public Transport Authority ($30.6 million), mainly in response to reduced own-source revenue as a result of lower public transport patronage due to the COVID-19 pandemic, and increased cleaning on buses, trains, ferries, road coaches, school buses, stations, facilities and offices (to reduce the risk of virus transmission). Of this total, $29.6 million was drawn in 2019-20 reflecting lower than expected actual cost outcomes.
Item 20: Regional Power Corporation (Horizon Power) ($18.7 million), reflecting additional operating subsidy approved for the WA Small Business and Charity Tariff Offset, Remote Essential Service Subsidy and doubling of the Energy Assistance Payment. A total of $1.1 million was not drawn against the approved funding for the Tariff Offset.
Item 21: Southern Ports Authority ($2.6 million), mainly for an increase in operating subsidy approved as part of the 2019-20 Mid-year Review, reflecting timing changes for port throughput and associated revisions to revenue and expenditure for the Government Support Package for Koolyanobbing Iron Ore.
Item 23: Western Australian Land Authority ($7.5 million), reflecting an additional operating subsidy provided in 2019-20 in support of the East Perth Power Station redevelopment project ($6.1 million) and the Government’s Rent Relief for Small Business initiative to support small business tenants ($1.3 million) during the pandemic. This funding was not subsequently drawn down following underspends in other projects, including Forrestdale Business Park West and Subiaco East Demolition works.
Item 27: Metropolitan Redevelopment Authority ($0.7 million), mainly for detailed planning work for the redevelopment of the East Perth Power Station site ($600,000) and venue hire fees at Elizabeth Quay ($71,000). A lower than expected drawn down ($367,000) reflected the impact of corporate service cost savings.

2019-20 Annual Report on State F inances
232
Item 36: WA Health ($2.8 million), reflecting the net impact of higher funding totalling $3.7 million to support transition costs associated with the insourcing of non-clinical patient support services at Fiona Stanley Hospital, partially offset by delayed funding of $0.9 million following delays with the Medical Imaging System replacement project.
Item 102: Animal Resources Authority ($0.5 million), with additional funding to manage COVID-19 impacts on operations ($250,000), capital works costs ($200,000) and to meet contractual payments for the Authority’s steriliser ($56,000).
Item 106: Department of Justice ($12.7 million), to address the cost of delivering the Custodial Infrastructure Program. Of the approved increase, $7.2 million was drawn due to timing changes for works that are now expected to be progressed in 2020-21.
Item 110: Kimberley Ports Authority ($3.3 million), reflecting an additional equity contribution of $3.3 million to fund the impact of the COVID-19 pandemic on cashflows and the establishment of First Point of Entry facilities for cruise vessels at the Port of Broome, to comply with the Commonwealth Biosecurity Act 2015.
Office of the Auditor General
Item 39: Delivery of Services ($0.6 million), to establish a forensic audit function and enhance the Office’s data analytics capability. The newly created audit branch will conduct targeted investigations of public sector agency accounts and matters related to public money, including contract management and systems.
Jobs, Tourism, Science and Innovation
Item 42: Delivery of Services ($3.6 million), with this funding to support the Tourism Recovery Program ($6.9 million), costs to expand Defence West and the Full Cycle Docking education campaign ($1.6 million), delivery of the metropolitan component of the Brand WA strategic marketing campaign ($966,000), employment costs of staff acting in Salaries and Allowances Tribunal determined positions ($549,000), sponsorship of the Resources Technology Showcase event ($500,000), reduced agency own-source revenue as a result of COVID-19 ($189,000) and reduced rent revenue as a result of the Government’s decision to waive rent owed to State government agencies ($90,000). These increases were partially offset by a reflow of tourism initiatives ($6.6 million) and science grants ($407,000), and a reduction in costs for leased vehicles ($107,000).
Item 121: Capital Appropriation ($0.1 million), to meet capital repayments for leased vehicles following implementation of AASB 16: Leases.

Appendix 7
233
Primary Industries and Regional Development
Item 44: Delivery of Services ($29.6 million), reflecting funding for the Broome Chinatown Revitalisation project, compensation payments for Abalone Managed Fishery scheme applicants following the establishment of the Ngari Capes Marine Park, support for the Renewable Hydrogen Strategy, upgrades to the laboratory facilities at the department’s South Perth site, voluntary separation payments, emergency management response incidents impacting the agricultural industry sector, rent relief to the property service provider at the Coral Bay Workers Accommodation Village, and to meet the waiver of various licence and registration fees due to the COVID-19 pandemic. These increases were partially offset by lower than expected costs associated with implementing AASB 16: Leases, which resulted in $27 million of the approved excess being drawn.
Item 122: Capital Appropriation ($3.7 million), to meet the loan repayment on the Fisheries Adjustment Scheme Loan. The approved excess was not drawn, largely due to a Government decision to restructure the Scheme.
Mines, Industry Regulation and Safety
Item 46: Delivery of Services ($10.6 million), reflecting additional funding to address lower industry revenue, the waiver of various occupational and business license fees due to the COVID-19 pandemic, additional staff to increase the operational capacity of the WorkSafe Division, and to meet other initiatives. These increases were partially offset by lower AASB 16: Leases costs.
WA Health
Item 51: Delivery of Services ($89 million), primarily due to increased funding requirements for hospital and non-hospital services ($45.6 million), funding for the purchase of COVID-19 related medical equipment, personal protective equipment and medical supplies ($35.5 million), funding for high priority maintenance projects ($20.1 million), payment for Western Australian residents receiving treatment in other jurisdictions’ hospitals ($10.6 million) and to meet lower Commonwealth funding under the National Health Reform Agreement ($9.6 million). These funding increases were partially offset by a decrease in appropriation for AASB 16: Leases costs ($31.8 million).
Item 125: Capital Appropriation ($5.8 million), primarily for the purchase of medical equipment related to COVID-19 ($14.5 million) and changes to lease costs under AASB 16: Leases. These costs were partially offset by a number of project deferrals.
Western Australia Police Force
Item 59: Delivery of Services ($19.3 million), primarily due to additional funding for the response to the COVID-19 pandemic ($25.1 million), commencement of the rollout of body armour to all deployable police officers ($6.3 million), a boost to police resources for the summer crime and safety operation ($5 million), partially offset by a lower than expected funding requirement for depreciation and for the cost of implementing AASB 16: Leases.
Item 60: Amount Provided for Administered Grants, Subsidies, and Other Transfer Payments ($0.1 million), for final payments relating to the Western Australia Medically Retired Police Redress Scheme.

2019-20 Annual Report on State F inances
234
Justice
Item 61: Delivery of Services ($24.1 million), with increased funding of $54.7 million required to meet higher than forecast cost and demand pressures for Justice and Legal Aid ($33.4 million and $1.6 million respectively), service and staffing costs for the Casuarina Prison Alcohol and Other Drugs Rehabilitation and Treatment Service ($1.8 million), establishment of the High Risk Offenders Board ($1.1 million), contract costs at Acacia Prison ($1 million), payments totalling $4.2 million for the use of copyright material, Act of Grace and mesothelioma claims, and legal costs incurred by the State Solicitor’s Office, COVID-19 related costs ($3.5 million), funding to meet additional Legal Aid costs for State-indictable matters, expensive cases and related items ($6.1 million), and a range of other minor costs totalling $2 million. These increases were partially offset by lower AASB 16: Leases costs ($25.9 million) and lower depreciation charges ($4.7 million).
Fire and Emergency Services
Item 62: Delivery of Services ($26.4 million), to meet unbudgeted bushfire suppression costs for significant fire incidents, including those at Esperance, Forrestania, Katanning, Norseman, Stirling Range National Park, and Yanchep ($25.6 million), and additional support to State Emergency Services volunteers whilst responding to severe weather events, including tropical cyclones Damien and Blake ($801,000).
Office of the Director of Public Prosecutions
Item 64: Delivery of Services ($0.5 million), reflecting higher than forecast growth in core prosecution services ($607,000), a reclassification of Asset Investment Program spending to recurrent expense for information and computing technology contracts ($200,000) and AASB 16: Leases costs for State Fleet vehicles ($7,000). These impacts were partially offset by lower office accommodation lease costs and movements in depreciation costs.
Chemistry Centre (WA)
Item 66: Delivery of Services ($2.7 million), to meet own-source revenue shortfalls and some temporary increases in operating costs (including funding the recruitment process for a new chief executive officer and the costs of voluntary separations).
Local Government, Sport and Cultural Industries
Item 72: Art Gallery of Western Australia ($0.2 million), reflecting an own-source revenue write-down, mainly due to the closure of the Art Gallery as a result of COVID-19.
Item 75: Perth Theatre Trust ($2.5 million), reflecting an own-source revenue write-down, mainly due to event cancellations as a result of COVID-19.
Item 76: Western Australian Museum ($0.7 million), reflecting an own-source revenue write-down, mainly due to the closure of the Maritime Museum and the Submarine in Fremantle, and Brig Amity in Albany, following the onset of the COVID-19 pandemic. The approved excess was not drawn, largely due to an accounting change that reclassified recurrent appropriation to capital purposes ($0.8 million).

Appendix 7
235
Item 77: Amount Provided for Administered Grants, Subsidies and Other Transfer Payments ($26.3 million), for the Land Tax Assistance for Landlords Program to assist commercial landlords and their small business tenants financially affected by the COVID-19 pandemic ($25 million), and to pay the anticipated shortfall in the Gambling Tax Rebate payable to Lotterywest ($1.3 million). Of the approved excess, $24.1 million was drawn down in 2019-20 due to a $2.2 million underspend for Gambling Tax Rebates to Lotterywest and Race Betting.
Item 137: Capital Appropriation ($1.4 million), primarily to deliver fit-out of the exhibition galleries at the new Museum ($5 million), partially offset by lower AASB 16: Leases costs ($3.4 million) and the reclassification of capital appropriation to recurrent purposes for the new Museum ($0.2 million).
Western Australian Sports Centre Trust
Item 78: Delivery of Services ($21.8 million), reflecting funding provided due to the impact of pandemic-related revenue losses resulting from the closure of the Western Australian Sports Centre Trust’s venues, the subsequent staged re-opening of venues at lower capacity, the cancellation of scheduled events, border restrictions and accounting treatment changes. Of the approved excess, $21.5 million was drawn.
Transport
Item 79: Delivery of Services ($35 million) to fund settlement of an outstanding claim against the State. Of the approved excess, $20.6 million was drawn due to the reflow of a range of projects to 2020-21.
Biodiversity, Conservation and Attractions
Item 83: Delivery of Services ($26.2 million) to meet increased bushfire suppression expenditure ($8.9 million) and lower own-source revenue ($17.3 million) due to COVID-19 related impacts on service delivery. Of the approved excess, $20.4 million was drawn, mainly due to better than expected revenue outcomes following the reopening of attractions in June 2020 and lower than expected costs under AASB 16: Leases.
Western Australian Land Information Authority
Item 86: Delivery of Services ($0.5 million), reflecting additional funding to meet costs associated with the contract management of the Commercialised Services Agreement following the partial commercialisation of Landgate. The approved excess was partially offset by savings of $17,000 with the termination of a premises lease agreement as part of the government office accommodation reform program.
New Item: Capital Appropriation ($4.4 million), reflecting replacement funding for continuing information technology asset enhancement and core systems development to support Landgate’s evolving business needs.

2019-20 Annual Report on State F inances
236
National Trust of Australia (WA)
Item 88: Delivery of Services ($0.3 million), to compensate for the loss of income resulting from the Government’s rent waiver initiative ($180,000) and the impact of foregone own-source revenue following the closure of facilities during the COVID-19 pandemic ($119,000).
Infrastructure WA
New Item: Delivery of Services ($4.1 million), for the establishment of Infrastructure WA as a statutory authority on 25 July 2019. Of the approved excess, $3.9 million was drawn down to reflect an adjustment to realign salary funding to be met under the Salaries and Allowances Act 1975.
New Item: Capital Appropriation ($0.1 million), to reflect the establishment of the new agency’s capital budget. The approved excess was not drawn down due to lower than expected costs under AASB 16: Leases.
Governor’s Establishment
Item 95: Capital Appropriation ($0.2 million), which includes $12,000 to meet capital repayments for leased vehicles in accordance with AASB 16: Leases and $165,000 for the purchase and installation of the commemorative statue of Fanny Balbuk in the gardens of Government House.

237
A P P E N D I X 8
General Government Sector Salaries
Introduction
Salaries are the single largest component of general government sector expenses (42% in 2019-20, or 46% if concurrent superannuation costs are also included).
In 2019-20, general government salaries expenditure grew by 5.0% to total $12,887 million. This includes increases in workforce numbers particularly in health, education, law and order, and community services, as well as increases in wage rates consistent with the Government’s $1,000 per year wages policy.
The following table summarises salaries outcomes for general government agencies for 2019-20.
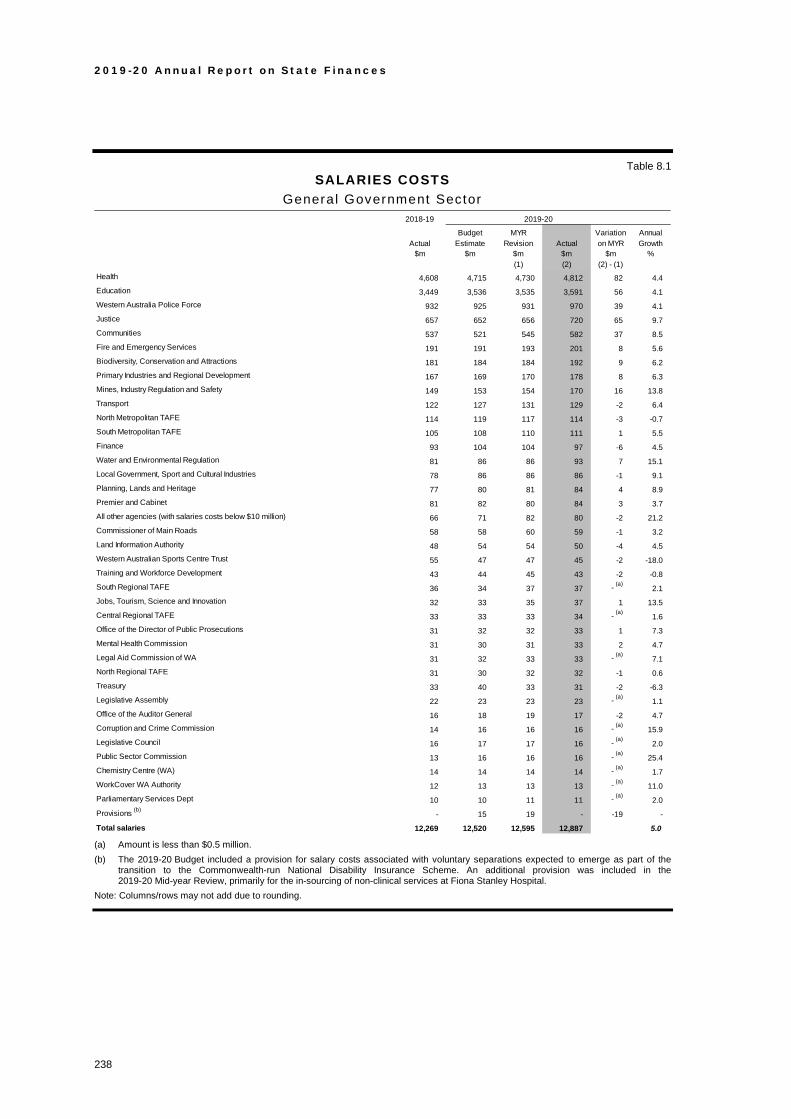
2019-20 Annual Report on State F inances
238
Table 8.1 SALARIES COSTS
General Government Sector
(a) Amount is less than $0.5 million. (b) The 2019-20 Budget included a provision for salary costs associated with voluntary separations expected to emerge as part of the
transition to the Commonwealth-run National Disability Insurance Scheme. An additional provision was included in the 2019-20 Mid-year Review, primarily for the in-sourcing of non-clinical services at Fiona Stanley Hospital.
Note: Columns/rows may not add due to rounding.
2018-19
Budget MYR Variation AnnualActual Estimate Revision Actual on MYR Growth
$m $m $m $m $m %(1) (2) (2) - (1)
Health 4,608 4,715 4,730 4,812 82 4.4 Education 3,449 3,536 3,535 3,591 56 4.1 Western Australia Police Force 932 925 931 970 39 4.1 Justice 657 652 656 720 65 9.7 Communities 537 521 545 582 37 8.5 Fire and Emergency Services 191 191 193 201 8 5.6 Biodiversity, Conservation and Attractions 181 184 184 192 9 6.2 Primary Industries and Regional Development 167 169 170 178 8 6.3 Mines, Industry Regulation and Safety 149 153 154 170 16 13.8 Transport 122 127 131 129 -2 6.4 North Metropolitan TAFE 114 119 117 114 -3 -0.7 South Metropolitan TAFE 105 108 110 111 1 5.5 Finance 93 104 104 97 -6 4.5 Water and Environmental Regulation 81 86 86 93 7 15.1 Local Government, Sport and Cultural Industries 78 86 86 86 -1 9.1 Planning, Lands and Heritage 77 80 81 84 4 8.9 Premier and Cabinet 81 82 80 84 3 3.7 All other agencies (with salaries costs below $10 million) 66 71 82 80 -2 21.2 Commissioner of Main Roads 58 58 60 59 -1 3.2 Land Information Authority 48 54 54 50 -4 4.5 Western Australian Sports Centre Trust 55 47 47 45 -2 -18.0 Training and Workforce Development 43 44 45 43 -2 -0.8 South Regional TAFE 36 34 37 37 - (a)
2.1 Jobs, Tourism, Science and Innovation 32 33 35 37 1 13.5 Central Regional TAFE 33 33 33 34 - (a)
1.6 Office of the Director of Public Prosecutions 31 32 32 33 1 7.3 Mental Health Commission 31 30 31 33 2 4.7 Legal Aid Commission of WA 31 32 33 33 - (a)
7.1 North Regional TAFE 31 30 32 32 -1 0.6 Treasury 33 40 33 31 -2 -6.3 Legislative Assembly 22 23 23 23 - (a)
1.1 Office of the Auditor General 16 18 19 17 -2 4.7 Corruption and Crime Commission 14 16 16 16 - (a)
15.9 Legislative Council 16 17 17 16 - (a)
2.0 Public Sector Commission 13 16 16 16 - (a)
25.4 Chemistry Centre (WA) 14 14 14 14 - (a)
1.7 WorkCover WA Authority 12 13 13 13 - (a)
11.0 Parliamentary Services Dept 10 10 11 11 - (a)
2.0 Provisions (b)
- 15 19 - -19 -
Total salaries 12,269 12,520 12,595 12,887 5.0
2019-20

239
A P P E N D I X 9
Expense Limit Outcomes
Introduction
In headline terms, general government expenses increased by 5% in 2019-20, slightly above the decade average of 4.8%. This included increased spending in immediate response to the COVID-19 pandemic. A key part of the Government’s spending management is delivered through the control of approved expense limits that underlie Resource Agreements for appropriation-funded agencies.
The following table summarises expense limit outcomes for agencies with Resource Agreements for the 2019-20 year. Variations from the original 2019-20 Budget estimates are adjusted in the table to exclude accounting remeasurements in end-of-year asset valuations that have impacted expenses.

2019-20 Annual Report on State F inances
240
Table 9.1 TOTAL COST OF SERVICES
Agency Resource Agreements
Note: Columns/rows may not add due to rounding.
Original Budget
Estimate
Mid-yearReview
Revision ActualLess
Remeasurements Adjusted
Actual
Variation on Original Budget
$m $m $m $m $m $m(1) (2) (2) - (1)
Health 9,135 9,224 9,424 53 9,370 236
Education 5,241 5,328 5,359 - 5,359 118
Communities 3,451 3,351 3,305 - 3,305 -146
Justice 1,638 1,646 1,623 - 1,623 -15
Public Transport Authority 1,559 1,634 1,602 - 1,602 43
Western Australia Police Force 1,581 1,610 1,595 - 1,595 14
Finance 1,271 1,272 1,312 1 1,312 41
Commissioner of Main Roads 1,490 1,550 1,244 - 1,244 -246
Mental Health Commission 942 940 947 -(a) 947 5
Biodiversity, Conservation and Attractions 402 404 618 216 402 -(a)
Transport 555 562 560 - 560 5
Training and Workforce Development 578 589 558 - 558 -20
Fire and Emergency Services 449 451 471 - 471 21
Primary Industries and Regional Development 483 501 451 4 447 -36
Local Government, Sport and Cultural Industries 286 351 327 7 320 33
Mines, Industry Regulation and Safety 280 280 287 - 287 7
Western Australian Sports Centre Trust 244 249 244 - 244 -(a)
Jobs, Tourism, Science and Innovation 211 223 200 10 190 -22
Water and Environmental Regulation 177 182 183 - 183 6
Planning, Lands and Heritage 178 188 178 1 177 -1
Premier and Cabinet 158 158 159 - 159 1
Western Australian Planning Commission 50 54 126 47 79 29
Treasury 89 73 60 - 60 -30
Office of the Director of Public Prosecutions 47 48 48 - 48 1
Public Sector Commission 26 27 26 - 26 -(a)
Small Business Development Corporation 15 15 14 - 14 -1
Economic Regulation Authority 15 15 14 - 14 -1
Registrar, Western Australian Industrial Relations Commission 13 13 12 - 12 -1
National Trust of Australia (WA) 8 8 8 - 8 -(a)
Commissioner for Equal Opportunity 4 4 4 - 4 -(a)
Commissioner for Children and Young People 3 3 3 - 3 -(a)
Heritage Council of Western Australia 3 3 1 - 1 -2
Salaries and Allowances Tribunal 1 1 1 - 1 -(a)
Rural Business Development Corporation -(a) -(a) 1 - 1 -(a)
(a) Amounts are less than $0.5 million.
2019-20

241
A P P E N D I X 1 0
Key Technical Terms Used in the Financial Report
Australian Bureau of Statistics Government Finance Statistics Manual
The Australian Bureau of Statistics’ publication Australian System of Government Finance Statistics: Concepts, Sources and Methods 2015 contains a comprehensive and definitive guide to the classification of financial aggregates for National Accounts and GFS purposes.
Advances Paid
Loans acquired for policy rather than liquidity management purposes. These include long and short-term loans, non-marketable debentures and long and short-term promissory agreements (bonds and bills) issued to public sector units for achieving government policy objectives.
Accrual accounting
Accounting method that records revenue and expenses when they are incurred, regardless of when cash is exchanged. The term ‘accrual’ refers to any individual entry recording revenue or expense in the absence of a cash.
Asset Investment Program
Total public sector purchases of non-financial assets (i.e. the State’s infrastructure program).
Balance sheet
A financial statement that presents the financial position of a sector by detailing the stock of assets, liabilities and equity at the end of a reporting period.
Biological Assets
Biological assets may comprise of commercial forests and also any living animal, plant or agricultural produce that is the harvested product of biological assets.

2019-20 Annual Report on State F inances
242
Borrowings
Borrowings refer to interest bearing liabilities mainly raised from public borrowings raised through the Western Australian Treasury Corporation, leases and other interest bearing arrangements. Borrowings exclude liabilities raised from other government entities (including other lease arrangements).
Capital grants (transfers)
Transactions in which the ownership of an asset (other than cash and inventories) is transferred from one institutional unit to another, to enable the recipient to acquire another asset or in which cash is transferred to enable the recipient to acquire an asset other than inventories, for which no economic benefits of equal value are receivable in return.
Cash flow statement
A financial statement that presents a summary of all cash receipts and payments for a sector in a reporting period.
Cash flow from operating activities
Receipts and payments of cash relating to a reporting entity’s operating activities.
Cash flow from investing activities
Relates to the purchase or sale of assets, such as land, buildings and equipment.
Cash flow from financing activities
Shows the cash receipts and payments related to transactions with the providers of finance.
Cash surplus/deficit
Reported in the cash flow statement, the cash surplus/deficit measures the net impact of cash flows (excluding financing activities) during the period. It equals net cash flows from operating activities (things that agencies do on a daily basis as part of their operations) plus net cash flows from the acquisition and disposal of non-financial assets (i.e. infrastructure activities), less distributions paid (i.e. dividends). The Commonwealth refers to this aggregate as the ‘underlying cash balance’ in its publications and is that tier of government’s headline budget measure. A surplus is generally consistent with declining levels of net debt while a deficit indicates a need for more borrowing.
Change in net worth
Change in net worth (also known as comprehensive result) is revenue from transactions less expenses from transactions plus other economic flows and measures the variation in the public sector’s accumulated assets and liabilities.

Appendix 10
243
Classification of the Functions of Government
The Classification of the Functions of Government (COFOG) classifies expenses and acquisitions of non-financial assets of the public sector and general government sector in terms of the purposes for which the transactions are made. As required under AASB 1049, total assets of the State and general government sector are also required to be allocated to this functional classification where possible to do so. The major groups reflect the broad objectives of government and the groups and subgroups details the means by which these broad objectives are met.
Consolidated Account
The Constitution Act 1889 creates the Consolidated Account. Under section 64 of the Constitution Act 1889, all moneys due to the State from taxes, charges, imposts, and other sources, and that are not hypothecated by separate legislation, must be credited to the Consolidated Account and can only be expended if authorised by an Appropriation Act or other statute authorising appropriation. The legislation does not impose any restrictions on the purposes for which the Consolidated Account may be appropriated. See also Public Bank Account below.
Consolidated financial statements
The aggregate financial statements for the whole-of-government (and its sub-sectors), including the financial outcomes of public sector agencies. Transactions, assets and obligations between agencies are eliminated on consolidation.
Consumer Price Index
The Consumer Price Index (CPI) measures changes in the price of a ‘basket’ of goods and services purchased by households. Growth in the CPI is often used as a benchmark estimate of inflation.
Contingent asset
A possible asset that arises from past events and whose existence will be confirmed only by the occurrence or non-occurrence of one or more uncertain future events not wholly within the control of the entity. Contingent assets are not recognised on the balance sheet. For example, the State may expect to receive a cash benefit if it delivers on various obligations in the future.
Contingent liability
A potential financial obligation arising out of a condition, situation, guarantee or indemnity, the ultimate effect of which will be confirmed only on the occurrence or non-occurrence of one or more uncertain future events. Contingent liabilities are not recorded on the balance sheet. Examples include pending legal proceedings and items covered by government guarantees, sureties and indemnities.

2019-20 Annual Report on State F inances
244
Convergence difference
The difference between the amounts recognised in the financial statements (prepared under Australian Accounting Standards) compared with the amounts determined for Government Finance Statistics purposes as a result of differences in definition, recognition, measurement, classification and consolidation principles and rules.
Current grants (transfers)
The provision of something of value for no specific return or consideration (e.g. grants, subsidies and donations).
Derivatives
‘Held for trading’ financial instruments valued at fair value at the balance sheet date, in accordance with AASB 9: Financial Instruments.
Employee expenses
These expenses include all costs related to employment including wages and salaries, fringe benefits tax, leave entitlements, voluntary separation payments, defined benefits superannuation plans and defined contribution superannuation plans.
Expenses
Expenses are defined as transactions that reduce net worth. They represent the cost of day-to-day operations. Purchases of services (other than those that are capitalised as infrastructure) are expenses because the services are consumed when provided and net worth is reduced by the cost of the services. For example, the purchase of labour services (commonly known as ‘salaries’) is an expense.
Financial asset
Any asset that is:
• cash;
• an equity instrument of another entity;
• a contractual right:
− to receive cash or another financial asset from another entity; or
− to exchange financial assets or financial liabilities with another entity under conditions that are potentially favourable to the entity; or
• a contract that will or may be settled in the entity’s own equity instruments and is:
− a non-derivative for which the entity is or may be obliged to receive a variable number of the entity’s own equity instruments; or

Appendix 10
245
− a derivative that will or may be settled other than by the exchange of a fixed amount of cash or another financial asset for a fixed number of the entity’s own equity instruments. For this purpose, the entity’s own equity instruments do not include instruments that are themselves contracts for the future receipt or delivery of the entity’s own equity instruments.
Assets that are highly liquid (such as cash or very short-term investments that convert to cash very easily) are treated as an offset to borrowings and other financial instruments, to derive net debt.
Financial liability
Financial obligations to a third party. Includes deposits held on behalf of third parties, advances (loans) received from the Commonwealth, borrowings (including leases), employee entitlements (such as unfunded superannuation liabilities), accounts payable, etc.
Financial Management Act 2006
The Act that sets out the framework for public sector budgeting in Western Australia.
Fiscal aggregates
Analytical balances that are useful for macroeconomic analysis purposes, including assessing the impact of a government and its sectors on the economy. Key fiscal aggregates defined under ABS Government Finance Statistics manual are required to be disclosed under AASB 1049: Whole of Government and General Government Sector Financial Reporting. They are opening net worth, net operating balance, net lending/-borrowings, change in net worth due to revaluations, change in net worth due to other changes in the volume of assets, total change in net worth, closing net worth, and cash surplus/-deficit.
Forward estimates
Estimates of financial aggregates for future years. These assume that there will be no significant change in government policy and are designed to provide a longer-term perspective to the budget process.
Full-time equivalents
One full-time equivalent staff member is the same as one person working full time for one financial year.
General government sector
Defined in Government Finance Statistics as an entity or group of entities which are mainly engaged in the production of goods and/or services outside the normal market mechanism. Government departments are usually recognised as general government sector agencies.
Government Financial Responsibility Act 2000
Western Australian legislation that establishes a framework for government financial planning with a view to improving government financial outcomes and facilitates public scrutiny of government financial policy and performance.

2019-20 Annual Report on State F inances
246
Government Finance Statistics
Refers to statistics that measure the financial transactions of governments and reflect the impact of those transactions on other sectors of the economy. Government Finance Statistics in Australia are developed by the ABS in conjunction with all governments and are mainly based on international statistical standards developed, in consultation with member countries, by the International Monetary Fund.
Grants and subsidies
Transactions in which one unit provides goods, services, assets (or extinguishes a liability) or labour to another unit without receiving approximately equal value in return. Grants can either be of a current or capital nature (see current grants and capital grants).
While grants to governments may result in the provision of some goods or services to the transferor, they do not give the transferor a claim to receive benefits directly of approximately equal value. Receipt and sacrifice of approximately equal value may occur, but only by coincidence. For this reason, grants are referred to by the AASB as involuntary transfers and are termed non-reciprocal transfers.
Grants can be paid as general purpose grants which refers to grants which are not subject to conditions regarding their use. Alternatively, they may be paid as specific purpose grants which are paid for a particular purpose and/or have conditions attached regarding their use.
Gross borrowing
Loans and debt obligations liabilities, other than advances, created through direct agreements with lenders, the sale of securities and acquisition of leases. Gross borrowing is the largest component of gross debt, used to calculate the State’s net debt.
Gross debt
A component of net debt. Gross debt includes borrowings, deposits held on behalf of third parties and advances (loans) from the Commonwealth. Net debt is derived from gross debt less liquid financial assets.
Gross State Product
Gross State Product (GSP) measures the value of all final goods and services produced within a State. GSP is a common measure of economic growth.
Key fiscal aggregates
Financial aggregates that are important for analysis purposes, including assessing the impact of a government and its sectors on the economy. For example, the net operating balance and net debt which are a focus of the discussion in the Financial Results chapter of this report.

Appendix 10
247
Leases
A contract is, or contains, a lease if the contract conveys the right to control the use of an identified asset for a period of time in exchange for consideration. For example, public sector agencies often lease buildings and vehicles, and record such leased assets on the balance sheets. All related costs and the total remaining lease liability is also recorded in the financial statements. Depending on the nature of arrangement, Public Private Partnerships may be recognised as finance lease arrangements (other borrowings in the Balance Sheet). Finance leases are treated as government debt on the State’s balance sheet.
National partnership payment
A Commonwealth government grant to a State and/or Territory to support the delivery of specified outputs or projects, to facilitate reforms or to reward the delivery of nationally significant reforms. Each National partnership payment is supported by a National Partnership Agreement which defines mutually agreed objectives, outputs and performance benchmarks.
Net acquisition (disposal) of non-financial assets from transactions
Includes purchases (or acquisitions) of non-financial assets less sales (or disposals) of non-financial assets less depreciation plus changes in inventories and other movements in non-financial assets. Purchases and sales (or net acquisitions) of non-financial assets generally include accrued expenses and payables for capital items. Purchases exclude non-produced assets and valuables which are included in other movements in non-financial assets.
Net actuarial gains
Includes actuarial gains and losses on defined benefit superannuation entitlements.
Net cash flows from investments in financial assets (liquidity management purposes)
Includes cash receipts from liquidation or repayment of investments in financial assets for liquidity management purposes less cash payments for such investments. Investment for liquidity management purposes means making funds available to others with no policy intent and with the aim of earning a commercial rate of return.
Net cash flows from investments in financial assets (policy purposes)
Includes cash receipts from the repayment and liquidation of investments in financial assets for policy purposes less cash payments for acquiring financial assets for policy purposes. Acquisition of financial assets for policy purposes is distinguished from investments in financial assets (liquidity management purposes) by the underlying motivation for acquiring the assets. Acquisition of financial assets for policy purposes is motivated by Government policies such as encouraging the development of certain industries or assisting citizens affected by natural disaster.

2019-20 Annual Report on State F inances
248
Net debt
Net debt measures the public sector’s net stock of selected gross financial liabilities less liquid financial assets. Net debt is derived from the balance sheet as the sum of deposits held, advances received, government securities, loans and borrowings (including lease liabilities), less the sum of cash and deposits, advances paid and investments, loans and placements.
Net financial liabilities
Equals total liabilities less financial assets (other than equity in public corporations and other entities). This measure is broader than net debt as it includes significant liabilities, other than borrowings (for example, accrued employee liabilities such as superannuation and long service leave entitlements).
Net financial worth
Measures the public sector’s net holdings of financial assets. It is calculated from the Uniform Presentation Framework balance sheet as financial assets less liabilities. Net financial worth is a broader measure than net debt, as it incorporates provisions (such as superannuation, but excludes depreciation and doubtful debts) as well as holdings of equity. Net financial worth includes all classes of financial assets and liabilities.
Net gain on equity investments in other sector entities
Net gain on equity investments in other sector entities measured at proportional share of the carrying amount of net assets/liabilities represents the net gains relating to the equity held by the general government sector in other sector entities. It arises from a change in the carrying amount of net assets of the subsidiaries. The net gains are measured based on the proportional share of the subsidiary’s carrying amount of net assets/liabilities before elimination of inter-sector balances.
Net lending/borrowing
An operating statement measure that differs from the net operating balance as it includes spending on capital items but excludes depreciation. The net lending/borrowing measure more accurately reflects the cash requirements of the public sector in any given year. A net lending (or fiscal surplus) balance indicates that the public sector is saving more than enough to finance all its investment spending. A net borrowing (or fiscal deficit) position indicates that the public sector’s level of investment is greater than its level of savings.
Net operating balance
This is calculated as income from transactions less expenses from transactions. It is a summary measure of the ongoing sustainability of operations and excludes gains and losses resulting from changes in price levels and other changes in the volume of assets. It is the component of the change in net worth that is due to transactions.

Appendix 10
249
Net worth
It is an economic measure of wealth and provides a relatively comprehensive picture of the public sector’s overall financial position. It is calculated as total assets less total liabilities less shares and other contributed capital. For the general government sector, net worth is assets less liabilities, since shares and contributed capital do not exist for the central government.
Operating statement
A financial statement that presents the operating performance of a reporting entity by detailing all items of revenue and expense recognised as they accrue during a reporting period. Cash flows for these accruing operating activities may occur in the same or subsequent reporting period.
Operating result
A measure of financial performance of the operations for the period. It is the net result of items of revenue, gains and expenses (including losses) recognised for the period, excluding those that are classified as ‘other non-owner movements in equity’.
Other economic flows
The change in the volume or value of assets and liabilities that does not result from operating transactions.
Other revenue
Revenue not elsewhere classified or disclosed.
Public Bank Account
The Public Bank Account (PBA) is administered by the Department of Treasury and forms the central bank account of the Government of Western Australia. The PBA is created by the Financial Management Act 2006, and is divided into component parts and includes the Consolidated Account, Treasurer’s Advance and Treasurer’s Special Purpose Accounts (collectively referred to as the Public Ledger and detailed in Appendix 7 of this report), and agency Special Purpose Accounts.
Public corporations
Those agencies that are primarily operating in a market and seek to recover a substantial portion of their costs through user charges. They comprise public financial corporations and public non-financial corporations (see below).
Public financial corporations sector
The sector comprises government controlled entities mainly engaged in financial activities, such as providing banking and insurance services. They are able to incur financial liabilities on their own account (e.g. taking deposits, issuing securities or providing insurance services).

2019-20 Annual Report on State F inances
250
Public non-financial corporations sector
The public non-financial corporations sector comprises those non-financial public sector agencies engaged mainly in the production of goods and services for sale in the market, with an objective to recover at least a significant proportion of operating costs through charges for goods and services.
Public Private Partnerships
A term used to describe a method of procuring government infrastructure and associated services through private sector involvement. Public Private Partnership (PPPs) create opportunities with the private sector for increasing investment in social and economic infrastructure. The accounting rules for PPPs are complex and are based on case by case circumstances. However, they often result in recognition of a finance lease for the public sector balance sheet (which is a component of gross and net debt).
Revenue
Revenue is defined as operating transactions that increase net worth or are associated with the acquisition of an economic benefit. Examples include tax collections, Commonwealth grants, royalty income, and fees for goods and services.
Right-of-use Asset
Represents a lessee's right to use an asset over the life of a lease. The asset is calculated as the initial amount of the lease liability, plus any lease payments made to the lessor before the lease commencement date, plus any initial direct costs incurred, minus any lease incentives received.
Sales of goods and services
Refers to revenue from the direct provision of goods and services, and includes fees and charges for services rendered, sales of goods and services, fees from regulatory services and work done as an agent for private enterprises. It also includes rental income under operating leases and on produced assets such as buildings and entertainment, but excludes rent income from the use of non-produced assets such as land.
Securities other than shares
Negotiable financial instruments serving as evidence of the obligations to settle by means of providing cash, a financial instrument, or some other item of economic value. The security normally specifies a schedule for interest payments and principal repayments. Examples include bills, bonds and debentures, commercial paper, and securitised mortgage loans.
Superannuation concurrent cost
The current service cost of employees.

Appendix 10
251
Superannuation interest cost
Represents the carrying cost of unfunded superannuation liabilities. Unfunded superannuation is essentially a debt owing to employees which attracts a carrying (or interest) cost. The State of Western Australia now concurrently funds the superannuation costs of almost all of its employees since 1998-99. As a result, superannuation interest costs are anticipated to decline over the next two to three decades as unfunded entitlements are gradually paid out.
Taxation revenue
Taxation revenue represents revenue received from the State’s taxpayers and includes payroll tax, land tax, duties levied principally on conveyances and land transfers, gambling taxes levied mainly on private lotteries and racing, insurance duty relating to compulsory third party policies, motor vehicle taxes, including registration fees and duty on registrations and transfers, levies on statutory corporations in other sectors of government and other taxes, including landfill levies, licence and concession fees.
Tax equivalents regime
The mechanism to ensure that public corporations incur similar tax liabilities as privately owned organisations that are exposed to the tax system. Under these arrangements, greater parity exists between the cost structures of public sector trading entities and the private sector, aiding in the achievement of competitive neutrality.
Total change in net worth
The net result of all items of income and expense recognised for the period. This is sometimes also referred to as the ‘Comprehensive Result’. It is the aggregate of operating result and other movements in equity, other than transactions with owners as owners. It is equivalent to the change in the total value of assets less the total value of liabilities on the balance sheet.
Total non-financial assets
Assets that are not ‘financial assets’, predominantly land and other fixed assets.
Total non-financial public sector
The total non-financial public sector represents the consolidated transactions and assets and liabilities of the general government and public non-financial corporations sectors. In compiling statistics for the total non-financial public sector, transactions and debtor/creditor relationships between sub-sectors are eliminated.
Transactions
Transactions are those economic flows that are considered to arise from an interaction between two entities by mutual agreement. They also include flows within an entity such as depreciation where the owner is simultaneously acting as the owner of the depreciating asset and as the consumer of the service provided by the asset.

2019-20 Annual Report on State F inances
252
Taxation is regarded as mutually agreed interactions between the public sector and tax payers. Transactions can be in kind (e.g. assets provided/given free of charge or for nominal consideration) or where the final consideration is in cash.
Uniform Presentation Framework
The Uniform Presentation Framework (UPF) was first agreed by the Australian Loan Council in 1993. The current UPF incorporates the use of accounting standard AASB 1049: Whole of Government and General Government Sector Financial Reporting and specifies that Commonwealth, State and Territory governments will present a minimum set of budget and financial outcome information on AASB 1049 and Government Finance Statistics bases according to an agreed format specified by Loan Council reporting arrangements.
Whole-of-government financial report
A financial report prepared by a Government that is prepared in accordance with Australian Accounting Standards and thereby separately recognises assets, liabilities, income, expenses and cash flows of all entities under the control of the Government on a line-by-line basis.

2019-20
ANNUAL REPORT ON STATE FINANCES
September 2020
2019
-20 A
NN
UA
L RE
PO
RT
ON
STAT
E F
INA
NC
ES
2019-20_ARSF_Cover.indd 12019-20_ARSF_Cover.indd 1 23/09/2020 12:50:05 PM23/09/2020 12:50:05 PM