2018/19 Quarter Year to June Corporate Services ...
31
2018/19 Quarter Year to June Corporate Services Performance Report – Performance Indicators Corporate Services - Audit Cat Code & Name Target 2016/17 2017/18 2018/19 Q1 2017/18 Q2 2017/18 Q3 2017/18 Q4 2017/18 Q1 2018/19 Latest Note Status Value Value Value Value Value Value Value Value Local FICT055 Percentage of Delivery of Audit Plan (cumulative) 0% 79% 73% N/A 21% 46% 68% 73% N/A Having reported slippage in the audit plan for 2017/18 to the Audit and Scrutiny Committee as a consequence of a staff vacancy and other workload pressures it was agreed the audit plan for that year should progress to completion in the period to 30th June. The new year plan thus only commenced in July 2018 and its progress will be monitored over the remaining three quarters of the year. Local FICT056 Percentage of Audit Reports issued within target timescale following audit completion 90% 90% 95% 100% 90% 90% 100% 100% 100% All reports are issued promptly on completion and while there can be a variability in the time taken for management responses to be received this is not measured as part of this indicator Local FICT300 Governance Statement produced by 30th June Yes Yes Yes N/A Measured annually Measured annually Completed as part of the year end process for 2017/18 Corporate Services - Corporate Resources Cat Code & Name Target 2016/17 2017/18 2018/19 Q1 2017/18 Q2 2017/18 Q3 2017/18 Q4 2017/18 Q1 2018/19 Latest Note Status Value Value Value Value Value Value Value Value Nat(b) CORP1 Support services as a % of total gross expenditure Data only 4.54% N/A N/A Measured annually Measured annually Support service costs for Moray Council rose again in 2016/17 to £10.42 from £10M in 2015/16. Gross expenditure rose by approximately £2M from £223M to £225M, leading to a slight increase in the percentage cost of support services for the Moray Council from 4.49% to 4.54%. This increase has led to Moray Council being ranked 15th out of the 32 Scottish Councils for value, compared to a ranking of 9th in 2015/16; the lowest ranking for the last 7 financial years. North Ayrshire yet again leads the rankings with a figure of 2.28%, while Scottish Borders has replaced Eilean Siar in 32nd place with support service costs of 9.36% (up from 8.01% in 2015/16). Moray's support costs continue to remain below the Scottish average (which was 5% in 2016/17)
Transcript of 2018/19 Quarter Year to June Corporate Services ...

2018/19 Quarter Year to June Corporate Services
Performance Report – Performance Indicators
Corporate Services - Audit
Cat Code & Name Target 2016/17 2017/18 2018/19
Q1
2017/18
Q2
2017/18
Q3
2017/18
Q4
2017/18
Q1
2018/19 Latest Note Status
Value Value Value Value Value Value Value Value
Local FICT055 Percentage of Delivery
of Audit Plan (cumulative) 0% 79% 73% N/A 21% 46% 68% 73% N/A
Having reported slippage in the audit plan for
2017/18 to the Audit and Scrutiny Committee as a
consequence of a staff vacancy and other workload
pressures it was agreed the audit plan for that year
should progress to completion in the period to 30th
June. The new year plan thus only commenced in
July 2018 and its progress will be monitored over the
remaining three quarters of the year.
Local
FICT056 Percentage of Audit
Reports issued within target
timescale following audit
completion
90% 90% 95% 100% 90% 90% 100% 100% 100%
All reports are issued promptly on completion and
while there can be a variability in the time taken for
management responses to be received this is not
measured as part of this indicator
Local FICT300 Governance
Statement produced by 30th
June
Yes Yes Yes N/A Measured annually Measured
annually
Completed as part of the year end process for
2017/18
Corporate Services - Corporate Resources
Cat Code & Name Target 2016/17 2017/18 2018/19
Q1
2017/18
Q2
2017/18
Q3
2017/18
Q4
2017/18
Q1
2018/19 Latest Note Status
Value Value Value Value Value Value Value Value
Nat(b) CORP1 Support services as a
% of total gross expenditure Data only 4.54% N/A N/A Measured annually
Measured
annually
Support service costs for Moray Council rose again in
2016/17 to £10.42 from £10M in 2015/16. Gross
expenditure rose by approximately £2M from £223M
to £225M, leading to a slight increase in the percentage cost of support services for the Moray
Council from 4.49% to 4.54%. This increase has led
to Moray Council being ranked 15th out of the 32
Scottish Councils for value, compared to a ranking of
9th in 2015/16; the lowest ranking for the last 7
financial years. North Ayrshire yet again leads the
rankings with a figure of 2.28%, while Scottish
Borders has replaced Eilean Siar in 32nd place with
support service costs of 9.36% (up from 8.01% in 2015/16). Moray's support costs continue to remain
below the Scottish average (which was 5% in
2016/17)

Financial Services - Accountancy
Cat Code & Name Target 2016/17 2017/18 2018/19
Q1
2017/18
Q2
2017/18
Q3
2017/18
Q4
2017/18
Q1
2018/19 Latest Note Status
Value Value Value Value Value Value Value Value
Local
FS001 Annual Accounts
submitted by 30th June to
External Audit
Yes Yes Yes N/A Measured annually Measured
annually
Local FS002 Was Unqualified Audit
Certificate Received (end
September)
Yes Yes Yes N/A Measured annually Measured
annually
Local FS003 Provide Report to
Council to allow C Tax setting Yes Yes Yes N/A Measured annually
Measured
annually
Local
FS008 Percentage of budget
monitoring reports issued to
budget managers within target
timescales
100% 100% 100% 100% 100% 100% 100% 100% 100%
Financial Services - Payments
Cat Code & Name Target 2016/17 2017/18 2018/19
Q1
2017/18
Q2
2017/18
Q3
2017/18
Q4
2017/18
Q1
2018/19 Latest Note Status
Value Value Value Value Value Value Value Value
Nat(b) FS101 Percentage of invoices
sampled paid within 30 days 85% 89.9% 90.6% 90.5% 90.8% 92.1% 90.2% 89.2% 90.5%
Local FS111 Payroll: Accuracy - Number
99.5% 99.72% 99.89% 99.77% 99.89% 99.86% 99.94% 99.87% 99.77% In Quarter 1 total number of employees paid incorrect was 36. Total number paid 15366.
Local FS112 Payroll: Accuracy - Value
99.85% 99.94% 99.97% 99.98% 99.97% 99.94% 99.97% 99.98% 99.98%
In Quarter 1 total amount paid incorrectly was
£6207.19. Total amount paid in Quarter
£27,370,665.33.
Financial Services - Revenues
Cat Code & Name Target 2016/17 2017/18 2018/19
Q1
2017/18
Q2
2017/18
Q3
2017/18
Q4
2017/18
Q1
2018/19 Latest Note Status
Value Value Value Value Value Value Value Value
Local
FICT137 Gross cost of
collecting Non Domestic Rates
per property.
£33.00 £30.73 £30.58 N/A Measured annually Measured
annually
Nat(b) SBA1e Gross administration cost per benefits case
£71.00 £61.57 N/A N/A Measured annually Measured annually
Nat(b) SCM5 Cost of collecting council
tax per dwelling £14.00 £10.64 £9.30 N/A Measured annually
Measured
annually
Nat(b) SCM6b Percentage of current
year council tax received
(cumulative)
28.7% 95.9% 96.7% 28.9% 28.7% 54.6% 81% 96.7% 28.9%

Cat Code & Name Target 2016/17 2017/18 2018/19
Q1
2017/18
Q2
2017/18
Q3
2017/18
Q4
2017/18
Q1
2018/19 Latest Note Status
Value Value Value Value Value Value Value Value
Nat(b)
CPS011 Average time in days to process new housing
benefits (HB) claims
(cumulative for the year)
23 20.56 27.37 24.5 22 26.15 29.05 27.37 24.5
Nat(b)
CPS012 Average time in days
to process notifications of
changes of circumstances in housing benefits (HB) claims
(cumulative for the year)
9 9.67 10.86 9.08 10 11.89 12.86 8.67 9.08
Nat
FS210 Total value of housing
benefits (HB) overpayments
outstanding at the start of each
quarter
Data only £3,562,889 £3,544,060 £924,337 £895,324 £800,198 £920,624 £927,914 £924,337
Nat FS211 Total value of housing
benefits (HB) overpayments
created this quarter
Data only £389,329 £292,412 £90,661 £52,281 £99,300 £68,328 £72,503 £90,661
Nat FS212 Total value of housing
benefit (HB) overpayment
recovered during the quarter
Data only £367,236 £252,037 £51,018 £77,364 £45,551 £59,820 £69,302 £51,018
Human Resources and ICT - Human Resources
Cat Code & Name Target 2016/17 2017/18 2018/19
Q1
2017/18
Q2
2017/18
Q3
2017/18
Q4
2017/18
Q1
2018/19 Latest Note Status
Value Value Value Value Value Value Value Value
Nat(b)
CS016B.1 Sickness Absence
Rates - Average number of working days per employee
lost through sickness absence -
Teachers
5.9 5.9 N/A N/A Measured annually Measured
annually
2016/17 – Continued work in this area from schools
management supported by HR has allowed us to
match last year’s return.
Nat(b)
CS016B.2 Sickness Absence
Rates - Average number of
working days per employee lost through sickness absence -
all other local government
employees
11 11 N/A N/A Measured annually Measured annually
2016/7 – an improvement in sickness absence
rates has been achieved by a range of measures
including a more targeted approach in higher absence areas; early intervention; active case
management; and training for those managing
cases.
Local
CS024a Number of Health and
Safety Incidents reported
(target based on previous 3 years average per quarter)
61 212 251 58 59 47 50 95 58
Local
CS024b Number of Violence
and Aggression Incidents
reported (target based on
previous 3 years average per
quarter)
267 1,071 1,038 220 314 189 231 304 220
Education – 197
Woodview – NOT YET AVAILABLE
Other areas – 23

Cat Code & Name Target 2016/17 2017/18 2018/19
Q1
2017/18
Q2
2017/18
Q3
2017/18
Q4
2017/18
Q1
2018/19 Latest Note Status
Value Value Value Value Value Value Value Value
Nat(b) CS037.1 Equal Opportunities
Percentage of highest paid 5%
of earners that are women
50% 51.9% N/A N/A Measured annually Measured
annually
There has been an increase of 1.3% to 51.9% in the number of females employed in each grade that falls
within the top 5% of earners. This reflects an
increase of 5 additional female staff now appearing
in the top 5% of earners as a result of promotion or
new appointments. The number of males within this
category has remained static due to the number of
leavers equalling the number of new appointments.
Local
CS045 Working days lost due
to industrial injury / accidents
(based on average of past 3
years)
106.25 424 510 96 169 141 114 86 96
Local CS146 Human Resources - Employee Engagement Index
Score
70 N/A 73 N/A Measured annually Measured
annually
Human Resources and ICT - ICT Applications
Cat Code & Name Target 2016/17 2017/18 2018/19
Q1
2017/18
Q2
2017/18
Q3
2017/18
Q4
2017/18
Q1
2018/19 Latest Note Status
Value Value Value Value Value Value Value Value
Local
FICT173 ICT Action Plan
completion percentage
(cumulative)
22.5% 83% 89% 27% 23% 42% 69% 89% 27%
Of the 81 projects on the current plan:
•15 are now complete,
•31 Work In Progress, •3 on hold,
•1 no longer required
•and 31 not started.
Human Resources and ICT - ICT Infrastructure
Cat Code & Name Target 2016/17 2017/18 2018/19
Q1 2017/18
Q2 2017/18
Q3 2017/18
Q4 2017/18
Q1 2018/19 Latest Note Status
Value Value Value Value Value Value Value Value
Local CPS041 Help desk - Percentage resolution of calls within target
timescale
90% 93.72% 95.23% 96.73% 96.85% 95.9% 93.04% 95.24% 96.73% 2071 out of 2141 calls resolved within target for all
call priorities during Q1 2018/19
Local CS147 Schools ICT - Customer
Satisfaction Index Data only N/A N/A N/A Measured annually
Measured
annually
The ICT survey for schools has been issued -
awaiting responses.
Local
CS148 Corporate ICT -
Customer Satisfaction Index
(This indicator covers ICT
Applications and ICT
Infrastructure)
75.8 N/A N/A N/A Measured annually Measured
annually
Customer Satisfaction Survey last carried out in
2016. Next survey to be carried out in 2019.
Local FICT174 Percentage availability
of the Moray Council Website 99% 99.89% 99.98% 99.98% 99.94% 99.99% 100% 100% 99.97%

Legal and Democratic Services - Customer Services
Cat Code & Name Target 2016/17 2017/18 2018/19
Q1
2017/18
Q2
2017/18
Q3
2017/18
Q4
2017/18
Q1
2018/19 Latest Note Status
Value Value Value Value Value Value Value Value
Local(b)
CPS058 Percentage of
telephone calls answered
against those received
93% 90.86% 92.81% 91.99% 93.68% 92.46% 92.74% 92.34% 91.99%
Local(b) CPS059 Percentage of
telephone calls answered
within 20 seconds
74% 66.9% 68.11% 63.36% 75.11% 69.5% 65.49% 62.78% 63.36%
April's figures effect this %, and are unpredictable
due to the overspill of year end documentation and
customer reaction. The impact of an unfilled post, long term absence and annual leave also have had
an effect and we hope to have a full complement as
we move forward in Q2.
Local CPS062 Customer Services -
Customer Satisfaction Index Data only N/A N/A N/A Measured annually
Measured
annually
Survey complete and analysis currently underway.
The results will be reported to the new council
members in due course.
Legal and Democratic Services - Democratic Services
Cat Code & Name Target 2016/17 2017/18 2018/19
Q1
2017/18
Q2
2017/18
Q3
2017/18
Q4
2017/18
Q1
2018/19 Latest Note Status
Value Value Value Value Value Value Value Value
Local
CS001 Committee Agenda -
Percentage issued on time or
early
85% 371% 392% 100% 100% 100% 100% 92% 100%
Local CS002 Committee Action
Sheets - Percentage issued on
time or early
85% 363.5% 343.1% 100% 87.5% 88.9% 66.7% 100% 100%
Local CS003 Committee Draft
minutes - Percentage issued on time or early
85% 366.9% 252.8% 82.4% 50% 77.8% 41.7% 83.3% 82.4% 3 issued late due to workload, annual leave and staff
training.
Local CS133 Committee Services -
Customer Satisfaction Index 88.3 99 N/A N/A Measured annually
Measured
annually
Legal and Democratic Services - Legal Services
Cat Code & Name Target 2016/17 2017/18 2018/19
Q1
2017/18
Q2
2017/18
Q3
2017/18
Q4
2017/18
Q1
2018/19 Latest Note Status
Value Value Value Value Value Value Value Value
Local(b)
CS126 Total cost of the legal
function as a percentage of
organisational running costs
(expenditure)
Data only N/A N/A N/A Measured annually Measured
annually Not yet available.
Local(b) CS132 Cost per hour of providing legal work
Data only N/A N/A N/A Measured annually Measured annually
Not yet available.
Local CS136 Legal Services -
Customer Satisfaction Index 84% N/A 86% N/A Measured annually
Measured
annually Customer survey not due this year

Legal and Democratic Services - Registrars
Cat Code & Name Target 2016/17 2017/18 2018/19
Q1
2017/18
Q2
2017/18
Q3
2017/18
Q4
2017/18
Q1
2018/19 Latest Note Status
Value Value Value Value Value Value Value Value
Local(b)
CS031 General Register Office
Report - % error rate in
Registration of Births,
Marriages and Deaths
3% 1.63% N/A N/A Measured annually Measured
annually
Interim report up to July 2017
A good interim report recording so far. Only a slight
decrease from the interim figure of 98.98% and the
final figure of 99.15% recorded in 2016. Good to see
an accuracy of over 98.00% maintained.
Local CS143 Registrars - Customer
Satisfaction Index N/A 97.7 N/A N/A Measured annually
Measured
annually
Customer Satisfaction Survey carried out in 2017.
Next survey to be carried out in 3 years' time.

2018/19 Quarter to June Development Services
Performance Report - Performance Indicators
Strategy Building Standards
Code PI Code Short Name Current
Target
2016/17 2017/18 2018/19 Q1
2017/18
Q2
2017/18
Q3
2017/18
Q4
2017/18
Q1
2018/19 Latest Note
Traffic
Light
Icon Value Value Value Value Value Value Value Value
Nat(b) ENVDV-BS-
KPO1(A)
Average time per Building Warrant
(Working Days)
Data
only 74 86 83 75 100 84 69
Nat(b) ENVDV-BS-
KPO1(B)
Percentage of building warrant and
amendment first reports (including
building warrant or amendment
issued without a first report) issued within 20 working days
95% 67% 87% 87% 89% 89% 85% 97%
Nat(b) ENVDV-BS-
KPO1(C)
BS - Percentage of building warrants
and amendments issued within 10
days of receipt of satisfactory
information
90% 81%
Nat(b) ENVDV-BS-KPO2
BS - % of CCNPs (Construction
Compliance and Notification plans)
fully achieved for "accepted" (by
relevant person and verifier)
completion certificates
Data only
26.2
Local ENVDV046a BS - Number of amended plans
responded to
Data
only 1,469 1,414 368 393 357 360 304 368
Local ENVDV046b BS - Average number of days taken
to respond to amended plans 15 11 7.5 8.6 7 8.6 7.6 6.5

Strategy Development Management
Code PI Code Short Name Current
Target
2015/16 2016/17 2017/18 Q4
2016/17
Q1
2017/18
Q2
2017/18
Q3
2017/18
Q4
2017/18
Latest Note
Reported in line with Scottish Government
Reporting (1 quarter later so Q4 expected this quarter)
Traffic Light Icon Value Value Value Value Value Value Value Value
Nat(b) ENVDV252 Enforcement Activity. Number of cases
taken up
Data
only 237 222 295 64 91 72 39 92
The rise in cases is mainly down to changes in
internal procedures in terms of logging breaches of
planning conditions as enforcement cases and
having a full time Condition Compliance Officer to
be solely dedicated to this task allowing Planning Officers to focus on delivering planning applications
rather than cashing up non-compliance with
conditions. Approx. 10% is down to a rise in cases
raised by members of the public, as there has
been a growing trend in enforcement cases
generally over the last few years, which is
promoted by the Enforcement Charter.
Nat(b) ENVDV262 Number of Local Planning Application
determined in less than 2 months
Data
only 736 539 625 104 173 159 152 166
Nat(b) ENVDV263 Number of Local Planning Application
determined in more than 2 months
Data
only 30 26 29 6 17 14 20 5
Nat(b) SDS2ai Number of major planning applications
determined
Data
only 8 2 6 2 4 2 3 0
Nat(b) SDS2aii
Average time (weeks) taken to
determine Major Planning Applications
(with processing agreements)
Data
only 164 N/A 12.2 N/A 95.5 N/A N/A N/A
Nat(b) SDS2aiii
Average time (weeks) taken to
determine Major Planning Applications
(without processing agreements)
Data only
28.3 16.9 18.6 16.9 9.8 15.9 20 N/A
Nat(b) SDS2b Average time (weeks) to deal with local
planning applications 10.4 6.7 6.7 6.1 6 6.1 6.6 5.5 6.1
Nat(b) SECON02
Cost per planning application
(Total Planning costs include Gross
Expenditure on Building Control,
Development Control, Planning Policy
and Environmental initiatives)
Data
only £3383 £3879 Not measured for Quarters
2017/18 data not due until Feb 2019
Nat(b) SECON03 Average Time Per Commercial Planning
Application
Data
only 7.69 6.95 Not measured for Quarters
2017/18 data not due until Feb 2019

Strategy Economic Development
Code PI Code Short Name Current
Target
2016/17 2017/18 2018/19 Q1
2017/18 Q2
2017/18 Q3
2017/18 Q4
2017/18 Q1
2018/19 Latest Note
Traffic
Light
Icon Value Value Value Value Value Value Value Value
Local ENVDV266 Number of new Business start-ups
through the Business Gateway
Data
only 132 128 36 34 28 30 36
41 FTE jobs have been either retained or created in Q1 of 18/19 by start-up businesses, This data is
collected by BG Moray as a result of direct BG
interventions.
Local ENVDV267 Business Gateway 3 year survival rate
(based on 100% sampling)
Data
only 84% 86% Not measured for Quarters
Local ENVDV268 External funding leverage (against every
pound from Council)
Data
only £4.69 Not measured for Quarters
SLAED report presented to ED&IS Committee on
March 20 2018
Nat(b) SECON05 No of business gateway start-ups per
10,000 population
Data
only 13.74 Not measured for Quarters 2017/18 data not due until Feb 2019
Strategy Environmental Health
Code PI Code Short Name Current
Target
2015/16 2016/17 2017/18 Q1
2017/18
Q2
2017/18
Q3
2017/18
Q4
2017/18
Q1
2018/19 Latest Note Traffic Light
Icon Value Value Value Value Value Value Value Value
Nat(b) ENVDV215b Cost of environmental health services
per 1,000 population.
Data
only £15,041 Not measured for Quarters 2017/18 data not due until Feb 2019
Local ENVDV078a
EH - Health & Safety - percentage of
high-risk (12 months) premises
inspected within time during quarter
100% N/A N/A N/A N/A N/A N/A N/A
Local(b) ENVDV086 EH - Percentage of responses for high-priority pest control services which met
the national target
95% 100% N/A N/A N/A N/A N/A N/A
Local(b) ENVDV087
EH - Percentage of responses for low-
priority pest control services which met
the national target
90% 85% 85% 88% 88% 81% 84% 88%
Strategy Environmental Health (Food Safety)
Code PI Code Short Name Current
Target
2015/16 2016/17 2017/18
Q4
2016/
17
Q1
2017/18
Q2
2017/18
Q3
2017/18
Q4
2017/18
Latest Note
Reported in line with Scottish Government
Reporting (1 quarter later so Q4 expected this
quarter)
Traffic
Light
Icon Value Value Value Value Value Value Value Value
Local ENVDV069a
EH - Food Safety - percentage of
category A (6 month) premises
inspected within time during quarter
100% 96% 100% 91.7% 100% 83% 100% 89% 100%
Local ENVDV070a
EH - Food Safety - percentage of
category B (12 months) premises
inspected within time during quarter
100% 80% 88.4% 87.1% 84% 87% 90% 96% 75%

Code PI Code Short Name Current
Target
2015/16 2016/17 2017/18
Q4
2016/
17
Q1
2017/18
Q2
2017/18
Q3
2017/18
Q4
2017/18
Latest Note
Reported in line with Scottish Government
Reporting (1 quarter later so Q4 expected this
quarter)
Traffic Light
Icon Value Value Value Value Value Value Value Value
Local ENVDV259a
EH - Food Safety - percentage of
category C (18 months) premises
inspected within time during quarter
Data
only 58% 82% 82.5% 89.4% 75.9% 89.3% 84.0% 80.9%
Local(b) ENVDV410a EH - Food Safety - percentage of category D (24 months) premises
inspected within time during quarter
Data
only
87.5%
Q4 only 87.5% 87.5% 62% 86.2% 77.7% 82.6% 14 of 18 inspected in time
Local ENVDV070c
EH - Food Safety - % of registered food
premises which are broadly compliant
with food law (of all rated premises)
80% 77% 89.9% 88.8% 89.9% 85% 90.3% 87% 88.8%
Strategy Planning and Development
Code PI Code Short Name Current Target
2016/17 2017/18 2018/19 Q1
2017/18
Q2
2017/18
Q3
2017/18
Q4
2017/18
Q1
2018/19 Latest Note
Traffic
Light
Icon Value Value Value Value Value Value Value Value
Local ENVDV247 P&D - Age of local development plan
(requirement less than 5 years) Yes Yes Yes Not measured for Quarters
Local ENVDV248 P&D - The effective housing land
provision is greater than a 5 year supply Yes Yes Yes Not measured for Quarters
Local ENVDV250 P&D - Vacancy rate of retail floor space 10% 11.9% N/A Not measured for Quarters
Town Centre Health Checks are carried out every 2
years and the latest health checks have been
carried out over the summer and will be reported
to P&RS and ED&I before end of the calendar year.
Local ENVDV264 Annual monitoring statement of the
Local Development Plan is published Yes Yes Yes Not measured for Quarters
Local ENVDV265
Area of Employment
(Marketable/Effective) Land available
(hectares)
Data
only
80.62
ha
80.27
ha Not measured for Quarters
Local ENVDV265a Area of Immediately Available/ Serviced
Employment Land (hectares)
Data
only
18.07
ha
17.95
ha Not measured for Quarters

Strategy Trading Standards
Code PI Code Short Name Current
Target
2016/17 2017/18 2018/19 Q1
2017/18
Q2
2017/18
Q3
2017/18
Q4
2017/18
Q1
2018/19 Latest Note
Traffic
Light
Icon Value Value Value Value Value Value Value Value
Local ENVDV201
Percentage of clients who were
'very satisfied' or 'fairly satisfied'
with the consumer complaint
service.
95% 95% 95% Not measured for Quarters
Nat(b) ENVDV215a Cost of Trading Standards per 1,000
population.
Data
only £4,955 Not measured for Quarters 2017/18 data not due until Feb 2019
Local ENVDV216
Percentage of welfare benefits
clients who were ‘very satisfied’ or
‘fairly satisfied’ with service received
Data
only 96% 97% Not measured for Quarters
Local ENVDV217 Welfare Benefits clients – estimated
benefit gain (£000s)
Data
only £1,713 £1,049 £221 £336 £246 £246 £261
Local ENVDV218b Welfare Benefit clients – percentage
of clients with successful appeals 75% 93% 80% 83% 88% 71% 83% 80%
Local ENVDV253 Number of Reports to the
Procurator Fiscal
Data
only 9 6 2 1 3 0 1
Local ENVDV254
Estimated increase in the Council’s
collection of Rent and Council Tax
money from Money Advice Clients
Data
only £57,905 £72,642 Not measured for Quarters
Local ENVDV255
Percentage of money advice clients
who agreed that ‘The service helped to sort out their debt problem’.
Data
only 100% 98% Not measured for Quarters
Local ENVDV300
Percentage of money advice clients
who were 'very satisfied' or 'fairly
satisfied' with service received.
95% 100% 100% Not measured for Quarters
Strategy Transportation Planning
Code PI Code Short Name Current
Target
2016/17 2017/18 2018/19 Q1
2017/18
Q2
2017/18
Q3
2017/18
Q4
2017/18
Q1
2018/19 Latest Note
Traffic
Light
Icon Value Value Value Value Value Value Value Value
Local ENVDR074b
% of pre-application cases (major)
responded to planning department within
target time of 15 working days of
scheduled meeting with developer
100% 100% 100% 100% 100% 100% N/A N/A No pre-application cases were received/due within
this period.
Local ENVDR252
Percentage of planning applications
returned to the planning department
within target time
88% 85.9% 86.3% 90% 89% 88% 80% 91%
145/159 – improved level of performance due to
vacancy being filled with qualified and experienced
member of staff

2018/19 Quarter Year to June Direct Services
Performance Report – Performance Indicators
Consultancy Engineering Design Services
Cat Code & Name Target 2016/17 2017/18 2018/19
Q1
2017/18
Q2
2017/18
Q3
2017/18
Q4
2017/18
Q1
2018/19 Latest Note Status
Value Value Value Value Value Value Value Value
Local
Envdr206 Bridge Condition Index
(average of the 379 Bridges in Moray) -
A general inspection of each bridge is
scheduled every 2 years.
87 86.93 87.04 Not measured for Quarters
Not
measured
for
Quarters
Local Envdr207 % of responses to Planning
Consultation on Flooding and Drainage
that are responded to within 14 days
100% 98.8% 100% Not measured for Quarters
Not
measured
for Quarters
Local Envdr248 % of projects which were
within target budget 90% 90% 90% Not measured for Quarters
Not
measured
for
Quarters
Dallas FAS overspend due to unforeseen ground
conditions
Environmental Protection Building Cleaning & Catering
Cat Code & Name Target 2016/17 2017/18 2018/19
Q1 2017/18
Q2 2017/18
Q3 2017/18
Q4 2017/18
Q1 2018/19 Latest Note Status
Value Value Value Value Value Value Value Value
Local Envdr211 Food cost per school meal
(Primary School) £0.75 £0.67 £0.76 £0.71 £0.73 £0.77 £0.76 £0.74
Local Envdr212 Customer Satisfaction rating of
Building Cleaning & Catering services 72% N/A N/A Not measured for Quarters
Not
measured
for
Quarters
No survey in 2017/18
Local Envdr213 Unit cost per 100 square
metres for Building Cleaning £4.70 £4.92 £4.91 Not measured for Quarters
Not
measured
for

Cat Code & Name Target 2016/17 2017/18 2018/19
Q1
2017/18
Q2
2017/18
Q3
2017/18
Q4
2017/18
Q1
2018/19 Latest Note Status
Value Value Value Value Value Value Value Value
Quarters
Local Envdr249 % Primary School Pupils taking
School Meals - Uptake in Primary School
Meals for Primary 1,2 &3
75% 78.12% 77.06% 78.2% 76.9% 76.8% 76.9% 78.1%
Local ENVDR071 % Primary School Pupils
taking School Meals - Uptake in Primary
School Meals
60% 64% 60.28% 62.7% 59.6% 60.5% 60.9% 60%
Environmental Protection Lands & Parks/Countryside/Access
Cat Code & Name Target 2016/17 2017/18 2018/19
Q1
2017/18
Q2
2017/18
Q3
2017/18
Q4
2017/18
Q1
2018/19 Latest Note Status
Value Value Value Value Value Value Value Value
Nat(b) Envdr214 Cost of parks and open spaces
per 1,000 population £15,000 £13,615 N/A Not measured for Quarters
Not
measured
for
Quarters
rank 7 in Scotland and rank 2 in family group
changed from £15,603
Nat(b) Envdr215 Percentage of adults satisfied
with parks and open spaces 75% 88% N/A Not measured for Quarters
Not
measured
for
Quarters
Direct services survey results available in January
2018 - 57 out of 88 (65%) satisfied or better.
LGBF results taken from the Scottish Household
Survey (Moray):
2014-17 87.7%
2013-16 89.7%
2015 93.0%
2014 90.43%
Environmental Protection Waste Management
Cat Code & Name Target 2016/17 2017/18 2018/19
Q1 2017/18
Q2 2017/18
Q3 2017/18
Q4 2017/18
Q1 2018/19 Latest Note Status
Value Value Value Value Value Value Value Value
Nat(b) Envdr218 Net cost of street cleaning per
1,000 population £7,800 £7,671 N/A Not measured for Quarters
Not measured
for
Quarters
Total cost £737.000. Mid year estimate 2016-17
Moray population 96,070.
Nat(b) Envdr220 Percentage of adults satisfied
with refuse collection 93% 87% N/A Not measured for Quarters
Not
measured
for Quarters
Direct services survey results available in January
2018 - 52 out of 89 (58%) respondents satisfied
or better.
Nat(b) Envdr221 Percentage of adults satisfied
with street cleaning 70% 66% N/A Not measured for Quarters
Not
measured
for
Quarters
Direct services survey results available in January
2018 - 36 of 59 (61%) respondents satisfied or
better.

Cat Code & Name Target 2016/17 2017/18 2018/19
Q1 2017/18
Q2 2017/18
Q3 2017/18
Q4 2017/18
Q1 2018/19 Latest Note Status
Value Value Value Value Value Value Value Value
Nat(b) ENVDR069 Percentage of total waste
arising that is recycled (percentage of
waste diverted from landfill)
60% 59.1% 57.9% Not measured for Quarters
Not measured
for
Quarters
This is the calendar year figure for 2017. Reason for this is that work is ongoing for Jan-March 2018
figures, changes required for Revenue Scotland
and all data is to be double checked.
Nat(b) SENV01a Net cost of Waste collection per
premise £65.91 £49.26 N/A Not measured for Quarters
Not
measured
for
Quarters
Data due Q3 2018-19
Nat(b) SENV02a Net waste disposal cost per
premises £95.06 £98.40 N/A Not measured for Quarters
Not
measured
for
Quarters
Data due Q3 2018-19
Nat SENV03c Street Cleanliness Score for
Acceptable Cleanliness 85 N/A 87 Not measured for Quarters
Not
measured
for
Quarters
Roads Maintenance Fleet Services
Cat Code & Name Target 2016/17 2017/18 2018/19
Q1
2017/18
Q2
2017/18
Q3
2017/18
Q4
2017/18
Q1
2018/19 Latest Note Status
Value Value Value Value Value Value Value Value
Local ENVDR130c % Occasions where vehicles
were available for use 94.50% 97.2% 97.5% 96.4% 96.2% 98.2% 97.4% 96.6% Exceeds target.
Local ENVDR223 Unit cost per vehicle and
plant maintenance (weighted) £205 £775 £763 £194 £172 £186 £211 £205 Met target.
Local ENVDR224 Net savings for Pool Cars £190,000 £235,441 £286,365 Not measured for Quarters
Not
measured
for
Quarters
Provisional figure as Finance have not completed
year end at this time
Local ENVDR259 Average mileage of Pool Cars 3,000 11,637 11,618 2,988 2,868 2,790 2,963 3,017 Exceeds target.
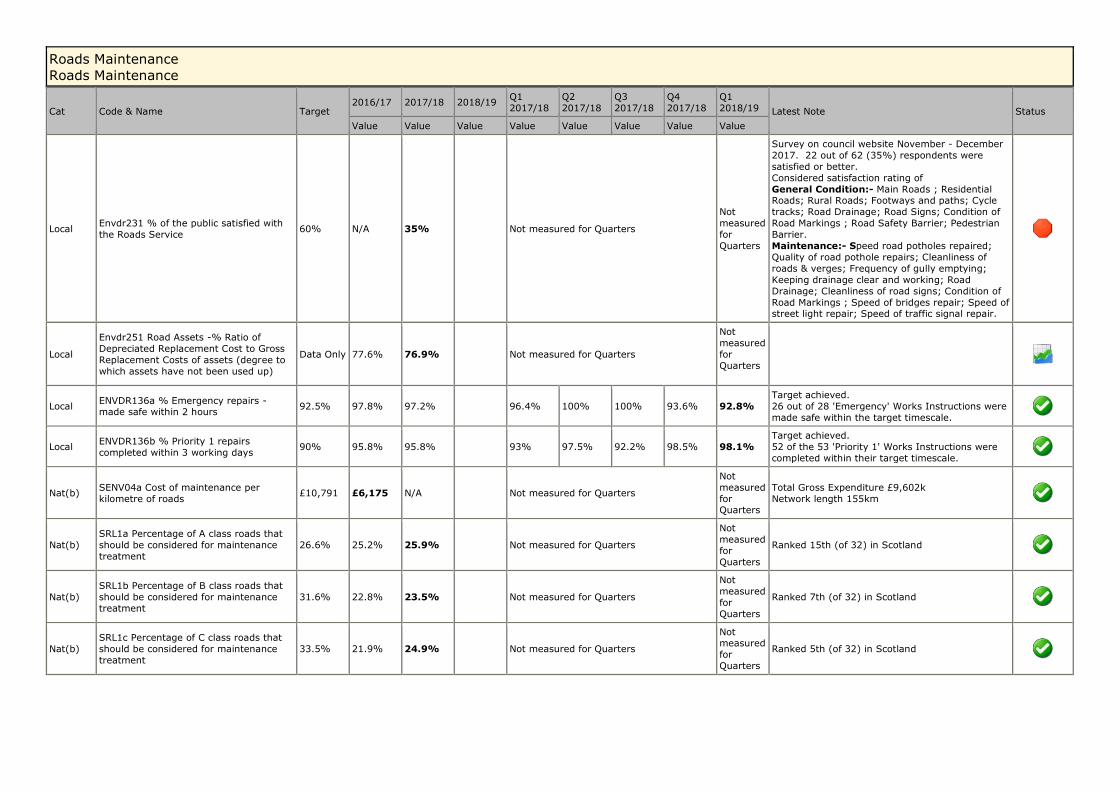
Roads Maintenance Roads Maintenance
Cat Code & Name Target 2016/17 2017/18 2018/19
Q1
2017/18
Q2
2017/18
Q3
2017/18
Q4
2017/18
Q1
2018/19 Latest Note Status
Value Value Value Value Value Value Value Value
Local Envdr231 % of the public satisfied with
the Roads Service 60% N/A 35% Not measured for Quarters
Not
measured
for
Quarters
Survey on council website November - December
2017. 22 out of 62 (35%) respondents were
satisfied or better.
Considered satisfaction rating of
General Condition:- Main Roads ; Residential Roads; Rural Roads; Footways and paths; Cycle
tracks; Road Drainage; Road Signs; Condition of
Road Markings ; Road Safety Barrier; Pedestrian
Barrier.
Maintenance:- Speed road potholes repaired;
Quality of road pothole repairs; Cleanliness of
roads & verges; Frequency of gully emptying;
Keeping drainage clear and working; Road
Drainage; Cleanliness of road signs; Condition of
Road Markings ; Speed of bridges repair; Speed of street light repair; Speed of traffic signal repair.
Local
Envdr251 Road Assets -% Ratio of
Depreciated Replacement Cost to Gross
Replacement Costs of assets (degree to
which assets have not been used up)
Data Only 77.6% 76.9% Not measured for Quarters
Not
measured
for
Quarters
Local ENVDR136a % Emergency repairs - made safe within 2 hours
92.5% 97.8% 97.2% 96.4% 100% 100% 93.6% 92.8%
Target achieved.
26 out of 28 'Emergency' Works Instructions were
made safe within the target timescale.
Local ENVDR136b % Priority 1 repairs
completed within 3 working days 90% 95.8% 95.8% 93% 97.5% 92.2% 98.5% 98.1%
Target achieved.
52 of the 53 'Priority 1' Works Instructions were
completed within their target timescale.
Nat(b) SENV04a Cost of maintenance per
kilometre of roads £10,791 £6,175 N/A Not measured for Quarters
Not
measured
for Quarters
Total Gross Expenditure £9,602k
Network length 155km
Nat(b) SRL1a Percentage of A class roads that
should be considered for maintenance
treatment
26.6% 25.2% 25.9% Not measured for Quarters
Not
measured
for
Quarters
Ranked 15th (of 32) in Scotland
Nat(b) SRL1b Percentage of B class roads that
should be considered for maintenance
treatment
31.6% 22.8% 23.5% Not measured for Quarters
Not
measured
for
Quarters
Ranked 7th (of 32) in Scotland
Nat(b) SRL1c Percentage of C class roads that
should be considered for maintenance
treatment
33.5% 21.9% 24.9% Not measured for Quarters
Not measured
for
Quarters
Ranked 5th (of 32) in Scotland
Cat Code & Name Target 2016/17 2017/18 2018/19
Q1
2017/18
Q2
2017/18
Q3
2017/18
Q4
2017/18
Q1
2018/19 Latest Note Status
Value Value Value Value Value Value Value Value
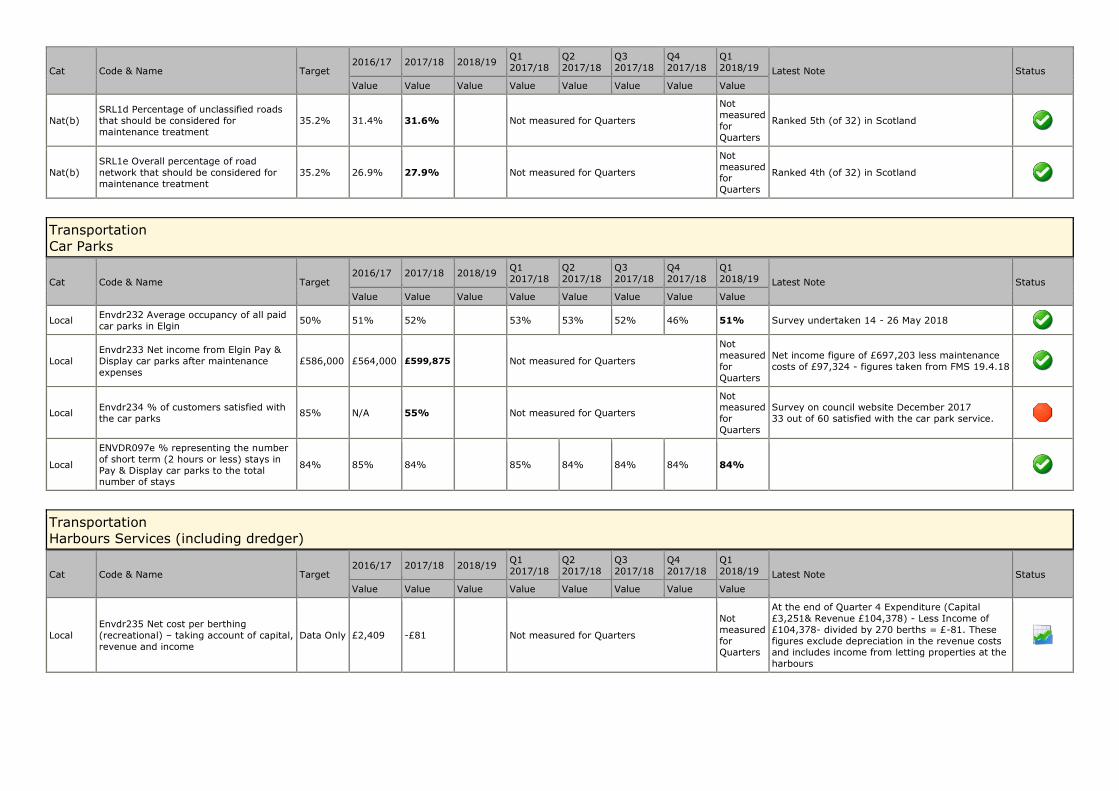
Nat(b) SRL1d Percentage of unclassified roads
that should be considered for
maintenance treatment
35.2% 31.4% 31.6% Not measured for Quarters
Not
measured
for
Quarters
Ranked 5th (of 32) in Scotland
Nat(b) SRL1e Overall percentage of road
network that should be considered for
maintenance treatment
35.2% 26.9% 27.9% Not measured for Quarters
Not
measured for
Quarters
Ranked 4th (of 32) in Scotland
Transportation Car Parks
Cat Code & Name Target 2016/17 2017/18 2018/19
Q1
2017/18
Q2
2017/18
Q3
2017/18
Q4
2017/18
Q1
2018/19 Latest Note Status
Value Value Value Value Value Value Value Value
Local Envdr232 Average occupancy of all paid
car parks in Elgin 50% 51% 52% 53% 53% 52% 46% 51% Survey undertaken 14 - 26 May 2018
Local Envdr233 Net income from Elgin Pay &
Display car parks after maintenance
expenses
£586,000 £564,000 £599,875 Not measured for Quarters
Not
measured
for
Quarters
Net income figure of £697,203 less maintenance
costs of £97,324 - figures taken from FMS 19.4.18
Local Envdr234 % of customers satisfied with
the car parks 85% N/A 55% Not measured for Quarters
Not measured
for
Quarters
Survey on council website December 2017
33 out of 60 satisfied with the car park service.
Local
ENVDR097e % representing the number
of short term (2 hours or less) stays in
Pay & Display car parks to the total number of stays
84% 85% 84% 85% 84% 84% 84% 84%
Transportation Harbours Services (including dredger)
Cat Code & Name Target 2016/17 2017/18 2018/19
Q1
2017/18
Q2
2017/18
Q3
2017/18
Q4
2017/18
Q1
2018/19 Latest Note Status
Value Value Value Value Value Value Value Value
Local
Envdr235 Net cost per berthing
(recreational) – taking account of capital,
revenue and income
Data Only £2,409 -£81 Not measured for Quarters
Not
measured
for Quarters
At the end of Quarter 4 Expenditure (Capital
£3,251& Revenue £104,378) - Less Income of
£104,378- divided by 270 berths = £-81. These
figures exclude depreciation in the revenue costs and includes income from letting properties at the
harbours
Cat Code & Name Target 2016/17 2017/18 2018/19
Q1
2017/18
Q2
2017/18
Q3
2017/18
Q4
2017/18
Q1
2018/19 Latest Note Status
Value Value Value Value Value Value Value Value
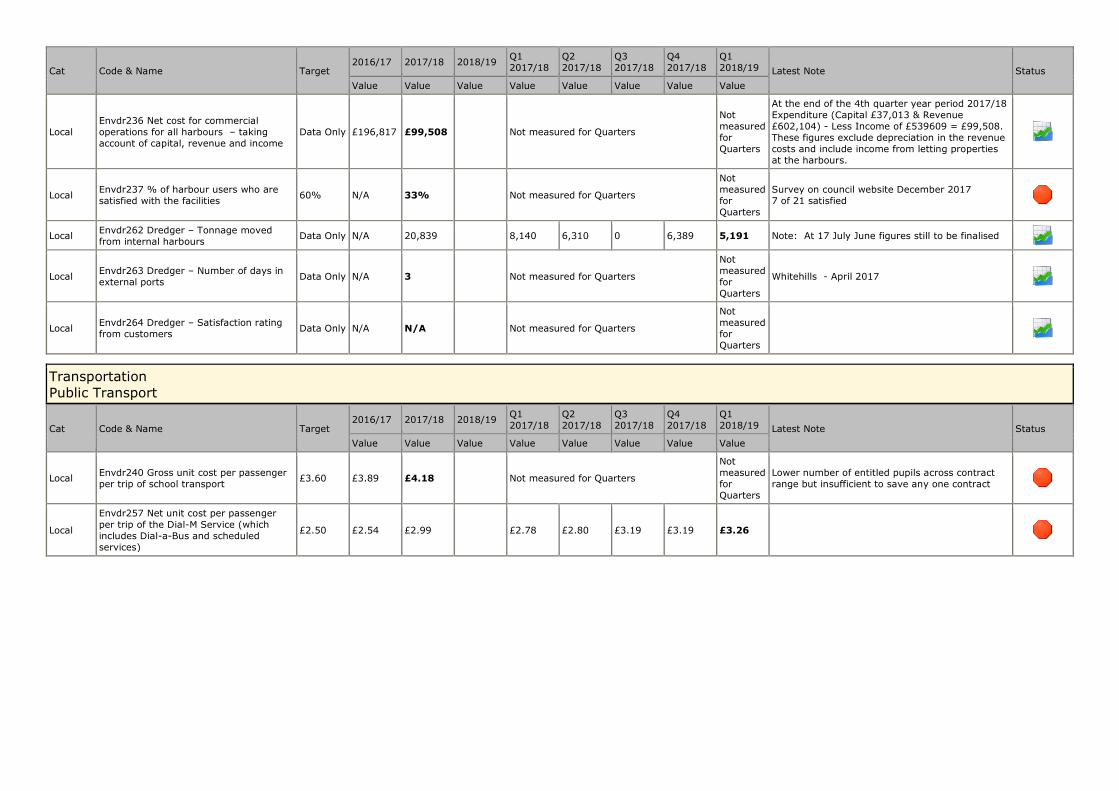
Local Envdr236 Net cost for commercial
operations for all harbours – taking
account of capital, revenue and income
Data Only £196,817 £99,508 Not measured for Quarters
Not
measured
for
Quarters
At the end of the 4th quarter year period 2017/18
Expenditure (Capital £37,013 & Revenue
£602,104) - Less Income of £539609 = £99,508.
These figures exclude depreciation in the revenue
costs and include income from letting properties
at the harbours.
Local Envdr237 % of harbour users who are
satisfied with the facilities 60% N/A 33% Not measured for Quarters
Not
measured
for
Quarters
Survey on council website December 2017
7 of 21 satisfied
Local Envdr262 Dredger – Tonnage moved
from internal harbours Data Only N/A 20,839 8,140 6,310 0 6,389 5,191 Note: At 17 July June figures still to be finalised
Local Envdr263 Dredger – Number of days in
external ports Data Only N/A 3 Not measured for Quarters
Not
measured
for
Quarters
Whitehills - April 2017
Local Envdr264 Dredger – Satisfaction rating
from customers Data Only N/A N/A Not measured for Quarters
Not
measured
for
Quarters
Transportation Public Transport
Cat Code & Name Target 2016/17 2017/18 2018/19
Q1
2017/18
Q2
2017/18
Q3
2017/18
Q4
2017/18
Q1
2018/19 Latest Note Status
Value Value Value Value Value Value Value Value
Local Envdr240 Gross unit cost per passenger
per trip of school transport £3.60 £3.89 £4.18 Not measured for Quarters
Not
measured
for
Quarters
Lower number of entitled pupils across contract
range but insufficient to save any one contract
Local
Envdr257 Net unit cost per passenger
per trip of the Dial-M Service (which
includes Dial-a-Bus and scheduled
services)
£2.50 £2.54 £2.99 £2.78 £2.80 £3.19 £3.19 £3.26

Transportation Statutory & General Transportation
Cat Code & Name Target 2016/17 2017/18 2018/19
Q1
2017/18
Q2
2017/18
Q3
2017/18
Q4
2017/18
Q1
2018/19 Latest Note Status
Value Value Value Value Value Value Value Value
Local
ENVDR074b % of pre-application cases
(major) responded to planning
department within target time of 15
working days of scheduled meeting with
developer
100% 100% 100% 100% 100% 100% N/A N/A No pre-application cases were received/due within
this period.
Local ENVDR074dv % of Local Review Body
(LRB) notifications returned within 10
working days in the period
100% 100% 100% 100% 100% 100% 100% 100% 4 out of 4 returned within target timescale.
Local Envdr252 Percentage of planning
applications returned to the planning
department within target time
80% 85.9% 86.3% 90% 89% 88% 80.3% 91.2%
145/159 – improved level of performance due to
vacancy being filled with qualified and
experienced member of staff.
Transportation Traffic Management
Cat Code & Name Target 2016/17 2017/18 2018/19
Q1
2017/18
Q2
2017/18
Q3
2017/18
Q4
2017/18
Q1
2018/19 Latest Note Status
Value Value Value Value Value Value Value Value
Local
Envdr242 % of Traffic enquiries dealt
with within target time (10 working
days)
95% 96% 95% 96% 95% 95% 95% 95% 20 out of 21 enquiries dealt with within target
time period.
Local Envdr243 % of planned projects
completed within the financial year 100% 100% 100% Not measured for Quarters
Not measured
for
Quarters
1 project
Local Envdr244 Number of Traffic enquiries/
applications dealt with within a year Data Only 1,336 1,271 Not measured for Quarters
Not
measured
for
Quarters
1,189 applications and 82 enquiries for the year

Cat Code & Name Target 2016/17 2017/18 2018/19
Q1
2017/18
Q2
2017/18
Q3
2017/18
Q4
2017/18
Q1
2018/19 Latest Note Status
Value Value Value Value Value Value Value Value
Local
Envdr245 Average number of cycle
journeys made per day on shared
use/national cycle network within Moray
(from a set sample of counters)
Data Only 455 375 Not measured for Quarters
Not
measured
for
Quarters
Annual Average Daily Traffic:
Forres-Kinloss 45
Kinloss-Findhorn 80
Cullen Viaduct 13
Garmouth railway bridge 25 Hopeman-Duffus 17
Glenmoray Drive 30
Library 58
Shaw Place 90
Hopeman-Cummingston 17
TOTAL - 375
In addition there are a number of new counters
which have been introduced:
Decora Bridge N-S 70 Decora Bridge E-W 75
Elginshill 57
Leisure Centre 52
Cathederal 50
TOTAL - 304
Local
Envdr246 Number of primary schools participating in Level 2 Bikeability (level
after the pupil can control the bike. For
level 1, training takes place within a
controlled environment. In Level 2 the
training takes place on local roads)
Data Only N/A 17 Not measured for Quarters
Not
measured
for
Quarters
17 schools undertook on road training.
Local Envdr247 Number of schools completing
the Hands Up survey Data Only 48 48 Not measured for Quarters
Not measured
for
Quarters
Local Envdr265 Number of times the car
charger points are used. Data Only N/A 515 84 174 127 130 144 Only publically accessible units measured

2018/19 Quarter Year to June Education & Social Care
Performance Report – Performance Indicators
Integrated Children's Services Children's Wellbeing & Continuing Support
Cat Code & Name Current
Target
2016/17 2017/18 2018/19 Q1
2017/18 Q2
2017/18 Q3
2017/18 Q4
2017/18 Q1
2018/19 Latest Note Status
Value Value Value Value Value Value Value Value
Local EdS005.30 Number of referrals made to Intake &
Assessment - Triage service
Data
Only 4,657 3,018 825 1,014 537 642 540
The referral system has been changed from 2017/18. Referrals will only include first contact for
new cases / work. Previously new cases included a
number of referrals such as information coming
from other agencies, this will be included as
activities and not as separate referrals. The
change in process is why there is a fall in numbers.
Local EdS005.31 Number of children referred to Intake
& Assessment - Triage Service
Data
Only 1,988 1,678 559 620 419 595 482
The referral system has been changed from
2017/18. Referrals will only include first contact for
new cases / work. Previously new cases included a
number of referrals such as information coming
from other agencies, this will be included as
activities and not as separate referrals.
Local EdS005.32 Number of cases currently open to Intake & Assessment
Data Only
252 407 334 305 286 407 383 The number of open cases is down on the previous quarter, although up on the same period last year.
Local EdS005.34 Number of cases closed in the period by
Intake & Assessment
Data
Only 1,243 1,388 377 276 331 404 381
Local CMS013 Number of children on the Child Protection
Register at end date of reporting period
Data
Only 81 59 84 76 69 59 55
The number of the child protection register has
continued to decrease, with 55 registered at the
end of June.
Local CMS014 Number of new registrations in the
reporting period
Data
Only 98 80 27 24 16 13 24
24 new registrations over the 3 months period, a
rise compared to the previous two quarters.
Local CMS015 Number of re-registrations in the reporting
period
Data
Only 11 11 5 3 2 1 7
Seven children who were registered on the CPR
during Quarter 1 had previously been registered.
No previous registration was within the past 12
months.
Local CMS016 Number of de-registrations in the reporting
period
Data
Only 74 102 24 31 23 24 28
28 children were de-registered during the 3 month
period covering quarter 1.

Integrated Children's Services Community Justice
Cat Code & Name Current
Target
2016/17 2017/18 2018/19 Q1
2017/18
Q2
2017/18
Q3
2017/18
Q4
2017/18
Q1
2018/19 Latest Note Status
Value Value Value Value Value Value Value Value
Local CJ01 % of Criminal Justice Social Work Reports
submitted to courts by the due date 100% 99.6% 100% 100% 100% 100% 100% 100%
All 126 reports were submitted to courts by due
date during the quarter. The number of reports
requested was slightly down on the same period
last year (130).
Local CJ02 % of new Community Payback Orders with a
supervision requirement seen by a supervising
officer within one week (adults)
100% 87.7% 82.9% 74.4% 80% 83.6% 90.2% 79.7%
Out of 59 new CPOs 47 were seen within one week.
Of the remaining 12: -
2 – Court Paperwork Not Available 1 – Offender did not turn up
1 - Other: Client based
3 – Currently on order or supervision
4 – Offender in custody
1 – Offender undertaking paid employment
Local(b) CJ03 % of Community Payback Orders with a
requirement of Unpaid Work or Other Activity commenced within 7 days of order being imposed
Data
Only 40.5% 37.2% 41% 32.7% 35.2% 38.8% 33.3%
Out of 60 CPOs 20 commenced within 7 days of the order being imposed. Of the remaining 40: -
10 - Currently on Order or Supervision
7 - Offender Did Not Turn Up for First Day of
Placement
9 - Offender Undertaking Paid Employment
9 - Other: Client Based
3 - Other: Service Based
1 – Offender ill
1 – Offender in custody
Local CJ04 Total number of new community payback
orders made in the period (adults)
Data
Only 314 355 78 76 92 109 90
Local CJ05 Number of new community payback orders
with an unpaid work requirement made in period (adults)
Data
Only 247 266 61 49 71 85 60
Local CJ12 Number of referrals to the Moray Youth Justice
Service
Data
Only 585 N/A N/A 24 19 18 29
Local CJ13 Number of young people actively engaged
with the Moray Youth Justice Service
Data
Only N/A N/A N/A 20 18 14 19
Integrated Children's Services Looked After Children
Cat Code & Name Current
Target
2016/17 2017/18 2018/19 Q1
2017/18
Q2
2017/18
Q3
2017/18
Q4
2017/18
Q1
2018/19 Latest Note Status
Value Value Value Value Value Value Value Value
Local CSCF100 Number of Looked After Children at the
end of the reporting quarter
Data
Only 222 218 225 212 222 218 224

Cat Code & Name Current
Target
2016/17 2017/18 2018/19 Q1
2017/18
Q2
2017/18
Q3
2017/18
Q4
2017/18
Q1
2018/19 Latest Note Status
Value Value Value Value Value Value Value Value
Local CSCF101 % of Looked After Children cared for in a
Community Setting
Data
Only 82.4% 78.9% 83.5% 81.6% 79.3% 78.9% 78.6%
44 Under Home Supervision – 19.6%
40 Kinship Care – 17.8%%
68 Moray Council Fostering Care – 30.4% 8 Independent Fostering (within Moray) – 3.6%
9 Independent Fostering (out with Moray) – 4%
7 Placed for Adoption – 3.1%
Total – 78.6%
Local CSCF102 % of Looked After Children cared for in Residential accommodation
Data Only
17.6% 21.1% 16.5% 18.4% 20.7% 21.1% 21.4%
23 Residential Placement within Moray – 10.3%
22 Residential Placement out with Moray – 9.8% 3 LAC in Secure Placement – 1.3%
Total – 21.4%
Local CSCF103 % of Looked After Children in Residential
placement within Moray
Data
Only 9.9% 10.5% 8.4% 9% 10.8% 10.5% 10.3% 23 / 224
Local CSCF104 % of Looked After Children in Residential
placement out with Moray
Data
Only 7.7% 9.6% 7.5% 8.5% 9.5% 9.6% 9.8% 22 / 224
Local(b) EdS606.08 % of LAC in Secure Placement 1% 0.45% 0.65% 0.4% 0.9% 0.4% 0.9% 1.3% 3 / 224 LAC at the end of June 2018 in secure
placement
Local CSCF001a % of Looked After and Accommodated
Children in family placement 80% 78.6% 76.38% 79.9% 77.8% 74.4% 73.4% 73.3%
132/180 (180 Looked After and Accommodated
Children in Moray at end of March 2018)
Local CSCF001b % of Looked After and Accommodated
Children in residential placement within Moray 8.5% 11.2% 11.9% 10% 10.8% 13.3% 13.3% 12.8% 23/180
Local CSCF001c % of Looked After and Accommodated
Children in out-of-area placement 10.5% 9.65% 11.2% 9.2% 10.2% 12.2% 13.2% 13.9% 25/180 (when including 3 secure placements)
Local CSCF012 The number, per thousand of the child
population in Moray, looked after and accommodated by the local authority
8 9.22 9.57 9.8 9.5 9.7 9.3 9.7 180/18,568
Local CSCF013 The number, per thousand of the child
population in Moray, subject to compulsory
measures of supervision or care
10 9.65 9.55 9.6 9.4 9.5 9.7 9.7 180/18,568
Lifelong Learning Leisure Management
Cat Code & Name Current
Target
2016/17 2017/18 2018/19 Q1
2017/18
Q2
2017/18
Q3
2017/18
Q4
2017/18
Q1
2018/19 Latest Note Status
Value Value Value Value Value Value Value Value
Local SCC1 Number of attendances per 1,000 population to all pools (cumulative)
Data Only
5630 5714 1396 2791 4091 5714 1364
At the end of the reporting quarter Moray Council
pool attendances fell slightly compared to quarter 1
last year; attendance at council gyms showed an increase; while MLC swimming usage was down on
the same period last year – overall the attendance
rate per 1,000 was marginally down on last year.

Cat Code & Name Current
Target
2016/17 2017/18 2018/19 Q1
2017/18
Q2
2017/18
Q3
2017/18
Q4
2017/18
Q1
2018/19 Latest Note Status
Value Value Value Value Value Value Value Value
Local SCC2 Number of attendances per 1,000 population
for indoor sports and leisure facilities (cumulative)
Data
Only 5152 4503 1185 2108 3225 4503 1041
Both, Moray council staffed community centres and
the health and wellness facilities at MLC reported a
decline in usage figures compared to last year – the data will continue to be monitored closely.
Lifelong Learning Libraries & Information Services
Cat Code & Name Current
Target
2016/17 2017/18 2018/19 Q1
2017/18
Q2
2017/18
Q3
2017/18
Q4
2017/18
Q1
2018/19 Latest Note Status
Value Value Value Value Value Value Value Value
Local(b) CE015 Freedom of Information - Percentage of
requests replied to within twenty working days 95% 99.6% 98.9% 100% 97.6% 98.8% 99.1% 95%
Decrease in % meeting target due to delay in
responses to FOIs from Council Services (138
requests)
Local EdS511.10 Number of new learners at Moray
Libraries Learning Centres
Data
Only N/A 193 56 136 154 193 70
Increase in numbers compared to quarter 1 last
year due to the introduction of ITAs (Individual
Training Accounts).
Local EdS511.11 Number attending sessions at Moray
Libraries Learning Centres
Data
Only N/A 2,301 728 1,241 1,829 2,301 1,495
Significant increase in numbers attending sessions
due to the introduction of Code Clubs.
Local EdS511.12 Number attending Job Clubs Data
Only N/A 1,568 438 875 1,194 1,568 311
Reported fall in job club attendees, largely due to the introduction of Universal Credit and job
coaches unable to support job club during the first
quarter.
Local EdS511.2 Number of borrowers as a percentage of
the population 20% 20% 19.1% 9.6% 15.1% 17.2% 19.1% 10.4%
Increase in borrowers due to the re-instatement of
the book fund and increased publicity.
MI CE037 Data Protection - Percentage of requests
responded to within 40 calendar days 95% 100% 100% 100% 100% 100% 100% 100%
9 requests received and responded to within
timescale.
Lifelong Learning Sports Development
Cat Code & Name Current
Target
2016/17 2017/18 2018/19 Q1
2017/18 Q2
2017/18 Q3
2017/18 Q4
2017/18 Q1
2018/19 Latest Note Status
Value Value Value Value Value Value Value Value
Local EdS006.2 Number attending holiday and term-time
sports coaching programme sessions (cumulative) 500 2,365 2,822 671 1,569 2,219 2,822 752 Exceeding target
Local EdS006.4 Number attending coach education and
training courses 40 220 389 72 128 54 135 97 Exceeding target

Schools and Curriculum Development Childcare
Cat Code & Name Current
Target
2016/17 2017/18 2018/19 Q1
2017/18
Q2
2017/18
Q3
2017/18
Q4
2017/18
Q1
2018/19 Latest Note Status
Value Value Value Value Value Value Value Value
Local EdS605.01 % Looked After 2yr olds attending free
Childcare
Data
Only N/A N/A 92% 78% 60% 88% 75% 6 out of 8 children are accessing 2 year old ELC.
Local EdS605.02 % 2yr olds with a parent in receipt of
qualifying benefits attending free Childcare
Data
Only N/A N/A 69% 76% 79% 85% 88%
Schools and Curriculum Development Early Learning and Childcare Education
Cat Code & Name Current Target
2016/17 2017/18 2018/19 Q1
2017/18
Q2
2017/18
Q3
2017/18
Q4
2017/18
Q1
2018/19 Latest Note Status
Value Value Value Value Value Value Value Value
Local(b) EdS010 % of pre-school centres achieving
satisfactory or better in HMIE inspection reports 100% 100% 0% Annual Indicator N/A
One Nursery group was inspected by HMIE ( as
part of a joint inspection with the Care
Inspectorate) during 2017-18:
Hythehill Primary School Nursery
(All 4 quality indicators were evaluated as weak)
Local EdS010.3 Number of Care Inspectorate reports
which contain requirements 0 13 6 Annual Indicator N/A
6 of the 29 care inspectorate visit to pre-school
centres had a requirement in the inspection report.
Schools and Curriculum Development Primary School Education
Cat Code & Name Current
Target
2016/17 2017/18 2018/19 Q1
2017/18
Q2
2017/18
Q3
2017/18
Q4
2017/18
Q1
2018/19 Latest Note Status
Value Value Value Value Value Value Value Value
Local(b) EdS011 % of Primary Schools receiving an
evaluation of satisfactory or better in HMIE
inspection reports
100% 100% 66% Annual Indicator N/A
Three inspections of Moray Primary Schools were
carried out during 2017-18:
Newmill / Crossroads / Hythehill Primary Schools
(2 of the 3 schools received inspections of
satisfactory or better)

2018/19 Quarter Year to June Housing and Property Services
Performance Report - Performance Indicators
1. THE CUSTOMER/LANDLORD RELATIONSHIP
Cat PI Code & Short Name Target 2016/17 2017/18 2018/19
Q1
2017/18
Q2
2017/18
Q3
2017/18
Q4
2017/18
Q1
2018/19 Latest Note Status
Value Value Value Value Value Value Value Value
Nat(b) H1.1 % of tenants satisfied with the overall services provided by their landlord
90% N/A N/A Not measured for Quarters Survey carried out every three years
Nat(b) H1.3 % who feel landlord is good at keeping them informed about services
90% N/A N/A Not measured for Quarters Survey carried out every three years
Nat(b) H1.4a % of 1st stage complaints resolved
Data only 98.8 98.3 75.0 87.5 100 95.6 97.3
Nat(b) H1.4b % of 2nd stage complaints resolved
Data only 92.3 93.3 68.4 81.3 76.9 84.8 81.3
Nat(b) H1.4c % of complaints upheld Data only 48.1 38.0 53.6 44.1 37.5 26.8 42.9
Nat(b) H1.5a % of 1st stage complaints dealt with within SPSO timescales
100% 96.5 77.8 60 52.4 73.7 97.7 80.6
Nat(b) H1.5b % 2nd stage complaints dealt with within SPSO timescales
100% 85.4 74.3 53.9 53.9 60.0 100 69.2
Nat(b) H1.6 % tenants happy with opportunity to participate in decision making process
80% N/A N/A Not measured for Quarters Survey carried out every three years
Local H1.7a No of MSP enquiries received in period
Data only 78 58 30 20 8 5 30
Local H1.7b % of MSP enquiries responded to within target
90% 89.7 67.7 62.1 60.7 80.0 75.0 100

2. HOUSING QUALITY AND MAINTENANCE
Cat PI Code & Short Name Target 2016/17 2017/18 2018/19
Q1
2017/18
Q2
2017/18
Q3
2017/18
Q4
2017/18
Q1
2018/19 Latest Note Status
Value Value Value Value Value Value Value Value
Nat(b) H2.1 % of stock meeting the SHQS 100% 100 100 Not measured for Quarters
Nat(b) H2.2a % of properties at or above the appropriate NHER rating
100% 100 100 Not measured for Quarters
Nat(b) H2.2b Percentage of stock meeting the Energy Efficiency Standard for Social Housing (EESSH)
65.75% 52.7 55.4 Not measured for Quarters
Nat(b) H2.3 % of tenants satisfied with the standard of their home when moving in
90% 78.3 78.9 82.8 73.3 77.8 75.0 78.4
Nat(b) H2.4 % of tenant satisfied with the quality of their home
90% N/A N/A Not measured for Quarters Survey carried out every three years.
Nat(b) H2.7 Average length of time (hours) to complete emergency repairs
4 2.4 2.6 2.3 2.4 2.7 2.8 2.4
Nat(b) H2.8 Average length of time (working days) to complete non-emergency repairs
10 6.4 7.7 7.5 8.7 7.3 7.2 6.3
Nat(b) H2.9a Number of repairs completed within target time (excl voids)
Data only 16,673 14,880 3,564 3,223 3,649 3,268 2,925
Nat(b) H2.11 % of repairs completed right first time
90% 85.9 81.2 87.8 84.0 82.5 81.2 84.5
Nat(b) H2.12 % of repairs appointments kept 95% 92.4 93.3 93.6 95.1 92.9 92.2 92.5
Nat(b)
H2.13 % of properties that require a gas safety record which had a gas safety check & record completed by the anniversary date
100% 99.9 100 99.9 100 100 100 100
Nat(b)
H2.14 % of tenants who have had repairs or maintenance carried out in last 12 months and are satisfied with the service
90% N/A 83.2 Not measured for Quarters
Local H7.6 Percentage of planned maintenance works completed within agreed programme
98% 95.3 88.4 Not measured for Quarters
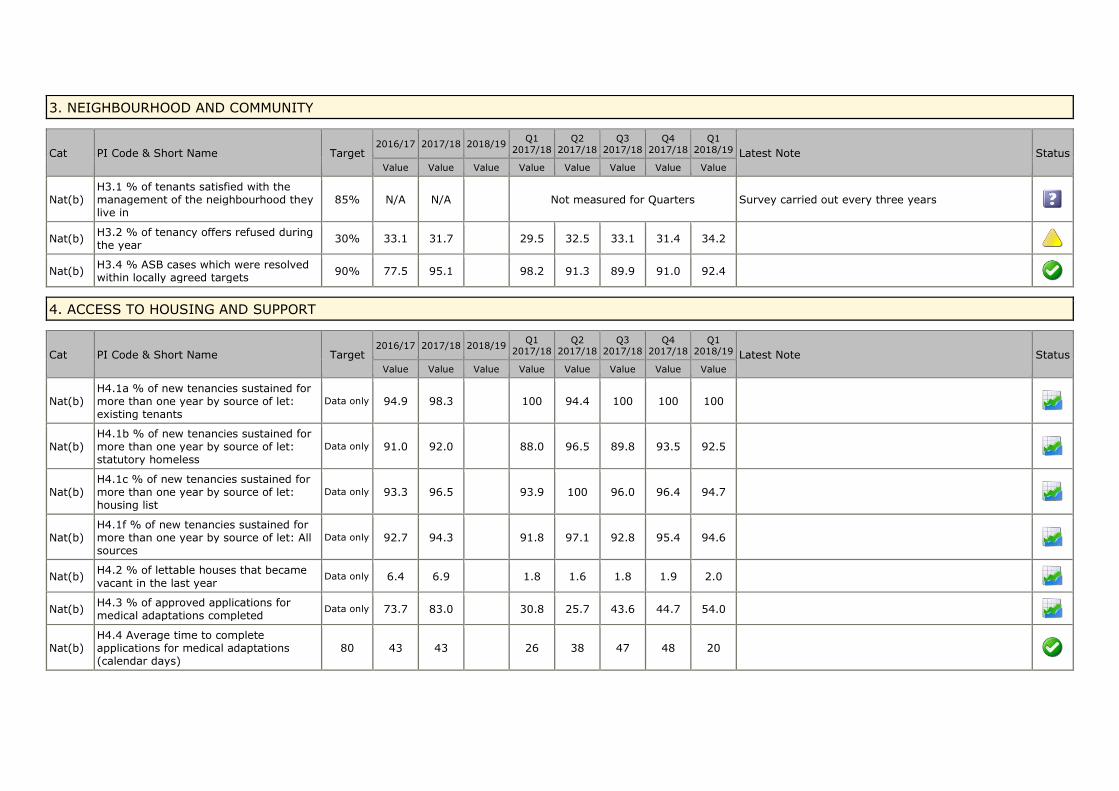
3. NEIGHBOURHOOD AND COMMUNITY
Cat PI Code & Short Name Target 2016/17 2017/18 2018/19
Q1
2017/18
Q2
2017/18
Q3
2017/18
Q4
2017/18
Q1
2018/19 Latest Note Status
Value Value Value Value Value Value Value Value
Nat(b) H3.1 % of tenants satisfied with the management of the neighbourhood they live in
85% N/A N/A Not measured for Quarters Survey carried out every three years
Nat(b) H3.2 % of tenancy offers refused during the year
30% 33.1 31.7 29.5 32.5 33.1 31.4 34.2
Nat(b) H3.4 % ASB cases which were resolved within locally agreed targets
90% 77.5 95.1 98.2 91.3 89.9 91.0 92.4
4. ACCESS TO HOUSING AND SUPPORT
Cat PI Code & Short Name Target 2016/17 2017/18 2018/19
Q1 2017/18
Q2 2017/18
Q3 2017/18
Q4 2017/18
Q1 2018/19 Latest Note Status
Value Value Value Value Value Value Value Value
Nat(b) H4.1a % of new tenancies sustained for more than one year by source of let: existing tenants
Data only 94.9 98.3 100 94.4 100 100 100
Nat(b) H4.1b % of new tenancies sustained for more than one year by source of let: statutory homeless
Data only 91.0 92.0 88.0 96.5 89.8 93.5 92.5
Nat(b) H4.1c % of new tenancies sustained for more than one year by source of let: housing list
Data only 93.3 96.5 93.9 100 96.0 96.4 94.7
Nat(b) H4.1f % of new tenancies sustained for more than one year by source of let: All sources
Data only 92.7 94.3 91.8 97.1 92.8 95.4 94.6
Nat(b) H4.2 % of lettable houses that became
vacant in the last year Data only 6.4 6.9 1.8 1.6 1.8 1.9 2.0
Nat(b) H4.3 % of approved applications for medical adaptations completed
Data only 73.7 83.0 30.8 25.7 43.6 44.7 54.0
Nat(b) H4.4 Average time to complete applications for medical adaptations (calendar days)
80 43 43 26 38 47 48 20

Cat PI Code & Short Name Target 2016/17 2017/18 2018/19
Q1
2017/18
Q2
2017/18
Q3
2017/18
Q4
2017/18
Q1
2018/19 Latest Note Status
Value Value Value Value Value Value Value Value
Nat(b) H4.4a Average time to complete applications for major medical adaptations (calendar days)
Data only 239 176 162 185 166 207 120
Nat(b) H4.4b Average time to complete applications for minor medical adaptations (calendar days)
Data only 16 25 13 14 27 28 17
Nat(b) H4.5 % of court actions initiated which
resulted in eviction Data only 11.4 14.8 28.6 6.3 16.7 7.7 0.0
Nat(b) H4.5a No of court actions initiated Data only 79 61 14 16 18 13 10
Nat(b) H4.5b No of repossession orders granted Data only 21 21 5 5 4 7 5
Nat(b) H4.5c No of properties recovered for: Non payment of rent
Data only 9 9 4 1 3 1 0
Nat(b) H4.5ci No of properties recovered for: Anti Social Behaviour
Data only 0 0 0 0 0 0 0
Nat(b) H4.5cii No of properties recovered for: Other
Data only 0 0 0 0 0 0 0
Nat(b) H4.6a Average length of time in temp accomm by type (weeks): LA ordinary dwelling
Data only 14.8 14.8 17.3 13.2 13.1 15.5 16.2
Nat(b) H4.6b Average length of time in temp accomm by type (weeks): HA/RSL ordinary dwelling
Data only 14.6 14.2 12.4 9.6 15.1 23.6 18.1
Nat(b) H4.6c Average length of time in temp accomm by type (weeks): Hostel - LA owned
Data only 6.9 19.4 26.5 2.5 31.2 7.6 13.8
Nat(b) H4.6d Average length of time in temp accomm by type (weeks): Hostel - RSL
Data only 14.1 16.9 15.9 19.3 15.3 17.3 13.5
Nat(b) H4.6e Average length of time in temp accomm by type (weeks): Hostel - other
Data only 10.7 13.2 16.7 12.6 12.6 11.2 8.7
Nat(b) H4.6f Average length of time in temp accomm by type (weeks): Bed & Breakfast
Data only 1.1 0.6 0.6 0.4 0.2 0.0 0.0
Nat(b) H4.6g Average length of time in temp Data only 21.8 14.7 17.1 12.0 13.2 19.3 11.8

Cat PI Code & Short Name Target 2016/17 2017/18 2018/19
Q1
2017/18
Q2
2017/18
Q3
2017/18
Q4
2017/18
Q1
2018/19 Latest Note Status
Value Value Value Value Value Value Value Value
accomm by type (weeks): Women's refuge
Nat(b) H4.6h Average length of time in temp accomm by type (weeks): Private Sector Lease
Data only 0.0 2.3 2.7 0.6 0.7 10.9 0.0
Nat(b) H4.6i Average length of time in temp accomm by type (weeks): Other
Data only 0.0 0.3 0.0 0.0 0.0 0.3 10.0
Nat(b) H4.7 % of households requiring temp or emergency accomm to whom an offer was made
100% 100 100 100 100 100 100 100
Nat(b) H4.8 % of temp or emergency accomm offers refused in the last year by accommodation type
7% 11.1 7.9 5.3 11.0 9.2 6.9 7.0
Nat(b)
H4.9 % satisfied with the quality of temporary or emergency accommodation (of those households homeless in the last 12 months)
90% 89.8 94.4 100 87.5 100 100 62.5 5 of 8
Local H4.13 Percentage of homelessness assessments completed within 28 days
100% 96.2 96.6 94.8 99.3 96.9 98.4 98.1
Local H4.15 Percentage of housing applications admitted to list within 10 days
100% 99.5 99.6 99.8 100 100 100 100
Local H4.18a % allocations by group: Homeless Priority
40% 54.9 51.2 47.7 51.8 54.6 51.3 36.2
Local H4.18b % allocations by group: Waiting List
40% 29.8 28.0 34.2 25.9 19.4 31.9 35.4
Local H4.18c % allocations by group: Transfer List
20% 15.3 20.8 18.0 22.4 25.9 16.8 28.5
5. GETTING GOOD VALUE FROM RENTS AND SERVICE CHARGES
Cat PI Code & Short Name Target 2016/17 2017/18 2018/19
Q1 2017/18
Q2 2017/18
Q3 2017/18
Q4 2017/18
Q1 2018/19 Latest Note Status
Value Value Value Value Value Value Value Value
Nat(b) H5.1 Percentage of tenants who feel that the rent for their
84% N/A N/A Not measured for Quarters Survey carried out every three years

Cat PI Code & Short Name Target 2016/17 2017/18 2018/19
Q1
2017/18
Q2
2017/18
Q3
2017/18
Q4
2017/18
Q1
2018/19 Latest Note Status
Value Value Value Value Value Value Value Value
property represents good value for money
Nat(b) H5.2 Rent collected as % of total rent due
99% 99.5 101.8 97.7 96.5 101.0 102.6 100.4 97.7
Nat(b) H5.3 Gross rent arrears as a % of rent due
2.8% 2.5 2.4 2.8 3.0 2.5 2.4 2.9
Nat(b) H5.3a Total value of gross rent arrears (£)
Data
only £430,186. £432,218. £529,146. £539,213. £539,354. £451,087. £432,218. £529,146.
Nat(b) H5.4 % of rent lost due to
voids 0.63% 0.54 0.66 0.56 0.41 0.76 0.89 1.02
As stated in the previous quarter, ‘This can be attributed mainly to pressures within the Council’s Building Services (DLO), which continues to have problems recruiting to key trades. In addition, some delays have been caused while waiting for asbestos surveys to be carried out by external consultants. Structural changes within the DLO voids team were implemented just prior to year-end with the aim of improving void performance. Realistically due to the current voids backlog, this is unlikely to take effect until the second quarter of 2018/19’
Nat(b) H5.5 Current tenants' arrears as a % of net rent due
3.5% 2.8 2.7 3.8 4.0 3.1 2.7 3.8
Nat(b) H5.6 Average time taken to re-let empty properties (calendar days)
32 31 35 30 30 35 44 45 See 5.4
Local H5.10 Former tenant arrears - value
Data
only £91,876 £102,623 £105,599 £105,873 £108,313 £107,785 £102,623 £105,599
Local H5.11 % of tenants giving up tenancy in arrears
Data
only 26.6 26.5 21.1 22.1 22.3 25.7 26.5 21.1
Local H5.12 % of Former Tenants Arrears written off & collected
Data
only 81.3 71.4 8.8 10.4 22.3 43.4 71.4 8.8

6. GYPSY/TRAVELLERS
Cat PI Code & Short Name Target 2016/17 2017/18 2018/19
Q1
2017/18
Q2
2017/18
Q3
2017/18
Q4
2017/18
Q1
2018/19 Latest Note Status
Value Value Value Value Value Value Value Value
Local H6.1a No of new unauthorised encampments within period
Data only 22 20 12 6 2 0 10
Local H6.1b No of encampments ended within
period Data only 21 21 12 5 3 1 11
Local H6.1c Average duration of encampments ended within period (days)
Data only 26 55 76 23 42 15 66
Local H6.2 % of new unauthorised encampments visited within target timescale
100% 100 100 100 100 100 N/A 100