2018.02.28 - Kiawah Presentation
41
welcome
Transcript of 2018.02.28 - Kiawah Presentation

welcome


Infrastructure Resiliency Planning & Strategy at the Municipal Level
Adapt, Thrive, and Survive Climate Impacts

Who we are• Since 1899• Over 500
professionals• 19 Office
Locations on East Coast
• Three companies

Proven Industry Leader
• Top 50 Trenchless Design Firm in US (Rank #18)*• Top 200 Design Firm in US (Rank #186)**• Top 200 Environmental Engineering Firm in US (Rank #117)**• Top 500 Design Firm in US**
*According to Trenchless Technology
**According to the Engineering News Record

• Water
• Wastewater
• MEP/SCADA
• Stormwater
• Infrastructure Resiliency
• Architecture
• Landscape Architecture
• Information Technology/GIS
• Transportation
• Solid Waste
Weston & Sampson Services

• Renewable Energy
• Hazardous Waste Services
• Structural Engineering
• Geotechnical Engineering, Dams
• Public Works Facilities
• Surveying
• Environmental Science & Permitting
• Operation & Maintenance Services
• Construction
Weston & Sampson Services

• Operation & Maintenance• Water & Sewer System
Maintenance• Emergency Repairs (24 - 7) • Cross Connection Control
& Backflow Prevention• Treatment Plant & System
Operations• Design/Build• Construction
CMR & SERVICES

Recent Resiliency & Flooding Projects• Church Creek Drainage Project – Charleston, SC
• City of Boston Climate Resilience Design Standards – Boston, MA
• MBTA Blueline (Aquarium to Maverick Stations) Flood Vulnerability Assessment – Boston, MA
• DCR Draw Seven Park – Somerville, MA
• DCAMM State-wide Resiliency Master Plan, Massachusetts
• Coastal Vulnerability Assessment Lynn Economic Development & Industrial Corporation – Lynn, MA
• LoPresti Park Engineering and Design Services –East Boston, MA
• Chelsea Creek Wetland Restoration/Habitat Conservation – Chelsea, MA
• Chelsea Flood Resiliency Improvements –Chelsea, MA
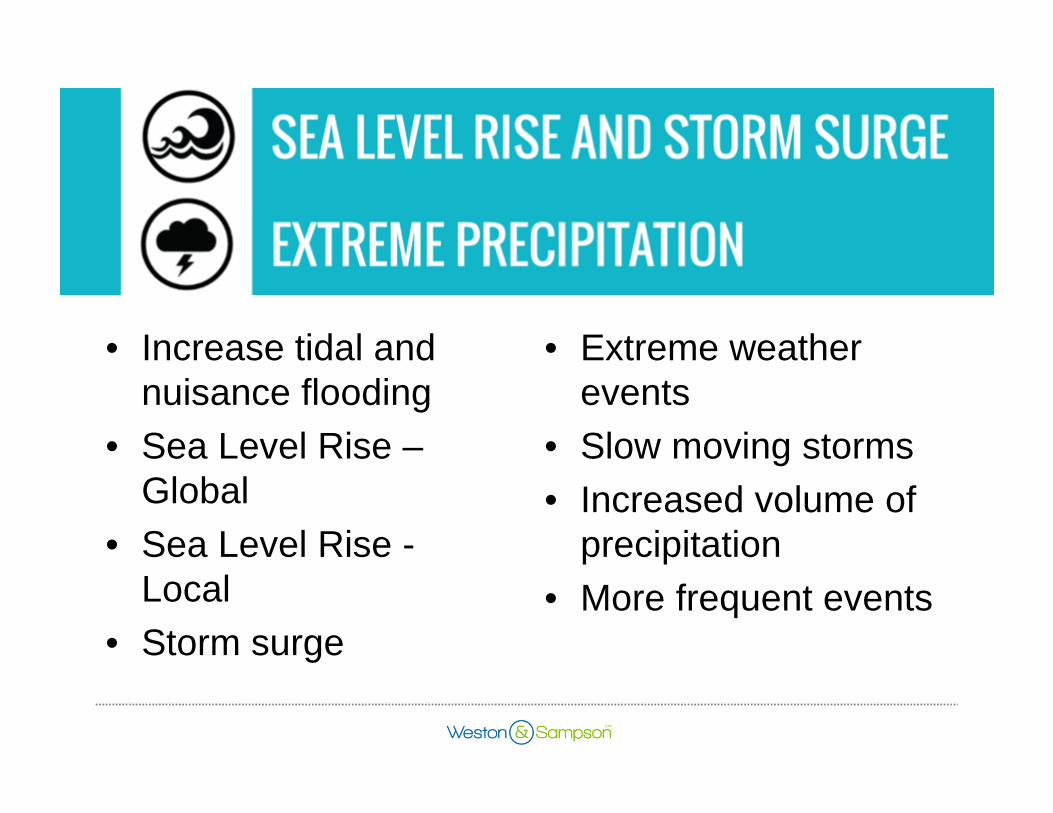
• Increase tidal and nuisance flooding
• Sea Level Rise –Global
• Sea Level Rise -Local
• Storm surge
• Extreme weather events
• Slow moving storms• Increased volume of
precipitation• More frequent events

TASK 6Implement adaptation and preparedness plan and monitor progress
TASK 5Identify and select adaptation strategies using C.E.F.T.A.C. analysis
TASK 4Evaluate risk given probability of climate scenario and consequence
TASK 3Identify the tipping point that would damage each critical asset
TASK 2Identify critical assets located in vulnerable areas
TASK 1
Map climate conditions under future conditions
PHASE 1 – CLIMATE
SCENARIO SELECTION
PHASE 2 –
VULNERABILITY AND
RISK ANALYSIS
PHASE 3 – ADAPTATION
STRATEGIES
Resiliency Process

PHASE 1 – CLIMATE SCENARIO SELECTION
• Synthesis of available relevant technical
analyses and reports
• Coastal Geomorphology
• Watershed Characteristics
• Asset Locations and Information
• Compilation of GIS data
• Development of Study Scenarios
• Preliminary review of relevant regulations
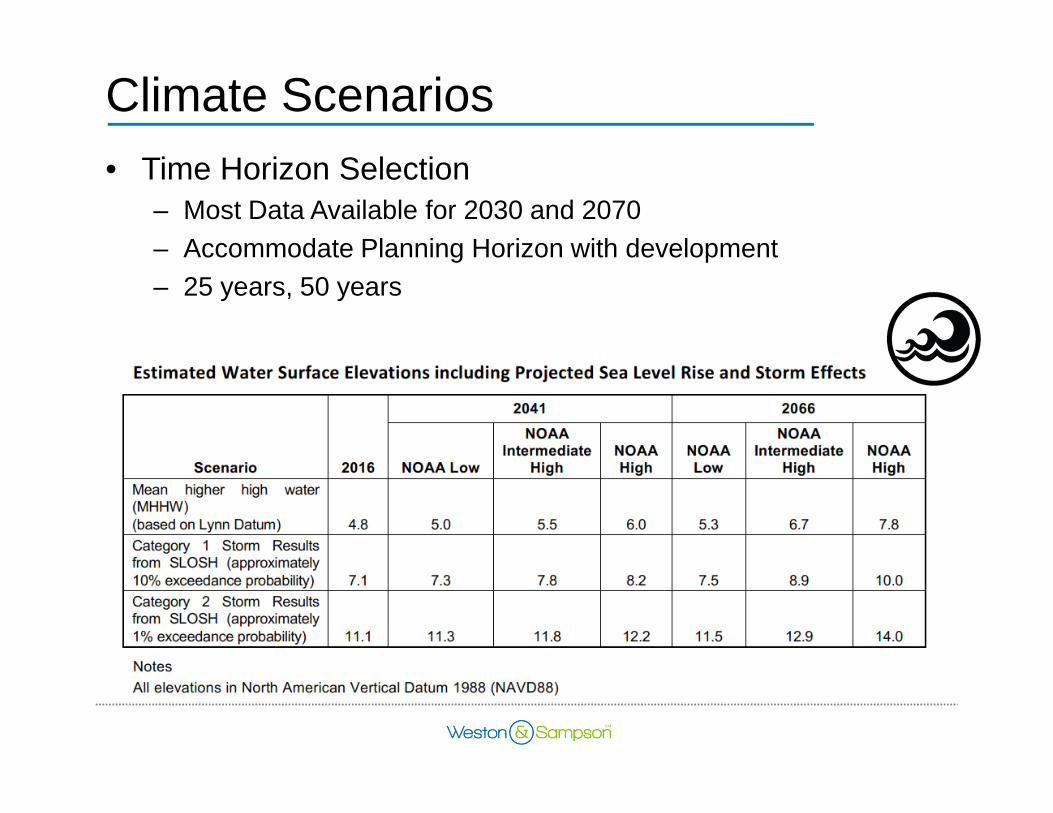
• Time Horizon Selection– Most Data Available for 2030 and 2070– Accommodate Planning Horizon with development– 25 years, 50 years
Climate Scenarios

Existing Sea Level

1 ft. Sea Level Rise

2 ft. Sea Level Rise

3 ft. Sea Level Rise

Bathtub versus dynamic model• Storm events striking an area can result
in significantly different impacts – timing of the storm with the tide cycle– storm track– radius to maximum wind of a tropical storm– amount of precipitation, etc.
• Data for design– Probability of flooding (annual
exceedance)– Depth of Flooding– Flood pathways– Residence times– Wind– Waves– Percent probability exceedance over all
time horizons
Source: The Woods Hole Group. Kirk Bosma: CLIMATE CHANGE PRIORITIZATION,
EcoSeptember 2016

Flood Pathways & Residence Times

Precipitation and Inland Flooding

PHASE 2 – VULNERABILITY AND RISK ANALYSIS
INFRASTRUCTURE & PROPERTY
CLIMATE HAZARDS
CRITICAL ASSETS
RISK RANKING

22
January 17, 2017 Climate Change Adaptation and Uncertainty
Local Sea Level Rise

23
• Sea Level Rise & Storm Surge
• Inland Precipitation
• Heat
• Sea Level Rise & Storm Surge
• Inland Precipitation
• Heat
CLIMATE CHANGE SCENARIOS
P(Event)
• Review of Existing Information
• Inspection
• Interview
• Review of Existing Information
• Inspection
• Interview
SITE/FACILITY CHARACTERIZATION
P(Damages|Event) = Adaptive Capacity *
Sensitivity
Risk =P(Event)*P(Damages)
*Consequence
ADAPTATION
STRATEGIES
Mitigate Risk
Risk Analysis – Site Specific
• Interview
• Public Health & Safety
• Economic Impact
• Interdependency
• Interview
• Public Health & Safety
• Economic Impact
• Interdependency
SITE/FACILITY CHARACTERIZATION
Consequence
Vulnerable Facility Elements
Identify Site Exposure and Scenarios

Site Specific Evaluation and Inspection

25
Data Collection and Tabulation

PHASE 3 – ADAPTATION STRATEGIES

PHASE 3 – ADAPTATION STRATEGIES
Source: Massachusetts Stormwater Handbook

Cost
$$$
Effectiveness
(Risk Reduction)
Feasibility
(Implementation)
Timing
(Short Term vs. Long Term)
Adaptability
(Flexibility)
Co-benefits
(Mitigation)
Adaptation Criteria – C.E.F.T.A.C

Adaptation Strategies – Co-benefits
CONTRIBUTIVE – Opportunity to make changes in your community.

DRAW SEVEN PARK
Elevate and ProtectIncremental Adaptation
Embrace Water
Image credit: Brooklyn Bridge Park, Julienne
Schaer
Image credit: Brooklyn Bridge Park, Etienne
FrossardImage credit: Brooklyn Bridge Park, Julienne
Schaer
• Elevate grades for
critical site features
• Elevated walkways
• Flood barriers
• Identify site evolution
Design for future climate
impacts
• Downstream protection
• Identify areas to
embrace water for
frequent flooding
and storm events
CLIMATE RESILIENCE MEASURES TO MANAGE CHRONIC AND ACUTE CHANGES IN ENVIRONMENT OVER TIME


Church Creek Drainage Design

Boston Public Works DepartmentClimate Resilient Design Standards – Incremental Approaches
Transform Harborwalk into flood barrier
Create vegetated berms in waterfront open spaces as flood barrier
Source: “The Low Battery.” Design Division For The Common Good, www.designdivision.org/lowbattery/.
Source: Blackman, Austin, et al. “COASTAL RESILIENCE SOLUTIONS FOR EAST BOSTON AND
CHARLESTOWN.” Climate Ready Boston.
Source: Carlson, Jen. “Brooklyn Bridge Park Now 80% Complete As Pier 5 Uplands Officially Open.” Gothamist, 7 July 2017, 1:55 PM,
gothamist.com/2017/07/07/brooklyn_bridge_park_pier_5_uplands_photos.php#photo-10. (left) and Scioto
Mile_Columbus_greenways3_MKSK(right)

Boston Public Works DepartmentClimate Resilient Design Standards – Incremental Approaches
Raise roadways to create flood barrier
Standards for deployable flood barriers
Source: Blackman, Austin, et al. “COASTAL
RESILIENCE SOLUTIONS FOR EAST BOSTON
AND CHARLESTOWN.” Climate Ready Boston.
Source:
ttps://www.norfolk.gov/DocumentCenter/View/1
6292
Source: “Austria's mighty mobile flood walls can hold back 15 ft of floodwater-an ingenious initiative! - NTD Inspired.”
Www.ntd.tv, 16 Sept. 2017, www.ntd.tv/inspiring/life/austrias-mighty-mobile-flood-walls-can-hold-back-15-ft-of-
floodwater-an-ingenious-initiative.html.
Source: “ILC Dover – Side Deployed Flexwall

Chelsea Pump Station Example: Resilience tied into existing project
• Approx. 1,400 feet of new stormwater force main and abandonment of existing
force main
• A new discharge structure at a culvert
• Flood resiliency improvements at the Carter Street Pump Station
• A wall around the perimeter of the pump station and a surface drain
system to remove water captured within the enclosed perimeter
Weston & Sampson provided design, permitting, and bidding services. The scope of
work included:

• Base-flood Elevation
• Hydrostatic Pressure and Uplift
• Geotechnical• Structural• Interior drainage• Systems upgrades• Emergency Power• Access
Design Considerations

• Planning Horizon: Before & During
• Strategy: Protect
• Cost – $ - $$. Customized to openings
• Effectiveness – Max: depends on structural strength of
building walls and connections
• Feasibility – Yes: easy to install, use, store and transport
• Adaptability – Flexible: Adjust to water height
• Timing - Short term: <1 hour installation
• Co-benefits - No.
Image courtesy of PS Flood Barriers
VULNERABLE
FACILITY ELEMENTLOCATION
CLIMATE
STRESSPRIORITY
Basement doorways to
Outdoor Equipment Room,
Mechanical Room, etc.
North side of site Extreme
Precipitation &
Flooding
High
Adaptation Strategies – Example
Image courtesy of Global Industrial

Design Considerations for Kiawah
• Surrounded by water • Beach erosion • Three tidal inlets• Transport of fines• Settlement • Liquefaction• Groundwater
(existing and future)• Ecosystem/Habitat
• Public Health and Safety
• Transportation• Property and real estate• Tourism• Salt marsh• Drainage and outfalls• Power and Electricity• Communications


questions?westonandsampson.com

thank youwestonandsampson.com


![2006 EAST END BEACH RESTORATION PROJECT KIAWAH … · Coastal Science & Engineering (CSE) March 2011 – Year 4 Annual Monitoring Report [2258] 5. Kiawah Island, South Carolina. The](https://static.fdocuments.us/doc/165x107/5f9ec6937149d12d897451d8/2006-east-end-beach-restoration-project-kiawah-coastal-science-engineering.jpg)