2018 Schools Survey Report: SLP Caseload …...ASHA Schools Survey Report: SLP Caseload...
15
Schools Survey Report: SLP Caseload Characteristics Trends 2000–2018 Gail Brook, Surveys and Analysis American Speech-Language-Hearing Association 2200 Research Boulevard Rockville, MD 20850-3289 September 10, 2018
Transcript of 2018 Schools Survey Report: SLP Caseload …...ASHA Schools Survey Report: SLP Caseload...

Schools Survey Report: SLP Caseload Characteristics Trends 2000–2018
Gail Brook, Surveys and Analysis American Speech-Language-Hearing Association 2200 Research Boulevard Rockville, MD 20850-3289 September 10, 2018

ASHA Schools Survey Report: SLP Caseload Characteristics Trends, 2000–2018 Page 2 of 15
Contents
Introduction…………………………………………………………………………. 3
Survey Report Highlights......………………………………………………………. 3
Caseload Size………………………………………………………………………. 4
Areas of Intervention………………………………………………………………. 5
Weekly Activities……………………………………………………………….......
5
Missed Sessions With Students……………………………………………………. 6
Role in MTSS/RtI………………………………………………………………....... 7
Survey Methodology………………………………………………………………. 8
Response Rates…………………………………………………………………....... 8
Suggested Citation…………………………………………………………………. 8
Additional Information………………………………………………………........... 8
Questions?................................................................................................................... 8
Acknowledgment………………………………………………………………........ 8
Appendix…………………………………………………………………………….
9
Key of Geographic Regions/Divisions and Corresponding States………………
10
Data Tables………………………………………………………………………
11

ASHA Schools Survey Report: SLP Caseload Characteristics Trends, 2000–2018 Page 3 of 15
Introduction
The American Speech-Language-Hearing Association (ASHA) conducted the 2018 Schools Survey
to gather information about professional issues related to school-based services. Results from this
survey are presented in a series of reports, including this report on speech-language pathologist (SLP)
caseload characteristics trends.
Findings from the 2000, 2004, 2006, 2008, 2010, 2012, 2014, and 2016 ASHA Schools Surveys and
the 2000 ASHA Omnibus Survey are included in this report for comparative purposes. Questions
differ among surveys, so data on all topics are not available for all survey years.
Survey Report Highlights
In 2018, SLPs had a median monthly caseload size of 48—up slightly from 47 in 2012 and
the same as in 2014 and 2016.
From 2000 to 2018, caseload size was lower in special day or residential schools (23–30)
and in preschools (37–41) than in other types of schools.
SLPs in Ohio consistently had among the largest caseload sizes (55–61) from 2000 to 2018.
SLPs in New York consistently had among the smallest caseload sizes (30–50).
In 2016 and 2018, SLPs in the Northeast had smaller caseload sizes (36–38) than did SLPs
in other regions of the country.
From 2014 to 2018, about 90% of SLPs treated students with autism spectrum disorder,
language disorders, and speech sound disorders.
From 2014 to 2018, SLPs’ caseloads included a higher number of students with language
disorders, reading and writing difficulties, and speech sound disorders than with other
disorders.
From 2014 to 2018, overall, SLPs spent much of their time each week (18–20 hours) in
pullout services to students.
From 2014 to 2018, SLPs in elementary schools spent more time in pullout services per
week (20–22 hours) than did SLPs in other types of schools.
In 2016 and 2018, most SLPs (54%) were required to make up missed sessions with
students any time they missed a session for any reason.
From 2010 to 2018, most SLPs participated in Multi-Tiered System of Supports
(MTSS)/Response to Intervention (RtI) or pre-referral. About half of SLPs conducted
screenings, provided consultation as a member of the pre-referral team, and offered
strategies to classroom teachers.

ASHA Schools Survey Report: SLP Caseload Characteristics Trends, 2000–2018 Page 4 of 15
Caseload Size
In 2018, SLPs had a median monthly caseload size of 48—up slightly from 47 in 2012 and the same as
in 2014 and 2016 (see Appendix Table 1). In other words, each SLP treated about 48 different
students in a typical month.
Caseload Size, by School Setting
Caseload size differed by school setting. From 2000 to 2018, caseload size was lower in special day
or residential schools and preschools than in other school settings (23–30 for special day or
residential schools and 37–41 for preschools; see Appendix Table 1).
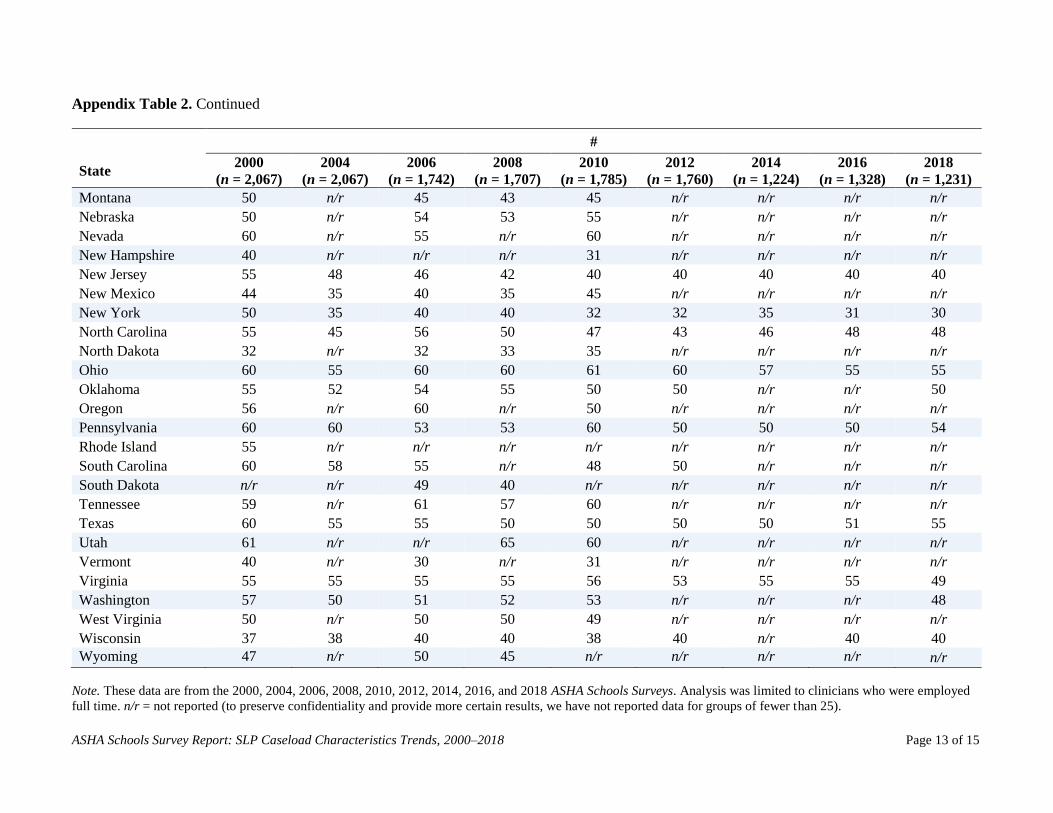
Caseload Size, by State
Caseload size varied by state. From 2000 to 2018, SLPs in California and Ohio consistently had
among the largest caseload sizes (55–60 and 55–61, respectively). SLPs in New York and Missouri
consistently had among the smallest caseload sizes (30–50 and 39–50, respectively; see Appendix
Table 2).
Caseload Size, by Geographic Region
Caseload sized varied by geographic region. In 2016 and 2018, SLPs in the Northeast—especially in
the Mid-Atlantic states—had smaller caseload sizes than did SLPs in other regions of the country
(see Table 1 and page 10 for a key of geographic regions/divisions and corresponding states).
Table 1. Median monthly caseload size of school-based SLPs, by geographic region and year.
#
Geographic region 2016
(n = 1,328)
2018
(n = 1,539)
Northeast 38 36
New England 40 40
Mid-Atlantic 37 35
Midwest 48 49
East North Central 50 50
West North Central 41 43
South 50 50
South Atlantic 50 50
East South Central 55 57
West South Central 50 50
West 52 54
Mountain 52 55
Pacific 48 52
Note. These data are from the 2016 and 2018 ASHA Schools Surveys. Analysis was limited to clinicians who were
employed full time.
ASHA Schools Survey Report: SLP Caseload Characteristics Trends, 2000–2018 Page 5 of 15
Areas of Intervention
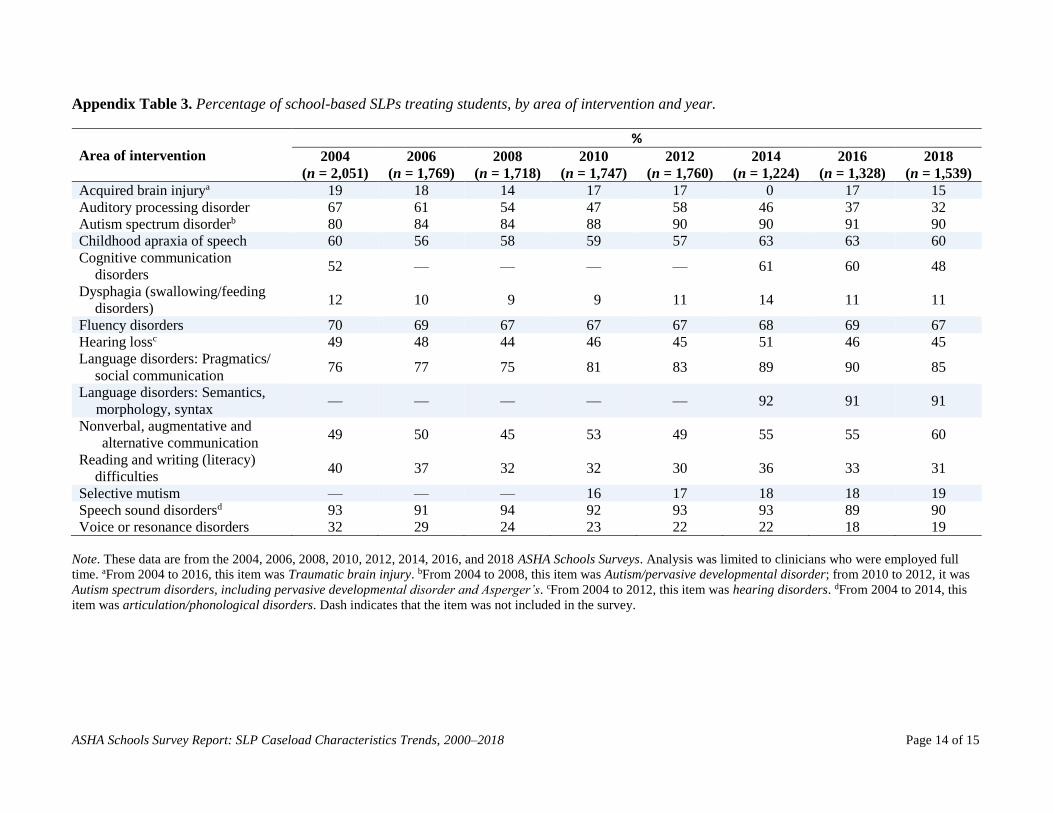
SLPs served students in numerous areas of intervention. From 2014 to 2018, about 90% of SLPs
served students with autism spectrum disorder, language disorders, and speech sound disorders.
About 70% of SLPs served students with fluency disorders (see Appendix Table 3).
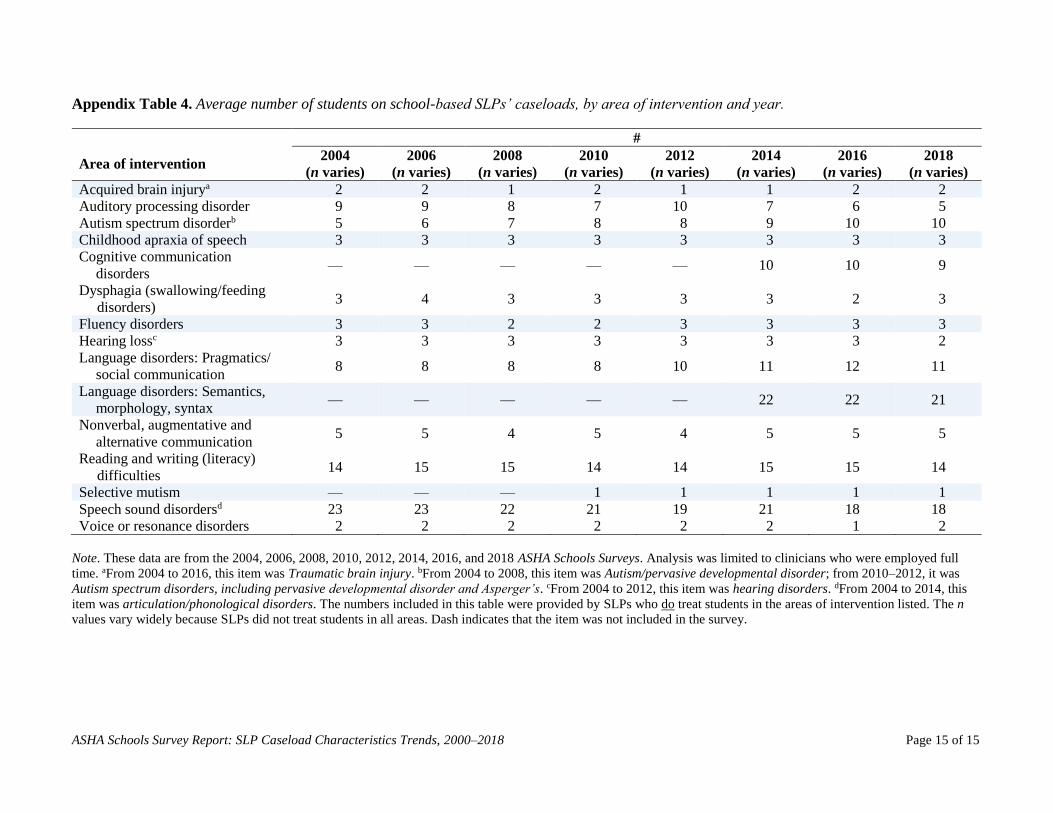
From 2014 to 2018, SLPs’ caseloads included a higher number of students with language disorders,
reading and writing (literacy) difficulties, and speech sound disorders than with other disorders (see
Appendix Table 4).
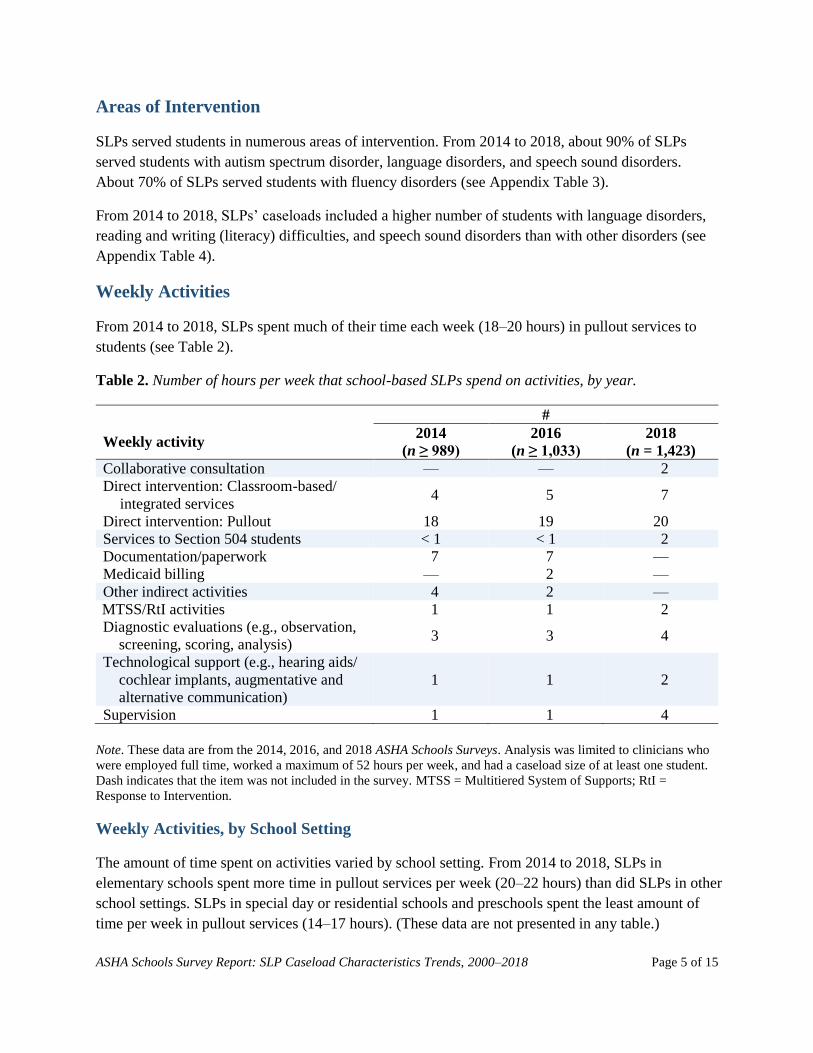
Weekly Activities
From 2014 to 2018, SLPs spent much of their time each week (18–20 hours) in pullout services to
students (see Table 2).
Table 2. Number of hours per week that school-based SLPs spend on activities, by year.
#
Weekly activity 2014
(n ≥ 989)
2016
(n ≥ 1,033)
2018
(n = 1,423)
Collaborative consultation — — 2
Direct intervention: Classroom-based/
integrated services 4 5 7
Direct intervention: Pullout 18 19 20
Services to Section 504 students < 1 < 1 2
Documentation/paperwork 7 7 —
Medicaid billing — 2 —
Other indirect activities 4 2 —
MTSS/RtI activities 1 1 2
Diagnostic evaluations (e.g., observation,
screening, scoring, analysis) 3 3 4
Technological support (e.g., hearing aids/
cochlear implants, augmentative and
alternative communication)
1 1 2
Supervision 1 1 4
Note. These data are from the 2014, 2016, and 2018 ASHA Schools Surveys. Analysis was limited to clinicians who
were employed full time, worked a maximum of 52 hours per week, and had a caseload size of at least one student.
Dash indicates that the item was not included in the survey. MTSS = Multitiered System of Supports; RtI =
Response to Intervention.
Weekly Activities, by School Setting
The amount of time spent on activities varied by school setting. From 2014 to 2018, SLPs in
elementary schools spent more time in pullout services per week (20–22 hours) than did SLPs in other
school settings. SLPs in special day or residential schools and preschools spent the least amount of
time per week in pullout services (14–17 hours). (These data are not presented in any table.)

ASHA Schools Survey Report: SLP Caseload Characteristics Trends, 2000–2018 Page 6 of 15
Missed Sessions With Students
In 2016 and 2018, most SLPs (54%) were required to make up missed sessions with students any
time they missed a session for any reason. Nearly half of SLPs (40%) were not required to make up
missed sessions (see Table 3).
Table 3. Percentage of school-based SLPs who are required to make up missed sessions, by
circumstance and year.
%
Circumstance 2016
(n = 1,597)
2018
(n = 1,864)
I am not required to make up
missed sessions. 40 40
When the student misses a
session due to an assembly or
a classroom activity
12 13
Any time a student misses a
session for any reason 8 9
Any time I miss a session for
any reason 54 54
Note. These data are from the 2016 and 2018 ASHA Schools Surveys. Analysis was limited to clinicians who were
employed full or part time. There is not enough evidence from the data to say that the responses varied by school
setting.

ASHA Schools Survey Report: SLP Caseload Characteristics Trends, 2000–2018 Page 7 of 15
Role in MTSS/RtI
From 2010 to 2018, most SLPs participated in MTSS/RtI or pre-referral. About half of SLPs
conducted screenings, provided consultation as a member of the pre-referral team, and provided
strategies to classroom teachers. About one third of SLPs (27%–41%) provided direct services within
general education. Fewer than one third of SLPs (23%–32%) did not participate in MTSS/RtI or pre-
referral (see Table 4).
Table 4. Percentage of school-based SLPs participating on MTSS/RtI or pre-referral teams, by role
and year.
%
Role 2010
(n = 2,198)
2012
(n = 2,202)
2014
(n = 1,517)
2016
(n = 1,597)
2018
(n = 1,864)
Conduct screenings 47 56 60 55 54
Provide consultation as a
member of the pre-
referral teama
52 60 64 55 55
Provide direct services
within general education 32 35 41 30 27
Provide strategies to
classroom teachers 52 56 61 58 57
Not applicable; I don’t
participate in MTSS/RtI
or pre-referral.
32 26 23 27 28
Note. These data are from the 2010, 2012, 2014, 2016, and 2018 ASHA Schools Surveys. Analysis was limited to
clinicians who were employed full or part time. aIn the 2010, 2012, and 2014 surveys, this item was provide
consultation.
Role in MTSS/RtI, by School Setting
Participation in MTSS/RtI or pre-referral varied greatly by school setting. From 2010 to 2018,
participation was most common in elementary schools and least common in special day or residential
schools. Fewer than one quarter (13%–24%) of SLPs in elementary schools did not participate in
MTSS/RtI or pre-referral compared with about three-quarters (67%–85%) of SLPs in special day or
residential schools. (These data are not presented in any table.)

ASHA Schools Survey Report: SLP Caseload Characteristics Trends, 2000–2018 Page 8 of 15
Survey Methodology
The survey was mailed in February 2018 to a random sample of 4,500 ASHA-certified SLPs and 500
ASHA-certified audiologists employed in school settings in the United States. The sample was
stratified by state. Small groups, such as SLPs and audiologists in Wyoming, were oversampled. A
survey notification email was sent at the time of the mailing. Second and third mailings followed, at
approximately 3- or 4-week intervals, to individuals who had not responded to earlier mailings.
Response Rates
Of the original 4,500 SLPs in the sample plus four other SLPs who returned surveys without any
identifying number, six had incorrect mailing addresses, nine had retired, 29 were employed in other
types of facilities, six were not employed in the profession, and four were ineligible for other reasons,
which left 4,450 possible respondents. The actual number of respondents was 2,170—a 48.8%
response rate.
Past ASHA Schools Survey response rates were as follows:
2000: 43.0% (ASHA Schools Survey); 61.0% (ASHA Omnibus Survey)
2004: 69.7%
2006: 64.9%
2008: 64.0%
2010: 64.8% (overall); 65.5% (among SLPs)
2012: 63.6% (overall); 64.7% (among SLPs)
2014: 46.0% (overall); 47.0% (among SLPs)
2016: 47.4% (overall); 47.9% (among SLPs)
Suggested Citation
American Speech-Language-Hearing Association. (2018). Schools survey report: Caseload
characteristics trends, 2000–2018. Available from www.asha.org
Additional Information
Companion reports are available on the ASHA website at
www.asha.org/research/memberdata/schoolssurvey/.
Questions?
For additional information regarding this report or school services generally, please contact Jaumeiko
Coleman, director of school services, at [email protected].
Acknowledgment
Without the generous cooperation of the members who participate in our surveys, ASHA could not
fulfill its mission to provide vital information about the professions and discipline to the Association
membership and public. Thank you!

ASHA Schools Survey Report: SLP Caseload Characteristics Trends, 2000–2018 Page 9 of 15
Appendix

ASHA Schools Survey Report: SLP Caseload Characteristics Trends, 2000–2018 Page 10 of 15
Key of geographic regions/divisions and corresponding states.
Geographic region/division Corresponding states
Northeast
New England CT, ME, MA, NH, RI, VT
Mid-Atlantic NJ, NY, PA
Midwest
East North Central IL, IN, MI, OH, WI
West North Central IA, KS, MN, MO, NE, ND, SD
South
South Atlantic DE, DC, FL, GA, MD, NC, SC, VA, WV
East South Central AL, KY, MS, TN
West South Central AR, LA, OK, TX
West
Mountain AZ, CO, ID, MT, NV, NM, UT, WY
Pacific AK, CA, HI, OR, WA

ASHA Schools Survey Report: SLP Caseload Characteristics Trends, 2000–2018 Page 11 of 15
Appendix Table 1. Median monthly caseload size of SLPs, by school setting and year.
School setting
#
2000
(n ≤ 519)
2004
(n = 2,052)
2006
(n = 1,772)
2008
(n = 1,721)
2010
(n = 1,749)
2012
(n = 1,760)
2014
(n = 1,224)
2016
(n = 1,328)
2018
(n = 1,539)
Overalla 48 50 50 50 50 47 48 48 48
Special day or residential
school 23 25 27 28 28 25 24 30 27
Preschool 40 40 40 40 40 37 41 38 40
Elementary school 50 52 52 50 50 50 50 50 50
Secondary school (middle
school, junior high, or
senior high)
48 50 55 49 50 48 50 50 48
Combination of the above
school settings 48 50 55 50 50 50 52 45 48
Note. These data are from the 2000 ASHA Omnibus Survey and from the 2004, 2006, 2008, 2010, 2012, 2014, 2016, and 2018 ASHA Schools Surveys. Analysis was
limited to clinicians who were employed full time. aOverall includes respondents who did not indicate a school setting.

ASHA Schools Survey Report: SLP Caseload Characteristics Trends, 2000–2018 Page 12 of 15
Appendix Table 2. Median monthly caseload size of school-based SLPs, by state and year.
#
State 2000
(n = 2,067)
2004
(n = 2,067)
2006
(n = 1,742)
2008
(n = 1,707)
2010
(n = 1,785)
2012
(n = 1,760)
2014
(n = 1,224)
2016
(n = 1,328)
2018
(n = 1,231)
Alabama 50 n/r 50 n/r n/r n/r n/r n/r n/r
Alaska 55 n/r n/r n/r 49 n/r n/r n/r n/r
Arizona 55 54 55 57 60 57 n/r n/r 60
Arkansas 48 40 41 40 40 42 n/r n/r 40
California 60 58 58 55 55 55 55 55 55
Colorado 60 48 n/r 48 n/r 55 n/r n/r n/r
Connecticut 47 42 40 37 40 32 n/r 35 n/r
Delaware n/r n/r 50 55 54 n/r n/r n/r n/r
District of
Columbia n/r n/r n/r n/r n/r n/r n/r n/r n/r
Florida 64 72 65 46 65 59 60 64 60
Georgia 55 50 46 43 46 45 52 42 43
Hawaii 50 n/r 35 40 40 n/r n/r n/r n/r
Idaho 60 n/r 57 61 58 n/r n/r n/r n/r
Illinois 60 50 55 50 50 48 49 50 49
Indiana 75 74 78 75 80 72 n/r n/r 76
Iowa 45 50 49 55 50 n/r n/r n/r n/r
Kansas 47 47 n/r 46 45 n/r n/r n/r n/r
Kentucky 62 63 60 65 59 52 n/r 60 60
Louisiana 48 50 n/r 45 46 45 n/r n/r n/r
Maine 45 n/r n/r n/r 30 n/r n/r n/r n/r
Maryland 60 50 52 45 43 45 47 45 44
Massachusetts 50 45 40 40 43 42 41 40 41
Michigan 55 57 57 55 60 55 58 50 54
Minnesota 40 42 45 45 42 43 n/r 36 38
Mississippi 58 55 55 50 45 n/r n/r n/r n/r
Missouri 50 45 42 48 45 39 40 40 42
(Table continues)
ASHA Schools Survey Report: SLP Caseload Characteristics Trends, 2000–2018 Page 13 of 15
Appendix Table 2. Continued
#
State 2000
(n = 2,067)
2004
(n = 2,067)
2006
(n = 1,742)
2008
(n = 1,707)
2010
(n = 1,785)
2012
(n = 1,760)
2014
(n = 1,224)
2016
(n = 1,328)
2018
(n = 1,231)
Montana 50 n/r 45 43 45 n/r n/r n/r n/r
Nebraska 50 n/r 54 53 55 n/r n/r n/r n/r
Nevada 60 n/r 55 n/r 60 n/r n/r n/r n/r
New Hampshire 40 n/r n/r n/r 31 n/r n/r n/r n/r
New Jersey 55 48 46 42 40 40 40 40 40
New Mexico 44 35 40 35 45 n/r n/r n/r n/r
New York 50 35 40 40 32 32 35 31 30
North Carolina 55 45 56 50 47 43 46 48 48
North Dakota 32 n/r 32 33 35 n/r n/r n/r n/r
Ohio 60 55 60 60 61 60 57 55 55
Oklahoma 55 52 54 55 50 50 n/r n/r 50
Oregon 56 n/r 60 n/r 50 n/r n/r n/r n/r
Pennsylvania 60 60 53 53 60 50 50 50 54
Rhode Island 55 n/r n/r n/r n/r n/r n/r n/r n/r
South Carolina 60 58 55 n/r 48 50 n/r n/r n/r
South Dakota n/r n/r 49 40 n/r n/r n/r n/r n/r
Tennessee 59 n/r 61 57 60 n/r n/r n/r n/r
Texas 60 55 55 50 50 50 50 51 55
Utah 61 n/r n/r 65 60 n/r n/r n/r n/r
Vermont 40 n/r 30 n/r 31 n/r n/r n/r n/r
Virginia 55 55 55 55 56 53 55 55 49
Washington 57 50 51 52 53 n/r n/r n/r 48
West Virginia 50 n/r 50 50 49 n/r n/r n/r n/r
Wisconsin 37 38 40 40 38 40 n/r 40 40
Wyoming 47 n/r 50 45 n/r n/r n/r n/r n/r
Note. These data are from the 2000, 2004, 2006, 2008, 2010, 2012, 2014, 2016, and 2018 ASHA Schools Surveys. Analysis was limited to clinicians who were employed
full time. n/r = not reported (to preserve confidentiality and provide more certain results, we have not reported data for groups of fewer than 25).
ASHA Schools Survey Report: SLP Caseload Characteristics Trends, 2000–2018 Page 14 of 15
Appendix Table 3. Percentage of school-based SLPs treating students, by area of intervention and year.
Area of intervention %
2004
(n = 2,051)
2006
(n = 1,769)
2008
(n = 1,718)
2010
(n = 1,747)
2012
(n = 1,760)
2014
(n = 1,224)
2016
(n = 1,328)
2018
(n = 1,539)
Acquired brain injurya 19 18 14 17 17 0 17 15
Auditory processing disorder 67 61 54 47 58 46 37 32
Autism spectrum disorderb 80 84 84 88 90 90 91 90
Childhood apraxia of speech 60 56 58 59 57 63 63 60
Cognitive communication
disorders 52 — — — — 61 60 48
Dysphagia (swallowing/feeding
disorders) 12 10 9 9 11 14 11 11
Fluency disorders 70 69 67 67 67 68 69 67
Hearing lossc 49 48 44 46 45 51 46 45
Language disorders: Pragmatics/
social communication 76 77 75 81 83 89 90 85
Language disorders: Semantics,
morphology, syntax — — — — — 92 91 91
Nonverbal, augmentative and
alternative communication 49 50 45 53 49 55 55 60
Reading and writing (literacy)
difficulties 40 37 32 32 30 36 33 31
Selective mutism — — — 16 17 18 18 19
Speech sound disordersd 93 91 94 92 93 93 89 90
Voice or resonance disorders 32 29 24 23 22 22 18 19
Note. These data are from the 2004, 2006, 2008, 2010, 2012, 2014, 2016, and 2018 ASHA Schools Surveys. Analysis was limited to clinicians who were employed full
time. aFrom 2004 to 2016, this item was Traumatic brain injury. bFrom 2004 to 2008, this item was Autism/pervasive developmental disorder; from 2010 to 2012, it was
Autism spectrum disorders, including pervasive developmental disorder and Asperger’s. cFrom 2004 to 2012, this item was hearing disorders. dFrom 2004 to 2014, this
item was articulation/phonological disorders. Dash indicates that the item was not included in the survey.
ASHA Schools Survey Report: SLP Caseload Characteristics Trends, 2000–2018 Page 15 of 15
Appendix Table 4. Average number of students on school-based SLPs’ caseloads, by area of intervention and year.
#
Area of intervention 2004
(n varies)
2006
(n varies)
2008
(n varies)
2010
(n varies)
2012
(n varies)
2014
(n varies)
2016
(n varies)
2018
(n varies)
Acquired brain injurya 2 2 1 2 1 1 2 2
Auditory processing disorder 9 9 8 7 10 7 6 5
Autism spectrum disorderb 5 6 7 8 8 9 10 10
Childhood apraxia of speech 3 3 3 3 3 3 3 3
Cognitive communication
disorders — — — — — 10 10 9
Dysphagia (swallowing/feeding
disorders) 3 4 3 3 3 3 2 3
Fluency disorders 3 3 2 2 3 3 3 3
Hearing lossc 3 3 3 3 3 3 3 2
Language disorders: Pragmatics/
social communication 8 8 8 8 10 11 12 11
Language disorders: Semantics,
morphology, syntax — — — — — 22 22 21
Nonverbal, augmentative and
alternative communication 5 5 4 5 4 5 5 5
Reading and writing (literacy)
difficulties 14 15 15 14 14 15 15 14
Selective mutism — — — 1 1 1 1 1
Speech sound disordersd 23 23 22 21 19 21 18 18
Voice or resonance disorders 2 2 2 2 2 2 1 2
Note. These data are from the 2004, 2006, 2008, 2010, 2012, 2014, 2016, and 2018 ASHA Schools Surveys. Analysis was limited to clinicians who were employed full
time. aFrom 2004 to 2016, this item was Traumatic brain injury. bFrom 2004 to 2008, this item was Autism/pervasive developmental disorder; from 2010–2012, it was
Autism spectrum disorders, including pervasive developmental disorder and Asperger’s. cFrom 2004 to 2012, this item was hearing disorders. dFrom 2004 to 2014, this
item was articulation/phonological disorders. The numbers included in this table were provided by SLPs who do treat students in the areas of intervention listed. The n
values vary widely because SLPs did not treat students in all areas. Dash indicates that the item was not included in the survey.