2018 Review of Shareholder Activism - Lazard...2018 Review of Shareholder Activism LAZARD'S...
34
2018 Review of Shareholder Activism LAZARD'S SHAREHOLDER ADVISORY GROUP JANUARY 2019 Lazard has prepared the information herein based upon publicly available information and for general informational purposes only. The information is not intended to be, and should not be construed as, financial, legal or other advice, and Lazard shall have no duties or obligations to you in respect of the information.
Transcript of 2018 Review of Shareholder Activism - Lazard...2018 Review of Shareholder Activism LAZARD'S...
2018 Review of Shareholder Activism
L A Z A R D ' S S H A R E H O L D E R A D V I S O R Y G R O U P
J A N U A R Y 2 0 1 9
Lazard has prepared the information herein based upon publicly available
information and for general informational purposes only. The information is not
intended to be, and should not be construed as, financial, legal or other advice,
and Lazard shall have no duties or obligations to you in respect of the information.
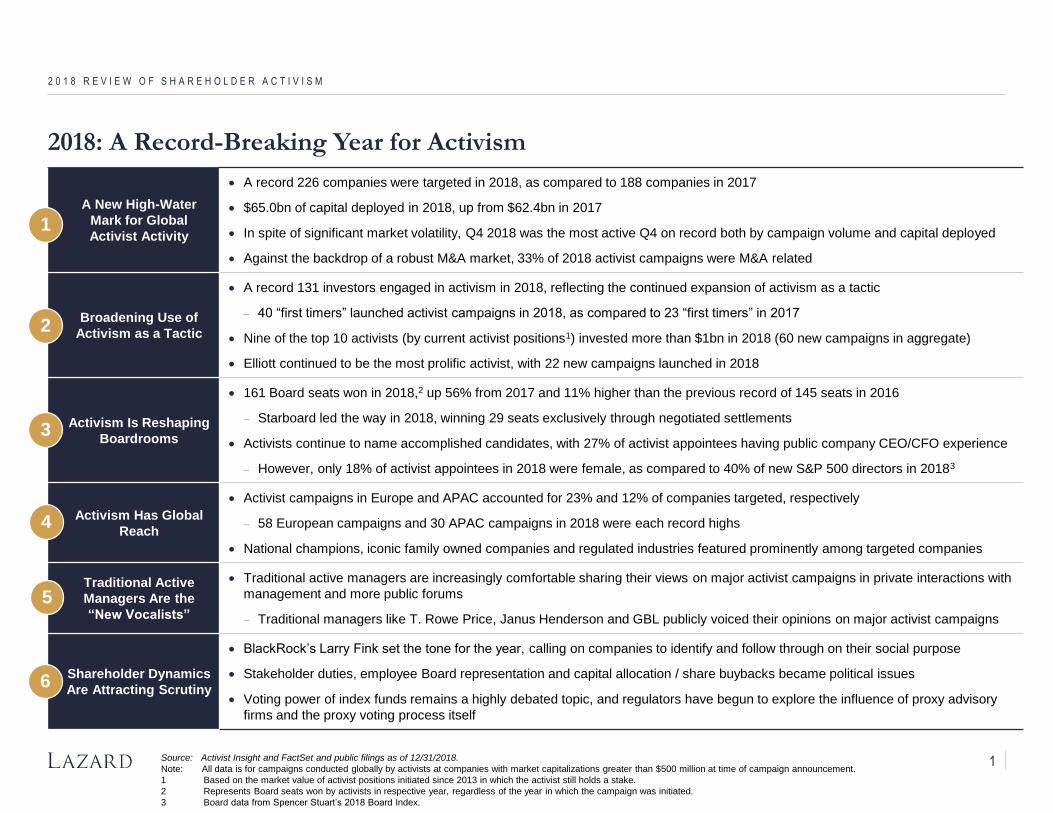
2018: A Record-Breaking Year for Activism
2 0 1 8 R E V I E W O F S H A R E H O L D E R A C T I V I S M
Source: Activist Insight and FactSet and public filings as of 12/31/2018.
Note: All data is for campaigns conducted globally by activists at companies with market capitalizations greater than $500 million at time of campaign announcement.
1 Based on the market value of activist positions initiated since 2013 in which the activist still holds a stake.
2 Represents Board seats won by activists in respective year, regardless of the year in which the campaign was initiated.
3 Board data from Spencer Stuart’s 2018 Board Index.
A New High-Water
Mark for Global
Activist Activity
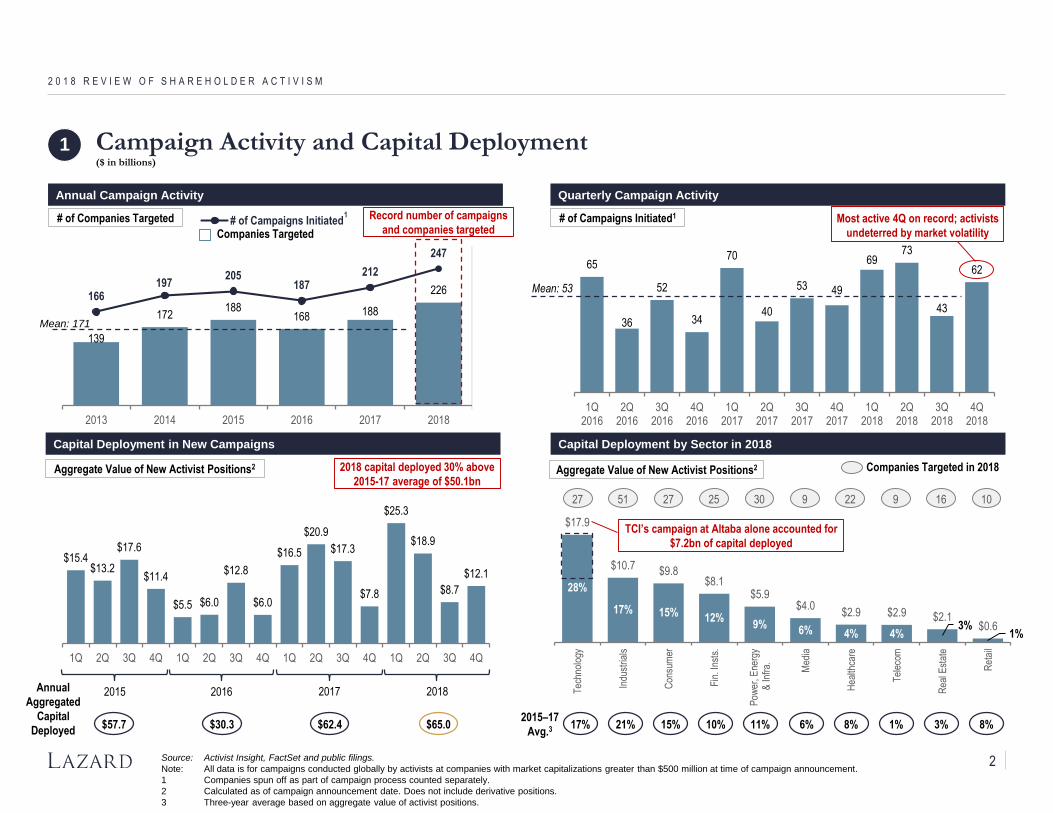
A record 226 companies were targeted in 2018, as compared to 188 companies in 2017
$65.0bn of capital deployed in 2018, up from $62.4bn in 2017
In spite of significant market volatility, Q4 2018 was the most active Q4 on record both by campaign volume and capital deployed
Against the backdrop of a robust M&A market, 33% of 2018 activist campaigns were M&A related
Broadening Use of
Activism as a Tactic
A record 131 investors engaged in activism in 2018, reflecting the continued expansion of activism as a tactic
40 “first timers” launched activist campaigns in 2018, as compared to 23 “first timers” in 2017
Nine of the top 10 activists (by current activist positions1) invested more than $1bn in 2018 (60 new campaigns in aggregate)
Elliott continued to be the most prolific activist, with 22 new campaigns launched in 2018
Activism Is Reshaping
Boardrooms
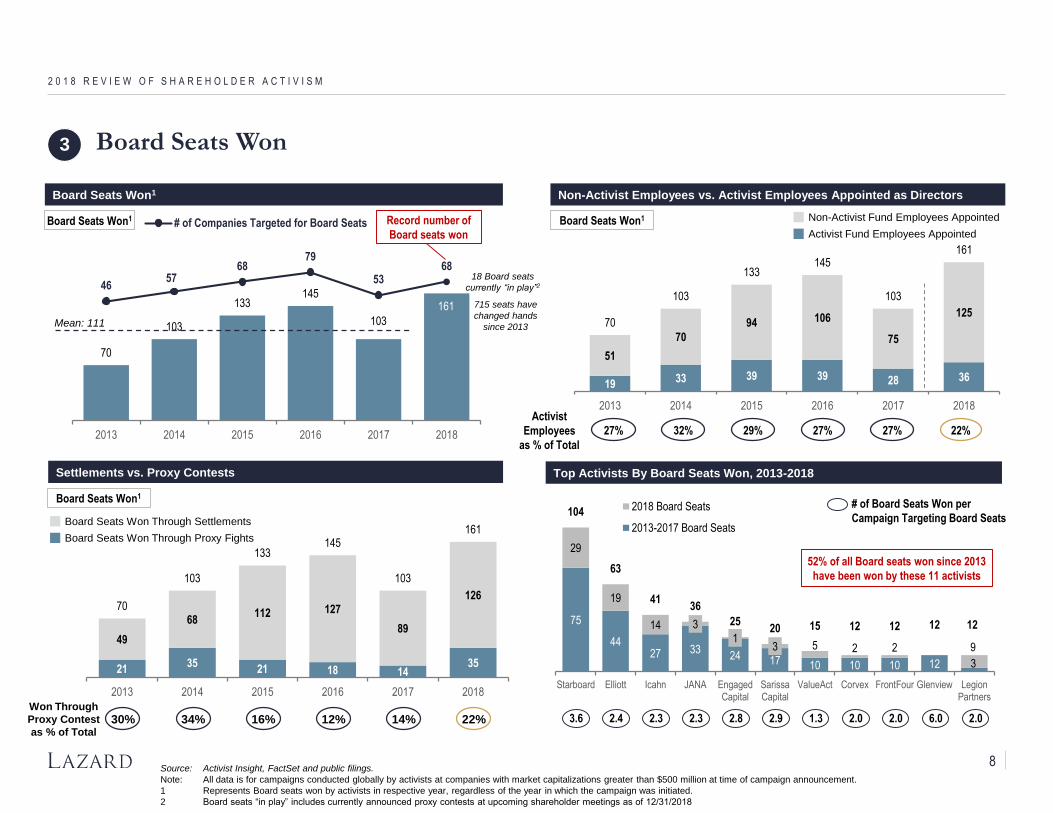
161 Board seats won in 2018,2 up 56% from 2017 and 11% higher than the previous record of 145 seats in 2016
Starboard led the way in 2018, winning 29 seats exclusively through negotiated settlements
Activists continue to name accomplished candidates, with 27% of activist appointees having public company CEO/CFO experience
However, only 18% of activist appointees in 2018 were female, as compared to 40% of new S&P 500 directors in 20183
Activism Has Global
Reach
Activist campaigns in Europe and APAC accounted for 23% and 12% of companies targeted, respectively
58 European campaigns and 30 APAC campaigns in 2018 were each record highs
National champions, iconic family owned companies and regulated industries featured prominently among targeted companies
Traditional Active
Managers Are the
“New Vocalists”
Traditional active managers are increasingly comfortable sharing their views on major activist campaigns in private interactions with
management and more public forums
Traditional managers like T. Rowe Price, Janus Henderson and GBL publicly voiced their opinions on major activist campaigns
Shareholder Dynamics
Are Attracting Scrutiny
BlackRock’s Larry Fink set the tone for the year, calling on companies to identify and follow through on their social purpose
Stakeholder duties, employee Board representation and capital allocation / share buybacks became political issues
Voting power of index funds remains a highly debated topic, and regulators have begun to explore the influence of proxy advisory
firms and the proxy voting process itself
1
2
3
4
5
6
1
139
172188
168 188
226166
197205
187212
247
-10
40
90
140
190
240
290
100
200
300
2013 2014 2015 2016 2017 2018
# of Campaigns Initiated# of Companies Targeted
65
36
52
34
70
40
53 49
6973
43
62
1Q2016
2Q2016
3Q2016
4Q2016
1Q2017
2Q2017
3Q2017
4Q2017
1Q2018
2Q2018
3Q2018
4Q2018
2 0 1 8 R E V I E W O F S H A R E H O L D E R A C T I V I S M
Source: Activist Insight, FactSet and public filings.
Note: All data is for campaigns conducted globally by activists at companies with market capitalizations greater than $500 million at time of campaign announcement.
1 Companies spun off as part of campaign process counted separately.
2 Calculated as of campaign announcement date. Does not include derivative positions.
3 Three-year average based on aggregate value of activist positions.
Quarterly Campaign Activity
# of Campaigns Initiated1
Mean: 53
Annual Campaign Activity
1
Companies Targeted
Mean: 171
$15.4$13.2
$17.6
$11.4
$5.5 $6.0
$12.8
$6.0
$16.5
$20.9
$17.3
$7.8
$25.3
$18.9
$8.7
$12.1
1Q 2Q 3Q 4Q 1Q 2Q 3Q 4Q 1Q 2Q 3Q 4Q 1Q 2Q 3Q 4Q
Capital Deployment in New Campaigns
Aggregate Value of New Activist Positions2
2015 2016 2017
$57.7
Annual
Aggregated
Capital
Deployed$30.3 $62.4
2018
$65.0
Aggregate Value of New Activist Positions2
17%2015–17
Avg.321% 15% 6%11% 8% 3%10% 1% 8%
27 51 27 25 30 9 22 9 16 10
Tec
hnol
ogy
Indu
stria
ls
Con
sum
er
Fin
anci
alIn
stitu
tions
Pow
er, E
nerg
y &
Infr
a.
Med
ia
Hea
lthca
re
Tel
ecom
Rea
l Est
ate
Ret
ail$17.9
$10.7 $9.8$8.1
$5.9$4.0
$2.9 $2.9 $2.1$0.6
28%
17% 15% 12% 9%
6% 4% 4% 3%
1% 0%
10%
20%
30%
40%
50%
60%
02468
101214161820
Tec
hnol
ogy
Indu
stria
ls
Con
sum
er
Fin
. Ins
ts.
Pow
er, E
nerg
y &
Infr
a. Med
ia
Hea
lthca
re
Tel
ecom
Rea
l Est
ate
Ret
ail
Companies Targeted in 2018
1 Campaign Activity and Capital Deployment($ in billions)
Capital Deployment by Sector in 2018
Record number of campaigns
and companies targeted
2018 capital deployed 30% above
2015-17 average of $50.1bn
Most active 4Q on record; activists
undeterred by market volatility
TCI’s campaign at Altaba alone accounted for
$7.2bn of capital deployed
2
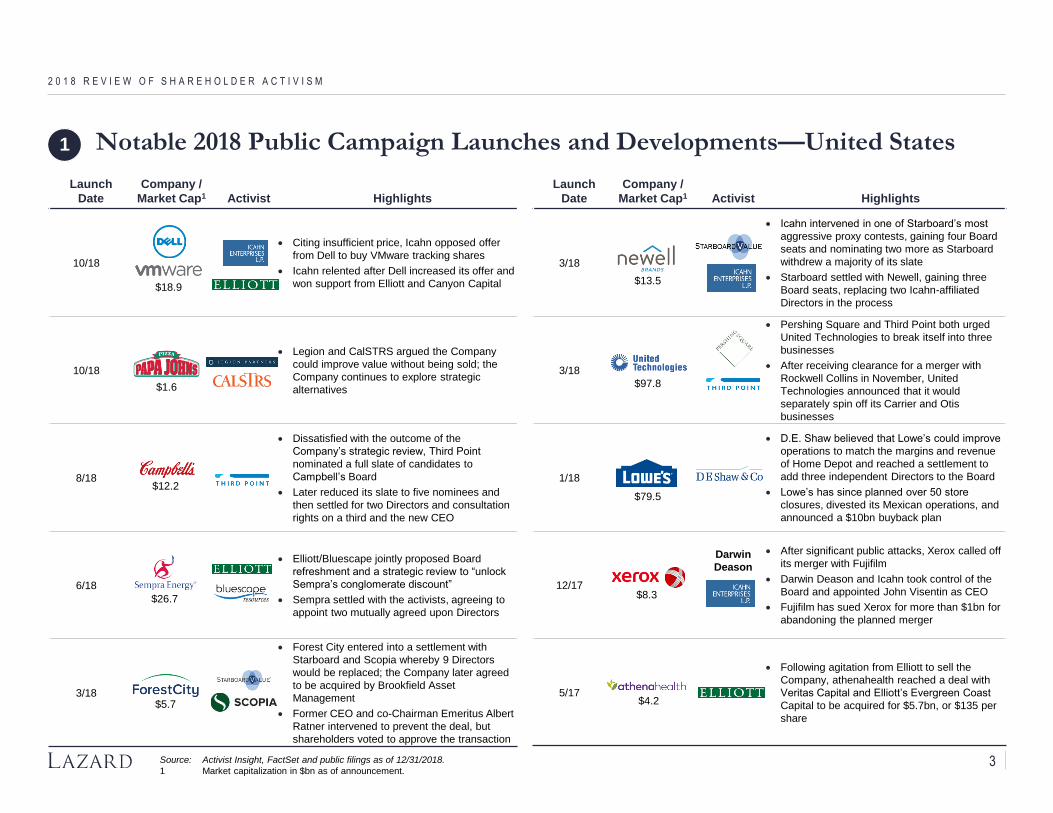
Launch
Date
Company /
Market Cap1 Activist Highlights
3/18
Icahn intervened in one of Starboard’s most
aggressive proxy contests, gaining four Board
seats and nominating two more as Starboard
withdrew a majority of its slate
Starboard settled with Newell, gaining three
Board seats, replacing two Icahn-affiliated
Directors in the process
3/18
Pershing Square and Third Point both urged
United Technologies to break itself into three
businesses
After receiving clearance for a merger with
Rockwell Collins in November, United
Technologies announced that it would
separately spin off its Carrier and Otis
businesses
1/18
D.E. Shaw believed that Lowe’s could improve
operations to match the margins and revenue
of Home Depot and reached a settlement to
add three independent Directors to the Board
Lowe’s has since planned over 50 store
closures, divested its Mexican operations, and
announced a $10bn buyback plan
12/17
Darwin
Deason
After significant public attacks, Xerox called off
its merger with Fujifilm
Darwin Deason and Icahn took control of the
Board and appointed John Visentin as CEO
Fujifilm has sued Xerox for more than $1bn for
abandoning the planned merger
5/17
Following agitation from Elliott to sell the
Company, athenahealth reached a deal with
Veritas Capital and Elliott’s Evergreen Coast
Capital to be acquired for $5.7bn, or $135 per
share
2 0 1 8 R E V I E W O F S H A R E H O L D E R A C T I V I S M
Launch
Date
Company /
Market Cap1 Activist Highlights
10/18
Citing insufficient price, Icahn opposed offer
from Dell to buy VMware tracking shares
Icahn relented after Dell increased its offer and
won support from Elliott and Canyon Capital
10/18
Legion and CalSTRS argued the Company
could improve value without being sold; the
Company continues to explore strategic
alternatives
8/18
Dissatisfied with the outcome of the
Company’s strategic review, Third Point
nominated a full slate of candidates to
Campbell’s Board
Later reduced its slate to five nominees and
then settled for two Directors and consultation
rights on a third and the new CEO
6/18
Elliott/Bluescape jointly proposed Board
refreshment and a strategic review to “unlock
Sempra’s conglomerate discount”
Sempra settled with the activists, agreeing to
appoint two mutually agreed upon Directors
3/18
Forest City entered into a settlement with
Starboard and Scopia whereby 9 Directors
would be replaced; the Company later agreed
to be acquired by Brookfield Asset
Management
Former CEO and co-Chairman Emeritus Albert
Ratner intervened to prevent the deal, but
shareholders voted to approve the transaction
Source: Activist Insight, FactSet and public filings as of 12/31/2018.
1 Market capitalization in $bn as of announcement.
Notable 2018 Public Campaign Launches and Developments—United States1
$18.9
$1.6
$12.2
$26.7
$5.7 $4.2
$13.5
$97.8
$79.5
$8.3
3
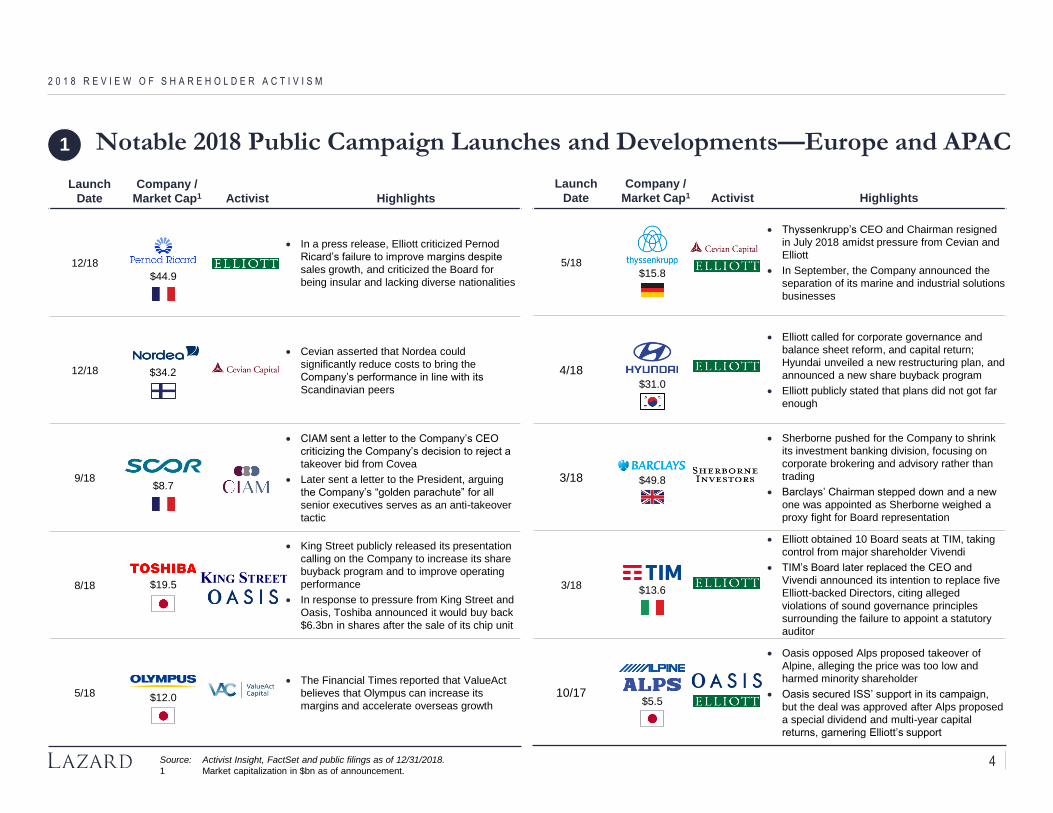
Launch
Date
Company /
Market Cap1 Activist Highlights
12/18
In a press release, Elliott criticized Pernod
Ricard’s failure to improve margins despite
sales growth, and criticized the Board for
being insular and lacking diverse nationalities
12/18
Cevian asserted that Nordea could
significantly reduce costs to bring the
Company’s performance in line with its
Scandinavian peers
9/18
CIAM sent a letter to the Company’s CEO
criticizing the Company’s decision to reject a
takeover bid from Covea
Later sent a letter to the President, arguing
the Company’s “golden parachute” for all
senior executives serves as an anti-takeover
tactic
8/18
King Street publicly released its presentation
calling on the Company to increase its share
buyback program and to improve operating
performance
In response to pressure from King Street and
Oasis, Toshiba announced it would buy back
$6.3bn in shares after the sale of its chip unit
5/18
The Financial Times reported that ValueAct
believes that Olympus can increase its
margins and accelerate overseas growth
Launch
Date
Company /
Market Cap1 Activist Highlights
5/18
Thyssenkrupp’s CEO and Chairman resigned
in July 2018 amidst pressure from Cevian and
Elliott
In September, the Company announced the
separation of its marine and industrial solutions
businesses
4/18
Elliott called for corporate governance and
balance sheet reform, and capital return;
Hyundai unveiled a new restructuring plan, and
announced a new share buyback program
Elliott publicly stated that plans did not got far
enough
3/18
Sherborne pushed for the Company to shrink
its investment banking division, focusing on
corporate brokering and advisory rather than
trading
Barclays’ Chairman stepped down and a new
one was appointed as Sherborne weighed a
proxy fight for Board representation
3/18
Elliott obtained 10 Board seats at TIM, taking
control from major shareholder Vivendi
TIM’s Board later replaced the CEO and
Vivendi announced its intention to replace five
Elliott-backed Directors, citing alleged
violations of sound governance principles
surrounding the failure to appoint a statutory
auditor
10/17
Oasis opposed Alps proposed takeover of
Alpine, alleging the price was too low and
harmed minority shareholder
Oasis secured ISS’ support in its campaign,
but the deal was approved after Alps proposed
a special dividend and multi-year capital
returns, garnering Elliott’s support
2 0 1 8 R E V I E W O F S H A R E H O L D E R A C T I V I S M
Source: Activist Insight, FactSet and public filings as of 12/31/2018.
1 Market capitalization in $bn as of announcement.
Notable 2018 Public Campaign Launches and Developments—Europe and APAC1
$44.9
$8.7
$19.5
$12.0
$15.8
$5.5
$31.0
$49.8
$13.6
$34.2
4
2 0 1 8 R E V I E W O F S H A R E H O L D E R A C T I V I S M
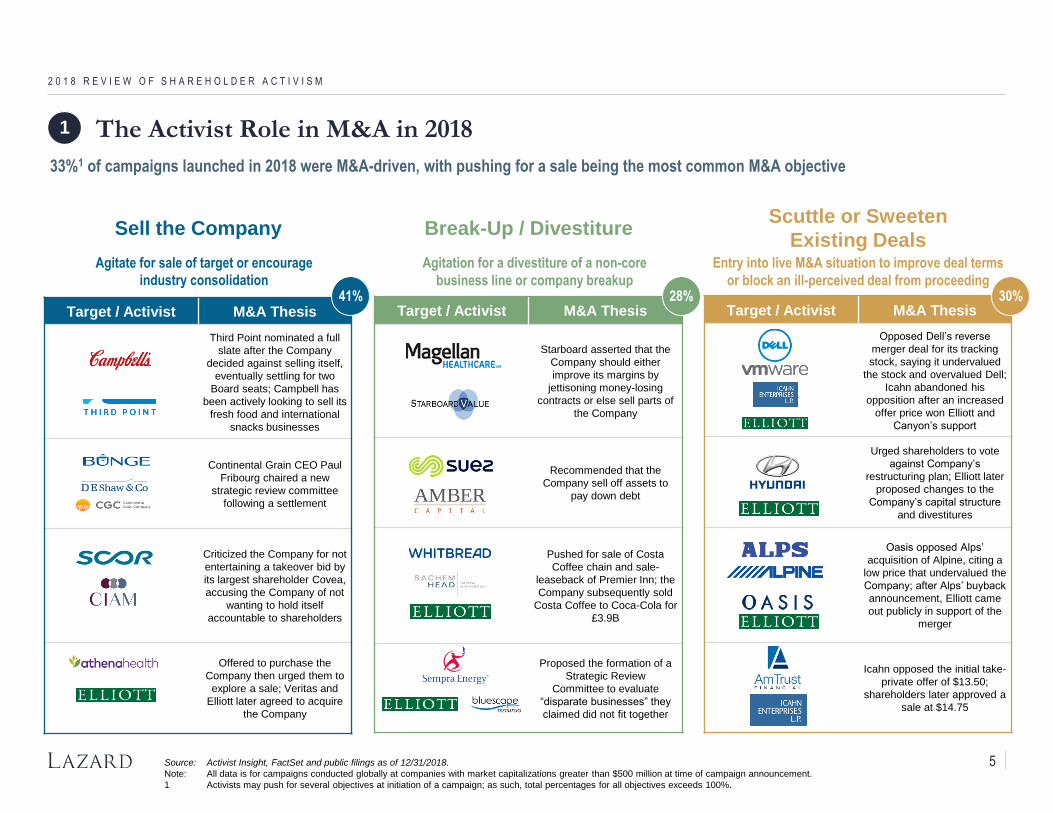
The Activist Role in M&A in 2018
Target / Activist M&A Thesis
Starboard asserted that the
Company should either
improve its margins by
jettisoning money-losing
contracts or else sell parts of
the Company
Recommended that the
Company sell off assets to
pay down debt
Pushed for sale of Costa
Coffee chain and sale-
leaseback of Premier Inn; the
Company subsequently sold
Costa Coffee to Coca-Cola for
£3.9B
Proposed the formation of a
Strategic Review
Committee to evaluate
“disparate businesses” they
claimed did not fit together
Target / Activist M&A Thesis
Opposed Dell’s reverse
merger deal for its tracking
stock, saying it undervalued
the stock and overvalued Dell;
Icahn abandoned his
opposition after an increased
offer price won Elliott and
Canyon’s support
Urged shareholders to vote
against Company’s
restructuring plan; Elliott later
proposed changes to the
Company’s capital structure
and divestitures
Oasis opposed Alps’
acquisition of Alpine, citing a
low price that undervalued the
Company; after Alps’ buyback
announcement, Elliott came
out publicly in support of the
merger
Icahn opposed the initial take-
private offer of $13.50;
shareholders later approved a
sale at $14.75
Sell the CompanyScuttle or Sweeten
Existing DealsBreak-Up / Divestiture
Agitate for sale of target or encourage
industry consolidation
Entry into live M&A situation to improve deal terms
or block an ill-perceived deal from proceeding
Agitation for a divestiture of a non-core
business line or company breakup
Target / Activist M&A Thesis
Third Point nominated a full
slate after the Company
decided against selling itself,
eventually settling for two
Board seats; Campbell has
been actively looking to sell its
fresh food and international
snacks businesses
Continental Grain CEO Paul
Fribourg chaired a new
strategic review committee
following a settlement
Criticized the Company for not
entertaining a takeover bid by
its largest shareholder Covea,
accusing the Company of not
wanting to hold itself
accountable to shareholders
Offered to purchase the
Company then urged them to
explore a sale; Veritas and
Elliott later agreed to acquire
the Company
Source: Activist Insight, FactSet and public filings as of 12/31/2018.
Note: All data is for campaigns conducted globally at companies with market capitalizations greater than $500 million at time of campaign announcement.
1 Activists may push for several objectives at initiation of a campaign; as such, total percentages for all objectives exceeds 100%.
41% 30%28%
33%1 of campaigns launched in 2018 were M&A-driven, with pushing for a sale being the most common M&A objective
1
5
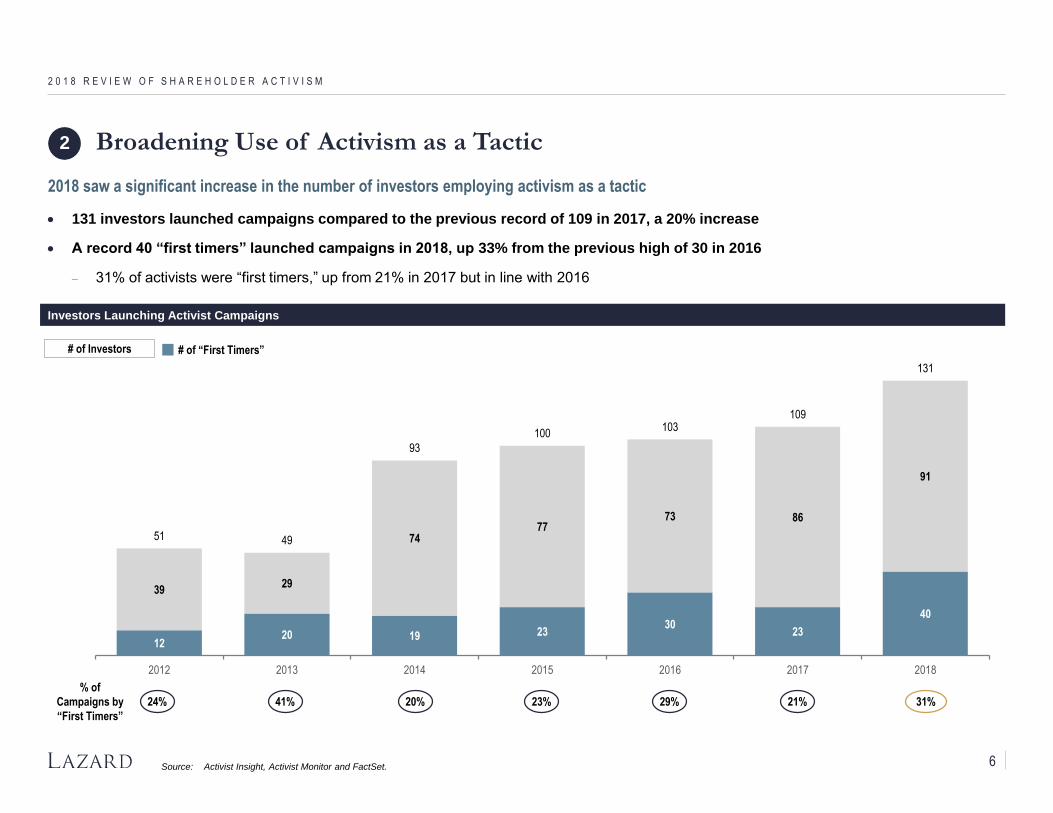
1220 19 23
3023
40
3929
7477
73 86
91
51 49
93
100103
109
131
2012 2013 2014 2015 2016 2017 2018
2018 saw a significant increase in the number of investors employing activism as a tactic
131 investors launched campaigns compared to the previous record of 109 in 2017, a 20% increase
A record 40 “first timers” launched campaigns in 2018, up 33% from the previous high of 30 in 2016
31% of activists were “first timers,” up from 21% in 2017 but in line with 2016
2 0 1 8 R E V I E W O F S H A R E H O L D E R A C T I V I S M
Broadening Use of Activism as a Tactic
Source: Activist Insight, Activist Monitor and FactSet.
2
Investors Launching Activist Campaigns
41% 20% 23% 29% 21%24% 31%
# of “First Timers”# of Investors
% of
Campaigns by
“First Timers”
6
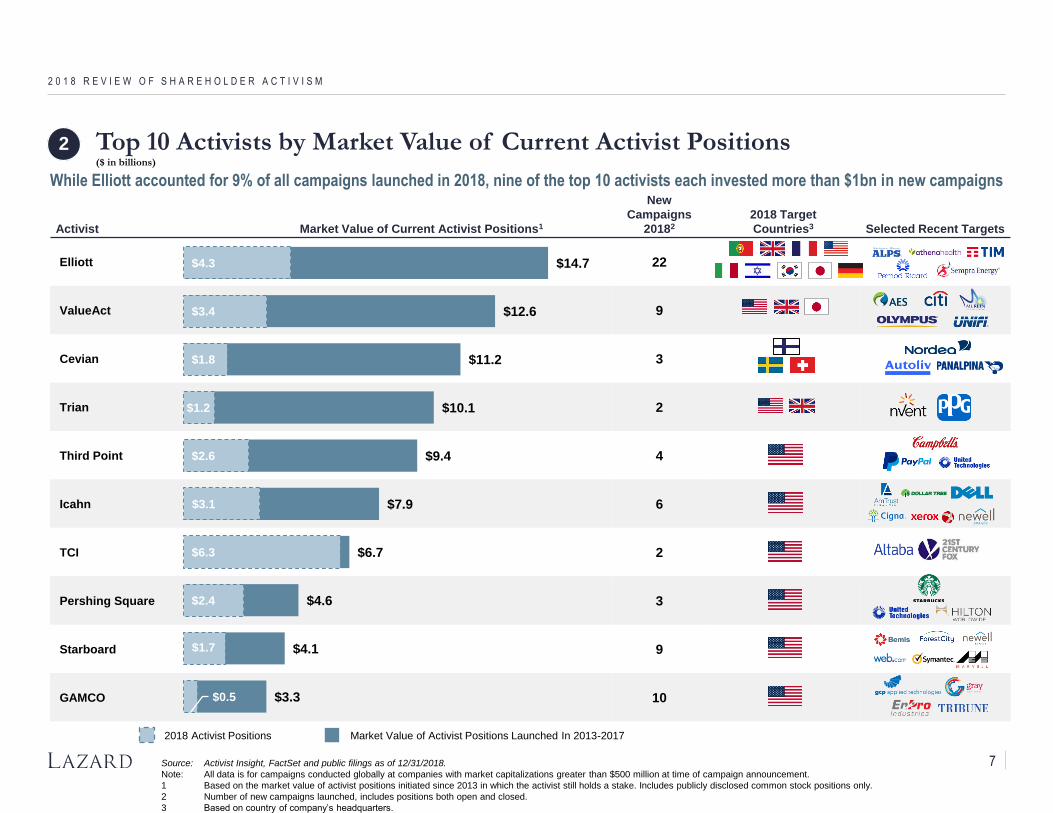
Activist Market Value of Current Activist Positions1
New
Campaigns
20182
2018 Target
Countries3 Selected Recent Targets
Elliott 22
ValueAct 9
Cevian 3
Trian 2
Third Point 4
Icahn 6
TCI 2
Pershing Square 3
Starboard 9
GAMCO 10
$4.3
$3.4
$1.8
$1.2
$2.6
$3.1
$6.3
$2.4
$1.7
$0.5
$14.7
$12.6
$11.2
$10.1
$9.4
$7.9
$6.7
$4.6
$4.1
$3.3
2 0 1 8 R E V I E W O F S H A R E H O L D E R A C T I V I S M
Source: Activist Insight, FactSet and public filings as of 12/31/2018.
Note: All data is for campaigns conducted globally at companies with market capitalizations greater than $500 million at time of campaign announcement.
1 Based on the market value of activist positions initiated since 2013 in which the activist still holds a stake. Includes publicly disclosed common stock positions only.
2 Number of new campaigns launched, includes positions both open and closed.
3 Based on country of company’s headquarters.
2018 Activist Positions Market Value of Activist Positions Launched In 2013-2017
Top 10 Activists by Market Value of Current Activist Positions($ in billions)
2
While Elliott accounted for 9% of all campaigns launched in 2018, nine of the top 10 activists each invested more than $1bn in new campaigns
7
75
4427 33
24 17 10 10 10 12 3
29
19
14 31
3 5 2 2 9
104
63
4136
2520 15 12 12 12 12
Starboard Elliott Icahn JANA EngagedCapital
SarissaCapital
ValueAct Corvex FrontFour Glenview LegionPartners
2018 Board Seats
2013-2017 Board Seats
2 0 1 8 R E V I E W O F S H A R E H O L D E R A C T I V I S M
Board Seats Won1 Non-Activist Employees vs. Activist Employees Appointed as Directors
Settlements vs. Proxy Contests
Source: Activist Insight, FactSet and public filings.
Note: All data is for campaigns conducted globally by activists at companies with market capitalizations greater than $500 million at time of campaign announcement.
1 Represents Board seats won by activists in respective year, regardless of the year in which the campaign was initiated.
2 Board seats “in play” includes currently announced proxy contests at upcoming shareholder meetings as of 12/31/2018
19 33 39 39 28 36
51
70
94 106
75
12570
103
133145
103
161
2013 2014 2015 2016 2017 2018
29%
Activist
Employees
as % of Total
27%
Board Seats Won1
32%
Non-Activist Fund Employees Appointed
Activist Fund Employees Appointed
22%27%
Board Seats Won1
Board Seats Won Through Settlements
Board Seats Won Through Proxy Fights
70
103
133145
103
161
4657
6879
5368
2013 2014 2015 2016 2017 2018
# of Companies Targeted for Board SeatsBoard Seats Won1
Mean: 111
2135
21 18 1435
49
68112 127
89
12670
103
133145
103
161
2013 2014 2015 2016 2017 2018
16%Won Through
Proxy Contest
as % of Total12% 14%30% 34% 22%
27%
715 seats have
changed hands
since 2013
18 Board seats
currently “in play”2
Top Activists By Board Seats Won, 2013-2018
Board Seats Won3
# of Board Seats Won per
Campaign Targeting Board Seats
52% of all Board seats won since 2013
have been won by these 11 activists
2.32.32.43.6 6.01.3 2.0 2.02.8 2.9 2.0
Record number of
Board seats won
8
2 0 1 8 R E V I E W O F S H A R E H O L D E R A C T I V I S M
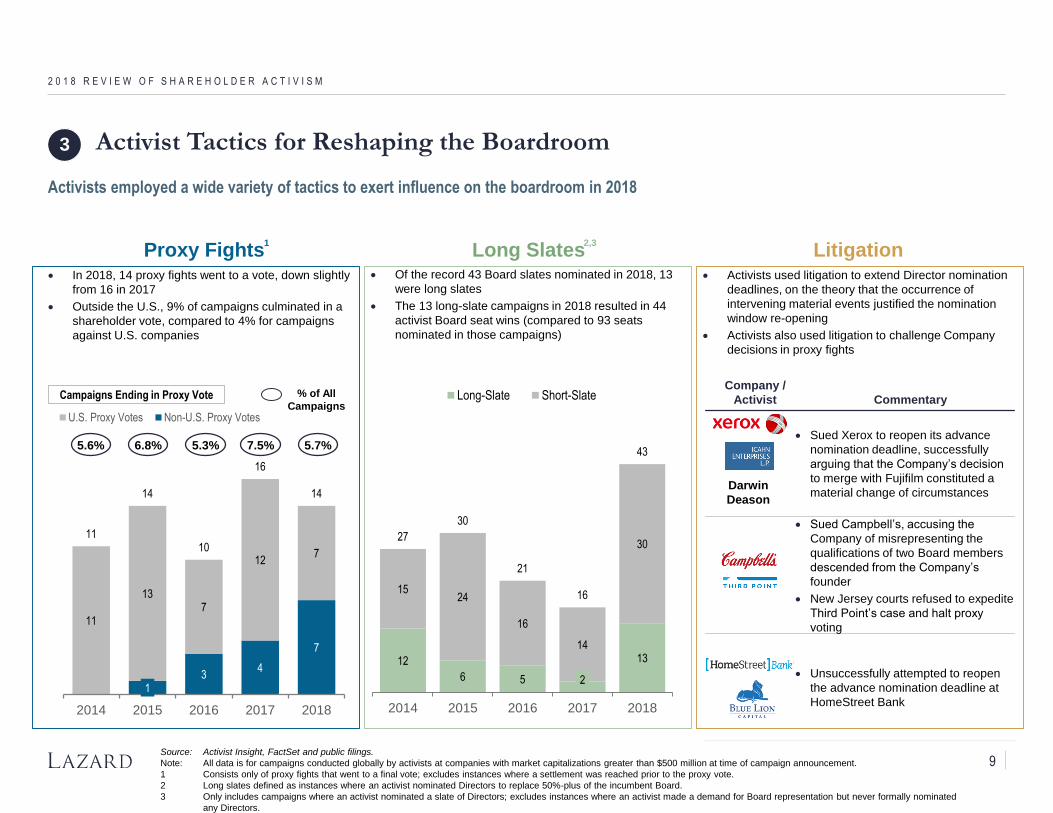
Activists employed a wide variety of tactics to exert influence on the boardroom in 2018
Activist Tactics for Reshaping the Boardroom3
Company /
Activist Commentary
Sued Xerox to reopen its advance
nomination deadline, successfully
arguing that the Company’s decision
to merge with Fujifilm constituted a
material change of circumstances
Sued Campbell’s, accusing the
Company of misrepresenting the
qualifications of two Board members
descended from the Company’s
founder
New Jersey courts refused to expedite
Third Point’s case and halt proxy
voting
Unsuccessfully attempted to reopen
the advance nomination deadline at
HomeStreet Bank
LitigationLong SlatesProxy Fights Activists used litigation to extend Director nomination
deadlines, on the theory that the occurrence of
intervening material events justified the nomination
window re-opening
Activists also used litigation to challenge Company
decisions in proxy fights
Darwin
Deason
12
6 5 2
13
1524
16
14
3027
30
21
16
43
2014 2015 2016 2017 2018
Long-Slate Short-Slate
Of the record 43 Board slates nominated in 2018, 13
were long slates
The 13 long-slate campaigns in 2018 resulted in 44
activist Board seat wins (compared to 93 seats
nominated in those campaigns)
In 2018, 14 proxy fights went to a vote, down slightly
from 16 in 2017
Outside the U.S., 9% of campaigns culminated in a
shareholder vote, compared to 4% for campaigns
against U.S. companies
13
4
7
11
137
127
11
14
10
16
14
2014 2015 2016 2017 2018
U.S. Proxy Votes Non-U.S. Proxy Votes
Campaigns Ending in Proxy Vote
5.3% 7.5% 5.7%5.6% 6.8%
% of All
Campaigns
Source: Activist Insight, FactSet and public filings.
Note: All data is for campaigns conducted globally by activists at companies with market capitalizations greater than $500 million at time of campaign announcement.
1 Consists only of proxy fights that went to a final vote; excludes instances where a settlement was reached prior to the proxy vote.
2 Long slates defined as instances where an activist nominated Directors to replace 50%-plus of the incumbent Board.
3 Only includes campaigns where an activist nominated a slate of Directors; excludes instances where an activist made a demand for Board representation but never formally nominated
any Directors.
2,31
9
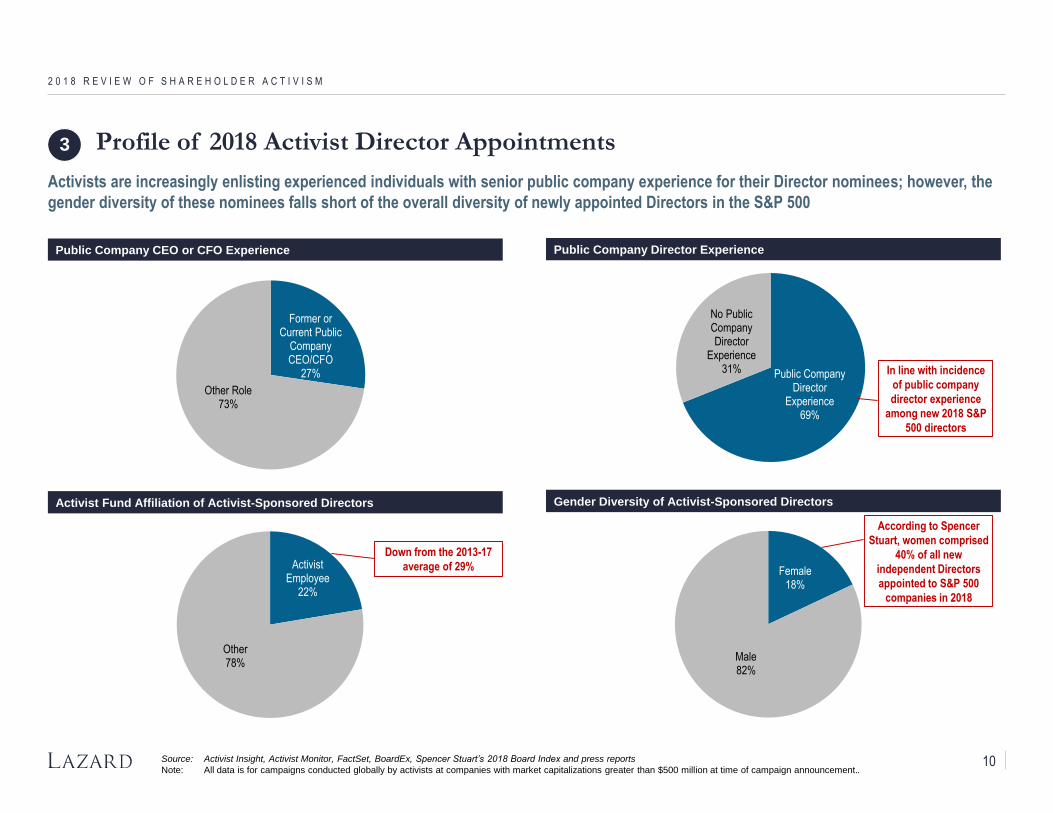
Female18%
Male82%
Activist Employee
22%
Other78%
Former or Current Public
Company CEO/CFO
27%
Other Role73%
2 0 1 8 R E V I E W O F S H A R E H O L D E R A C T I V I S M
Profile of 2018 Activist Director Appointments
Gender Diversity of Activist-Sponsored DirectorsActivist Fund Affiliation of Activist-Sponsored Directors
3
Source: Activist Insight, Activist Monitor, FactSet, BoardEx, Spencer Stuart’s 2018 Board Index and press reports
Note: All data is for campaigns conducted globally by activists at companies with market capitalizations greater than $500 million at time of campaign announcement..
Activists are increasingly enlisting experienced individuals with senior public company experience for their Director nominees; however, the
gender diversity of these nominees falls short of the overall diversity of newly appointed Directors in the S&P 500
Public Company CEO or CFO Experience
Public Company Director
Experience69%
No Public Company Director
Experience31%
Public Company Director Experience
According to Spencer
Stuart, women comprised
40% of all new
independent Directors
appointed to S&P 500
companies in 2018
In line with incidence
of public company
director experience
among new 2018 S&P
500 directors
Down from the 2013-17
average of 29%
10
2 0 1 8 R E V I E W O F S H A R E H O L D E R A C T I V I S M
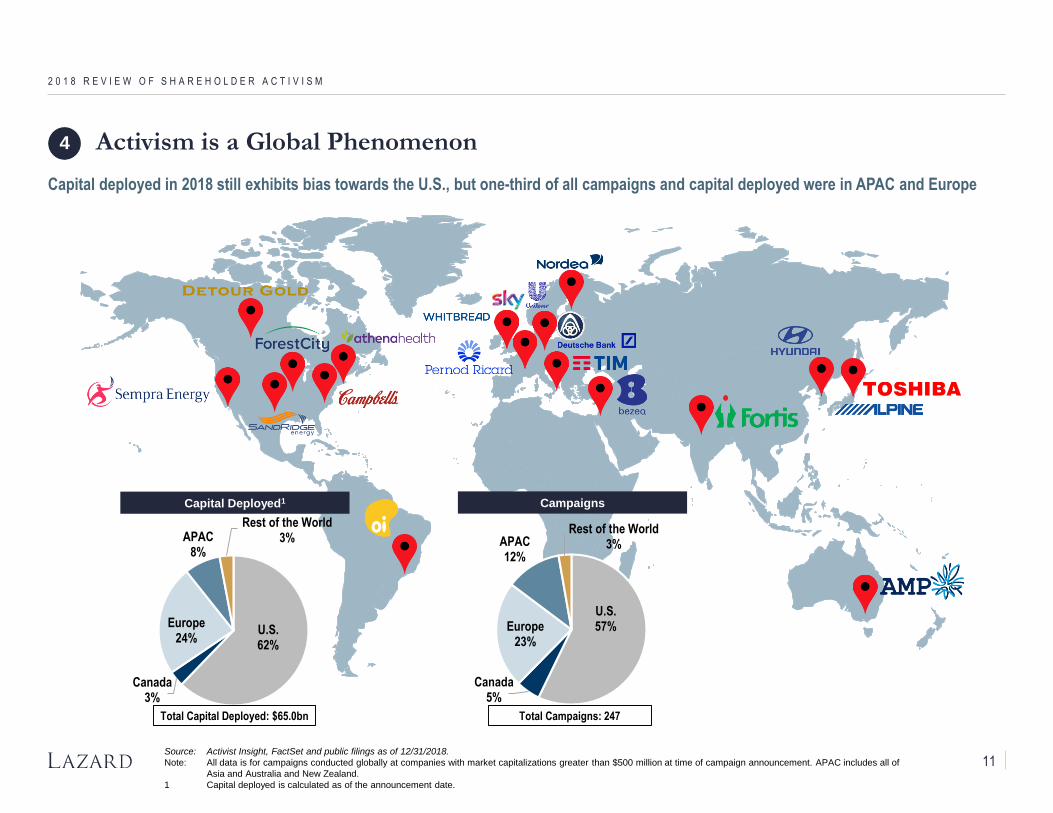
U.S.57%
Canada5%
Europe23%
APAC12%
Rest of the World3%
Campaigns
Activism is a Global Phenomenon
Capital deployed in 2018 still exhibits bias towards the U.S., but one-third of all campaigns and capital deployed were in APAC and Europe
Source: Activist Insight, FactSet and public filings as of 12/31/2018.
Note: All data is for campaigns conducted globally at companies with market capitalizations greater than $500 million at time of campaign announcement. APAC includes all of
Asia and Australia and New Zealand.
1 Capital deployed is calculated as of the announcement date.
4
U.S.62%
Canada3%
Europe24%
APAC8%
Rest of the World3%
Capital Deployed1
Total Capital Deployed: $65.0bn Total Campaigns: 247
11
% of Global
Capital
Deployed
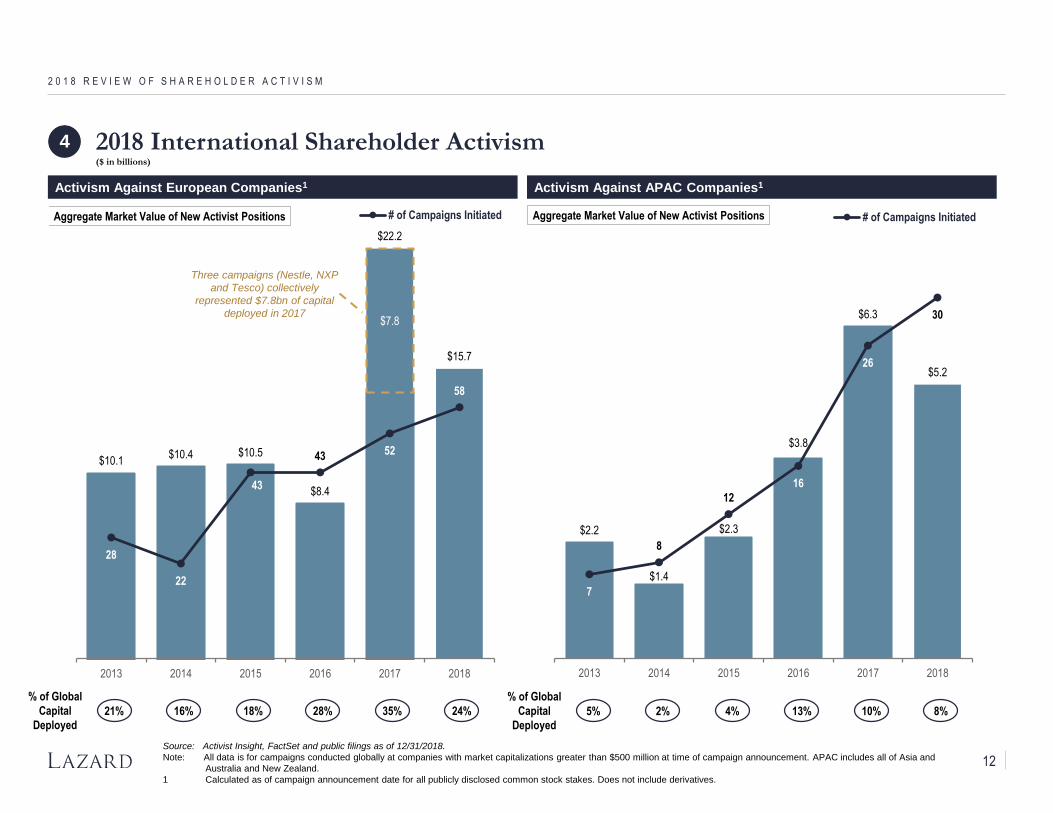
$2.2
$1.4
$2.3
$3.8
$6.3
$5.2
7
8
12
16
26
30
0
25
2013 2014 2015 2016 2017 2018
# of Campaigns InitiatedAggregate Market Value of New Activist Positions
$7.8
$10.1$10.4 $10.5
$8.4
$22.2
$15.7
28
22
43
43 52
58
0
25
50
75
2013 2014 2015 2016 2017 2018
# of Campaigns InitiatedAggregate Market Value of New Activist Positions
2 0 1 8 R E V I E W O F S H A R E H O L D E R A C T I V I S M
Source: Activist Insight, FactSet and public filings as of 12/31/2018.
Note: All data is for campaigns conducted globally at companies with market capitalizations greater than $500 million at time of campaign announcement. APAC includes all of Asia and
Australia and New Zealand.
1 Calculated as of campaign announcement date for all publicly disclosed common stock stakes. Does not include derivatives.
Activism Against European Companies1
% of Global
Capital
Deployed
21% 16% 28%18% 35% 24%
Three campaigns (Nestle, NXP
and Tesco) collectively
represented $7.8bn of capital
deployed in 2017
2018 International Shareholder Activism($ in billions)
4
Activism Against APAC Companies1
5% 2% 13%4% 10% 8%
12
Company /
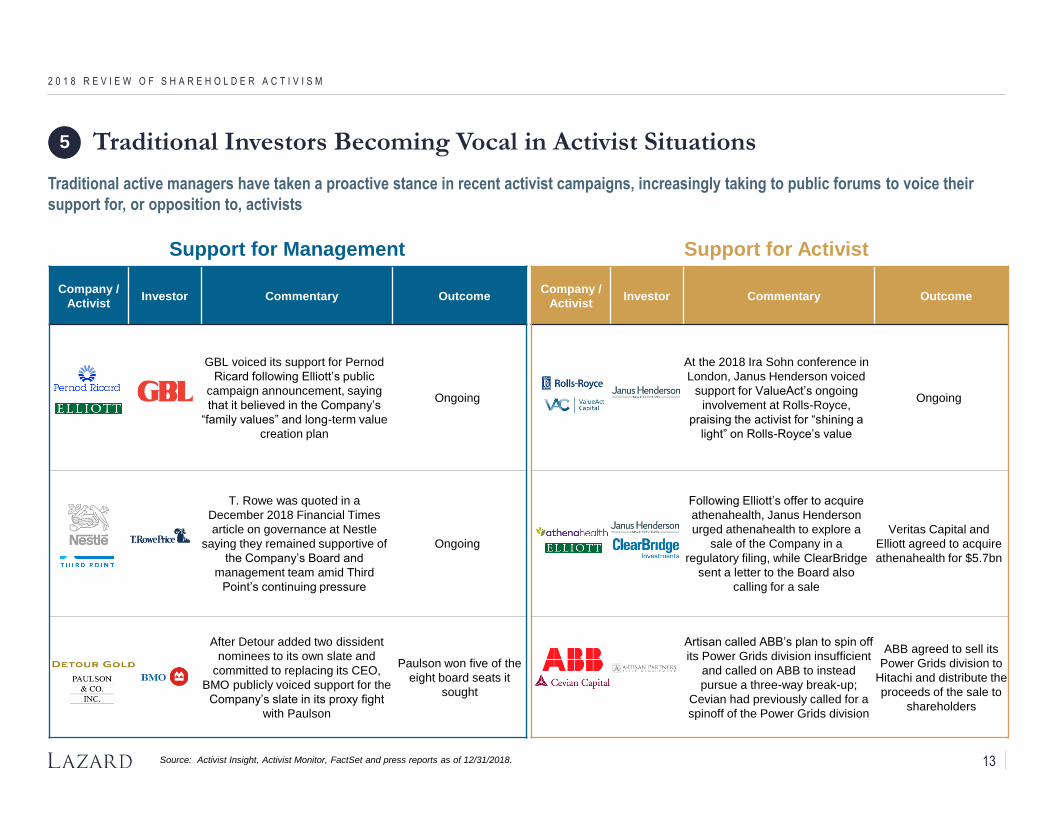
ActivistInvestor Commentary Outcome
GBL voiced its support for Pernod
Ricard following Elliott’s public
campaign announcement, saying
that it believed in the Company’s
“family values” and long-term value
creation plan
Ongoing
T. Rowe was quoted in a
December 2018 Financial Times
article on governance at Nestle
saying they remained supportive of
the Company’s Board and
management team amid Third
Point’s continuing pressure
Ongoing
After Detour added two dissident
nominees to its own slate and
committed to replacing its CEO,
BMO publicly voiced support for the
Company’s slate in its proxy fight
with Paulson
Paulson won five of the
eight board seats it
sought
2 0 1 8 R E V I E W O F S H A R E H O L D E R A C T I V I S M
Traditional Investors Becoming Vocal in Activist Situations
Traditional active managers have taken a proactive stance in recent activist campaigns, increasingly taking to public forums to voice their
support for, or opposition to, activists
Source: Activist Insight, Activist Monitor, FactSet and press reports as of 12/31/2018.
5
Support for Management Support for Activist
Company /
ActivistInvestor Commentary Outcome
At the 2018 Ira Sohn conference in
London, Janus Henderson voiced
support for ValueAct’s ongoing
involvement at Rolls-Royce,
praising the activist for “shining a
light” on Rolls-Royce’s value
Ongoing
Following Elliott’s offer to acquire
athenahealth, Janus Henderson
urged athenahealth to explore a
sale of the Company in a
regulatory filing, while ClearBridge
sent a letter to the Board also
calling for a sale
Veritas Capital and
Elliott agreed to acquire
athenahealth for $5.7bn
Artisan called ABB’s plan to spin off
its Power Grids division insufficient
and called on ABB to instead
pursue a three-way break-up;
Cevian had previously called for a
spinoff of the Power Grids division
ABB agreed to sell its
Power Grids division to
Hitachi and distribute the
proceeds of the sale to
shareholders
13
2 0 1 8 R E V I E W O F S H A R E H O L D E R A C T I V I S M
Source: FactSet and press reports.
1 Represents data through 3Q 2018.
2 Includes BEL 20 (Belgium) and AEX (Netherlands).
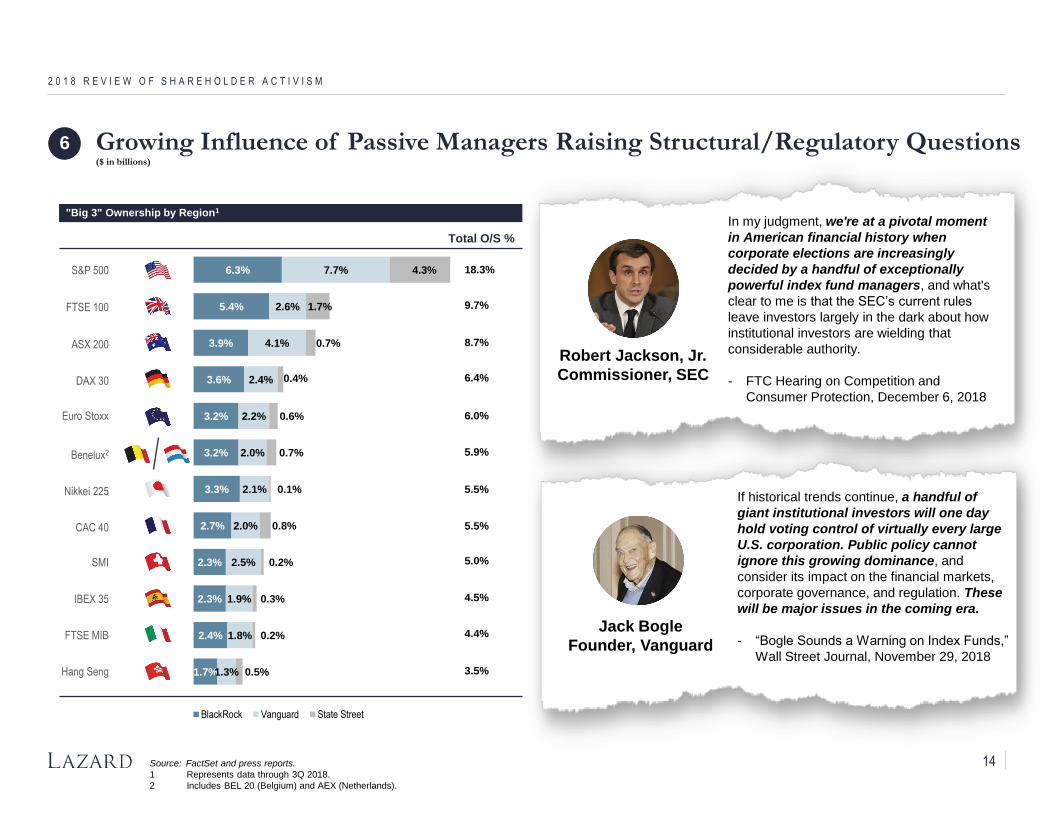
Robert Jackson, Jr.
Commissioner, SEC
In my judgment, we're at a pivotal moment
in American financial history when
corporate elections are increasingly
decided by a handful of exceptionally
powerful index fund managers, and what's
clear to me is that the SEC’s current rules
leave investors largely in the dark about how
institutional investors are wielding that
considerable authority.
- FTC Hearing on Competition and
Consumer Protection, December 6, 2018
Growing Influence of Passive Managers Raising Structural/Regulatory Questions($ in billions)
6
Total O/S %
Hang Seng 1.7%
2.4%
2.3%
2.3%
2.7%
3.3%
3.2%
3.2%
3.6%
3.9%
5.4%
6.3%
1.3%
1.8%
1.9%
2.5%
2.0%
2.1%
2.0%
2.2%
2.4%
4.1%
2.6%
7.7%
0.5%
0.2%
0.3%
0.2%
0.8%
0.1%
0.7%
0.6%
0.4%
0.7%
1.7%
4.3%
BlackRock Vanguard State Street
FTSE MIB
IBEX 35
SMI
CAC 40
Nikkei 225
Benelux2
Euro Stoxx
DAX 30
ASX 200
FTSE 100
S&P 500 18.3%
9.7%
6.4%
6.0%
5.9%
5.5%
5.0%
4.5%
4.4%
3.5%
8.7%
5.5%
"Big 3" Ownership by Region1
If historical trends continue, a handful of
giant institutional investors will one day
hold voting control of virtually every large
U.S. corporation. Public policy cannot
ignore this growing dominance, and
consider its impact on the financial markets,
corporate governance, and regulation. These
will be major issues in the coming era.
- “Bogle Sounds a Warning on Index Funds,”
Wall Street Journal, November 29, 2018
Jack Bogle
Founder, Vanguard
14
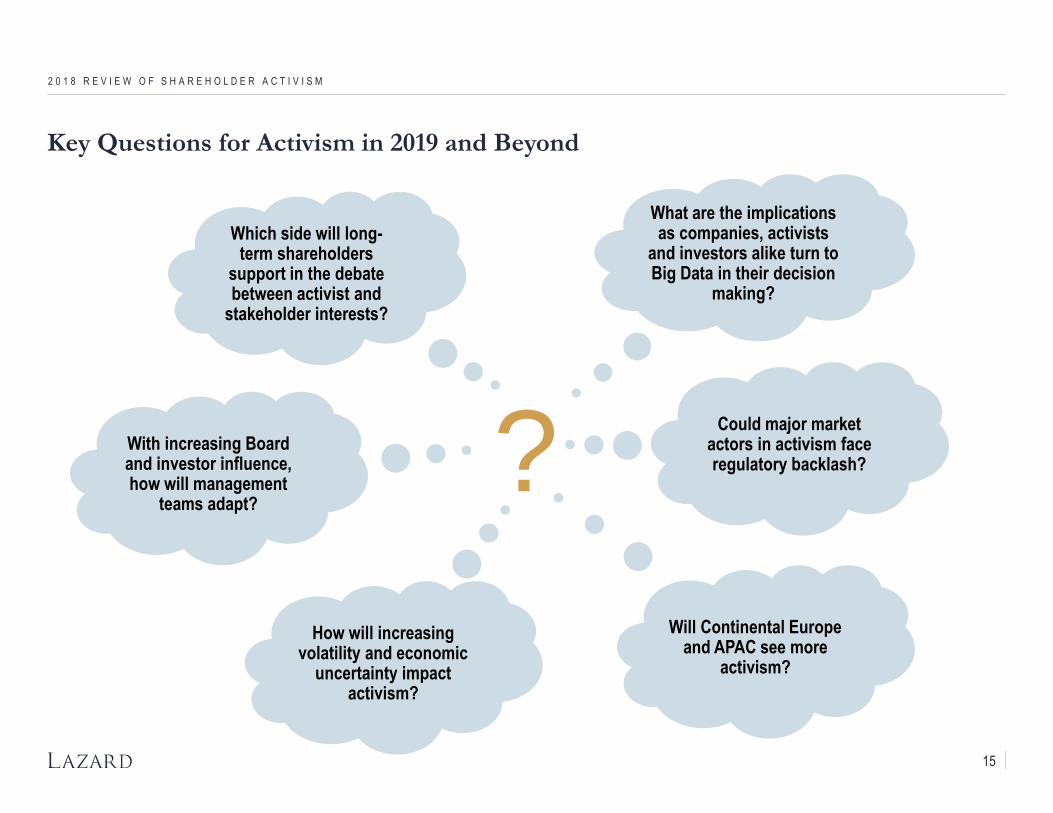
Key Questions for Activism in 2019 and Beyond
?
What are the implications as companies, activists
and investors alike turn to Big Data in their decision
making?
Could major market actors in activism face regulatory backlash?
With increasing Board and investor influence, how will management
teams adapt?
How will increasing volatility and economic
uncertainty impact activism?
Which side will long-term shareholders
support in the debate between activist and
stakeholder interests?
2 0 1 8 R E V I E W O F S H A R E H O L D E R A C T I V I S M
Will Continental Europe and APAC see more
activism?
15
C O N F I D E N T I A L
Appendix
2 0 1 8 R E V I E W O F S H A R E H O L D E R A C T I V I S M
C O N F I D E N T I A L
A List of 2018 Activist Campaigns
2 0 1 8 R E V I E W O F S H A R E H O L D E R A C T I V I S M
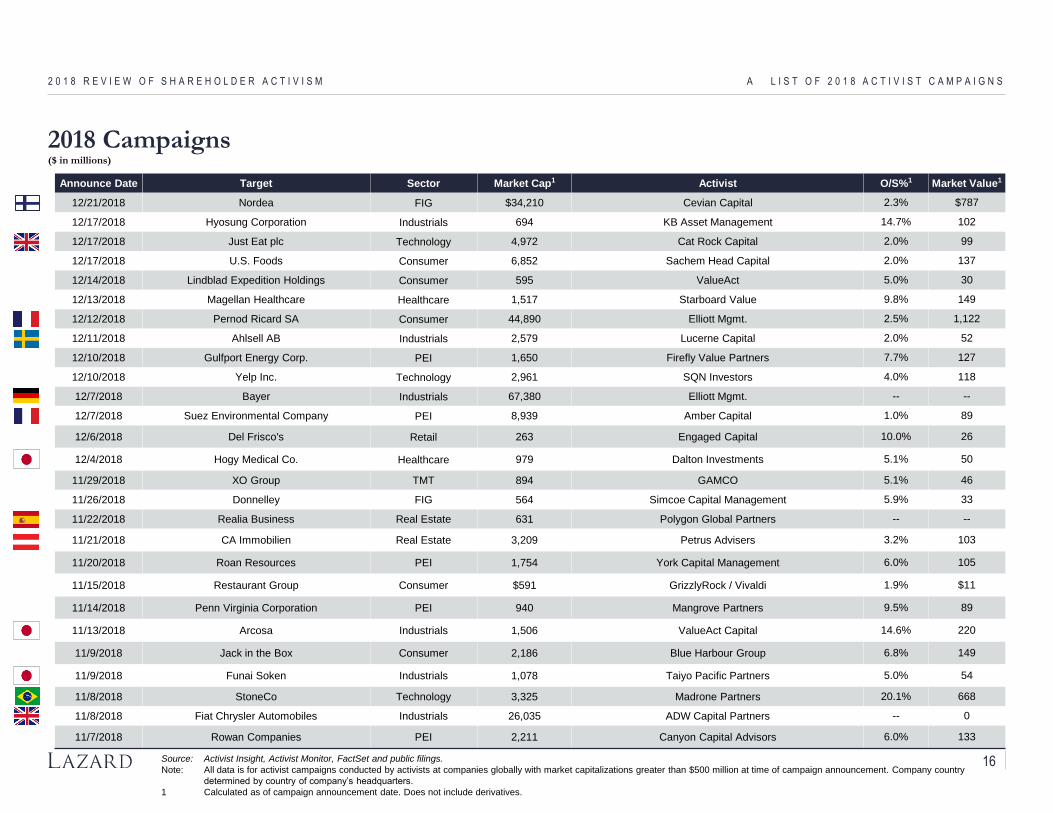
Announce Date Target Sector Market Cap1 Activist O/S%1 Market Value1
12/21/2018 Nordea FIG $34,210 Cevian Capital 2.3% $787
12/17/2018 Hyosung Corporation Industrials 694 KB Asset Management 14.7% 102
12/17/2018 Just Eat plc Technology 4,972 Cat Rock Capital 2.0% 99
12/17/2018 U.S. Foods Consumer 6,852 Sachem Head Capital 2.0% 137
12/14/2018 Lindblad Expedition Holdings Consumer 595 ValueAct 5.0% 30
12/13/2018 Magellan Healthcare Healthcare 1,517 Starboard Value 9.8% 149
12/12/2018 Pernod Ricard SA Consumer 44,890 Elliott Mgmt. 2.5% 1,122
12/11/2018 Ahlsell AB Industrials 2,579 Lucerne Capital 2.0% 52
12/10/2018 Gulfport Energy Corp. PEI 1,650 Firefly Value Partners 7.7% 127
12/10/2018 Yelp Inc. Technology 2,961 SQN Investors 4.0% 118
12/7/2018 Bayer Industrials 67,380 Elliott Mgmt. -- --
12/7/2018 Suez Environmental Company PEI 8,939 Amber Capital 1.0% 89
12/6/2018 Del Frisco's Retail 263 Engaged Capital 10.0% 26
12/4/2018 Hogy Medical Co. Healthcare 979 Dalton Investments 5.1% 50
11/29/2018 XO Group TMT 894 GAMCO 5.1% 46
11/26/2018 Donnelley FIG 564 Simcoe Capital Management 5.9% 33
11/22/2018 Realia Business Real Estate 631 Polygon Global Partners -- --
11/21/2018 CA Immobilien Real Estate 3,209 Petrus Advisers 3.2% 103
11/20/2018 Roan Resources PEI 1,754 York Capital Management 6.0% 105
11/15/2018 Restaurant Group Consumer $591 GrizzlyRock / Vivaldi 1.9% $11
11/14/2018 Penn Virginia Corporation PEI 940 Mangrove Partners 9.5% 89
11/13/2018 Arcosa Industrials 1,506 ValueAct Capital 14.6% 220
11/9/2018 Jack in the Box Consumer 2,186 Blue Harbour Group 6.8% 149
11/9/2018 Funai Soken Industrials 1,078 Taiyo Pacific Partners 5.0% 54
11/8/2018 StoneCo Technology 3,325 Madrone Partners 20.1% 668
11/8/2018 Fiat Chrysler Automobiles Industrials 26,035 ADW Capital Partners -- 0
11/7/2018 Rowan Companies PEI 2,211 Canyon Capital Advisors 6.0% 133
A L I S T O F 2 0 1 8 A C T I V I S T C A M P A I G N S2 0 1 8 R E V I E W O F S H A R E H O L D E R A C T I V I S M
Source: Activist Insight, Activist Monitor, FactSet and public filings.
Note: All data is for activist campaigns conducted by activists at companies globally with market capitalizations greater than $500 million at time of campaign announcement. Company country
determined by country of company’s headquarters.
1 Calculated as of campaign announcement date. Does not include derivatives.
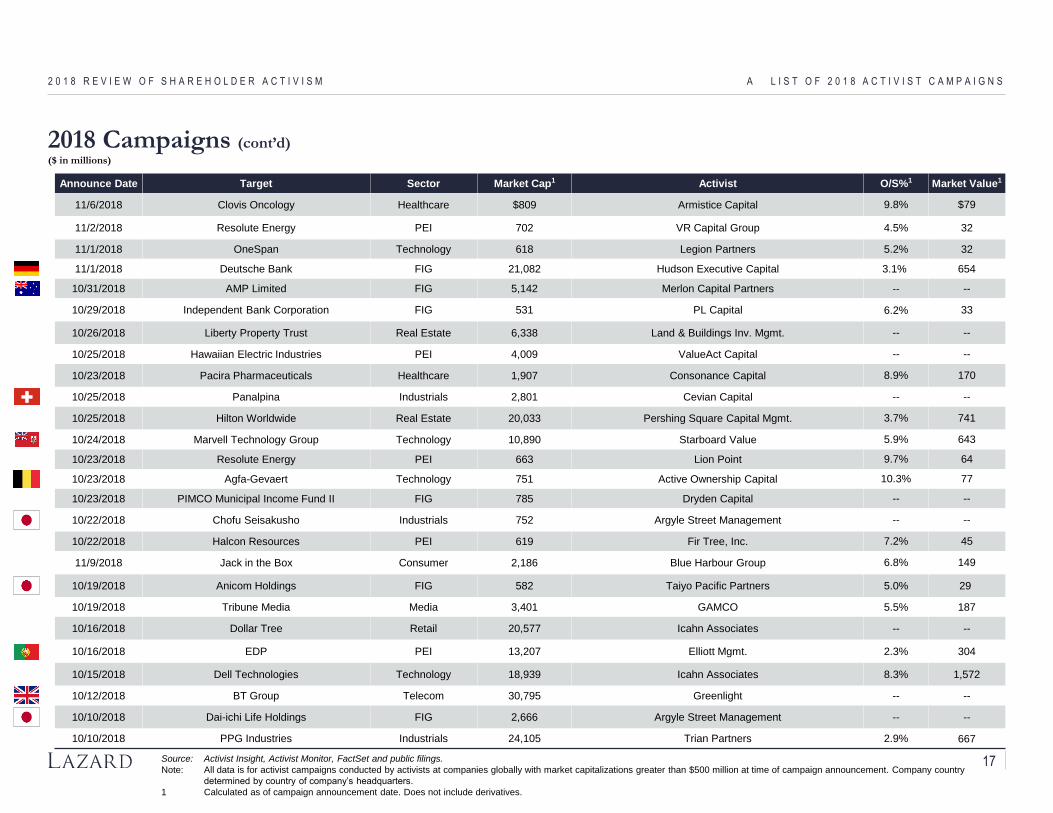
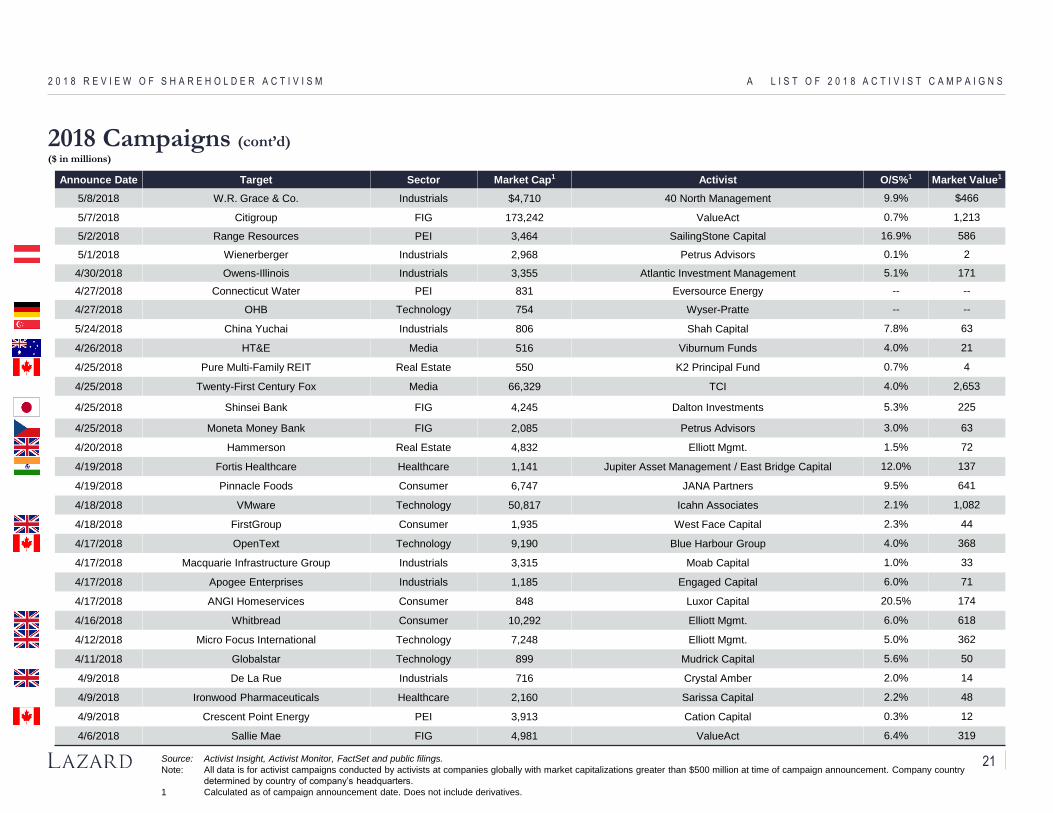
2018 Campaigns($ in millions)
16
A L I S T O F 2 0 1 8 A C T I V I S T C A M P A I G N S2 0 1 8 R E V I E W O F S H A R E H O L D E R A C T I V I S M
2018 Campaigns (cont’d)($ in millions)
Announce Date Target Sector Market Cap1 Activist O/S%1 Market Value1
11/6/2018 Clovis Oncology Healthcare $809 Armistice Capital 9.8% $79
11/2/2018 Resolute Energy PEI 702 VR Capital Group 4.5% 32
11/1/2018 OneSpan Technology 618 Legion Partners 5.2% 32
11/1/2018 Deutsche Bank FIG 21,082 Hudson Executive Capital 3.1% 654
10/31/2018 AMP Limited FIG 5,142 Merlon Capital Partners -- --
10/29/2018 Independent Bank Corporation FIG 531 PL Capital 6.2% 33
10/26/2018 Liberty Property Trust Real Estate 6,338 Land & Buildings Inv. Mgmt. -- --
10/25/2018 Hawaiian Electric Industries PEI 4,009 ValueAct Capital -- --
10/23/2018 Pacira Pharmaceuticals Healthcare 1,907 Consonance Capital 8.9% 170
10/25/2018 Panalpina Industrials 2,801 Cevian Capital -- --
10/25/2018 Hilton Worldwide Real Estate 20,033 Pershing Square Capital Mgmt. 3.7% 741
10/24/2018 Marvell Technology Group Technology 10,890 Starboard Value 5.9% 643
10/23/2018 Resolute Energy PEI 663 Lion Point 9.7% 64
10/23/2018 Agfa-Gevaert Technology 751 Active Ownership Capital 10.3% 77
10/23/2018 PIMCO Municipal Income Fund II FIG 785 Dryden Capital -- --
10/22/2018 Chofu Seisakusho Industrials 752 Argyle Street Management -- --
10/22/2018 Halcon Resources PEI 619 Fir Tree, Inc. 7.2% 45
11/9/2018 Jack in the Box Consumer 2,186 Blue Harbour Group 6.8% 149
10/19/2018 Anicom Holdings FIG 582 Taiyo Pacific Partners 5.0% 29
10/19/2018 Tribune Media Media 3,401 GAMCO 5.5% 187
10/16/2018 Dollar Tree Retail 20,577 Icahn Associates -- --
10/16/2018 EDP PEI 13,207 Elliott Mgmt. 2.3% 304
10/15/2018 Dell Technologies Technology 18,939 Icahn Associates 8.3% 1,572
10/12/2018 BT Group Telecom 30,795 Greenlight -- --
10/10/2018 Dai-ichi Life Holdings FIG 2,666 Argyle Street Management -- --
10/10/2018 PPG Industries Industrials 24,105 Trian Partners 2.9% 667
Source: Activist Insight, Activist Monitor, FactSet and public filings.
Note: All data is for activist campaigns conducted by activists at companies globally with market capitalizations greater than $500 million at time of campaign announcement. Company country
determined by country of company’s headquarters.
1 Calculated as of campaign announcement date. Does not include derivatives.
17
A L I S T O F 2 0 1 8 A C T I V I S T C A M P A I G N S2 0 1 8 R E V I E W O F S H A R E H O L D E R A C T I V I S M
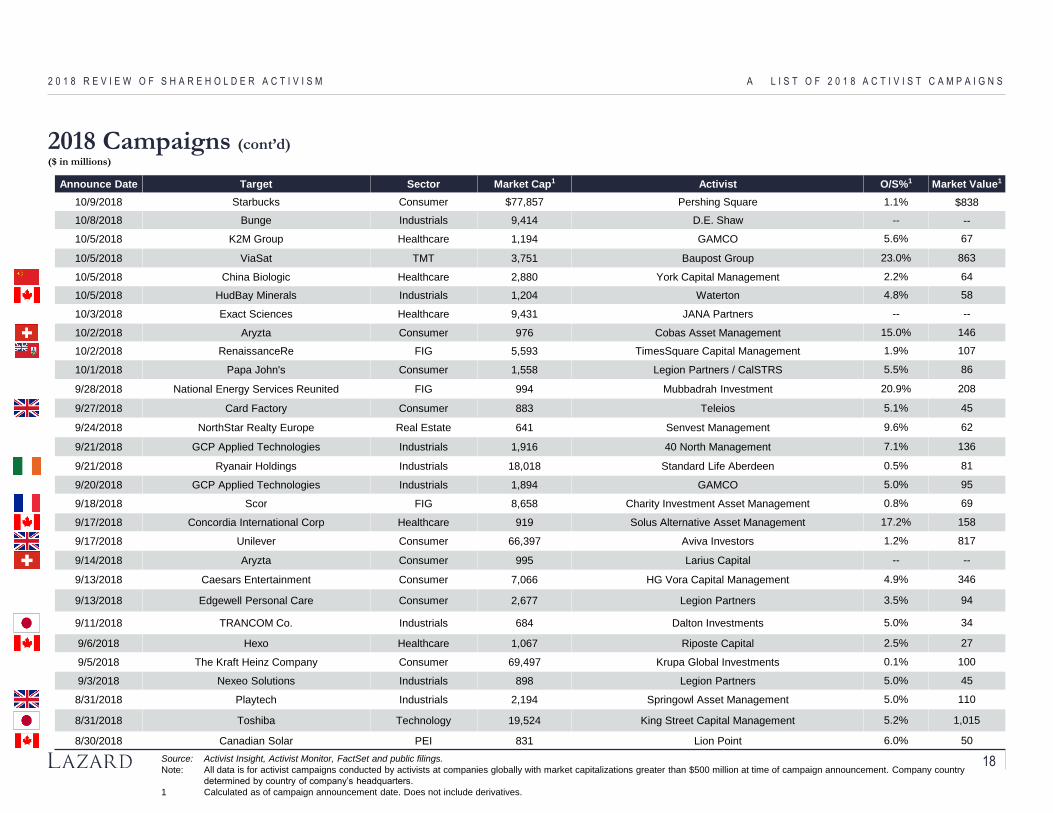
2018 Campaigns (cont’d)($ in millions)
Announce Date Target Sector Market Cap1 Activist O/S%1 Market Value1
10/9/2018 Starbucks Consumer $77,857 Pershing Square 1.1% $838
10/8/2018 Bunge Industrials 9,414 D.E. Shaw -- --
10/5/2018 K2M Group Healthcare 1,194 GAMCO 5.6% 67
10/5/2018 ViaSat TMT 3,751 Baupost Group 23.0% 863
10/5/2018 China Biologic Healthcare 2,880 York Capital Management 2.2% 64
10/5/2018 HudBay Minerals Industrials 1,204 Waterton 4.8% 58
10/3/2018 Exact Sciences Healthcare 9,431 JANA Partners -- --
10/2/2018 Aryzta Consumer 976 Cobas Asset Management 15.0% 146
10/2/2018 RenaissanceRe FIG 5,593 TimesSquare Capital Management 1.9% 107
10/1/2018 Papa John's Consumer 1,558 Legion Partners / CalSTRS 5.5% 86
9/28/2018 National Energy Services Reunited FIG 994 Mubbadrah Investment 20.9% 208
9/27/2018 Card Factory Consumer 883 Teleios 5.1% 45
9/24/2018 NorthStar Realty Europe Real Estate 641 Senvest Management 9.6% 62
9/21/2018 GCP Applied Technologies Industrials 1,916 40 North Management 7.1% 136
9/21/2018 Ryanair Holdings Industrials 18,018 Standard Life Aberdeen 0.5% 81
9/20/2018 GCP Applied Technologies Industrials 1,894 GAMCO 5.0% 95
9/18/2018 Scor FIG 8,658 Charity Investment Asset Management 0.8% 69
9/17/2018 Concordia International Corp Healthcare 919 Solus Alternative Asset Management 17.2% 158
9/17/2018 Unilever Consumer 66,397 Aviva Investors 1.2% 817
9/14/2018 Aryzta Consumer 995 Larius Capital -- --
9/13/2018 Caesars Entertainment Consumer 7,066 HG Vora Capital Management 4.9% 346
9/13/2018 Edgewell Personal Care Consumer 2,677 Legion Partners 3.5% 94
9/11/2018 TRANCOM Co. Industrials 684 Dalton Investments 5.0% 34
9/6/2018 Hexo Healthcare 1,067 Riposte Capital 2.5% 27
9/5/2018 The Kraft Heinz Company Consumer 69,497 Krupa Global Investments 0.1% 100
9/3/2018 Nexeo Solutions Industrials 898 Legion Partners 5.0% 45
8/31/2018 Playtech Industrials 2,194 Springowl Asset Management 5.0% 110
8/31/2018 Toshiba Technology 19,524 King Street Capital Management 5.2% 1,015
8/30/2018 Canadian Solar PEI 831 Lion Point 6.0% 50
Source: Activist Insight, Activist Monitor, FactSet and public filings.
Note: All data is for activist campaigns conducted by activists at companies globally with market capitalizations greater than $500 million at time of campaign announcement. Company country
determined by country of company’s headquarters.
1 Calculated as of campaign announcement date. Does not include derivatives.
18
A L I S T O F 2 0 1 8 A C T I V I S T C A M P A I G N S2 0 1 8 R E V I E W O F S H A R E H O L D E R A C T I V I S M
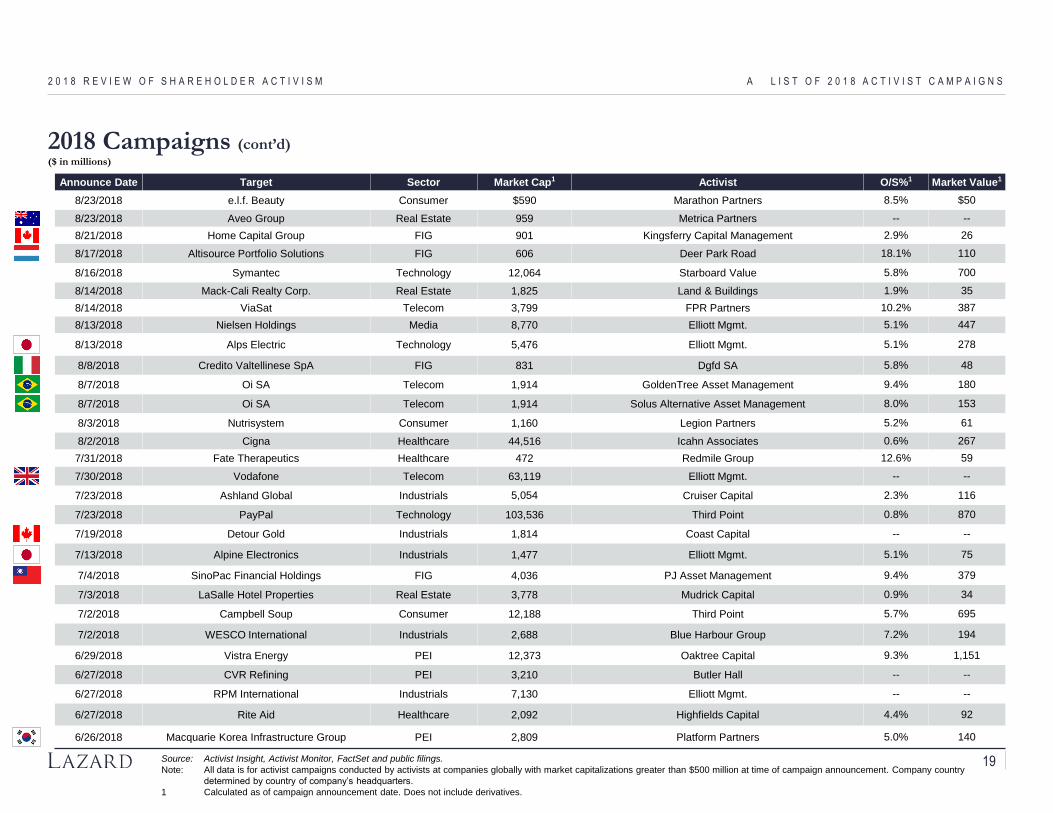
2018 Campaigns (cont’d)($ in millions)
Announce Date Target Sector Market Cap1 Activist O/S%1 Market Value1
8/23/2018 e.l.f. Beauty Consumer $590 Marathon Partners 8.5% $50
8/23/2018 Aveo Group Real Estate 959 Metrica Partners -- --
8/21/2018 Home Capital Group FIG 901 Kingsferry Capital Management 2.9% 26
8/17/2018 Altisource Portfolio Solutions FIG 606 Deer Park Road 18.1% 110
8/16/2018 Symantec Technology 12,064 Starboard Value 5.8% 700
8/14/2018 Mack-Cali Realty Corp. Real Estate 1,825 Land & Buildings 1.9% 35
8/14/2018 ViaSat Telecom 3,799 FPR Partners 10.2% 387
8/13/2018 Nielsen Holdings Media 8,770 Elliott Mgmt. 5.1% 447
8/13/2018 Alps Electric Technology 5,476 Elliott Mgmt. 5.1% 278
8/8/2018 Credito Valtellinese SpA FIG 831 Dgfd SA 5.8% 48
8/7/2018 Oi SA Telecom 1,914 GoldenTree Asset Management 9.4% 180
8/7/2018 Oi SA Telecom 1,914 Solus Alternative Asset Management 8.0% 153
8/3/2018 Nutrisystem Consumer 1,160 Legion Partners 5.2% 61
8/2/2018 Cigna Healthcare 44,516 Icahn Associates 0.6% 267
7/31/2018 Fate Therapeutics Healthcare 472 Redmile Group 12.6% 59
7/30/2018 Vodafone Telecom 63,119 Elliott Mgmt. -- --
7/23/2018 Ashland Global Industrials 5,054 Cruiser Capital 2.3% 116
7/23/2018 PayPal Technology 103,536 Third Point 0.8% 870
7/19/2018 Detour Gold Industrials 1,814 Coast Capital -- --
7/13/2018 Alpine Electronics Industrials 1,477 Elliott Mgmt. 5.1% 75
7/4/2018 SinoPac Financial Holdings FIG 4,036 PJ Asset Management 9.4% 379
7/3/2018 LaSalle Hotel Properties Real Estate 3,778 Mudrick Capital 0.9% 34
7/2/2018 Campbell Soup Consumer 12,188 Third Point 5.7% 695
7/2/2018 WESCO International Industrials 2,688 Blue Harbour Group 7.2% 194
6/29/2018 Vistra Energy PEI 12,373 Oaktree Capital 9.3% 1,151
6/27/2018 CVR Refining PEI 3,210 Butler Hall -- --
6/27/2018 RPM International Industrials 7,130 Elliott Mgmt. -- --
6/27/2018 Rite Aid Healthcare 2,092 Highfields Capital 4.4% 92
6/26/2018 Macquarie Korea Infrastructure Group PEI 2,809 Platform Partners 5.0% 140
Source: Activist Insight, Activist Monitor, FactSet and public filings.
Note: All data is for activist campaigns conducted by activists at companies globally with market capitalizations greater than $500 million at time of campaign announcement. Company country
determined by country of company’s headquarters.
1 Calculated as of campaign announcement date. Does not include derivatives.
19
A L I S T O F 2 0 1 8 A C T I V I S T C A M P A I G N S2 0 1 8 R E V I E W O F S H A R E H O L D E R A C T I V I S M
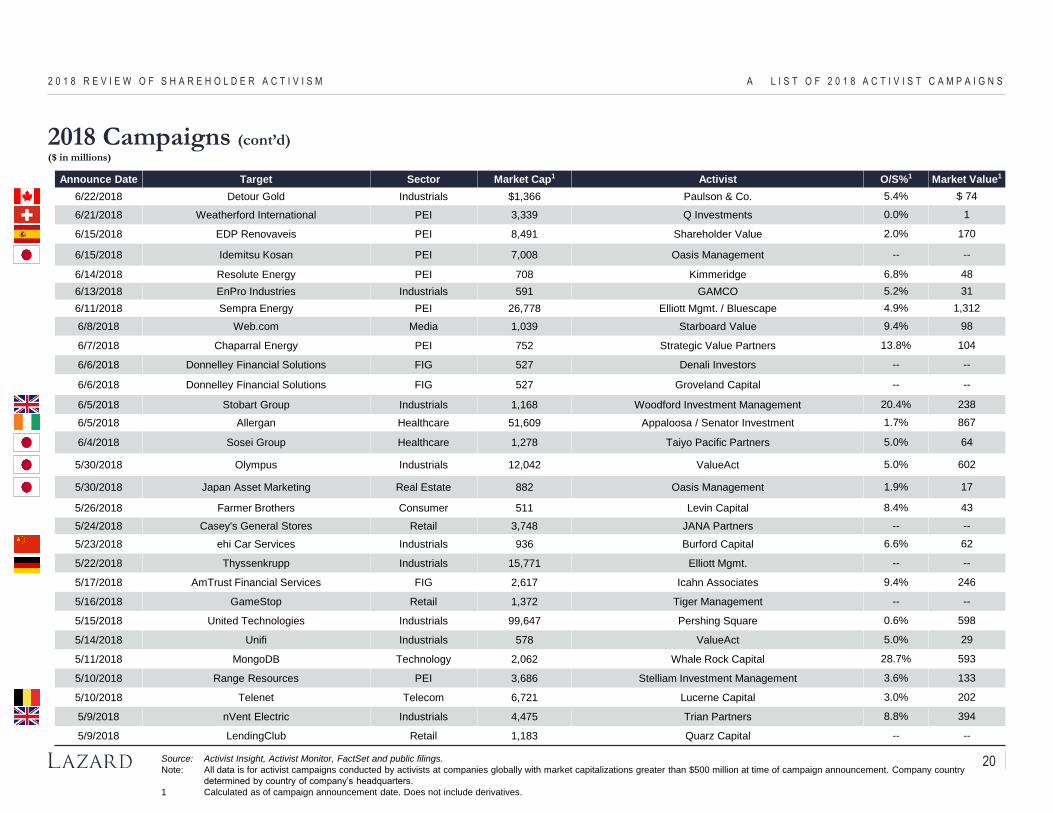
2018 Campaigns (cont’d)($ in millions)
6 Announce Date Target Sector Market Cap1 Activist O/S%1 Market Value1
6/22/2018 Detour Gold Industrials $1,366 Paulson & Co. 5.4% $ 74
6/21/2018 Weatherford International PEI 3,339 Q Investments 0.0% 1
6/15/2018 EDP Renovaveis PEI 8,491 Shareholder Value 2.0% 170
6/15/2018 Idemitsu Kosan PEI 7,008 Oasis Management -- --
6/14/2018 Resolute Energy PEI 708 Kimmeridge 6.8% 48
6/13/2018 EnPro Industries Industrials 591 GAMCO 5.2% 31
6/11/2018 Sempra Energy PEI 26,778 Elliott Mgmt. / Bluescape 4.9% 1,312
6/8/2018 Web.com Media 1,039 Starboard Value 9.4% 98
6/7/2018 Chaparral Energy PEI 752 Strategic Value Partners 13.8% 104
6/6/2018 Donnelley Financial Solutions FIG 527 Denali Investors -- --
6/6/2018 Donnelley Financial Solutions FIG 527 Groveland Capital -- --
6/5/2018 Stobart Group Industrials 1,168 Woodford Investment Management 20.4% 238
6/5/2018 Allergan Healthcare 51,609 Appaloosa / Senator Investment 1.7% 867
6/4/2018 Sosei Group Healthcare 1,278 Taiyo Pacific Partners 5.0% 64
5/30/2018 Olympus Industrials 12,042 ValueAct 5.0% 602
5/30/2018 Japan Asset Marketing Real Estate 882 Oasis Management 1.9% 17
5/26/2018 Farmer Brothers Consumer 511 Levin Capital 8.4% 43
5/24/2018 Casey's General Stores Retail 3,748 JANA Partners -- --
5/23/2018 ehi Car Services Industrials 936 Burford Capital 6.6% 62
5/22/2018 Thyssenkrupp Industrials 15,771 Elliott Mgmt. -- --
5/17/2018 AmTrust Financial Services FIG 2,617 Icahn Associates 9.4% 246
5/16/2018 GameStop Retail 1,372 Tiger Management -- --
5/15/2018 United Technologies Industrials 99,647 Pershing Square 0.6% 598
5/14/2018 Unifi Industrials 578 ValueAct 5.0% 29
5/11/2018 MongoDB Technology 2,062 Whale Rock Capital 28.7% 593
5/10/2018 Range Resources PEI 3,686 Stelliam Investment Management 3.6% 133
5/10/2018 Telenet Telecom 6,721 Lucerne Capital 3.0% 202
5/9/2018 nVent Electric Industrials 4,475 Trian Partners 8.8% 394
5/9/2018 LendingClub Retail 1,183 Quarz Capital -- --
Source: Activist Insight, Activist Monitor, FactSet and public filings.
Note: All data is for activist campaigns conducted by activists at companies globally with market capitalizations greater than $500 million at time of campaign announcement. Company country
determined by country of company’s headquarters.
1 Calculated as of campaign announcement date. Does not include derivatives.
20
A L I S T O F 2 0 1 8 A C T I V I S T C A M P A I G N S2 0 1 8 R E V I E W O F S H A R E H O L D E R A C T I V I S M
2018 Campaigns (cont’d)($ in millions)
Announce Date Target Sector Market Cap1 Activist O/S%1 Market Value1
5/8/2018 W.R. Grace & Co. Industrials $4,710 40 North Management 9.9% $466
5/7/2018 Citigroup FIG 173,242 ValueAct 0.7% 1,213
5/2/2018 Range Resources PEI 3,464 SailingStone Capital 16.9% 586
5/1/2018 Wienerberger Industrials 2,968 Petrus Advisors 0.1% 2
4/30/2018 Owens-Illinois Industrials 3,355 Atlantic Investment Management 5.1% 171
4/27/2018 Connecticut Water PEI 831 Eversource Energy -- --
4/27/2018 OHB Technology 754 Wyser-Pratte -- --
5/24/2018 China Yuchai Industrials 806 Shah Capital 7.8% 63
4/26/2018 HT&E Media 516 Viburnum Funds 4.0% 21
4/25/2018 Pure Multi-Family REIT Real Estate 550 K2 Principal Fund 0.7% 4
4/25/2018 Twenty-First Century Fox Media 66,329 TCI 4.0% 2,653
4/25/2018 Shinsei Bank FIG 4,245 Dalton Investments 5.3% 225
4/25/2018 Moneta Money Bank FIG 2,085 Petrus Advisors 3.0% 63
4/20/2018 Hammerson Real Estate 4,832 Elliott Mgmt. 1.5% 72
4/19/2018 Fortis Healthcare Healthcare 1,141 Jupiter Asset Management / East Bridge Capital 12.0% 137
4/19/2018 Pinnacle Foods Consumer 6,747 JANA Partners 9.5% 641
4/18/2018 VMware Technology 50,817 Icahn Associates 2.1% 1,082
4/18/2018 FirstGroup Consumer 1,935 West Face Capital 2.3% 44
4/17/2018 OpenText Technology 9,190 Blue Harbour Group 4.0% 368
4/17/2018 Macquarie Infrastructure Group Industrials 3,315 Moab Capital 1.0% 33
4/17/2018 Apogee Enterprises Industrials 1,185 Engaged Capital 6.0% 71
4/17/2018 ANGI Homeservices Consumer 848 Luxor Capital 20.5% 174
4/16/2018 Whitbread Consumer 10,292 Elliott Mgmt. 6.0% 618
4/12/2018 Micro Focus International Technology 7,248 Elliott Mgmt. 5.0% 362
4/11/2018 Globalstar Technology 899 Mudrick Capital 5.6% 50
4/9/2018 De La Rue Industrials 716 Crystal Amber 2.0% 14
4/9/2018 Ironwood Pharmaceuticals Healthcare 2,160 Sarissa Capital 2.2% 48
4/9/2018 Crescent Point Energy PEI 3,913 Cation Capital 0.3% 12
4/6/2018 Sallie Mae FIG 4,981 ValueAct 6.4% 319
Source: Activist Insight, Activist Monitor, FactSet and public filings.
Note: All data is for activist campaigns conducted by activists at companies globally with market capitalizations greater than $500 million at time of campaign announcement. Company country
determined by country of company’s headquarters.
1 Calculated as of campaign announcement date. Does not include derivatives.
21
A L I S T O F 2 0 1 8 A C T I V I S T C A M P A I G N S2 0 1 8 R E V I E W O F S H A R E H O L D E R A C T I V I S M
2018 Campaigns (cont’d)($ in millions)
6Announce Date Target Sector Market Cap1 Activist O/S%1 Market Value1
4/5/2018 Carrizo Oil & Gas PEI $1,257 Kimmeridge 7.5% $94
4/5/2018 McDermott International Industrials 1,659 Hotchkis & Wiley Capital 2.0% 33
4/5/2018 Artis REIT Real Estate 1,626 Sandpiper Asset Management 4.5% 73
4/4/2018 Macerich Real Estate 7,905 Starboard Value 0.4% 32
4/4/2018 Navient Corp. FIG 3,309 Canyon Partners 7.8% 258
4/3/2018 Hyundai Motor Group Industrials 30,957 Elliott Mgmt. 2.6% 808
4/3/2018 Consolidated Communications Holdings Telecom 741 Maglan Capital 2.2% 16
4/2/2018 LaSalle Hotel Properties Real Estate 3,284 HG Vora Capital Management 7.1% 233
4/2/2018 Commvault Systems Technology 2,562 Elliott Mgmt. 10.3% 264
3/29/2018 Ahold Delhaize Consumer 29,370 CIAM 1.0% 294
3/28/2018 Gray Televsion Media 1,096 GAMCO 1.3% 14
3/26/2018 Travelport Worldwide Consumer 1,799 Elliott Mgmt. 11.8% 212
3/26/2018 United Technologies Industrials 97,859 Third Point 1.5% 1,468
3/26/2018 Petroleo Brasileiro PEI 90,064 Leblon Equities -- --
3/23/2018 Alder BioPharmaceuticals Healthcare 770 Redmile Group 10.0% 77
3/23/2018 Forest City Real Estate 5,674 Starboard Value / Scopia Capital 11.3% 641
3/21/2018 Macnica Fuji Electronics Technology 1,085 Dalton Investments 8.2% 89
3/20/2018 Greif Industrials 2,484 GAMCO 5.1% 125
3/20/2018 Latecoere Industrials 543 Sterling Strategic Value / Financiere de l'Echiquier 6.4% 35
3/20/2018 Natus Medical Healthcare 1,088 Voce Capital Management 2.0% 22
3/19/2018 Gogo Telecom 813 Senator Investment Group 6.5% 53
3/19/2018 Life Storage Real Estate 3,806 Land & Buildings 1.8% 69
3/19/2018 Barclays FIG 49,766 Sherborne Investors 5.2% 2,568
3/16/2018 SPS Commerce Technology 1,070 Legion Partners / Ancora Advisors 3.1% 33
3/16/2018 Bemis Industrials 4,103 Starboard Value 1.6% 68
3/16/2018 Newell Brands Consumer 14,017 Icahn Associates 6.9% 967
3/15/2018 Altaba Technology 73,930 TCI 9.7% 7,171
3/15/2018 Asbury Automotive Industrials 1,438 Abrams Capital 5.2% 75
Source: Activist Insight, Activist Monitor, FactSet and public filings.
Note: All data is for activist campaigns conducted by activists at companies globally with market capitalizations greater than $500 million at time of campaign announcement. Company country
determined by country of company’s headquarters.
1 Calculated as of campaign announcement date. Does not include derivatives.
22
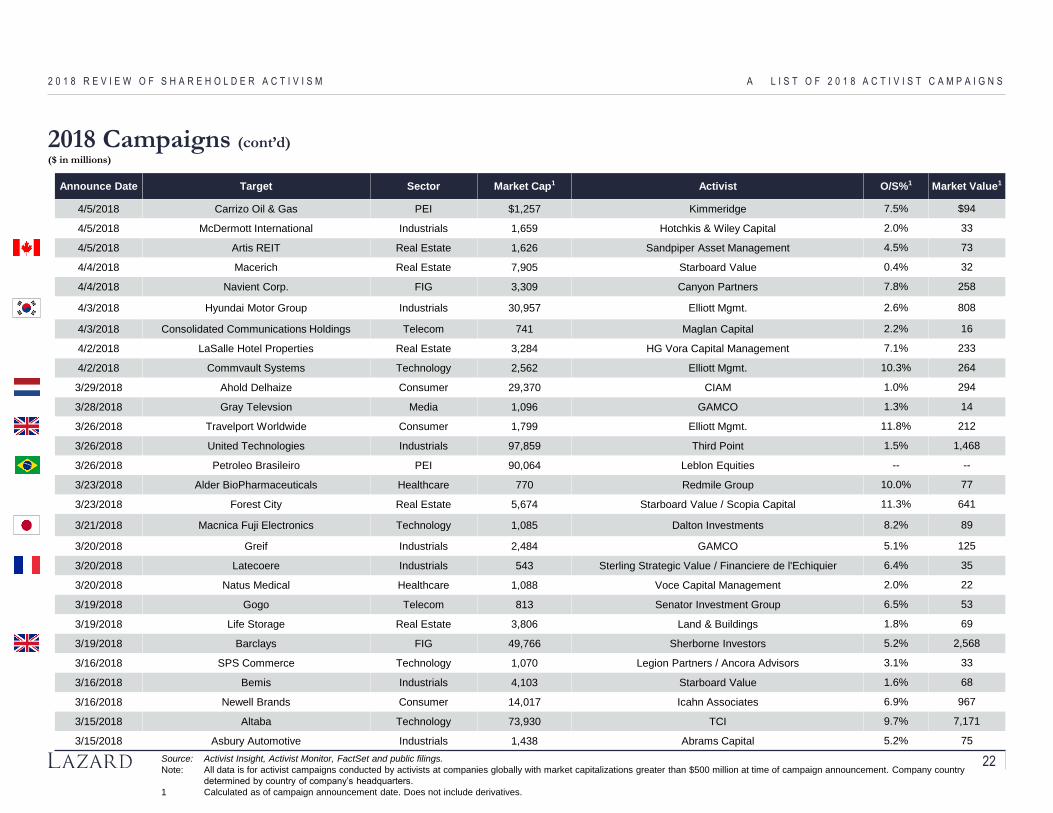
A L I S T O F 2 0 1 8 A C T I V I S T C A M P A I G N S2 0 1 8 R E V I E W O F S H A R E H O L D E R A C T I V I S M
2018 Campaigns (cont’d)($ in millions)
Announce Date Target Sector Market Cap1 Activist O/S%1 Market Value1
3/14/2018 Provident Financial FIG $1,911 Elliott Mgmt. 4.0% $76
3/13/2018 ConMed Healthcare 1,776 Scopia Capital 7.8% 139
3/12/2018 VMWare Technology 50,817 Jericho Capital Asset Management 1.8% 915
3/9/2018 Liberbank FIG 1,634 Oceanwood Capital Management 17.5% 286
3/5/2018 Bunge Consumer 10,576 Continental Grains 1.0% 106
3/5/2018 Telecom Italia Telecom 13,561 Elliott Mgmt. 6.0% 814
3/1/2018 Autoliv Industrials 12,479 Cevian Capital 6.9% 861
2/22/2018 QTS Realty Trust Real Estate 1,724 Land & Buildings 1.0% 16
2/21/2018 Bloomin' Brands Retail 1,904 Barington Capital 0.3% 6
2/21/2018 Fidessa Group Technology 1,936 Elliott Mgmt. 4.9% 94
2/20/2018 Rayonier Advanced Materials Industrials 787 Marcato Capital Management 3.6% 28
2/20/2018 Actuant Industrials 1,439 Southeastern Asset Management 9.8% 141
2/19/2018 Merlin Entertainments Media 4,902 ValueAct 5.4% 265
2/16/2018 Blackhawk Network Holdings Technology 2,541 GAMCO 5.7% 145
2/15/2018 Jack in the Box Retail 2,460 JANA Partners 7.3% 180
2/9/2018 Newell Brands Consumer 13,532 Starboard Value 4.0% 541
2/9/2018 Booker Group Consumer 5,427 Sandell Asset Mgmt. 1.8% 95
2/6/2018 Babcock & Wilcox Enterprises PEI 253 Steel Partners 11.8% 30
2/5/2018 Lattice Semiconductor Technology 777 Lion Point 6.2% 48
2/2/2018 Turquoise Hill Resources Industrials 6,151 SailingStone Capital 11.3% 696
1/31/2018 Cardtronics FIG 1,113 Hudson Executive Capital 13.1% 146
1/30/2018 Brunswick Corporation Consumer 5,250 Owl Creek 2.8% 147
1/29/2018 Antero Resources Corp. PEI 6,313 SailingStone Capital 11.1% 699
1/29/2018 A10 Networks Technology 492 VIEX Capital 5.2% 26
1/26/2018 Stewart Information Services FIG 1,093 Starboard Value 9.7% 106
1/26/2018 Resolute Energy Corporation PEI 722 Monarch Alternative Capital 9.2% 66
1/26/2018 Sky Media 25,471 Elliott Mgmt. 1.1% 280
1/26/2018 Pinnacle Foods Consumer 7,052 Third Point 0.8% 59
1/25/2018 Antero Resources Corp. PEI 6,373 Chapter IV Investors -- --
Source: Activist Insight, Activist Monitor, FactSet and public filings.
Note: All data is for activist campaigns conducted by activists at companies globally with market capitalizations greater than $500 million at time of campaign announcement. Company country
determined by country of company’s headquarters.
1 Calculated as of campaign announcement date. Does not include derivatives.
23
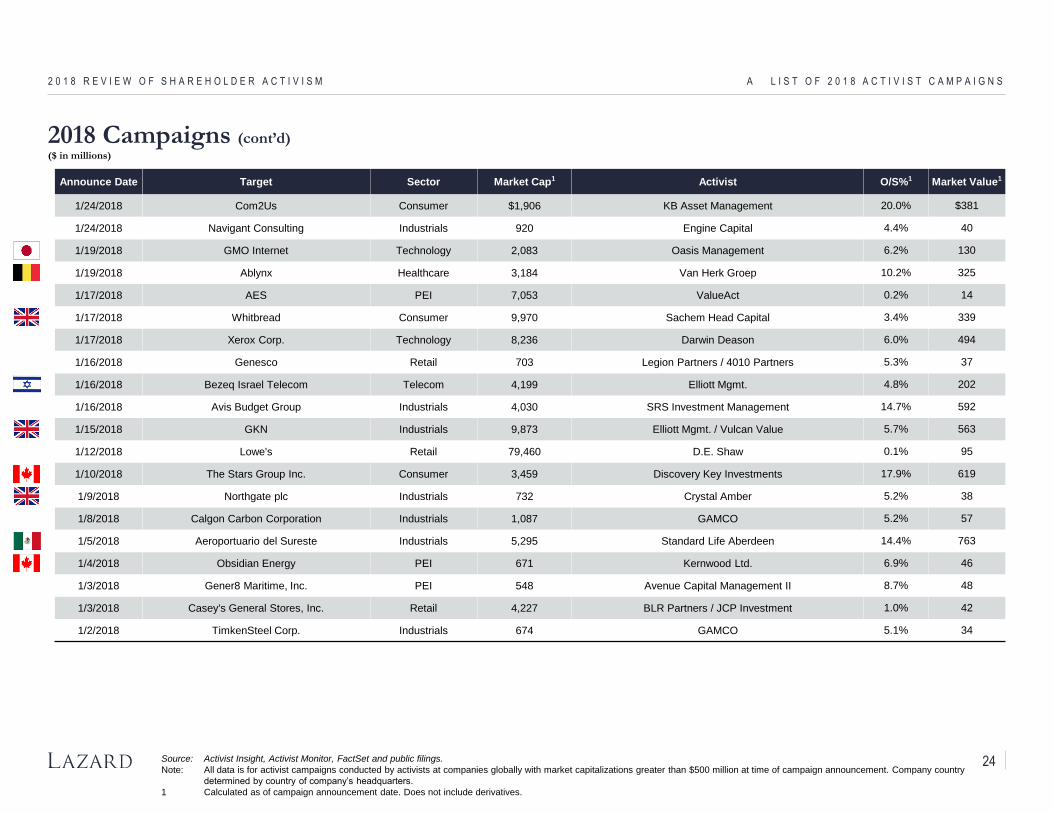
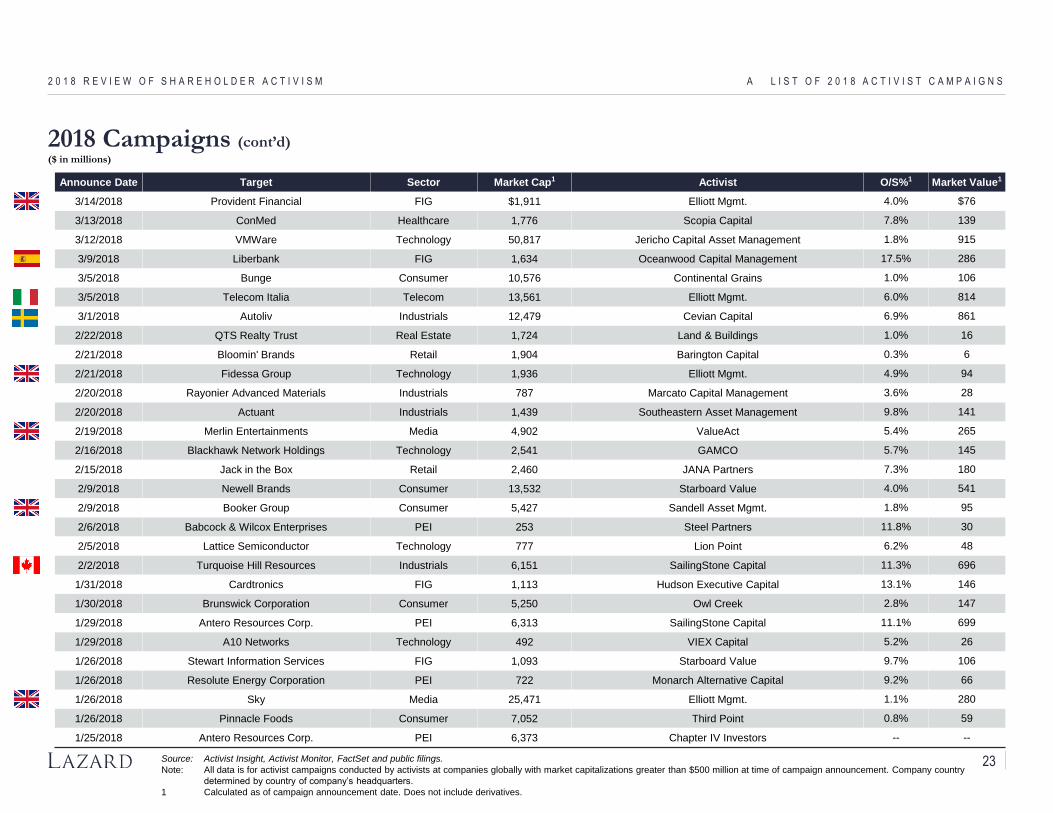
A L I S T O F 2 0 1 8 A C T I V I S T C A M P A I G N S2 0 1 8 R E V I E W O F S H A R E H O L D E R A C T I V I S M
2018 Campaigns (cont’d)($ in millions)
Announce Date Target Sector Market Cap1 Activist O/S%1 Market Value1
1/24/2018 Com2Us Consumer $1,906 KB Asset Management 20.0% $381
1/24/2018 Navigant Consulting Industrials 920 Engine Capital 4.4% 40
1/19/2018 GMO Internet Technology 2,083 Oasis Management 6.2% 130
1/19/2018 Ablynx Healthcare 3,184 Van Herk Groep 10.2% 325
1/17/2018 AES PEI 7,053 ValueAct 0.2% 14
1/17/2018 Whitbread Consumer 9,970 Sachem Head Capital 3.4% 339
1/17/2018 Xerox Corp. Technology 8,236 Darwin Deason 6.0% 494
1/16/2018 Genesco Retail 703 Legion Partners / 4010 Partners 5.3% 37
1/16/2018 Bezeq Israel Telecom Telecom 4,199 Elliott Mgmt. 4.8% 202
1/16/2018 Avis Budget Group Industrials 4,030 SRS Investment Management 14.7% 592
1/15/2018 GKN Industrials 9,873 Elliott Mgmt. / Vulcan Value 5.7% 563
1/12/2018 Lowe's Retail 79,460 D.E. Shaw 0.1% 95
1/10/2018 The Stars Group Inc. Consumer 3,459 Discovery Key Investments 17.9% 619
1/9/2018 Northgate plc Industrials 732 Crystal Amber 5.2% 38
1/8/2018 Calgon Carbon Corporation Industrials 1,087 GAMCO 5.2% 57
1/5/2018 Aeroportuario del Sureste Industrials 5,295 Standard Life Aberdeen 14.4% 763
1/4/2018 Obsidian Energy PEI 671 Kernwood Ltd. 6.9% 46
1/3/2018 Gener8 Maritime, Inc. PEI 548 Avenue Capital Management II 8.7% 48
1/3/2018 Casey's General Stores, Inc. Retail 4,227 BLR Partners / JCP Investment 1.0% 42
1/2/2018 TimkenSteel Corp. Industrials 674 GAMCO 5.1% 34
Source: Activist Insight, Activist Monitor, FactSet and public filings.
Note: All data is for activist campaigns conducted by activists at companies globally with market capitalizations greater than $500 million at time of campaign announcement. Company country
determined by country of company’s headquarters.
1 Calculated as of campaign announcement date. Does not include derivatives.
24

C O N F I D E N T I A L
B 2018 Board Seat Changes
2 0 1 8 R E V I E W O F S H A R E H O L D E R A C T I V I S M
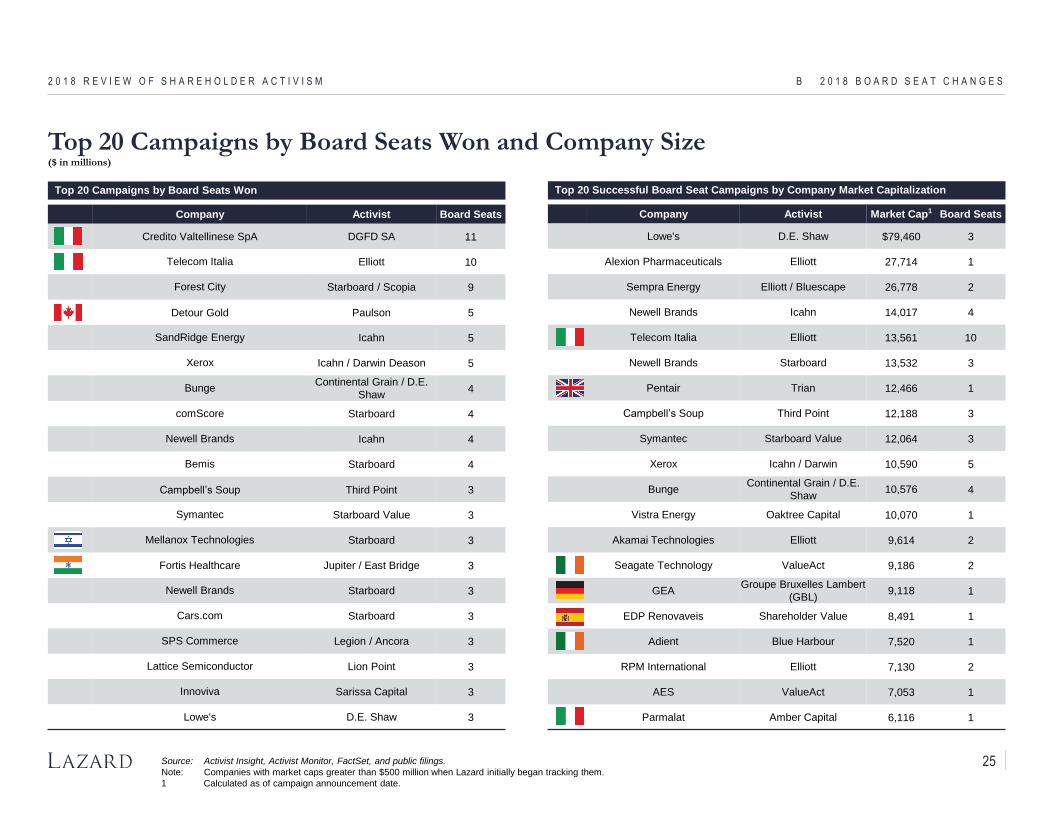
Top 20 Campaigns by Board Seats Won and Company Size($ in millions)
B 2 0 1 8 B O A R D S E A T C H A N G E S2 0 1 8 R E V I E W O F S H A R E H O L D E R A C T I V I S M
Company Activist Board Seats
Credito Valtellinese SpA DGFD SA 11
Telecom Italia Elliott 10
Forest City Starboard / Scopia 9
Detour Gold Paulson 5
SandRidge Energy Icahn 5
Xerox Icahn / Darwin Deason 5
BungeContinental Grain / D.E.
Shaw4
comScore Starboard 4
Newell Brands Icahn 4
Bemis Starboard 4
Campbell’s Soup Third Point 3
Symantec Starboard Value 3
Mellanox Technologies Starboard 3
Fortis Healthcare Jupiter / East Bridge 3
Newell Brands Starboard 3
Cars.com Starboard 3
SPS Commerce Legion / Ancora 3
Lattice Semiconductor Lion Point 3
Innoviva Sarissa Capital 3
Lowe's D.E. Shaw 3
Source: Activist Insight, Activist Monitor, FactSet, and public filings.
Note: Companies with market caps greater than $500 million when Lazard initially began tracking them.
1 Calculated as of campaign announcement date.
Company Activist Market Cap1 Board Seats
Lowe's D.E. Shaw $79,460 3
Alexion Pharmaceuticals Elliott 27,714 1
Sempra Energy Elliott / Bluescape 26,778 2
Newell Brands Icahn 14,017 4
Telecom Italia Elliott 13,561 10
Newell Brands Starboard 13,532 3
Pentair Trian 12,466 1
Campbell’s Soup Third Point 12,188 3
Symantec Starboard Value 12,064 3
Xerox Icahn / Darwin 10,590 5
BungeContinental Grain / D.E.
Shaw10,576 4
Vistra Energy Oaktree Capital 10,070 1
Akamai Technologies Elliott 9,614 2
Seagate Technology ValueAct 9,186 2
GEAGroupe Bruxelles Lambert
(GBL)9,118 1
EDP Renovaveis Shareholder Value 8,491 1
Adient Blue Harbour 7,520 1
RPM International Elliott 7,130 2
AES ValueAct 7,053 1
Parmalat Amber Capital 6,116 1
Top 20 Campaigns by Board Seats Won Top 20 Successful Board Seat Campaigns by Company Market Capitalization
25
B 2 0 1 8 B O A R D S E A T C H A N G E S2 0 1 8 R E V I E W O F S H A R E H O L D E R A C T I V I S M
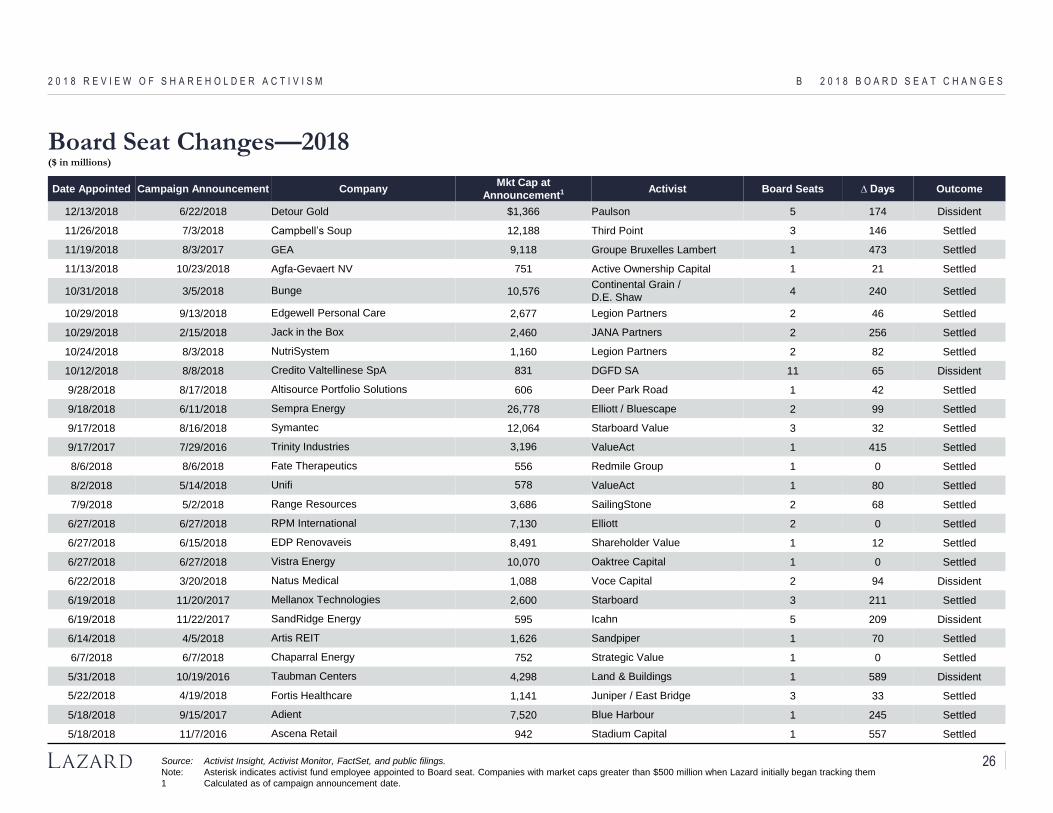
Board Seat Changes—2018($ in millions)
Source: Activist Insight, Activist Monitor, FactSet, and public filings.
Note: Asterisk indicates activist fund employee appointed to Board seat. Companies with market caps greater than $500 million when Lazard initially began tracking them
1 Calculated as of campaign announcement date.
Date Appointed Campaign Announcement CompanyMkt Cap at
Announcement1 Activist Board Seats ∆ Days Outcome
12/13/2018 6/22/2018 Detour Gold $1,366 Paulson 5 174 Dissident
11/26/2018 7/3/2018 Campbell’s Soup 12,188 Third Point 3 146 Settled
11/19/2018 8/3/2017 GEA 9,118 Groupe Bruxelles Lambert 1 473 Settled
11/13/2018 10/23/2018 Agfa-Gevaert NV 751 Active Ownership Capital 1 21 Settled
10/31/2018 3/5/2018 Bunge 10,576Continental Grain /
D.E. Shaw4 240 Settled
10/29/2018 9/13/2018 Edgewell Personal Care 2,677 Legion Partners 2 46 Settled
10/29/2018 2/15/2018 Jack in the Box 2,460 JANA Partners 2 256 Settled
10/24/2018 8/3/2018 NutriSystem 1,160 Legion Partners 2 82 Settled
10/12/2018 8/8/2018 Credito Valtellinese SpA 831 DGFD SA 11 65 Dissident
9/28/2018 8/17/2018 Altisource Portfolio Solutions 606 Deer Park Road 1 42 Settled
9/18/2018 6/11/2018 Sempra Energy 26,778 Elliott / Bluescape 2 99 Settled
9/17/2018 8/16/2018 Symantec 12,064 Starboard Value 3 32 Settled
9/17/2017 7/29/2016 Trinity Industries 3,196 ValueAct 1 415 Settled
8/6/2018 8/6/2018 Fate Therapeutics 556 Redmile Group 1 0 Settled
8/2/2018 5/14/2018 Unifi 578 ValueAct 1 80 Settled
7/9/2018 5/2/2018 Range Resources 3,686 SailingStone 2 68 Settled
6/27/2018 6/27/2018 RPM International 7,130 Elliott 2 0 Settled
6/27/2018 6/15/2018 EDP Renovaveis 8,491 Shareholder Value 1 12 Settled
6/27/2018 6/27/2018 Vistra Energy 10,070 Oaktree Capital 1 0 Settled
6/22/2018 3/20/2018 Natus Medical 1,088 Voce Capital 2 94 Dissident
6/19/2018 11/20/2017 Mellanox Technologies 2,600 Starboard 3 211 Settled
6/19/2018 11/22/2017 SandRidge Energy 595 Icahn 5 209 Dissident
6/14/2018 4/5/2018 Artis REIT 1,626 Sandpiper 1 70 Settled
6/7/2018 6/7/2018 Chaparral Energy 752 Strategic Value 1 0 Settled
5/31/2018 10/19/2016 Taubman Centers 4,298 Land & Buildings 1 589 Dissident
5/22/2018 4/19/2018 Fortis Healthcare 1,141 Juniper / East Bridge 3 33 Settled
5/18/2018 9/15/2017 Adient 7,520 Blue Harbour 1 245 Settled
5/18/2018 11/7/2016 Ascena Retail 942 Stadium Capital 1 557 Settled
26
B 2 0 1 8 B O A R D S E A T C H A N G E S2 0 1 8 R E V I E W O F S H A R E H O L D E R A C T I V I S M
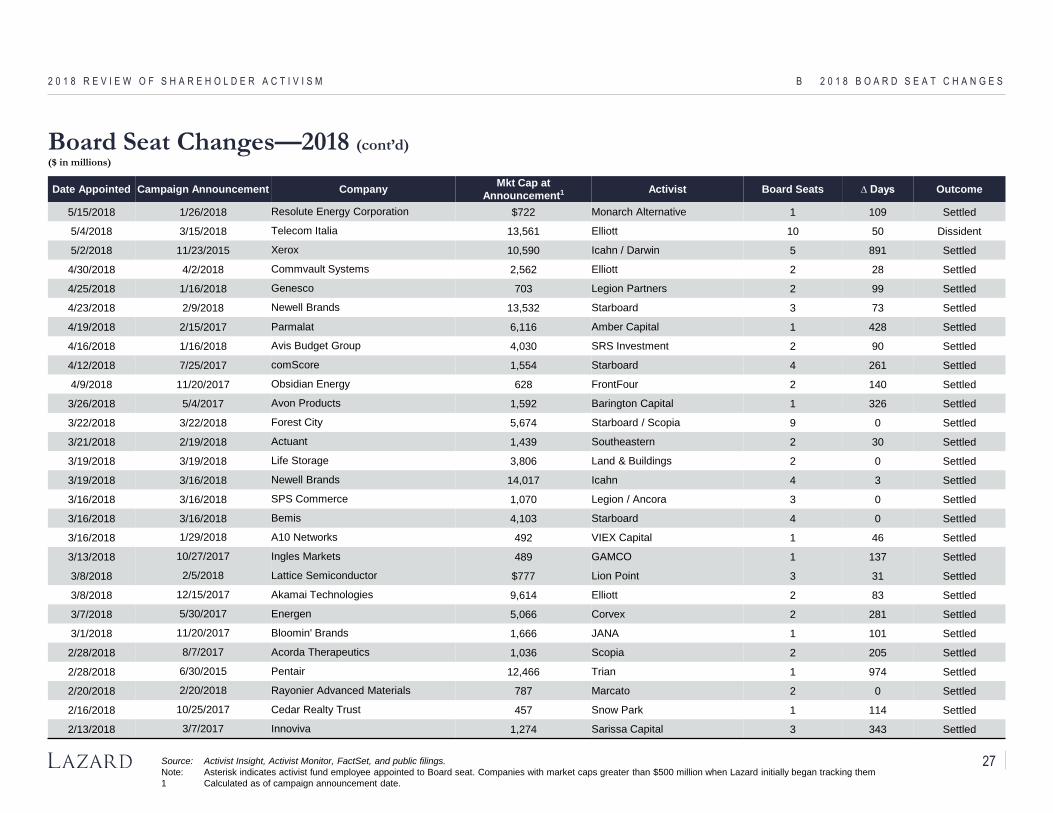
Board Seat Changes—2018 (cont’d)($ in millions)
Source: Activist Insight, Activist Monitor, FactSet, and public filings.
Note: Asterisk indicates activist fund employee appointed to Board seat. Companies with market caps greater than $500 million when Lazard initially began tracking them
1 Calculated as of campaign announcement date.
Date Appointed Campaign Announcement CompanyMkt Cap at
Announcement1 Activist Board Seats ∆ Days Outcome
5/15/2018 1/26/2018 Resolute Energy Corporation $722 Monarch Alternative 1 109 Settled
5/4/2018 3/15/2018 Telecom Italia 13,561 Elliott 10 50 Dissident
5/2/2018 11/23/2015 Xerox 10,590 Icahn / Darwin 5 891 Settled
4/30/2018 4/2/2018 Commvault Systems 2,562 Elliott 2 28 Settled
4/25/2018 1/16/2018 Genesco 703 Legion Partners 2 99 Settled
4/23/2018 2/9/2018 Newell Brands 13,532 Starboard 3 73 Settled
4/19/2018 2/15/2017 Parmalat 6,116 Amber Capital 1 428 Settled
4/16/2018 1/16/2018 Avis Budget Group 4,030 SRS Investment 2 90 Settled
4/12/2018 7/25/2017 comScore 1,554 Starboard 4 261 Settled
4/9/2018 11/20/2017 Obsidian Energy 628 FrontFour 2 140 Settled
3/26/2018 5/4/2017 Avon Products 1,592 Barington Capital 1 326 Settled
3/22/2018 3/22/2018 Forest City 5,674 Starboard / Scopia 9 0 Settled
3/21/2018 2/19/2018 Actuant 1,439 Southeastern 2 30 Settled
3/19/2018 3/19/2018 Life Storage 3,806 Land & Buildings 2 0 Settled
3/19/2018 3/16/2018 Newell Brands 14,017 Icahn 4 3 Settled
3/16/2018 3/16/2018 SPS Commerce 1,070 Legion / Ancora 3 0 Settled
3/16/2018 3/16/2018 Bemis 4,103 Starboard 4 0 Settled
3/16/2018 1/29/2018 A10 Networks 492 VIEX Capital 1 46 Settled
3/13/2018 10/27/2017 Ingles Markets 489 GAMCO 1 137 Settled
3/8/2018 2/5/2018 Lattice Semiconductor $777 Lion Point 3 31 Settled
3/8/2018 12/15/2017 Akamai Technologies 9,614 Elliott 2 83 Settled
3/7/2018 5/30/2017 Energen 5,066 Corvex 2 281 Settled
3/1/2018 11/20/2017 Bloomin' Brands 1,666 JANA 1 101 Settled
2/28/2018 8/7/2017 Acorda Therapeutics 1,036 Scopia 2 205 Settled
2/28/2018 6/30/2015 Pentair 12,466 Trian 1 974 Settled
2/20/2018 2/20/2018 Rayonier Advanced Materials 787 Marcato 2 0 Settled
2/16/2018 10/25/2017 Cedar Realty Trust 457 Snow Park 1 114 Settled
2/13/2018 3/7/2017 Innoviva 1,274 Sarissa Capital 3 343 Settled
27
B 2 0 1 8 B O A R D S E A T C H A N G E S2 0 1 8 R E V I E W O F S H A R E H O L D E R A C T I V I S M
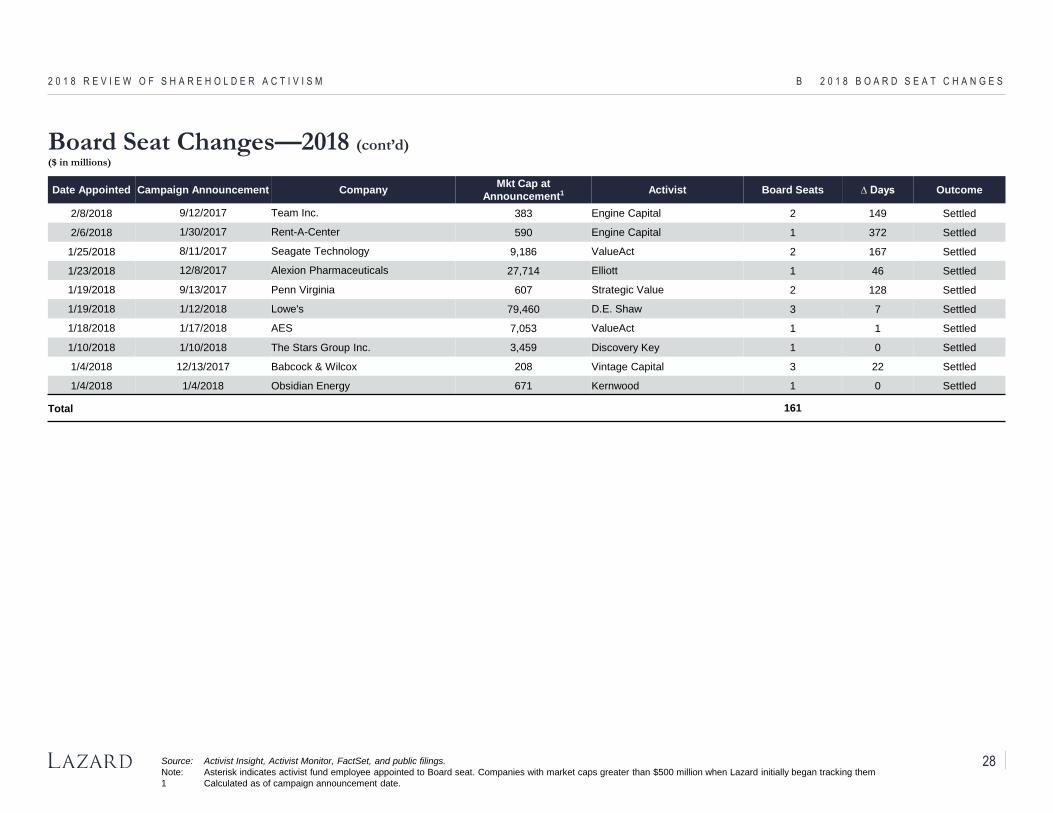
Board Seat Changes—2018 (cont’d)($ in millions)
Source: Activist Insight, Activist Monitor, FactSet, and public filings.
Note: Asterisk indicates activist fund employee appointed to Board seat. Companies with market caps greater than $500 million when Lazard initially began tracking them
1 Calculated as of campaign announcement date.
Date Appointed Campaign Announcement CompanyMkt Cap at
Announcement1 Activist Board Seats ∆ Days Outcome
2/8/2018 9/12/2017 Team Inc. 383 Engine Capital 2 149 Settled
2/6/2018 1/30/2017 Rent-A-Center 590 Engine Capital 1 372 Settled
1/25/2018 8/11/2017 Seagate Technology 9,186 ValueAct 2 167 Settled
1/23/2018 12/8/2017 Alexion Pharmaceuticals 27,714 Elliott 1 46 Settled
1/19/2018 9/13/2017 Penn Virginia 607 Strategic Value 2 128 Settled
1/19/2018 1/12/2018 Lowe's 79,460 D.E. Shaw 3 7 Settled
1/18/2018 1/17/2018 AES 7,053 ValueAct 1 1 Settled
1/10/2018 1/10/2018 The Stars Group Inc. 3,459 Discovery Key 1 0 Settled
1/4/2018 12/13/2017 Babcock & Wilcox 208 Vintage Capital 3 22 Settled
1/4/2018 1/4/2018 Obsidian Energy 671 Kernwood 1 0 Settled
Total 161
28
C O N F I D E N T I A L
C Selected Members of Shareholder Advisory Group
2 0 1 8 R E V I E W O F S H A R E H O L D E R A C T I V I S M
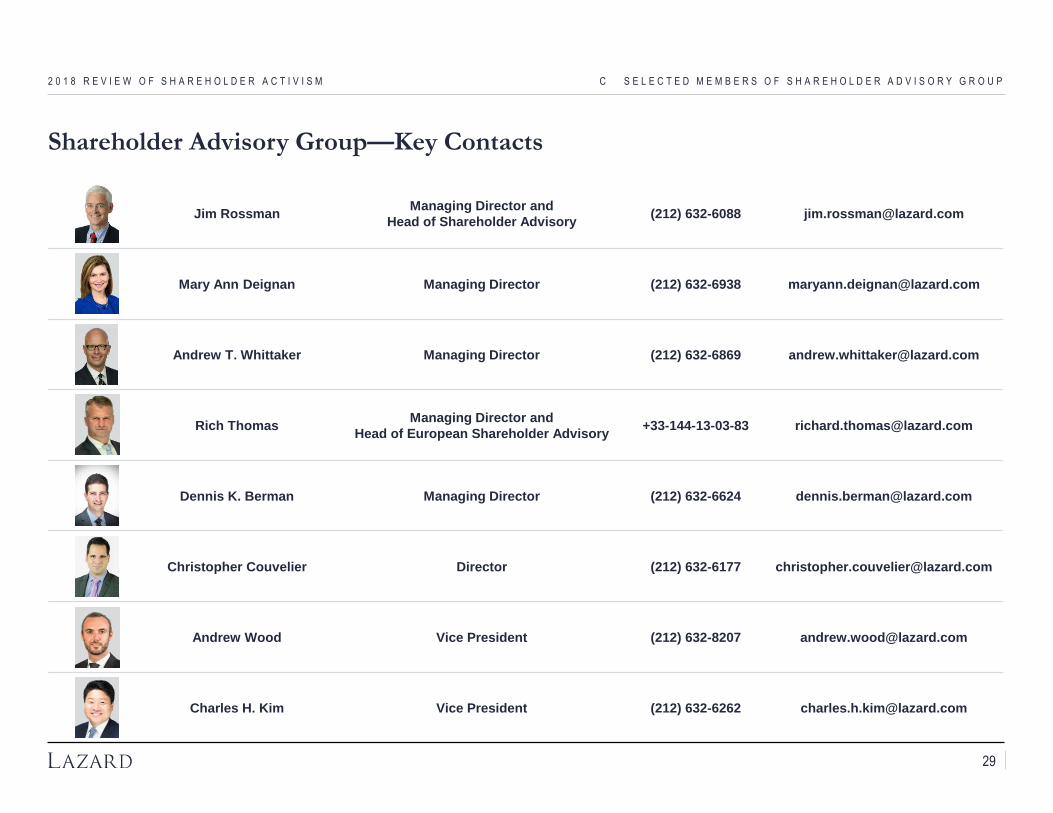
Shareholder Advisory Group—Key Contacts
C S E L E C T E D M E M B E R S O F S H A R E H O L D E R A D V I S O R Y G R O U P2 0 1 8 R E V I E W O F S H A R E H O L D E R A C T I V I S M
Jim RossmanManaging Director and
Head of Shareholder Advisory(212) 632-6088 [email protected]
Mary Ann Deignan Managing Director (212) 632-6938 [email protected]
Andrew T. Whittaker Managing Director (212) 632-6869 [email protected]
Rich ThomasManaging Director and
Head of European Shareholder Advisory+33-144-13-03-83 [email protected]
Dennis K. Berman Managing Director (212) 632-6624 [email protected]
Christopher Couvelier Director (212) 632-6177 [email protected]
Andrew Wood Vice President (212) 632-8207 [email protected]
Charles H. Kim Vice President (212) 632-6262 [email protected]
29