2018 - Parliament of Western Australia
102
Annual Report 2018 2018 SOUTH METROPOLITAN TAFE
Transcript of 2018 - Parliament of Western Australia

Annual Report 2018
2018S O U T H M E T R O P O L I T A N T A F E


Statement of compliance
To the Hon. Suzanne Ellery MLC, Minister for Education and TrainingIn accordance with section 63 of the Financial Management Act 2006, we hereby submit for information and presentation to Parliament, the annual report of South Metropolitan TAFE for the period ending 31 December 2018.
This report has been prepared in accordance with the provisions of the Financial Management Act 2006 and the Vocational Education and Training Act 1996.
Terry DurantManaging Director
12 March 2019
Elizabeth Carr AMChair of Governing Council
12 March 2019
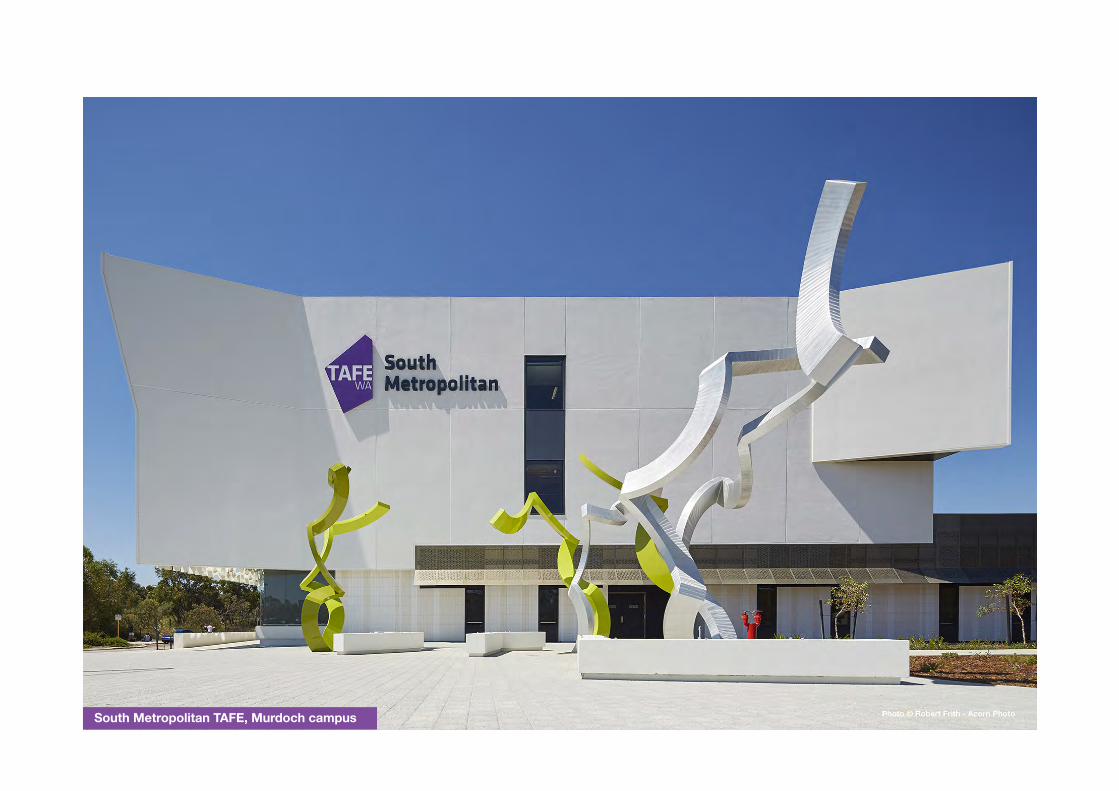
South Metropolitan TAFE, Murdoch campus

AN
NU
AL
RE
PO
RT
2018
SO
UTH
METR
OP
OLITA
N TA
FE
3
Statement of Compliance 1Contents 3Welcome from the Chair and Managing Director 4OVERVIEW OF THE AGENCY 6Executive Summary 6Legislative Environment 8Organisational Structure 9Governing Council 10Performance Management Framework 16Student Population 17Report on Operations 18AGENCY PERFORMANCE 20Progress against our Strategy 2020 priorities 202018 Business Plan Achievements 222018 Overview by Division 24• Access,CommunityandHealth 24• Construction,HopspitalityandCommerce 25• Engineering,TransportandDefence 26Jobs & Skills Centres 28
Contents
SIGNIFICANT ISSUES IMPACTING THE AGENCY 30DISCLOSURES AND LEGAL COMPLIANCE 31Certification of Financial Statements 31Auditor General’s Opinion 32Financial Statements 37Certification of Key Performance Indicators 77Key Performance Indicators 78Ministerial Directives 84Other Financial Disclosures 84Governance Disclosures 87Government Policy Requirements 93
This publication is available in alternative formats upon request.

AN
NU
AL
RE
PO
RT
2018
SO
UTH
METR
OP
OLITA
N TA
FE
4
Welcome from the Chair and Managing Director
On behalf of South Metropolitan TAFE (SM TAFE), we are pleased to present the 2018 Annual Report. This report provides an overview of the many achievements and activities of 2018, highlighting another productive year for SM TAFE as we continue to implement our strategic plan, develop exciting partnerships, introduce new courses, and deliver millions of hours of training to thousands of Western Australians.
A primary focus of 2018 was preparing for our new Student Management System (SMS) - a project that has been led and implemented across the WA TAFE sector by the Department of Training and Workforce Development. The SMS project has been significant due to the impact the new system will have on the college’s administrative environment. After most of 2018 spent in preparation, the college successfully went live with the system in late December. We are thankful for the dedication and support of our staff in preparing for this change, which was fundamental to the success of the project at SM TAFE.
As part of the State Government’s Plan for Jobs, SM TAFE was delighted to launch three Jobs and Skills Centres (JSCs) across our Peel (Mandurah), Rockingham and Thornlie campuses. Funded through the State Government, the JSCs are providing SM TAFE with the opportunity to re-prioritise valuable job-seeker services and create one-stop shops for careers, training, and employment advice, as well as provide tailored employment services for youth, Aboriginal people, and people from culturally diverse backgrounds. Importantly, the JSCs are furthering our capacity to develop relationships and connect with local communities and businesses, promoting a consultative approach to local
workforce development. Community reception to the new JSCs has been positive, with thousands of services having already been provided to future students, job-seekers, career changers, and local employers. We look forward to building on the work of the JSCs in 2019, and continually build on our strong community links and our commitment to meeting the need of local workforces.
As a cornerstone of our strategic plan, SM TAFE is committed to positioning our delivery to meet current and future workforce needs as we move swiftly into the ‘fourth industrial revolution’. A landmark partnership with Rio Tinto Iron Ore was progressed this year, with SM TAFE leading the way nationally in the development of training that will prepare future and existing workers with the skills needed in workplaces characterised by increasingly automated processes. Complementing this, new courses in network security were launched earlier this year, which will assist WA to keep up with demand for skilled cyber security professionals. Recent investment in SM TAFE’s own Training Cyber Security Operations Centre (TCSOC), which will be launched in 2019, will provide students with hands-on training in a simulated environment, and provide the opportunity to collaborate with other training centres both locally and internationally.

AN
NU
AL
RE
PO
RT
2018
SO
UTH
METR
OP
OLITA
N TA
FE
5
In addition to exciting work in automation, SM TAFE’s partnership with the Naval Shipbuilding College was progressed and the college is looking forward to supporting the State with initiatives in the Defence Industries Strategic Plan and collaborating with other agencies in promoting the STEM skills agenda.
Each year we are inspired by the achievements of our students, who are consistently recognised for their skills across a vast array of industry areas. 2018 was no different, with our students representing the college both locally, nationally and internationally at events such as the WA Training Awards, Worldskills and the Telstra Perth Fashion Festival. Congratulations to all students who represented the college in 2018.
During the year, SM TAFE farewelled Stephen Cain from our Governing Council. Mr Cain provided wisdom, insight and enthusiasm for the value of vocational education and training during his decade long service on the Council and we extend our sincerest gratitude for
his service. We also thank Christine Coyne, another departing Governing Council member, for her valuable contribution, insights and support.
As we review 2018, it is comforting to see growth in the amount of training being delivered, exciting projects coming to fruition, and as always, witnessing the ongoing commitment and enthusiasm of our staff. In light of that, we would like to extend our sincerest thanks to our colleagues, who have continued to show great resilience during times of change and commitment to providing quality training and education to our students.
We would like extend our appreciation to our industry and community partners, who continue to play a vital role in supporting us to deliver responsive, contemporary training, and to enable our communities to get the most out of our services.
Lastly, we would like to thank the Hon. Sue Ellery MLC, Minister for Education and Training for her genuine support and enthusiasm for the sector during 2018.
SM TAFE’s partnership with the Naval Shipbuilding College
Terry Durant Managing Director
12 March 2019
Elizabeth Carr AM Chair of Governing Council
12 March 2019

AN
NU
AL
RE
PO
RT
2018
SO
UTH
METR
OP
OLITA
N TA
FE
6
SIGNIFICANT ISSUES IMPACTING THE AGENCYAGENCY PERFORMANCE
DISCLOSURES AND LEGAL COMPLIANCEOVERVIEW OF THE AGENCY
OVERVIEW OF THE AGENCY
Executive summaryOverview of year and key highlights of 2018
WE EXCEEDED OUR PROFILE DELIVERY TARGET AND DELIVERED
7,475,676 HOURS OF GOVERNMENT
SUBSIDISED TRAINING
WE DELIVERED TRAINING TO 26,194STUDENTS
WE LAUNCHED 3x JOBS & SKILLS
CENTRES WHICH PROVIDED OVER
9200 SERVICES
WE WENT LIVE ON A
NEW STUDENT MANAGEMENTSYSTEM
WE LAUNCHED EXCITING
NEW QUALIFICATIONS IN
CYBERSECURITY
WE DELIVERED OVER 330QUALIFICATIONS
WE TRAINED 5,521APPRENTICES AND 840 TRAINEES
WE PARTNERED WITH DOZENS OF PRIVATE, NOT-FOR-PROFIT AND GOVERNMENTORGANISATIONS
TO DELIVER TRAINING TO WESTERN AUSTRALIANS
WE ACHIEVED A STUDENT SATISFACTION
RATING OF
87.8%2.8% ABOVE TARGET
AN
NU
AL
RE
PO
RT
2018
SO
UTH
METR
OP
OLITA
N TA
FE
7
SIGNIFICANT ISSUES IMPACTING THE AGENCYAGENCY PERFORMANCE
DISCLOSURES AND LEGAL COMPLIANCEOVERVIEW OF THE AGENCY
South Metropolitan TAFE is one of Western Australia’s largest and most diverse training providers, delivering training to thousands of local and international students per year and workforce development services to businesses across the State. SM TAFE delivers courses ranging from certificate I to advanced diplomas across a vast array of para-professional, trade and foundation courses.
With 14 campuses located from Fremantle to Armadale and as far south as Mandurah, SM TAFE provides access to education and training for communities throughout the southern metropolitan region.
SM TAFE plays an important role in the State’s economic development by responding to industry, workforce, and community needs. SM TAFE is committed to collaborating and partnering with industry to support the development of education and training programs, the placement of job-ready graduates and the identification of training needs. This strong relationship with Industry ensures SM TAFE’s programs remain contemporary, relevant to workplace requirements, and supportive of broader workforce development initiatives.
OUR PURPOSEWe provide students with skills to enable employment and career development
We do this by:
• providingstudentswithhighqualitytrainingservicesthatpreparethemforpathways to employment
• providingstudentswithpathwaystofurthereducationandtrainingopportunitiesthat can launch and extend their careers
• helpingindustryandouremployersgrowandcreatetheworkforceofthefuture• strengtheningourcommunitiesthroughlifelonglearningopportunitiesforall.
OUR VISIONBy 2020 SM TAFE will be recognised as a national leader in providing skills for employment and career development.
Our vision ensures we aspire to create futures for individuals by:
• preparingthemforjobsorsupportingfurtherlearningtodeveloptheircareers• buildingandnurturingaskilledworkforce• forgingprosperousfuturesforourcommunities.
OUR VALUES Integrity: We are committed to achieving our vision and delivering on our purpose; we work collaboratively; we are ethical and accountable in all our dealings with our students, our partners and ourselves.
Excellence: We are excellent at what we do; we have a quality focus and quality lens in the services and training delivery that we perform; we exude and execute professionalism in all our dealings.
Agility: We are flexible, inclusive, agile and easy to do business with; service is delivered with the customer in mind and at the centre of all our decisions and actions; we are outcomes focused and we respond.
Innovation: We are future focused, keeping pace with customers and market needs; we look for solutions and encourage creative thinking and continuous improvement.
Sout
h M
etro
polit
an T
AFE

AN
NU
AL
RE
PO
RT
2018
SO
UTH
METR
OP
OLITA
N TA
FE
8
SIGNIFICANT ISSUES IMPACTING THE AGENCYAGENCY PERFORMANCE
DISCLOSURES AND LEGAL COMPLIANCEOVERVIEW OF THE AGENCY
Legislative Environment Enabling LegislationSMTAFEwasestablishedasastatutoryauthorityundersection35oftheVocational Education and Training Act 1996.
Administering legislation The Minister for Education and Training administers the Vocational Education and Training Act 1996 (the Act).
SM TAFE complies with the following relevant legislation:
• Aboriginal and Torres Strait Islander Commission Amendment Act 2005• Commercial Tenancy (Retail Shops) Agreements Act 1985• Corruption and Crime Commission Act 2003• Disability Discrimination Act 1992• Disability Services Act 1993• Education Services for Overseas Students Registration Charges Act 1997• Equal Opportunity Act 1984• Financial Management Act 2006• Freedom of Information Act 1982• Higher Education Support Act 2003• Industrial Relations Act 1979 • Library Board of Western Australia Act 1951• Occupational Safety and Health Act 1984• Public Interest Disclosure Act 2003• Public Sector Management Act 1994• School Education Act 1999• State Records Act 2000• State Supply Commission Act 1991• Tertiary Education Quality and Standards Agency Act 2011• Vocational Education and Training Act 1996• Workers Compensation and Injury Management Act 1981• Working with Children (Criminal Record Checking)

AN
NU
AL
RE
PO
RT
2018
SO
UTH
METR
OP
OLITA
N TA
FE
9
SIGNIFICANT ISSUES IMPACTING THE AGENCYAGENCY PERFORMANCE
DISCLOSURES AND LEGAL COMPLIANCEOVERVIEW OF THE AGENCY
Organisational structureResponsible MinisterIn 2018 SM TAFE was responsible to the Hon. Sue Ellery MLC, Minister for Education and Training, with the primary purpose of delivering vocational education and training.
Minister for Education and Training
Hon. Sue Ellery MLC
South Metropolitan TAFE Governing Council Chair
Elizabeth Carr AM
Managing Director Terry Durant
General Manager Organisational Services
Melanie Sorensen
General Manager Training Services II
Brenda Micale
General Manager Corporate Services
Annette Keller
General Manager Training Services
Blair Marsh
Director Planning and Reporting
Daniel Ronzan
Executive Director Engineering, Transport
and Defence Jonathon Maile
Director Human Resources
Mark Taylor
Executive Director Construction, Commerce
and Hospitality Julia Burns
Director Quality and Development
Jamie Drew
Director Strategic Partnerships Darshi Ganeson-Oats
Director Finance
David Saville
Executive Director Access, Community and Health
Lyn Southam
Director Client Services Karen Kelleher
Director Information Services
Shu Wing Chan (acting)
Director Product Strategy Melina Kawecki
Director Facilities
Glen Robinson

AN
NU
AL
RE
PO
RT
2018
SO
UTH
METR
OP
OLITA
N TA
FE
10
SIGNIFICANT ISSUES IMPACTING THE AGENCYAGENCY PERFORMANCE
DISCLOSURES AND LEGAL COMPLIANCEOVERVIEW OF THE AGENCY
Governing Council SM TAFE’s Governing Council is responsible for overseeing the college’s operations and affairs and providing strategic direction. The council oversees the direction of the college through the execution of its statutory functions under the Vocational Education and Training Act 1996, Public Sector Management Act 1994 and the Financial Management Act 2006.Governing Council members are chosen for their vast experience and expertise across multiple sectors, including training, education, community affairs and industry. The Governing Council’s sub-committees are responsible for the oversight of key governance issues, including the Finance, Audit and Risk Management Sub-Committee (FARM), Higher Education Academic Board, and the Nomination and Evaluation Sub-Committee. In 2018 the Governing Council membership was as follows:
Elizabeth Carr AM (Chair) Elizabeth Carr has been the Chair of the Governing Council since its inception in April 2016. Elizabeth is a full-time non-executive director with a board portfolio covering government, private, education and not-for-profit organisations in Western Australia and New South Wales.
Her background incorporates the private and public sectors. She has worked in senior executive positions for IBM and Macquarie Group and within senior levels of politics and government in NSW, WA, Papua New Guinea and the United States.
She chairs St Mary’s Anglican Girls School (WA), St Catherine’s Aged Care Services (NSW), and the Department of Family and Community Services Audit and Risk Committee (NSW) and Deputy Chair of the Kokoda Track Foundation (National).
She is a member of The Environmental Protection Authority (WA), Director of Insurance and Care (NSW), on the Audit and Risk Committees for the Urban Growth Development Corporation (NSW) and on the National Council as a WA representative for the Harvard Club of Australia. Elizabeth holds a BA (Hons) from UWA, a master’s degree from Harvard University and is a Fellow of the Australian Institute of Company Directors.

AN
NU
AL
RE
PO
RT
2018
SO
UTH
METR
OP
OLITA
N TA
FE
11
SIGNIFICANT ISSUES IMPACTING THE AGENCYAGENCY PERFORMANCE
DISCLOSURES AND LEGAL COMPLIANCEOVERVIEW OF THE AGENCY
Emeritus Professor David Wood (Deputy Chair)Emeritus Professor David Wood is a retired academic who spent much of his professional life at Curtin University as Provost and Senior Deputy Vice-Chancellor, Deputy Vice-Chancellor International, Pro Vice-Chancellor of Humanities and in a number of other positions in the Faculty of Humanities and the School of Built Environment.
His academic discipline is Urban and Regional Planning and he has led numerous research projects in this area, most recently leading CSIRO collaboration clusters that unite university and CSIRO scientists to address real world problems, such as in Australia’s coastal zone. David continues to serve Curtin University as Emeritus Professor in Humanities and as a member of the Humanities Faculty Advisory Council.
Between 2004 and 2010, David served on a number of state boards, including the Coastal Planning and Coordination
Council and Ningaloo Sustainable Development Committee, both of which he chaired, and the WA Planning Commission and Heritage Council of Western Australia.
David’s earlier roles were in local government where he was Coordinator of the Arthur Head Bicentennial Project, and Joint Head of the Department of Conservation and Restoration and Curator of Restoration at the WA Maritime Museum.
David Wood has a Bachelor of Arts (Monash), a Postgraduate Diploma in Urban and Regional Planning and a doctorate from Curtin University.
Niegel GraziaNiegel Grazia is currently the Deputy Director General, Industry and Economic Development at the Department of Primary Industries and Regional Development. His contribution to SM TAFE is informed by experiences working with communities, NGOs, the media and governments on remote and complex development projects in Australia and overseas.
Niegel worked in the oil and gas industry for 21 years, including senior corporate and project based roles and for five years as the Australian Petroleum Production and Exploration Association’s representative in WA. He has led the corporate affairs function in an ASX top 20 company and has undertaken residential postings in the Pilbara and Kimberley regions. Niegel has formerly served as Governing Council Chair of the Kimberley Training Institute.
Prior appointments also include roles with the Kimberley Development Commission, the Department of Premier and Cabinet and other agencies within the WA public service. He also served for seven years on the staff of WA State Government ministers across the local government, mines, energy and emergency services portfolios.
Niegel holds a Bachelor of Business from Curtin University and offers proven leadership, communication, advocacy, strategic thinking and problem solving skills.

AN
NU
AL
RE
PO
RT
2018
SO
UTH
METR
OP
OLITA
N TA
FE
12
SIGNIFICANT ISSUES IMPACTING THE AGENCYAGENCY PERFORMANCE
DISCLOSURES AND LEGAL COMPLIANCEOVERVIEW OF THE AGENCY
Deborah HamblinDeborah Hamblin is the Deputy Mayor of the City of Rockingham. She has promoted the importance of education in the region for the past 12 years while on the City of Rockingham Council. She is passionate about the value of education and its importance in developing a strong community. Cr Hamblin has been a member of a variety of management boards and is a valuable contributor to SM TAFE’s Governing Council. She holds a bachelor degree from Murdoch University, a post graduate qualification from Curtin University and is an Associate Member of the Australian Library and Information Association.
Nicole AshbyNicole Ashby is an Exposure Alchemist who has a unique skill in assisting business owners to gain media exposure to further build their profile, market leadership and authority.
With hundreds of media interviews under her belt, including with The Project, The Today Show, The 7.30 Report, The Australian, BBC radio, ABC radio to mention but a few, Nicole knows how to create successful media strategy.
Having built her former company and first business, FIFO Families, from scratch in 2010 and selling it five years later, Nicole now mentors aspiring business owners. A dual Telstra Business of The Year Finalist, Telstra Business of The Year Finalist and dual 40Under40 Winner, Nicole helps other business owners explore their innate potential and develop media strategy to drive business growth.
Julian Coyne Julian Coyne brings entrepreneurship, engineering and technology together. After graduating with honours in Computer and Mathematical Science in 2002 Julian founded his first company Unified - which has since delivered successful technology solutions to major clients including Toyota, Rio Tinto, INPEX, IBM, Microsoft, Landgate, Lotterywest, UWA and State and Federal Government agencies throughout Australia. Julian has since launched several other successful companies and initiatives, and has been invited to Oxford University, Silicon Valley and Singapore to present and work on the future of technology, industry, academia and government.
AN
NU
AL
RE
PO
RT
2018
SO
UTH
METR
OP
OLITA
N TA
FE
13
SIGNIFICANT ISSUES IMPACTING THE AGENCYAGENCY PERFORMANCE
DISCLOSURES AND LEGAL COMPLIANCEOVERVIEW OF THE AGENCY
Julian presently serves as WA Chairman for the Australian Information Industry Association (AIIA) - Australia’s peak body for the technology industry. The AIIA represents global organisations including Apple, Amazon, Google, IBM, Intel, Microsoft, Optus, Telstra, Deloitte, EY, KPMG and PwC through to local SMEs, start-ups and scale-ups. In 2006 Julian was selected for the Commonwealth Government’s inaugural ICT Industry Entrepreneur Accelerator Program, hosted at Macquarie Graduate School of Management (MGSM) in partnership AusIndustry and AIIA. Julian is also a graduate of the Australian Institute of Company Directors (AICD), a Senior Certified Professional with the Australia Computer Society (ACS), a member of the Institute of Electrical and Electronic Engineers (IEEE) and a member of the Commonwealth Club of California.
In addition to serving on the Governing Council of South Metropolitan TAFE, Julian serves as Chairman of the Autism Academy of Software Quality Assurance (AASQA) and Chairman of the Advisory Board for the State Government’s Regional New Industries Fund.
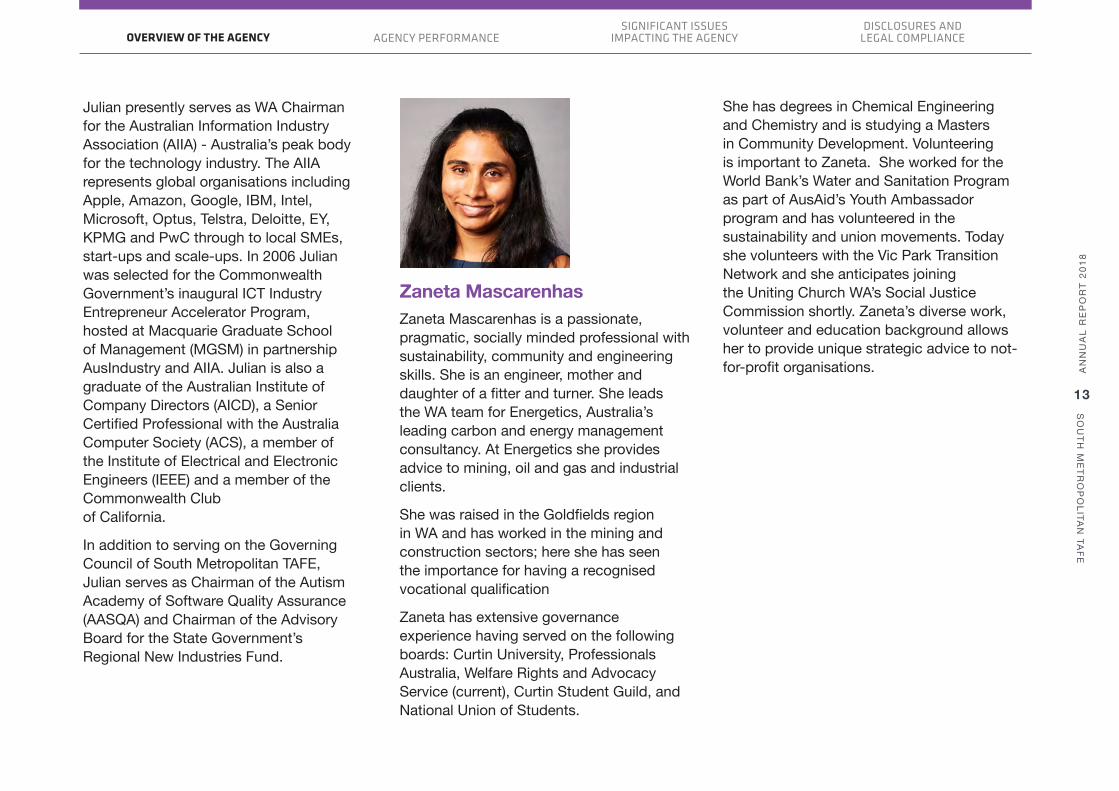
Zaneta Mascarenhas Zaneta Mascarenhas is a passionate, pragmatic, socially minded professional with sustainability, community and engineering skills. She is an engineer, mother and daughter of a fitter and turner. She leads the WA team for Energetics, Australia’s leading carbon and energy management consultancy. At Energetics she provides advice to mining, oil and gas and industrial clients.
She was raised in the Goldfields region in WA and has worked in the mining and construction sectors; here she has seen the importance for having a recognised vocational qualification
Zaneta has extensive governance experience having served on the following boards: Curtin University, Professionals Australia, Welfare Rights and Advocacy Service (current), Curtin Student Guild, and National Union of Students.
She has degrees in Chemical Engineering and Chemistry and is studying a Masters in Community Development. Volunteering is important to Zaneta. She worked for the World Bank’s Water and Sanitation Program as part of AusAid’s Youth Ambassador program and has volunteered in the sustainability and union movements. Today she volunteers with the Vic Park Transition Network and she anticipates joining the Uniting Church WA’s Social Justice Commission shortly. Zaneta’s diverse work, volunteer and education background allows her to provide unique strategic advice to not-for-profit organisations.

AN
NU
AL
RE
PO
RT
2018
SO
UTH
METR
OP
OLITA
N TA
FE
14
SIGNIFICANT ISSUES IMPACTING THE AGENCYAGENCY PERFORMANCE
DISCLOSURES AND LEGAL COMPLIANCEOVERVIEW OF THE AGENCY
Kelly TownsonKelly Townson has over 20 years’ experience in strategy development, brand building, partnership development, and change leadership having worked across a diverse portfolio of industry sectors including tourism, higher education and training, FMCG and financial services. She has private and government sector exposure and previous board experience. She serves on the Board of Bicycling Western Australia and currently she is the General Manager of Marketing for Crown Resorts Perth.
Lina DickinsLina Dickins has led training and competency functions for a number of major oil and gas projects in Australia and overseas. In executing these projects, her strategies always promote collaboration with vocational institutes, indigenous employment, and the development of trainees and apprentices.
Lina contributes experience in driving closer alignments between industry and educational institutions, which she sees as one of the key areas for developing future skills in Australia.
Stephen Cain (term ended June 2018)Stephen Cain is the Chief Executive Officer of the City of Cockburn. Over the past 20 years he has held senior management positions in the private and public sectors. He served for 36 years as an officer in the Australian Army (regular and reserve forces) and is a graduate of Royal Military College, Duntroon.
He continues to serve in the Army Reserves as an Aide-de-camp to the Governor General and holds the rank of Brigadier. Stephen is a fellow of the Chartered Institute of Transport and Logistics, sits on the board of Hockey WA and is a member of the Bravery Trust (Governance Committee).

AN
NU
AL
RE
PO
RT
2018
SO
UTH
METR
OP
OLITA
N TA
FE
15
SIGNIFICANT ISSUES IMPACTING THE AGENCYAGENCY PERFORMANCE
DISCLOSURES AND LEGAL COMPLIANCEOVERVIEW OF THE AGENCY
Christine Coyne (term ended June 2018)Christine Coyne has been providing specialist Aboriginal engagement and training services throughoutacareerspanning35years.Forthe past four years Christine has been running her own consultancy business, Christine Coyne & Associates, and works with a range of clients involved in major construction projects, mining, infrastructure and a broad range of industry sectors and groups.
Christine is recognised as a specialist in thisarea.Duringthepast25yearsChristinehas worked within the private sector for some of the country’s major employers, including Woodside Energy, Fortescue Metals Group, Foster Wheeler, Worley Parsons, Compass Group Australia and the Chamber of Commerce and Industry. Prior to this, Christine spent ten years working in policy development and training in Aboriginal program areas for the Federal Government.
As well as providing specialist Aboriginal engagement services and managing a range of Aboriginal employment projects, Christine has been involved in the development and delivery of Aboriginal cultural awareness, mentoring workshops and other customised training programs.
Terry DurantTerry Durant is the Managing Director of SM TAFE and is an ex-officio member of the Governing Council.

AN
NU
AL
RE
PO
RT
2018
SO
UTH
METR
OP
OLITA
N TA
FE
16
SIGNIFICANT ISSUES IMPACTING THE AGENCYAGENCY PERFORMANCE
DISCLOSURES AND LEGAL COMPLIANCEOVERVIEW OF THE AGENCY
Performance Management FrameworkOutcome Based Management FrameworkGovernment goals are supported at agency level by specific desired outcomes. Agencies deliver services to achieve these outcomes, which ultimately contribute to meeting higher level government goals. The following illustrates the relationship between SM TAFE’s outcomes and the most appropriate government goal.
Government goal Desired outcome SM TAFE services
Future jobs and skills
Grow and diversify the economy, create jobs and support skills development.
1) Provision of a diverse mix of government funded and commercial, fee for service training.
2) Delivery of apprenticeships and traineeships.3) Partnerships with industry and major employers.4) Flexible, responsive and nationally accredited training ranging from
certificate I to advanced diplomas. 5)JobsandSkillsCentresthatengagewiththelocalcommunity,
businesses and industry, providing employment services, workforce development support among other services.
Changes To Outcome Based Management Framework There was no change to SM TAFE’s Outcome Based Management Framework in 2018.
Shared responsibilities with other agencies SM TAFE receives funding from the State Government through an annual resource agreement, the Delivery and Performance Agreement, with the Department of Training and Workforce Development (DTWD). The college reports to DTWD for outcomes under that agreement.

AN
NU
AL
RE
PO
RT
2018
SO
UTH
METR
OP
OLITA
N TA
FE
17
SIGNIFICANT ISSUES IMPACTING THE AGENCYAGENCY PERFORMANCE
DISCLOSURES AND LEGAL COMPLIANCEOVERVIEW OF THE AGENCY
Student population In 2018, 26,194 unique students enrolled at SM TAFE. Approximately 79% of students enrolled at eight of the college’s 13 campuses, with the Thornlie campus the largest delivery site with5,549students.
* Other delivery sites include prisons, Armadale Campus, Jandakot Campus, Kwinana Automotive Technical Centre, Henderson Campus and Munster Campus.
Thelargestgroupofstudentscontinuedtobethe15to19year old age group, representing 30% of the total SM TAFE student population.
Of the total number of students enrolled, 41% were enrolled in certificateIIandbelowcourses,35%enrolledincertificateIIIcourses and 24% enrolled in certificate IV and above courses.

AN
NU
AL
RE
PO
RT
2018
SO
UTH
METR
OP
OLITA
N TA
FE
18
SIGNIFICANT ISSUES IMPACTING THE AGENCYAGENCY PERFORMANCE
DISCLOSURES AND LEGAL COMPLIANCEOVERVIEW OF THE AGENCY
Approximately 60% of students who studied at SM TAFE in 2018 were male and 40% were female.
Report on Operations In2018SMTAFEdeliveredatotalof9,529,995studentcurriculumhours (SCH) to 26,194 students in 39,883 course enrolments.
SCH includes both profile funded training (State Government subsidised training) and non-profile training, including domestic and international fee-for-service delivery, and Commonwealth Government funded activity.
ProfileTheamountofprofilefundedtrainingdeliveredin2018was7,475,674 SCH to 19,898 students in 30,660 course enrolments. This represented more than 78% of SM TAFE’s total training delivery activity in 2018.
General industry training courses represented the largest profile delivery category comprising 27% of all profile funded delivery. General industry training comprises non-entitlement, institutional based training courses which align to a range of key industry areas. The ANZSCO categories with thehighestSCHdeliveredin2018included;GeneralEducation(987,115SCH),AutomotiveandEngineeringTradeWorkers(915,887SCH);CarersandAides(619,210SCH);HealthandWelfareSupportWorkers(557,679SCH);Engineering,ICTandScienceTechnicians(534,877SCH).
Apprenticeship and traineeship delivery (employment-based training) was the second largest profile delivery category, accounting for 22% of total profile funded delivery.
Priority industry training delivery was the third largest profile delivery category,accountingfor15%oftotalprofilefundeddelivery.

AN
NU
AL
RE
PO
RT
2018
SO
UTH
METR
OP
OLITA
N TA
FE
19
SIGNIFICANT ISSUES IMPACTING THE AGENCYAGENCY PERFORMANCE
DISCLOSURES AND LEGAL COMPLIANCEOVERVIEW OF THE AGENCY
Non ProfileSMTAFEachieved2,054,319SCHinnon-profilefundedtrainingactivity delivered to 7,196 students in 8,470 course enrolments.
Non-profile funded activity includes domestic fee-for-service courses tailored to meet the contemporary needs of employers and international onshore and offshore clients.
A major source of non-profile funding is Commonwealth Government funded programs, including the Adult Migrant English Program (AMEP) and Skills for Education and Employment (SEE) program.
Commonwealth Funded ProgramsUnder contract to the Commonwealth Government Department of Education and Training, SM TAFE delivers customised commercial programs through the AMEP and the SEE. The college deliveredAMEPandSEEservicesto1,356clientsin2018.
The AMEP program was delivered across three metropolitan campuses, six community-based venues and eight rural and regional locations. The program enabled many students to achieve Certificates in Spoken and Written English.
The SEE program was delivered at selected metropolitan campuses. Progress against our Strategy 2020 Priorities

AN
NU
AL
RE
PO
RT
2018
SO
UTH
METR
OP
OLITA
N TA
FE
20
SIGNIFICANT ISSUES IMPACTING THE AGENCYAGENCY PERFORMANCE
DISCLOSURES AND LEGAL COMPLIANCEOVERVIEW OF THE AGENCY
AGENCY PERFORMANCE
Progress against our Strategy 2020 priorities
The 2018 – 2020 Strategic Plan outlines four key strategic themes underpinned by a number of goals and initiatives that guide SM TAFE’s efforts and activities. The following key activities and achievements in 2018 assisted to support the college’s four Strategy 2020 strategic themes:
Exceed customer expectationsIn 2018, SM TAFE undertook a number of projects and initiatives in support of its strategic goal of Exceeding Customer Expectations. The college continued to develop quality partnerships with major employers in the State, with a major focus being on the development of automation qualifications with Rio Tinto Iron Ore and on the progression of defence partnerships, including the college’s participation in the Naval Shipbuilding College. SM TAFE’s involvement in the WA VET Collaboration, which is spearheading the development of STEM skills and Industry 4.0 qualifications in Western Australia, is also providing the opportunity to work strategically with industry to develop a highly skilled workforce.
Preparing for the Student Management System (SMS) was one of the most significant projects during the year, and a pivotal project outlined in the college’s strategic plan. The new SMS is a part of a larger framework of projects designed to drive the Exceed Customer Expectations strategic theme to develop an efficient system of student administration, with greater capability for student self-service.
A key component of the Exceeding Customer Expectations priority is ensuring our courses are aligned to market needs; meeting the demands of growth sectors and areas of skills shortages. New courses in cyber security were introduced in 2018, which will allow the college to assist in meeting critical skills shortages in the ICT industry. The addition of the Training Cyber Security Operations Centre (TCSOC) in 2019 will further the college’s capability and capacity to collaborate with industry.
Three Jobs & Skills Centres, established as part of the State Government’s Plan for Jobs were opened in 2018 at the Thornlie, Rockingham and Mandurah campuses. The centres have been well patronised, and provided over 9,000 services to jobs seekers, career changers and local businesses.

AN
NU
AL
RE
PO
RT
2018
SO
UTH
METR
OP
OLITA
N TA
FE
21
SIGNIFICANT ISSUES IMPACTING THE AGENCYAGENCY PERFORMANCE
DISCLOSURES AND LEGAL COMPLIANCEOVERVIEW OF THE AGENCY
Achieve financial sustainabilitySM TAFE’s strategic goal of achieving financial sustainability has provided an important barometer which the college has used to measure and prioritise activities over 2018. Efforts to ensure the college is operating efficiently has resulted in the college working towards a stabilised financial position – allowing for investment in new student facilities during 2018, including the expansion of the college’s simulated nursing wards and investment in the TCSOC, both due to become operational in 2019.
Optimise operations SM TAFE worked towards further aligning delivery with key precincts this year, including planning the new Naval Base Campus designed to align the college to activity in the defence sector, as well as completing the final decant of the Beaconsfield campus. The latter move is strategically important, as it allows SM TAFE to relocate tourism delivery to the vibrant and historic hub of Fremantle campus, as well as consolidate hospitality delivery at the Bentley campus, making the first step toward establishing Bentley as the college’s main hospitality hub.
Develop a high performance workforce This year an Academic Governance Framework was developed, which will be rolled out in 2019. The framework will be important step in promoting the college’s strategic goal of developing a high performance workforce and embedding a culture of quality. A staff survey conducted in late 2018 will provide insight on the progress of initiatives implemented since the college was formed in 2016, and guidance on where initiatives can be developed to promote staff culture.
Expansion of the college’s simulated nursing wards

AN
NU
AL
RE
PO
RT
2018
SO
UTH
METR
OP
OLITA
N TA
FE
22
SIGNIFICANT ISSUES IMPACTING THE AGENCYAGENCY PERFORMANCE
DISCLOSURES AND LEGAL COMPLIANCEOVERVIEW OF THE AGENCY
SM TAFE is required under the Vocational Education and Training Act 1996 to submit an annual a business plan detailing strategies and projects to achieve training objectives. The following key initiatives were achieved in 2018 to support employment based training, priority institutional training, general industry training and youth support objectives:
Employment based training • Continuedtoengagewithlocalindustryand
businesses through the college’s 22 industry advisory committees.
• Improvedresponseratestotheemployersurvey by moving from web-based to phone-based surveys, providing a more balanced and representative view of employer feedback.
• MaintainedastrongrelationshipwiththeAustralian Apprenticeship Support Network (AASN) to improve participation and completion outcomes. The new Jobs & Skills Centres provided additional scope to work closely with AASNs
• Deliveredjobreadyprogramsinpartnershipwith vocational training and employment centres (VTECS) and employers to Indigenous job seekers. Excellent outcomes were achieved with SM TAFE’s partnership with Sodexo and AtWork Australia, which won the 2018 National Employment Services Association (NESA) Excellence in Collaboration award. The initiative is designed to assist Indigenous Australians remove barriers to employment, and has proven an effective and life-changing experience for participants. SM TAFE will continue to work with Sodexo in 2019.
Priority institutional training • TheAppliedEngineeringportfoliotransitioned
most of their qualification delivery into skill set components, allowing flexibility to deliver skill components during evening classes to meet the growing demand from students who are in full time employment, but seeking skill development. These skill sets are focused on higher level qualifications, enabling trade graduates to progress their career opportunities.
• Inlinewithagrowthintrainingopportunitiesarising from the National Disability Insurance Scheme (NDIS), SM TAFE developed a Recognition of Prior Learning (RPL) tool in partnership with Rise Network to map in-house training and work experience to care staff.
• AnewDiplomaofAeronauticswasintroduced,designed to provide students with the opportunity to complete Civil Aviation Safety Authority (CASA) requirements to address state and national skill shortages.
• SMTAFEbeganworkingwiththeNavalShipbuilding College (NSC) and Weld Australia for the development of institution pathways to ensure pre-apprenticeship training for upcoming defence projects is geared towards specialised shipbuilding needs.
2018 Business Plan Achievements

AN
NU
AL
RE
PO
RT
2018
SO
UTH
METR
OP
OLITA
N TA
FE
23
SIGNIFICANT ISSUES IMPACTING THE AGENCYAGENCY PERFORMANCE
DISCLOSURES AND LEGAL COMPLIANCEOVERVIEW OF THE AGENCY
General industry training • Newcybersecurityqualificationswere
introduced to support skills shortages. SM TAFE intends to grow training in this area in 2019, which will be enabled by investment in a new Training Cyber Security Operations Centre, which will become operational in 2019.
• Thecollegeinvestedinanewsimulatednursing ward, which will expand the college’s capacity to delivery nursing and allied health training from the college’s Murdoch campus, located in Murdoch’s Medical Health and Education Precinct.
Youth support strategies • SMTAFEcontinuedtodeliverprograms
across industry areas to support disengaged youth to participate in training with initiatives including the Youth Access Reintegration Program (YARP) and successfully piloting a Certificate II in Construction designed for disengaged school students in the southern metropolitan region.
• SMTAFEfacilitatedprogramssuchas the ‘Try a Trade’ course to promote employment based training opportunities to school students.
SM TAFE’s own Cyber Security Operations Centre will be launched in 2019

AN
NU
AL
RE
PO
RT
2018
SO
UTH
METR
OP
OLITA
N TA
FE
24
SIGNIFICANT ISSUES IMPACTING THE AGENCYAGENCY PERFORMANCE
DISCLOSURES AND LEGAL COMPLIANCEOVERVIEW OF THE AGENCY
Access, Community and HealthFoundation Skills, Children’s Services, Adult Migrant English Program, Health, Vet Nursing and Animal Studies, Community Services, and Science and Environment
This year, the division achieved recognition for the Vocational Training and Employment Centre (VTEC) program, designed to provide up-skilling and employment opportunities for Indigenous Australians. The program was awarded for Excellence in Collaboration at the annual National Employment Services Association (NESA) Awards for the VTEC program, along with partners Sodexo and atWork Australia. SM TAFE’s VTEC program is in its third year, having now had over 270 students participate and many successfully completing the program and gaining employment with Morris Corp and Sodexo.
The Community Services portfolio commenced delivery of disability qualifications from Thornlie campus, working with a number of external disability agencies and providing the opportunity for students to articulate into specialised electives. The disability industry is facing a skills shortage due to an increase in service needs arising from the National Disability
Insurance Scheme (NDIS), and agencies were able to connect with students on work placements while studying, and then transition into employment.
Students from the Certificate III in Community Services worked with the City of Cockburn, Cockburn Integrate Health, BreastScreen WA and the WA Association for Mental Health to provide support at the Women’s Health and Wellbeing Day in October. The event provided the opportunity for students to demonstrate their skills in a client environment and learn about inter agency networking to support client needs. Mandurah based Community Services student Dee-Arne Hovingh was also awarded the City of Mandurah’s Nikki Wise Scholarship for 2018 in recognition of her volunteer work. Ms Hovingh completed her work placement with The Crew, an organisation that provides support to the homeless in the Rockingham and Kwinana area.
The Foundation Skills portfolio partnered with Clontarf Aboriginal College, Kubardu Aboriginal Centre and the Ngaannyatjarra Centre to develop new partnerships to promote pathways for Indigenous students from schools into TAFE and universities. The outcome of these partnerships will
be more Indigenous students undertaking TAFE courses into 2019. The Foundation Skills portfolio also achieved targets across all delivery areas and campuses in the Course in Applied Vocational Study Skills (CAVSS) and Course in Underpinning Skills for Industry Qualifications (USIQ). CAVSS and USIQ courses address a national priority to improve language, literacy and numeracy outcomes within VET training. These courses are delivered within a wide range of qualifications, and are associated with a decrease in student attrition when compared to courses delivered without CAVSS support. Anecdotal data associates CAVVS with increased student motivation, resilience and engagement.
The Children’s Services portfolio commenced delivery of the Certificate III in Early Childhood Education and Care to secondary school students. The program provides the opportunity for students to continue year 11 and 12 while undertaking VET studies, providing them with a pathway into the diploma level course or into employment in the industry upon completion.
This year the Health portfolio hosted 13 WA Country Health Service workers as part of an innovative training initiative to develop
2018 Overview by Division
AN
NU
AL
RE
PO
RT
2018
SO
UTH
METR
OP
OLITA
N TA
FE
25
SIGNIFICANT ISSUES IMPACTING THE AGENCYAGENCY PERFORMANCE
DISCLOSURES AND LEGAL COMPLIANCEOVERVIEW OF THE AGENCY
health skills within workplaces in their regional communities. The students, who hailed from Kalgoorlie, Broome, Kununurra, Meekatharra, Carnarvon, Geraldton, Derby, and Cunderdin work in various roles ranging from ward clerks, health promotion officers and patient care assistants. Students graduated with a Certificate III in Health Services Assistance and will take their new knowledge and skills into their workplaces.
Into 2019, the division will continue to focus on developing relationships with local organisations and businesses to continue to provide opportunities for our students to connect with future employers.
Construction, Hospitality and CommerceConstruction, Creative Industries and Lifestyle, Business and Financial Services, Information Technology, and Hospitality and Culinary Arts
This year the Creative Industries and Lifestyle portfolio held the 48th Annual Graduate Fashion Show ‘weARE’ where students from the Advanced Diploma of Fashion Design and Merchandising lit up the Fremantle PS Art Space with decadent designs from 11 student collections. Fashion students also dazzled the stage of the Telstra Perth Fashion Festival’s Future Runway, which showcased the work of the State’s most promising student designers from a number of universities and design
schools. Both events provided SM TAFE’s talented students with exposure to industry and the ability to showcase their work in front of local designers, media, and potential employers. A number of SM TAFE students were awarded for their work.
The Information Technology portfolio partnered with Box Hill Institute and AustCyber to establish new cyber security qualifications for delivery at SM TAFE. The introduction of these new courses in 2018 will position the college to meet critical industry skills shortages in cyber security as well as provide strong employment outcomes for students.
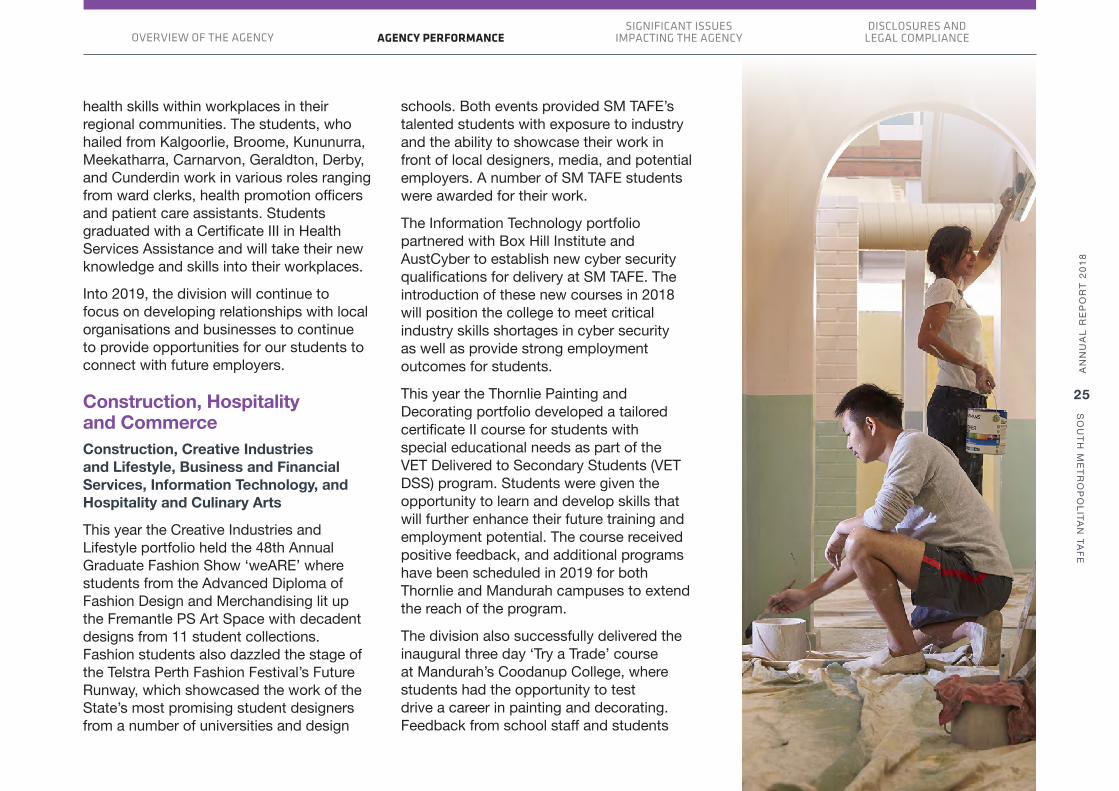
This year the Thornlie Painting and Decorating portfolio developed a tailored certificate II course for students with special educational needs as part of the VET Delivered to Secondary Students (VET DSS) program. Students were given the opportunity to learn and develop skills that will further enhance their future training and employment potential. The course received positive feedback, and additional programs have been scheduled in 2019 for both Thornlie and Mandurah campuses to extend the reach of the program.
The division also successfully delivered the inaugural three day ‘Try a Trade’ course at Mandurah’s Coodanup College, where students had the opportunity to test drive a career in painting and decorating. Feedback from school staff and students

AN
NU
AL
RE
PO
RT
2018
SO
UTH
METR
OP
OLITA
N TA
FE
26
SIGNIFICANT ISSUES IMPACTING THE AGENCYAGENCY PERFORMANCE
DISCLOSURES AND LEGAL COMPLIANCEOVERVIEW OF THE AGENCY
was very positive, and helped promote pre-apprenticeship opportunities and career pathways to students.
The Construction portfolio successfully hosted a Future Trades Open Night, attracting dozens of interested future students and their parents. Attendees enjoyed getting hands-on at some of the activities, and quizzing lecturers with their skills-based and apprenticeship questions. Attendees were also able to view current student work in a number of trade areas including bricklaying, plumbing, carpentry and joinery as well as participate in workshops. Current students also attended, showing off their skills and discussing their training achievements.
The Construction portfolio also delivered a pilot Certificate II in Construction program designed for disengaged school students in the southern metropolitan region. Students received training in three separate trade areas, including painting and decorating, bricklaying, and carpentry and joinery. The course provided students with the opportunity to undertake work experience within the industry. The participation rate of students exceeded expectations, with many students being from low socio-economic backgrounds and disengaged from education. A number of students were linked with potential employers for apprenticeships.
The portfolio began delivery of the Certificate II (Para-Professional) in Construction in 2018, the first of to be delivered in Western Australia. The course was funded through the Construction Training Fund as part of their scholarship program, and provided students with an opportunity to break into the construction industry without completing a traditional trade apprenticeship. It is hoped that this program will promote gender diversity in the industry.
A general decline in the building and construction industry continues to present a challenge for the division, as the number of employers able to take on work experience students has become increasingly limited. A focus for the division going into 2019 will be on further developing relationships with industry, and promoting apprenticeships and traineeships.
Engineering, Transport and DefenceOil and Gas Process Engineering, Defence, Mechanical and Fabrication, Applied Engineering, Light Automotive Technology, Heavy Automotive and Refrigeration and Aerospace, Maritime and Logistics
This year the division successfully developed international partnerships in China through the delivery of the Advanced Diploma of Engineering to the Zhejiang

AN
NU
AL
RE
PO
RT
2018
SO
UTH
METR
OP
OLITA
N TA
FE
27
SIGNIFICANT ISSUES IMPACTING THE AGENCYAGENCY PERFORMANCE
DISCLOSURES AND LEGAL COMPLIANCEOVERVIEW OF THE AGENCY
Institute of Mechanical and Electrical Engineering (ZIME) and the delivery of a professional development program to staff from Ningbo Polytechnic. The partnerships promoted SM TAFE’s high-quality training services and assisted to generate commercial revenue to strengthen the college’s training capabilities and organisational sustainability. In October 2018, SM TAFE was named as one of the top50vocationalinstitutionsintheAsia-Pacific by the Asian Education Forum Organizing Committee at the 2018 Asia-Pacific Vocational Education International Cooperation Summit held in Chengdu, China. The conference provided a platform to showcase SM TAFE’s commitment to assisting Chinese institutions to understand delivery strategies and teaching methodologies required for successful delivery of Australian VET qualifications in China. SM TAFE is one of three Australian TAFE institutes to make the prestigious list.
Exciting updates to the college’s oil and gas facilities at the Australian Centre for Energy Process Training (ACEPT), which were supported by the college’s industry partners Honeywell and Emerson, commenced at the end of 2018. These critical updates will ensure students will be trained on current industry standard facilities, supporting not only the oil and gas sector, but control room operations and automation systems for Industry 4.0 applications, future virtual reality, and augmented reality training in
the engineering, resources, energy and processing sectors. A focus for 2019 will be on ensuring the division can utilise these facilities to enhance online delivery and ensure the college’s delivery is strongly linked to future developments in Industry 4.0 and the interoperability of systems in the resources sectors.
The Engineering division developed a new Professional Connections Package (PCP) with Engineers Australia (EA), which will actively support engineering students and new graduates to commence their careers. The program provides support to students through industry engagement, providing EA membership to students (the national engineering body), and assisting to ensure final year students are supported in their transition from study to the workplace.
This year the Automotive portfolio hosted the inaugural Light Automotive Awards at Carlisle campus. The event received support from major industry partners, and saw over
200 students and industry representatives attend. Attendees were treated to a number of displays, and were able to view the college’s workshop areas and facilities. Overall, 10 award categories were presented, with the premier category Apprentice of the Year Award, presented to the outstanding 3rd year apprentice of the year. The event received great feedback from major industry partners, including Kawasaki.
The Aviation portfolio hosted a successful 713 SQN Australia Air Force Cadet (AAFC) visit in May. The cadets were introduced to the Aerospace Training Centre and staff provided them with an overview of various areas of delivery. This is the AAFC’s 4th visit to SM TAFE and is an example of the college gaining exposure with a proactive training organisation.
In 2019, the division will focus on the development of Industry 4.0 capability through collaboration with the Australian Industry Group (Ai Group) to begin the scoping process for the Diploma in Applied Technologies in Western Australia. This qualification will develop the skills required for organisations embarking upon digital engineering to ensure they can engage in the ongoing industry transformation arising from Industry 4.0. Following positive feedback from Blue Tongue, a long term industry partner, the division will also work to scope a new qualification focused on automation in the heavy automotive industry.
The development of a Professional Connections Package with Engineers Australia assists final year students in their transition from study to the workplace

AN
NU
AL
RE
PO
RT
2018
SO
UTH
METR
OP
OLITA
N TA
FE
28
SIGNIFICANT ISSUES IMPACTING THE AGENCYAGENCY PERFORMANCE
DISCLOSURES AND LEGAL COMPLIANCEOVERVIEW OF THE AGENCY
Jobs & Skills CentresThree Jobs & Skills Centres opened at Thornlie, Rockingham and Mandurah.Pre-apprenticeship workshops delivered to over 250 people.Over 9,200 services delivered.
As part of the WA State Government’s Plan for Jobs, three Jobs & Skills Centres (JSCs) were opened at the college’s Thornlie, Rockingham and Mandurah campuses throughout 2018. JSC services are free and accessible– designed to provide a variety of employment related services to all members of the community. Over 2018, SM TAFE’s JSCs delivered over 9,000 services to jobseekers, school students, career changers and local businesses. The JCSs provided a varied range of services, with the most popular services including resume workshopping, career information and guidance, apprenticeship and traineeship assistance, and training and course information.
Some of the JSCs key activities and achievements in 2018 included:
• Thedevelopmentofacommunicationstrategy to engage with out of contract apprentices
• HostingNAIDOCeventsacrossallJSCs• Anincreaseinsign-upstoschoolbased
traineeships through improved engagement• Developmentofcollaborativerelationships
with SMYL and Bridging the Gap• Deliveringyouthemployabilityworkshopsand
‘meet the boss’ sessions, as well as general employability skills workshops in partnership with atWork Australia
• Supportingdeliveryareaswithevents such as the Trades Open Night at the Rockingham campus
• Engagingwithnumerouslocalbusinessesand industry organisations, providing workforce development advice and linking students and job seekers with potential employers.

AN
NU
AL
RE
PO
RT
2018
SO
UTH
METR
OP
OLITA
N TA
FE
29
SIGNIFICANT ISSUES IMPACTING THE AGENCYAGENCY PERFORMANCE
DISCLOSURES AND LEGAL COMPLIANCEOVERVIEW OF THE AGENCY
Case StudyAnayanci (Anna) Herrera, originally from El Salvador, is a paraplegic looking to return to the workforce after 17 years.
Anna visited the Thornlie Jobs & Skills Centre (JSC) seeking career guidance, and expressed interest in a broad range of careers including laboratory technician, airline operations, property management and medical reception. The JSC staff were able to provide Anna with information about each of the occupations, likely job prospects and availability of training programs.
Anna was invited to participate in the official launch of the metropolitan Jobs & Skills Centres, with the Premier and Minister on 30 May 2018.
Through the JSC, Anna was connected with AMA Training Services and is now enrolled in a medical reception course, which will gain her specific skills and experience to work in the industry. Anna has also been referred to Bizlink Quality Employment who can provide support in securing employment for people with disabilities.
Anna Herrera participating in the launch of Thornlie’s Jobs & Skills Centre
AN
NU
AL
RE
PO
RT
2018
SO
UTH
METR
OP
OLITA
N TA
FE
30
SIGNIFICANT ISSUES IMPACTING THE AGENCYAGENCY PERFORMANCE
DISCLOSURES AND LEGAL COMPLIANCEOVERVIEW OF THE AGENCY
SIGNIFICANT ISSUES IMPACTING THE AGENCY
Significant current and emerging issues
Developing the customer experience In 2018, SM TAFE took an important step towards developing the customer experience through the implementation of a enterprise wide Student Management System (SMS). After most of the year spent in preparation, the SMS was implemented in December 2018 in time for the Semester 1 enrolment period. Although the SMS is a significant component of developing the customer experience, this projects forms a part of a larger framework of initiatives designed to develop a student centric environment. Ensuring SM TAFE can continue to develop the customer experience and continue working toward other student experience projects will be pivotal to driving continued student satisfaction and achieving the college’s strategic goal of ‘Exceeding Customer Expectations’. SM TAFE will focus on improving the customer experience in 2019, with the appointment of a Director Customer Experience (CX) in 2018 to drive this initiative.
Western Australian defence economy The defence sector will be a major focus in 2019 as the college works to position itself to meet the State’s defence related skilling needs. SM TAFE will work closely with Department of Jobs, Tourism, Science and Innovation to assist with strategies outlined in the WA Defence and Defence Industries Strategic Plan, as well as with our partner, the Naval Shipbuilding College. A new campus at Naval Base, which will be opened in 2019, will assist to better position the college within the State’s major maritime defence precinct.
Industry 4.0 and skilling for the future As a provider of training designed to meet the needs of existing and emerging industries, a primary consideration for SM TAFE will be how to effectively respond to the impact of ‘Industry 4.0’, and how new technologies will evolve the needs of workers now and into the future.
Exciting partnerships with Rio Tinto and the University of Western Australia, as well as recently introduced courses in fields such as cyber security are already furthering the college’s capability in this area. Continuing to ensure new and existing courses reflect evolving workplaces will continue to be a pivotal part of SM TAFE’s strategy – a commitment to ensuring that Western Australian workers can access the training they need to thrive in evolving economies.
International educationInternational students play an important role in promoting cultural exchange and diversity on our campuses. International education, both onshore and offshore, is also an important aspect of the college’s business and a source of profitable revenue. Ensuring the college can access the benefits of international education and develop international partnerships will be important both in terms of driving financial sustainability and delivering reputational advantages.

AN
NU
AL
RE
PO
RT
2018
SO
UTH
METR
OP
OLITA
N TA
FE
31
SIGNIFICANT ISSUES IMPACTING THE AGENCYAGENCY PERFORMANCE
DISCLOSURES AND LEGAL COMPLIANCEOVERVIEW OF THE AGENCY
Terry Durant Managing Director
12 March 2019
David Savill Director Finance
12 March 2019
Elizabeth Carr AM Chair of Governing Council
12 March 2019
The accompanying financial statements of South Metropolitan TAFE have been prepared in compliance with the provisions of the Financial Management Act 2006 from proper accounts and records to present fairly the financial transactions for the period ending 31 December 2018 and the financial position as at 31 December 2018.
At the date of signing we are not aware of any circumstances that would render the particulars included in the financial statements misleading or inaccurate.
DISCLOSURES AND LEGAL COMPLIANCE
Financial StatementsCertification of Financial Statements

AN
NU
AL
RE
PO
RT
2018
SO
UTH
METR
OP
OLITA
N TA
FE
32
SIGNIFICANT ISSUES IMPACTING THE AGENCYAGENCY PERFORMANCE
DISCLOSURES AND LEGAL COMPLIANCEOVERVIEW OF THE AGENCY
AN
NU
AL
RE
PO
RT
2018
SO
UTH
METR
OP
OLITA
N TA
FE
33
SIGNIFICANT ISSUES IMPACTING THE AGENCYAGENCY PERFORMANCE
DISCLOSURES AND LEGAL COMPLIANCEOVERVIEW OF THE AGENCY

AN
NU
AL
RE
PO
RT
2018
SO
UTH
METR
OP
OLITA
N TA
FE
34
SIGNIFICANT ISSUES IMPACTING THE AGENCYAGENCY PERFORMANCE
DISCLOSURES AND LEGAL COMPLIANCEOVERVIEW OF THE AGENCY

AN
NU
AL
RE
PO
RT
2018
SO
UTH
METR
OP
OLITA
N TA
FE
35
SIGNIFICANT ISSUES IMPACTING THE AGENCYAGENCY PERFORMANCE
DISCLOSURES AND LEGAL COMPLIANCEOVERVIEW OF THE AGENCY

AN
NU
AL
RE
PO
RT
2018
SO
UTH
METR
OP
OLITA
N TA
FE
36
SIGNIFICANT ISSUES IMPACTING THE AGENCYAGENCY PERFORMANCE
DISCLOSURES AND LEGAL COMPLIANCEOVERVIEW OF THE AGENCY

AN
NU
AL
RE
PO
RT
2018
SO
UTH
METR
OP
OLITA
N TA
FE
37
SIGNIFICANT ISSUES IMPACTING THE AGENCYAGENCY PERFORMANCE
DISCLOSURES AND LEGAL COMPLIANCEOVERVIEW OF THE AGENCY
South Metropolitan TAFESTATEMENT OF COMPREHENSIVE INCOME 2018 2017FOR THE YEAR ENDED 31 DECEMBER 2018
Notes $ $COST OF SERVICESExpensesEmployee benefits expense 2.1 114,440,902 117,476,683 Grants and subsidies 2.2 397,297 453,105 Supplies and services 2.3 31,584,904 33,046,010 Asset revaluation decrement 2.3 2,000,000 11,622,508 Other expenses 2.3 11,187,618 11,284,351 Cost of sales 3.3 234,758 244,324 Loss on disposal of non‐current assets 3.6 32,193 ‐ Depreciation and amortisation expense 4.1,4.2 8,786,480 7,922,260 Total cost of services 168,664,152 182,049,241
IncomeRevenueFee for service 3.2 24,742,929 27,848,058 Student fees and charges 3.2 23,744,365 24,144,340 Ancillary trading 3.2 1,333,504 1,727,613 Sales 3.3 368,595 367,669 Interest revenue 3.4 1,108,306 1,058,971 Other revenue 3.5 2,178,605 4,156,885 Total revenue 53,476,304 59,303,536
GainsGain on disposal of non‐current assets 3.6 ‐ 662 Gain arising from changes in fair value ‐ buildings 3.6 2,514,158 ‐ Total gains 2,514,158 662 Total income other than income from State Government 55,990,462 59,304,198 NET COST OF SERVICES 112,673,690 122,745,043
Income from State GovernmentService appropriation 3.1 102,705,370 100,407,437 Services received free of charge 3.1 5,986,296 6,927,747 Total income from State Government 3.1 108,691,666 107,335,184 DEFICIT FOR THE PERIOD (3,982,024) (15,409,859)
OTHER COMPREHENSIVE INCOMEItems not reclassified subsequently to profit or lossChanges in asset revaluation surplus ‐ 60,026 Total other comprehensive income ‐ 60,026 TOTAL COMPREHENSIVE INCOME FOR THE PERIOD (3,982,024) (15,349,833)
The Statement of Comprehensive Income should be read in conjunction with the accompanying notes.

AN
NU
AL
RE
PO
RT
2018
SO
UTH
METR
OP
OLITA
N TA
FE
38
SIGNIFICANT ISSUES IMPACTING THE AGENCYAGENCY PERFORMANCE
DISCLOSURES AND LEGAL COMPLIANCEOVERVIEW OF THE AGENCY
South Metropolitan TAFESTATEMENT OF FINANCIAL POSITION 2018 2017AS AT 31 DECEMBER 2018
Notes $ $ASSETSCurrent Assets Cash and cash equivalents 6.1 37,923,318 35,684,507 Restricted cash and cash equivalents 6.1 926,588 2,719,321 Receivables 5.1 4,770,523 3,220,163 Inventories 3.3 23,959 ‐ Other current assets 5.2 1,023,036 1,178,811 Non‐current assets classified as held for distribution to owners 8.8 950,074 950,074 Total Current Assets 45,617,498 43,752,876
Non‐Current Assets Restricted cash and cash equivalents 6.1 1,279,045 1,088,916 Property, plant and equipment 4.1 317,878,034 332,331,303 Intangible assets 4.2 31,877 81,525 Total Non‐Current Assets 319,188,956 333,501,744 TOTAL ASSETS 364,806,454 377,254,620
LIABILITIESCurrent LiabilitiesPayables 5.3 2,768,777 3,181,238 Employee related provisions 2.1 22,118,764 20,448,405 Other current liabilities 5.4 86,569 2,929,651 Total Current Liabilities 24,974,110 26,559,294
Non‐Current LiabilitiesEmployee related provisions 2.1 2,840,136 3,860,825 Total Non‐Current Liabilities 2,840,136 3,860,825 TOTAL LIABILITIES 27,814,246 30,420,119
NET ASSETS 336,992,208 346,834,501
EQUITYContributed equity 8.9 364,022,813 369,223,643 Reserves 8.9 60,026 60,026 Accumulated deficit (27,090,631) (22,449,168) TOTAL EQUITY 336,992,208 346,834,501
The Statement of Financial Position should be read in conjunction with the accompanying notes.

AN
NU
AL
RE
PO
RT
2018
SO
UTH
METR
OP
OLITA
N TA
FE
39
SIGNIFICANT ISSUES IMPACTING THE AGENCYAGENCY PERFORMANCE
DISCLOSURES AND LEGAL COMPLIANCEOVERVIEW OF THE AGENCY
South Metropolitan TAFESTATEMENT OF CHANGES IN EQUITY Contributed AccumulatedFOR THE YEAR ENDED 31 DECEMBER 2018 Equity Reserves Surplus / (Deficit) Total Equity
Notes $ $ $Balance at 1 January 2017 388,489,397 ‐ (7,039,309) 381,450,088
Deficit for the period (15,409,859) (15,409,859) Other comprehensive income 8.9 60,026 ‐ 60,026 Total comprehensive income for the period ‐ 60,026 (15,409,859) (15,349,833)
Transactions with owners in their capacity as owners: 8.9
52,319,237 ‐ 52,319,237 (71,584,991) ‐ (71,584,991) (19,265,754) ‐ ‐ (19,265,754) 369,223,643 60,026 (22,449,168) 346,834,501
369,223,643 60,026 (22,449,168) 346,834,501 8.2 ‐ 871,096 871,096
8.9(a) 1,530,616 ‐ (1,530,535) 81
370,754,259 60,026 (23,108,607) 347,705,678 (3,982,024) (3,982,024)
8.9 ‐ ‐
Capital appropriationsDistributions to ownersTotalBalance at 31 December 2017
Balance at 1 January 2018Changes in accounting policy Reclassification of grant revenue as contributed equity
Restated balance at 1 January 2018 Deficit for the periodOther comprehensive incomeTotal comprehensive income for the period ‐ ‐ (3,982,024) (3,982,024)
‐ Transactions with owners in their capacity as owners: 8.9
Capital appropriations 1,149,162 ‐ 1,149,162 Transfer of assets from other government agencies 4,572,129 ‐ 4,572,129 Distributions to owners (12,452,737) ‐ (12,452,737)
Total (6,731,446) ‐ ‐ (6,731,446) Balance at 31 December 2018 364,022,813 60,026 (27,090,631) 336,992,208
The Statement of Changes in Equity should be read in conjunction with the accompanying notes.

AN
NU
AL
RE
PO
RT
2018
SO
UTH
METR
OP
OLITA
N TA
FE
40
SIGNIFICANT ISSUES IMPACTING THE AGENCYAGENCY PERFORMANCE
DISCLOSURES AND LEGAL COMPLIANCEOVERVIEW OF THE AGENCY
South Metropolitan TAFESTATEMENT OF CASH FLOWS 2018 2017FOR THE YEAR ENDED 31 DECEMBER 2018
Notes $ $CASH FLOWS FROM STATE GOVERNMENTService appropriation ‐ Department of Training and Workforce Development 99,833,486 97,785,472 Capital appropriation ‐ Department of Training and Workforce Development 1,147,149 ‐ Total Net cash provided by State Government 100,980,635 97,785,472
Utilised as follows:CASH FLOWS FROM OPERATING ACTIVITIESPaymentsEmployee benefits (113,540,461) (117,446,357) Supplies and services (26,764,777) (27,791,021) Grants and subsidies (397,297) (453,105) GST payments on purchases (2,907,572) (3,100,782) Other payments (10,527,008) (11,464,167) ReceiptsFee for service 24,448,817 28,143,245 Student fees and charges 23,018,786 22,032,403 Ancillary trading and sales 1,693,366 2,095,282 Interest received 1,086,068 1,092,705 GST receipts on sales 629,943 1,216,832 GST receipts from taxation authority 2,140,974 1,728,742 Other receipts 2,138,460 3,704,701 Net cash used in operating activities (98,980,701) (100,241,522)
CASH FLOWS FROM INVESTING ACTIVITIESPaymentsPurchase of non‐current physical assets (1,370,178) (2,449,767) ReceiptsProceeds from sale of non‐current physical assets 6,451 5,670 Net cash used in investing activities (1,363,727) (2,444,097)
Net increase (decrease) in cash and cash equivalents 636,207 (4,900,147) Cash and cash equivalents at the beginning of period 39,492,745 44,392,892 CASH AND CASH EQUIVALENTS AT THE END OF PERIOD 6.1 40,128,951 39,492,745
The Statement of Cash Flows should be read in conjunction with the accompanying notes.

AN
NU
AL
RE
PO
RT
2018
SO
UTH
METR
OP
OLITA
N TA
FE
41
SIGNIFICANT ISSUES IMPACTING THE AGENCYAGENCY PERFORMANCE
DISCLOSURES AND LEGAL COMPLIANCEOVERVIEW OF THE AGENCY
South Metropolitan TAFENOTES TO THE FINANCIAL STATEMENTSFOR THE YEAR ENDED 31 DECEMBER 2018
2018 2,017
1 Basis of preparationSouth Metropolitan TAFE (SM TAFE) is a WA Government entity and is controlled by the State of Western Australia,which is the ultimate parent. SM TAFE is a not‐for‐profit entity (as profit is not its principal objective).
A description of the nature of its operations and its principal activities have been included in the 'Overview' which does not form part of these financial statements.
These annual financial statements were authorised for issue by the Managing Director of SM TAFE on12 March 2019.
Statement of complianceThese general purpose financial statements have been prepared in accordance with:1) The Financial Management Act 2006 (FMA)2) The Treasurer's Instructions (the Instructions or TI)3) Australian Accounting Standards (AAS) ‐ Reduced Disclosure Requirements4) Where appropriate, those AAS paragraphs applicable for not‐for‐profit entities have been applied.
The Financial Management Act 2006 and the Treasurer's Instructions (the Instructions) take precedence over AAS. Several AAS are modified by the Instructions to vary application, disclosure format and wording. Where modification is required and has had a material or significant financial effect upon the reported results, details of that modification and the resulting financial effect are disclosed in the notes to the financial statements.
Basis of preparationThese financial statements are presented in Australian dollars applying the accrual basis of accounting andhistorical cost convention. Certain balances will apply a different measurement basis (such as fair value basis). Where this is the case the different measurement basis is disclosed in the associated note.
Judgements and estimatesJudgements, estimates and assumptions are required to be made about financial information being presented. Thesignificant judgements and estimates made in the preparation of these financial statements are disclosed in the notes where amounts affected by those judgements and/or estimates are disclosed. Estimates and associated assumptions are based on professional judgements derived from historical experience and various other factors that are believed to be reasonable under the circumstances.
Contributed equityAASB Interpretation 1038 Contributions by Owners Made to Wholly‐Owned Public Sector Entities requires transfers in the nature of equity contributions, other than as a result of a restructure of administrative arrangements, to be designated by the Government (the owner) as contributions by owners (at the time of, or prior to transfer) before such transfers can be recognised as equity contributions. Capital appropriations have been designated as contributions by owners by TI 955 Contributions by Owners made to Wholly Owned Public Sector Entities and have been credited directly to Contributed Equity.
The transfer of net assets to/from other agencies, other than as a result of a restructure of administrative arrange‐ments, are designated as contributions by owners where the transfers are non‐discretionary and non‐reciprocal.
2 Use of our fundingExpenses incurred in the delivery of servicesThis section provides additional information about how SM TAFE’s funding is applied and the accounting policiesthat are relevant for an understanding of the items recognised in the financial statements. The primary expenses incurred by SM TAFE in achieving its objectives and the relevant notes are:
Notes 2018 2017Employee benefits expense 2.1(a) 114,440,902 117,476,683 Employee related provisions 2.1(b) 24,958,900 24,309,231 Grants and subsidies 2.2 397,297 453,105 Other expenses 2.3 13,187,618 22,906,859
2.1(a) Employee benefits expense2018 2017
Wages and salaries 104,173,193 106,213,885 Termination benefits 409,031 1,046,746 Superannuation ‐ defined contribution plans (a) 9,858,678 10,216,052
2.1(a)Total employee benefits expenses 114,440,902 117,476,683 (a) Defined contribution plans includes West State Superannuation Scheme (WSS), Gold State Superannuation Scheme(GSS) Government Employees Superannuation Board Schemes (GESB) and other eligible funds.
Wages and salaries: Employee expenses include all costs related to employment including wages and salaries, fringebenefits tax and leave entitlements.
Termination benefits: Payable when employment is terminated before normal retirement date, or when an employee

AN
NU
AL
RE
PO
RT
2018
SO
UTH
METR
OP
OLITA
N TA
FE
42
SIGNIFICANT ISSUES IMPACTING THE AGENCYAGENCY PERFORMANCE
DISCLOSURES AND LEGAL COMPLIANCEOVERVIEW OF THE AGENCY
South Metropolitan TAFENOTES TO THE FINANCIAL STATEMENTSFOR THE YEAR ENDED 31 DECEMBER 2018
2018 2,017
1 Basis of preparationSouth Metropolitan TAFE (SM TAFE) is a WA Government entity and is controlled by the State of Western Australia,which is the ultimate parent. SM TAFE is a not‐for‐profit entity (as profit is not its principal objective).
A description of the nature of its operations and its principal activities have been included in the 'Overview' which does not form part of these financial statements.
These annual financial statements were authorised for issue by the Managing Director of SM TAFE on12 March 2019.
Statement of complianceThese general purpose financial statements have been prepared in accordance with:1) The Financial Management Act 2006 (FMA)2) The Treasurer's Instructions (the Instructions or TI)3) Australian Accounting Standards (AAS) ‐ Reduced Disclosure Requirements4) Where appropriate, those AAS paragraphs applicable for not‐for‐profit entities have been applied.
The Financial Management Act 2006 and the Treasurer's Instructions (the Instructions) take precedence over AAS. Several AAS are modified by the Instructions to vary application, disclosure format and wording. Where modification is required and has had a material or significant financial effect upon the reported results, details of that modification and the resulting financial effect are disclosed in the notes to the financial statements.
Basis of preparationThese financial statements are presented in Australian dollars applying the accrual basis of accounting andhistorical cost convention. Certain balances will apply a different measurement basis (such as fair value basis). Where this is the case the different measurement basis is disclosed in the associated note.
Judgements and estimatesJudgements, estimates and assumptions are required to be made about financial information being presented. Thesignificant judgements and estimates made in the preparation of these financial statements are disclosed in the notes where amounts affected by those judgements and/or estimates are disclosed. Estimates and associated assumptions are based on professional judgements derived from historical experience and various other factors that are believed to be reasonable under the circumstances.
Contributed equityAASB Interpretation 1038 Contributions by Owners Made to Wholly‐Owned Public Sector Entities requires transfers in the nature of equity contributions, other than as a result of a restructure of administrative arrangements, to be designated by the Government (the owner) as contributions by owners (at the time of, or prior to transfer) before such transfers can be recognised as equity contributions. Capital appropriations have been designated as contributions by owners by TI 955 Contributions by Owners made to Wholly Owned Public Sector Entities and have been credited directly to Contributed Equity.
The transfer of net assets to/from other agencies, other than as a result of a restructure of administrative arrange‐ments, are designated as contributions by owners where the transfers are non‐discretionary and non‐reciprocal.
2 Use of our fundingExpenses incurred in the delivery of servicesThis section provides additional information about how SM TAFE’s funding is applied and the accounting policiesthat are relevant for an understanding of the items recognised in the financial statements. The primary expenses incurred by SM TAFE in achieving its objectives and the relevant notes are:
Notes 2018 2017Employee benefits expense 2.1(a) 114,440,902 117,476,683 Employee related provisions 2.1(b) 24,958,900 24,309,231 Grants and subsidies 2.2 397,297 453,105 Other expenses 2.3 13,187,618 22,906,859
2.1(a) Employee benefits expense2018 2017
Wages and salaries 104,173,193 106,213,885 Termination benefits 409,031 1,046,746 Superannuation ‐ defined contribution plans (a) 9,858,678 10,216,052
2.1(a)Total employee benefits expenses 114,440,902 117,476,683 (a) Defined contribution plans includes West State Superannuation Scheme (WSS), Gold State Superannuation Scheme(GSS) Government Employees Superannuation Board Schemes (GESB) and other eligible funds.
Wages and salaries: Employee expenses include all costs related to employment including wages and salaries, fringebenefits tax and leave entitlements.
Termination benefits: Payable when employment is terminated before normal retirement date, or when an employee

AN
NU
AL
RE
PO
RT
2018
SO
UTH
METR
OP
OLITA
N TA
FE
43
SIGNIFICANT ISSUES IMPACTING THE AGENCYAGENCY PERFORMANCE
DISCLOSURES AND LEGAL COMPLIANCEOVERVIEW OF THE AGENCY
South Metropolitan TAFENOTES TO THE FINANCIAL STATEMENTSFOR THE YEAR ENDED 31 DECEMBER 2018
2018 2,017
1 Basis of preparationSouth Metropolitan TAFE (SM TAFE) is a WA Government entity and is controlled by the State of Western Australia,which is the ultimate parent. SM TAFE is a not‐for‐profit entity (as profit is not its principal objective).
A description of the nature of its operations and its principal activities have been included in the 'Overview' which does not form part of these financial statements.
These annual financial statements were authorised for issue by the Managing Director of SM TAFE on12 March 2019.
Statement of complianceThese general purpose financial statements have been prepared in accordance with:1) The Financial Management Act 2006 (FMA)2) The Treasurer's Instructions (the Instructions or TI)3) Australian Accounting Standards (AAS) ‐ Reduced Disclosure Requirements4) Where appropriate, those AAS paragraphs applicable for not‐for‐profit entities have been applied.
The Financial Management Act 2006 and the Treasurer's Instructions (the Instructions) take precedence over AAS. Several AAS are modified by the Instructions to vary application, disclosure format and wording. Where modification is required and has had a material or significant financial effect upon the reported results, details of that modification and the resulting financial effect are disclosed in the notes to the financial statements.
Basis of preparationThese financial statements are presented in Australian dollars applying the accrual basis of accounting andhistorical cost convention. Certain balances will apply a different measurement basis (such as fair value basis). Where this is the case the different measurement basis is disclosed in the associated note.
Judgements and estimatesJudgements, estimates and assumptions are required to be made about financial information being presented. Thesignificant judgements and estimates made in the preparation of these financial statements are disclosed in the notes where amounts affected by those judgements and/or estimates are disclosed. Estimates and associated assumptions are based on professional judgements derived from historical experience and various other factors that are believed to be reasonable under the circumstances.
Contributed equityAASB Interpretation 1038 Contributions by Owners Made to Wholly‐Owned Public Sector Entities requires transfers in the nature of equity contributions, other than as a result of a restructure of administrative arrangements, to be designated by the Government (the owner) as contributions by owners (at the time of, or prior to transfer) before such transfers can be recognised as equity contributions. Capital appropriations have been designated as contributions by owners by TI 955 Contributions by Owners made to Wholly Owned Public Sector Entities and have been credited directly to Contributed Equity.
The transfer of net assets to/from other agencies, other than as a result of a restructure of administrative arrange‐ments, are designated as contributions by owners where the transfers are non‐discretionary and non‐reciprocal.
2 Use of our fundingExpenses incurred in the delivery of servicesThis section provides additional information about how SM TAFE’s funding is applied and the accounting policiesthat are relevant for an understanding of the items recognised in the financial statements. The primary expenses incurred by SM TAFE in achieving its objectives and the relevant notes are:
Notes 2018 2017Employee benefits expense 2.1(a) 114,440,902 117,476,683 Employee related provisions 2.1(b) 24,958,900 24,309,231 Grants and subsidies 2.2 397,297 453,105 Other expenses 2.3 13,187,618 22,906,859
2.1(a) Employee benefits expense2018 2017
Wages and salaries 104,173,193 106,213,885 Termination benefits 409,031 1,046,746 Superannuation ‐ defined contribution plans (a) 9,858,678 10,216,052
2.1(a)Total employee benefits expenses 114,440,902 117,476,683 (a) Defined contribution plans includes West State Superannuation Scheme (WSS), Gold State Superannuation Scheme(GSS) Government Employees Superannuation Board Schemes (GESB) and other eligible funds.
Wages and salaries: Employee expenses include all costs related to employment including wages and salaries, fringebenefits tax and leave entitlements.
Termination benefits: Payable when employment is terminated before normal retirement date, or when an employee accepts an offer of benefits in exchange for the termination of employment. Termination benefits are recognised when SM TAFE is demonstrably committed to terminating the employment of current employees according to adetailed formal plan without possibility of withdrawal or providing termination benefits as a result of an offer made to encourage voluntary redundancy. Benefits falling due more than 12 months after the end of the reporting period are discounted to present value.
Superannuation: The amount recognised in profit or loss of the Statement of Comprehensive Income comprisesemployer contributions paid to the GSS (concurrent contributions), the WSS, the GESB, or other superannuation funds. The employer contribution paid to the Government Employees Superannuation Board (GESB) in respect of the GSS is paid back into the Consolidated Account by the GESB.
GSS (concurrent contributions) is a defined benefit scheme for the purposes of employees and whole‐of‐government reporting. It is however a defined contribution plan for SM TAFE purposes because the concurrent contributions (defined contributions) made by SM TAFE to GESB extinguishes SM TAFE’s obligations to the related superannuationliability.
SM TAFE does not recognise any defined benefit liabilities because it has no legal or constructive obligation topay future benefits relating to its employees. The Liabilities for the unfunded Pension Scheme and the unfunded GSS transfer benefits attributable to members who transferred from the Pension Scheme, are assumed by the Treasurer. All other GSS obligations are funded by concurrent contributions made by SM TAFE to the GESB.
The GESB and other fund providers administer public sector superannuation arrangements in Western Australia in accordance with legislative requirements. Eligibility criteria for membership in particular schemes for public sector employees vary according to commencement and implementation dates.
2.1(b) Employee related provisionsProvision is made for benefits accruing to employees in respect of wages and salaries, annual leave and long service leave for services rendered up to the reporting date and recorded as an expense during the period theservices are delivered.
2018 2017CurrentEmployee benefits provisionAnnual leave (a) 4,181,427 4,632,709 Long service leave (b) 16,268,715 14,345,503 Deferred salary scheme (c) 349,848 241,393 Purchased leave (d) 4,429 3,171
20,804,419 19,222,776 Other provisionsEmployment on‐costs (e) 1,314,345 1,225,629
2.1bc Total current employee benefits provisions 22,118,764 20,448,406
Non‐currentEmployee benefits provisionLong service leave (b) 2,671,169 3,631,035
2,671,169 3,631,035 Other provisionsEmployment on‐costs (e) 168,967 229,790
2.1bn Total non‐current employee benefits provisions 2,840,136 3,860,825 2.1(b)Total employee benefits provisions 24,958,900 24,309,231
(a) Annual leave liabilities: Classified as current as there is no unconditional right to defer settlement for at least 12 months after the end of the reporting period.
The provision for annual leave is calculated at the present value of expected payments to be made in relation to services provided by employees up to the reporting date.
(b) Long service leave liabilities: Unconditional long service leave provisions are classified as current liabilities asSM TAFE does not have an unconditional right to defer settlement of the liability for at least 12 months after theend of the reporting period.
Pre‐conditional and conditional long service leave provisions are classified as non‐current liabilities because SM TAFE has an unconditional right to defer the settlement of the liability until the employee has completed therequisite years of service.
A liability for long service leave is recognised after an employee has completed 4 years of service based on remunerationrates current as at the end of the reporting period.
An actuarial assessment of long service leave undertaken by Pricewaterhouse Coopers Actuaries at 31 December2016 determined that the liability measured using the short hand measurement technique above was not materially different from the liability determined using the present value of expected future payments. This calculation is consistent with the College's experience of employee retention and leave taken.

AN
NU
AL
RE
PO
RT
2018
SO
UTH
METR
OP
OLITA
N TA
FE
44
SIGNIFICANT ISSUES IMPACTING THE AGENCYAGENCY PERFORMANCE
DISCLOSURES AND LEGAL COMPLIANCEOVERVIEW OF THE AGENCY
accepts an offer of benefits in exchange for the termination of employment. Termination benefits are recognised when SM TAFE is demonstrably committed to terminating the employment of current employees according to adetailed formal plan without possibility of withdrawal or providing termination benefits as a result of an offer made to encourage voluntary redundancy. Benefits falling due more than 12 months after the end of the reporting period are discounted to present value.
Superannuation: The amount recognised in profit or loss of the Statement of Comprehensive Income comprisesemployer contributions paid to the GSS (concurrent contributions), the WSS, the GESB, or other superannuation funds. The employer contribution paid to the Government Employees Superannuation Board (GESB) in respect of the GSS is paid back into the Consolidated Account by the GESB.
GSS (concurrent contributions) is a defined benefit scheme for the purposes of employees and whole‐of‐government reporting. It is however a defined contribution plan for SM TAFE purposes because the concurrent contributions (defined contributions) made by SM TAFE to GESB extinguishes SM TAFE’s obligations to the related superannuationliability.
SM TAFE does not recognise any defined benefit liabilities because it has no legal or constructive obligation topay future benefits relating to its employees. The Liabilities for the unfunded Pension Scheme and the unfunded GSS transfer benefits attributable to members who transferred from the Pension Scheme, are assumed by the Treasurer. All other GSS obligations are funded by concurrent contributions made by SM TAFE to the GESB.
The GESB and other fund providers administer public sector superannuation arrangements in Western Australia in accordance with legislative requirements. Eligibility criteria for membership in particular schemes for public sector employees vary according to commencement and implementation dates.
2.1(b) Employee related provisionsProvision is made for benefits accruing to employees in respect of wages and salaries, annual leave and long service leave for services rendered up to the reporting date and recorded as an expense during the period theservices are delivered.
2018 2017CurrentEmployee benefits provisionAnnual leave (a) 4,181,427 4,632,709 Long service leave (b) 16,268,715 14,345,503 Deferred salary scheme (c) 349,848 241,393 Purchased leave (d) 4,429 3,171
20,804,419 19,222,776 Other provisionsEmployment on‐costs (e) 1,314,345 1,225,629
2.1bc Total current employee benefits provisions 22,118,764 20,448,406
Non‐currentEmployee benefits provisionLong service leave (b) 2,671,169 3,631,035
2,671,169 3,631,035 Other provisionsEmployment on‐costs (e) 168,967 229,790
2.1bn Total non‐current employee benefits provisions 2,840,136 3,860,825 2.1(b)Total employee benefits provisions 24,958,900 24,309,231
(a) Annual leave liabilities: Classified as current as there is no unconditional right to defer settlement for at least 12 months after the end of the reporting period.
The provision for annual leave is calculated at the present value of expected payments to be made in relation to services provided by employees up to the reporting date.
(b) Long service leave liabilities: Unconditional long service leave provisions are classified as current liabilities asSM TAFE does not have an unconditional right to defer settlement of the liability for at least 12 months after theend of the reporting period.
Pre‐conditional and conditional long service leave provisions are classified as non‐current liabilities because SM TAFE has an unconditional right to defer the settlement of the liability until the employee has completed therequisite years of service.
A liability for long service leave is recognised after an employee has completed 4 years of service based on remunerationrates current as at the end of the reporting period.
An actuarial assessment of long service leave undertaken by Pricewaterhouse Coopers Actuaries at 31 December2016 determined that the liability measured using the short hand measurement technique above was not materially different from the liability determined using the present value of expected future payments. This calculation is consistent with the College's experience of employee retention and leave taken.
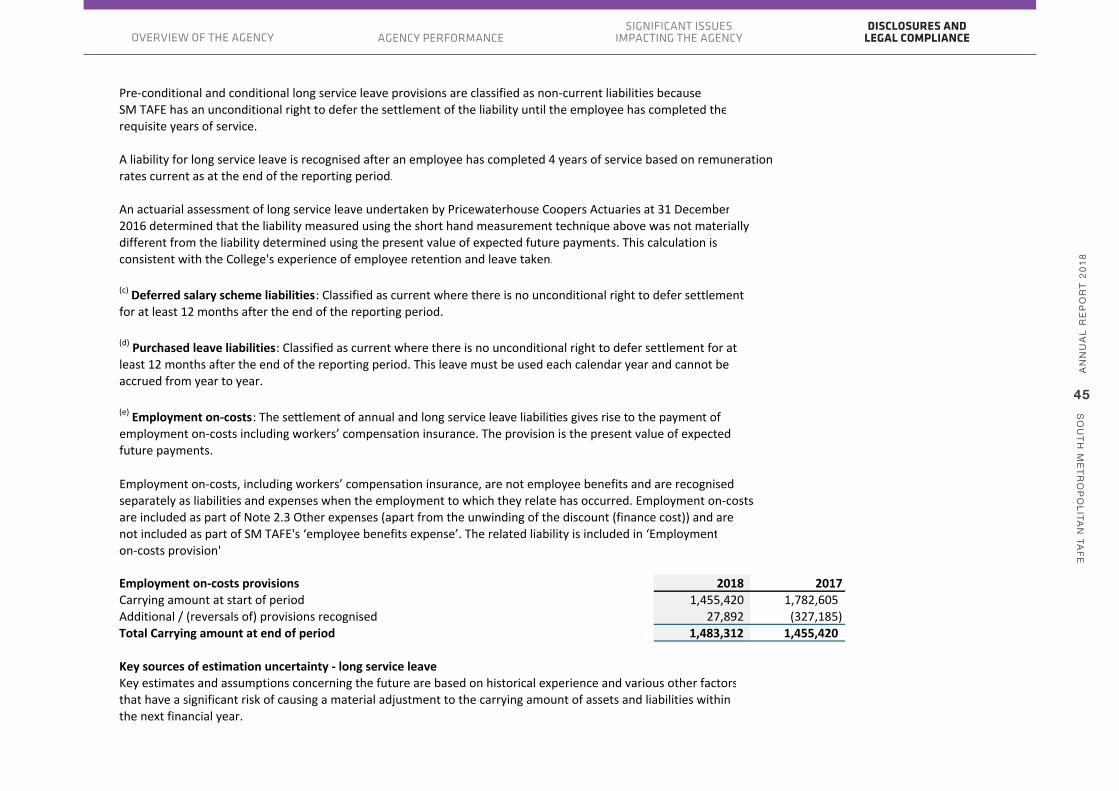
AN
NU
AL
RE
PO
RT
2018
SO
UTH
METR
OP
OLITA
N TA
FE
45
SIGNIFICANT ISSUES IMPACTING THE AGENCYAGENCY PERFORMANCE
DISCLOSURES AND LEGAL COMPLIANCEOVERVIEW OF THE AGENCY
accepts an offer of benefits in exchange for the termination of employment. Termination benefits are recognised when SM TAFE is demonstrably committed to terminating the employment of current employees according to adetailed formal plan without possibility of withdrawal or providing termination benefits as a result of an offer made to encourage voluntary redundancy. Benefits falling due more than 12 months after the end of the reporting period are discounted to present value.
Superannuation: The amount recognised in profit or loss of the Statement of Comprehensive Income comprisesemployer contributions paid to the GSS (concurrent contributions), the WSS, the GESB, or other superannuation funds. The employer contribution paid to the Government Employees Superannuation Board (GESB) in respect of the GSS is paid back into the Consolidated Account by the GESB.
GSS (concurrent contributions) is a defined benefit scheme for the purposes of employees and whole‐of‐government reporting. It is however a defined contribution plan for SM TAFE purposes because the concurrent contributions (defined contributions) made by SM TAFE to GESB extinguishes SM TAFE’s obligations to the related superannuationliability.
SM TAFE does not recognise any defined benefit liabilities because it has no legal or constructive obligation topay future benefits relating to its employees. The Liabilities for the unfunded Pension Scheme and the unfunded GSS transfer benefits attributable to members who transferred from the Pension Scheme, are assumed by the Treasurer. All other GSS obligations are funded by concurrent contributions made by SM TAFE to the GESB.
The GESB and other fund providers administer public sector superannuation arrangements in Western Australia in accordance with legislative requirements. Eligibility criteria for membership in particular schemes for public sector employees vary according to commencement and implementation dates.
2.1(b) Employee related provisionsProvision is made for benefits accruing to employees in respect of wages and salaries, annual leave and long service leave for services rendered up to the reporting date and recorded as an expense during the period theservices are delivered.
2018 2017CurrentEmployee benefits provisionAnnual leave (a) 4,181,427 4,632,709 Long service leave (b) 16,268,715 14,345,503 Deferred salary scheme (c) 349,848 241,393 Purchased leave (d) 4,429 3,171
20,804,419 19,222,776 Other provisionsEmployment on‐costs (e) 1,314,345 1,225,629
2.1bc Total current employee benefits provisions 22,118,764 20,448,406
Non‐currentEmployee benefits provisionLong service leave (b) 2,671,169 3,631,035
2,671,169 3,631,035 Other provisionsEmployment on‐costs (e) 168,967 229,790
2.1bn Total non‐current employee benefits provisions 2,840,136 3,860,825 2.1(b)Total employee benefits provisions 24,958,900 24,309,231
(a) Annual leave liabilities: Classified as current as there is no unconditional right to defer settlement for at least 12 months after the end of the reporting period.
The provision for annual leave is calculated at the present value of expected payments to be made in relation to services provided by employees up to the reporting date.
(b) Long service leave liabilities: Unconditional long service leave provisions are classified as current liabilities asSM TAFE does not have an unconditional right to defer settlement of the liability for at least 12 months after theend of the reporting period.
Pre‐conditional and conditional long service leave provisions are classified as non‐current liabilities because SM TAFE has an unconditional right to defer the settlement of the liability until the employee has completed therequisite years of service.
A liability for long service leave is recognised after an employee has completed 4 years of service based on remunerationrates current as at the end of the reporting period.
An actuarial assessment of long service leave undertaken by Pricewaterhouse Coopers Actuaries at 31 December2016 determined that the liability measured using the short hand measurement technique above was not materially different from the liability determined using the present value of expected future payments. This calculation is consistent with the College's experience of employee retention and leave taken.
(c) Deferred salary scheme liabilities: Classified as current where there is no unconditional right to defer settlement for at least 12 months after the end of the reporting period.
(d) Purchased leave liabilities: Classified as current where there is no unconditional right to defer settlement for at least 12 months after the end of the reporting period. This leave must be used each calendar year and cannot be accrued from year to year.
(e) Employment on‐costs : The se�lement of annual and long service leave liabili�es gives rise to the payment of employment on‐costs including workers’ compensation insurance. The provision is the present value of expected future payments.
Employment on‐costs, including workers’ compensation insurance, are not employee benefits and are recognised separately as liabilities and expenses when the employment to which they relate has occurred. Employment on‐costs are included as part of Note 2.3 Other expenses (apart from the unwinding of the discount (finance cost)) and arenot included as part of SM TAFE's ‘employee benefits expense’. The related liability is included in ‘Employmenton‐costs provision'
Employment on‐costs provisions 2018 2017Carrying amount at start of period 1,455,420 1,782,605 Additional / (reversals of) provisions recognised 27,892 (327,185) Total Carrying amount at end of period 1,483,312 1,455,420
Key sources of estimation uncertainty ‐ long service leaveKey estimates and assumptions concerning the future are based on historical experience and various other factorsthat have a significant risk of causing a material adjustment to the carrying amount of assets and liabilities within the next financial year.
Several estimates and assumptions are used in calculating SM TAFE’s long service leave provision. These include:• Expected future salary rates• Discount rates• Employee retention rates; and• Expected future payments
Changes in these estimations and assumptions may impact on the carrying amount of the long service leave provision.
Any gain or loss following revaluation of the present value of long service leave liabilities is recognised as employee benefits expense.
2.2 Grants and subsidies2018 2017
RecurrentScholarships for students 397,297 453,105
2.2 Total grants and subsidies 397,297 453,105
Transactions in which SM TAFE provides goods, services, assets (or extinguishes a liability) or labour to anotherparty without receiving approximately equal value in return are categorised as ‘Grant expenses’. Grants can either be operating or capital in nature.
Grants can be paid as general purpose grants which refer to grants that are not subject to conditions regarding theiruse. Alternatively, they may be paid as specific purpose grants which are paid for a particular purpose and/or haveconditions attached regarding their use.
Grants and other transfers to third parties (other than contribution to owners) are recognised as an expense in the reporting period in which they are paid or payable. They include transactions such as: grants, subsidies, personal benefit payments made in cash to individuals, other transfer payments made to public sector agencies, local government, non‐government schools and community groups.

AN
NU
AL
RE
PO
RT
2018
SO
UTH
METR
OP
OLITA
N TA
FE
46
SIGNIFICANT ISSUES IMPACTING THE AGENCYAGENCY PERFORMANCE
DISCLOSURES AND LEGAL COMPLIANCEOVERVIEW OF THE AGENCY
(c) Deferred salary scheme liabilities: Classified as current where there is no unconditional right to defer settlement for at least 12 months after the end of the reporting period.
(d) Purchased leave liabilities: Classified as current where there is no unconditional right to defer settlement for at least 12 months after the end of the reporting period. This leave must be used each calendar year and cannot be accrued from year to year.
(e) Employment on‐costs : The se�lement of annual and long service leave liabili�es gives rise to the payment of employment on‐costs including workers’ compensation insurance. The provision is the present value of expected future payments.
Employment on‐costs, including workers’ compensation insurance, are not employee benefits and are recognised separately as liabilities and expenses when the employment to which they relate has occurred. Employment on‐costs are included as part of Note 2.3 Other expenses (apart from the unwinding of the discount (finance cost)) and arenot included as part of SM TAFE's ‘employee benefits expense’. The related liability is included in ‘Employmenton‐costs provision'
Employment on‐costs provisions 2018 2017Carrying amount at start of period 1,455,420 1,782,605 Additional / (reversals of) provisions recognised 27,892 (327,185) Total Carrying amount at end of period 1,483,312 1,455,420
Key sources of estimation uncertainty ‐ long service leaveKey estimates and assumptions concerning the future are based on historical experience and various other factorsthat have a significant risk of causing a material adjustment to the carrying amount of assets and liabilities within the next financial year.
Several estimates and assumptions are used in calculating SM TAFE’s long service leave provision. These include:• Expected future salary rates• Discount rates• Employee retention rates; and• Expected future payments
Changes in these estimations and assumptions may impact on the carrying amount of the long service leave provision.
Any gain or loss following revaluation of the present value of long service leave liabilities is recognised as employee benefits expense.
2.2 Grants and subsidies2018 2017
RecurrentScholarships for students 397,297 453,105
2.2 Total grants and subsidies 397,297 453,105
Transactions in which SM TAFE provides goods, services, assets (or extinguishes a liability) or labour to anotherparty without receiving approximately equal value in return are categorised as ‘Grant expenses’. Grants can either be operating or capital in nature.
Grants can be paid as general purpose grants which refer to grants that are not subject to conditions regarding theiruse. Alternatively, they may be paid as specific purpose grants which are paid for a particular purpose and/or haveconditions attached regarding their use.
Grants and other transfers to third parties (other than contribution to owners) are recognised as an expense in the reporting period in which they are paid or payable. They include transactions such as: grants, subsidies, personal benefit payments made in cash to individuals, other transfer payments made to public sector agencies, local government, non‐government schools and community groups.

AN
NU
AL
RE
PO
RT
2018
SO
UTH
METR
OP
OLITA
N TA
FE
47
SIGNIFICANT ISSUES IMPACTING THE AGENCYAGENCY PERFORMANCE
DISCLOSURES AND LEGAL COMPLIANCEOVERVIEW OF THE AGENCY
2.3 Other expenses2018 2017
Supplies and servicesConsumables and minor equipment 6,353,235 6,953,887 Communication expenses 533,266 569,769 Utilities expenses 3,182,411 3,263,483 Consultancies and contracted services 15,803,741 16,423,650 Minor works 300,451 92,420 Repairs and maintenance 627,150 899,336 Operating lease and hire charges 2,167,843 2,068,357 Travel and passenger transport 174,765 212,270 Advertising and public relations 142,184 281,883 Staff professional development activities 116,198 129,671 Supplies and services ‐ other 2,183,660 2,151,284
2.3s Total supplies and services expenses 31,584,904 33,046,010
Other expenditureBuilding maintenance 2,981,747 2,805,183 Doubtful debts expense ‐ (138,427) Expected credit losses expense (a) 394,494 ‐ Employment on‐costs 7,700,700 8,172,507 Student prizes and awards 4,001 2,223 Losses and write‐offs 130 2,902 Other 106,546 439,963
2.3o Total other expenses 11,187,618 11,284,351
Asset revaluation decrementLand 2,000,000 6,750,000 Buildings ‐ 4,872,508
2.3r Total asset revaluation decrement 2,000,000 11,622,508
2.3 Total other expenditure 13,187,618 22,906,859 (a) Expected credit losses were not measured in 2017
Supplies and services:Supplies and services are recognised as an expense in the reporting period in which they are incurred. The carrying amounts of any materials held for distribution are expensed when the materials are distributed.
Repairs, maintenance and minor works:Repairs and maintenance costs are recognised as expenses as incurred, except where they relate to the replacement of a significant component of an asset. In that case, the costs are capitalised and depreciated.
Other:Other operating expenses generally represent the day‐to‐day running costs incurred in normal operations.
Doubtful debts expense:Doubtful debts expense was recognised as the movement in the allowance for doubtful debts. From 2018 expectedcredit losses expense is recognised as the movement in the allowance for expected credit losses. The allowance forexpected credit losses receivables is measured at the lifetime expected credit losses at each reporting date. SM TAFE has established a provision matrix that is based on its historical credit loss experience,adjusted for forward‐looking factors specific to the debtors and the economic environment. (Note 5.1 Receivables)
Employment on‐costs:Includes workers’ compensation insurance and other employment on‐costs. The on‐costs liability associated withthe recognition of annual and long service leave liabilities is included at Note 2.1(b) Employee related provisions.Superannuation contributions accrued as part of the provision for leave are employee benefits and are not includedin employment on‐costs.
Asset Revaluation:Revaluation increment is credited directly to an asset revaluation reserve, except to the extent that any increment reverses a revaluation decrement of the same class of assets previously recognised as an expense. Revaluationdecrement is recognised as an expense, except to the extent of any balance existing in the asset revaluation reservein respect of that class of assets.

AN
NU
AL
RE
PO
RT
2018
SO
UTH
METR
OP
OLITA
N TA
FE
48
SIGNIFICANT ISSUES IMPACTING THE AGENCYAGENCY PERFORMANCE
DISCLOSURES AND LEGAL COMPLIANCEOVERVIEW OF THE AGENCY
2.3 Other expenses2018 2017
Supplies and servicesConsumables and minor equipment 6,353,235 6,953,887 Communication expenses 533,266 569,769 Utilities expenses 3,182,411 3,263,483 Consultancies and contracted services 15,803,741 16,423,650 Minor works 300,451 92,420 Repairs and maintenance 627,150 899,336 Operating lease and hire charges 2,167,843 2,068,357 Travel and passenger transport 174,765 212,270 Advertising and public relations 142,184 281,883 Staff professional development activities 116,198 129,671 Supplies and services ‐ other 2,183,660 2,151,284
2.3s Total supplies and services expenses 31,584,904 33,046,010
Other expenditureBuilding maintenance 2,981,747 2,805,183 Doubtful debts expense ‐ (138,427) Expected credit losses expense (a) 394,494 ‐ Employment on‐costs 7,700,700 8,172,507 Student prizes and awards 4,001 2,223 Losses and write‐offs 130 2,902 Other 106,546 439,963
2.3o Total other expenses 11,187,618 11,284,351
Asset revaluation decrementLand 2,000,000 6,750,000 Buildings ‐ 4,872,508
2.3r Total asset revaluation decrement 2,000,000 11,622,508
2.3 Total other expenditure 13,187,618 22,906,859 (a) Expected credit losses were not measured in 2017
Supplies and services:Supplies and services are recognised as an expense in the reporting period in which they are incurred. The carrying amounts of any materials held for distribution are expensed when the materials are distributed.
Repairs, maintenance and minor works:Repairs and maintenance costs are recognised as expenses as incurred, except where they relate to the replacement of a significant component of an asset. In that case, the costs are capitalised and depreciated.
Other:Other operating expenses generally represent the day‐to‐day running costs incurred in normal operations.
Doubtful debts expense:Doubtful debts expense was recognised as the movement in the allowance for doubtful debts. From 2018 expectedcredit losses expense is recognised as the movement in the allowance for expected credit losses. The allowance forexpected credit losses receivables is measured at the lifetime expected credit losses at each reporting date. SM TAFE has established a provision matrix that is based on its historical credit loss experience,adjusted for forward‐looking factors specific to the debtors and the economic environment. (Note 5.1 Receivables)
Employment on‐costs:Includes workers’ compensation insurance and other employment on‐costs. The on‐costs liability associated withthe recognition of annual and long service leave liabilities is included at Note 2.1(b) Employee related provisions.Superannuation contributions accrued as part of the provision for leave are employee benefits and are not includedin employment on‐costs.
Asset Revaluation:Revaluation increment is credited directly to an asset revaluation reserve, except to the extent that any increment reverses a revaluation decrement of the same class of assets previously recognised as an expense. Revaluationdecrement is recognised as an expense, except to the extent of any balance existing in the asset revaluation reservein respect of that class of assets.

AN
NU
AL
RE
PO
RT
2018
SO
UTH
METR
OP
OLITA
N TA
FE
49
SIGNIFICANT ISSUES IMPACTING THE AGENCYAGENCY PERFORMANCE
DISCLOSURES AND LEGAL COMPLIANCEOVERVIEW OF THE AGENCY
3 Our funding sourcesHow we obtain our fundingThis section provides additional information about how SM TAFE obtains its funding and the relevant accountingpolicy notes that govern the recognition and measurement of this funding. The primary income received by SM TAFEand the relevant notes are:
Notes 2018 2017Income from State Government 3.1 108,691,666 107,335,184 User charges and fees 3.2 49,820,799 53,720,011 Trading profit 3.3 133,837 123,345 Interest revenue 3.4 1,108,306 1,058,971 Other revenue 3.5 2,178,605 4,156,885 Gains/(Losses) 3.6 2,514,158 662
3.1 Income from State Government2018 2017
Appropriation received during the period:Service appropriation
Delivery and Performance Agreement (DPA) (a) 98,256,252 97,664,851 Non‐DPA Grants from Department of Training and Workforce Development (DTWD) 4,449,118 2,742,586
3.1s 102,705,370 100,407,437
Services received free of charge from other State Government agencies during the period:Department of Training and Workforce Development‐ Corporate systems support 3,610,003 3,445,446 ‐ Human resources and industrial relations support 71,679 80,916 ‐ Training infrastructure management (b) 1,717,020 2,924,113 ‐ Other 587,594 477,272
3.1f 5,986,296 6,927,747
3.1 Total income from State Government 108,691,666 107,335,184
(a) Funds received from the Department of Training and Workforce Development in respect of the delivery of services forming part of the Delivery Performance Agreement. They are the result of training successfully tendered for under competitive tendering arrangements. This revenue is recognised at nominal value in the period in which the College meets the terms of the Agreement.
Service appropriations are recognised as revenues at fair value in the period in which the College gains control of the appropriated funds. The College gains control of the appropriated funds at the time these funds are deposited in the bank account.
(b) Represents expenditure by the Department of Training and Workforce Development on facilities and equipment projects at South Metropolitan TAFE.
3.2 User charges and fees2018 2017
Fee for serviceFee for service ‐ general 8,855,153 8,494,963 Fee for service ‐ Department of Training and Workforce Development (DTWD) 32,367 698 Fee for service ‐ Government (other than DTWD) 7,660,502 7,513,098 International fees 7,865,296 10,253,506 Higher education 329,611 1,585,793
3.2f Total fee for service 24,742,929 27,848,058
Student fees and charges Tuition fees 17,491,581 17,272,936 Enrolment and Resource fees 5,388,245 5,982,241 Recognition of prior learning (RPL) fees 513,885 591,954 Incidental fees 45,570 50,654 Other College fees 305,084 246,555
3.2s Total student fees and charges 23,744,365 24,144,340
Ancillary tradingLiveworks (not a trading activity) 1,281,906 1,604,907 Contracting & consulting revenue 1,127 4,009 Other ancillary revenue 50,471 118,697
3.2a Total ancillary trading 1,333,504 1,727,613 3.2 Total User charges and fees 49,820,798 53,720,011
Revenue is recognised and measured at the fair value of consideration received or receivable. Revenue is recognised for the major business activities when fees and charges are due.

AN
NU
AL
RE
PO
RT
2018
SO
UTH
METR
OP
OLITA
N TA
FE
50
SIGNIFICANT ISSUES IMPACTING THE AGENCYAGENCY PERFORMANCE
DISCLOSURES AND LEGAL COMPLIANCEOVERVIEW OF THE AGENCY
3 Our funding sourcesHow we obtain our fundingThis section provides additional information about how SM TAFE obtains its funding and the relevant accountingpolicy notes that govern the recognition and measurement of this funding. The primary income received by SM TAFEand the relevant notes are:
Notes 2018 2017Income from State Government 3.1 108,691,666 107,335,184 User charges and fees 3.2 49,820,799 53,720,011 Trading profit 3.3 133,837 123,345 Interest revenue 3.4 1,108,306 1,058,971 Other revenue 3.5 2,178,605 4,156,885 Gains/(Losses) 3.6 2,514,158 662
3.1 Income from State Government2018 2017
Appropriation received during the period:Service appropriation
Delivery and Performance Agreement (DPA) (a) 98,256,252 97,664,851 Non‐DPA Grants from Department of Training and Workforce Development (DTWD) 4,449,118 2,742,586
3.1s 102,705,370 100,407,437
Services received free of charge from other State Government agencies during the period:Department of Training and Workforce Development‐ Corporate systems support 3,610,003 3,445,446 ‐ Human resources and industrial relations support 71,679 80,916 ‐ Training infrastructure management (b) 1,717,020 2,924,113 ‐ Other 587,594 477,272
3.1f 5,986,296 6,927,747
3.1 Total income from State Government 108,691,666 107,335,184
(a) Funds received from the Department of Training and Workforce Development in respect of the delivery of services forming part of the Delivery Performance Agreement. They are the result of training successfully tendered for under competitive tendering arrangements. This revenue is recognised at nominal value in the period in which the College meets the terms of the Agreement.
Service appropriations are recognised as revenues at fair value in the period in which the College gains control of the appropriated funds. The College gains control of the appropriated funds at the time these funds are deposited in the bank account.
(b) Represents expenditure by the Department of Training and Workforce Development on facilities and equipment projects at South Metropolitan TAFE.
3.2 User charges and fees2018 2017
Fee for serviceFee for service ‐ general 8,855,153 8,494,963 Fee for service ‐ Department of Training and Workforce Development (DTWD) 32,367 698 Fee for service ‐ Government (other than DTWD) 7,660,502 7,513,098 International fees 7,865,296 10,253,506 Higher education 329,611 1,585,793
3.2f Total fee for service 24,742,929 27,848,058
Student fees and charges Tuition fees 17,491,581 17,272,936 Enrolment and Resource fees 5,388,245 5,982,241 Recognition of prior learning (RPL) fees 513,885 591,954 Incidental fees 45,570 50,654 Other College fees 305,084 246,555
3.2s Total student fees and charges 23,744,365 24,144,340
Ancillary tradingLiveworks (not a trading activity) 1,281,906 1,604,907 Contracting & consulting revenue 1,127 4,009 Other ancillary revenue 50,471 118,697
3.2a Total ancillary trading 1,333,504 1,727,613 3.2 Total User charges and fees 49,820,798 53,720,011
Revenue is recognised and measured at the fair value of consideration received or receivable. Revenue is recognised for the major business activities when fees and charges are due.

AN
NU
AL
RE
PO
RT
2018
SO
UTH
METR
OP
OLITA
N TA
FE
51
SIGNIFICANT ISSUES IMPACTING THE AGENCYAGENCY PERFORMANCE
DISCLOSURES AND LEGAL COMPLIANCEOVERVIEW OF THE AGENCY
3.3 Trading profit2018 2017
Cafeteria (non‐training related)Sales 368,595 367,669 Cost of Sales:Opening Inventory ‐ ‐ Purchases (234,758) (228,209)
(234,758) (228,209) Closing Inventory ‐ ‐ Cost of Goods Sold (234,758) (228,209)
Total trading profit ‐ Cafeteria (non‐training related) 133,837 139,460
Other tradingSales ‐ ‐ Cost of Sales:Opening Inventory ‐ (10,188) Purchases ‐ (5,927)
‐ (16,115) Closing Inventory ‐ ‐ Cost of Goods Sold ‐ (16,115)
Total trading loss ‐ Other trading ‐ (16,115)
3.3 Total Trading profit 133,837 123,345
Closing Inventory comprises:Current InventoriesNon trading activities (at cost) 23,959 ‐
3.3e Total current inventories 23,959 ‐
SalesRevenue is recognised from the sale of goods and disposal of other assets when the significant risks and rewards ofownership transfer to the purchaser and can be measured reliably.
InventoriesInventories are measured at the lower of cost and net realisable value. Costs are assigned by the method most appropriate for each particular class of inventory, with the majority being measured on a first in first out basis.Inventories not held for resale are measured at cost unless they are no longer required, in which case they are measured at net realisable value.
3.4 Interest revenue2018 2017
3.4 Interest revenue 1,108,306 1,058,971
Revenue is recognised as the interest accrues.
3.5 Other revenue2018 2017
Rental and facilities fees 258,178 472,342 Sponsorship and donations revenue 261,446 611,885 Recoups from external organisations 506,231 317,649 Recognition of assets ‐ 452,156 Riskcover performance adjustment and insurance recoveries 404,072 1,192,963 Prior year revenue 320,515 847,600 Miscellaneous revenue 428,163 262,290
3.5 2,178,605 4,156,885
Revenue is recognised and measured at the fair value of consideration received or receivable.

AN
NU
AL
RE
PO
RT
2018
SO
UTH
METR
OP
OLITA
N TA
FE
52
SIGNIFICANT ISSUES IMPACTING THE AGENCYAGENCY PERFORMANCE
DISCLOSURES AND LEGAL COMPLIANCEOVERVIEW OF THE AGENCY
3.3 Trading profit2018 2017
Cafeteria (non‐training related)Sales 368,595 367,669 Cost of Sales:Opening Inventory ‐ ‐ Purchases (234,758) (228,209)
(234,758) (228,209) Closing Inventory ‐ ‐ Cost of Goods Sold (234,758) (228,209)
Total trading profit ‐ Cafeteria (non‐training related) 133,837 139,460
Other tradingSales ‐ ‐ Cost of Sales:Opening Inventory ‐ (10,188) Purchases ‐ (5,927)
‐ (16,115) Closing Inventory ‐ ‐ Cost of Goods Sold ‐ (16,115)
Total trading loss ‐ Other trading ‐ (16,115)
3.3 Total Trading profit 133,837 123,345
Closing Inventory comprises:Current InventoriesNon trading activities (at cost) 23,959 ‐
3.3e Total current inventories 23,959 ‐
SalesRevenue is recognised from the sale of goods and disposal of other assets when the significant risks and rewards ofownership transfer to the purchaser and can be measured reliably.
InventoriesInventories are measured at the lower of cost and net realisable value. Costs are assigned by the method most appropriate for each particular class of inventory, with the majority being measured on a first in first out basis.Inventories not held for resale are measured at cost unless they are no longer required, in which case they are measured at net realisable value.
3.4 Interest revenue2018 2017
3.4 Interest revenue 1,108,306 1,058,971
Revenue is recognised as the interest accrues.
3.5 Other revenue2018 2017
Rental and facilities fees 258,178 472,342 Sponsorship and donations revenue 261,446 611,885 Recoups from external organisations 506,231 317,649 Recognition of assets ‐ 452,156 Riskcover performance adjustment and insurance recoveries 404,072 1,192,963 Prior year revenue 320,515 847,600 Miscellaneous revenue 428,163 262,290
3.5 2,178,605 4,156,885
Revenue is recognised and measured at the fair value of consideration received or receivable.

AN
NU
AL
RE
PO
RT
2018
SO
UTH
METR
OP
OLITA
N TA
FE
53
SIGNIFICANT ISSUES IMPACTING THE AGENCYAGENCY PERFORMANCE
DISCLOSURES AND LEGAL COMPLIANCEOVERVIEW OF THE AGENCY
3.6 Gains/(Losses)2018 2017
Gains/(losses) on disposal of non current assetsNet proceeds from disposal of non‐current assetsPlant, furniture and general equipment 6,006 5,670 Marine craft 445 ‐ Total proceeds from disposal of non‐current assets 6,451 5,670
Carrying amount of non‐current assets disposedPlant, furniture and general equipment (2,895) (1,135) Computers and communication network ‐ (3,873) Marine craft (35,749) ‐
3.6G Net gain/(loss) (32,193) 662
Other gains3.6B Gain arising from changes in fair value ‐ buildings 2,514,158 ‐ 0 Other gains 2,514,158 ‐
Realised and unrealised gains are usually recognised on a net basis. These include the gains arising on the disposal of non‐current assets and some revaluations of non‐current assets.
Gains and losses on the disposal of non‐current assets are presented by deducting from the proceeds on disposalthe carrying amount of the asset and related selling expenses. Gains and losses are recognised in profit or loss inthe statement of comprehensive income (from the proceeds of sale).
4 Key assetsAssets utilised for economic benefit or service potentialThis section includes information regarding the key assets SM TAFE utilises to gain economic benefits or provideservice potential. The section sets out both the key accounting policies and financial information about the performance of these assets:
Notes 2018 2017Property, plant and equipment 4.1 317,878,034 332,331,303 Intangibles 4.2 31,877 81,525 Total key assets 317,909,911 332,412,828

AN
NU
AL
RE
PO
RT
2018
SO
UTH
METR
OP
OLITA
N TA
FE
54
SIGNIFICANT ISSUES IMPACTING THE AGENCYAGENCY PERFORMANCE
DISCLOSURES AND LEGAL COMPLIANCEOVERVIEW OF THE AGENCY
4.1 Property, plant and equipment
Year ended 31 December 2018Land
$Buildings
$
Motor vehicles,
caravans and trailers
$
Leasehold improve‐
ments$
Plant, furniture and
general equipment
$
Computer equipment, communica‐tion network
$Marine craft
$
Library collection
$Works of art
$Total
$1 January 2018Gross carrying amount 103,470,000 216,507,070 392,854 8,779,359 9,082,754 3,920,055 577,728 1,230,276 659,225 344,619,322 Accumulated depreciation ‐ ‐ (138,978) (8,346,409) (2,420,108) (1,382,523) ‐ ‐ ‐ (12,288,018) Carrying amount at start of period 103,470,000 216,507,070 253,876 432,950 6,662,646 2,537,532 577,728 1,230,276 659,225 332,331,303
Additions ‐ 4,755,796 28,382 ‐ 685,906 554,523 ‐ 196,838 ‐ 6,221,445 Transfer between asset classes ‐ (241,669) ‐ ‐ 241,669 ‐ ‐ ‐ ‐ ‐ Transfers (a) (10,000,000) (2,235,375) (4,648) ‐ (212,714) ‐ ‐ ‐ ‐ (12,452,737) Other disposals ‐ ‐ ‐ ‐ (2,297) ‐ (31,564) ‐ ‐ (33,861) Revaluation increments/(decrements) (2,000,000) 2,514,158 ‐ ‐ ‐ ‐ ‐ ‐ ‐ 514,158 Depreciation ‐ (5,473,051) (71,740) (432,950) (1,381,563) (1,086,561) (74,046) (182,362) ‐ (8,702,274) Carrying amount 31 December 2018 91,470,000 215,826,928 205,870 ‐ 5,993,646 2,005,494 472,118 1,244,752 659,225 317,878,034 Gross carrying amount 91,470,000 215,826,929 405,246 8,779,359 9,697,869 4,469,225 555,050 1,427,114 659,225 333,290,018 Accumulated depreciation ‐ ‐ (199,377) (8,779,359) (3,704,223) (2,463,731) (82,932) (182,362) ‐ (15,411,984)
(a) Department of Planning, Lands and Heritage (DPLH) is the only agency with the power to sell Crown land. The land is transferred to DPLH for sale and SM TAFE accounts for the transfer as a distribution to owner.Also includes a transfer of motor vehicles and equipment to the Department of Primary Industries and Regional Development.

AN
NU
AL
RE
PO
RT
2018
SO
UTH
METR
OP
OLITA
N TA
FE
55
SIGNIFICANT ISSUES IMPACTING THE AGENCYAGENCY PERFORMANCE
DISCLOSURES AND LEGAL COMPLIANCEOVERVIEW OF THE AGENCY
Initial recognitionItems of property, plant and equipment, costing $5,000 or more are measured initially at cost. Where an asset is acquired for no or nominal cost, the cost is valued at its fair value at the date of acquisition. Items of property, plant and equipment costing less than $5,000 are immediately expensed direct to the Statement of Comprehensive Income (other than where they form part of a group of similar items which are significant in total).
Assets transferred as part of a machinery of government change are transferred at their fair value.
The cost of a leasehold improvement is capitalised and depreciated over the shorter of the remaining term of the lease or the estimated useful life of the leasehold improvement.
The initial cost for a non‐financial physical asset under a finance lease is measured at amounts equal to the fair value of the leased asset or, if lower, the present value of the minimum lease payments, each determined at the inception of the lease.
Subsequent measurementSubsequent to initial recognition of an asset, the revaluation model is used for the measurement of land, buildingsworks of art and marine craft.
Land and works of art are carried at fair value.
Buildings and marine craft are carried at fair value less accumulated depreciation and accumulated impairment losses.
All other property, plant and equipment are stated at historical cost less accumulated depreciation and accumulated impairment losses.
Land and buildings are independently valued annually by the Western Australian Land Information Authority (Valuations and Property Analytics) and recognised annually to ensure that the carrying amount does not differ materially from the asset’s fair value at the end of the reporting period.
Land and buildings were revalued as at 01 July 2018 by the Western Australian Land Information Authority(Valuations and Property Analytics). The valuations were performed during the year ended 31 December 2018 andrecognised at 31 December 2018. In undertaking the revaluation, fair value was determined by reference tomarket values for land: $13,500,000 (2017: $13,500,000).
For the remaining balance, fair value of buildings was determined on the basis of depreciated replacement cost and the fair value of land was determined on the basis of comparison with market evidence for land with low level utility (high restricted use land).
Revaluation model:a) Fair Value where market‐based evidence is available:The fair value of land and buildings is determined on the basis of current market values determined by reference to recent market transactions. When buildings are revalued by reference to recent market transactions, the accumulated depreciation is eliminated against the gross carrying amount of the asset and the net amount restated to the revalued amount.
b) Fair value in the absence of market‐based evidence:Buildings are specialised or where land is restricted : Fair value of land and buildings is determined on the basis of existing use. Existing use buildings: Fair value is determined by reference to the cost of replacing the remaining future economic benefits embodied in the asset, i.e. the depreciated replacement cost. Where the fair value of buildings is determinedon the depreciated replacement cost basis, the gross carrying amount is adjusted in a manner that is consistentwith the revaluation of the carrying amount of the asset and the accumulated depreciation is adjusted to equalthe difference between the gross carrying amount and the carrying amount of the asset.Restricted use land: Fair value is determined by comparison with market value of comparable unrestrictedland (low restricted use land).
Marine craft are valued every three years by professional valuer. The last valuation occurred as at 31 December 2017and was undertaken by Maritime Engineers Pty Ltd.
Works of art are revalued every three years by an independent artwork valuer to ensure the carrying amount does not differ materially from fair value.
Significant assumptions and judgements: The most significant assumptions and judgements in estimating fair value are made in assessing whether to apply the existing use basis to assets and in determining estimated economic life. Professional judgement by the valuer is required where the evidence does not provide a clear distinction between market type assets and existing use assets.

AN
NU
AL
RE
PO
RT
2018
SO
UTH
METR
OP
OLITA
N TA
FE
56
SIGNIFICANT ISSUES IMPACTING THE AGENCYAGENCY PERFORMANCE
DISCLOSURES AND LEGAL COMPLIANCEOVERVIEW OF THE AGENCY
Initial recognitionItems of property, plant and equipment, costing $5,000 or more are measured initially at cost. Where an asset is acquired for no or nominal cost, the cost is valued at its fair value at the date of acquisition. Items of property, plant and equipment costing less than $5,000 are immediately expensed direct to the Statement of Comprehensive Income (other than where they form part of a group of similar items which are significant in total).
Assets transferred as part of a machinery of government change are transferred at their fair value.
The cost of a leasehold improvement is capitalised and depreciated over the shorter of the remaining term of the lease or the estimated useful life of the leasehold improvement.
The initial cost for a non‐financial physical asset under a finance lease is measured at amounts equal to the fair value of the leased asset or, if lower, the present value of the minimum lease payments, each determined at the inception of the lease.
Subsequent measurementSubsequent to initial recognition of an asset, the revaluation model is used for the measurement of land, buildingsworks of art and marine craft.
Land and works of art are carried at fair value.
Buildings and marine craft are carried at fair value less accumulated depreciation and accumulated impairment losses.
All other property, plant and equipment are stated at historical cost less accumulated depreciation and accumulated impairment losses.
Land and buildings are independently valued annually by the Western Australian Land Information Authority (Valuations and Property Analytics) and recognised annually to ensure that the carrying amount does not differ materially from the asset’s fair value at the end of the reporting period.
Land and buildings were revalued as at 01 July 2018 by the Western Australian Land Information Authority(Valuations and Property Analytics). The valuations were performed during the year ended 31 December 2018 andrecognised at 31 December 2018. In undertaking the revaluation, fair value was determined by reference tomarket values for land: $13,500,000 (2017: $13,500,000).
For the remaining balance, fair value of buildings was determined on the basis of depreciated replacement cost and the fair value of land was determined on the basis of comparison with market evidence for land with low level utility (high restricted use land).
Revaluation model:a) Fair Value where market‐based evidence is available:The fair value of land and buildings is determined on the basis of current market values determined by reference to recent market transactions. When buildings are revalued by reference to recent market transactions, the accumulated depreciation is eliminated against the gross carrying amount of the asset and the net amount restated to the revalued amount.
b) Fair value in the absence of market‐based evidence:Buildings are specialised or where land is restricted : Fair value of land and buildings is determined on the basis of existing use. Existing use buildings: Fair value is determined by reference to the cost of replacing the remaining future economic benefits embodied in the asset, i.e. the depreciated replacement cost. Where the fair value of buildings is determinedon the depreciated replacement cost basis, the gross carrying amount is adjusted in a manner that is consistentwith the revaluation of the carrying amount of the asset and the accumulated depreciation is adjusted to equalthe difference between the gross carrying amount and the carrying amount of the asset.Restricted use land: Fair value is determined by comparison with market value of comparable unrestrictedland (low restricted use land).
Marine craft are valued every three years by professional valuer. The last valuation occurred as at 31 December 2017and was undertaken by Maritime Engineers Pty Ltd.
Works of art are revalued every three years by an independent artwork valuer to ensure the carrying amount does not differ materially from fair value.
Significant assumptions and judgements: The most significant assumptions and judgements in estimating fair value are made in assessing whether to apply the existing use basis to assets and in determining estimated economic life. Professional judgement by the valuer is required where the evidence does not provide a clear distinction between market type assets and existing use assets.

AN
NU
AL
RE
PO
RT
2018
SO
UTH
METR
OP
OLITA
N TA
FE
57
SIGNIFICANT ISSUES IMPACTING THE AGENCYAGENCY PERFORMANCE
DISCLOSURES AND LEGAL COMPLIANCEOVERVIEW OF THE AGENCY
4.1.1 Depreciation and impairmentCharge for the period
2018 2017DepreciationBuildings 5,473,050 4,641,271 Leasehold improvements ‐ buildings 432,950 860,747 Motor vehicles, caravans and trailers 71,740 71,086 Plant, furniture and general equipment 1,381,563 1,372,067 Computers and communication network 1,086,561 787,651 Marine craft 74,046 18,095 Library Collection 182,363 ‐
4.1.1 Total depreciation for the period 8,702,273 7,750,917
As at 31 December 2018 there were no indications of impairment to property, plant and equipment.
All surplus assets at 31 December 2018 have either been classified as assets held for sale or written‐off.
Please refer to Note 4.2 Intangible assets for guidance in relation to the impartment assessment that has beenperformed for intangible assets.
Finite useful livesMost property, plant and equipment having a limited useful life are systematically depreciated over their estimated useful lives in a manner that reflects the consumption of their future economic benefits.
Depreciation is generally calculated on a straight line basis, at rates that allocate the asset’s value, less any estimated residual value, over its estimated useful life. Typical estimated useful lives for the different asset classes for current and prior years are included in the table below:
Asset Useful life: yearsBuilding 40 yearsLeasehold improvements 1 to 2 yearsMotor vehicles, caravans and trailers 1 to 25 yearsPlant, furniture and general equipment 1 to 30 yearsComputer and communication equipment 1 to 14 yearsMarine craft 5 to 8 years
The estimated useful lives, residual values and depreciation method are reviewed at the end of each annual reporting period, and adjustments should be made where appropriate.
Leasehold improvements are depreciated over the shorter of the lease term and their useful lives.
Land and works of art, which are considered to have an indefinite life, are not depreciated. Depreciation is not recognised in respect of these assets because their service potential has not, in any material sense, been consumed during the reporting period.
Under the College capitalisation policy, the library collection is recognised as a grouped asset at year end in accordancewith Treasurer’s Instruction 1101, and depreciated under a rolling depreciation methodology. Purchases in a givenyear are 100% depreciated in the fifth year following purchase and derecognised in the seventh year following purchase.
Under the College capitalisation policy, like Computer equipment items, less than the capitalisation thresholdis recognised as a grouped asset at year end in accordance with Treasurer’s Instruction 1101. Purchases in a given year are depreciated over future years in line with standard college depreciation rates.
ImpairmentNon‐financial assets, including items of property, plant and equipment, are tested for impairment whenever there is an indication that the asset may be impaired. Where there is an indication of impairment, the recoverable amount is estimated. Where the recoverable amount is less than the carrying amount, the asset is considered impaired and is written down to the recoverable amount and an impairment loss is recognised.
Where an asset measured at cost is written down to its recoverable amount, an impairment loss is recognised through profit or loss.
Where a previously revalued asset is written down to its recoverable amount, the loss is recognised as a revaluation decrement through other comprehensive income.

AN
NU
AL
RE
PO
RT
2018
SO
UTH
METR
OP
OLITA
N TA
FE
58
SIGNIFICANT ISSUES IMPACTING THE AGENCYAGENCY PERFORMANCE
DISCLOSURES AND LEGAL COMPLIANCEOVERVIEW OF THE AGENCY
4.1.1 Depreciation and impairmentCharge for the period
2018 2017DepreciationBuildings 5,473,050 4,641,271 Leasehold improvements ‐ buildings 432,950 860,747 Motor vehicles, caravans and trailers 71,740 71,086 Plant, furniture and general equipment 1,381,563 1,372,067 Computers and communication network 1,086,561 787,651 Marine craft 74,046 18,095 Library Collection 182,363 ‐
4.1.1 Total depreciation for the period 8,702,273 7,750,917
As at 31 December 2018 there were no indications of impairment to property, plant and equipment.
All surplus assets at 31 December 2018 have either been classified as assets held for sale or written‐off.
Please refer to Note 4.2 Intangible assets for guidance in relation to the impartment assessment that has beenperformed for intangible assets.
Finite useful livesMost property, plant and equipment having a limited useful life are systematically depreciated over their estimated useful lives in a manner that reflects the consumption of their future economic benefits.
Depreciation is generally calculated on a straight line basis, at rates that allocate the asset’s value, less any estimated residual value, over its estimated useful life. Typical estimated useful lives for the different asset classes for current and prior years are included in the table below:
Asset Useful life: yearsBuilding 40 yearsLeasehold improvements 1 to 2 yearsMotor vehicles, caravans and trailers 1 to 25 yearsPlant, furniture and general equipment 1 to 30 yearsComputer and communication equipment 1 to 14 yearsMarine craft 5 to 8 years
The estimated useful lives, residual values and depreciation method are reviewed at the end of each annual reporting period, and adjustments should be made where appropriate.
Leasehold improvements are depreciated over the shorter of the lease term and their useful lives.
Land and works of art, which are considered to have an indefinite life, are not depreciated. Depreciation is not recognised in respect of these assets because their service potential has not, in any material sense, been consumed during the reporting period.
Under the College capitalisation policy, the library collection is recognised as a grouped asset at year end in accordancewith Treasurer’s Instruction 1101, and depreciated under a rolling depreciation methodology. Purchases in a givenyear are 100% depreciated in the fifth year following purchase and derecognised in the seventh year following purchase.
Under the College capitalisation policy, like Computer equipment items, less than the capitalisation thresholdis recognised as a grouped asset at year end in accordance with Treasurer’s Instruction 1101. Purchases in a given year are depreciated over future years in line with standard college depreciation rates.
ImpairmentNon‐financial assets, including items of property, plant and equipment, are tested for impairment whenever there is an indication that the asset may be impaired. Where there is an indication of impairment, the recoverable amount is estimated. Where the recoverable amount is less than the carrying amount, the asset is considered impaired and is written down to the recoverable amount and an impairment loss is recognised.
Where an asset measured at cost is written down to its recoverable amount, an impairment loss is recognised through profit or loss.
Where a previously revalued asset is written down to its recoverable amount, the loss is recognised as a revaluation decrement through other comprehensive income.
As SM TAFE is a not‐for‐profit entity, the recoverable amount of regularly revalued specialised assets is anticipatedto be materially the same as fair value.
If there is an indication that there has been a reversal in impairment, the carrying amount shall be increased to its recoverable amount. However this reversal should not increase the asset’s carrying amount above what would have been determined, net of depreciation or amortisation, if no impairment loss had been recognised in prior years.
The risk of impairment is generally limited to circumstances where an asset’s depreciation is materially understated, where the replacement cost is falling or where there is a significant change in useful life. Each relevant class of assets is reviewed annually to verify that the accumulated depreciation/amortisation reflects the level of future consumption or expiration of the asset’s economic benefits and to evaluate any impairment risk from declining replacement costs.
4.2 Intangible assets
Year ended 31 December 2018
Computer software and
licences1 January 2018Cost/gross carrying amount 383,983 Accumulated amortisation (302,459) Carrying amount at start of period 81,524
Additions 34,560 Amortisation expense (84,207) Carrying amount at 31 December 2018 31,877
Initial recognitionAcquisitions of intangible assets costing $5,000 or more and internally generated intangible assets costing$5,000 or more that comply with the recognition criteria as per AASB 138.57 (as noted below), are capitalised.
Costs incurred below these thresholds are immediately expensed directly to the Statement of Comprehensive Income.
Intangible assets are initially recognised at cost. For assets acquired at no cost or for nominal cost, the cost is their fair value at the date of acquisition.
An internally generated intangible asset arising from development (or from the development phase of an internal project) is recognised if, and only if, all of the following are demonstrated:(a) The technical feasibility of completing the intangible asset so that it will be available for use or sale;(b) An intention to complete the intangible asset and use or sell it;(c) The ability to use or sell the intangible asset;(d) The intangible asset will generate probable future economic benefit;(e) The availability of adequate technical, financial and other resources to complete the development and to use or sell the intangible asset;(f) The ability to measure reliably the expenditure attributable to the intangible asset during its development.Costs incurred in the research phase of a project are immediately expensed.
Subsequent measurementThe cost model is applied for subsequent measurement of intangible assets, requiring the asset to be carried at costless any accumulated amortisation and accumulated impairment losses.
4.2.1 Amortisation and impairmentCharge for the period
2018 2017AmortisationComputer software 84,207 171,343
4.2.1 Total amortisation for the period 84,207 171,343
As at 31 December 2018 there were no indications of impairment to intangible assets.
SM TAFE held no goodwill or intangible assets with an indefinite useful life during the reporting period.
Amortisation of finite life intangible assets is calculated on a straight line basis at rates that allocate the asset’s value over its estimated useful life. All intangible assets controlled by SM TAFE have a finite useful life and zeroresidual value. Estimated useful lives are reviewed annually.
The estimated useful life for intangible assets are:Computer software (a) 3 to 5 years(a) Software that is not integral to the operation of any related hardware.

AN
NU
AL
RE
PO
RT
2018
SO
UTH
METR
OP
OLITA
N TA
FE
59
SIGNIFICANT ISSUES IMPACTING THE AGENCYAGENCY PERFORMANCE
DISCLOSURES AND LEGAL COMPLIANCEOVERVIEW OF THE AGENCY
As SM TAFE is a not‐for‐profit entity, the recoverable amount of regularly revalued specialised assets is anticipatedto be materially the same as fair value.
If there is an indication that there has been a reversal in impairment, the carrying amount shall be increased to its recoverable amount. However this reversal should not increase the asset’s carrying amount above what would have been determined, net of depreciation or amortisation, if no impairment loss had been recognised in prior years.
The risk of impairment is generally limited to circumstances where an asset’s depreciation is materially understated, where the replacement cost is falling or where there is a significant change in useful life. Each relevant class of assets is reviewed annually to verify that the accumulated depreciation/amortisation reflects the level of future consumption or expiration of the asset’s economic benefits and to evaluate any impairment risk from declining replacement costs.
4.2 Intangible assets
Year ended 31 December 2018
Computer software and
licences1 January 2018Cost/gross carrying amount 383,983 Accumulated amortisation (302,459) Carrying amount at start of period 81,524
Additions 34,560 Amortisation expense (84,207) Carrying amount at 31 December 2018 31,877
Initial recognitionAcquisitions of intangible assets costing $5,000 or more and internally generated intangible assets costing$5,000 or more that comply with the recognition criteria as per AASB 138.57 (as noted below), are capitalised.
Costs incurred below these thresholds are immediately expensed directly to the Statement of Comprehensive Income.
Intangible assets are initially recognised at cost. For assets acquired at no cost or for nominal cost, the cost is their fair value at the date of acquisition.
An internally generated intangible asset arising from development (or from the development phase of an internal project) is recognised if, and only if, all of the following are demonstrated:(a) The technical feasibility of completing the intangible asset so that it will be available for use or sale;(b) An intention to complete the intangible asset and use or sell it;(c) The ability to use or sell the intangible asset;(d) The intangible asset will generate probable future economic benefit;(e) The availability of adequate technical, financial and other resources to complete the development and to use or sell the intangible asset;(f) The ability to measure reliably the expenditure attributable to the intangible asset during its development.Costs incurred in the research phase of a project are immediately expensed.
Subsequent measurementThe cost model is applied for subsequent measurement of intangible assets, requiring the asset to be carried at costless any accumulated amortisation and accumulated impairment losses.
4.2.1 Amortisation and impairmentCharge for the period
2018 2017AmortisationComputer software 84,207 171,343
4.2.1 Total amortisation for the period 84,207 171,343
As at 31 December 2018 there were no indications of impairment to intangible assets.
SM TAFE held no goodwill or intangible assets with an indefinite useful life during the reporting period.
Amortisation of finite life intangible assets is calculated on a straight line basis at rates that allocate the asset’s value over its estimated useful life. All intangible assets controlled by SM TAFE have a finite useful life and zeroresidual value. Estimated useful lives are reviewed annually.
The estimated useful life for intangible assets are:Computer software (a) 3 to 5 years(a) Software that is not integral to the operation of any related hardware.

AN
NU
AL
RE
PO
RT
2018
SO
UTH
METR
OP
OLITA
N TA
FE
60
SIGNIFICANT ISSUES IMPACTING THE AGENCYAGENCY PERFORMANCE
DISCLOSURES AND LEGAL COMPLIANCEOVERVIEW OF THE AGENCY
As SM TAFE is a not‐for‐profit entity, the recoverable amount of regularly revalued specialised assets is anticipatedto be materially the same as fair value.
If there is an indication that there has been a reversal in impairment, the carrying amount shall be increased to its recoverable amount. However this reversal should not increase the asset’s carrying amount above what would have been determined, net of depreciation or amortisation, if no impairment loss had been recognised in prior years.
The risk of impairment is generally limited to circumstances where an asset’s depreciation is materially understated, where the replacement cost is falling or where there is a significant change in useful life. Each relevant class of assets is reviewed annually to verify that the accumulated depreciation/amortisation reflects the level of future consumption or expiration of the asset’s economic benefits and to evaluate any impairment risk from declining replacement costs.
4.2 Intangible assets
Year ended 31 December 2018
Computer software and
licences1 January 2018Cost/gross carrying amount 383,983 Accumulated amortisation (302,459) Carrying amount at start of period 81,524
Additions 34,560 Amortisation expense (84,207) Carrying amount at 31 December 2018 31,877
Initial recognitionAcquisitions of intangible assets costing $5,000 or more and internally generated intangible assets costing$5,000 or more that comply with the recognition criteria as per AASB 138.57 (as noted below), are capitalised.
Costs incurred below these thresholds are immediately expensed directly to the Statement of Comprehensive Income.
Intangible assets are initially recognised at cost. For assets acquired at no cost or for nominal cost, the cost is their fair value at the date of acquisition.
An internally generated intangible asset arising from development (or from the development phase of an internal project) is recognised if, and only if, all of the following are demonstrated:(a) The technical feasibility of completing the intangible asset so that it will be available for use or sale;(b) An intention to complete the intangible asset and use or sell it;(c) The ability to use or sell the intangible asset;(d) The intangible asset will generate probable future economic benefit;(e) The availability of adequate technical, financial and other resources to complete the development and to use or sell the intangible asset;(f) The ability to measure reliably the expenditure attributable to the intangible asset during its development.Costs incurred in the research phase of a project are immediately expensed.
Subsequent measurementThe cost model is applied for subsequent measurement of intangible assets, requiring the asset to be carried at costless any accumulated amortisation and accumulated impairment losses.
4.2.1 Amortisation and impairmentCharge for the period
2018 2017AmortisationComputer software 84,207 171,343
4.2.1 Total amortisation for the period 84,207 171,343
As at 31 December 2018 there were no indications of impairment to intangible assets.
SM TAFE held no goodwill or intangible assets with an indefinite useful life during the reporting period.
Amortisation of finite life intangible assets is calculated on a straight line basis at rates that allocate the asset’s value over its estimated useful life. All intangible assets controlled by SM TAFE have a finite useful life and zeroresidual value. Estimated useful lives are reviewed annually.
The estimated useful life for intangible assets are:Computer software (a) 3 to 5 years(a) Software that is not integral to the operation of any related hardware.
Impairment of intangible assetsIntangible assets with finite useful lives are tested for impairment annually or when an indication of impairmentis identified. The policy in connection with testing for impairment is outlined in Note 4.1.1 Depreciation and impair‐ment.
5 Other assets and liabilitiesThis section sets out those assets and liabilities that arose from SM TAFE’s controlled operations and includesother assets utilised for economic benefits and liabilities incurred during normal operations:
Notes 2018 2017Receivables 5.1 4,770,522 3,220,162 Other assets 5.2 1,023,036 1,178,811 Payables 5.3 2,768,777 3,181,239 Other liabilities 5.4 86,569 2,929,650
5.1 Receivables2018 2017
CurrentReceivables ‐ Trade 1,513,839 2,359,726 Receivables ‐ Students 1,318,042 1,173,397 Allowance for impairment of receivables (394,494) (1,438,957) Accrued revenue 2,013,349 784,236 GST receivable 319,764 341,734
4,770,500 3,220,136 Advances:Other debtors 23 27
23 27 5.1c Total current 4,770,523 3,220,163 5.1 Total receivables 4,770,523 3,220,163
Receivables are recognised at original invoice amount less any allowances for uncollectible amounts (i.e. impairment).The carrying amount of net receivables is equivalent to fair value as it is due for settlement within 30 days.
5.2 Other assets2018 2017
CurrentPrepayments 1,021,583 1,178,811 Other 1,453 ‐
5.2c Total current 1,023,036 1,178,811 5.2 Balance at end of period 1,023,036 1,178,811
Other non‐financial assets include prepayments which represent payments in advance of receipt of goods or services or that part of expenditure made in one accounting period covering a term extending beyond that period.
5.3 Payables2018 2017
CurrentTrade payables 100,193 88,566 Accrued expenses 1,533,943 2,121,154 Accrued salaries and related costs 1,128,742 964,290 Paid parental leave payable 5,899 7,228
5.3c Total current 2,768,777 3,181,238 5.3 Balance at end of period 2,768,777 3,181,238
Payables are recognised at the amounts payable when SM TAFE becomes obliged to make future payments as aresult of a purchase of assets or services. The carrying amount is equivalent to fair value, as settlement is generally within 30 days.
Accrued salaries represent the amount due to staff but unpaid at the end of the reporting period. Accrued salaries are settled within a fortnight of the reporting period end. SM TAFE considers the carrying amount of accrued salariesto be equivalent to its fair value.
The accrued salaries suspense account (see Note 6.1 Cash and cash equivalents) consists of amounts paid annuallyfrom SM TAFE appropriations for salaries expense, into a Treasury suspense account to meet the additional cashoutflow for employee salary payments in reporting periods with 27 pay days instead of the normal 26 pay days.No interest is received on this account.

AN
NU
AL
RE
PO
RT
2018
SO
UTH
METR
OP
OLITA
N TA
FE
61
SIGNIFICANT ISSUES IMPACTING THE AGENCYAGENCY PERFORMANCE
DISCLOSURES AND LEGAL COMPLIANCEOVERVIEW OF THE AGENCY
Impairment of intangible assetsIntangible assets with finite useful lives are tested for impairment annually or when an indication of impairmentis identified. The policy in connection with testing for impairment is outlined in Note 4.1.1 Depreciation and impair‐ment.
5 Other assets and liabilitiesThis section sets out those assets and liabilities that arose from SM TAFE’s controlled operations and includesother assets utilised for economic benefits and liabilities incurred during normal operations:
Notes 2018 2017Receivables 5.1 4,770,522 3,220,162 Other assets 5.2 1,023,036 1,178,811 Payables 5.3 2,768,777 3,181,239 Other liabilities 5.4 86,569 2,929,650
5.1 Receivables2018 2017
CurrentReceivables ‐ Trade 1,513,839 2,359,726 Receivables ‐ Students 1,318,042 1,173,397 Allowance for impairment of receivables (394,494) (1,438,957) Accrued revenue 2,013,349 784,236 GST receivable 319,764 341,734
4,770,500 3,220,136 Advances:Other debtors 23 27
23 27 5.1c Total current 4,770,523 3,220,163 5.1 Total receivables 4,770,523 3,220,163
Receivables are recognised at original invoice amount less any allowances for uncollectible amounts (i.e. impairment).The carrying amount of net receivables is equivalent to fair value as it is due for settlement within 30 days.
5.2 Other assets2018 2017
CurrentPrepayments 1,021,583 1,178,811 Other 1,453 ‐
5.2c Total current 1,023,036 1,178,811 5.2 Balance at end of period 1,023,036 1,178,811
Other non‐financial assets include prepayments which represent payments in advance of receipt of goods or services or that part of expenditure made in one accounting period covering a term extending beyond that period.
5.3 Payables2018 2017
CurrentTrade payables 100,193 88,566 Accrued expenses 1,533,943 2,121,154 Accrued salaries and related costs 1,128,742 964,290 Paid parental leave payable 5,899 7,228
5.3c Total current 2,768,777 3,181,238 5.3 Balance at end of period 2,768,777 3,181,238
Payables are recognised at the amounts payable when SM TAFE becomes obliged to make future payments as aresult of a purchase of assets or services. The carrying amount is equivalent to fair value, as settlement is generally within 30 days.
Accrued salaries represent the amount due to staff but unpaid at the end of the reporting period. Accrued salaries are settled within a fortnight of the reporting period end. SM TAFE considers the carrying amount of accrued salariesto be equivalent to its fair value.
The accrued salaries suspense account (see Note 6.1 Cash and cash equivalents) consists of amounts paid annuallyfrom SM TAFE appropriations for salaries expense, into a Treasury suspense account to meet the additional cashoutflow for employee salary payments in reporting periods with 27 pay days instead of the normal 26 pay days.No interest is received on this account.

AN
NU
AL
RE
PO
RT
2018
SO
UTH
METR
OP
OLITA
N TA
FE
62
SIGNIFICANT ISSUES IMPACTING THE AGENCYAGENCY PERFORMANCE
DISCLOSURES AND LEGAL COMPLIANCEOVERVIEW OF THE AGENCY
Impairment of intangible assetsIntangible assets with finite useful lives are tested for impairment annually or when an indication of impairmentis identified. The policy in connection with testing for impairment is outlined in Note 4.1.1 Depreciation and impair‐ment.
5 Other assets and liabilitiesThis section sets out those assets and liabilities that arose from SM TAFE’s controlled operations and includesother assets utilised for economic benefits and liabilities incurred during normal operations:
Notes 2018 2017Receivables 5.1 4,770,522 3,220,162 Other assets 5.2 1,023,036 1,178,811 Payables 5.3 2,768,777 3,181,239 Other liabilities 5.4 86,569 2,929,650
5.1 Receivables2018 2017
CurrentReceivables ‐ Trade 1,513,839 2,359,726 Receivables ‐ Students 1,318,042 1,173,397 Allowance for impairment of receivables (394,494) (1,438,957) Accrued revenue 2,013,349 784,236 GST receivable 319,764 341,734
4,770,500 3,220,136 Advances:Other debtors 23 27
23 27 5.1c Total current 4,770,523 3,220,163 5.1 Total receivables 4,770,523 3,220,163
Receivables are recognised at original invoice amount less any allowances for uncollectible amounts (i.e. impairment).The carrying amount of net receivables is equivalent to fair value as it is due for settlement within 30 days.
5.2 Other assets2018 2017
CurrentPrepayments 1,021,583 1,178,811 Other 1,453 ‐
5.2c Total current 1,023,036 1,178,811 5.2 Balance at end of period 1,023,036 1,178,811
Other non‐financial assets include prepayments which represent payments in advance of receipt of goods or services or that part of expenditure made in one accounting period covering a term extending beyond that period.
5.3 Payables2018 2017
CurrentTrade payables 100,193 88,566 Accrued expenses 1,533,943 2,121,154 Accrued salaries and related costs 1,128,742 964,290 Paid parental leave payable 5,899 7,228
5.3c Total current 2,768,777 3,181,238 5.3 Balance at end of period 2,768,777 3,181,238
Payables are recognised at the amounts payable when SM TAFE becomes obliged to make future payments as aresult of a purchase of assets or services. The carrying amount is equivalent to fair value, as settlement is generally within 30 days.
Accrued salaries represent the amount due to staff but unpaid at the end of the reporting period. Accrued salaries are settled within a fortnight of the reporting period end. SM TAFE considers the carrying amount of accrued salariesto be equivalent to its fair value.
The accrued salaries suspense account (see Note 6.1 Cash and cash equivalents) consists of amounts paid annuallyfrom SM TAFE appropriations for salaries expense, into a Treasury suspense account to meet the additional cashoutflow for employee salary payments in reporting periods with 27 pay days instead of the normal 26 pay days.No interest is received on this account.
5.4 Other liabilities2018 2017
CurrentIncome received in advance (a) 79,621 265,742 Monies/deposits held in trust 6,948 6,269 Amount payable to North Metropolitan TAFE for current leave liabilities ‐ 2,657,640
5.4 Balance at end of period 86,569 2,929,651
(a) Includes unspent funds provided under the VET Student Loan arrangements not yet allocated to student enrolments and income received in advance from students.
6 FinancingThis section sets out the material balances and disclosures associated with the financing and cashflows of SM TAFE.
NotesCash and cash equivalents 6.1 Commitments 6.2 Non‐cancellable operating lease commitments 6.2.1Capital commitments 6.2.2
6.1 Cash and cash equivalents2018 2017
CurrentCash and cash equivalentsCash On Hand 18,610 19,860 Cash At Bank 37,904,708 35,664,647
6.1c Total cash and cash equivalents 37,923,318 35,684,507
Restricted cash and cash equivalents current Capital works grants received from Department of Training and Workforce Development 926,588 2,719,321
6.1r Total restricted cash and cash equivalents current 926,588 2,719,321 Total current 38,849,906 38,403,828
Non‐currentRestricted cash and cash equivalents non‐currentAccrued salaries suspense account (27th pay provision) (a) 1,279,045 1,088,916
6.1n Total non‐current 1,279,045 1,088,916 Balance at end of period 40,128,951 39,492,744
(a) Represents an amount set aside for the 27th pay occuring in the year 2025.
For the purpose of the statement of cash flows, cash and cash equivalent (and restricted cash and cash equivalent) assets comprise cash on hand and short‐term deposits with original maturities of three months or less that are readily convertible to a known amount of cash and which are subject to insignificant risk of changes in value.
6.2 Commitments
6.2.1 Non‐cancellable operating lease commitments2018 2017
Commitments for minimum lease payments are payable as follows:Within 1 year 1,326,455 1,357,484 Later than 1 year and not later than 5 years 3,485,987 2,702,760 Later than 5 years 4,007,914 2,856,646
6.2.1 8,820,356 6,916,890
Operating leases are expensed on a straight line basis over the lease term as this represents the pattern of benefits derived from the leased properties.
6.2.2 Capital commitments2018 2017
Capital expenditure commitments, being contracted capital expenditure additionalto the amounts reported in the financial statements, are payable as follows: ‐ ‐ Within 1 year 4,630 111,144 Later than 1 year and not later than 5 years ‐ ‐ Later than 5 years ‐ ‐
6.2.2 4,630 111,144 The totals presented for capital commitments are GST inclusive.
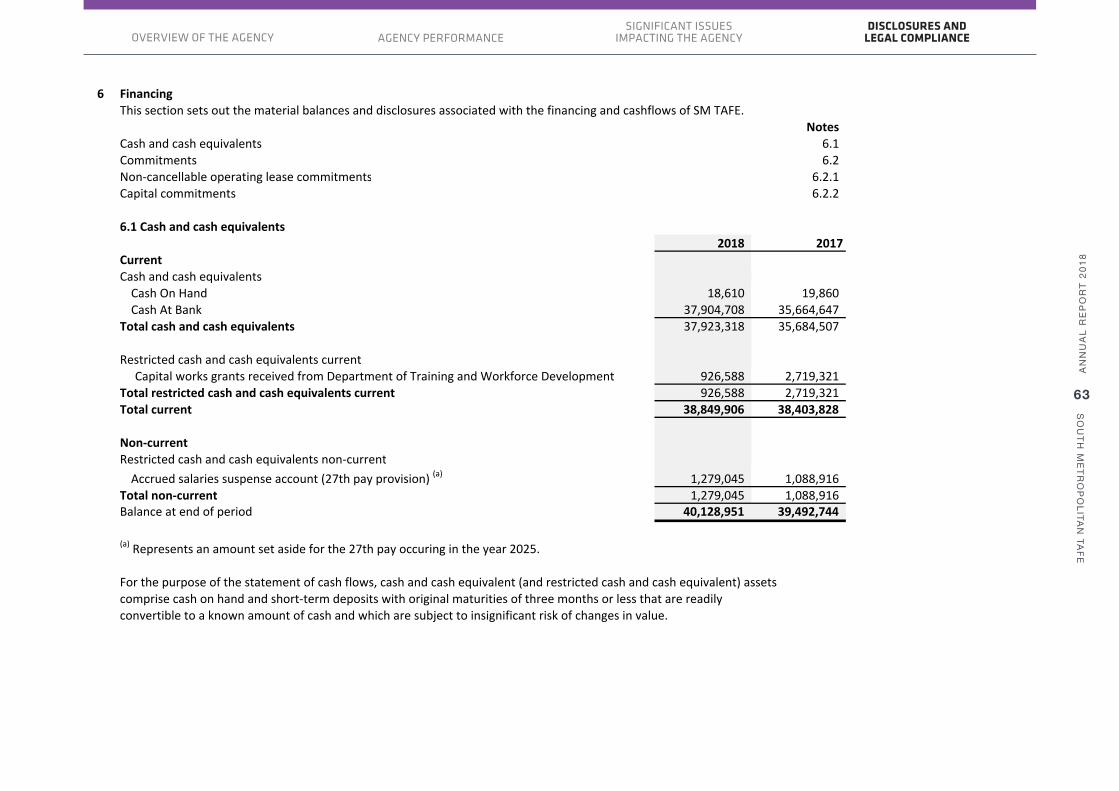
AN
NU
AL
RE
PO
RT
2018
SO
UTH
METR
OP
OLITA
N TA
FE
63
SIGNIFICANT ISSUES IMPACTING THE AGENCYAGENCY PERFORMANCE
DISCLOSURES AND LEGAL COMPLIANCEOVERVIEW OF THE AGENCY
5.4 Other liabilities2018 2017
CurrentIncome received in advance (a) 79,621 265,742 Monies/deposits held in trust 6,948 6,269 Amount payable to North Metropolitan TAFE for current leave liabilities ‐ 2,657,640
5.4 Balance at end of period 86,569 2,929,651
(a) Includes unspent funds provided under the VET Student Loan arrangements not yet allocated to student enrolments and income received in advance from students.
6 FinancingThis section sets out the material balances and disclosures associated with the financing and cashflows of SM TAFE.
NotesCash and cash equivalents 6.1 Commitments 6.2 Non‐cancellable operating lease commitments 6.2.1Capital commitments 6.2.2
6.1 Cash and cash equivalents2018 2017
CurrentCash and cash equivalentsCash On Hand 18,610 19,860 Cash At Bank 37,904,708 35,664,647
6.1c Total cash and cash equivalents 37,923,318 35,684,507
Restricted cash and cash equivalents current Capital works grants received from Department of Training and Workforce Development 926,588 2,719,321
6.1r Total restricted cash and cash equivalents current 926,588 2,719,321 Total current 38,849,906 38,403,828
Non‐currentRestricted cash and cash equivalents non‐currentAccrued salaries suspense account (27th pay provision) (a) 1,279,045 1,088,916
6.1n Total non‐current 1,279,045 1,088,916 Balance at end of period 40,128,951 39,492,744
(a) Represents an amount set aside for the 27th pay occuring in the year 2025.
For the purpose of the statement of cash flows, cash and cash equivalent (and restricted cash and cash equivalent) assets comprise cash on hand and short‐term deposits with original maturities of three months or less that are readily convertible to a known amount of cash and which are subject to insignificant risk of changes in value.
6.2 Commitments
6.2.1 Non‐cancellable operating lease commitments2018 2017
Commitments for minimum lease payments are payable as follows:Within 1 year 1,326,455 1,357,484 Later than 1 year and not later than 5 years 3,485,987 2,702,760 Later than 5 years 4,007,914 2,856,646
6.2.1 8,820,356 6,916,890
Operating leases are expensed on a straight line basis over the lease term as this represents the pattern of benefits derived from the leased properties.
6.2.2 Capital commitments2018 2017
Capital expenditure commitments, being contracted capital expenditure additionalto the amounts reported in the financial statements, are payable as follows: ‐ ‐ Within 1 year 4,630 111,144 Later than 1 year and not later than 5 years ‐ ‐ Later than 5 years ‐ ‐
6.2.2 4,630 111,144 The totals presented for capital commitments are GST inclusive.

AN
NU
AL
RE
PO
RT
2018
SO
UTH
METR
OP
OLITA
N TA
FE
64
SIGNIFICANT ISSUES IMPACTING THE AGENCYAGENCY PERFORMANCE
DISCLOSURES AND LEGAL COMPLIANCEOVERVIEW OF THE AGENCY
5.4 Other liabilities2018 2017
CurrentIncome received in advance (a) 79,621 265,742 Monies/deposits held in trust 6,948 6,269 Amount payable to North Metropolitan TAFE for current leave liabilities ‐ 2,657,640
5.4 Balance at end of period 86,569 2,929,651
(a) Includes unspent funds provided under the VET Student Loan arrangements not yet allocated to student enrolments and income received in advance from students.
6 FinancingThis section sets out the material balances and disclosures associated with the financing and cashflows of SM TAFE.
NotesCash and cash equivalents 6.1 Commitments 6.2 Non‐cancellable operating lease commitments 6.2.1Capital commitments 6.2.2
6.1 Cash and cash equivalents2018 2017
CurrentCash and cash equivalentsCash On Hand 18,610 19,860 Cash At Bank 37,904,708 35,664,647
6.1c Total cash and cash equivalents 37,923,318 35,684,507
Restricted cash and cash equivalents current Capital works grants received from Department of Training and Workforce Development 926,588 2,719,321
6.1r Total restricted cash and cash equivalents current 926,588 2,719,321 Total current 38,849,906 38,403,828
Non‐currentRestricted cash and cash equivalents non‐currentAccrued salaries suspense account (27th pay provision) (a) 1,279,045 1,088,916
6.1n Total non‐current 1,279,045 1,088,916 Balance at end of period 40,128,951 39,492,744
(a) Represents an amount set aside for the 27th pay occuring in the year 2025.
For the purpose of the statement of cash flows, cash and cash equivalent (and restricted cash and cash equivalent) assets comprise cash on hand and short‐term deposits with original maturities of three months or less that are readily convertible to a known amount of cash and which are subject to insignificant risk of changes in value.
6.2 Commitments
6.2.1 Non‐cancellable operating lease commitments2018 2017
Commitments for minimum lease payments are payable as follows:Within 1 year 1,326,455 1,357,484 Later than 1 year and not later than 5 years 3,485,987 2,702,760 Later than 5 years 4,007,914 2,856,646
6.2.1 8,820,356 6,916,890
Operating leases are expensed on a straight line basis over the lease term as this represents the pattern of benefits derived from the leased properties.
6.2.2 Capital commitments2018 2017
Capital expenditure commitments, being contracted capital expenditure additionalto the amounts reported in the financial statements, are payable as follows: ‐ ‐ Within 1 year 4,630 111,144 Later than 1 year and not later than 5 years ‐ ‐ Later than 5 years ‐ ‐
6.2.2 4,630 111,144 The totals presented for capital commitments are GST inclusive.
Judgements made by management in applying accounting policies – operating lease commitments
SM TAFE has entered into a number of leases for buildings for branch office accommodation. Some of these leasesrelate to buildings of a temporary nature and it has been determined that the lessor retains substantially all therisks and rewards incidental to ownership. Accordingly, these leases have been classified as operating leases.
7 Financial Instruments and ContingenciesThis note sets out the key risk management policies and measurement techniques of SM TAFE.
NotesFinancial instruments 7.1 Contingent assets 7.2.1Contingent liabilities 7.2.2
7.1 Financial InstrumentsThe carrying amounts of each of the following categories of financial assets and financial liabilities at the end ofthe reporting period are:
2018 2017Financial assetsCash and cash equivalents 37,923,318 35,684,507 Restricted cash and cash equivalents 2,205,633 3,808,237 Receivables (a) 4,450,759 2,878,429 Total financial assets 44,579,710 42,371,173
Financial liabilitiesFinancial liabilities measured at amortised cost 2,768,777 3,181,238 Other current liabilities 6,948 2,663,909 Total financial liabilities 2,775,725 5,845,147 (a) The amount excludes GST recoverable from the ATO (statutory receivable).
7.2 Contingent assets and liabilitiesContingent assets and contingent liabilities are not recognised in the statement of financial position but are disclosed and, if quantifiable, are measured at the best estimate.
Contingent assets and liabilities are presented inclusive of GST receivable or payable respectively.
7.2.1 Contingent assetsSM TAFE has no contingent assets.
7.2.2 Contingent liabilitiesSM TAFE has no contingent liabilites.
8 Other disclosuresThis section includes additional material disclosures required by accounting standards or other pronouncements, for the understanding of this financial report.
NotesEvents occurring after the end of the reporting period 8.1 Initial application of Australian Accounting Standards 8.2 Key management personnel 8.3 Related parties 8.4 Related bodies 8.5 Affiliated bodies 8.6 Remuneration of auditors 8.7 Non‐current assets classified as held for distribution to owners 8.8 Equity 8.9 Supplementary financial information 8.10Explanatory statement 8.11
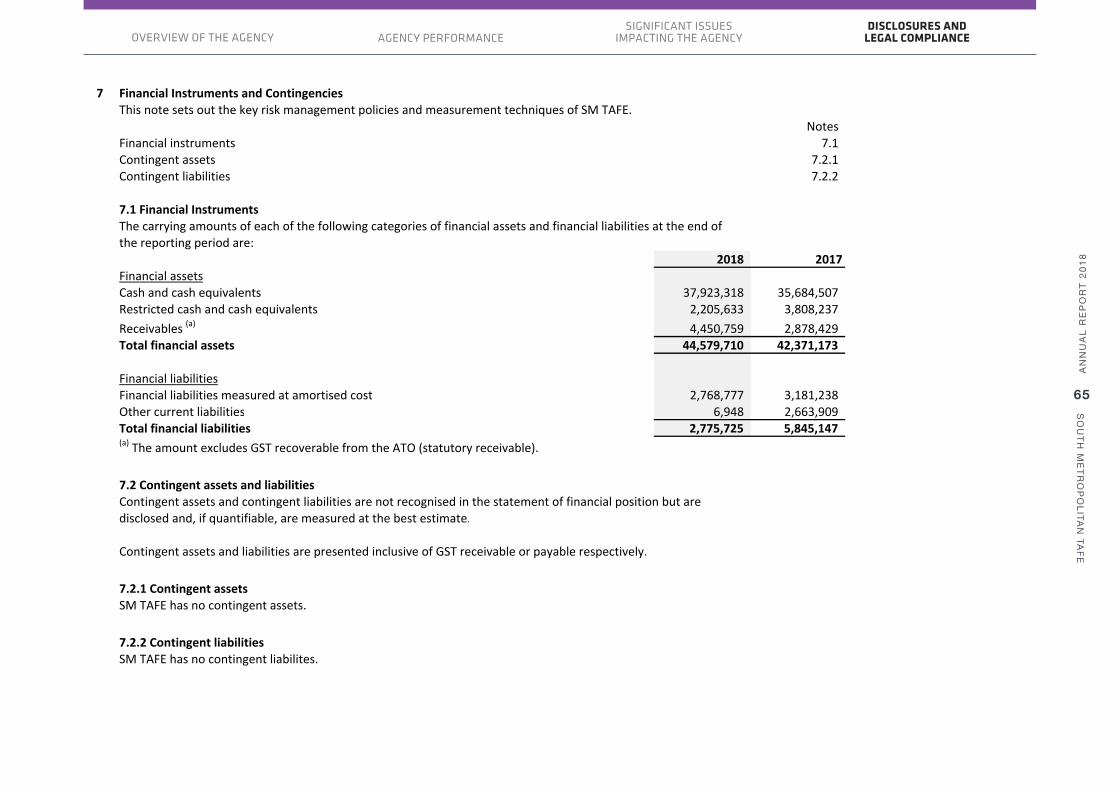
AN
NU
AL
RE
PO
RT
2018
SO
UTH
METR
OP
OLITA
N TA
FE
65
SIGNIFICANT ISSUES IMPACTING THE AGENCYAGENCY PERFORMANCE
DISCLOSURES AND LEGAL COMPLIANCEOVERVIEW OF THE AGENCY
Judgements made by management in applying accounting policies – operating lease commitments
SM TAFE has entered into a number of leases for buildings for branch office accommodation. Some of these leasesrelate to buildings of a temporary nature and it has been determined that the lessor retains substantially all therisks and rewards incidental to ownership. Accordingly, these leases have been classified as operating leases.
7 Financial Instruments and ContingenciesThis note sets out the key risk management policies and measurement techniques of SM TAFE.
NotesFinancial instruments 7.1 Contingent assets 7.2.1Contingent liabilities 7.2.2
7.1 Financial InstrumentsThe carrying amounts of each of the following categories of financial assets and financial liabilities at the end ofthe reporting period are:
2018 2017Financial assetsCash and cash equivalents 37,923,318 35,684,507 Restricted cash and cash equivalents 2,205,633 3,808,237 Receivables (a) 4,450,759 2,878,429 Total financial assets 44,579,710 42,371,173
Financial liabilitiesFinancial liabilities measured at amortised cost 2,768,777 3,181,238 Other current liabilities 6,948 2,663,909 Total financial liabilities 2,775,725 5,845,147 (a) The amount excludes GST recoverable from the ATO (statutory receivable).
7.2 Contingent assets and liabilitiesContingent assets and contingent liabilities are not recognised in the statement of financial position but are disclosed and, if quantifiable, are measured at the best estimate.
Contingent assets and liabilities are presented inclusive of GST receivable or payable respectively.
7.2.1 Contingent assetsSM TAFE has no contingent assets.
7.2.2 Contingent liabilitiesSM TAFE has no contingent liabilites.
8 Other disclosuresThis section includes additional material disclosures required by accounting standards or other pronouncements, for the understanding of this financial report.
NotesEvents occurring after the end of the reporting period 8.1 Initial application of Australian Accounting Standards 8.2 Key management personnel 8.3 Related parties 8.4 Related bodies 8.5 Affiliated bodies 8.6 Remuneration of auditors 8.7 Non‐current assets classified as held for distribution to owners 8.8 Equity 8.9 Supplementary financial information 8.10Explanatory statement 8.11
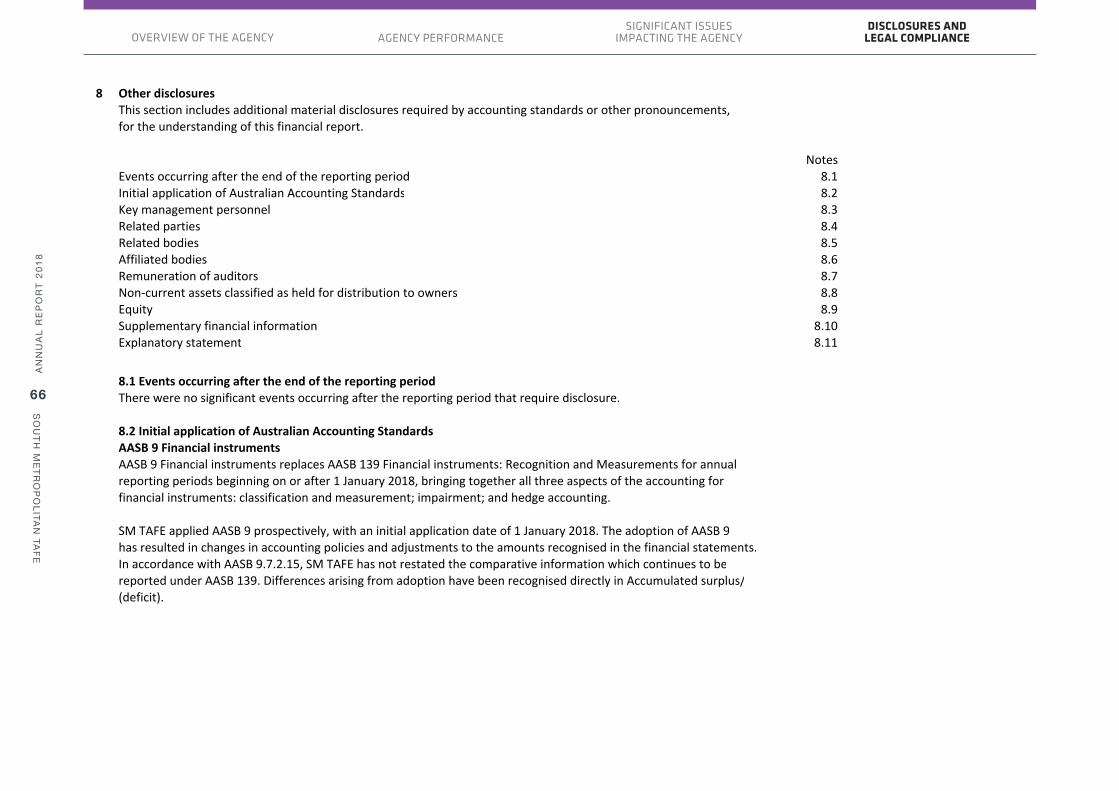
AN
NU
AL
RE
PO
RT
2018
SO
UTH
METR
OP
OLITA
N TA
FE
66
SIGNIFICANT ISSUES IMPACTING THE AGENCYAGENCY PERFORMANCE
DISCLOSURES AND LEGAL COMPLIANCEOVERVIEW OF THE AGENCY
Judgements made by management in applying accounting policies – operating lease commitments
SM TAFE has entered into a number of leases for buildings for branch office accommodation. Some of these leasesrelate to buildings of a temporary nature and it has been determined that the lessor retains substantially all therisks and rewards incidental to ownership. Accordingly, these leases have been classified as operating leases.
7 Financial Instruments and ContingenciesThis note sets out the key risk management policies and measurement techniques of SM TAFE.
NotesFinancial instruments 7.1 Contingent assets 7.2.1Contingent liabilities 7.2.2
7.1 Financial InstrumentsThe carrying amounts of each of the following categories of financial assets and financial liabilities at the end ofthe reporting period are:
2018 2017Financial assetsCash and cash equivalents 37,923,318 35,684,507 Restricted cash and cash equivalents 2,205,633 3,808,237 Receivables (a) 4,450,759 2,878,429 Total financial assets 44,579,710 42,371,173
Financial liabilitiesFinancial liabilities measured at amortised cost 2,768,777 3,181,238 Other current liabilities 6,948 2,663,909 Total financial liabilities 2,775,725 5,845,147 (a) The amount excludes GST recoverable from the ATO (statutory receivable).
7.2 Contingent assets and liabilitiesContingent assets and contingent liabilities are not recognised in the statement of financial position but are disclosed and, if quantifiable, are measured at the best estimate.
Contingent assets and liabilities are presented inclusive of GST receivable or payable respectively.
7.2.1 Contingent assetsSM TAFE has no contingent assets.
7.2.2 Contingent liabilitiesSM TAFE has no contingent liabilites.
8 Other disclosuresThis section includes additional material disclosures required by accounting standards or other pronouncements, for the understanding of this financial report.
NotesEvents occurring after the end of the reporting period 8.1 Initial application of Australian Accounting Standards 8.2 Key management personnel 8.3 Related parties 8.4 Related bodies 8.5 Affiliated bodies 8.6 Remuneration of auditors 8.7 Non‐current assets classified as held for distribution to owners 8.8 Equity 8.9 Supplementary financial information 8.10Explanatory statement 8.11
8.1 Events occurring after the end of the reporting periodThere were no significant events occurring after the reporting period that require disclosure.
8.2 Initial application of Australian Accounting StandardsAASB 9 Financial instrumentsAASB 9 Financial instruments replaces AASB 139 Financial instruments: Recognition and Measurements for annual reporting periods beginning on or after 1 January 2018, bringing together all three aspects of the accounting for financial instruments: classification and measurement; impairment; and hedge accounting.
SM TAFE applied AASB 9 prospectively, with an initial application date of 1 January 2018. The adoption of AASB 9has resulted in changes in accounting policies and adjustments to the amounts recognised in the financial statements.In accordance with AASB 9.7.2.15, SM TAFE has not restated the comparative information which continues to bereported under AASB 139. Differences arising from adoption have been recognised directly in Accumulated surplus/(deficit).
The effect of adopting AASB 9 as at 1 January 2018 was, as follows:Adjustments 1 January 2018
AssetsReceivables (a),(b) 871,096 Total Assets 871,096
Total adjustments on EquityAccumulated surplus/(deficit) (a),(b) 871,096
871,096
The nature of these adjustments are described below:
(a) Classification and measurementUnder AASB 9, financial assets are subsequently measured at amortised cost, fair value through other comprehensive income (fair value through OCI) or fair value through profit or loss (fair value through P/L). The classification is based on two criteria: SM TAFE’s business model for managing the assets; and whether the assets’ contractual cash flowsrepresent ‘solely payments of principal and interest’ on the principal amount outstanding.
The assessment of SM TAFE’s business model was made as of the date of initial application, 1 January 2018. Theassessment of whether contractual cash flows on financial assets are solely comprised of principal and interest was made based on the facts and circumstances as at the initial recognition of the assets.
The classification and measurement requirements of AASB 9 did not have a significant impact to SM TAFE. Thefollowing are the changes in the classification of SM TAFE’s financial assets:
• Receivables as at 31 December 2017 are held to collect contractual cash flows and give rise to cash flows representing solely payments of principal and interest. These are classified and measured as Financial assets at amortised cost beginning 1 January 2018• SM TAFE did not designate any financial assets as at fair value through P/L.
In summary, upon the adoption of AASB 9, SM TAFE had the following required (or elected) reclassifications as at 1 January 2018:
AASB 9 category
$Amortised cost
$
Fair value through OCI
$
Fair value through P/L
$AASB 139 categoryReceivables * 2,094,166 2,965,262 ‐ ‐
2,965,262 ‐ ‐ * The change in carrying amount is a result of reduced impairment allowance. See the discussion on impairmentbelow.
(b) ImpairmentThe adoption of AASB 9 has fundamentally changed SM TAFE’s accounting for impairment losses for financial assetsby replacing AASB 139’s incurred loss approach with a forward‐looking expected credit loss (ECL) approach. AASB 9 requires SM TAFE to recognise an allowance for ECLs for all financial assets not held at fair value through P/L.
Upon adoption of AASB 9, SM TAFE reduced the impairment on receivables by $871096which resulted in a decrease in Accumulated deficit of $871096 as at 1 January 2018.
Set out below is the reconciliation of the ending impairment allowances in accordance with AASB 139 to the openingloss allowances determined in accordance with AASB 9:
Impairment under AASB 139
as at 31 Dec 2017
$
Remeasure‐ment
$
ECL under AASB 9 as at 1 Jan 2018
$Receivables under AASB 139 / Financial assets at
amortised cost under AASB 9 1,438,957 (871,096) 567,861 1,438,957 (871,096) 567,861

AN
NU
AL
RE
PO
RT
2018
SO
UTH
METR
OP
OLITA
N TA
FE
67
SIGNIFICANT ISSUES IMPACTING THE AGENCYAGENCY PERFORMANCE
DISCLOSURES AND LEGAL COMPLIANCEOVERVIEW OF THE AGENCY
8.1 Events occurring after the end of the reporting periodThere were no significant events occurring after the reporting period that require disclosure.
8.2 Initial application of Australian Accounting StandardsAASB 9 Financial instrumentsAASB 9 Financial instruments replaces AASB 139 Financial instruments: Recognition and Measurements for annual reporting periods beginning on or after 1 January 2018, bringing together all three aspects of the accounting for financial instruments: classification and measurement; impairment; and hedge accounting.
SM TAFE applied AASB 9 prospectively, with an initial application date of 1 January 2018. The adoption of AASB 9has resulted in changes in accounting policies and adjustments to the amounts recognised in the financial statements.In accordance with AASB 9.7.2.15, SM TAFE has not restated the comparative information which continues to bereported under AASB 139. Differences arising from adoption have been recognised directly in Accumulated surplus/(deficit).
The effect of adopting AASB 9 as at 1 January 2018 was, as follows:Adjustments 1 January 2018
AssetsReceivables (a),(b) 871,096 Total Assets 871,096
Total adjustments on EquityAccumulated surplus/(deficit) (a),(b) 871,096
871,096
The nature of these adjustments are described below:
(a) Classification and measurementUnder AASB 9, financial assets are subsequently measured at amortised cost, fair value through other comprehensive income (fair value through OCI) or fair value through profit or loss (fair value through P/L). The classification is based on two criteria: SM TAFE’s business model for managing the assets; and whether the assets’ contractual cash flowsrepresent ‘solely payments of principal and interest’ on the principal amount outstanding.
The assessment of SM TAFE’s business model was made as of the date of initial application, 1 January 2018. Theassessment of whether contractual cash flows on financial assets are solely comprised of principal and interest was made based on the facts and circumstances as at the initial recognition of the assets.
The classification and measurement requirements of AASB 9 did not have a significant impact to SM TAFE. Thefollowing are the changes in the classification of SM TAFE’s financial assets:
• Receivables as at 31 December 2017 are held to collect contractual cash flows and give rise to cash flows representing solely payments of principal and interest. These are classified and measured as Financial assets at amortised cost beginning 1 January 2018• SM TAFE did not designate any financial assets as at fair value through P/L.
In summary, upon the adoption of AASB 9, SM TAFE had the following required (or elected) reclassifications as at 1 January 2018:
AASB 9 category
$Amortised cost
$
Fair value through OCI
$
Fair value through P/L
$AASB 139 categoryReceivables * 2,094,166 2,965,262 ‐ ‐
2,965,262 ‐ ‐ * The change in carrying amount is a result of reduced impairment allowance. See the discussion on impairmentbelow.
(b) ImpairmentThe adoption of AASB 9 has fundamentally changed SM TAFE’s accounting for impairment losses for financial assetsby replacing AASB 139’s incurred loss approach with a forward‐looking expected credit loss (ECL) approach. AASB 9 requires SM TAFE to recognise an allowance for ECLs for all financial assets not held at fair value through P/L.
Upon adoption of AASB 9, SM TAFE reduced the impairment on receivables by $871096which resulted in a decrease in Accumulated deficit of $871096 as at 1 January 2018.
Set out below is the reconciliation of the ending impairment allowances in accordance with AASB 139 to the openingloss allowances determined in accordance with AASB 9:
Impairment under AASB 139
as at 31 Dec 2017
$
Remeasure‐ment
$
ECL under AASB 9 as at 1 Jan 2018
$Receivables under AASB 139 / Financial assets at
amortised cost under AASB 9 1,438,957 (871,096) 567,861 1,438,957 (871,096) 567,861
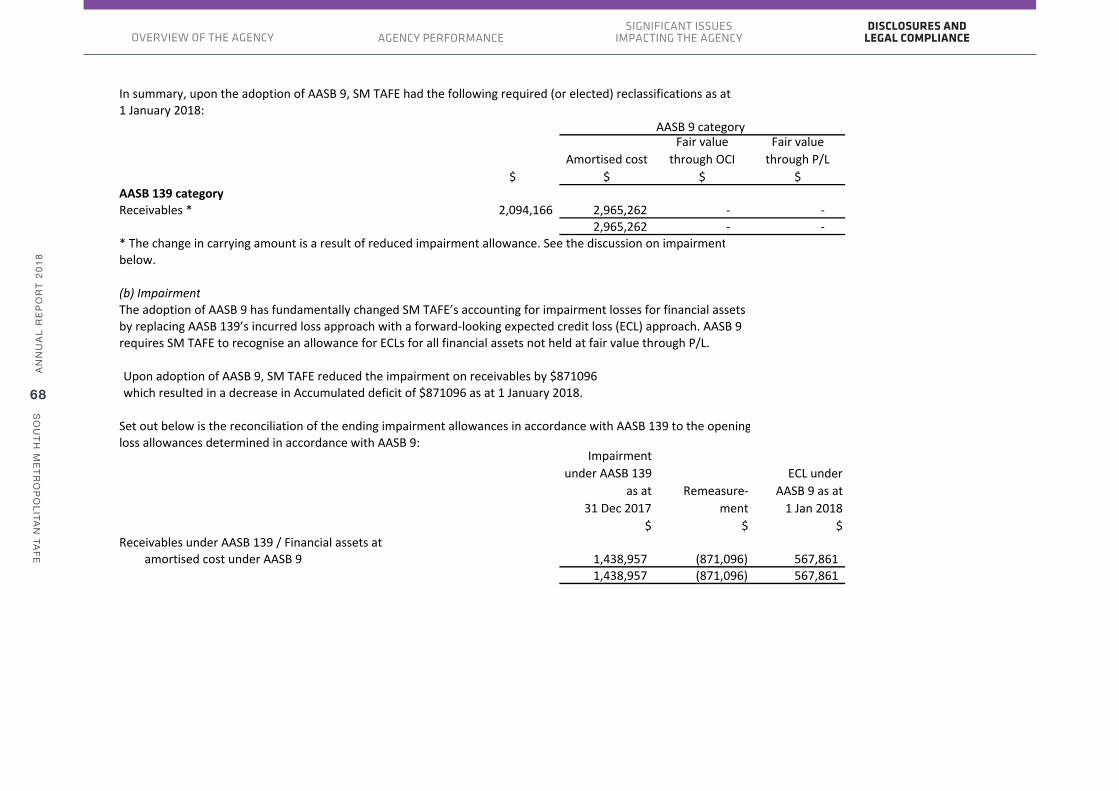
AN
NU
AL
RE
PO
RT
2018
SO
UTH
METR
OP
OLITA
N TA
FE
68
SIGNIFICANT ISSUES IMPACTING THE AGENCYAGENCY PERFORMANCE
DISCLOSURES AND LEGAL COMPLIANCEOVERVIEW OF THE AGENCY
8.1 Events occurring after the end of the reporting periodThere were no significant events occurring after the reporting period that require disclosure.
8.2 Initial application of Australian Accounting StandardsAASB 9 Financial instrumentsAASB 9 Financial instruments replaces AASB 139 Financial instruments: Recognition and Measurements for annual reporting periods beginning on or after 1 January 2018, bringing together all three aspects of the accounting for financial instruments: classification and measurement; impairment; and hedge accounting.
SM TAFE applied AASB 9 prospectively, with an initial application date of 1 January 2018. The adoption of AASB 9has resulted in changes in accounting policies and adjustments to the amounts recognised in the financial statements.In accordance with AASB 9.7.2.15, SM TAFE has not restated the comparative information which continues to bereported under AASB 139. Differences arising from adoption have been recognised directly in Accumulated surplus/(deficit).
The effect of adopting AASB 9 as at 1 January 2018 was, as follows:Adjustments 1 January 2018
AssetsReceivables (a),(b) 871,096 Total Assets 871,096
Total adjustments on EquityAccumulated surplus/(deficit) (a),(b) 871,096
871,096
The nature of these adjustments are described below:
(a) Classification and measurementUnder AASB 9, financial assets are subsequently measured at amortised cost, fair value through other comprehensive income (fair value through OCI) or fair value through profit or loss (fair value through P/L). The classification is based on two criteria: SM TAFE’s business model for managing the assets; and whether the assets’ contractual cash flowsrepresent ‘solely payments of principal and interest’ on the principal amount outstanding.
The assessment of SM TAFE’s business model was made as of the date of initial application, 1 January 2018. Theassessment of whether contractual cash flows on financial assets are solely comprised of principal and interest was made based on the facts and circumstances as at the initial recognition of the assets.
The classification and measurement requirements of AASB 9 did not have a significant impact to SM TAFE. Thefollowing are the changes in the classification of SM TAFE’s financial assets:
• Receivables as at 31 December 2017 are held to collect contractual cash flows and give rise to cash flows representing solely payments of principal and interest. These are classified and measured as Financial assets at amortised cost beginning 1 January 2018• SM TAFE did not designate any financial assets as at fair value through P/L.
In summary, upon the adoption of AASB 9, SM TAFE had the following required (or elected) reclassifications as at 1 January 2018:
AASB 9 category
$Amortised cost
$
Fair value through OCI
$
Fair value through P/L
$AASB 139 categoryReceivables * 2,094,166 2,965,262 ‐ ‐
2,965,262 ‐ ‐ * The change in carrying amount is a result of reduced impairment allowance. See the discussion on impairmentbelow.
(b) ImpairmentThe adoption of AASB 9 has fundamentally changed SM TAFE’s accounting for impairment losses for financial assetsby replacing AASB 139’s incurred loss approach with a forward‐looking expected credit loss (ECL) approach. AASB 9 requires SM TAFE to recognise an allowance for ECLs for all financial assets not held at fair value through P/L.
Upon adoption of AASB 9, SM TAFE reduced the impairment on receivables by $871096which resulted in a decrease in Accumulated deficit of $871096 as at 1 January 2018.
Set out below is the reconciliation of the ending impairment allowances in accordance with AASB 139 to the openingloss allowances determined in accordance with AASB 9:
Impairment under AASB 139
as at 31 Dec 2017
$
Remeasure‐ment
$
ECL under AASB 9 as at 1 Jan 2018
$Receivables under AASB 139 / Financial assets at
amortised cost under AASB 9 1,438,957 (871,096) 567,861 1,438,957 (871,096) 567,861

AN
NU
AL
RE
PO
RT
2018
SO
UTH
METR
OP
OLITA
N TA
FE
69
SIGNIFICANT ISSUES IMPACTING THE AGENCYAGENCY PERFORMANCE
DISCLOSURES AND LEGAL COMPLIANCEOVERVIEW OF THE AGENCY
8.3 Key management personnelSM TAFE has determined key management personnel to include the Responsible Minister, members of the Accountable Authority and senior officers of SM TAFE. SM TAFE does not incur expenditures to compensate the responsible Minister andthose disclosures may be found in the Annual Report on State Finances.
The total fees, salaries, superannuation, non‐monetary benefits and other benefits for senior officers and Council members of SM TAFE for the reporting period are presented within the following bands:
Compensation Band ($) 2018 2017260,001 ‐ 270,001 1 ‐ 210,001 ‐ 220,000 ‐ 1 200,001 ‐ 210,000 1 2 190,001 ‐ 200,000 1 1 180,001 ‐ 190,000 3 3 170,001 ‐ 180,000 1 1 160,001 ‐ 170,000 ‐ 1 150,001 ‐ 160,000 2 1 140,001 ‐ 150,000 1 2 130,001 ‐ 140,000 1 1 100,001 ‐ 110 000 1 ‐ 80,001 ‐ 90,000 1 1 70,001 ‐ 80,000 1 ‐ 60,001 ‐ 70,000 1 ‐ 20,001 ‐ 30,000 1 1 0 ‐ 10,000 8 5
Short‐term employee benefits 1,900,015 2,026,586 Post‐employment benefits 180,501 189,792 Other long‐term benefits 272,502 255,584 Total compensation of senior officers 2,353,018 2,471,962
Total compensation includes the superannuation expense incurred by SM TAFE in respect of senior officers.
8.4 Related partiesSM TAFE is a wholly owned public sector entity that is controlled by the State of Western Australia.
Related parties of SM TAFE include:• all cabinet ministers and their close family members, and their controlled or jointly controlled entities; • all senior officers and their close family members, and their controlled or jointly controlled entities;• other departments and statutory authorities, including related bodies included in the whole of government consolidated financial statements (i.e. wholly‐owned public sector entities);• associates and joint ventures of a wholly‐owned public sector entity; and• the Government Employees Superannuation Board (GESB).
Material transactions with other related partiesOutside of normal citizen type transactions with SM TAFE, there were no other related party transactions thatinvolved key management personnel and/or their close family members and/or their controlled (or jointlycontrolled) entities.
8.5 Related bodiesSM TAFE has no related bodies.
8.6 Affiliated bodiesSM TAFE has no affiliated bodies.
8.7 Remuneration of auditorsRemuneration paid or payable to the Auditor General in respect of the audit for the current financial year is as follows:
2018 2017Auditing the accounts, financial statements, controls and key performance indicators 173,000 173,000

AN
NU
AL
RE
PO
RT
2018
SO
UTH
METR
OP
OLITA
N TA
FE
70
SIGNIFICANT ISSUES IMPACTING THE AGENCYAGENCY PERFORMANCE
DISCLOSURES AND LEGAL COMPLIANCEOVERVIEW OF THE AGENCY
8.3 Key management personnelSM TAFE has determined key management personnel to include the Responsible Minister, members of the Accountable Authority and senior officers of SM TAFE. SM TAFE does not incur expenditures to compensate the responsible Minister andthose disclosures may be found in the Annual Report on State Finances.
The total fees, salaries, superannuation, non‐monetary benefits and other benefits for senior officers and Council members of SM TAFE for the reporting period are presented within the following bands:
Compensation Band ($) 2018 2017260,001 ‐ 270,001 1 ‐ 210,001 ‐ 220,000 ‐ 1 200,001 ‐ 210,000 1 2 190,001 ‐ 200,000 1 1 180,001 ‐ 190,000 3 3 170,001 ‐ 180,000 1 1 160,001 ‐ 170,000 ‐ 1 150,001 ‐ 160,000 2 1 140,001 ‐ 150,000 1 2 130,001 ‐ 140,000 1 1 100,001 ‐ 110 000 1 ‐ 80,001 ‐ 90,000 1 1 70,001 ‐ 80,000 1 ‐ 60,001 ‐ 70,000 1 ‐ 20,001 ‐ 30,000 1 1 0 ‐ 10,000 8 5
Short‐term employee benefits 1,900,015 2,026,586 Post‐employment benefits 180,501 189,792 Other long‐term benefits 272,502 255,584 Total compensation of senior officers 2,353,018 2,471,962
Total compensation includes the superannuation expense incurred by SM TAFE in respect of senior officers.
8.4 Related partiesSM TAFE is a wholly owned public sector entity that is controlled by the State of Western Australia.
Related parties of SM TAFE include:• all cabinet ministers and their close family members, and their controlled or jointly controlled entities; • all senior officers and their close family members, and their controlled or jointly controlled entities;• other departments and statutory authorities, including related bodies included in the whole of government consolidated financial statements (i.e. wholly‐owned public sector entities);• associates and joint ventures of a wholly‐owned public sector entity; and• the Government Employees Superannuation Board (GESB).
Material transactions with other related partiesOutside of normal citizen type transactions with SM TAFE, there were no other related party transactions thatinvolved key management personnel and/or their close family members and/or their controlled (or jointlycontrolled) entities.
8.5 Related bodiesSM TAFE has no related bodies.
8.6 Affiliated bodiesSM TAFE has no affiliated bodies.
8.7 Remuneration of auditorsRemuneration paid or payable to the Auditor General in respect of the audit for the current financial year is as follows:
2018 2017Auditing the accounts, financial statements, controls and key performance indicators 173,000 173,000
8.8 Non‐current assets classified as held for distribution to owners2018 2017
8.7 Transfer of the Murray House Cultural Precinct to the City of Melville currently awaiting 950,074 950,074 Ministerial approval.
Non‐current assets held for distribution to owners are recognised at the lower of carrying amount or fair value less cost to distribute and are disclosed separately in the Statement of Financial Position. Assets classified as held for distribution to ownersare not depreciated or amortised.
8.9 Equity2018 2017
Contributed equityBalance at start of period 369,223,643 388,489,397 Correction of prior period error (a) 1,530,616 ‐ Restated balance at start of period 370,754,259 388,489,397
Contributions by ownersCapital appropriation 1,149,162 ‐
Transfer of net assets from other agenciesTransfer of assets from other government agencies 4,572,129 52,319,237
8.8e Total contributions by owners 376,475,550 440,808,634
Distributions to ownersTransfer of assets to other government agencies (12,452,737) ‐ Net assets transferred to Government ‐ (71,584,991) Total distributions to owners (12,452,737) (71,584,991)
8.8c Balance at the end of period 364,022,813 369,223,642
(a) Reclassification of 2017 grants revenue to contributed equity in accordance with the determination by the Department of Training and Workforce Development under paragraph 8(c) of AASB Interpretation 1038 'Contribution by Owners Made to Wholly‐Owned Public Sector Entities.
Asset revaluation surplusBalance at start of period 60,026 ‐
Net revaluation increments Marine craft ‐ 60,026
8.8r Balance at end of period 60,026 60,026
8.10 Supplementary financial information(a) Write‐offsDuring the financial year, $568,936 (2017: $158,920) of debts due to SM TAFE were written off under the authority of:
2018 2017The accountable authority 568,936 158,920
568,936 158,920
(b) Losses through theft, defaults and other causes2018 2017
Losses of public money and public and other property through theft or defaults 130 604 Amounts recovered ‐ ‐
130 604

AN
NU
AL
RE
PO
RT
2018
SO
UTH
METR
OP
OLITA
N TA
FE
71
SIGNIFICANT ISSUES IMPACTING THE AGENCYAGENCY PERFORMANCE
DISCLOSURES AND LEGAL COMPLIANCEOVERVIEW OF THE AGENCY
8.8 Non‐current assets classified as held for distribution to owners2018 2017
8.7 Transfer of the Murray House Cultural Precinct to the City of Melville currently awaiting 950,074 950,074 Ministerial approval.
Non‐current assets held for distribution to owners are recognised at the lower of carrying amount or fair value less cost to distribute and are disclosed separately in the Statement of Financial Position. Assets classified as held for distribution to ownersare not depreciated or amortised.
8.9 Equity2018 2017
Contributed equityBalance at start of period 369,223,643 388,489,397
1,530,616 ‐ 370,754,259 388,489,397
1,149,162 ‐
Reclassification of grant revenue as contributed equity(a) Restated balance at start of period
Contributions by ownersCapital appropriation
Transfer of net assets from other agenciesTransfer of assets from other government agencies 4,572,129 52,319,237
8.8e Total contributions by owners 376,475,550 440,808,634
Distributions to ownersTransfer of assets to other government agencies (12,452,737) ‐ Net assets transferred to Government ‐ (71,584,991) Total distributions to owners (12,452,737) (71,584,991)
8.8c Balance at the end of period 364,022,813 369,223,642
(a) Reclassification of 2017 grants revenue to contributed equity in accordance with the determination by the Department of Training and Workforce Development under paragraph 8(c) of AASB Interpretation 1038 'Contribution by Owners Made toWholly‐Owned Public Sector Entities.
Asset revaluation surplusBalance at start of period 60,026 ‐
Net revaluation increments Marine craft ‐ 60,026
8.8r Balance at end of period 60,026 60,026
8.10 Supplementary financial information(a) Write‐offsDuring the financial year, $568,936 (2017: $158,920) of debts due to SM TAFE were written offunder the authority of:
2018 2017The accountable authority 568,936 158,920
568,936 158,920
(b) Losses through theft, defaults and other causes2018 2017
Losses of public money and public and other property through theft or defaults 130 604 Amounts recovered ‐ ‐
130 604

AN
NU
AL
RE
PO
RT
2018
SO
UTH
METR
OP
OLITA
N TA
FE
72
SIGNIFICANT ISSUES IMPACTING THE AGENCYAGENCY PERFORMANCE
DISCLOSURES AND LEGAL COMPLIANCEOVERVIEW OF THE AGENCY
8.8 Non‐current assets classified as held for distribution to owners2018 2017
8.7 Transfer of the Murray House Cultural Precinct to the City of Melville currently awaiting 950,074 950,074 Ministerial approval.
Non‐current assets held for distribution to owners are recognised at the lower of carrying amount or fair value less cost to distribute and are disclosed separately in the Statement of Financial Position. Assets classified as held for distribution to ownersare not depreciated or amortised.
8.9 Equity2018 2017
Contributed equityBalance at start of period 369,223,643 388,489,397 Correction of prior period error (a) 1,530,616 ‐ Restated balance at start of period 370,754,259 388,489,397
Contributions by ownersCapital appropriation 1,149,162 ‐
Transfer of net assets from other agenciesTransfer of assets from other government agencies 4,572,129 52,319,237
8.8e Total contributions by owners 376,475,550 440,808,634
Distributions to ownersTransfer of assets to other government agencies (12,452,737) ‐ Net assets transferred to Government ‐ (71,584,991) Total distributions to owners (12,452,737) (71,584,991)
8.8c Balance at the end of period 364,022,813 369,223,642
(a) Reclassification of 2017 grants revenue to contributed equity in accordance with the determination by the Department of Training and Workforce Development under paragraph 8(c) of AASB Interpretation 1038 'Contribution by Owners Made to Wholly‐Owned Public Sector Entities.
Asset revaluation surplusBalance at start of period 60,026 ‐
Net revaluation increments Marine craft ‐ 60,026
8.8r Balance at end of period 60,026 60,026
8.10 Supplementary financial information(a) Write‐offsDuring the financial year, $568,936 (2017: $158,920) of debts due to SM TAFE were written off under the authority of:
2018 2017The accountable authority 568,936 158,920
568,936 158,920
(b) Losses through theft, defaults and other causes2018 2017
Losses of public money and public and other property through theft or defaults 130 604 Amounts recovered ‐ ‐
130 604
8.11 Explanatory statement (Controlled Operations)All variances between estimates (original budget) and actual results for 2018, and between the actual results for 2018and 2017. Narratives are provided for key major variances, which are generally greater than:• 5% and $3.4 million for the Statements of comprehensive income and cash flows, and• 5% and $7.5 million for the Statement of financial position.
8.11.1 Statement of ComprehensiveIncome Variances
Variance Note Estimate 2018
$ Actual 2018
$ Actual 2017
$
Variance between
estimate and actual
$
Variance between actual results for 2018
and 2017$
ExpensesEmployee benefits expense 1 121,040,235 114,440,902 117,476,683 (6,599,333) (3,035,781) Grants and subsidies 250,000 397,297 453,105 147,297 (55,808) Supplies and services 31,141,741 31,584,904 33,046,010 443,163 (1,461,106) Asset revaluation decrement 5 ‐ 2,000,000 11,622,508 2,000,000 (9,622,508) Other expenses 10,882,189 11,187,618 11,284,351 305,429 (96,733) Cost of sales 200,000 234,758 244,324 34,758 (9,566)
assets ‐ 32,193 ‐ 32,193 32,193 Depreciation and amortisation expense 8,523,300 8,786,480 7,922,260 263,180 864,220
Total cost of services 172,037,465 168,664,152 182,049,241 (3,373,313) (13,385,089)
IncomeRevenueFee for service 2 28,951,094 24,742,929 27,848,058 (4,208,165) (3,105,129) Student fees and charges 26,705,374 23,744,365 24,144,340 (2,961,009) (399,975) Ancillary trading 1,600,004 1,333,504 1,727,613 (266,500) (394,109) Sales 25,000 368,595 367,669 343,595 926 Interest revenue 1,150,000 1,108,306 1,058,971 (41,694) 49,335 Other revenue 3,294,996 2,178,605 4,156,885 (1,116,391) (1,978,280) Total revenue 61,726,468 53,476,304 59,303,536 (8,250,164) (5,827,231)
GainsGain on disposal of non‐current assets ‐ ‐ 662 ‐ (662)
3,4 ‐ 2,514,158 ‐ 2,514,158 2,514,158 Total gains ‐ 2,514,158 662 2,514,158 2,513,496 Total income other than income from State Government 61,726,468 55,990,462 59,304,198 (5,736,006) (3,313,735)
NET COST OF SERVICES 110,310,997 112,673,690 122,745,043 2,362,693 (10,071,354)
Income from State GovernmentService appropriation 97,966,000 102,705,370 100,407,437 4,739,370 2,297,933 Services received free of charge 4,175,584 5,986,296 6,927,747 1,810,712 (941,451) Total income from State Government 102,141,584 108,691,666 107,335,184 6,550,082 1,356,482 SURPLUS/(DEFICIT) FOR THE PERIOD (8,169,413) (3,982,024) (15,409,859) 4,187,388 11,427,834
OTHER COMPREHENSIVE INCOMEItems not reclassified subsequently to profit or lossChanges in asset revaluation surplus ‐ ‐ 60,026 ‐ (60,026) Total other comprehensive income ‐ ‐ 60,026 ‐ (60,026) TOTAL COMPREHENSIVE DEFICIT FOR THE PERIOD (8,169,413) (3,982,024) (15,349,833) 4,187,388 11,367,809
Major Estimate and Actual (2018) Variance Narratives1) The Employee Benefits variance is due to structural realignment achieving reduced costs. 2) A decrease in international enrolments in 2018 is the key factor of the Fee For Service variance.3) Gain arising from changes in fair value ‐ buildings relates to revaluations for which a budget cannot be set.
Major Actual 2018 and Comparative (2017) Variance Narratives4) Gain arising from changes in fair value ‐ buildings reflects the building revaluation increments which did not occur in 2017.5) Only land received a revaluation decrement in 2018 and buildings were incremented.
Loss on disposal of non‐current
Gain arising from changes in fair value ‐ buildings

AN
NU
AL
RE
PO
RT
2018
SO
UTH
METR
OP
OLITA
N TA
FE
73
SIGNIFICANT ISSUES IMPACTING THE AGENCYAGENCY PERFORMANCE
DISCLOSURES AND LEGAL COMPLIANCEOVERVIEW OF THE AGENCY
8.11 Explanatory statement (Controlled Operations)All variances between estimates (original budget) and actual results for 2018, and between the actual results for 2018and 2017. Narratives are provided for key major variances, which are generally greater than:• 5% and $3.4 million for the Statements of comprehensive income and cash flows, and• 5% and $7.5 million for the Statement of financial position.
8.11.1 Statement of ComprehensiveIncome Variances
Variance Note Estimate 2018
$ Actual 2018
$ Actual 2017
$
Variance between
estimate and actual
$
Variance between actual results for 2018
and 2017$
ExpensesEmployee benefits expense 1 121,040,235 114,440,902 117,476,683 (6,599,333) (3,035,781) Grants and subsidies 250,000 397,297 453,105 147,297 (55,808) Supplies and services 31,141,741 31,584,904 33,046,010 443,163 (1,461,106) Asset revaluation decrement 5 ‐ 2,000,000 11,622,508 2,000,000 (9,622,508) Other expenses 10,882,189 11,187,618 11,284,351 305,429 (96,733) Cost of sales 200,000 234,758 244,324 34,758 (9,566)
assets ‐ 32,193 ‐ 32,193 32,193 Depreciation and amortisation expense 8,523,300 8,786,480 7,922,260 263,180 864,220
Total cost of services 172,037,465 168,664,152 182,049,241 (3,373,313) (13,385,089)
IncomeRevenueFee for service 2 28,951,094 24,742,929 27,848,058 (4,208,165) (3,105,129) Student fees and charges 26,705,374 23,744,365 24,144,340 (2,961,009) (399,975) Ancillary trading 1,600,004 1,333,504 1,727,613 (266,500) (394,109) Sales 25,000 368,595 367,669 343,595 926 Interest revenue 1,150,000 1,108,306 1,058,971 (41,694) 49,335 Other revenue 3,294,996 2,178,605 4,156,885 (1,116,391) (1,978,280) Total revenue 61,726,468 53,476,304 59,303,536 (8,250,164) (5,827,231)
GainsGain on disposal of non‐current assets ‐ ‐ 662 ‐ (662)
3,4 ‐ 2,514,158 ‐ 2,514,158 2,514,158 Total gains ‐ 2,514,158 662 2,514,158 2,513,496 Total income other than income from State Government 61,726,468 55,990,462 59,304,198 (5,736,006) (3,313,735)
NET COST OF SERVICES 110,310,997 112,673,690 122,745,043 2,362,693 (10,071,354)
Income from State GovernmentService appropriation 97,966,000 102,705,370 100,407,437 4,739,370 2,297,933 Services received free of charge 4,175,584 5,986,296 6,927,747 1,810,712 (941,451) Total income from State Government 102,141,584 108,691,666 107,335,184 6,550,082 1,356,482 SURPLUS/(DEFICIT) FOR THE PERIOD (8,169,413) (3,982,024) (15,409,859) 4,187,388 11,427,834
OTHER COMPREHENSIVE INCOMEItems not reclassified subsequently to profit or lossChanges in asset revaluation surplus ‐ ‐ 60,026 ‐ (60,026) Total other comprehensive income ‐ ‐ 60,026 ‐ (60,026) TOTAL COMPREHENSIVE DEFICIT FOR THE PERIOD (8,169,413) (3,982,024) (15,349,833) 4,187,388 11,367,809
Major Estimate and Actual (2018) Variance Narratives1) The Employee Benefits variance is due to structural realignment achieving reduced costs. 2) A decrease in international enrolments in 2018 is the key factor of the Fee For Service variance.3) Gain arising from changes in fair value ‐ buildings relates to revaluations for which a budget cannot be set.
Major Actual 2018 and Comparative (2017) Variance Narratives4) Gain arising from changes in fair value ‐ buildings reflects the building revaluation increments which did not occur in 2017.5) Only land received a revaluation decrement in 2018 and buildings were incremented.
Loss on disposal of non‐current
Gain arising from changes in fair value ‐ buildings

AN
NU
AL
RE
PO
RT
2018
SO
UTH
METR
OP
OLITA
N TA
FE
74
SIGNIFICANT ISSUES IMPACTING THE AGENCYAGENCY PERFORMANCE
DISCLOSURES AND LEGAL COMPLIANCEOVERVIEW OF THE AGENCY
8.11 Explanatory statement (Controlled Operations)All variances between estimates (original budget) and actual results for 2018, and between the actual results for 2018and 2017. Narratives are provided for key major variances, which are generally greater than:• 5% and $3.4 million for the Statements of comprehensive income and cash flows, and• 5% and $7.5 million for the Statement of financial position.
8.11.1 Statement of ComprehensiveIncome Variances
Variance Note Estimate 2018
$ Actual 2018
$ Actual 2017
$
Variance between
estimate and actual
$
Variance between actual results for 2018
and 2017$
ExpensesEmployee benefits expense 1 121,040,235 114,440,902 117,476,683 (6,599,333) (3,035,781) Grants and subsidies 250,000 397,297 453,105 147,297 (55,808) Supplies and services 31,141,741 31,584,904 33,046,010 443,163 (1,461,106) Asset revaluation decrement 5 ‐ 2,000,000 11,622,508 2,000,000 (9,622,508) Other expenses 10,882,189 11,187,618 11,284,351 305,429 (96,733) Cost of sales 200,000 234,758 244,324 34,758 (9,566)
assets ‐ 32,193 ‐ 32,193 32,193 Depreciation and amortisation expense 8,523,300 8,786,480 7,922,260 263,180 864,220
Total cost of services 172,037,465 168,664,152 182,049,241 (3,373,313) (13,385,089)
IncomeRevenueFee for service 2 28,951,094 24,742,929 27,848,058 (4,208,165) (3,105,129) Student fees and charges 26,705,374 23,744,365 24,144,340 (2,961,009) (399,975) Ancillary trading 1,600,004 1,333,504 1,727,613 (266,500) (394,109) Sales 25,000 368,595 367,669 343,595 926 Interest revenue 1,150,000 1,108,306 1,058,971 (41,694) 49,335 Other revenue 3,294,996 2,178,605 4,156,885 (1,116,391) (1,978,280) Total revenue 61,726,468 53,476,304 59,303,536 (8,250,164) (5,827,231)
GainsGain on disposal of non‐current assets ‐ ‐ 662 ‐ (662)
3,4 ‐ 2,514,158 ‐ 2,514,158 2,514,158 Total gains ‐ 2,514,158 662 2,514,158 2,513,496 Total income other than income from State Government 61,726,468 55,990,462 59,304,198 (5,736,006) (3,313,735)
NET COST OF SERVICES 110,310,997 112,673,690 122,745,043 2,362,693 (10,071,354)
Income from State GovernmentService appropriation 97,966,000 102,705,370 100,407,437 4,739,370 2,297,933 Services received free of charge 4,175,584 5,986,296 6,927,747 1,810,712 (941,451) Total income from State Government 102,141,584 108,691,666 107,335,184 6,550,082 1,356,482 SURPLUS/(DEFICIT) FOR THE PERIOD (8,169,413) (3,982,024) (15,409,859) 4,187,388 11,427,834
OTHER COMPREHENSIVE INCOMEItems not reclassified subsequently to profit or lossChanges in asset revaluation surplus ‐ ‐ 60,026 ‐ (60,026) Total other comprehensive income ‐ ‐ 60,026 ‐ (60,026) TOTAL COMPREHENSIVE DEFICIT FOR THE PERIOD (8,169,413) (3,982,024) (15,349,833) 4,187,388 11,367,809
Major Estimate and Actual (2018) Variance Narratives1) The Employee Benefits variance is due to structural realignment achieving reduced costs. 2) A decrease in international enrolments in 2018 is the key factor of the Fee For Service variance.3) Gain arising from changes in fair value ‐ buildings relates to revaluations for which a budget cannot be set.
Major Actual 2018 and Comparative (2017) Variance Narratives4) Gain arising from changes in fair value ‐ buildings reflects the building revaluation increments which did not occur in 2017.5) Only land received a revaluation decrement in 2018 and buildings were incremented.
Loss on disposal of non‐current
Gain arising from changes in fair value ‐ buildings

AN
NU
AL
RE
PO
RT
2018
SO
UTH
METR
OP
OLITA
N TA
FE
75
SIGNIFICANT ISSUES IMPACTING THE AGENCYAGENCY PERFORMANCE
DISCLOSURES AND LEGAL COMPLIANCEOVERVIEW OF THE AGENCY
8.11.2 Statement of Financial Position Variances
Variance Note Estimate 2018
$ Actual 2018
$ Actual 2017
$
Variance between
estimate and actual
$
Variance between actual results for 2018
and 2017$
ASSETSCurrent Assets Cash and cash equivalents 41,246,481 37,923,318 35,684,507 (3,323,163) 2,238,811 Restricted cash and cash equivalents ‐ 926,588 2,719,321 926,588 (1,792,733) Receivables 2,484,831 4,770,523 3,220,163 2,285,692 1,550,360 Inventories 18,364 23,959 ‐ 5,595 23,959 Other current assets 1,791,288 1,023,036 1,178,811 (768,252) (155,775)
‐ 950,074 950,074 950,074 ‐ Total Current Assets 45,540,964 45,617,498 43,752,876 76,534 1,864,622
Non‐Current Assets Restricted cash and cash equivalents 1,017,697 1,279,045 1,088,916 261,348 190,129 Property, plant and equipment 1 346,332,720 317,878,034 332,331,303 (28,454,686) (14,453,269) Intangible assets ‐ 31,877 81,525 31,877 (49,648) Total Non‐Current Assets 347,350,417 319,188,956 333,501,744 (28,161,461) (14,312,788) TOTAL ASSETS 392,891,381 364,806,454 377,254,620 (28,084,927) (12,448,167)
LIABILITIESCurrent LiabilitiesPayables 4,088,100 2,768,777 3,181,238 (1,319,323) (412,461) Employee related provisions 21,251,000 22,118,764 20,448,405 867,764 1,670,359 Other current liabilities 6,977,784 86,569 2,929,651 (6,891,215) (2,843,082) Total Current Liabilities 32,316,884 24,974,110 26,559,294 (7,342,774) (1,585,184)
Non‐Current LiabilitiesEmployee related provisions 4,790,000 2,840,136 3,860,825 (1,949,864) (1,020,689) Total Non‐Current Liabilities 4,790,000 2,840,136 3,860,825 (1,949,864) (1,020,689) TOTAL LIABILITIES 37,106,884 27,814,246 30,420,119 (9,292,638) (2,605,873)
NET ASSETS 355,784,497 336,992,208 346,834,501 (18,792,289) (9,842,293)
EQUITYContributed equity 380,086,406 364,022,813 369,223,643 (16,063,593) (5,200,830) Reserves ‐ 60,026 60,026 60,026 (0) Accumulated deficit (24,301,909) (27,090,631) (22,449,168) (2,788,722) (4,641,463) TOTAL EQUITY 355,784,497 336,992,208 346,834,501 (18,792,289) (9,842,293)
Major Estimate and Actual (2018) Variance Narratives1) Property, Plant & Equipment is less than estimated due to the impact of asset revaluations and transfersto/from Department of Training and Workforce Development that were not budgeted for.
Non‐current assets classified as held for transfer
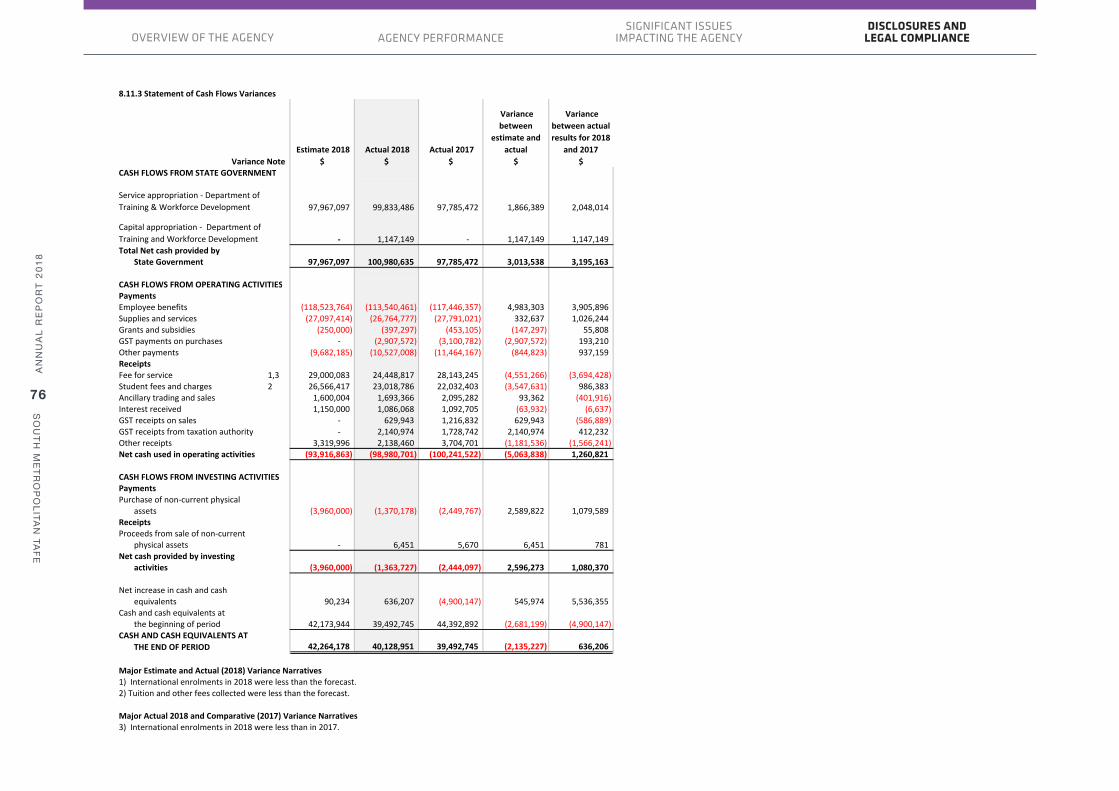
AN
NU
AL
RE
PO
RT
2018
SO
UTH
METR
OP
OLITA
N TA
FE
76
SIGNIFICANT ISSUES IMPACTING THE AGENCYAGENCY PERFORMANCE
DISCLOSURES AND LEGAL COMPLIANCEOVERVIEW OF THE AGENCY
8.11.3 Statement of Cash Flows Variances
Variance Note Estimate 2018
$ Actual 2018
$ Actual 2017
$
Variance between
estimate and actual
$
Variance between actual results for 2018
and 2017$
CASH FLOWS FROM STATE GOVERNMENT
97,967,097 99,833,486 97,785,472 1,866,389 2,048,014
‐ 1,147,149 ‐ 1,147,149 1,147,149 Total Net cash provided by
State Government 97,967,097 100,980,635 97,785,472 3,013,538 3,195,163
CASH FLOWS FROM OPERATING ACTIVITIESPaymentsEmployee benefits (118,523,764) (113,540,461) (117,446,357) 4,983,303 3,905,896 Supplies and services (27,097,414) (26,764,777) (27,791,021) 332,637 1,026,244 Grants and subsidies (250,000) (397,297) (453,105) (147,297) 55,808 GST payments on purchases ‐ (2,907,572) (3,100,782) (2,907,572) 193,210 Other payments (9,682,185) (10,527,008) (11,464,167) (844,823) 937,159 ReceiptsFee for service 1,3 29,000,083 24,448,817 28,143,245 (4,551,266) (3,694,428) Student fees and charges 2 26,566,417 23,018,786 22,032,403 (3,547,631) 986,383 Ancillary trading and sales 1,600,004 1,693,366 2,095,282 93,362 (401,916) Interest received 1,150,000 1,086,068 1,092,705 (63,932) (6,637) GST receipts on sales ‐ 629,943 1,216,832 629,943 (586,889) GST receipts from taxation authority ‐ 2,140,974 1,728,742 2,140,974 412,232 Other receipts 3,319,996 2,138,460 3,704,701 (1,181,536) (1,566,241) Net cash used in operating activities (93,916,863) (98,980,701) (100,241,522) (5,063,838) 1,260,821
CASH FLOWS FROM INVESTING ACTIVITIESPaymentsPurchase of non‐current physical
assets (3,960,000) (1,370,178) (2,449,767) 2,589,822 1,079,589 ReceiptsProceeds from sale of non‐current
physical assets ‐ 6,451 5,670 6,451 781 Net cash provided by investing
activities (3,960,000) (1,363,727) (2,444,097) 2,596,273 1,080,370
Net increase in cash and cashequivalents 90,234 636,207 (4,900,147) 545,974 5,536,355
Cash and cash equivalents at the beginning of period 42,173,944 39,492,745 44,392,892 (2,681,199) (4,900,147)
CASH AND CASH EQUIVALENTS AT THE END OF PERIOD 42,264,178 40,128,951 39,492,745 (2,135,227) 636,206
Major Estimate and Actual (2018) Variance Narratives1) International enrolments in 2018 were less than the forecast. 2) Tuition and other fees collected were less than the forecast.
Major Actual 2018 and Comparative (2017) Variance Narratives3) International enrolments in 2018 were less than in 2017.
Service appropriation ‐ Department of Training & Workforce Development
Capital appropriation ‐ Department of Training and Workforce Development
AN
NU
AL
RE
PO
RT
2018
SO
UTH
METR
OP
OLITA
N TA
FE
77
SIGNIFICANT ISSUES IMPACTING THE AGENCYAGENCY PERFORMANCE
DISCLOSURES AND LEGAL COMPLIANCEOVERVIEW OF THE AGENCY
Terry Durant Managing Director
12 March 2019
Elizabeth Carr AM Chair of Governing Council
12 March 2019
We hereby certify that the key performance indicators are based on proper records, are relevant and appropriate for assisting users to assess South Metropolitan TAFE’s performance, and fairly represent the performance of SM TAFE for the period ending 31 December 2018.
KEY PERFORMANCE INDICATORS
Certification of Key Performance Indicators

AN
NU
AL
RE
PO
RT
2018
SO
UTH
METR
OP
OLITA
N TA
FE
78
SIGNIFICANT ISSUES IMPACTING THE AGENCYAGENCY PERFORMANCE
DISCLOSURES AND LEGAL COMPLIANCEOVERVIEW OF THE AGENCY
South Metropolitan TAFE 2018 KEY PERFORMANCE INDICATORS
DESIRED OUTCOME: The provision of vocational education and training services to meet community and industry training needs. EFFECTIVENESS INDICATORS: The effectiveness indicators measure the achievement of vocational education and training in meeting community and industry needs via student and graduate satisfaction, labour force status of graduates and profile achievement. Student Satisfaction Survey The Student Satisfaction Survey is administered annually on behalf of the Department of Training and Workforce Development by a third-party research agency. In 2018 the fieldwork and analysis were conducted by EY Sweeney. The key focus is to attain an understanding of the students’ training requirements and measure the quality of the delivery of training and services provided by South Metropolitan TAFE. Students who were enrolled in either the first or second semester of 2018 were invited to complete the survey online via e-mail, SMS, through the WA Student Satisfaction Survey website and via posters on campuses. Students were also able to complete a hard copy questionnaire provided by staff at each of the campuses. A subset of students were called in order to complete the survey using telephone surveying. KPI 1 – Student Satisfaction The overall student satisfaction rating is obtained from the 2018 Student Satisfaction Survey and measures the extent to which students were satisfied with the training they received from South Metropolitan TAFE. The measure represents the proportion of 'satisfied' and 'very satisfied' (on a five point scale) responses received from students responding to the question ‘Overall how satisfied were you with your course?’ Table 1 – Overall Student Satisfaction
2016 Actual
2017 Actual
2018 Target
2018 Actual
Variance
South Metropolitan TAFE 88.7% 87.1% >85% 87.8% +2.8% All WA TAFEs & WAAPA 88.9% 87.3% n/a 88.2% n/a
Source: Department of Training and Workforce Development, 2018 Student Satisfaction Survey.
Notes: The WA Student Satisfaction Survey is an annual survey amongst students who are funded under the National Agreement for Skills and Workforce Development. The following student groups have been excluded from the scope of the survey: international full fee paying students, students undergoing training through a school-based program (VET in schools), Adult community education (ACE) students, students who are in a correctional facility and students aged less than 15 years.
All data described in this report have been weighted back to the total student population based on a combination of gender (male, female), age group (15-19, 20-29, 30-44, 45+), student status (IBS, EBS), and the specific training provider (each of the six colleges plus private providers as one group), resulting in 112 different weighted cell possibilities. Weight cells with a zero count for both the population and survey data were removed.
Percentages are rounded to the nearest whole percentage.
In 2018, of the 15,796 South Metropolitan TAFE students contacted, there were 3,491 usable returns representing a response rate of 22.1%. South Metropolitan TAFE’s standard error for 2018 was 0.6%, with a relative sampling error of +/- 1.0% at the 95% level of confidence. The 2018 target overall student satisfaction at South Metropolitan TAFE was met and exceeded, with 87.8% of respondents claiming to be either satisfied or very satisfied. This is slightly higher than the level of student satisfaction reported in 2017 (87.1%).

AN
NU
AL
RE
PO
RT
2018
SO
UTH
METR
OP
OLITA
N TA
FE
79
SIGNIFICANT ISSUES IMPACTING THE AGENCYAGENCY PERFORMANCE
DISCLOSURES AND LEGAL COMPLIANCEOVERVIEW OF THE AGENCY
South Metropolitan TAFE 2018 KEY PERFORMANCE INDICATORS
Student Outcomes Survey The Student Outcomes Survey is conducted on behalf of the National Centre for Vocational Education Research (NCVER) by the Social Research Centre. The survey measures vocational education and training students' employment levels, further study and opinions on the training undertaken. Out of scope of the survey are: • international students • students who undertook recreational, leisure or personal enrichment (short) courses • students who undertook VET delivered in schools, where training activity was undertaken as part of a senior secondary certificate • students under 18 years of age.
2016 comparatives have not been reported as no survey was performed in that year. From 2017, the survey results are reported annually.
KPI 2 - Graduate Achievement Graduate achievement is a question in the NCVER Student Outcomes Survey and measures the extent to which South Metropolitan TAFE Graduates have “Achieved their main reason for doing the training’”. The measure shows the proportion of graduates who indicated they had fully achieved or partly achieved their main reason for doing the training.
Table 2 – Graduate Achievement
2017 Actual
2018 Target
2018 Actual
South Metropolitan TAFE 81.0% 80.0% 79.5% TAFE Western Australia n/a n/a 79.7% TAFE Australia 83.2% n/a 82.1% All VET providers Australia 84.2% n/a 84.2%
In 2018, of the 4,288 South Metropolitan TAFE graduates asked, there were 1,583 usable returns representing a response rate of 36.9%. South Metropolitan TAFE’s relative sampling error for this result was +/- 1.7% at the 95% level of confidence. The 2018 South Metropolitan TAFE’s target for graduate achievement was slightly below target, with 79.5% of respondents claiming to have achieved their main reason for doing the training.

AN
NU
AL
RE
PO
RT
2018
SO
UTH
METR
OP
OLITA
N TA
FE
80
SIGNIFICANT ISSUES IMPACTING THE AGENCYAGENCY PERFORMANCE
DISCLOSURES AND LEGAL COMPLIANCEOVERVIEW OF THE AGENCY
South Metropolitan TAFE 2018 KEY PERFORMANCE INDICATORS
KPI 3 - Graduate Destination Graduate destination data is also taken from the Student Outcomes Survey and measures the proportion of graduates in employment. This measure shows the extent to which the college is providing relevant, quality training that enhances student employability. Graduate employment status measures who was employed, unemployed or not in the labour force, and was obtained by calculating the graduates in each category compared to the total valid responses over the total responses and expressed as a percentage.
Table 3 – Graduate Destination Rate - Employed
2017 Actual
2018 2018 Target Actual
South Metropolitan TAFE 73.2% >75% 68.4% TAFE Western Australia n/a n/a 68.5% TAFE Australia 73.1% n/a 72.4% All VET providers Australia 77.7% n/a 77.3%
In 2018, of the 4,288 South Metropolitan TAFE graduates contacted, there were 1,553 usable returns representing a response rate of 36.2%. South Metropolitan TAFE’s relative sampling error for this result was +/- 2.0% at the 95% level of confidence. The 2018 target for graduate destination rate (employed) was not met, with 68.4% of respondents claiming to be employed after training.

AN
NU
AL
RE
PO
RT
2018
SO
UTH
METR
OP
OLITA
N TA
FE
81
SIGNIFICANT ISSUES IMPACTING THE AGENCYAGENCY PERFORMANCE
DISCLOSURES AND LEGAL COMPLIANCEOVERVIEW OF THE AGENCY
South Metropolitan TAFE 2018 KEY PERFORMANCE INDICATORS
KPI 4 – Achievement of profile delivery (by ANZSCOs) This achievement of profile delivery indicator reports the effectiveness of South Metropolitan TAFE in meeting its Delivery and Performance Agreement (DPA) targets. The delivery profile is negotiated directly with the Department of Training and Workforce Development and constitutes South Metropolitan TAFE’s profile funded training delivery plan. The delivery profile takes into consideration government priorities, the needs of individuals, industry and the local community. It should be noted that the KPI reporting is based on the originally negotiated DPA. The Department of Training and Workforce Development allows South Metropolitan TAFE to review and make any modifications to the original DPA targets twice a year. This provides the opportunity to consider any changes in the operating environment and modify the DPA to set realistic targets. In 2018, the final amended profile SCH target was 7,437,000 SCH compared to the original DPA target of 7,300,000. Table 3: Profile Achievement (DPA)
Actual Achievement 2016
Actual Achievement 2017
Actual Achievement 2018
Profile Achievement % (DPA Original) 93.4% 101.7% 102.2%
The Profile delivered by South Metropolitan TAFE was above the original planned target of 7,300,000 SCH by 164,046 SCH, resulting in an overall achievement of 102.2%. South Metropolitan TAFE’s profile delivery by ANZSCO (Australia and New Zealand Standard Classification of Occupations) levels for 2018 are provided in Table 4. As per the data presented in Table 4, in 2018, the following ANZSCO sub groups constituted over 50% of total SCH achievement: General Education (13%); Automotive and Engineering Trades Workers (12%); Carers and Aides (8%); Health and Welfare Support Workers (7%); Engineering, ICT and Science Technicians (7%); and Sports and Personal Service Workers (5%). The ANZSCO levels that were significantly above target (more than 40,000 SCH of positive variance) were: Automotive and Engineering Trade Workers, Sports and Personal Service Workers, Health and Welfare Support Workers, Adult Literacy / ESL and Carers and Aides. The ANZSCO levels that were significantly below target (more than 40,000 SCH of negative variance) were: Skilled Animal and Horticultural Workers.

AN
NU
AL
RE
PO
RT
2018
SO
UTH
METR
OP
OLITA
N TA
FE
82
SIGNIFICANT ISSUES IMPACTING THE AGENCYAGENCY PERFORMANCE
DISCLOSURES AND LEGAL COMPLIANCEOVERVIEW OF THE AGENCY
South Metropolitan TAFE 2018 KEY PERFORMANCE INDICATORS
Table 4: Achievement of 2018 Profile Delivery (DPA) by ANZSCO sub groups
ANZSCO Major Group Title ANZSCO Sub Group Title 2018 Census Actual
2018 Target Planned
2018 Target Achievement
1. Managers 11 – Chief Executives, General Managers and Legislators 9,690 12,750 76.0%
12 – Farmers and Farm Managers 0 5,179 0.0%
13 – Specialist Managers 36,747 54,627 67.3%
14 – Hospitality, Retail and Service Managers 136,210 105,324 129.3%
2. Professionals 21 – Arts and Media Professionals 3,985 5,031 79.2%
22 – Business, Human Resource and Marketing Professionals 24,485 32,200 76.0%
23 – Design, Engineering, Science and Transport Professionals 178,973 213,221 83.9%
24 – Education Professionals 46,490 19,500 238.4%
26 – ICT Professionals 231,455 214,499 107.9%
3. Technicians and Trades Workers 31 – Engineering, ICT and Science Technicians 534,877 539,897 99.1%
32 – Automotive and Engineering Trades Workers 915,887 797,051 114.9%
33 – Construction Trades Workers 220,923 210,490 105.0%
34 – Electro-technology and Telecommunications Trades Workers 190,064 207,495 91.6%
35 – Food Trades Workers 266,832 280,105 95.3%
36 – Skilled Animal and Horticultural Workers 336,503 411,248 81.8%
39 – Other Technicians and Trades Workers 263,520 255,759 103.0%
4. Community and Personal Service Workers
41 – Health and Welfare Support Workers 557,679 491,863 113.4%
42 – Carers and Aides 619,210 562,919 110.0%
43 – Hospitality Workers 85,538 82,821 103.3%
44 – Protective Service Workers 0 21,266 0.0%
45 – Sports and Personal Service Workers 410,501 340,961 120.4%
5. Clerical and Administrative Workers
51 – Office Managers and Program Administrators 41,495 37,000 112.1%
53 – General Clerical Workers 104,370 134,356 77.7%
54 – Inquiry Clerks and Receptionists 27,490 28,000 98.2%

AN
NU
AL
RE
PO
RT
2018
SO
UTH
METR
OP
OLITA
N TA
FE
83
SIGNIFICANT ISSUES IMPACTING THE AGENCYAGENCY PERFORMANCE
DISCLOSURES AND LEGAL COMPLIANCEOVERVIEW OF THE AGENCY
South Metropolitan TAFE 2018 KEY PERFORMANCE INDICATORS
55 – Numerical Clerks 126,265 116,690 108.2%
59 – Other Clerical and Administrative Workers 91,108 74,551 122.2%
7. Machinery Operators and Drivers 71 – Machine and Stationary Plant Operators 48,773 74,319 65.6%
72 – Mobile Plant Operators 25,933 18,323 141.5%
74 – Store-persons 5,490 6,473 84.8%
8. Labourers 82 – Construction and Mining Labourers 62,212 97,134 64.0%
83 – Factory Process Workers 139,937 143,662 97.4%
84 – Farm, Forestry and Garden Workers 116,380 128,845 90.3%
85 – Food Preparation Assistants 9,482 13,921 68.1%
89 – Other Labourers 358,038 373,641 95.8%
G. General Education GB – General Education 987,115 921,891 107.1%
GE – General Education 250,389 266,988 93.8%
TOTAL 7,464,046 7,300,000 102.2% KPI 5 – Delivery Cost per Student Curriculum Hour (SCH) The overall cost per SCH demonstrates the efficiency with which South Metropolitan TAFE manages its resources to enable the provision of vocational education and training programs. The overall cost per SCH shows the aggregate unit cost of delivery output per SCH, based on the delivery costs (total cost of service) as detailed in the 2018 Financial Statements.
Table 6 – Delivery Cost per SCH
2017
2018
Actual Cost per SCH $18.43 $17.70 Target Cost per SCH $16.16 $17.80 Variance -$2.27 $0.10
Note: The total delivery cost per SCH is calculated by dividing the total cost of services as defined in the Financial Statements by the total SCH delivered including profile and non-profile delivery. Non-profile delivery in 2018 was 2,065,949 SCH.
The 2016 comparatives have not been presented as the College was granted a partial exemption by the Under Treasurer from the reporting of this efficiency indicator for 2016. The 2018 actual unit cost of delivery is within the target specified in the 2018 Section 40 Estimates.

AN
NU
AL
RE
PO
RT
2018
SO
UTH
METR
OP
OLITA
N TA
FE
84
SIGNIFICANT ISSUES IMPACTING THE AGENCYAGENCY PERFORMANCE
DISCLOSURES AND LEGAL COMPLIANCEOVERVIEW OF THE AGENCY
Ministerial directivesTreasurer’s Instruction 903 (12) requires SM TAFE to disclose details of any ministerial directives relevant to the setting of desired outcomes or operational objectives, the achievement of desired outcomes or operational objectives, investment activities and financing activities.
No such directives were issued to SM TAFE in 2018.
Other financial disclosures Pricing policies for services provided Under the Vocational Education and Training Regulations 1996, the college may determine fees and charges for services, other than for services prescribed by the Minister for Training and Workforce Development.
Fees and charges levied by the college were in accordance with the requirements of the following:
• Vocational Education and Training Act, 1996• Vocational Education and Training Regulations, 1996• Policy Guidelines for Publicly Funded Registered
Training Organisations (RTO)
Capital works SM TAFE’s capital works program was funded by internally generated revenue and State Government contributions. There were no major capital works programs completed or commenced in 2018.
Unauthorised use of credit cardsAgencies are required to publish details of instances in their annual report where a Western Australian Government Purchasing Card (credit card) is utilised for personal use. In 2018,15officersinadvertentlyusedanSMTAFEpurchasingcardforpersonaluse,tothevalueof$507.88.
The details as required by Treasurer’s Instruction 903 (iv) are set out below.
Unauthorised use of purchasing cards $
Aggregate amount of personal use expenditure for the reporting period 507.88
Aggregate amount of personal use expenditure settled bytheduedate(within5workingdays) 239.85
Aggregate amount of personal use expenditure settled aftertheperiod(after5workingdays) 243.44
Aggregate amount of personal use expenditure outstanding at balance date 24.59

AN
NU
AL
RE
PO
RT
2018
SO
UTH
METR
OP
OLITA
N TA
FE
85
SIGNIFICANT ISSUES IMPACTING THE AGENCYAGENCY PERFORMANCE
DISCLOSURES AND LEGAL COMPLIANCEOVERVIEW OF THE AGENCY
Staff ProfileSM TAFE is a large and diverse organisation delivering a large number of specialist and unique vocational education and training services, which requires an equally diverse and high quality workforce. As at December 31, 2018, SM TAFE employed 909 Full Time Equivalent (FTE) staff. SM TAFE’s staffing levels by employment category for 2018 is presented below.
2018 2017
Full-time (FTE)
Part-time (FTE)
TOTAL (FTE)
Full-time (FTE)
Part-time (FTE)
TOTAL (FTE)
LecturerContract 44 34 78 160 27 187
Permanent 352 96 448 331 39 370
GOSACContract 30 19 49 50 7 57
Permanent 253 81 334 312 51 363
TOTAL 679 230 909 853 124 977
Equal employment opportunity and diversitySM TAFE is committed to ensuring a discrimination and harassment free workplace, and to promoting equal employment opportunity for all people. This is an integral part of the college’s values and is reflected in our policies, programs and personnel practices such as the Code of Conduct, grievance procedures and recruitment processes.
SM TAFE continues to work to create a workforce that matches the diversity in the Western Australian community. SM TAFE promotes a work environment that is inclusive and free from discrimination in accordance with its obligations under Part IX of the Equal Opportunity Act 1984. In 2018, the college developed and implemented an Intranet page which provides information relating to recruitment, employment and working with people with disability.
The table below compares our workforce composition to the public sector workforce in relation to different equity groups. Representation is based on the number of employees who identified themselves as belonging to a diversity group.

AN
NU
AL
RE
PO
RT
2018
SO
UTH
METR
OP
OLITA
N TA
FE
86
SIGNIFICANT ISSUES IMPACTING THE AGENCYAGENCY PERFORMANCE
DISCLOSURES AND LEGAL COMPLIANCEOVERVIEW OF THE AGENCY
Equal Employment Opportunity and Diversity (continued)
SM TAFE WA Public Sector
Aboriginal people representation 1.7% 2.7%
People with culturally diverse background representation 15.3% 13.2%
People with disability representation 2.7% 1.6%
Compliance with public sector standards and ethical codes SM TAFE has policies, procedures and guidelines in place to ensure agency obligations are met with respect to the Public Sector Standards in Human Resource Management, the Western Australian Code of Ethics and the Code of Conduct.
These policies and supporting guidelines are actively promoted throughout the college’s intranet site and by the Human Resource Directorate. In addition, SM TAFE continues to provide training for all staff on Accountable and Ethical Decision Making in line with the Public Sector Commission Instruction Codes of Conduct and Integrity Training.
In accordance with section 31(1) of the Public Sector Management Act 1994, SM TAFE provides the following statements regarding compliance with the Public Sector Standards, the Public Sector Code of Ethics and the SM TAFE Code of Conduct.
Compliance category 2018 result
Public sector standards in human resource management 0 breaches
WA Code of Ethics 0 breaches
SM TAFE Code of Conduct 2 breaches

AN
NU
AL
RE
PO
RT
2018
SO
UTH
METR
OP
OLITA
N TA
FE
87
SIGNIFICANT ISSUES IMPACTING THE AGENCYAGENCY PERFORMANCE
DISCLOSURES AND LEGAL COMPLIANCEOVERVIEW OF THE AGENCY
Employee Assistance ProgramSM TAFE is committed to maintaining a safe and healthy work environment. As part of this commitment, the college values the importance of the contribution of its staff.
SM TAFE’s Employee Assistance Program is available to help staff identify, explore and resolve work or personal problems that may adversely affect their wellbeing, including anxiety, depression, relationships, conflict with others, coping with change and communication breakdown. This free service is available to all staff and their immediate family.
Family and domestic violenceSM TAFE is committed to supporting employees experiencing family and domestic violence by helping them to maintain their employment and participate safely in the workplace. All employees, including casuals, can access up to an additional 10 days, non-cumulative paid leave per calendar year.
SM TAFE has trained Family and Domestic Violence (FDV) officers available to provide information and assistance to staff experiencing FDV.
Workers compensation Nine claims for workers compensation were lodged in the 2018 financial year. One claim was declined by RiskCover, of the accepted claims, four were lost time injuries.
Governance disclosuresDeclarations of interests In accordance with the requirements of Treasurer’s Instruction 903 (14), other than normal contracts of employment of service, no senior officers, or entities in which senior officers have any substantial interests, had any interest in existing or proposed contracts with SM TAFE.
Public interest disclosures The Public Interest Disclosure Act 2003 facilitates the disclosure of information in the public interest about matters of wrongdoing, corruption or improper conduct within the Western Australian public sector. The legislation provides protections for the person raising the disclosure and any person about whom the disclosure is made. SM TAFE has three Public Interest Disclosure officers. There were no public interest disclosures during 2018.

AN
NU
AL
RE
PO
RT
2018
SO
UTH
METR
OP
OLITA
N TA
FE
88
SIGNIFICANT ISSUES IMPACTING THE AGENCYAGENCY PERFORMANCE
DISCLOSURES AND LEGAL COMPLIANCEOVERVIEW OF THE AGENCY
Governing Council remuneration The individual and aggregate cost of remunerating Governing Council members in 2018 was as follows:
Position Name Type of remuneration Period of membership Gross remuneration $
Chair Elizabeth Carr AM Annual salary 12 months 22,665.24
Deputy Chair David Wood Per meeting 12 months 2,215
Member Christine Coyne Per meeting 6 months 768
Member Niegel Grazia Per meeting 12 months 0
Member Stephen Cain Per meeting 6 months 0
Member Deborah Hamblin Per meeting 12 months 2,304
Member Kelly Townson Per meeting 6 months 1,152
Member Zaneta Mascarenhas Per meeting 6 months 768
Member Nicole Ashby Per meeting 6 months 1,152
Member Lina Dickins Per meeting 6 months 1,152
Member Julian Coyne Per meeting 6 months 1,152
33,328.24

AN
NU
AL
RE
PO
RT
2018
SO
UTH
METR
OP
OLITA
N TA
FE
89
SIGNIFICANT ISSUES IMPACTING THE AGENCYAGENCY PERFORMANCE
DISCLOSURES AND LEGAL COMPLIANCEOVERVIEW OF THE AGENCY
Other legal requirements
Advertising expenditureInaccordancewithSection175ZEoftheElectoralAct1907,thefollowingisastatementofallexpenditureincurredbySMTAFEduring2018in relation to advertising, market research, polling, direct mail and media advertising organisations.
Expenditure was incurred in the following areas:
Total $ Expenditure Amount $
Advertising agencies Nil Nil Nil
Market research organisations Nil Nil Nil
Polling organisations Nil Nil Nil
Direct mail organisations 2,208.91 Campaign Monitor 2,208.91
Media advertising agencies 56,951.03 Carat Australia Pty LtdFacebook (GST not applicable)GoogleLinkedin
7216.65
43,816.515,345.51572.36

AN
NU
AL
RE
PO
RT
2018
SO
UTH
METR
OP
OLITA
N TA
FE
90
SIGNIFICANT ISSUES IMPACTING THE AGENCYAGENCY PERFORMANCE
DISCLOSURES AND LEGAL COMPLIANCEOVERVIEW OF THE AGENCY
As required under the Disability Services Act 1993, SM TAFE implemented actions throughout 2018 that supported the strategies in our Disability Access and Inclusion Plan (DAIP). Outlined below are outcomes and initiatives to address the agency outcomes to ensure SM TAFE’s services, facilities and information are accessible and inclusive.
People with a disability have the same opportunities as other people to access the services of, and any events organised by, a public authority
• TheDAIPCommitteeprovidesguidanceand a forum for progressing discussion and action planning key initiatives
• Informationandresourcesareavailableon the intranet site to assist staff to ensure events are accessible.
People with a disability have the same opportunities as other people to access the buildings and other facilities of a public authority
• Completionofupgradestotheaccessible parking bays at Munster and Murdoch campuses to meet legislative requirements
• FacilitiesstaffarerepresentedontheDAIP Committee, providing advice and regular updates on building and facilities access.
People with a disability receive information from a public authority in a format that will enable them to access the information as readily as other people
• ImplementationofaTrainingServicesprocess to identify student support needs at course commencement in line with standard 1.7 of the Standards for RTOs2015
• Afocusontheimplementationanddelivery of high quality, sustainable training services across all portfolio areas.
People with a disability receive the same level and quality of service from the staff of a public authority as other people
• Theadditionofanaccessibilitycontentwebpage to the college’s e-learning intranet page to assist lecturers in designing accessible content on the newly implemented Blackboard platform
• Staffprofessionaldevelopmentopportunities to broaden understanding of the needs of students with a disability, including the delivery of four lecturer-orientated sessions entitled Students with a disability: What lecturers need to know.
Disability Access and Inclusion Plan (DAIP) – Outcomes 2018

AN
NU
AL
RE
PO
RT
2018
SO
UTH
METR
OP
OLITA
N TA
FE
91
SIGNIFICANT ISSUES IMPACTING THE AGENCYAGENCY PERFORMANCE
DISCLOSURES AND LEGAL COMPLIANCEOVERVIEW OF THE AGENCY
People with a disability have the same opportunities as other people to make complaints to a public authority
• Peoplewithdisabilityhaveanopportunity to discuss concerns and grievances with Student Support Advisors in a confidential setting and receive assistance to resolve issues
• StudentSupportAdvisorstoassiststudents with disability to access alternatives to online complaint and feedback submissions such as face-to-face meetings or hard copy forms.
People with a disability have the same opportunities as other people to participate in any public consultation by a public authority
• Ongoinggeneralsurveyingofstudents,including state student satisfaction surveys, college based learner surveys and disability support effectiveness surveys. Assistance completing surveys is provided where needed, such as providing hard copy versions
• SMTAFEregularlyengageswithagenciesthat support people with disability on training matters such as the NDIS program, Disability Employment Services and mental health support services.
People with a disability have the same opportunities as other people to obtain and maintain employment with a public authority
• Thenumbersofemployeeswithadisclosed disability is monitored in order to inform HR strategies and practices
• SMTAFEprovidesinformationandsupport to managers to assist them in employing people with a disability.
AN
NU
AL
RE
PO
RT
2018
SO
UTH
METR
OP
OLITA
N TA
FE
92
SIGNIFICANT ISSUES IMPACTING THE AGENCYAGENCY PERFORMANCE
DISCLOSURES AND LEGAL COMPLIANCEOVERVIEW OF THE AGENCY
Recordkeeping PlanUnder the State Records Act 2000, all government agencies are required to have a record keeping plan. SM TAFE has an approved Recordkeeping Plan as prescribed by the State Records Act 2000. This consolidated Recordkeeping Plan covers the WA TAFE Sector as a whole and has been submitted to the State Records Office. The plan was approved by the State Records Commission on 10 August 2018. In addition SM TAFE has a new recordkeeping system scheduled for implementation in January 2019.
Records awareness training remains a key component of SM TAFEs induction process, addressing staff roles and responsibilities in regard to compliance with the Recordkeeping Plan. All staff are required to complete Records Awareness Training.
In addition, training is provided to staff regularly either formally or in a “one on one” setting which looks at the practical aspects of capturing significant business and corporate records. The efficiency and effectiveness of recordkeeping training will form part of the forthcoming records management review to ensure that the program continues to meet staff needs and the requirements of the Act.
Freedom of InformationSM TAFE’s FOI Information Statement is available on our website. One FOI request was received during the 2018 reporting period.

AN
NU
AL
RE
PO
RT
2018
SO
UTH
METR
OP
OLITA
N TA
FE
93
SIGNIFICANT ISSUES IMPACTING THE AGENCYAGENCY PERFORMANCE
DISCLOSURES AND LEGAL COMPLIANCEOVERVIEW OF THE AGENCY
Government policy requirementsSM TAFE is committed to maintaining a high level of safety within the work environment. A robust system of safety committees at both the work site and senior management level exists across the organisation to ensure safety outcomes are achieved. The SM TAFE Occupational Safety and Health team continue to ensure uniformity is applied across all sites in the field of safety and as part of this process provide up to date policies and procedures which cover the entire organisation. An independent audit is undertaken to assess the organisation against the WorkSafe Plan to ensure the college’s safety strategy meets industry best practice standards.
MeasureActual results Results against targets
2016 2017 2018 Target Comment on result
Number of fatalities 0 0 0 Zero (0) Target achieved
Lost time injury and/or disease incidence rate
0.57 0.96 0.44 Zero (0) or 10% reduction
Targetachieved,54%reduction on 2017
Lost time injury severity rate
25 18 50 Zero (0) or 10% reduction
Although the rate has increased the number of LTI’s have reduced significantly from 11 in 2017 to 4 in 2018
Percentage of injured workers returned to work within: (i) 13 weeks; and (ii) 26 weeks
(i) 100%(ii) 100%
(i)85%(ii) 100%
(i) 100%(ii) 100%
Greater than or equal to 80% return to work within:(i) 13 weeks; and (ii) 26 weeks
Targets have been met
Percentage of managers and supervisors trained in occupational safety, health and injury management responsibilities
N/A N/A *50% Greater than or equal to 80%
Further training will continue in 2019
* In November 2018 SM TAFE commenced a new online training program to provide OSH training to managers and supervisors. This training will continue in 2019.

AN
NU
AL
RE
PO
RT
2018
SO
UTH
METR
OP
OLITA
N TA
FE
94
SIGNIFICANT ISSUES IMPACTING THE AGENCYAGENCY PERFORMANCE
DISCLOSURES AND LEGAL COMPLIANCEOVERVIEW OF THE AGENCY
Note:
• Fatalities: number of compensated work related fatalities• Lost time injury/disease incidence rate: The lost time injury/disease incidence rate is the number of lost time injury/disease
claims lodged, divided by the number of employees (FTE) and multiplied by 100• Lost time injury severity rate: The lost time injury severity rate is the number of severe injuries (over 60 days lost from work)
divided by the number of lost time injury/disease claims multiplied by 100.

AN
NU
AL
RE
PO
RT
2018
SO
UTH
METR
OP
OLITA
N TA
FE
95
SIGNIFICANT ISSUES IMPACTING THE AGENCYAGENCY PERFORMANCE
DISCLOSURES AND LEGAL COMPLIANCEOVERVIEW OF THE AGENCY
Section 40 estimates for 2019In accordance with section 40 of the Financial Management Act 2006 and Treasurer’s Instruction 953 the annual estimates for the 2019 financial year are hereby included in the Annual Report. These estimates do not form part of the financial statements and are not subject to audit.
South Metropolitan TAFE 2019
STATEMENT OF COMPREHENSIVE INCOME Estimate$
COST OF SERVICES
ExpensesEmployee benefits expense 117,300,000Supplies and services 31,391,127Depreciation and amortisation expense 9,207,050Grants and subsidies 453,125Cost of sales 202,500Other expenses 11,000,000
Total Cost of Services 169,553,802
IncomeRevenueFee for service 25,076,674Student charges and fees 26,246,519Ancillary trading 1,520,004Sales 350,313Interest revenue 1,250,000Other revenue 3,472,304
Total Revenue 57,915,814
57,915,814
NET COST OF SERVICES (111,637,988)
INCOME FROM STATE GOVERNMENT
Service Appropriation 98,470,000Resources received free of charge 4,191,316Total income from State Government 102,661,316
DEFICIT FOR THE PERIOD (8,976,672)
TOTAL COMPREHENSIVE DEFICIT FOR THE PERIOD (8,976,672)
Total income other than income from State Government

AN
NU
AL
RE
PO
RT
2018
SO
UTH
METR
OP
OLITA
N TA
FE
96
SIGNIFICANT ISSUES IMPACTING THE AGENCYAGENCY PERFORMANCE
DISCLOSURES AND LEGAL COMPLIANCEOVERVIEW OF THE AGENCY
South Metropolitan TAFE 2019
STATEMENT OF FINANCIAL POSITION Estimate
$ASSETSCurrent AssetsCash and cash equivalents 37,321,646Restricted cash and cash equivalents 2,719,321Receivables 1,664,537Other current assets 458,570Non-current assets classified as held for sale 950,074Total Current Assets 43,114,148
Non-Current AssetsRestricted cash and cash equivalents 1,597,764Property, plant and equipment 329,209,380Intangible assets 81,525Total Non-Current Assets 330,888,669
TOTAL ASSETS 374,002,817 LIABILITIESCurrent LiabilitiesPayables 5,883,669Provisions 21,251,000Other current liabilities 3,152,779Total Current Liabilities 30,287,448
Non-Current LiabilitiesProvisions 4,321,000Total Non-Current Liabilities 4,321,000TOTAL LIABILITIES 34,608,448
NET ASSETS 339,394,369
EQUITYContributed Equity 378,795,439Reserves 60,026Accumulated deficit (39,461,096)
TOTAL EQUITY 339,394,369

AN
NU
AL
RE
PO
RT
2018
SO
UTH
METR
OP
OLITA
N TA
FE
97
SIGNIFICANT ISSUES IMPACTING THE AGENCYAGENCY PERFORMANCE
DISCLOSURES AND LEGAL COMPLIANCEOVERVIEW OF THE AGENCY
South Metropolitan TAFE 2019
STATEMENT OF CASH FLOWS Estimate
CASH FLOWS FROM STATE GOVERNMENTService Appropriation 98,470,000Net cash provided by State Government 98,470,000
Utilised as follows:
CASH FLOWS FROM OPERATING ACTIVITIESPaymentsEmployee benefits (113,037,230)Supplies and services (28,839,138)Grants and subsidies (453,125)Other payments (9,169,796)
ReceiptsFee for service 25,281,475Student fees and charges 25,039,607Ancillary trading 1,520,004Interest received 1,275,960GST receipts from taxation authority 35,707Sale of Goods 325,000Other receipts 3,249,763Net cash used in operating activities (94,771,773)
CASH FLOWS FROM INVESTING ACTIVITIESPurchase of non-current physical assets (2,630,000)Net cash used in investing activities (2,630,000)
Net increase in cash held and cash equivalents 1,068,227Cash and cash equivalents at the beginning of the period 40,570,504
CASH AND CASH EQUIVALENTS AT THE END OF THE PERIOD 41,638,731

N O T E S


southmetrotafe.wa.edu.au
South Metropolitan TAFE 1 Fleet Street, Fremantle Western Australia 6160 PHONE: 1800 001 001 EMAIL: [email protected] WEB: southmetrotafe.wa.edu.au
SM TAFE RTO: 52787
SMT0
01/1
9