2018 Market Forecast Report - Danske Maritime · Newbuilding requirements for non-cargo carriers...
64
Newbuilding Requirements 2018-2035 | SEA Market Forecast WG 2018 Market Forecast Report
Transcript of 2018 Market Forecast Report - Danske Maritime · Newbuilding requirements for non-cargo carriers...

Newbuilding Requirements 2018-2035 | SEA Market Forecast WG
2018 Market Forecast Report


3
2018 Market Forecast Report


5
Contents
Introduction . . . . . . . . . . . . . . . . . . . . . . . . . . . . . . . . . . . . . . . . . . . . . . 7
Executive Summary . . . . . . . . . . . . . . . . . . . . . . . . . . . . . . . . . . . . . . . . . 9
Global Economic Situation . . . . . . . . . . . . . . . . . . . . . . . . . . . . . . . . . . . 11
Global Energy Consumption . . . . . . . . . . . . . . . . . . . . . . . . . . . . . . . . . 13
Global Seaborne Trade . . . . . . . . . . . . . . . . . . . . . . . . . . . . . . . . . . . . . 15
Impact of Environmental Regulations . . . . . . . . . . . . . . . . . . . . . . . . . . . . 17
Newbuilding Requirements: Cargo Carriers . . . . . . . . . . . . . . . . . . . . . . . 21
a . Containerships . . . . . . . . . . . . . . . . . . . . . . . . . . . . . . . . . . . . . 21b . General Cargo Ships . . . . . . . . . . . . . . . . . . . . . . . . . . . . . . . . . 24c . Bulk Carriers . . . . . . . . . . . . . . . . . . . . . . . . . . . . . . . . . . . . . . . 27d . Oil & Chemical Tankers . . . . . . . . . . . . . . . . . . . . . . . . . . . . . . . 30e . LNG & LPG Carriers . . . . . . . . . . . . . . . . . . . . . . . . . . . . . . . . . 31
Newbuilding Requirements: Oil & Gas Offshore . . . . . . . . . . . . . . . . . . . . 33
Market Drivers . . . . . . . . . . . . . . . . . . . . . . . . . . . . . . . . . . . . . . . 33The Market Cycle . . . . . . . . . . . . . . . . . . . . . . . . . . . . . . . . . . . . . 33The Effects of Shale Oil . . . . . . . . . . . . . . . . . . . . . . . . . . . . . . . . . 34Offshore Spending and Activity . . . . . . . . . . . . . . . . . . . . . . . . . . . 34The Offshore Fleet . . . . . . . . . . . . . . . . . . . . . . . . . . . . . . . . . . . . . 35The Offshore Shipping Market Outlook . . . . . . . . . . . . . . . . . . . . . . 36
Offshore E&P . . . . . . . . . . . . . . . . . . . . . . . . . . . . . . . . . . . . 36Construction & Subsea . . . . . . . . . . . . . . . . . . . . . . . . . . . . . . 37Offshore Supply & Service . . . . . . . . . . . . . . . . . . . . . . . . . . . 39
Summary . . . . . . . . . . . . . . . . . . . . . . . . . . . . . . . . . . . . . . . . . . . 41Newbuilding Requirements: Passenger Ferries . . . . . . . . . . . . . . . . . . . . . . 43
Newbuilding Requirements: Cruise Ships . . . . . . . . . . . . . . . . . . . . . . . . . 45
Newbuilding Requirements: Ro-Ro and Car Carriers . . . . . . . . . . . . . . . . . 47
Newbuilding Requirements: Other Non-Cargo Carrying Vessels (ONCCV) . . . 51
a . Fishing Vessels . . . . . . . . . . . . . . . . . . . . . . . . . . . . . . . . . . . . . 51b . Research Vessels . . . . . . . . . . . . . . . . . . . . . . . . . . . . . . . . . . . . 53c . Tugs . . . . . . . . . . . . . . . . . . . . . . . . . . . . . . . . . . . . . . . . . . . . 55d . Dredgers . . . . . . . . . . . . . . . . . . . . . . . . . . . . . . . . . . . . . . . . . 56e . The Arctic Market . . . . . . . . . . . . . . . . . . . . . . . . . . . . . . . . . . . 58f . Other Specialised Vessels . . . . . . . . . . . . . . . . . . . . . . . . . . . . . . 60


7
Introduction
SEA Market Forecast exists since 1969 . The main task of this group is to conduct market forecasts and deliver regular studies on technical issues such as market forecast, newbuilding requirements, CGT coefficient and shipbuilding capacities aiming at providing best possible guidance for long-term planning . The group represents European shipyards’ and maritime equipment industry at international level and takes part at international forecasting groups .
Forecasting is a difficult business, but when it needs to be done it is good to assemble the best . That is what ISFEM is for . The International Shipbuilding Forecast Expert Meeting is the forum for discussing findings and harmonizing the methodologies to create this report together with our collaborators: SAJ, KOSHIPA and CANSI . Our partnership in this annual endeavor increases our mutual understanding of our industry and its prospect for growth . There is one certainty: reality will end up looking differently than the forecast . The forecast can nevertheless serve to give an idea of the required amount of tonnage in the future and to stimulate serious discussion on future demand for ships .
The developing global macroeconomic outlook on economic growth, production, energy con- sumption (and developing changes to the energy production mix) provide the basis for the fore-casts found inside this report . These values, in turn, inform our expectations for maritime trade volumes in dynamic global shipping routes and patterns . These volumes are further broken down into segments such as major bulk trade, oil and gas cargo, general cargo and minor bulk .
It is important to note that expectations for technological advancement are having increasingly significant impact on the forecasts . The speed of change, the convergence of sciences, advanced robotics on one hand, and on the other machine perception, intelligence and learning are deli-vering capabilities that are seamless, synchronous, and personalized . Before 2035, many ships, systems, and components will be linked to the Internet, making them accessible from any location . Maritime connectivity and semi- or full automation will advance significantly with significant impact on shipping and its supply chain . Increasingly stringent environmental rules driven by societal and policy expectations on shipping to reduce its environmental footprint in the coming years and de-cades are also taken into account as key drivers for fleet replacement investments .
This forecast is reporting on newbuilding requirements, not demand growth . Newbuilding requi-rements reflect the expected growth of the fleet and are forecasted for individual ship type and size . These estimates take into consideration the average age of the fleet-segment and the rate of vessel scrapping .
The figure below illustrates the methodology:
GLOBAL TRADE
trade patterns type of trade sea borne/land etc .
NEWBUILDNG REQUIREMENT
TO 2035
MACRO ECONOMIC
GDP demography production energy mix etc .
FLEET REQUIREMENT TO 2035
Existing fleet size & age deleted ships & replacement regulations etc .
Figure 1. Forecasting Methodology Scheme (Source: SAJ, ISFEM 2016)
Taken together, the forecast shows that newbuilding requirements are on the rise, albeit that the growth rate is relatively low . Drivers for growth include increasing demand for transport and supply-side factors: that newer, smarter, and more efficient equipment, technologies, and training are playing an even more significant role in fleet replacement . Fleet digitalization is offering new horizons of possibilities for the fleet to become more effective, transparent, responsive, and timely in their operations .

Nonetheless, with sustained overcapacity of the global shipbuilding capacity and transport capa-city, these demand prospects for growth are not enough to restore balance to the ongoing health of the overall maritime industry . In 2018, some signs of improvement are visible across several shipping segments . Much has already been done to reduce this capacity, but it still falls short and risks are still high . We applaud those who have already taken steps - you are heroic caretakers of the industry and the future of maritime business .
Jenny N . Braat - Chairwoman
Annika Poitz
Dario Bazargan
Ralph Dazert
Sandra Rand & Gijs Streppel
Elina Vähäheikkilä
Paulino Fernandez
Jesús Algarra Lois
Runar Haddal
Niels-Henrik Møller

9
Executive Summary
The shipping industry is undergoing structural changes affecting almost all segments within the industry and impacting the foreseen newbuilding requirements towards year 2035 . Apart from ongoing technological advancements and increasing regulatory pressure on the industry, the geopolitical situation, slowing pace of overall seaborne trade growth and general global econo-mic uncertainties also affect the forecasts .
Global economic growth is strengthening with data surprisingly on the upside . Global GDP growth is projected to be between 3 .5% and 3 .75% for 2018, which is close to long-run averages .
More robust and higher quality private sector investment, including in intangibles and skills, is key for long-term productivity and real wage growth . There are positive signs indicating that busi-nesses intend to invest and now the global upturn signals demand for investments . But projected investment rates remain low to sustain the acceleration of activity . As a result, the projection for global GDP for 2019 shows a tempering of growth rather than continued strengthening .
The projected growth for 2018 is to be just over 3 .5%, the fastest for seven years, with impro-ved outcomes in both advanced economies and EME . Amongst the advanced economies, policy easing is helping growth to remain stronger than anticipated . Strong infrastructure investments in China in 2016 and 2017 are the key drivers for the upturn in the EME’s, boosting external demand elsewhere and contributing to the recovery in many commodity-exporting economies .
Commodity prices have risen, partly due to industrial demand, geopolitical risk and supply con-straints . The oil prices remain below the peaks seen in 2010-11 .
Most major shipping segments are still challenged by overcapacity issues but there are signs of improvements in some segments after the record low order intake level reached in 2016 . Looking further, however, provides confidence in the industry . Despite the above mentioned structural chan-ges, being a very volatile industry, shipping has historically followed long cycles . Hence, the perspectives for sea borne trade growth, the ocean economy and maritime business potential in general are good and indisputable .
Looking at the individual segments, containership market conditions have improved in 2017, fol-lowing a severely pressurized market environment in 2016 . Overall more positive demand trends, combined with continued moderate supply growth, have helped to start to re-balance the contai-nership sector . The containership segment is forecasted to grow firmly in the medium and long term towards 2035 driven by GDP growth . While challenges and risks remain, the bulk carrier market is also starting to move on a more positive trajectory, after having picked up pace this year . Our projection to 2035 shows that due to persisting overcapacity, oil tankers’ and LNG tankers’ fleet will grow less than oil and LNG seaborne trade .
With regard to the offshore segment there is, all in all, much more optimism in 2018 than in 2017 as key drivers show a more positive development . Investors in today’s $60-70 world are now viewing situation and outlook more positively . The market will be back, but most likely not to the heights we have seen the last decade . Market development from here may be slowly upwards, but “the deeper the downturn, the sharper the rebound” is often the case (ref . to section about the market cyclein the offshore chapter ) .
Despite a fairly mature passenger ferry market and slowing growth in passenger volumes in key markets, overall moderate demand growth is expected in the medium to long term . The cruise vessel segment has experienced tremendous growth the past years and judging from the order-books the level of growth will remain in the short to medium term . However, in the long term the newbuilding requirements will be linked to trends in international tourism, economic growth, and population growth .

Newbuilding requirements for non-cargo carriers such as fishing vessels, research vessels, tugs, dredgers and other specialized vessels are mixed . Due to an ageing fleet of fishing vessels a high level of scrapping is expected . This in turn will lead to an expected rise in newbuilding deliveries but still lower than the number of vessels scrapped resulting in a further drop of the fleet size . Despite low levels of exploration activities leading to low vessel utilization, low day rates and an increasing number of laid up vessels, recovery of exploration activities and fleet renewal are expected to restart investments in seismic research vessels . However, it remains to be seen whether the contracting levels of the past will be reached again . A similar development is expected in newbuilding requirements for oceanographic research vessels . While mature Western economies suffer from budget constraints, they still need to replace their ageing fleet . This is often achieved by replacing existing vessels with fewer but larger and more versatile vessels . Meanwhile, emer-ging economies are increasing spending on their oceanographic research fleets in their quest for energy sources and other raw materials . Taken together, these developments lead to a generally higher newbuilding requirement towards 2035 .
Compared to previous forecasts, the slowing of world seaborne trade growth, a lower level of scrapping and a generally restrained spending is expected to result in a reduced yet still increa-sing new building requirement for both tugs and dredgers . As the arctic areas of the world are opening the existing fleet of ships suited for the Arctic is exposed as ageing and insufficient . This development has spurred demand for icebreakers and ice-strengthened tonnage capable of Arctic operations in the medium to long term . The requirement for ships in the other special vessels category is expected to grow slightly below the projected annual growth rate of world seaborne trade resulting in a relatively unchanged fleet size with the potential for a gradual rise in deliveries towards 2035 .
0
10
20
30
40
50
60
Total Real deliveries Projected SEA Europe Average deliveries
Newbuilding Requirements - Actual + Forecast (in mill. CGT)
Newbuilding requirements 2018-2035. Source: SEA Europe Working Group (WG) on Market Forecast (MF), 2018

11
Global Economic Situation
Global economic growth is strengthening with data surprisingly on the upside . Global GDP growth is projected to be between 3 .5% and 3 .75% for 2018, which is close to long-run averages .
More robust and higher quality private sector investment, including in intangibles and skills, is key for long-term productivity and real wage growth . There are positive signs indicating that busi-nesses intend to invest and now the global upturn signals demand for investments . But projected investment rates remain low to sustain the acceleration of activity . As a result, the projection for global GDP for 2019 shows a tempering of growth rather than continued strengthening .
The projected growth for 2018 is to be just over 3 .5%, the fastest for seven years, with improved outcomes in both advanced economies and emerging economies (EME) . Amongst the advanced economies, policy easing is helping growth to remain stronger than anticipated . Strong infra-structure investments in China in 2016 and 2017 are the key drivers for the upturn in the EME’s, boosting external demand elsewhere and contributing to the recovery in many commodity-expor-ting economies .
Commodity prices have risen, partly due to industrial demand, geopolitical risk and supply con-straints . The oil prices remain below the peaks seen in 2010-11 .
-6,00%
-4,00%
-2,00%
0,00%
2,00%
4,00%
6,00%
8,00%
10,00%
1980
-198
9
1990
-199
9
2000
2001
2002
2003
2004
2005
2006
2007
2008
2009
2010
2011
2012
2013
2014
2015
2016
2017
2017
-202
0
2021
-25
2026
-30
2030
-35
Total OECD Developing Countries Total World
GDP Growth 1980 - 2035
Source: SEA Europe WG MF 2018
Looking further ahead the world economics will change . PwC project that the world economy could more than double in size by 2050, assuming broadly growth-friendly policies (including no sustained long-term retreat into protectionism) and no major global civilization-threatening cata-strophes .
Emerging markets will continue to be the growth engine of the global economy . By 2050, the E7 economies could have increased their share of world GDP from around 35% to almost 50% . China could be the largest economy in the world, accounting for around 20% of world GDP in 2050, with India in second place and Indonesia in fourth place (based on GDP at PPPs) . These econo-mies are rapidly evolving and often relatively volatile however, so companies will need dynamic and flexible operating strategies to succeed in them . Businesses should be prepared to adjust their brand and market positions to suit differing and often more nuanced local preferences . An in-depth understanding of the local market and consumers will be crucial, which will often involve working with local partners .

Despite the above mentioned structural changes, being a very volatile industry, shipping has historically followed long cycles . Hence, the perspectives for sea borne trade growth, the ocean economy and maritime business potential in general are good and indisputable . Apart from in-creasing new-building requirements, albeit with lower growth rates than historically, SEA Europe foresees a promising potential within conversions and retrofitting of the at any time existing fleet in a quest to comply with the even tighter regulatory requirements and ensure increasing operational efficiency .

13
Global Energy Consumption
The world population is increasing, and more than one billion people are without access to electricity today . In 2040 the number is expected to be reduced to around 500 million . The world economy is projected to almost double over the next 20 years and rise in prosperity, particularly in fast-growing developing economies, drives a strong increase in energy demand even if this growth is substantially offset by rapid gains in energy efficiency .
In BP’s main scenario, global energy demand grows by around a third by 2040 – a significantly slower rate of growth than in the previous 25 years - with the industrial sector accounting for around half of the overall increase . Growth in transport demand is much slower than in the past, reflecting faster gains in energy efficiency .
Rapid deployment and falling costs of clean energy technologies, growing electrification of ener-gy, cleaner energy mix in China, and resilience of shale gas and tight oil in the United States are expected be the main large-scale shifts in the global energy system, according to IEA .
Multilateral and international energy agencies forecast that all of the growth in energy demand will come from fast-growing developing economies, driven by increasing prosperity . China, India and other emerging Asia account for around two-thirds of the growth in energy consumption while Energy demand within the OECD is flat . Africa also plays an increasingly important role in dri-ving energy demand in the long term supported by an increasing population together with some pick-up in productivity .
0
5
10
15
20 OtherAfricaOther AsiaIndiaChinaOECD
0
5
10
15
20 RenewablesHydroNuclearCoalGasOil
Primary energy demand
Region Fuel
Source: BP Statistical Review 2018

Renewable energy is the fastest growing energy source (7% p .a .), accounting for half of the in- crease in power and its share is set to reach around a quarter of total power generation by 2040 . Coal is set to remain the largest source of energy for power in 2040 but its share is forecasted to account for just 13% of the increase (compared with more than 40% over the previous 25 years) .
The transport sector continues to be dominated by oil, despite increasing penetration of alternative fuels, particularly natural gas and electricity . In the BP Scenario, oil demand accounts for around 85% of total transport fuel demand in 2040, down from 94% currently . Natural gas, electricity and a mix of ‘other’ types of fuels are each projected to account for around 5% of transport fuel by 2040 . Hence, the transition towards a lower carbon fuel mix is set to continue .

15
Global Seaborne Trade
The low transport cost of shipping compared to other means of transport is the reason that about 90% of global goods transport is by sea . Improvement in port infrastructure and logistic chains and the new generation of energy efficient vessels are meant to benefit seaborne trade and maintain the leadership in international freight transport .
Since the downturn of 2009, when it slumped by 4%, world seaborne trade has grown by 38% . While seaborne trade appears to have settled on a lower growth path since 2011, it is still growing nevertheless and in fact recorded a rebound in growth in 2017 . Crude oil and oil products account for 27% of the total, dry bulk for 44% and containers for 16% . For 2018, the indicators are also po-sitive, the world economy being projected to almost double over the next 20 years, which means that additional seaborne transport capacity will be required . However, several factors may affect the outlook of seaborne trade growth in the longer term . While world economy and trade develop-ments continue to be key drivers in the evolution of seaborne trade, the relationship between eco-nomic output and trade of goods has been shifting over the recent years, the trade to GDP growth ratio being expected to remain at 1 .4 in 2018 . Hence forecasting solely based on GDP evolution and merchandise trade may no longer be sufficient as several factors come into play in connection to seaborne trade patterns’ (re) definition and evolution . These notably include infrastructure de-velopment projects such as the Belt and Road initiative (China), geopolitical developments, and potential escalation of trade restrictive policies affecting business confidence and investment de-cisions . Protectionist tendencies in several major world economies may have the potential to limit world trade growth and hence seaborne trade recovery in the coming years .
World seaborne trade volumes are forecasted to expand across all segments, with containerized trade and major dry bulk commodities trade witnessing the fastest growth . Dry bulk trade is fore-casted to continue growing in the long term following a 4% volume expansion in 2017 (in contrast to an average growth of just 0 .8% p .a . in 2015-16) to reach 6,367 million tons in 2035 . Positive drivers for continued expansion in the short-term include rising South East Asian coal imports, growing demand for high-quality foreign iron ore in China and the positive impact of improving global economic growth on minor bulk trade . Containerised trade is also expected to continue growing to reach approximately 3,600 mln tons in 2035, driven mainly by rising intra-Asian trade volumes and improved East–West main lanes flows . Seaborne crude and oil products trade is fore-casted to continue to grow, supported to large extent by increasing energy demand coming from emerging economies and growth in Middle Eastern and US exports driven, albeit at a steadily decreasing pace .
Total oil cargo
Total five major bulk
Minor bulk
General cargo
ContainerisedLPG
LNG
Global Seaborne Trade
0
500
1.000
1.500
2.000
2.500
3.000
3.500
4.000
4.500
5.000
1990 1995 2000 2001 2002 2003 2004 2005 2006 2007 2008 2009 2010 2011 2012 2013 2014 2015 2016 2017 2020 2025 2030 2035
million tonnes
Global Seaborne Trade forecast 2035 (mln tons). Source: SEA Europe WG MF, 2018

0
2000
4000
6000
8000
10000
12000
14000
16000
18000
1970
1975
1980
1985
1990
1995
2000
2001
2002
2003
2004
2005
2006
2007
2008
2009
2010
2011
2012
2013
2014
2015
2016
2017
2020
2025
2030
2035
Total trade in mln TONS
Total trade in mln TONS
Total trade in mln tons. Source: SEA Europe WG MF, 2018

17
Impact of Environmental Regulations
The impact of the recent and future waves of more stringent environmental regulations at global and regional level is an increasingly fundamental factor to consider when forecasting how the fleet will look like in the coming decades . Hence, the increasing, and probably overdue, environmental pressure on shipping and its potential impact on e .g . fleet replacement vs retrofitting needs or tonne-miles capacity in the bulker or container segments (resulting from slow steaming) has been incorporated in the newbuilding requirement forecasts of this report .
Shipping has come under serious pressure over the last decades due to its environmental impact: ships generate emissions of sulphur oxides (SOx), oxides of nitrogen (NOx), particulate matters (PM) and carbon dioxide (CO2) . These substances are a result of the current fuel used to power ships and especially in areas with heavy marine traffic ship generated emissions can be significant and have a negative impact on the population’s health . Moreover, the introduction of invasive ma-rine species into new environments by ships’ ballast water or attached to ships’ hulls and via other vectors has been identified as one of the greatest threats to the world’s oceans .
As a result, international and regional rules on fuel oil maximum sulphur content as loaded, bunke-red and subsequently used on board were introduced for Sulphur Emission Control Areas (SECA) and outside them with a stepwise increase in the sulphur content restrictions . The enforcement of a 0 .5% global sulphur cap on all marine bunkers from January 1, 2020 in particular is expected to be an important game changer . Similarly, NOx emission reduction regulation enforced from 2016 onwards requires newly built ships to meet the 80% Tier III criteria when operating in a NOx Emis-sion Control Area (NECA) . Increasingly stricter regulation of emissions and widening of respective control areas is expected to continue .
Shipping’s greenhouse gas (GHG) emissions and the associated climate impact were subject to intense debate within the International Maritime Organisation (IMO) . Although global regulation on mandatory energy efficiency standards in shipping was introduced in 2013, various studies projected shipping’s GHG emissions to grow if additional measures are not taken . For example, the official IMO GHG study foresees an increase of shipping’s GHG emissions of 50-250% by 2050 .
Range of exptected increase in GHG emissions from shippingMt CO2
3000
2500
2000
1500
1000
500
01990 1995 2000 2005 2010 2015 2020 2025 2030 2035 2040 2045 2050
Source: Third IMO GHG Study (2014) Transport & Environment

In April 2018, the IMO adopted an initial strategy aimed at reducing the total annual GHG emis-sions by at least 50% by 2050 compared to the 2008 level of emissions . Such decision is a key starting point towards the adoption of a revised – and hopefully more ambitious – IMO strategy in 2023 .
Finally, the IMO Ballast Water Management Convention (BMW), adopted in 2014 to prevent the spread of harmful aquatic organisms from one region to the other through the release of ships’ ballast water, entered into force on 8 September 2017 . The Convention prescribes that ships must adhere to certain discharge standards through the use of a ballast water system before the dead- line of 8 September 2024 .
Over the past recent years, the European Maritime Technology sector has helped the shipping industry with developing several technological and operational measures to enhance the sector’s environmental performance . Examples are modifications to ships’ design, development of onboard software dedicated tools to enhance energy efficiency, EEDI, alternative hull paints, conversion to alternative fuels like LNG etc . In 2018 EU shipyards and maritime technology producers are world leaders in LNG fuelled ships and alternative fuel engines and systems with a total aggregated portfolio in excess of € 15 Billion . Despite these positive developments it goes without saying that more efforts will be required to ensure that shipping really becomes environmental neutral by 2030 or 2050 .
While a rush in newbuilding activity in the short term is not to be expected in view of the upco-ming environmental regulations, there seems to be increasing speculation from various investors in Asian countries that hundreds of tankers and bulk carriers will be “removed” from the fleet by 2020 because they will become unprofitable as a result of the switch to low-sulphur fuel and associated rising costs . This would create a replacement demand for those vessels which would in turn trigger newbuild orders . For the time being, it can be observed that the increase in newbuild orders is reasonably steady but not at a high pace . IMO’s planned 50% GHG emission reduction targets may have however positive implications in the longer run for the newbuilding markets, quickening the pace of ship obsolesce and encouraging scrapping of old tonnage .
In the short term the biggest technical “disruption” will be assumably the 2020 0 .5 global sulphur cap enforcement . In the main merchant shipping segments shipowners are waiting to see what will happen in 2020, notably in relation to compliant fuel availability but it is expected that most of them will initially use fuel with low sulphur content . Given that the estimated extra cost will be about 400 dollars per fuel ton, shipowners are expected to employ slow steaming, reducing the speed by a few knots to compensate the higher fuel costs .
Installations and use of Exhaust Gas Cleaning Systems (commonly known under the name of “Scrubbers”) in combination with conventional engines running on heavy fuel oil (HFO) will conti-nue over approximately the next ten years but there is increasing awareness about the “transitio-nal” nature of such solution . Moreover, the use of open loop scrubbers in sensitive environmental areas or in ports may become limited if waste water discharge regulations become stricter .
Albeit still marginal in comparison to the total fleet size, the uptake of LNG-fuelled vessels is growing . There are currently 118 LNG fuelled vessels globally, excluding LNG carriers and inland waterway vessels, of which more than two-thirds are operating in Europe . A confirmed order book of 111 vessels will see that figure double . In addition, there are 114 vessels that are classified as LNG-ready . There is an increase in government-backed initiatives such as in Japan, Korea and China to develop LNG bunkering infrastructure as part of their commercial strategies and GHG reduction targets (DNV GL, 2017) . A quicker uptake of LNG as a fuel for shipping is thus clearly visible, also beyond short-sea ships operating in areas with developed gas bunkering infrastructu-re . As major pioneer and driver for LNG propulsion the cruise industry has stepped up ordering of clean vessels . The new orders for large LNG fuelled cruise ships already represent a quarter of all cruise tonnage on order . The multi-billion dollar investments are triggering LNG infrastructure particular in cruise destination ports . With bunkering infrastructure developing around the world, the concept is becoming increasingly appealing also to container lines, with several now giving serious consideration to LNG for their newbuild fleets as well . Lloyd’s Register Marine and the UCL Energy Institute expect that around 30% of all tankers will be fuelled by LNG by 2030 .

19
LNG might see a growing uptake in the short and medium term as part of industry efforts to miti-gate CO2 emissions, in particular if LNG becomes cheaper than low-sulphur fuels . LNG fuelling is projected to account for almost 200,000 barrels of oil equivalent per day of global bunker demand in 2020 but could take until the 2040s to overtake oil-based fuels (Alphatanker analyst 2018) . Whereas LNG is currently the most promising alternative, it remains a carbon fuel and it contributes to GHG emissions also in terms of methane slip . Therefore, in the long-run the decarbo-nisation objective will require zero-GHG fuels such as renewable gases or liquids e .g . methanol . Already today, first commercial vessels operate on methanol while others gather experience with the use of fuel cells .
It is likely that what will be needed to meet future emission targets will be an intelligent mosaic of various cleaner energy sources and integrated solutions . A large number of future new-builds will be equipped with multi-fuel engines to allow for a smooth transition of main fuels, while ultra-low or zero emissions will be achieved by electric propulsion in special areas, such as ports or ECAs . Several locally operating vessels will become fully electric (small, full electric ferries are already available on the market) as large high-density battery systems will become available driving stronger market uptake, while other vessels will have hybrid propulsion systems . Ships will become wind-assisted and batteries for non-propulsion workload will be recharged by solar energy .
With regard to ballast water, to date more than 60 ballast water treatment systems have been given type approval . European maritime technology industry has up until now developed approxi-mately 70% of total ballast water system, which is a market worth around 34 billion EUR . Uptakes across mainstream shipping segments was for the moment quite limited owing to the delayed ap-plication of the new rules, but the convention deadline of 8 September 2024 is expected to lead to an acceleration in demand and supply on the market for ballast water systems in the coming years and stimulate retrofitting activity .
To conclude, the recent and future wave of increasingly stringent rules will have not only an impact on the environmental performance of the shipping sector . They will also contribute to technology developments and growth in shipbuilding, repair and marine equipment industry by creating po-tentially new business opportunities . To meet global environmental targets as well as the internatio-nal regulations, current technologies will have to undergo major modifications and new innovative solutions will have to be established . Initiatives and standards will increasingly take into account the whole life-cycle of a ship, from raw materials used in shipbuilding to final dismantling . Growing public expectations related to environmental protection will result in more non-governmental and industry-led initiatives with new and additional voluntary standards . The shipbuilding and marine equipment industries are hence expected to play a large role in mitigating adverse impacts of ship-ping and allow the sector to respond to policy and societal requests to enhance its environmental sustainability .

21
Newbuilding Requirements: Cargo carriers
a. Container Ships
Containerisation has played a crucial role in the development of global trade . It greatly reduced the cost of international trade and increased its speed, especially of consumer goods and com-modities . Standardised containers made it possible to ship increasing volumes of goods around the globe in a cost-effective way . The constant growing of containerisation’s significance reflects the changes that have occurred over time in the international system set-up of manufacturing and production . Approximately 90% of non-bulk cargo worldwide is moved by containers stacked on transport ships .
Containership market conditions have improved in 2017, following a severely pressurized market environment in 2016 . In the freight market, rates appeared to have bottomed out in 2016 on both mainlane and non-mainlane routes . Whilst rates on most trade lanes have remained volatile, and on some have lost some ground since the start of 2017, they remain considerably above the historically depressed levels seen in early 2016 . This improvement was supported by more positive fundamentals as well as strong demand by liner companies for tonnage ahead of the launch of the new alliance services structures . Subsequently, charter rates have generally moved sideways or gradually upward, although there has been variation across the size sectors . Overall more positive demand trends, combined with continued moderate supply growth, have helped to start to re-balance the containership sector . Meanwhile, second-hand boxships prices have also recorded gains in 2017, away from the historically low levels of end 2016 .
Demand
Following growth of 3 .8% in 2016, container trade expansion has accelerated further in 2017, with volumes close to 200m TEU and growth reaching 5% . The healthy performance of box trade in 2017 has received broad support across the trade lane spectrum, including strongly positive growth on the Transpacific trade and a continued return to robust levels of growth on intra-Asian trades . North-South volumes have improved beyond initial expectations, buoyed partly by a gra-dual increase in commodity prices .
For the full year of 2017, data provider CTS (Container Trades Statistics Ltd .) counted 40 .9m TEU being transported between different Asian ports (+4 .3% Y/Y) . On the most important long-haul tra-des, CTS counted 18 .5m TEU going from the Far East into North America (+7 .3% Y/Y) and 15 .8m TEU on the routes from the Far East into Europe (+3 .7% Y/Y) .
Demand also grew on the Far East to Sub-Saharan Africa trades (+5 .9% for the full year of 2017) . Another “lower volume trade” that grew strongly in 2017 was the Far East to South and Central America trade lanes, shipping 3 .6m TEU during 2017, up by 10 .7% on last year . 2017 was hence marked by strong improvement signals . However, there was still some concern over the large amount of new capacity due to enter the market in 2018 .
Supply
In full year 2017, boxship fleet capacity grew 3 .7% to 20 .8m TEU (across 5,063 ships), following 1 .2% expansion in full year 2016 . Deliveries, though up on 2016, remain down on 2015 s record levels, with 1 .2m TEU for full year 2017 and the rate of “non-delivery” of the start year order-book at around 38% . Demolition reached a record 0 .65m TEU in 2016, and although unlikely to hit that level again this year, remains elevated, with 0 .4m TEU sold for recycling in 2017, including 57 old Panamax´ units . The average age of demolition in 2017 stands at 21 years . With regard to contracting activity, 112 units of 0 .6 m TEU were ordered . At the end of December, the orderbook totalled 398 ships of 2 .8m TEU of which 235 are of feeder type under 3,000 TEU, 68 are ULCS of

12,000 TEU and more, and the rest are between 3,000 TEU and 12,000 TEU, representing 13% of the fleet . The figure shows the CGT per vessel, that has been increasing in recent years .
20.000
25.000
30.000
35.000
40.000
2003
2004
20
05
2006
2007
2008
2009
2010
20
11
2012
20
13
2014
20
15
2016
2017
Reeks1 Lineair (Reeks1)
average CGT completed
Source: SEA Europe WG MF/ IHS Fairplay 2017
Containership fleet age structure
In 2017, approximately 25% of total containers are over 15 years old . The average age for the fleet was 11 .9 years . The orderbook covers 7% of the fleet .
25%
33%
22%
13%
7%
> 15 years 10-15 years 5-9 years
<5 years Orderbook
container fleet age structure
Source: SEA Europe WG MF, 2018 / IHS Fairplay, 2017
Slow Steaming
Slow steaming started in 2007 – 2008 triggered by the financial crisis, when the market started to face an oversupply of tonnage, declining freight rates and increasing bunker prices . Through slow steaming vessels save bunker fuel, which is the largest component of operating costs structure . So, the practice of deliberately slowing down the speed of a ship was based mainly on economic reasons .
While shipowners are currently waiting to see what will happen in 2020 when the global Sulphur cap enters into force, it is expected that most of them will initially use fuel with low sulfur content . Given that the estimated extra cost will be about 400 dollars per fuel ton, shipowners will employ slow steaming, reducing the speed by a few knots to compensate the higher fuel costs . This will result in a reduction in the available containerships tonnes-mile capacity .
0
2
4
6
8
10
12
14
16
18
20
1987
19
88
1989
19
90
1991
19
92
1993
19
94
1995
19
96
1997
19
98
1999
20
00
2001
20
02
2003
20
04
2005
20
06
2007
20
08
2009
20
10
2011
20
12
2013
20
14
2015
20
16
2017
Deliveries mDWT
containerships fleet in millions DWT year delivered

23
Container Market Outlook
While freight rates appear to be sustaining more positive levels than in 2016, continued big ship deliveries suggest that further improvements in freight market conditions will be hard won by ope-rators . The charter market has made useful gains, with idle capacity much reduced (to about 2% of capacity), and supply side trends remain supportive . Although demolition has recently slightly slowed, overall expansion in containership fleet capacity is still expected to remain fairly moderate into the medium-term . Trends on the demand side are increasingly encouraging, though risks to trade growth remain . Further projected improvements in the fundamentals should support conti-nued re-balancing along with a continued focus on liner company consolidation, and the sector as a whole now appears to be starting to build on the foundations in place for gradually improved market conditions .
The container shipping business is also changing, and operators are forming new alliances to in-crease operational efficiency . The alliances formed in the market limit the amount of port calls due to the large vessels for the main routes, which results in an increased number of feeders especially for small ports and shorter shipping routes . We can also notice a predilection for eco-friendly designs .
The phase-in of the new large containerships in 2018-2020 together with the scrapping of the oldest feeder fleet have produced a feeder vessel shortage . Therefore this will create a need to order and deliver a high number of feeder units until 2020 to maintain the same relative structure of the fleet .
Overall demand growth is expected to be lower than in 2017, but still high enough to potentially improve the fundamental market balance . BIMCO forecasts demand to grow by 4 .0-4 .5% against a fleet growth of 3 .9% in 2018 . The IMF January update of its World Economic Outlook signifi-cantly lifted expected GDP growth in advanced economies for 2018 and 2019, and growth in advanced economies is generally good for container shipping demand .
0
50
100
150
200
250
300
350
0
2.000.000
4.000.000
6.000.000
8.000.000
10.000.000
12.000.000
2011 2012 2013 2014 2015 2016 2017 2018 2020 2025 2030 2035
Containerships Completions, Actual and Forecast CGT Vessels
Source: SEA Europe WG MF , December 2017 / IHS Fairplay, 2018.Note: the bars represent CGT, while the line represents number of vessels

B. General Cargo ships
Background and fleet profile
For a century, the general cargo ship was the workhorse of global seaborne trade . This started to change with the advent of the container ship in the late 1960s . By the mid-80s, classic general cargo vessels were being sent off to the scrapping beaches in droves, as containerships pushed these ships out of more and more trades . As the classic general cargo ship left the scene, the com-position of the general cargo tilted more and more towards short sea cargo ships below 10,000 dwt carrying capacity on the one hand and multipurpose and heavy lift tonnage on the other hand . Despite these changes to the composition of the general cargo fleet, the decline in size and market share of this fleet continued . Of course there were certain periods of revival (as seen in the graph below), but overall the general cargo fleet has declined quite sharply in size, from 116 million dwt in 1980 to 75 million dwt as of the beginning of 2017 . Because the total merchant fleet expanded sharply in the same timeframe, the general cargo fleet’s share of the world merchant fleet has declined much more severely, from 17 .0% in 1980 to 4 .0% at the beginning of 20171 .
116 106 103
104 101
92
108
78 74 75 75
0
20
40
60
80
100
120
140
1980 1985 1990 1995 2000 2005 2010 2014 2015 2016 2017 0
2
4
6
8
10
12
14
16
18
General Cargo fleet development, 1980-2016, in size and share of world fleet
Million DWT %
General Cargo fleet development, 1980-2017, in size and share of world fleet. NOTE : bars indicate fleet size, while the line indicates market share (Source : UNCTAD review of maritime transport, issues 2012, 2015 & 2017). This graph is meant as an indication and is based on Clarksons data. The numbers may not match those used in the SEA Europe forecast, which is based on IHS Fairplay data.
While general cargo vessels have been replaced by container ships in many trades, there are some regions where volumes and port infrastructure do not (yet) allow replacement by container ships . General cargo ships with their own gear have the advantage of flexibility and can call at small ports with no ship-to-shore cargo handling equipment, while the ever-larger container ships require container cranes on the quays2 . More importantly, there are several trades for which con-tainer vessels are not suitable . Examples are short sea shipping and heavy lift shipping . These two shipping segments enjoyed a strong revival during the economic boom prior to the Lehmann crisis of 2008 . Short sea shipping, in Europe in particular, benefited from strong economic growth in various EU economies and plentiful financing, especially in Germany and the Netherlands, where the KG3 and CV4 capital structures attracted many new investors . Heavy lift shipping rode the wave of demand for project cargoes to China, as that country rapidly became the world’s factory . Heavy lift and multipurpose tonnage is very suited for the transport of outsized or breakbulk cargo which does not fit well in a container .
1) UNCTAD, Review of Maritime Transport 2017, pg . 242) UNCTAD, Review of Maritime Transport 2017, pg . 233) KG=Germany Limited Partnership4) sCV=Dutch Limited Partnership

25
The economic boom of the mid-00’s led to a sharp recovery of the size of the general cargo fleet, from 92 million DWT in 2005 to 109 million DWT in 2009 and 20115 . Unfortunately, the reco-very was shortlived as the general cargo fleet saw a very sharp decline in the years from 2011 onwards: in the space of four years (2011-2015) the fleet declined from 109 million DWT to 74 million DWT: a decrease of 32 percent and the worst decrease on record since 1980 .
As of December 31, 2017 the General Cargo fleet, as per the registers of IHS Fairplay, consisted of 15,189 ships . These are all vessels carrying an IMO number and they are classed by IHS either as “In service/commission”, “Laid up”, “In casualty or repair” or “Converting/rebuilding” . Of this total, 13,588 vessels are classed as “General Cargo Ships” . Heavy lift and multipurpose ships account for another 479 ships . The remainder of the category is made up by niche tonnage such as deck cargo ships, livestock carriers, semisubmersible heavy lift ships and the lone yacht carrier .
A large part of the fleet is very old: some 6,829 vessels or 45 percent of the fleet is at least 25 years old . At the same time, 3,635 vessels or 24 percent of the fleet is at most ten years old . The high proportion of old vessels indicates significant fleet renewal potential in the years ahead . Un-fortunately, trends in recent years have shown that the amount of vessels scrapped ever year quite often exceeds yearly newbuild deliveries . As newbuilds tend to be larger than the vessels they replace, the decline in terms of tonnage is less pronounced than the decline in numbers of vessels .
•Recent Market Developments and Market Drivers
With the European short sea shipping industry currently in the doldrums, ordering of newbuilds for this segment has slowed down significantly in recent years . Low freight rates, lack of finances on the shipowners’ side and reluctance of banks to finance newbuilds have left only a few European owners able to order newbuilds . When these owners do order newbuilds, the new ships tend to be much more efficient than the ships they are replacing, in order to reduce fuel consumption, harmful emissions and to comply with the EEDI6 design criteria of the IMO7 . Hulls are being opti-mised and installed engine power is being reduced, compared to older vessels . The large Dutch short sea shipowner, Royal Wagenborg, has indicated that its latest 22,000 dwt newbuildings of the R-BORG class burn two thirds less fuel than the 8,400 dwt ships from the late 90s they are replacing . Despite being almost three times larger, the R-BORG series has 15 percent lower instal-led engine power than its late 90s fleetmates8 . Short sea vessels with Open Top notation, able to sail without hatchcovers, are also on the rise . These vessels are particulary suited to ferry windmill parts to offshore windfarm installation projects . The very latest generation of these open top ves-sels has been adapted further to include a Dynamic Positioning system, increasing suitability for the offshore windfarm market . In recent years, many heavy lift vessels for project cargoes have been built as well, but this segment is currently also suffering from overcapacity and low rates, resulting in an early withdrawal of vessels with lower lifting capacities . Last but not least, the issue of sulphur emissions is firmly on the cards for short sea vessels, as many trade in present or future Sulphur Emission Control Areas, coupled with the global sulphur cap for shipping of 0 .5% per 20209 . While some ships have been retrofitted with sulphur scrubbers, these installations are pro-ving too large or too expensive for most short sea ships . Also many of the smaller short sea ships are either running on marine diesel, which is already compliant with the upcoming sulphur cap or their fuel consumption when running on Heavy Fuel Oil (HFO) is so low that the business case for a scrubber is not viable . Meanwhile, yards in Europe and China are starting to deliver the first short sea ships fuelled by LNG-burning dual fuel engines . Further on the horizon, issues like remote monitoring, autonomous ships and battery-powered ships are coming up .
5) UNCTAD review of maritime transport 2010, pg .30 & UNCTAD review of maritime transport 2012, pg .316) Energy Efficiency Design Index7) International Maritime Organisation, a United Nations agency8) Presentation by Albert Engelsman, Royal Wagenborg, 10/9/’159) IMO .org, 15/11/’16

•demand and supply
As indicated before, there is significant overcapacity as well as a severe lack of financing for newbuilds in the European short sea sector . Dutch short sea expert Johan Wagelaar only sees a balancing of demand and supply in the European short sea market by 2020, providing demand growth remains at 2 percent per year and newbuild contracting remains low10 . Contracting of ge-neral cargo newbuilds worldwide is in fact currently very low, resulting in a sharp drop in expected newbuild deliveries, from over 1 .05 million CGT for 2017, via 1 .87 million CGT in 2018 to a mere 660,000 CGT in 2019 . Deliveries for 2018 will probably end lower than expected due to delays on newbuilds, resulting in slightly higher final numbers for 2019 . Upon closer examination, over 300,000 CGT of the current general cargo orderbook was contracted before 2013, raising doubts whether this tonnage will be delivered at all .11 On the upside, some new contracting for 2019 deliveries is still to be expected, as general cargo ships generally have fairly short lead times . Nevertheless, the outlook for the next few years for yards specialising in general cargo tonnage is challenging . An improvement of newbuild contracting towards the end of the current decade (2018-2020) would seem likely though, given the significant scrapping potential of the existing fleet, exacerbated by upcoming new environmental regulations as detailed before . In addition, the orderbook-to-fleet ratio for the general cargo fleet at the end of 2017 was low at approximately 3 .3% in CGT terms .
In his very latest update, Mr Wagelaar notes that the financial situation of publicly listed European short sea operators is rapidly improving and specialised shipyards are starting to see a recovery of ordering for short sea tonnage as of May 2018 .12
•Uncertainties and Possible Future Demand Drivers
Of course, there are many developments and circumstances which are hard to predict in a de-mand requirement forecast . Perhaps intra-Asian trade will grow so fast that there will be a sharp increase in Asian demand for short sea vessels . Alternatively, a lot of this new intra-Asian traffic could be containerised immediately . Another interesting potential development could be that of unmanned ships, which might generate so many savings that wholesale replacement of existing manned ships by newly built unmanned short sea ships turns out to have a solid business case .
In the heavy lift and project cargo sector, a continuous push for larger and more capable ships (mainly in terms of lifting capacity) could generate a premature fleet replacement of the exi-sting ships . With the Chinese economy reaching maturity, the “Belt and Road’ (BRI) initiative or “Maritime Silk Road” of the Chinese government might generate renewed intense demand for heavy lifters . Also, a continued growth of several energy- and resource-rich African countries could spur heavy lift demand . At the time of writing however, the fate of many of these sub-Saharan “boom” economies is hanging in the balance .
General Cargo market outlook
SEA Europe predicts a relatively modest demand requirement for on average 138 General Cargo vessel deliveries or 1 .05 million CGT per year for the period 2018-2020 . For the period 2021-2025, the demand recovery for General Cargo is expected to peak at an average of 218 vessel deliveries per year or 1 .77 million CGT . In the longer run, however, we expect the world’s gene-ral cargo fleet to resume the declining trend it has exhibited over the years . Our forecast for the period 2031-2035 is therefore decidedly bearish, at an average 67 newbuild deliveries per year or 616,000 CGT per year . Demolition numbers are expected to remain firm throughout the entire forecasting period, oscillating between 277 and 284 ships per year or 1 .42 to 1 .46 million CGT per year . There are simply that many elderly ships in the general cargo fleet .
10) Johan Wagelaar, Tristan Beumer; The European Short Sea market in perspective, Volume III, 2015, pg .2611) Data source: IHS Fairplay, updated to end August 201612) Johan Wagelaar, presentation for Netherlands Maritime Technology, 24 May 2018

27
0
100
200
300
400
500
600
700
0
500.000
1.000.000
1.500.000
2.000.000
2.500.000
3.000.000
3.500.000
2007 2008 2009 2010 2011 2012 2013 2014 2015 2016 2017 2018-20 average
2020-25 average
2025-30 average
2030-35 average
General Cargo Vessels Completions, Actual and Forecast
CGT VESSELS
Source: SEA Europe WG MF, 2018 / IHS Fairplay, 2017 Note: the bars represent CGT, while the line represents number of vessels
C. Bulk Carriers
Background and Fleet Profile
Bulk carrier market conditions have shown clear improvement in 2017, compared to the historically depressed market environment seen in 2016 . The bulk carrier segment as a whole has seen last year much more positive sentiment amongst owners and stronger investor interest than in the past years . Second-hand prices recorded strong gains in early 2017, while sale and purchase activity has remained high . The improved balance in the bulk carrier sector this year has largely been driven by positive developments on the demand side . While recycling has slowed this year, in line with higher earnings, overall fleet growth has remained relatively moderate allowing faster dry bulk trade growth to start to erode some of the surplus capacity .
Furthermore, there is more room for demolitions, particularly given costly regulations on ballast water treatment systems and low sulphur emissions that are coming into play, which may sway retirement decisions .
•Demand
Expansion in seaborne dry bulk trade accelerated to around 4% in 2017, following average growth of just 0 .8% p .a . in 2015-16 . Strong Chinese demand has remained a key driver of volume growth .
Chinese seaborne imports of iron ore, coal and crude oil have all grown strongly throughout 2017 . Both seaborne imports of crude oil and iron ore have reached the highest level ever recorded, while coal reached the highest level in three years .
Imports of crude oil and coal have benefited the shipping industry to the greatest extent as both volumes and distances have increased .
China continues to ramp up its imports of iron ore with seaborne imports growing 4 .7% in 2017 compared to 2016 . This amounts to a total seaborne import of 1,054 million tonnes of iron ore breaking the record of 1,006 million tonnes from the year before . Total Chinese imports of Iron ore by all modes of transportation was 1,075 million tonnes in 2017, compared to 1,023 million tonnes in 2016 .

•supply
Expansion in bulk carrier fleet capacity picked up slightly in 2017 to around 2 .9%, following mu-ted growth of 1 .4% in 2016 . Bulk carrier demolition has slowed in 2017, with 14 .5m dwt sold for recycling in 2017, compared to close to 30m dwt in full year 2016 . Meanwhile “non-delivery” of the scheduled orderbook has decreased slightly this year, but remains significant with 34% in dwt terms and 37 .4m dwt being delivered, down almost 20% compared to 2016 . Following a period of extremely subdued contracting, the orderbook has dwindled to total 733 vessels of 76 .8m dwt at the end of December 2017, equivalent to 9% fleet capacity . Newbuilding interest has picked up strongly in the bulk carrier market this year with 286 units ordered in January-December 2017 (54 in 2016) .
15%
22%
29%
25%
9% Capesize
Panamax
Handymax
Handysize
Rest
BulkcarriersNumber (Fleet end 2017)
Source: SEA Europe WG MF, 2018 / IHS Fairplay, 2017
Capesize spot earnings averaged in 2017 reached USD 13,475 per day, up to 125% from the full year 2016 average, and in late September reached the highest level for almost three years (with USD 24,018 per day) . The improved market conditions have been supported by strong demolition over the last few years (although recycling has slowed more recently) and the continued firm pace of growth in iron ore trade, which has helped to gradually absorb surplus capacity .
The Panamax market has also seen an improvement in 2017 reaching up to 57 .5% from the 2016 average . While lower recycling led to a faster rate of growth in the Panamax fleet this year (2 .8%) than in the previous year (0 .5%), firm growth in coal and grain trade has supported a more po-sitive market environment, although earnings this year are still 45% below the ten year historical average .
16.000
16.500
17.000
17.500
18.000
18.500
19.000
19.500
2003 2004 2005 2006 2007 2008 2009 2010 2011 2012 2013 2014 2015 2016 2017
Reeks1 Lineair (Reeks1)
bulkcarriers average CGT completed
Source: SEA Europe WG MF, 2018 / IHS Fairplay, 2017
Capesize
Panamax
Handymax
Handysize
Rest
Bulkcarriersdwt (Fleet end 2017)
23%
25%
11%
0%
41%

29
The high growth trend in the average vessel size continues, as can be seen in the above graph .
Fleet growth in the Handymax sector remained the fastest of all the bulkcarrier segments this year at 4%, but improved growth in seaborne coal, grain and minor bulk trade have still helped to ti-ghten the market . An improvement in minor bulk trade volumes has helped to support fundamentals in the Handysize market despite a slight acceleration in fleet growth . Average Handysize trip rates reached up to 46% compared to the 2016 average .
Bulk Carrier Market Outlook
Momentum in the bulk carrier market appears to have picked up pace this year, and with seasonal factors also playing a role, earning rose to the highest level in almost four years . The faster pace of growth in dry bulk trade has been a key factor behind the improved market environment in 2017, and there remain positive drivers for continued expansion in the short-term, including rising South East Asian coal imports, rising demand for high-quality foreign iron ore in China, and the positive impact of improving global economic growth on minor bulk trade . However, there remain risks to the demand outlook, including from the potential impact of environment inspections on Chinese industrial activity, and from further displacement of Indian coal imports from rising domestic coal output . Nevertheless, even if demand growth moderates slightly in the short-term, the expected sharp slowdown in deliveries in 2018 looks like to limit fleet growth to a very subdued level of 1% in short term .
One of the uncertainties is on the issue of sulphur gas emissions . Shipowners are waiting to see what will happen in 2020, so they will initially use fuel with low sulfur content (assuming that in 2020 there will be enough low-sulphur fuel to meet all the demand) . Given that the estimated extra cost is about 400 dollars per fuel ton, shipowners will employ slow steaming, reducing the speed by a few knots to compensate the higher fuel costs . It is estimated that this may results in a 16 .7% reduction in the available bulk carriers tonnes-mile capacity . On the other hand, the rise of new technologies will make the productivity of the fleet greater . Another factor to consider is that by 2020 there will be almost 20% of existing fleet that would be over 15 years of age and become likely scrapping candidates due to expensive regulatory environment, the evolution of BDI and higher scrap prices .
While challenges and risks remain, it appears that the bulk carrier market is starting to move on a more positive trajectory .
0
50
100
150
200
250
300
350
400
2005 2006 2007 2008 2009 2010 2011 2012 2013 2014 2015 2016 2017 2018 2020 2025 2030 2035
Bulkcarriers completions, actual and forecast
Capesize Panamax Handymax Handysize Rest
Num
ber
Source: SEA Europe WG MF, 2018

Bulkcarriers completions, actual and forecast
0
5.000.000
10.000.000
15.000.000
20.000.000
25.000.000
2005 2006 2007 2008 2009 2010 2011 2012 2013 2014 2015 2016 2017 2018 2020 2025 2030 2035
Capesize Panamax Handymax Handysize Rest
CGT
Source: SEA Europe WG MF, 2018
D. Oil & Chemical Tankers
Background and Fleet Profile
In the long term, the pace of growth in oil consumption slows down globally, albeit in absolute terms, going from growth of more than 3% per year to below 2% in 2030 and 2035 .
On the other hand, in the past decade the tanker fleet grew more than oil seaborne trade, gene-rating fleet overcapacity . The projection to 2035 shows that due to this overcapacity, the tanker fleet will grow less than oil seaborne trade .
0%
1%
2%
3%
4%
5%
6%
7%
8%
0
1.000
2.000
3.000
4.000
5.000
6.000
1990
1995
2000
2005
2010
2016
2020
2025
2030
2035
2040
mill
ion
tons
(Oil
equi
vale
nt)
World Oil Consumption million tons (Oil equivalent)
Non-OCDE OCDE Annual increase % - Right Axis
Source: SEA Europe WG MF, 2018

31
Tanker Fleet Requirement and Newbuilding Forecast
-5%
0%
5%
10%
15%
20%
2008
2009
2010
2011
2012
2013
2014
2015
2016
2017
2020
2025
2030
2035
Ann
ual G
row
th
Oil Seaborne Trade Growth and Tanker Fleet Growth
Oil Seaborne Trade Growth (mill. Tons) Tanker Fleet Growth (dwt)
Source: SEA Europe WG MF, 2018
We expect the oil tankers fleet requirement to expand at a rate of 1 .7% per year in terms of dwt . In contrast to the previous decade, tanker fleet grew at a rate close to 5% per year in terms of dwt . In the period 2018-2035, oil tankers new building requirements, according to our forecasts, have a mean of 300 units per year, 33 dwt pa, and 9 .4 CGT p .a .
E. LNG & LPG Carriers
Background and Fleet Profile
Between 2001 and 2014, the strong growth in LNG transport demand and high gas prices led to an increase in the contracting of LNG and LPG vessels . However, as of 2015, as a result of the fall in the price of natural gas and oil reduced freight prices, contracts fell sharply to the lowest levels of the last 10 years . In 2017 only 17 units of LNG were contracted and only 9 units in 2016, com-pared to 70 LNG contracts in 2014 and 37 in 2015 . 2035 forecasts estimate growth of seaborne trade in LNG of 5,1% pa .
0
1000
2000
3000
4000
5000
6000
7000
0
100
200
300
400
500
600
700
800
900
1.000
198
5 1
986
199
0 1
995
200
0 2
001
200
2 2
003
200
4 2
005
200
6 2
007
200
8 2
009
201
0 2
011
201
2 2
013
201
4 2
015
201
6 2
017
202
0 2
025
203
0 2
035
Aver
age
dista
nce
mill
ion
tons
(Oil
equi
vale
nt)
Seaborne Trade in LNG million tons (Oil equivalent)
LPG LNG
Average distance, n. miles LNG Average distance, n. miles LPG
Source: SEA Europe WG MF, 2018
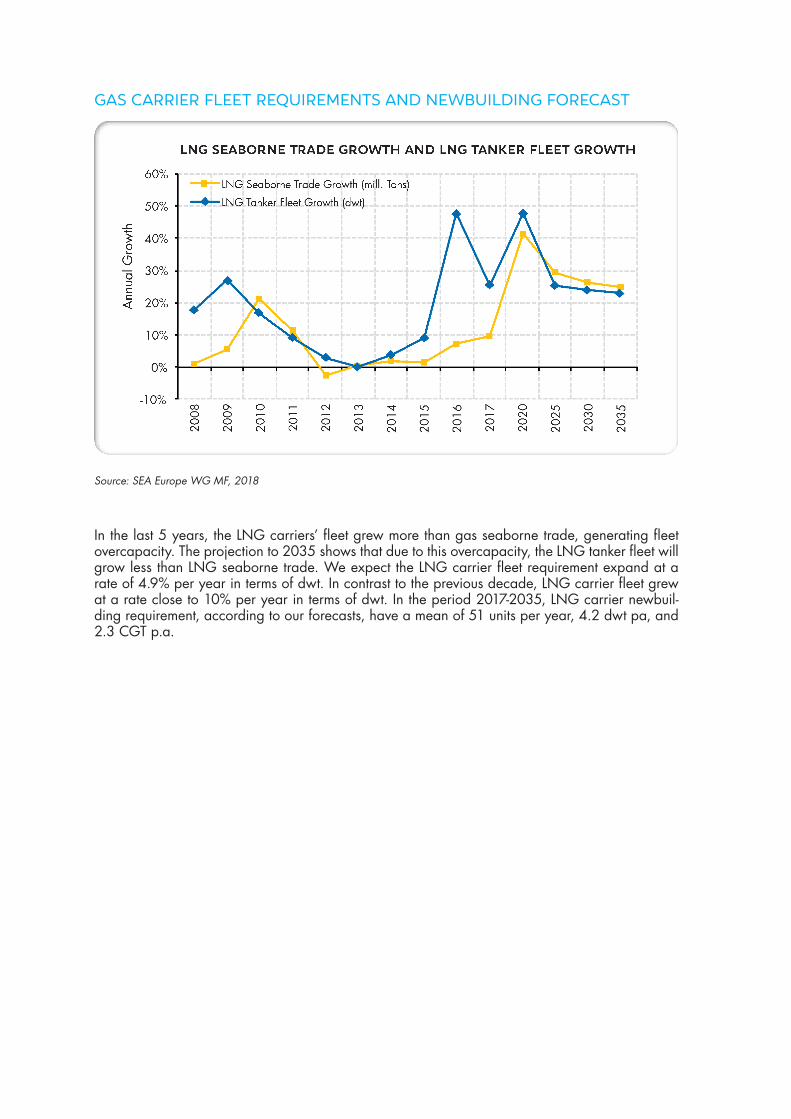
Gas Carrier Fleet Requirements and Newbuilding Forecast
-10%
0%
10%
20%
30%
40%
50%
60% 20
08
2009
2010
2011
2012
2013
2014
2015
2016
2017
2020
2025
2030
2035
Ann
ual G
row
th
LNG Seaborne Trade Growth and LNG Tanker Fleet Growth
LNG Seaborne Trade Growth (mill. Tons)
LNG Tanker Fleet Growth (dwt)
Source: SEA Europe WG MF, 2018
In the last 5 years, the LNG carriers’ fleet grew more than gas seaborne trade, generating fleet overcapacity . The projection to 2035 shows that due to this overcapacity, the LNG tanker fleet will grow less than LNG seaborne trade . We expect the LNG carrier fleet requirement expand at a rate of 4 .9% per year in terms of dwt . In contrast to the previous decade, LNG carrier fleet grew at a rate close to 10% per year in terms of dwt . In the period 2017-2035, LNG carrier newbuil-ding requirement, according to our forecasts, have a mean of 51 units per year, 4 .2 dwt pa, and 2 .3 CGT p .a .

33
Newbuilding requirements: Oil & Gas Offshore
Market drivers
The key driver for offshore newbuilding demand is the prevailing oil price and the perception of future oil price development vs . actual and expected cost development . Higher oil price results in a higher number of profitable offshore fields, increase in exploration activity and thus higher spending and a higher demand for rigs and ships .
However, there are significant differences in recognised oil analyst’s prognosis on future oil price development . As it is a challenge to predict future oil price it is equally challenging to predict the future level of offshore vessel demand or timing of the next peak .
New significant discoveries in one region will usually affect the sentiment to oil companies . New discoveries and high hit rates in areas previously regarded as not promising will be key drivers for increased interest and further exploration activity .
In emerging regions, the infrastructure is often limited, distances may be longer and the rig density is low . Thus, a higher number of support vessels per rig will be needed . Operation in arctic areas will drive this number even further .
Mature regions with predicted lower future production are often interpreted as declining offshore markets . However, lower production is also an important driver for higher exploration activity when there is a sufficient focus on replacing reserves . In addition, there will be higher focus on increasing the production rate per field or well (well intervention) . Development of marginal fields and tiebacks will also require subsea vessels . A mature installed base of subsea wells and pipeli-nes will require vessels for inspection, maintenance and repair . Then at some point there will be a need for decommissioning and specialist vessels accordingly . Activity in mature areas is often key for driving innovation with the North Sea as a good example .
Countries’ aiming to get less dependent on oil or gas import is also an important activity driver . For national oil companies (NOC) there will often be less attention on short-term profitability and more attention on long-term growth of reserves and production . This will depend on government policy . Still, as NOCs usually share production licences with international companies the challenge will be to make licences and projects as attractive as possible .
The mix of shallow water, deep water, ultra-deep water activity and effects of increased activity in remote areas is also key . Distances from shore are increasing leading to higher demand for more efficient vessels . With this there are new requirements and a need for more rigs and ships capable of operating in these areas in the most efficient and safe way .
More cost-efficient vessel designs and systems are also important drivers for newbuild demand as vessels then will have a competitive advantage, obtain higher utilisation and thus be preferred in the market .
The market cycle
Offshore shipping markets are normally very volatile . Oil price development has always been one reason for this, but other reasons are sometimes low market visibility, speculative orders, lack of discipline, the fight for market shares and overreaction from too many of the market players .
The market balance is sensitive with trigger effects . When fleet utilization is increasing above a certain level, the charter rates are sky rocketing with an order boom as a result . However, what is often the case is an order book containing too many vessels at the time when day rates start to drop again . The consequence may be several years with a low number of offshore orders .
Thus, the peaks may get higher and downturns deeper than what is possible to predict in a newbu-ilding prognosis .

Demolitions increase
Fleet shrinks
Lay-ups decreasing
Fright rates recover
Demand for newbuildings
increase
Yards reopened
or new yards
created
Excess of shipbuilding
capacity
Ship price drop
Cancellations
Lay-ups increase
Demand for newbuilding
drop
Fright rates drop
Over ordering by speculators/
bargain hunters
Oversupply
Shipping market cycle
The effects of shale oil
One main advantage of shale oil versus offshore is a far shorter lead-time from development to production start, reducing the time until a project turns cash positive . A disadvantage of shale oil wells is the higher decline rates compared to offshore, where the typical shale oil well declines 80% in production within the first three years . However, this becomes less of a concern when ta-king into account the lead times and costs .
According to several market observers, shale companies will struggle to keep growth rates up as they deplete the most profitable wells and have to move to higher-cost locations . Shale producers are also starting to face pressure from investors to stop growing at all costs, but rather to look at increasing cash flows instead .
With higher oil price and activity in the short and medium term, marginal costs for shale oil is expected to increase faster than for offshore . This is bringing offshore projects back to a compe-titive position .
Supply from offshore will be needed for decades . Shale will not be able to close the gap .
Offshore spending and activity
For E&P spending there was a trend shift in 2013, moving from double to single digit growth . The key reason for this was the stable oil price vs . very strong growth in costs . On the top of growth in costs there was a severe oil price slide resulting in aggressive spending cuts . It was a matter of survival . It was the first time in history that we saw reductions in E&P spending for three consecutive years .
However, after over three very lean years, companies are feeling the turn . After a prolonged effort to cut its cost base, there are clear positive signs in the industry . Investors in today’s $60-70 world are now viewing situation and outlook more positively . Oil demand has increased, not just becau-se of economic growth, but also due to the low oil price itself .

35
According to a report from DNV GL, confidence in industry growth has risen from 32% in 2017 to 63% in 2018 . In a survey from 2017, seven out of ten business leaders in the Norwegian oil and gas industry will hire more people in 2018 . The number of UK offshore fields set to get the go-ahead in 2018 alone represents a burst of 225% over the past two years combined, according to Rystad Energy . Shell says it has made one of its largest US Gulf of Mexico discoveries in the past decade at the deep-water Whale well . Brazil’s Petrobras is preparing a new wave of multi-billion dollar investments to help develop its massive pre-salt resources .
An offshore recovery is also needed to prevent an oil supply deficit emerging in the 2020s . The level of discoveries has been very low in recent years . A massive underinvestment could disturb the global supply system and trigger a new growth cycle, with shale production likely to prevent any drastic fluctuations in price .
A significant share of the growth in offshore spending that we saw before the oil price slide in 2014 was due to cost inflation, not increased activity . Now offshore is becoming much more cost efficient .
A significant reduction in costs - including improved project design, increased standardization, reduced complexity, increased drilling speed etc . - will help foster growth in offshore production . Field projects with sub-$40 break-even prices are matured to final investment decisions . For the giant Johan Sverdrup offshore field in the North Sea, break-even oil price in phase one is reduced to below USD 15 per barrel . The arctic offshore field Johan Castberg was originally not commer-cially viable with a break-even oil price of $80/bbl . Now the break-even oil price is $35/bbl . In 2013, the actual oil price was around $112/bbl . Still, Statoil’s cash flow was negative . Today, Statoil’s portfolio as a whole is said to have a break-even price of $27/bbl . According to Statoil, 80-90% of the cost improvements they have achieved are related to efficiency, doing things diffe-rently, not market effects nor deferring activities .
In general, oil companies and offshore operators have pushed down costs significantly in the past two years because of simpler concepts, cheaper equipment and more efficient drilling . This is af-fecting the number of profitable projects .
Offshore final investment decisions, subsea tree awards and general global upstream spending are set to rise further in 2018 . From a low base in 2016, offshore sanctioned capital expenditure was up 40% in 2017 . Project sanctions are set to further increase this year, but the timing of spen-ding will of course be spread out over several years .
Most market observers see higher oil prices in 2018-2019 and an increase in offshore E&P spen-ding from 2018 and onwards, perhaps with a significant increase in 2019 .
However, despite the above, several key questions remain; what happens if the OPEC cuts end, what will Russia do, to what extent an increase in US shale production will continue to impact the market, will there be a significant increase in onshore production in Iraq, the economic and politi-cal development in Venezuela etc .
The offshore fleet
The global offshore fleet consists of around 10,000 vessels across 30 vessel sub types with anchor handling tugs, platform supply vessels and crewboats representing more than half of this . These supply and service vessels are supporting over 1000 drilling rigs and floating production units in exploration and production activity . In addition, there are over 1000 offshore construction, crane, subsea support, pipelaying, inspection, maintenance, repair vessels in many shapes and sizes . Comments in this report will only cover the major categories .

The offshore shipping market outlook
Offshore E&P
0
20
40
60
80
100
120
2000-2004 2010-2014 2020-2024 2030-2034
0
100
200
300
400
500
2000-2004 2010-2014 2020-2024 2030-2034
Number of vessels by delivery year
0
100
200
300
400
500
2000-2004 2010-2014 2020-2024 2030-2034
Fleet growth – CGT mill
Fleet growth – GT mill
0
100
200
300
400
500
2000-2004 2010-2014 2020-2024 2030-2034
Fleet growth – DWT mill
Source: SEA Europe WG MF, 2018
•Drilling
The 2014-2016 oil price crash caused oil companies to cut exploration budgets, ending a boom in rig demand and bankrupting many owners . The dayrates and 2nd hand prices plunged . The downturn was both supply and demand driven where we still see a severe overcapacity for both shallow- and deep-water units .
However, demand is now starting to recover from its worst downturn ever . Energy firms are now hiring more rigs as crude prices have recovered some ground . The oil companies are left with a very different cost picture and the low rig rates will help them to increase activity . In addition, oil companies seem to believe in a higher future oil price and they will need to replace reserves to secure future revenues .
With many rigs and vessels having been cold or warm stacked since 2014, the question for owners will be when the time is right to re-mobilise these assets in preparation for a recovery . However, the costs of re-mobilisation can be significant and may outweigh the potential income going forward . Then scrapping will be a better option, helping to reduce overcapacity and thereby helping to improve utilization and charter rates . Many cold-stacked vessels will never return to the market .
Higher demand for harsh-environment rigs, particularly in the North Sea, may lead to increased rates already in 2018 . Other categories and regions may follow in 2019-2020 . According to Bas-soe, demand for deep-water rigs in South America may double by 2021 . In the US Gulf of Mexico, increased demand is fueled by significant discoveries . The global market is expected to improve gradually with an additional demand of around 60-70 floaters in 2020 .

37
Thus, there are absolutely signs of recovery, but the market will continue to be challenging for many owners and operators for some time to come . Given the overcapacity, the number of new rigs to be ordered the next five years will be limited . A few new generation units will be ordered despite oversupply, perhaps with a trend towards leaner, purpose-built and more cost efficient rigs .
•Floating Production
The number of deep water projects in the near-term planning queue indicates production floater orders are set to increase . Costs have dived and drilling is not a “bottle neck” anymore . There are over 200 projects at different planning stages (IMA) . Expected future oil price is what really counts .
The timing for when the projects will materialise is uncertain and there is a possible trend towards conversions rather than newbuilds . Thus, there is a challenge to evaluate number of newbuilds, but improvement is expected from 2018 onwards where Brazil’s ability to order new units will be key .
This market is important as driver for drilling, construction and subsea support activities and other offshore support vessels .
Construction & Subsea
Number of vessels by delivery year Fleet growth – CGT mill
Fleet growth – GT mill Fleet growth – DWT mill
0
50
100
150
200
250
300
2000-2004 2010-2014 2020-2024 2030-2034 0
20
40
60
80
2000-2004 2010-2014 2020-2024 2030-2034
0
20
40
60
80
2000-2004 2010-2014 2020-2024 2030-2034 0
20
40
60
80
2000-2004 2010-2014 2020-2024 2030-2034
Source: SEA Europe WG MF, 2018

•Construction Support Vessels
Evidence of a significant increase in activity, with actual awards gained, is good news for many shipowners with vessels in the subsea sector . Tender activity has increased from their previously low levels and is expected to increase further .
Strong demand growth towards 2020 and beyond is expected where field development will be the key driver . Another driver is also growth in installed base and inspection, maintenance and repair markets (IMR) .
However, we have a major build cycle behind us where most of these vessels were ordered on speculation . Combined with the drop in demand, this led to oversupply, downturn in charter rates and financial results . This resulted in almost full stop on the ordering of new ships in 2014-2017 .
As tasks are increasing in scope and complexity, many first-generation vessels will leave the market . New innovative solutions, combined with low ship prices, could stimulate demand for new vessels even in a market situation with oversupply . In the past, we have seen new and more cost-efficient technologies being developed in times with low oil price as well as new solutions which offered profit even in a difficult market .
However, the financial situation for many offshore shipowners is still challenging, and these ves-sels are very expensive . Thus, the number of newbuilds will be low in the short term, but it is still expected to pick up .
•Offshore Wind
The main advantage with offshore wind vs . onshore, is that the wind resource is much greater, thus generating more energy from fewer turbines . Offshore wind is suitable for large-scale develop-ment near the major demand; large cities .
There are four life cycle phases of an offshore wind farm: pre-Installation, installation, operation and decommission . In addition to purpose-built installation vessels, there are many other vessel types needed in these phases, but most of these can be found within other commercial segments (e .g . crewboats and cable layers) .
Development of offshore projects further from shore with increased turbine capacities is a trend . Greater distance from shore normally leads to deeper waters, where new foundation solutions are required . This will also have an impact on vessel size, requirements and capacities .
Costs have reduced significantly in recent years, predominantly due to the larger sizes of turbines installed with lower operational expenditures once wind farms become operational .
Strong growth in offshore wind markets is expected both in short and long-term . The average an-nual growth rate for new installations in the next decade is expected to be above 15% . In Europe, a tripling of capacity between 2020 and 2030 is expected .
As quite many vessels are too small to handle operations in deeper waters, the offshore wind in-dustry is most likely going to meet a shortage of installation vessels . However, we are not talking about many vessels per year in the short and medium term .
The market for offshore wind support or service operation vessels is also growing . Around 10-12 vessels have been ordered since 2013, 2-3 per year (> 80 m), but this will most likely increase from 2020 and beyond .
Due to low oil prices and the severe downturn in offshore markets, the utilization and day rates for subsea support vessels is very low and many vessels are laid-up . As offshore wind support is an adjacent market to these, ordering of new vessels is likely to be negatively affected in the short and medium term .
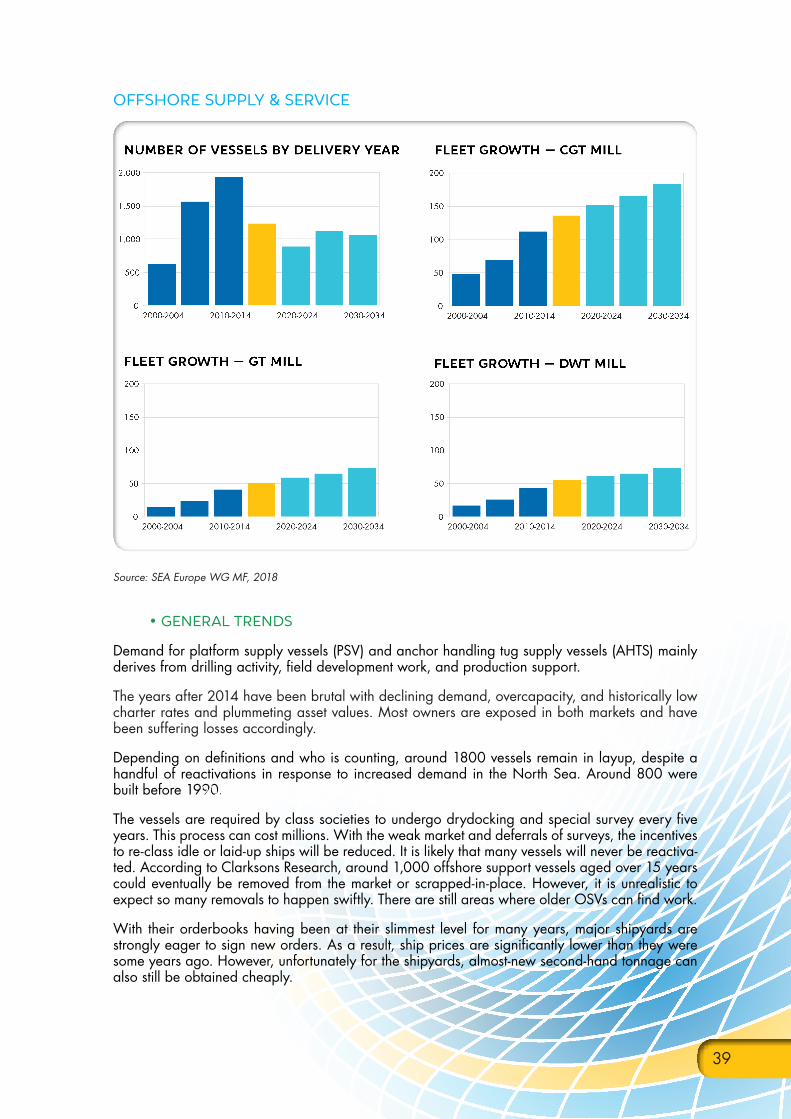
39
Offshore Supply & Service
Number of vessels by delivery year Fleet growth – CGT mill
Fleet growth – GT mill Fleet growth – DWT mill
0
500
1.000
1.500
2.000
2000-2004 2010-2014 2020-2024 2030-2034 0
50
100
150
200
2000-2004 2010-2014 2020-2024 2030-2034
0
50
100
150
200
2000-2004 2010-2014 2020-2024 2030-2034 0
50
100
150
200
2000-2004 2010-2014 2020-2024 2030-2034
Source: SEA Europe WG MF, 2018
•General trends
Demand for platform supply vessels (PSV) and anchor handling tug supply vessels (AHTS) mainly derives from drilling activity, field development work, and production support .
The years after 2014 have been brutal with declining demand, overcapacity, and historically low charter rates and plummeting asset values . Most owners are exposed in both markets and have been suffering losses accordingly .
Depending on definitions and who is counting, around 1800 vessels remain in layup, despite a handful of reactivations in response to increased demand in the North Sea . Around 800 were built before 1990 .
The vessels are required by class societies to undergo drydocking and special survey every five years . This process can cost millions . With the weak market and deferrals of surveys, the incentives to re-class idle or laid-up ships will be reduced . It is likely that many vessels will never be reactiva-ted . According to Clarksons Research, around 1,000 offshore support vessels aged over 15 years could eventually be removed from the market or scrapped-in-place . However, it is unrealistic to expect so many removals to happen swiftly . There are still areas where older OSVs can find work .
With their orderbooks having been at their slimmest level for many years, major shipyards are strongly eager to sign new orders . As a result, ship prices are significantly lower than they were some years ago . However, unfortunately for the shipyards, almost-new second-hand tonnage can also still be obtained cheaply .
2009 2010 2011 2012 2013 2014 2015

Many vessel owners and market observers expect a pick-up in offshore vessel chartering in 2018 with more vessel demand expected to follow from 2019 to 2021 . North Sea owners of offshore support vessels can expect to benefit from some uptick in utilisation already in 2018 . The increase in work is mainly due to higher rig activity in relation to drilling of both exploration and develop-ment wells as operators such as Statoil and Aker BP invest in new field projects, while also boosting spending on exploration . As costs finally settle at a bottom and operators set a new standard for operational efficiency, 2018 might be also a turning point for the deep-water sector in the US Gulf of Mexico .
Pareto estimates a global market demand for over 2,000 OSVs by 2020, as compared with demand for 1,725 of those ships now . Predictions are made with the assumption of oil price at between $50 and $60 per barrel .
A gradual increase in rig activity will improve the markets for both PSVs and AHTS . However, despite the potential for increased activity, the market will continue to be difficult for many owners and operators for still some time to come, but with regional differences .
•Platform supply vessels
We have seen a dramatic fleet increase for large PSVs and the market did earlier have an ama-zing ability to absorb new tonnage . However, those days were over in 2014 . A significant fall in contracting was expected, but then the oil price slide in 2014 put further pressure on market .
Dayrates are low and a significant number of vessels are laid up . There is still also a significant or-derbook where the majority of orders were placed at yards in China in 2012-2014 . However, quite many of these PSVs will never be completed or make it to the market . Many completed vessels are already in poor condition due to no inspection or maintenance, no ventilation, mold and rust . The condition will get worse in the course of the next years and will be hard to sell .
Charterers can now hire high-quality tonnage at a very low price . Thus, the outlook is best for new and efficient vessels . Older tonnage will often be ignored, and vessels will be scrapped or removed from the market . A survey made in 2017 revealed that most charterers would be reluctant to employ vessels that have been laid up for more than one or two years .
A lot of scrapping is needed to address the current supply overhang and the PSV market will conti-nue to be weak in the next few years . Yet, the bottom of the downturn has passed, future demand for PSVs will continue to grow, but it will take time to reach a market balance . Thus, the number of vessel to be ordered in the short and medium term is expected to be low .
•Anchor handling tug supply vessels
Moored rigs are the key drivers for anchor handling tug supply vessels; not only the number of rigs (semis and jack-ups), but the number of rig moves . A question is also whether mooring or dynamic positioning is chosen for optimal stationkeeping for semi–submersibles . FPSOs will also play a more important role as market driver in the future . Some light construction subsea work is also a part of the picture .
AHTS vessels are more exposed to exploration activity than PSVs and this area is typically the most volatile when oil companies make adjustments in spending . With the downturn in exploration drilling and low number of active rigs in recent years, the AHTS market was affected accordingly . As a result, there was a full stop of new orders, indeed for the larger units .
Utilisation and day rates are still low with many vessels laid up, but we see the early signs of an increase in rig activity . In addition, the activity related to FPSOs and subsea markets is expected to increase . This will increase the demand for AHTS, but regions remain uneven and improvement could be slow .

41
Also in the AHTS market we still see vessels on order, but for the same reasons as for PSVs it re-mains uncertain whether all of them will “make it to the market”, the smaller vessels in particular . The oversupply is not as severe as for PSVs, but only a few vessels will be ordered in the short term . The price of a large AHTS may be the double of a PSV . Traditional bank financing may still be difficult to source as many shipping banks had their fingers burnt in recent years .
Stronger long-term growth is expected as exploration and production activity is expected to increase .
Summary
Due to the oil price slide, there was a dramatic slowdown in all offshore markets . After an all-time high ordering activity, the downturn was both supply and demand driven . Both the low oil price and the cost development for oil companies required cuts in investments and postponement of projects .
As it is close to impossible to predict future oil price development, it is also very difficult to predict the future level of vessel demand, but it will still take some time before we see a balanced market and a significant increase in the ordering of new offshore vessels .
Costs and efficiency requirements are important drivers for innovation and technology develop-ment . Thus, these are times offering also opportunities . There are still challenges ahead but the cri-sis is over and we see an industry with a very different cost picture . The reduction in break-even oil price for new offshore projects is massive and there is a significant need for increased exploration . Combining that with higher oil price, we get higher number of profitable offshore fields, growth in spending, higher activity and a higher demand for rigs and ships .
All in all, there is much more optimism in 2018 than in 2017 as key drivers show a more positive development . The market will be back, but most likely not to the heights we have seen the last decade . Market development from here maybe slowly upwards, but “the deeper the downturn, the sharper the rebound” is often the case (ref . to section about the market cycle) .
With a growing global population, increasing industrialization, urbanization and growth in ener-gy demand, the long-term outlook for offshore is promising, also because of expected strong growth in offshore wind related activities .
Number of vessels by delivery year Fleet growth – CGT mill
Fleet growth – GT mill Fleet growth – DWT mill
0
500
1.000
1.500
2.000
2.500
2000-2004 2010-2014 2020-2024 2030-2034 0
100
200
300
400
500
2000-2004 2010-2014 2020-2024 2030-2034
0
100
200
300
400
500
2000-2004 2010-2014 2020-2024 2030-2034 0
100
200
300
400
500
2000-2004 2010-2014 2020-2024 2030-2034
Source: SEA Europe WG MF, 2018


43
Newbuilding Requirements: Passenger Ferries
Background and fleet profile
The Passenger Ferry sector includes Passenger/Car ferries and pure Passenger vessels without Ro-Ro facilities (Roll-on Roll-off) . Passenger/Car ferries account for the majority of vessels in this sector . They are defined as vessels having a passenger capacity in excess of 50 persons . Addi-tionally, vehicles can be driven on and off a car deck . Passenger vessels without Ro-Ro facilities are defined as vessels connecting two ports on a regular basis . The ratio of passenger capacity to cargo should be high . These vessels are designed to link transport networks as efficiently as pos-sible, both in national as well as international trade . Japan is a good example of linking national transport networks . Good examples of linking international networks are the connection between the United Kingdom and the European mainland through the English Channel or the link between Denmark and Germany on the one side and Scandinavia on the other . Due to the low prices of airlines on certain routes (e .g . the connection of the European mainland with London) and the time advantage, on certain routes the Passenger/Car Ferry sector is in direct competition with airlines .
For countries such as Norway, Canada and countries around the Adriatic Sea, Passenger/Car ferries provide a vital transport link between otherwise isolated communities . In Indonesia passenger fer-ries with cargo capacity sometimes are the only regular link between the islands .
The passenger ferry market is fairly matu-re . In the past growth in passenger volumes in key markets has been sluggish . A lack of newbuilding investment in recent years resulted in a limited amount in passenger ferry deliveries . Recently the demand for newbuildings is slightly picking up again . Certain routes show a returning growth on passenger numbers and also upcoming rules and regulations until 2020 will force older tonnage out of their present market, making place for newbuildings .
Demand & Supply
Traditionally Europe is playing a key role in the passenger ferry market . Expansion in passenger volumes has been very limited in recent years and volumes have failed to fully recover to the 2008 peak . On certain routes full recovery can be seen and even a small growth is expected on routes in the Baltic . However, especially this area is still suffering from economic difficulties in Russia and political trade embargos . Asia is an important emerging region showing moderate growth in recent years . A shift from passengers to cargo growth can be seen on certain routes where pas-senger growth suffers from the competition by low cost airlines . Particularly in the European and Japanese domestic markets, but also in emerging markets like Indonesia, passenger growth will be dampened by the competition of low cost airlines .
3.041
313
3.503
6.857
0
1.000
2.000
3.000
4.000
5.000
6.000
7.000
8.000 PASSENGER/RO RO CARGO
PASSENGER/GENERAL CARGO
PASSENGER VESSELS
TOTAL
passenger fleet by shiptype
Num
ber o
f Ves
sels
Source: SEA Europe MF WG, 2018

0
10
20
30
40
50
60
70
80
2010 2011 2012 2013 2014 2015 2016 2017
PASSENGER/GENERAL CARGO PASSENGER/RO-RO CARGO PASSENGER SHIP
completions by type
Num
ber o
f Ves
sels
Medium TermIn the medium term, growth in demand for new Passenger ferries is projected to average about 5% until 2020 . Passenger volumes are expected to grow moderately, although emerging upcoming areas like Asia or the US-Cuba route may suffer from political instability . A main driver for the growth on the medium term are the upcoming environmental regulations until 2020 . The required reduction in sulfur in marine fuels will lead to a shift in fuel type . Moreover, the expansion of Emis-sion Control Areas (ECAs) and tightening regulations in existing ones will support the need for fleet renewal . As the supply of LNG becomes better through a more developed infrastructure, it will become easier for owners, who are waiting for availability of LNG on their routes, to make the decision for new vessels . Finally, also the use of batteries, both hybrid and fully electrical driven, is speeding up .
Long termThe pressure on ship owners to renew their fleets based on upcoming environmental regulations may flatten out a bit on the long term . However, the need to stay competitive through more fuel- efficient and “greener” designs is expected to replace the medium term regulatory pressure . Besides, economic growth is also expected to pick up again, which will be visible by an expected growth in demand of 2 .5% per year for the Passenger Ferry sector .
0
100.000
200.000
300.000
400.000
500.000
600.000
700.000
800.000
0
10
20
30
40
50
60
70
80
90
100
110
120
130
140
150
160
170
180
2010 2011 2012 2013 2014 2015 2016 2017 2018 2019 2020 2026-2030
2031-2035
2036-2040
2041-2045
GT Vessels
PASSENGER VESSELS COMPLETIONS, ACTUAL, FORECAST
Vess
els
Gro
ss T
onna
ge
Source: SEA Europe WG MF, 2018
Source: SEA Europe WG MF, 2018

45
Newbuilding Requirements: Cruise Ships
BACKGROUND AND FLEET PROFILE
The cruise industry is a steady growing in-dustry . Over the last 10 years passenger numbers went up by over 50% . In 2017, both Germany and China had more than 2 million cruise passengers .
Growth strategies of the cruise ship owners started a couple of years ago are maintained, leading to a longer lead-time until delivery .
Shorter delivery times are seen for purpo-se-build expedition cruise vessels of up to 400 passengers in size . In the field of de-dicated expedition cruise vessels not much newbuilds have been delivered in the last decades . Although this market is still a niche market, a steady growth can also be seen here . Ageing tonnage combined with the steady growth increases demand for expe-dition cruise vessels .
Source: CLIA
Deliveries
In 2016, 9 vessels with a total 1,101,500 GT and 27,000 lower berths were delivered . In 2017 this figure has risen to 11 vessels with a total 1,142,200 GT and almost 28,000 lower berths .
11 s
hips
10 s
hips
9 sh
ips
5 sh
ips
8 sh
ips
12 s
hips
9 sh
ips
14 s
hips
11 s
hips
14 s
hips
17 s
hips
15 s
hips
13 s
hips
11 s
hips
5 sh
ips
6 sh
ips
10 s
hips
9 sh
ips
9 sh
ips
12 s
hips
7 sh
ips
7 sh
ips
6 sh
ips 6
ship
s
6 sh
ips
10 s
hips
11 s
hips
0
5.000
10.000
15.000
20.000
25.000
30.000
35.000
1991
1992
1993
1994
1995
1996
1997
1998
1999
2000
2001
2002
2003
2004
2005
2006
2007
2008
2009
2010
2011
2012
2013
2014
2015
2016
2017
LLooww
eerr bb
eerrtthh
ddeelliivveerryy yyeeaarr
cruise ship deliveries since 1991
Source: SEA Europe WG MF, 2018
17,8 19,1
20,5 20,9 21,3 22,3 23,1
24,7 25,8
27,2
2009 2010 2011 2012 2013 2014 2015 2016 2017p 2018p
global ocean cruise passengers (in Millions)
p=projection

Orderbook
Currently the orderbook for cruise ship newbuildings consists of 84 confirmed vessels, not inclu-ding options and alike, with a total capacity of 223,300 lower berths and a volume of 8,725,569 GT . The cruise shipbuilders have orders until 2025, meaning that the increase in the number of confirmed vessels on order filled up still available building slots until that year .
Outlook
Short term trends are showing intensified driven by the introduction of smaller expedition cruise vessels . As in the past, the introduction of new vessels partly with new features for passengers and new itineraries is driving customer interest and sales . On the long term, the main focus will return to all-round cruise vessels, but a stronger differentiation in size is to be expected . Long term trends are continuing to be influenced by short-term factors like changing political stability but will be linked to general long-term trends in international tourism, economic growth and population development .
0
200.000
400.000
600.000
800.000
1.000.000
1.200.000
1.400.000
1.600.000
1.800.000
2.000.000
2005
2006
2007
2008
2009
2010
20
11
2012
20
13
2014
2015
2016
2017
Ø 2018
-2020
Ø 2021
-2025
Ø 2026
-2030
Ø 2031
-2035
Ø 2036
-2040
Ø 2041
-2045
0
2
4
6
8
10
12
14
16
18
20
22
No. of Vessels GT
Gro
ss T
onna
ge
cruise completions fleet, actual and forecast
Vess
els
Source: SEA Europe WG MF, 2018 Note: the bars represent GT, while the line represents number of vessels

47
Newbuilding requirements: Ro-Ro & Car Carriers
Background and Fleet Profile
•Demand & Supply
The ro-ro market is exiting a long period of contraction characterized by a decreasing fleet size, an ageing fleet with few newbuildings, weak charter rates and generally difficult market conditions resulting in a decrease in number of owners/operators (most ro-ro vessels are owned and operated by the same company) and consolidation . This is a trend that is expected to continue .
In November 2017, the ro-ro fleet stood at 1,014 vessels with total capacity of 1 .3M lane-metres . In terms of capacity the ro-ro fleet will contract at an average annual rate of 0 .7% until the end of 2021 . In number of vessels, it will shrink by 2 .9% . As of November, the ro-ro carrier orderbook totalled only 37 vessels with combined capacity of 120,900 lane-metres, representing 9% of capa-city . It is expected that 67 vessels will be placed on order – 20 vessels more than in the previous five years . In lane-metre capacity the increase will be clearly higher at almost 70% - again highli-ghting ever-increasing ship sizes . Ro-ro deliveries have been weak over the past five years, just 52 vessels added to the fleet . Deliveries are expected to increase to 77 vessels, up by 50%, over the next five years . Due to the fact that the ships delivered will be larger than ever, the increase in terms of capacity will be 219,000 lane-metres, up by 85% .
The ro-ro fleet is divided between numerous owners . The US government owns the largest number of ships, with almost 17% of the total capacity, but there is only one other company that owns more than 5% of the capacity, and thus in total it is very fragmented .
•Uncertainties and Possible Demand Drivers
A number of important factors are still likely to impact the ro-ro market year 2017 and onwards:
• The emission control legislation has been and will continue to be a game changer . In the short term a period of fleet optimization, optimization of services, increasing investments in emission abatement technologies and migration of tonnage which is either too small or too old for in-vestments is foreseen .
• Despite continued efforts to reduce land borne vehicle traffic that could potentially support increasing ro-ro demand, the ro-ro market is to some extent disadvantaged of the rather expen-sive trailer units (high capital and maintenance costs and port dues) and is competing with other modes of transport . I .e . the risk of either a modal shift or loss of cargo to container operators as it is a cheap(er) alternative remains .
• Despite improving market conditions and continued consolidation, financial constraints among remaining owners/operators could eventually hamper contracting .
• The increasing needs of short-sea transport will influence the need for replacing the existing ageing fleet and could impact the future demand .
• As in other segments a clear and similar trend towards larger ships is seen . However, current reception facilities in relevant ports put some limitations on the possibilities to expand the capa-city of newbuild vessels .
• Geopolitical problems, wars, seasonal fluctuations and restrictions including sanctions have had a detrimental effect on the Baltic and Black Sea market and could affect the potential in the MENA region as the Mediterranean market is sensitive to geopolitical shocks (civil war in Syria, conflicts in Libya etc .) .

• A number of new markets and new opportunities are expected . Continued growth of the south-east Asian ro-ro market, higher demand in the MENA region and Arabian Gulf, increase of activity in the Caribbean .
•Ro-Ro vessels Market Outlook
The level of newbuild requirements is expected to stabilize at an annual average of 20 vessels or 0 .55 mil . CGT with particular focus on larger ro-ros . Given the large number of vessels with an age of 20+ years, 270-300 vessels are clear demolition candidates in the short term . As an annual average of 40-45 vessels are expected to be scrapped towards 2035, the newbuilding requirements are foreseen to primarily be driven by replacement needs .
0
5
10
15
20
25
30
0
100.000
200.000
300.000
400.000
500.000
600.000
700.000
2003 2004 2005 2006 2007 2008 2009 2010 2011 2012 2013 2014 2015 2016 2017 2017-20 average
2020-25 average
2025-30 average
2030-35 average
CGT Vessels
ro-ro vessels completions, actual and forecast
Source: SEA Europe WG MF, 2018 / IHS Fairplay, 2017Note: the bars represent CGT, while the line represents number of vessels
•Car Carriers Market Outlook
In the vehicle carrier fleet market there are currently 829 vessels with a total capacity of 3 .9M ceu . The orderbook is very moderate with 74 carriers . A total of 106 carriers will be contracted between 2017 and 2021 – substantially fewer than the 180 ordered in the previous five years . The fleet is projected to grow at an average annual rate of 2 .5% until 2021, to 4 .4M ceu . Between 2017 and 2021 the capacity of the 4,000+ ceu segments will expand by 2 .6% each year, while the fleet of smaller carriers will shrink . Operators have been cautious ordering new carriers ever since the recession in 2009 .
The vehicle carrier orderbook is dominated by two shipbuilding nations – China, which accounts for 38% (28 vessels) and Korea with a share of 35% (26 vessels) . Japan has the third largest or-derbook with a 19% share (14 vessels) .
Vehicle carrier deliveries are set to increase to 132 in the 2017-2021 period, which is eight ships more than in the previous five years . In terms of capacity, deliveries are set to increase to 831,600ceu in 2017-2021, which is 100,000ceu more than in 2012-2016 .
Removals of vehicle carriers are forecast at 108,800ceu in 2017, which is the highest amount sin-ce 2010 . They are then expected to drop to 31,000ceu in 2021 . The removal forecast stands at almost 100 vessels, which is 15 more than the previous five years . Again, it is the smaller carriers that are removed from the market .
In the vehicle carrier segment of the world fleet, ownership is highly concentrated if seen in capa-city . As the large operators do charter in tonnage, the situation is even more extreme in terms of controlled tonnage .

49
The best illustration of a very consolidated market came in the great recession year of 2009, when more than 100 car carriers were removed from the market – more than the aggregated total until that date .
Source: SEA Europe WG MF, 2018 / IHS Fairplay, 2017Note: the bars represent CGT, while the line represents number of vessels
0
5
10
15
20
25
30
35
40
45
50
55
60
65
70
0
500.000
1.000.000
1.500.000
2.000.000
2.500.000
2003 2004 2005 2006 2007 2008 2009 2010 2011 2012 2013 2014 2015 2016 2017 2017-20 average
2020-25 average
2025-30 average
Car carriers Completions, Actual and Forecast
CGT Vessels


51
Newbuilding requirements: Other Non-Cargo Carrying Vessels (ONCCV)
a. Fishing Vessels
Demand for fishing vessels is driven by the global population growth because of the main use of fish as food . Given the expected population growth, it follows that demand will grow in the future to meet the need for food . However, there are additional factors to consider .
0
20
40
60
80
100
120
140
50 55 60 65 70 75 80 85 90 95 00 05 120
3
6
9
12
15
18
21
World fish utilisation and supply
Fish utilisation
(mill
ion
tonn
es)
Population (billions)and food supply (kg/capita)
FoodNon-food usesPopulationFood supply
Source: Food Agricultural Organisation (FAO)
The future market for fishing vessels is one of the hardest markets to predict of all vessel types . This is largely due the fact that the fleet size is mostly dictated by government policies rather than market requirements . Several studies have shown that fish stocks have been seriously overfished in many areas of the world . Several countries have established targets to tackle national over-capacity of fishing fleets . A rise in fish quota restrictions is therefore to be expected . This is why the global fishery production in marine waters remains uniform between 78-83 million tonnes . Coupled to these restrictions is a likely decrease in the world fishing fleet size . At the same time, a rise in the number of vessels active in fish farming is to be expected . There will still be a newbuild requirement for fishing vessels, as a certain degree of fleet renewal will be necessary to replace part of the current ageing fleet . Global fish production has grown steadily in the last five decades, with food fish supply increasing at an average annual rate of 3 .2 %, outpacing world population growth at 1 .1 % .

0
20
40
60
80
100
120
140
160
50 55 60 65 70 75 80 85 90 95 00 05 12
World capture fisheries and aquaculture productionM
illon
es d
e to
nela
das
Aquaculture productionCapture production
Source: Food Agricultural Organisation (FAO)
The total world fishing fleet as per IHS Fairplay currently numbers almost 25,000 vessels (above 100 GT) with a total tonnage of 11 million GT (total number of fishing vessels in the world was estimated by FAO to be about 4 .72 million in 2012, 90% of them less than 12 m LOA) . Our fore-cast is based on the assumption that the current fleet will shrink by 20 percent to 8 .7 million GT by 2035 . A high level of scrapping is expected in the coming years due to the age of the fleet . Currently, more than 50% of the ships are over 30 years old . Newbuild deliveries are expected to rise from around 240 vessels in the period 2019-2030 to around 385 vessels per year in the period 2031-2035 . While the latter may seem like a significant number of vessels, it is still lower than the number of vessels deleted from the fleet in that same period, resulting in a further drop of the fleet size .
0
50
100
150
200
250
300
350
400
450
0
200.000
400.000
600.000
800.000
1.000.000
1.200.000
2005 2006 2007 2008 2009 2010 2011 2012 2013 2014 2015 2016 2017 2018 2020 2025 2030 2035
Fishing vessels Completions, Actual and Forecast CGT Vessels
Source: SEA Europe WG MF, 2018 / IHS Fairplay, 2017Note: the bars represent CGT, while the line represents number of vessels

53
B. Research Vessels
The market for research vessels is basically divided into two categories: the oceanographic re-search vessels (ORV) owned by government entities used for oceanographic research disciplines (physical, biological, chemical, marine geology and geophysics, ocean engineering and atmo-spheric science) and the geophysical seismic research vessels (SRV) owned by private companies and used in the offshore oil and gas industry . Order levels for government oceanographic research vessels (ORV) are driven by government planning and government budgets, while order levels for the seismic research vessels (SRV) related to the offshore industry are linked to the growth in exploration activities for oil and gas .
Seismic Research Vessels (SRV)
The level of exploration activities is related to expectations about the future price of oil and gas . Before the onset of the economic crisis, contracting of seismic research vessels (SRV) in particular peaked at 17 vessels per year in 2008 . Afterwards, it never returned to the same level, despite the quick recovery of the oil price after the severe dip of 2009 . The reasons for this low level of contracting might lie in the backlog of vessels ordered before the crisis and the rise in size and complexity of newbuildings . Orders for SRV hovered around five units per year between 2009 and 2014, when orders went down even further . The oil price went down considerably from mid-2014 onwards and is presently low . This has had an immediate effect on the investment plans for oil and gas exploration . Owners of seismic research vessels are recording losses and vessels are being laid up or, in the case of the older less competitive vessel, being scrapped .
With oil and gas exploration struggling with low vessel utilization, as demand keeps declining for exploration work in new frontier fields, day rates are already at severely depressed levels . The demand is expected to remain fairly low in first half 2018 but the situation is expected to improve in the second half .
In the medium and long term, oil companies must keep up their exploration activities or otherwise their known oil and gas reserves will decrease too much . Recovery of exploration activities and fleet renewal will help to restart investment in SRV vessels, but it remains to be seen whether the contracting levels of 2007-2008 will be reached again .
0
2
4
6
8
10
12
14
0
20.000
40.000
60.000
80.000
100.000
120.000
140.000
160.000
2005 2006 2007 2008 2009 2010 2011 2012 2013 2014 2015 2016 2017 2018 2020 2025 2030 2035
Seismic vessels Completions, Actual and Forecast CGT Vessels
Source: SEA Europe WG MF, 2018 / IHS Fairplay, 2017Note: the bars represent CGT, while the line represents number of vessels

Oceanographic Research Vessels (ORV)
As mentioned before, orders for government owned research vessels are related to government budgets . It will come as no surprise that these budgets have been under serious pressure in Europe and the USA in recent years . On the other hand, the newly emerging economic powers of China, India and some South America countries are spending a lot of money on expansion of their oce-anographic research fleets as they venture out further in the quest for energy sources and other raw materials .
The existing fleet of research vessels (government and private (energy industry)) will need repla-cing: almost half of the existing fleet of close to 800 research vessels is 30 years of age or older . Over a quarter of the existing fleet dates from the 1960s and 1970s . Due to the aforementioned budget constraints in mature western economies, it is highly likely that existing research vessels in those countries will be replaced by fewer but larger and more capable research vessels . China and India will in all likelihood keep expanding their research fleets for at least a decade, while Russia will need to replace about half of its existing fleet in the next decade: 46 of the 87 Russian flagged research vessels were built in 1984 or before .
Due to fleet replacement, scrapping is expected to rise in the mid-term, reaching 55,000 GT per year between 2019-2025 . Such increase in scrapped tonnage will be partly due to an increase in absolute numbers of vessels being scrapped, but in part also to the growth in size of resear-ch vessels being retired . Research vessels built in the early 90s measure 2,700 GT on average, while vessels built before 1985 measure about 1,100 GT on average . Deliveries of newbuilds are expected to average 16 vessels per year for the period 2018-2025 with an average tonnage of around 3,550 GT per vessels . For the period 2026-2035, deliveries are expected to increase to 21 units per year with an average size of 5,200 GT per vessel, reflecting the gradual growth in size of vessels witnessed in the past decades as well .
0
2
4
6
8
10
12
14
0
20.000
40.000
60.000
80.000
100.000
120.000
140.000
160.000
2005 2006 2007 2008 2009 2010 2011 2012 2013 2014 2015 2016 2017 2018 2020 2025 2030 2035
Seismic vessels Completions, Actual and Forecast CGT Vessels
Source: SEA Europe WG MF, 2018 / IHS Fairplay, 2017Note: the bars represent CGT, while the line represents number of vessels

55
C. Tugs
Drivers behind tug orders
Growth in the world fleet of tugs is driven by growth in world seaborne trade, which in turn is rela-ted to world GDP growth . While seaborne trade appears to have settled on a lower growth path since 2011, it is still growing nevertheless and in fact recorded a rebound in growth in 2017 . For 2018, the indicators are also positive . Whether this recovery in growth will continue in the longer term remains to be seen, as protectionist tendencies in several major world economies have the potential to limit world trade growth .
Growth in world trade means more vessel movements . Most of the larger vessels require tug assistance . In order to accommodate all these extra vessel movements, a lot of ports are being expanded or newly constructed, mainly in Asia, Africa and South America . The increase is not just in vessel movements, but also in vessel size . The growth in the size of vessels to be handled has led to demand for more powerful tugs, with a higher capacity in terms of Tonnes of Bollard Pull .
Not only the rise in vessel movements is driving newbuild orders for tugs . Another driving force is fleet renewal: large port tug operators in Europe, Asia, the Middle East and the US are ordering or operating energy efficient and environmentally friendly tugs with new propulsion forms, such as hybrid propulsion (battery/diesel) or dual fuel engines fueled by LNG or diesel . This fleet renewal by major tug operators is not directly leading to an increase in scrapping of old tugs, as tugs sim-ply have extremely long lives, making future scrapping hard to predict . We cannot rule out though that in the future tug lives will be cut short by environmental regulations, as it has also happened with some large ship types, like oil tankers and passenger ferries .
Fleet profile
“Tugs” are defined here as sea-going vessels over 100 Gross Tonnes (GT) listed in the registers of IHS Fairplay in the categories Tug, Pusher Tug, and Salvage Tug . The world fleet of tugs in these categories numbered about 18,000 vessels at the end of 2017 . This represented an increase of around 140 vessels compared to the end of 201613 . 37 percent of the current tug fleet was delive-red in the last ten years, whereas 26 percent of the fleet is aged 35 years and over .
Main builder countries for tugs in the past ten years have been Indonesia, Malaysia and China, with the three of them together having delivered over two thirds of all tugs in the last ten years . It should be mentioned here though that both Indonesian and Malaysian production consists mostly of relatively small tugs with a low level of sophistication . Other prolific tug building countries are the United States, Turkey, Japan, Spain, Vietnam and Romania, with the production numbers of the last two countries boosted by the presence of global tug builders, i .e . Damen from the Netherlands and Piriou from France .
The average size of the over 6,600 vessels delivered since 2008 is 288 GT, with one third of vessels delivered in this period measuring less than 200GT . A mere 280 vessels delivered in this period measured more than 500 GT, with a significant amount of the vessels in this subgroup sai-ling under the American flag . It would appear that not only the cars are larger in the United States!
Deliveries from 2008 onwards have been averaging around 660 vessels, but they have been on a downward trend since the peak in 2012, when 1,003 tugs were delivered . In contrast, 2017 saw the delivery of a mere 289 tugs . The sharp drop in tug deliveries of the past few years is caused by the slowdown in world shipping and the extremely sharp decline of tug production in Indonesia and Malaysia . The collapse of tug production in these two countries is the result of the overcapa-city situation in the regional tug market during the past three years14 .
13) IHS Fairplay World Register of Ships, 31/12/’1714) www .tugtechnologyandbusiness .com/news/view,indonesia-has-20-of-the-global-tug-fleet_49548 .htm

Forecast
Deliveries of tugs might start to recover in 2018, as close to 500 vessels were already listed in the orderbook with 2018 delivery at the end of 201715 . Improving world seaborne trade, the need for more powerful tugs as cargo ships continue to grow, and an expected recovery of the Indonesian tug market are expected to stimulate the tug market in the near future . This is reflected in our fore-cast for the 2018-2020 period, which has been increased by 11 percent in terms of Compensated Gross Tonnage (CGT) compared to the 2017 forecast .
We now expect to see 505 tug deliveries per year in the aforementioned period . For the longer term, we expected the growth of the world tug fleet to decrease from the current three percent to around two percent per year, in line with reduced growth expectations for world seaborne trade, the reasons for which are dealt with elsewhere in this report . A peak of close to 700 deliveries per year is expected in the 2025-2030 period, where after deliveries will decrease to around 650 units per year in the 2030-2035 period . Of course, expected delivery numbers could be impacted positively on the one hand by increased scrapping as a result of future environmental regulations or, more distantly, mass replacement of existing tugs by autonomous or remotely operated tugs . On the other hand, numbers could be impacted negatively by a stronger reduction in world seaborne trade growth .
0
200
400
600
800
1.000
1.200
0
200.000
400.000
600.000
800.000
1.000.000
1.200.000
1.400.000
1.600.000
2008 2009 2010 2011 2012 2013 2014 2015 2016 2017 2018-20 average
2020-25 average
2025-30 average
2030-35 average
Tug Completions, Actual and Forecast CGT Vessels
Tug Completions, actual and forecastSource: SEA Europe WG MF, 2018 / IHS Fairplay, 2017Note: the bars represent CGT, while the line represents number of vessels
D. Dredgers
The driving forces behind orders for dredgers are somewhat similar to those driving port tug or-ders: growth in world seaborne trade, growth in energy demand, the need for fleet replacement and need for both land expansion and defenses against rising sea water levels as the number of crowded coastal megacities across the globe continues to increase . Finally, a marked shift in the origin of demand is taking place as national dredging companies such as the massive Chinese company CCCC Dredging increasingly demand a piece of the pie .
Growth in world seaborne trade (and of the vessels used to transport the goods) necessitates incre-ases in port capacity and also expansion and creation of shipping canals . Examples of the latter activity are the recent work on both the Panama and Suez Canals and several pending shipping canal plans all over the globe . Continuously rising energy demand also entails more dredging work: on the one hand ports need to be extended to accommodate oil, coal and LNG terminals .
15) IHS Fairplay World Register of Ships, 31/12/’17

57
On the other hand, dredgers are also involved in preparatory work for the installation of offshore wind farms . A further source of dredging activity is the maintenance of flood defences . This used to be an activity mostly restricted to the Netherlands and surrounding countries, but as water levels rise worldwide, interest in this activity is increasing . Large scale land reclamation as witnessed in recent years in for example Dubai is currently on a lower level, but could take off again in the future, as many of the world’s largest cities are located near the sea . These cities will need both extra land space and protection against the sea . Jakarta is a good example of a city which is very active in this field . Last but not least, maintenance dredging of waterways is a continuous activity, providing employment to mainly smaller and mid-sized dredgers .
Dredgers as discussed in this report are defined as sea-going self-propelled dredgers with an IMO number . Fleet information is obtained from the registers of IHS Fairplay as per December 31, 2017 .
The ordering of dredging vessels has been somewhat subdued in recent years, but is bound to rise in the next years . Vessels ordered in recent years have generally been of the slightly smaller variety (below 8,000m3 hold capacity), as major dredging companies are renewing their mainte-nance dredging fleet . With over half of the existing fleet of 1,692 vessels aged 30 years or older, this trend is bound to continue for the foreseeable future . While the focus of the well-known large independent dredging companies is on replacement of elderly units, national dredging companies are buying more and more vessels to compete internationally for projects . Overall, spending on newbuilds is restrained though, but could pick up again, as world economic and seaborne trade growth are improving and the oil price is starting to recover from the lows seen in recent years . It will take a few years though before the dredging industry will reach the top of the cycle again .
New dredgers are expected to feature many advances in terms of reducing their environmental footprint . Already, the first LNG-fuelled maintenance dredgers are in service or under construction, and more will likely follow . LNG is not the only option though . Use of hybrid propulsion (combining diesel and batteries for example) might also be a suitable option for dredgers, as the power usage of these vessels fluctuates a lot during operations . Issues like mitigation of underwater noise and disruption of sea life due to the stirring up of mud during dredging operations are also increasingly being focused upon .
Newbuilding deliveries and scrapping of vessels are quite balanced at the moment, with both expected to hit an average of some 34 vessels per year in the period 2018-2020 . We expect scrapping to peak in the 2020-2025 period at some 61 vessels per year . In this period, many dredgers will reach replacement age (which tends to be over 30 years in this segment) . Dredging companies’ fortunes are expected to take a turn for the better in this period on a recovery in ener-gy and commodity prices and increasing investment, fuelling port expansion projects . Hence, they will be able to fund ample replacement of elderly units . On the other hand, it can not be ruled out that elderly vessels will be held on to for a little while longer as demand for their services peaks . Also replacement vessels always take a few years to arrive from the shipyards .
After 2030, we expect that the majority of fleet replacement is finished, resulting in a return of scrapping levels to more familiar levels of 30 units per year . Newbuild deliveries should still be stable at a relatively high level of 34 vessels per year, partly because as in all areas of shipbu-ilding, there is always a time lag between identifying the need for the vessel and finally taking delivery . In addition, world seaborne trade will continue to grow . Even if that trade growth takes place at lower levels than witnessed prior to 2011, it will still fuel the need for more dredging to accommodate ships in ports, canals and rivers . National dredging companies from emerging economies will still require more dredgers, necessary for both large projects at home and in order to compete for large projects abroad . The rise of local competitors and “local for local” shipbuil-ding policies have also led to an increase in the amount of yards building dredgers for the lower end of the market . It cannot be ruled out that some of these yards will gradually move towards higher-specification newbuilds .

0
10
20
30
40
50
60
0
50.000
100.000
150.000
200.000
250.000
300.000
350.000
400.000
450.000
500.000
2008 2009 2010 2011 2012 2013 2014 2015 2016 2017 2018-20 average
2021-25 average
2026-30 average
2031-35 average
Dredgers Completions, Actual and Forecast CGT Vessels
Dredgers completions, actual and forecastSource: SEA Europe MF WG, 2018 / IHS Fairplay, 2017Note: the bars represent CGT, while the line represents number of vessels
e. The Arctic Market
The Arctic is usually considered to be the area inside the Arctic Circle . In a broader perspective arctic ships are also needed in the areas where sea is freezing during the wintertime . The main characteristics of the Arctic market are the ice covering of the sea and the harsh and cold environ-ment . This makes Arctic nature also particularly vulnerable .
The picture below describes the fleet of traditional icebreakers (IHS Database definition) and its estimated growth . The traditional icebreaker’s fleet is quite small (around 90 vessels) . There are also other types of multipurpose ships that act as icebreakers . The combined number of traditional icebreakers and other types of multipurpose ships acting as icebreakers is around 150 . In addition, there is a fleet of ice strengthened cargo ships . In recent years there has been slight growth in the icebreaker fleet – in 2017 there were 88 traditional icebreaker vessels in operation . The fleet is expected to stay at these levels or grow modestly as it can be seen from the picture below .
0
20
40
60
80
100
120
140
2011 2012 2013 2014 2015 2016 2017 2018 2019 2020 2025 2030 2035
Icebreaker fleet
Num
ber o
f Ice
brea
kers
Source: SEA EUROPE WG MF, 2018 / IHS Fairplay, 2017
The planned lifetime of new icebreakers is 50 years and for older vessels somewhat less . Ave-rage age of an icebreaker is currently around 36 years . Average age of scrapping is around 34 years, but there have been very few scrappings in last 20 years, so the average age does not tell the whole story . Scrappings have been postponed past years so there are major re-fit needs . The picture below shows the delivery decades of the ships currently in operation .

59
It can be seen that large parts of the fleet are constructed in the 1970’s and the fleet is getting old . This means that replacement newbuilds are needed .
Source: SEA Europe WG MF, 2018 / IHS Fairplay, 2017
In 2016 two icebreakers were scrapped after long period of no scrappings . Many older Russian icebreakers will be at the end of their lifecycle in the next few years, so the country estimates it needs to build up to thirty more before 2030 . In Finland large part of the fleet is planned to be replaced by 2030 and Sweden has the same situation . USA and Canadian governments are considering their Arctic responsibilities . USA has announced a statement of Polar icebreaker reca-pitalization project for constructing a fleet of up to three heavy and three medium ships to meet mission demands in the high latitudes .
Along with aging, limited and increasingly thin supply, the demand for icebreaking vessels is expected to increase in the decade to come . It is assumed that most of the icebreakers over 50 years need to be scrapped or refitted . However, some scrappings must be postponed – there are not enough resources to renew so a large part of the fleet in the same timetable . Some scrappings will probably be postponed by refits . On the other hand, demand for icebreaking might increase when global temperatures rise and the Arctic areas of the world are opening . This means that icebreakers and ice-strengthened tonnage capable of Arctic operations are needed to guide ships through the Northern Sea Route and the North-West Passage and for offshore operations: explora-tion and extraction of natural resources, oil and gas in particular . The picture below describes the completions of icebreakers during 2000’s and the estimation of completions to 2035 in number of ships completed in 5-year periods .
0
2
4
6
8
10
12
14
16
2001-2005 2006-2010 2011-2015 2016-2020 2021-2025 2026-2030 2031-2035
Num
ber o
f shi
ps
Completions, actual & forecast
Icebreaker completions, actual and forecast in number of ships delivered at the period.Source: SEA EUROPE WG MF, 2018 / IHS Fairplay, 2017

There are also some uncertainties as to what kind of demand there will be . Northern sea routes create new demand . Climate warming might increase the need of icebreaking in some areas, but it might also decrease the demand in other areas and some vessels might not be replaced . On the other hand, climate warming makes the weather less predictable so there might be more need for icebreaker support in this way too .
It might also be that the need for traditional icebreakers will decrease if customers start to ask for multipurpose icebreaking ships that are capable of carrying out other kinds of operations also in the summertime . Also, research vessels and for example special ice strengthened passenger ships might have increasing demand, if Arctic tourism and research increases at the pace that it now seems . For instance, the first luxury icebreaker cruise ship is now under construction for Ponant . Icebreaking off-shore support vessels and icebreaking construction vessels are expected to see increasing de-mand if the arctic operations continue . The oil and gas reserves in the Arctic areas are located under ice-covered, deep water and very harsh conditions and arctic offshore energy operations will require top-of-the-range vessels .
The Arctic market development faces a lot of uncertainties . The current political situation between Russia, Europe and the United States has a heavy toll on the Russian economy . There is also a lack of (port) infrastructure in the Arctic that needs to be addressed in order to facilitate expansion of Ar-ctic shipping and operations . On the other hand, there have been major reductions in breakeven oil prices in offshore, also for arctic projects . President Trump has also revealed plans to support arctic offshore project at US waters . These factors might increase the activity . China’s Arctic Silk route plan might also mean increase in the activity in the arctic areas .
Icebreakers have seen significant technology developments in recent years . Increasing vessel sizes set new standards also for icebreakers: oblique icebreaker breaking wide channel sideways is one solu-tion . New icebreakers are also more stable when sailing in open waters . Also the first LNG powered Icebreaker has been built by Arctech Helsinki Shipyard . When the activity in the area is increasing, the demand for new products, especially for environmental protection technology, safety technology and ICT is increasing . The main threats for operations in the area are oils spills, that are harder to recover in the ice-covered areas, and also for example black carbon emissions that could increase the melting of the polar ice . The IMO’s Polar Code is also setting up some requirements so that the operations in the area would be safe and environmentally friendly .
f. Other Specialised Vessels
The remaining group of specialized vessels is a very mixed group of about 2,770 vessels, consisting of a wide variety of vessel types . It is a challenging group to keep track of, as certain subgroups of vessels move in and out of this category over time in the registers . This has to do with the employment of these vessels, which is often related to other large vessel groups such as Offshore vessels, Dredgers or Naval vessels for example .
Numbering close to 700 vessels, the largest subgroup of Other Special Vessels is that of the patrol vessels . Although patrol vessels are more related to navy ships than to regular commercial vessels, many are built these days by commercial shipbuilders and to commercial standards . Also, some of the smaller patrol vessels are offered as a multi-role design which can also be customised as a crew boat or supply tender . Production of patrol vessels is rising . Developing nations are building up their navies, while navies in the Western world are increasingly looking to deployment of patrol vessels as a more cost-effective way of performing some duties which used to be performed by frigates and corvettes, enabling the latter ship types to be deployed more exclusively on the more dangerous tasks .
Utility vessels and work/repair vessels also form a relatively large group, amounting to some 349 vessels . These are mostly small multi-role vessels, commonly known as “workboats” and often used as auxiliary vessels in port construction, dredging and offshore construction projects . These vessels are usually equipped with a crane and an open deck and often have a catamaran hull form in order to provide a relatively stable working platform on such a small vessel .

61
Also heavily involved in offshore energy projects are the crane vessels, of which there are 260 vessels .
Ships owned by governments or ports, such as pollution control vessels, buoy tenders, pilot vessels, search & rescue vessels, training ships and salvage vessels make up most of the remainder of this category .
Most of the other special ship types are built in very small numbers, with production in the low single digits each year . The most notable exceptions are the larger categories of workboats and patrol vessels . The average production of patrol vessels has almost doubled, from 16 units per year in the period 1998-2007 to 33 units per year in the period 2008-2017 . However, this is not the complete picture, as many patrol vessels are built to the standards of a Class Society but then withdrawn from Class shortly after delivery as they are naval units . These vessels then often disap-pear from the vessel registers . The production of utility vessels and work/repair vessels has also sharply increased, from less than 10 units per year before 2008, to an average of around 14 units per year in the last ten years . Although the production numbers of many other special vessels are relatively small, the vessels themselves are often high-value specialised vessels .
The economic crisis of 2009 and the collapse of the oil price since 2014 have both had a relatively limited impact on this segment . Only those vessels with duties related to port operations and port development have experienced decrease in demand as the growth of world seaborne trade decre-ased . Workboats meanwhile are also increasingly being employed in the construction of offshore windfarms, an industry which is growing fast in Europe, and it is expected to expand rapidly in the near future in Asia and North America . Countries outside Europe that are seen as future hotspots are amongst others China, Japan, South Korea, Taiwan and the United States . The increase in size of the windmills themselves also calls for more capable crane vessels, so that subsegment may also see some new orders . Finally, the versatility of workboats means that they are also increasingly employed in the growing fish farming industry .
We expect the requirement for ships in the Other Special Vessels category to grow at slightly below the projected annual growth rate of world seaborne trade . As this growth has settled on a lower level after 2011 and is expected to remain relatively low until 2020 (Source: OECD/ITF), we expect deliveries to remain at a somewhat lower level of around 67 vessels per year during the period 2018-2020 . Scrapping will continue at a relatively low level of around 40 vessels per year until 2025, as the very specialised nature of vessels in this fleet tends to lead to lengthy careers . Afterwards, scrapping will gradually rise until it peaks at around 48 units per year in the period 2030-2035 . As a result, we expect a gradual rise in deliveries of other special vessels after 2020 until it reaches 88 vessels per year during the period 2030-2035 .
0
10
20
30
40
50
60
70
80
90
100
0
50.000
100.000
150.000
200.000
250.000
300.000
350.000
400.000
450.000
2008 2009 2010 2011 2012 2013 2014 2015 2016 2017 2018-20 average
2020-25 average
2025-30 average
2030-35 average
Other special vessels Completions, Actual and Forecast CGT Vessels
Other special vessel completions actual and forecast. Bars represent CGT, line represents number of vessels Source: SEA EUROPE WG MF, 2018 / IHS Fairplay, 2017


Rue de la Loi, 671000 Brussels - Belgium
tel. +32 2 230 27 91fax +32 2 230 43 32
[email protected] www.seaeurope.eu