2018 GLOBAL Trends in Giving Report - valeriomelandri.it · The 2018 Global Trends in Giving Report...
28
2018 GLOBAL Trends in Giving Report RESEARCH BY NPTECHFORGOOD.COM SPONSORED BY PIR.ORG #GIVINGTRENDS18 GIVINGREPORT.NGO
Transcript of 2018 GLOBAL Trends in Giving Report - valeriomelandri.it · The 2018 Global Trends in Giving Report...
2 0 1 8 G LO BA L
Trends in Giving Report
RESEARCH BY NPTECHFORGOOD.COMSPONSORED BY P IR .ORG #GIVINGTRENDS18
GIVINGREPORT.NGO

3
5
6
10
11
12
13
15
17
18
19
20
21
22
23
27
Table of ContentsAbout the Report
About the Survey Respondents
GLOBAL TRENDS IN GIVING
Donors Worldwide
Giving Trends by Gender
Giving Trends by Generation
Giving Trends by Ideology
Giving Trends by Religion
Giving Trends by Donor Size
DATA SHEETS
Giving Trends in Africa
Giving Trends in Asia
Giving Trends in Australia & Oceania
Giving Trends in Europe
Giving Trends in North America
Giving Trends in South America
2018 Global Trends in Giving Report: 25 Key Findings
2018 Global Trends in Giving Report: Non-donors

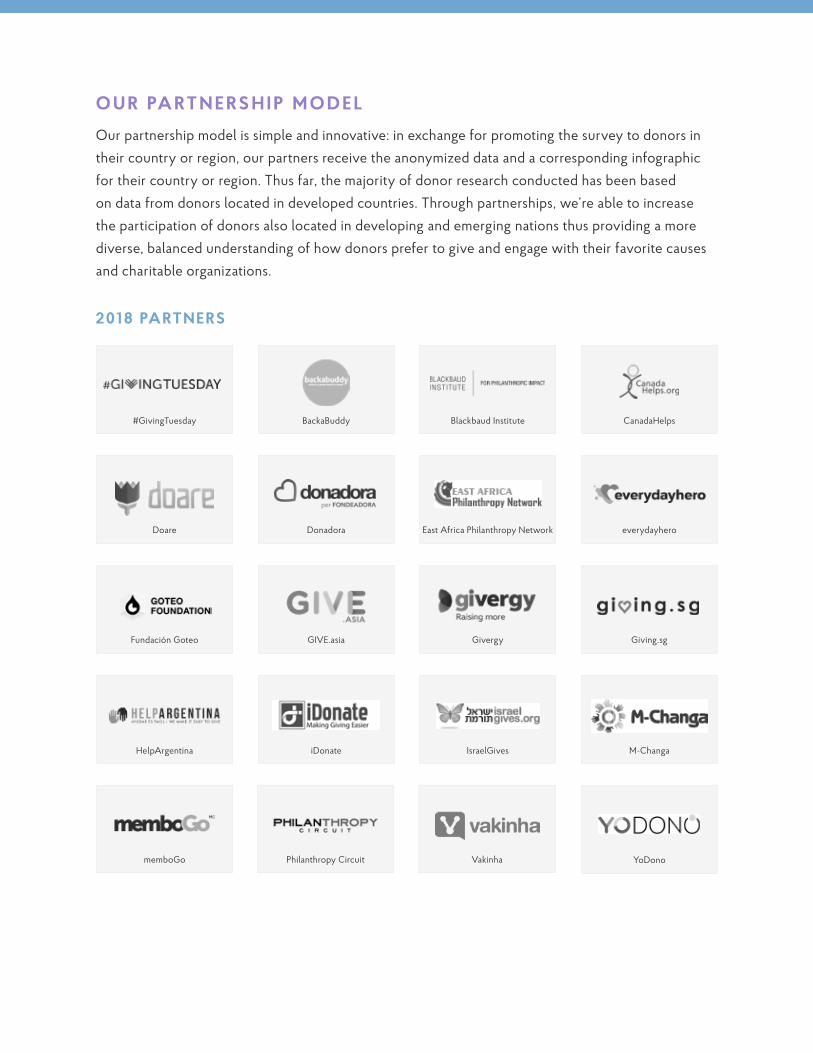
About the Report6,057 D O N O R S • 1 1 9 CO U N T R I E S
The Global Trends in Giving Report (givingreport.ngo) is a research project that seeks to gain a better understanding of how donors prefer to give and engage with their favorite causes and charitable organizations. Sponsored by the Public Interest Registry and researched by Nonprofit Tech for Good, the report summarizes donor data across six continents about how online and mobile technology effects giving. The report also examines the impact of gender, generation, ideology, religion, and donor size upon giving and volunteerism.
The 2018 Global Trends in Giving Report is unique in that it is the only annual study dedicated to analyzing the giving habits of donors worldwide and is a sister report to the Global NGO Technology Report (techreport.ngo). The data from both reports is meant to help non-governmental organizations (NGOs), non-profit organizations (NPOs), and charities worldwide better understand if they are using technology in the ways that their donors prefer and where they need to improve.
M E T H O D O LO G Y
The 2018 Global Trends in Giving Report is the second edition and based upon the survey results of 6,057 donors worldwide. The survey was conducted and promoted entirely online from April 23 through June 30, 2018. To reach a diverse global audience, the survey was published in Arabic, English, French, Portuguese, and Spanish.
Due to the methodology used, it’s important to note that the results only represent the views of respondents that (1) read Arabic, English, French, Portuguese, or Spanish; (2) have access to the Internet; and (3) use email and/or social media. Each year as more NGOs worldwide participate in the survey, the report becomes more accurate in its findings and useful to the NGO community.
SPONSORED BY
Public Interest Registry PIR .ORG
Based in Reston, VA, the Public Interest Registry is a non-profit organization created by the Internet Society in 2003 to manage the .ORG domain. In 2015, PIR launched the .NGO and .ONG domains to better serve the NGO sector.
RESEARCH BY
Nonprofit Tech for Good NPTECHFORGOOD.COM
With nearly 100,000 monthly visitors and more than one million followers on social networks, Nonprofit Tech for Good is a leading online fundraising and social media blog for nonprofit professionals worldwide.
YoDono
#GivingTuesday BackaBuddy Blackbaud Institute CanadaHelps
Doare Donadora East Africa Philanthropy Network everydayhero
Fundación Goteo GIVE.asia Givergy Giving.sg
HelpArgentina iDonate IsraelGives M-Changa
memboGo Philanthropy Circuit Vakinha
O U R PA RT N E R S H I P M O D E L
Our partnership model is simple and innovative: in exchange for promoting the survey to donors in their country or region, our partners receive the anonymized data and a corresponding infographic for their country or region. Thus far, the majority of donor research conducted has been based on data from donors located in developed countries. Through partnerships, we’re able to increase the participation of donors also located in developing and emerging nations thus providing a more diverse, balanced understanding of how donors prefer to give and engage with their favorite causes and charitable organizations.
2018 PARTNERS
About the Survey Respondents6,057 D O N O R S • 1 1 9 CO U N T R I E S
CAUSES DONATED TOAnimals and wildlife 10.5%Arts and culture 4%
Children and youth 15%
Community development 4.4%
Corporate accountability 0.2%
Disability rights 3.3%
Education and literacy 6.4%
Environment and conservation 5.6%
Faith and spirituality 6.6%
Health and wellness 10.8%
Human and civil rights 4.5%
Human and social services 8.1%
Hunger and homelessness 7.6%
International development and relief 6.4%
Peace and nonviolence 0.8%
Public media and communications 1%
Research and public policy 0.7%
Women and girls 4.1%
COUNTRIESCanada 23.5%
United States 17.9%
Brazil 12.3%
Singapore 7.1%
Israel 6.8%
Argentina 4.1%
United Kingdom 2.7%
Mexico 2.5%
Spain 2.3%
South Africa 2.1%
Other 18.7%
CONTINENTSAfrica 6%
Asia 20%
Australia & Oceania 3%
Europe 10%
North America 43%
South America 18%
GENDERFemale 64.7%
Male 34.8%
Non-binary 0.4%
GENERATIONGeneration Z (Born 1998 or after) 2.7%
Millennials (1981-1997) 32%
Generation X (1965-1980) 29.8%
Baby Boomers (1946-1964) 29.3%
Matures (Before 1946) 6.2%
REL IGIONBuddhist 3.6%
Christian 47%
Hindu 2.1%
Jewish 8.5%
Muslim 4.2%
Nonreligious/Secular 27.8%
Sikh 0.2%
Other 6.7%
IDEOLOGYVery liberal 23.2%
Somewhat liberal 29.5%
Moderate 32.8%
Somewhat conservative 10.4%
Conservative 4%
DONOR SIZEMicro ($100 USD or less) 30.7%
Small ($101-$1,000 USD) 43%
Mid-size ($1,001-$10,000 USD) 22.6%
Major ($10,000 USD or more) 3.7%

OTHER PREFERRED METHODS OF GIVING
HOW DONORS PREFER TO BE THANKED FOR THEIR DONATIONS
WHY FREE GIFTS DO NOT INSPIRE GIVING
45%ARE ENROLLED IN A MONTHLY
GIVING PROGRAM
14%GAVE ON #GIVINGTUESDAY 2017
—40% DID NOT
46%OF DONORS WORLDWIDE HAVE NOT
HEARD OF #GIVINGTUESDAY
G LO BA L T R E N DS I N G I V I N G
54% OF DONORS WORLDWIDE PREFER TO GIVE
ONLINE WITH A CREDIT OR DEBIT CARD
20% OF DONORS ARE MORE L IKELY TO GIVE
I F THEY ARE OFFERED A FREE GIFT —80% ARE NOT
11% DIRECT MAIL/POST
11% CASH
10% BANK/WIRE TRANSFER
★ 9% PAYPAL
★ 4% MOBILE APP/WALLET
★ 1% TEXT MESSAGE
68% WASTE OF THE MONEY
36% DON’T NEED/WANT GIFT
6% ENVIRONMENTAL IMPACT OF GIFT
69%EMAIL
14% PR INT LETTER
6% TEXT MESSAGE
5% PR INT POSTCARD
4%SOCIAL MEDIA MESSAGE
2% PHONECALL
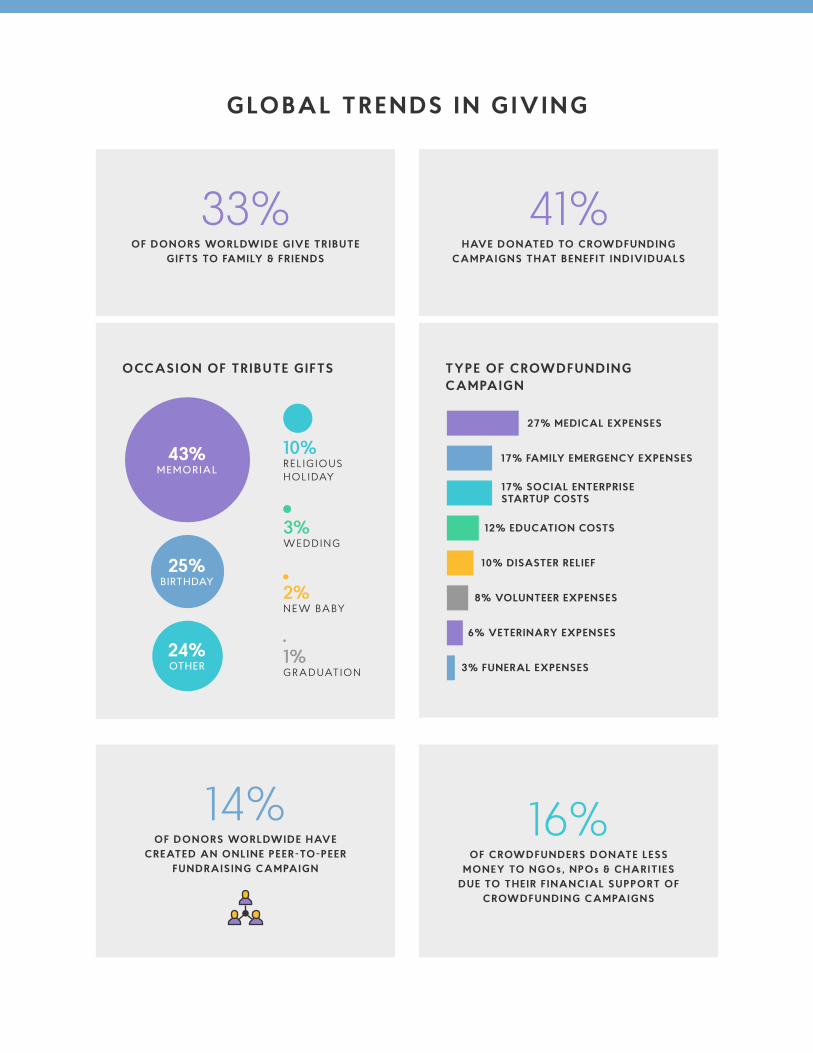
OCCASION OF TRIBUTE GIFTS TYPE OF CROWDFUNDING CAMPAIGN
G LO BA L T R E N DS I N G I V I N G
33% OF DONORS WORLDWIDE GIVE TRIBUTE
GIFTS TO FAMILY & FR IENDS
41% HAVE DONATED TO CROWDFUNDING
CAMPAIGNS THAT BENEF IT INDIVIDUALS
14% OF DONORS WORLDWIDE HAVE
CREATED AN ONLINE PEER-TO-PEER FUNDRAISING CAMPAIGN
16% OF CROWDFUNDERS DONATE LESS
MONEY TO NGOs, NPOs & CHARIT IES DUE TO THEIR F INANCIAL SUPPORT OF
CROWDFUNDING CAMPAIGNS
27% MEDICAL EXPENSES
17% FAMILY EMERGENCY EXPENSES
12% EDUCATION COSTS
10% DISASTER RELIEF
8% VOLUNTEER EXPENSES
6% VETERINARY EXPENSES
3% FUNERAL EXPENSES
17% SOCIAL ENTERPRISE STARTUP COSTS
43%MEMORIAL
25%BIRTHDAY
24%OTHER
10% REL IGIOUS HOLIDAY
3% WEDDING
2% NEW BABY
1%GRADUATION
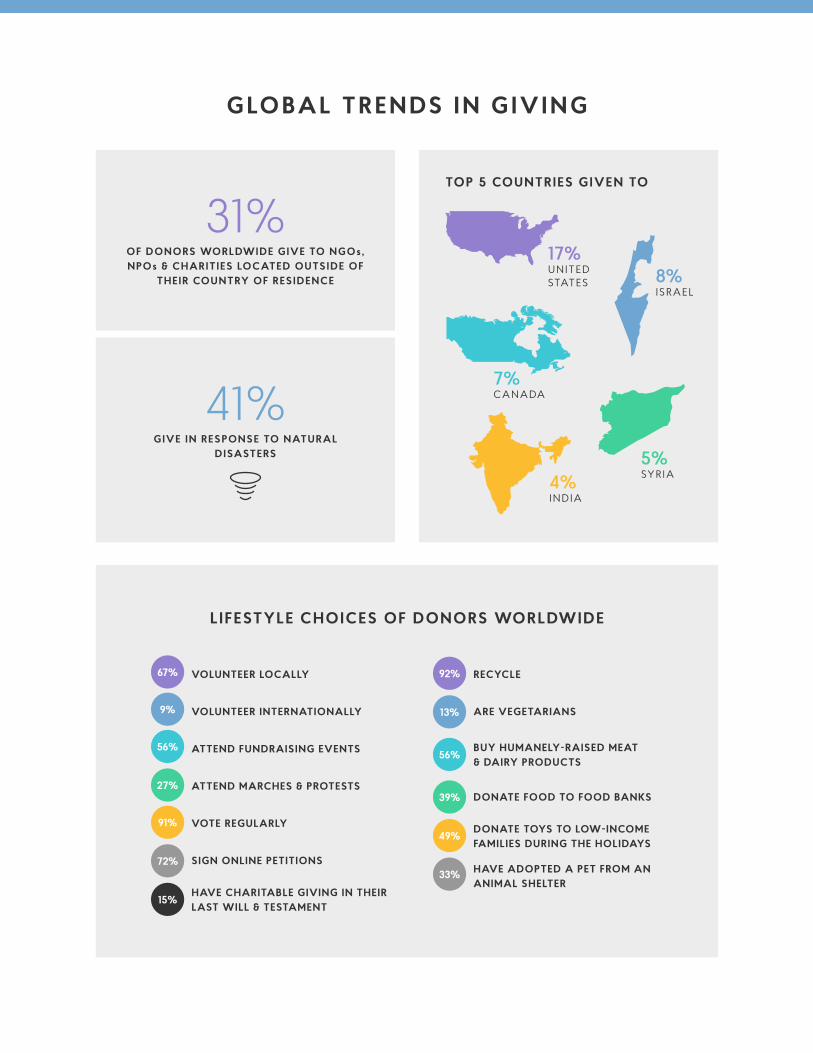
TOP 5 COUNTRIES GIVEN TO
31% OF DONORS WORLDWIDE GIVE TO NGOs, NPOs & CHARIT IES LOCATED OUTSIDE OF
THEIR COUNTRY OF RESIDENCE
L IFESTYLE CHOICES OF DONORS WORLDWIDE
41% GIVE IN RESPONSE TO NATURAL
DISASTERS
G LO BA L T R E N DS I N G I V I N G
17% UNITED STATES 8%
ISRAEL
7% CANADA
5% SYRIA4%
INDIA
67%
9% 13%
92%
56%
39%
56%
27%
49%91%
33%72%
15%
VOLUNTEER LOCALLY
VOLUNTEER INTERNATIONALLY
ATTEND FUNDRAISING EVENTS
ATTEND MARCHES & PROTESTS
VOTE REGULARLY
SIGN ONLINE PETITIONS
HAVE CHARITABLE GIVING IN THEIR LAST WILL & TESTAMENT
RECYCLE
ARE VEGETARIANS
BUY HUMANELY-RAISED MEAT & DAIRY PRODUCTS
DONATE FOOD TO FOOD BANKS
DONATE TOYS TO LOW-INCOME FAMILIES DURING THE HOLIDAYS
HAVE ADOPTED A PET FROM AN ANIMAL SHELTER
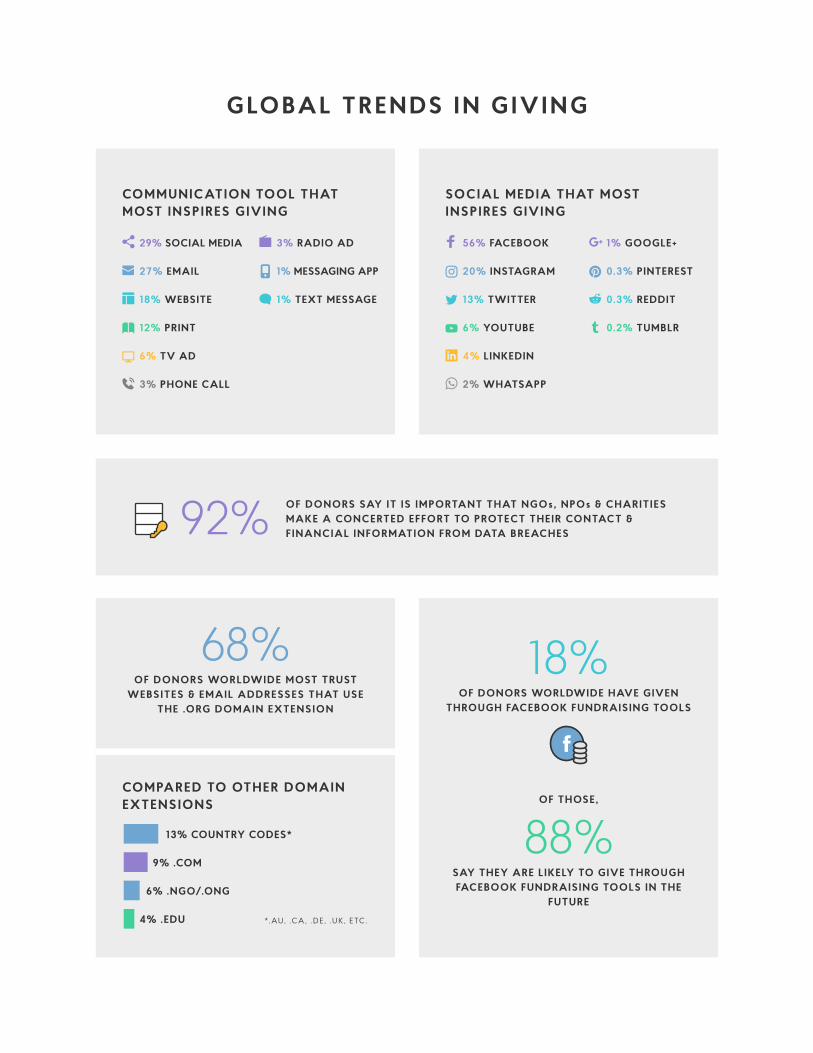
COMMUNICATION TOOL THAT MOST INSPIRES GIVING
SOCIAL MEDIA THAT MOST INSPIRES GIVING
G LO BA L T R E N DS I N G I V I N G
92%
29% SOCIAL MEDIA
27% EMAIL
18% WEBSITE
12% PRINT
6% TV AD
3% PHONE CALL
3% RADIO AD
1% MESSAGING APP
1% TEXT MESSAGE
56% FACEBOOK
20% INSTAGRAM
13% TWITTER
6% YOUTUBE
4% LINKEDIN
2% WHATSAPP
1% GOOGLE+
0.3% PINTEREST
0.3% REDDIT
0.2% TUMBLR
COMPARED TO OTHER DOMAIN EXTENSIONS
68% OF DONORS WORLDWIDE MOST TRUST
WEBSITES & EMAIL ADDRESSES THAT USE THE .ORG DOMAIN EXTENSION
18% OF DONORS WORLDWIDE HAVE GIVEN
THROUGH FACEBOOK FUNDRAISING TOOLS
OF THOSE,
88%SAY THEY ARE L IKELY TO GIVE THROUGH FACEBOOK FUNDRAISING TOOLS IN THE
FUTURE
13% COUNTRY CODES*
9% .COM
6% .NGO/.ONG
4% .EDU
OF DONORS SAY IT IS IMPORTANT THAT NGOs, NPOs & CHARIT IES MAKE A CONCERTED EFFORT TO PROTECT THEIR CONTACT & F INANCIAL INFORMATION FROM DATA BREACHES
*.AU, .CA, .DE , .UK, ETC.
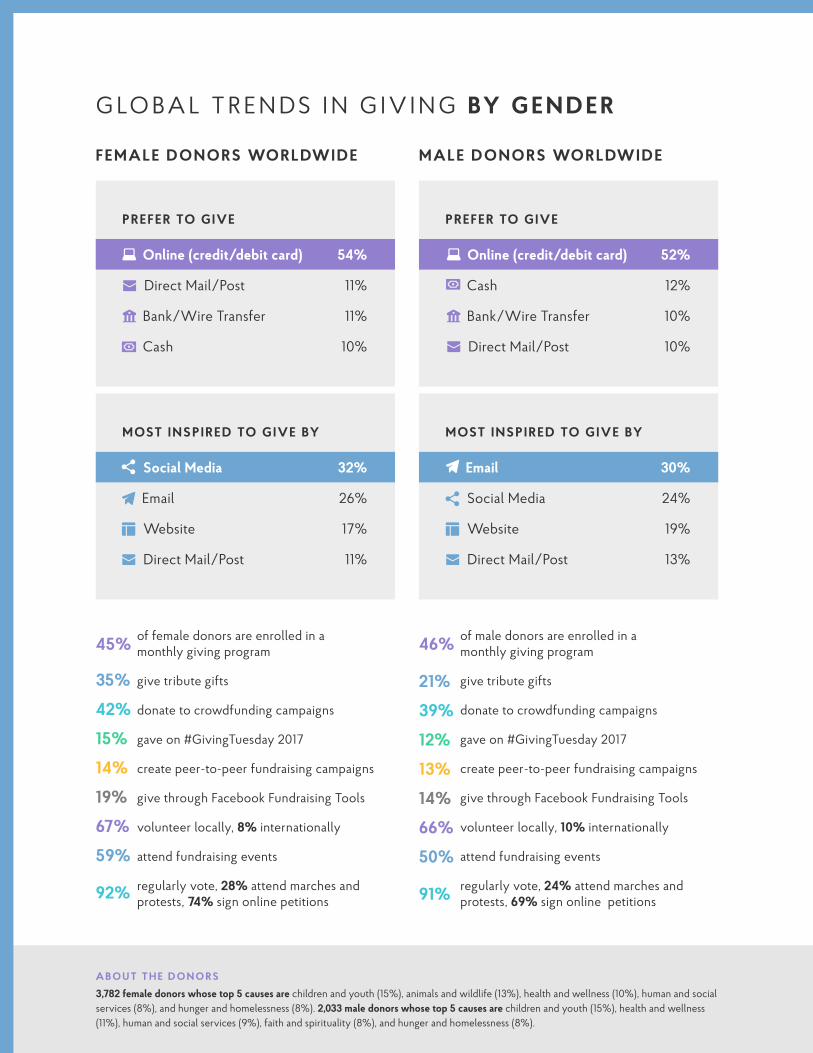
A BO U T T H E D O N O R S
3,782 female donors whose top 5 causes are children and youth (15%), animals and wildlife (13%), health and wellness (10%), human and social services (8%), and hunger and homelessness (8%). 2,033 male donors whose top 5 causes are children and youth (15%), health and wellness (11%), human and social services (9%), faith and spirituality (8%), and hunger and homelessness (8%).
G LO BA L T R E N DS I N G I V I N G BY G E N D E R
of female donors are enrolled in a monthly giving program
give tribute gifts
donate to crowdfunding campaigns
gave on #GivingTuesday 2017
create peer-to-peer fundraising campaigns
give through Facebook Fundraising Tools
volunteer locally, 8% internationally
attend fundraising events
regularly vote, 28% attend marches and protests, 74% sign online petitions
of male donors are enrolled in a monthly giving program
give tribute gifts
donate to crowdfunding campaigns
gave on #GivingTuesday 2017
create peer-to-peer fundraising campaigns
give through Facebook Fundraising Tools
volunteer locally, 10% internationally
attend fundraising events
regularly vote, 24% attend marches and protests, 69% sign online petitions
FEMALE DONORS WORLDWIDE MALE DONORS WORLDWIDE
MOST INSPIRED TO GIVE BY
Social Media 32%
Email 26%
Website 17%
Direct Mail/Post 11%
PREFER TO GIVE
Online (credit/debit card) 52%
Cash 12%
Bank/Wire Transfer 10%
Direct Mail/Post 10%
MOST INSPIRED TO GIVE BY
Email 30%
Social Media 24%
Website 19%
Direct Mail/Post 13%
45%
35%
42%
15%
14%
19%
67%
59%
92%
46%
21%
39%
12%
13%
14%
66%
50%
91%
PREFER TO GIVE
Online (credit/debit card) 54%
Direct Mail/Post 11%
Bank/Wire Transfer 11%
Cash 10%

A BO U T T H E D O N O R S
1,868 Millennial donors whose top 5 causes are children and youth (16%), animals and wildlife (13%), health and wellness (9%), hunger and homelessness (8%), and education (7%). 1,741 Gen X donors whose top 5 causes are children and youth (17%), animals and wildlife (11%), health and wellness (10%), human and social services (8%), and hunger and homelessness (7%). 1,708 Baby Boomer donors whose top 5 causes are health and wellness (13%), children and youth (12%), human and social services (10%), animals and wildlife (9%), and faith and spirituality (9%).
G LO BA L T R E N DS I N G I V I N G BY G E N E R AT I O N
of Millennial donors are enrolled in a monthly giving program
give tribute gifts
donate to crowdfunding campaigns
gave on #GivingTuesday 2017
give through Facebook Fundraising Tools
volunteer locally, 9% internationally
attend fundraising events
regularly vote, 32% attend marches and protests, 73% sign online petitions
of Gen X donors are enrolled in a monthly giving program
give tribute gifts
donate to crowdfunding campaigns
gave on #GivingTuesday 2017
give through Facebook Fundraising Tools
volunteer locally, 8% internationally
attend fundraising events
regularly vote, 26% attend marches and protests, 72% sign online petitions
of Baby Boomer donors are enrolled in a monthly giving program
give tribute gifts
donate to crowdfunding campaigns
gave on #GivingTuesday 2017
give through Facebook Fundraising Tools
volunteer locally, 9% internationally
attend fundraising events
regularly vote, 24% attend marches and protests, 71% sign online petitions
MILLENNIAL DONORS WORLDWIDE G E N X D O N O R S WO R L DW I D E BABY BOOMER DONORS WORLDWIDE
40%
26%
46%
15%
16%
64%
55%
87%
49%
31%
45%
14%
19%
64%
56%
91%
49%
41%
35%
15%
21%
71%
58%
96%
PREFER TO GIVE
Online (credit/debit card) 55%
Cash 14%
Bank/Wire Transfer 11%
PayPal 9%
MOST INSPIRED TO GIVE BY
Social Media 39%
Email 23%
Website 20%
Direct Mail/Post 6%
PREFER TO GIVE
Online (credit/debit card) 55%
Bank/Wire Transfer 12%
Cash 10%
PayPal 10%
MOST INSPIRED TO GIVE BY
Social Media 33%
Email 26%
Website 19%
Direct Mail/Post 9%
PREFER TO GIVE
Online (credit/debit card) 54%
Direct Mail/Post 19%
Bank/Wire Transfer 10%
PayPal 8%
MOST INSPIRED TO GIVE BY
Email 33%
Social Media 19%
Direct Mail/Post 18%
Website 16%

A BO U T T H E D O N O R S
2,501 liberal donors whose top 5 causes are children and youth (13%), animals and wildlife (11%), health and wellness (10%), human and social services (8%), and international development (8%). 1,556 moderate donors whose top 5 causes are children and youth (17%), health and wellness (13%), animals and wildlife (11%), human and social services (8%), and hunger and homelessness (8%). 684 conservative donors whose top 5 causes are faith and spirituality (19%), children and youth (15%), human and social services (10%), hunger and homelessness (10%), and animals and wildlife (9%).
G LO BA L T R E N DS I N G I V I N G BY I D E O LO G Y
of liberal donors are enrolled in a monthly giving program
give tribute gifts
donate to crowdfunding campaigns
gave on #GivingTuesday 2017
give through Facebook Fundraising Tools
volunteer locally, 9% internationally
attend fundraising events
regularly vote, 37% attend marches and protests, 79% sign online petitions
of moderate donors are enrolled in a monthly giving program
give tribute gifts
donate to crowdfunding campaigns
gave on #GivingTuesday 2017
give through Facebook Fundraising Tools
volunteer locally, 8% internationally
attend fundraising events
regularly vote, 16% attend marches and protests, 67% sign online petitions
of conservative donors are enrolled in a monthly giving program
give tribute gifts
donate to crowdfunding campaigns
gave on #GivingTuesday 2017
give through Facebook Fundraising Tools
volunteer locally, 10% internationally
attend fundraising events
regularly vote, 12% attend marches and protests, 62% sign online petitions
LIBERAL DONORS WORLDWIDE MODERATE DONORS WORLDWIDE CONSERVATIVE DONORS WORLDWIDE
48%
36%
45%
18%
20%
68%
59%
93%
41%
30%
38%
10%
16%
64%
52%
90%
50%
34%
35%
15%
16%
71%
58%
92%
PREFER TO GIVE
Online (credit/debit card) 56%
Direct Mail/Post 11%
Bank/Wire Transfer 10%
PayPal 10%
MOST INSPIRED TO GIVE BY
Social Media 31%
Email 29%
Website 17%
Direct Mail/Post 11%
PREFER TO GIVE
Online (credit/debit card) 53%
Cash 13%
Bank/Wire Transfer 12%
PayPal 8%
MOST INSPIRED TO GIVE BY
Social Media 30%
Email 24%
Website 19%
Direct Mail/Post 11%
PREFER TO GIVE
Online (credit/debit card) 53%
Direct Mail/Post 15%
Cash 11%
Bank/Wire Transfer 10%
MOST INSPIRED TO GIVE BY
Email 28%
Social Media 24%
Website 17%
Direct Mail/Post 16%
A BO U T T H E D O N O R S
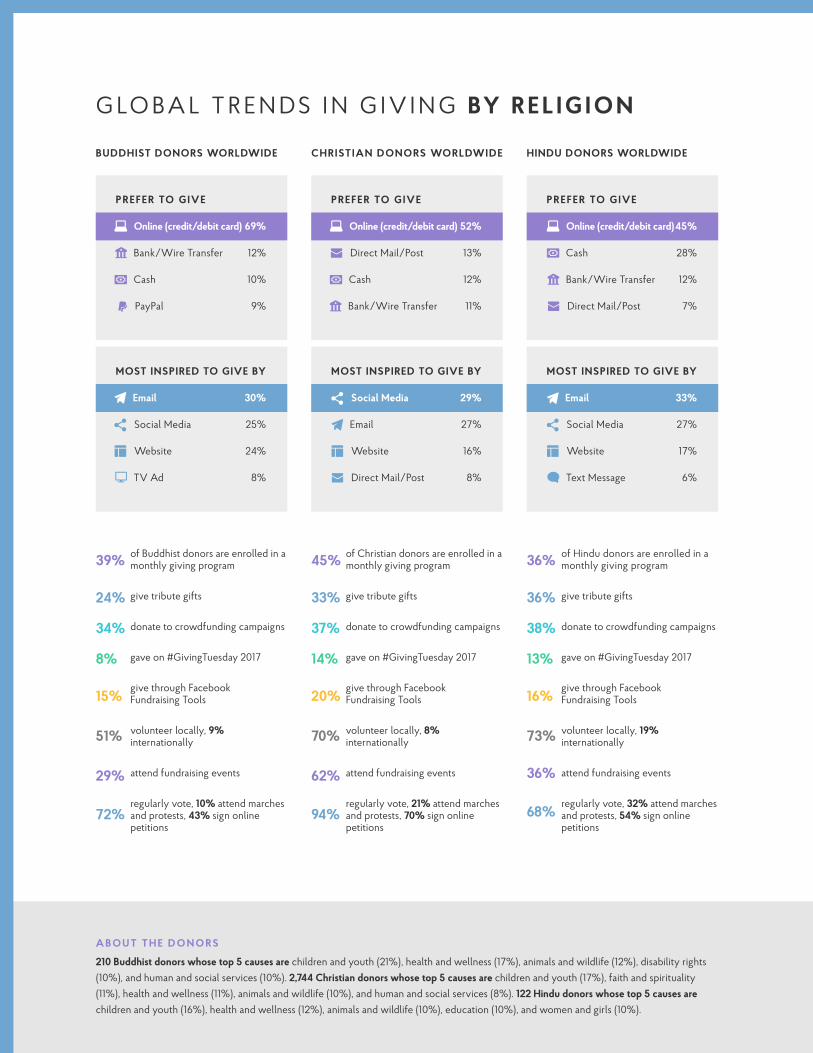
210 Buddhist donors whose top 5 causes are children and youth (21%), health and wellness (17%), animals and wildlife (12%), disability rights (10%), and human and social services (10%). 2,744 Christian donors whose top 5 causes are children and youth (17%), faith and spirituality (11%), health and wellness (11%), animals and wildlife (10%), and human and social services (8%). 122 Hindu donors whose top 5 causes are children and youth (16%), health and wellness (12%), animals and wildlife (10%), education (10%), and women and girls (10%).
G LO BA L T R E N DS I N G I V I N G BY R E L I G I O N
of Buddhist donors are enrolled in a monthly giving program
give tribute gifts
donate to crowdfunding campaigns
gave on #GivingTuesday 2017
give through Facebook Fundraising Tools
volunteer locally, 9% internationally
attend fundraising events
regularly vote, 10% attend marches and protests, 43% sign online petitions
of Christian donors are enrolled in a monthly giving program
give tribute gifts
donate to crowdfunding campaigns
gave on #GivingTuesday 2017
give through Facebook Fundraising Tools
volunteer locally, 8% internationally
attend fundraising events
regularly vote, 21% attend marches and protests, 70% sign online petitions
of Hindu donors are enrolled in a monthly giving program
give tribute gifts
donate to crowdfunding campaigns
gave on #GivingTuesday 2017
give through Facebook Fundraising Tools
volunteer locally, 19% internationally
attend fundraising events
regularly vote, 32% attend marches and protests, 54% sign online petitions
BUDDHIST DONORS WORLDWIDE CHRISTIAN DONORS WORLDWIDE HINDU DONORS WORLDWIDE
39%
24%
34%
8%
15%
51%
29%
72%
45%
33%
37%
14%
20%
70%
62%
94%
36%
36%
38%
13%
16%
73%
36%
68%
PREFER TO GIVE
Online (credit/debit card) 69%
Bank/Wire Transfer 12%
Cash 10%
PayPal 9%
MOST INSPIRED TO GIVE BY
Email 30%
Social Media 25%
Website 24%
TV Ad 8%
PREFER TO GIVE
Online (credit/debit card) 52%
Direct Mail/Post 13%
Cash 12%
Bank/Wire Transfer 11%
MOST INSPIRED TO GIVE BY
Social Media 29%
Email 27%
Website 16%
Direct Mail/Post 8%
PREFER TO GIVE
Online (credit/debit card) 45%
Cash 28%
Bank/Wire Transfer 12%
Direct Mail/Post 7%
MOST INSPIRED TO GIVE BY
Email 33%
Social Media 27%
Website 17%
Text Message 6%

A BO U T T H E D O N O R S
493 Jewish donors whose top 5 causes are children and youth (19%), hunger and homelessness (12%), health and wellness (11%), human and social services (11%), and faith and spirituality (8%). 246 Muslim donors whose top 5 causes are children and youth (18%), hunger and homelessness (13%), community development (9%), women and girls (9%), and education (8%). 1,624 non-religious donors whose top 5 causes are animals and wildlife (13%), children and youth (11%), health and wellness (10%), human and civil rights (8%), and international development (8%).
G LO BA L T R E N DS I N G I V I N G BY R E L I G I O N
of Jewish donors are enrolled in a monthly giving program
give tribute gifts
donate to crowdfunding campaigns
gave on #GivingTuesday 2017
give through Facebook Fundraising Tools
volunteer locally, 8% internationally
attend fundraising events
regularly vote, 27% attend marches and protests, 76% sign online petitions
of Muslim donors are enrolled in a monthly giving program
give tribute gifts
donate to crowdfunding campaigns
gave on #GivingTuesday 2017
give through Facebook Fundraising Tools
volunteer locally, 24% internationally
attend fundraising events
regularly vote, 34% attend marches and protests, 69% sign online petitions
of non-religious donors are enrolled in a monthly giving program
give tribute gifts
donate to crowdfunding campaigns
gave on #GivingTuesday 2017
give through Facebook Fundraising Tools
volunteer locally, 7% internationally
attend fundraising events
regularly vote, 36% attend marches and protests, 78% sign online petitions
JEWISH DONORS WORLDWIDE M U S L I M D O N O R S WO R L DW I D E NON-RELIGIOUS DONORS WORLDWIDE
50%
47%
55%
14%
11%
71%
50%
96%
45%
37%
52%
14%
11%
70%
52%
78%
48%
30%
43%
16%
17%
61%
54%
92%
PREFER TO GIVE
Online (credit/debit card) 53%
PayPal 17%
Direct Mail/Post 15%
Bank/Wire Transfer 7%
MOST INSPIRED TO GIVE BY
Email 33%
Social Media 22%
Website 15%
Direct Mail/Post 14%
PREFER TO GIVE
Online (credit/debit card) 35%
Cash 28%
Mobile App/Wallet 11%
Bank/Wire Transfer 10%
MOST INSPIRED TO GIVE BY
Social Media 36%
Email 24%
Website 12%
Phone Call 8%
PREFER TO GIVE
Online (credit/debit card) 59%
PayPal 11%
Bank/Wire Transfer 10%
Direct Mail/Post 8%
MOST INSPIRED TO GIVE BY
Social Media 32%
Email 27%
Website 20%
Direct Mail/Post 10%
A BO U T T H E D O N O R S
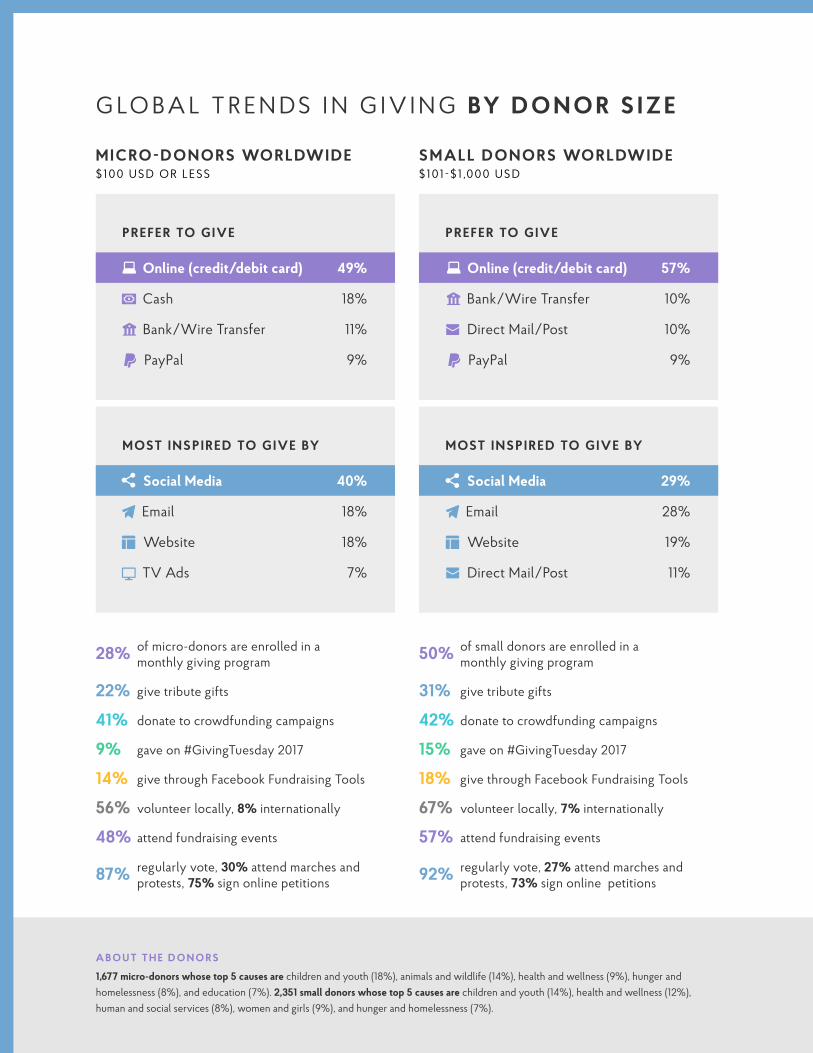
1,677 micro-donors whose top 5 causes are children and youth (18%), animals and wildlife (14%), health and wellness (9%), hunger and homelessness (8%), and education (7%). 2,351 small donors whose top 5 causes are children and youth (14%), health and wellness (12%), human and social services (8%), women and girls (9%), and hunger and homelessness (7%).
G LO BA L T R E N DS I N G I V I N G BY D O N O R S I Z E
of micro-donors are enrolled in a monthly giving program
give tribute gifts
donate to crowdfunding campaigns
gave on #GivingTuesday 2017
give through Facebook Fundraising Tools
volunteer locally, 8% internationally
attend fundraising events
regularly vote, 30% attend marches and protests, 75% sign online petitions
of small donors are enrolled in a monthly giving program
give tribute gifts
donate to crowdfunding campaigns
gave on #GivingTuesday 2017
give through Facebook Fundraising Tools
volunteer locally, 7% internationally
attend fundraising events
regularly vote, 27% attend marches and protests, 73% sign online petitions
MICRO-DONORS WORLDWIDE$100 USD OR LESS
SMALL DONORS WORLDWIDE $101-$1 ,000 USD
MOST INSPIRED TO GIVE BY
Social Media 40%
Email 18%
Website 18%
TV Ads 7%
PREFER TO GIVE
Online (credit/debit card) 57%
Bank/Wire Transfer 10%
Direct Mail/Post 10%
PayPal 9%
MOST INSPIRED TO GIVE BY
Social Media 29%
Email 28%
Website 19%
Direct Mail/Post 11%
28%
22%
41%
9%
14%
56%
48%
87%
50%
31%
42%
15%
18%
67%
57%
92%
PREFER TO GIVE
Online (credit/debit card) 49%
Cash 18%
Bank/Wire Transfer 11%
PayPal 9%

A BO U T T H E D O N O R S
1,235 mid-size donors whose top 5 causes are faith and spirituality (13%), children and youth (12%), health and wellness (11%), human and social services (10%), and international development (9%). 204 major donors whose top 5 causes are faith and spirituality (18%), human and social services (11%), international development (10%), children and youth (9%), and health and wellness (8%).
G LO BA L T R E N DS I N G I V I N G BY D O N O R S I Z E
of mid-size donors are enrolled in a monthly giving program
give tribute gifts
donate to crowdfunding campaigns
gave on #GivingTuesday 2017
give through Facebook Fundraising Tools
volunteer locally, 10% internationally
attend fundraising events
regularly vote, 23% attend marches and protests, 67% sign online petitions
of major donors are enrolled in a monthly giving program
give tribute gifts
donate to crowdfunding campaigns
gave on #GivingTuesday 2017
give through Facebook Fundraising Tools
volunteer locally, 19% internationally
attend fundraising events
regularly vote, 19% attend marches and protests, 62% sign online petitions
MID-SIZE DONORS WORLDWIDE $1 ,001-$10,000 USD
MAJOR DONORS WORLDWIDE $10,000 USD OR MORE
MOST INSPIRED TO GIVE BY
Email 33%
Social Media 20%
Direct Mail/Post 19%
Website 16%
PREFER TO GIVE
Online (credit/debit card) 45%
Direct Mail/Post 25%
Bank/Wire Transfer 16%
PayPal 6%
MOST INSPIRED TO GIVE BY
Email 33%
Direct Mail/Post 22%
Website 17%
Social Media 13%
58%
49%
40%
19%
24%
77%
63%
95%
53%
57%
37%
22%
33%
81%
69%
95%
PREFER TO GIVE
Online (credit/debit card) 55%
Direct Mail/Post 19%
Bank/Wire Transfer 9%
PayPal 8%

DATA S H E E T
Giving Trends in Africa32% of donors in Africa prefer to give cash, 25% online (credit/debit card), 15% through a mobile app/wallet, 14% by bank/wire transfer, and 7% via text message.
27% are enrolled in a monthly giving program.
61% prefer to be thanked for their donations by email, 17% via text message, 8% by print letter, 7% by phone call, and 6% by social media message.
9% donated on #GivingTuesday 2017, 28% did not. 62% have never heard of #GivingTuesday. Of those who gave on #GivingTuesday 2017, 62% gave to one organization, 35% to two or three, and 3% gave to four or more.
38% of donors in Africa give tribute gifts. The top five occasions are birthdays (23%), memorials (17%), weddings (12%), a new baby (9%), and religious holidays (7%).
50% donate to crowdfunding campaigns that benefit individuals. The top five causes are medical expenses (39%), education costs (14%), volunteer expenses (13%), start-up costs for a social enterprise (10%), and disaster relief (9%). Of those that give to crowdfunding campaigns, 28% say that they give less to organizations due to their financial support of crowdfunding campaigns.
45% are more likely to donate if they are offered a free gift in exchange for their donation.
18% create online peer-to-peer fundraising campaigns to benefit organizations.
20% give to organizations located outside of their country of residence.
40% donate in response to natural disasters.
14% have charitable giving in their last will and testament.
60% of donors in Africa are more likely to trust organizations that use the .org domain extension for website and email communications.
63% say they are most likely to give repeatedly to an organization if they receive regular communication about the work the organization is doing and the impact that their donation is making.
40% are most inspired to give by social media, email (20%), and TV ads (9%). Of those inspired by social media, Facebook (51%) has the largest impact, then Instagram (23%) and Twitter (12%). Messaging apps (3%), text messages (4%), and print (4%) are the least inspiring.
10% have donated directly to an organization using Facebook Fundraising Tools. Of those, 100% said they are likely to donate through Facebook again.
87% do not want organizations to share their contact information with other organizations. 95% want organizations to make a concerted effort to protect their contact and financial information from data breaches.
73% of donors in Africa volunteer. 68% attend fundraising events. 30% attend marches or protests. 83% regularly vote. 72% sign online petitions.
A BO U T T H E D O N O R S
352 donors whose top 5 causes are children and youth (22%), hunger and homelessness (11%), animals and wildlife (10%), education and literacy (9%), and community development (8%). Top 5 countries: South Africa (36%), Kenya (29%), Nigeria (20%), Tanzania (5%), and Uganda (3%). 63% are female, 37% male. 58% are Millennials, 26% Gen Xers, and 10% are Baby Boomers. 70% are Christian, 13% non-religious, and 12% are Muslim. 61% are micro-donors, 32% small, 6% mid-size, and 1% are major donors.

DATA S H E E T
Giving Trends in Asia51% of donors in Asia prefer to give online (credit/debit card), 13% via PayPal, 12% in cash, 10% through direct mail/post, and 9% by bank/wire transfer.
41% are enrolled in a monthly giving program.
71% prefer to be thanked for their donations by email, 11% by print letter, 6% via text message, 5% by phone call, and 6% by print postcard.
10% donated on #GivingTuesday 2017, 27% did not. 63% have never heard of #GivingTuesday. Of those who gave on #GivingTuesday 2017, 51% gave to one organization, 34% to two or three, 13% gave to four to six, and 2% gave to seven or more.
28% of donors in Asia give tribute gifts. The top five occasions are memorials (31%), birthdays (25%), religious holidays (12%), weddings (4%), and a new baby (2%).
44% donate to crowdfunding campaigns that benefit individuals. The top five causes are medical expenses (29%), family emergency expenses (18%), start-up costs for a social enterprise (18%), disaster relief (11%), and education costs (11%). Of those that give to crowdfunding campaigns, 22% say that they give less to organizations due to their financial support of crowdfunding campaigns.
25% are more likely to donate if they are offered a free gift in exchange for their donation.
10% create online peer-to-peer fundraising campaigns to benefit organizations.
44% give to organizations located outside of their country of residence.
34% donate in response to natural disasters.
15% have charitable giving in their last will and testament.
65% of donors in Asia are more likely to trust organizations that use the .org domain extension for website and email communications.
69% say they are most likely to give repeatedly to an organization if they receive regular communication about the work the organization is doing and the impact that their donation is making.
29% are most inspired to give by email, social media (26%), and by an organization’s website (21%). Of those inspired by social media, Facebook (63%) has the largest impact, then Instagram (13%) and YouTube (9%). Messaging apps (1%), radio ads (2%), and text messages (2%) are the least inspiring.
9% have donated directly to an organization using Facebook Fundraising Tools. Of those, 90% said they are likely to donate through Facebook again.
81% do not want organizations to share their contact information with other organizations. 90% want organizations to make a concerted effort to protect their contact and financial information from data breaches.
60% of donors in Asia volunteer. 32% attend fundraising events. 18% attend marches or protests. 80% regularly vote. 61% sign online petitions.
A BO U T T H E D O N O R S
1,145 donors whose top 5 causes are children and youth (18%), health and wellness (12%), human and social services (11%), hunger and homelessness (9%), and animals and wildlife (8%). Top 5 countries: Singapore (37%), Israel (35%), India (11%), Bangladesh (6%), and Pakistan (5%). 51% are female, 49% male. 35% are Gen Xers, 34% Millennials, and 20% are Baby Boomers. 30% are Jewish, 16% Muslim, and 14% are Buddhist. 42% are small donors, 31% micro, 21% mid-size, and 6% are major donors.

DATA S H E E T
Giving Trends in Australia & Oceania59% of donors in Australia & Oceania prefer to give online (credit/debit card), 13% in cash, 9% by direct mail/post, 8% by bank/wire transfer, and 8% via PayPal.
51% are enrolled in a monthly giving program.
74% prefer to be thanked for their donations by email, 10% by print letter, 7% via text message, 4% by print postcard, and 4% by social media message.
1% donated on #GivingTuesday 2017, 49% did not. 50% have never heard of #GivingTuesday. Of those who gave on #GivingTuesday 2017, 100% gave to one organization.
37% of donors in Australia & Oceania give tribute gifts. The top five occasions are memorials (34%), religious holidays (21%), birthdays (9%), weddings (4%), and a new baby (2%).
42% donate to crowdfunding campaigns that benefit individuals. The top five causes are medical expenses (24%), start-up costs for a social enterprise (24%), family emergency expenses (16%), volunteer expenses (16%), and disaster relief (7%). Of those that give to crowdfunding campaigns, 10% say that they give less to organizations due to their financial support of crowdfunding campaigns.
14% are more likely to donate if they are offered a free gift in exchange for their donation.
21% create online peer-to-peer fundraising campaigns to benefit organizations.
39% give to organizations located outside of their country of residence.
31% donate in response to natural disasters.
13% have charitable giving in their last will and testament.
65% of donors in Australia & Oceania are more likely to trust organizations that use the .org domain extension for website and email communications.
54% say they are most likely to give repeatedly to an organization if they receive regular communication about the work the organization is doing and the impact that their donation is making.
31% are most inspired to give by social media, email (30%), and by an organization’s website (17%). Of those inspired by social media, Facebook (54%) has the largest impact, then Instagram (21%) and LinkedIn (10%). Messaging apps (0.2%), text messages (1%), and radio ads (2%) are the least inspiring.
7% have donated directly to an organization using Facebook Fundraising Tools. Of those, 100% said they are likely to donate through Facebook again.
85% do not want organizations to share their contact information with other organizations. 95% want organizations to make a concerted effort to protect their contact and financial information from data breaches.
79% of donors in Australia & Oceania volunteer. 75% attend fundraising events. 15% attend marches or protests. 92% regularly vote. 79% sign online petitions.
A BO U T T H E D O N O R S
161 donors whose top 5 causes are children and youth (15%), international development (12%), animals and wildlife (10%), health and wellness (9%), and hunger and homelessness (9%). Top 4 countries: Australia (64%), New Zealand (33%), American Samoa (2%), and Fiji (1%). 76% are female, 24% male. 37% are Millennials, 32% Gen Xers, and 27% are Baby Boomers. 48% are non-religious, 37% Christian, and 4% are Jewish. 60% are small donors, 22% micro, 15% mid-size, and 3% are major donors.
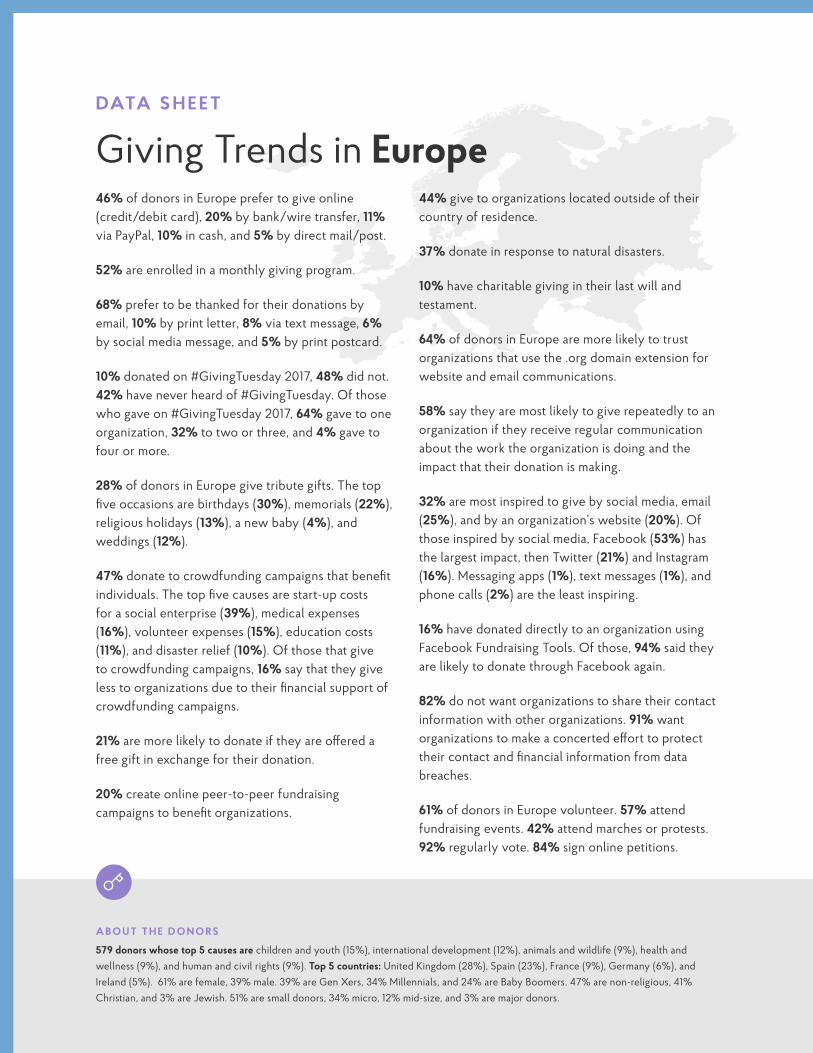
DATA S H E E T
Giving Trends in Europe46% of donors in Europe prefer to give online (credit/debit card), 20% by bank/wire transfer, 11% via PayPal, 10% in cash, and 5% by direct mail/post.
52% are enrolled in a monthly giving program.
68% prefer to be thanked for their donations by email, 10% by print letter, 8% via text message, 6% by social media message, and 5% by print postcard.
10% donated on #GivingTuesday 2017, 48% did not. 42% have never heard of #GivingTuesday. Of those who gave on #GivingTuesday 2017, 64% gave to one organization, 32% to two or three, and 4% gave to four or more.
28% of donors in Europe give tribute gifts. The top five occasions are birthdays (30%), memorials (22%), religious holidays (13%), a new baby (4%), and weddings (12%).
47% donate to crowdfunding campaigns that benefit individuals. The top five causes are start-up costs for a social enterprise (39%), medical expenses (16%), volunteer expenses (15%), education costs (11%), and disaster relief (10%). Of those that give to crowdfunding campaigns, 16% say that they give less to organizations due to their financial support of crowdfunding campaigns.
21% are more likely to donate if they are offered a free gift in exchange for their donation.
20% create online peer-to-peer fundraising campaigns to benefit organizations.
44% give to organizations located outside of their country of residence.
37% donate in response to natural disasters.
10% have charitable giving in their last will and testament.
64% of donors in Europe are more likely to trust organizations that use the .org domain extension for website and email communications.
58% say they are most likely to give repeatedly to an organization if they receive regular communication about the work the organization is doing and the impact that their donation is making.
32% are most inspired to give by social media, email (25%), and by an organization’s website (20%). Of those inspired by social media, Facebook (53%) has the largest impact, then Twitter (21%) and Instagram (16%). Messaging apps (1%), text messages (1%), and phone calls (2%) are the least inspiring.
16% have donated directly to an organization using Facebook Fundraising Tools. Of those, 94% said they are likely to donate through Facebook again.
82% do not want organizations to share their contact information with other organizations. 91% want organizations to make a concerted effort to protect their contact and financial information from data breaches.
61% of donors in Europe volunteer. 57% attend fundraising events. 42% attend marches or protests. 92% regularly vote. 84% sign online petitions.
A BO U T T H E D O N O R S
579 donors whose top 5 causes are children and youth (15%), international development (12%), animals and wildlife (9%), health and wellness (9%), and human and civil rights (9%). Top 5 countries: United Kingdom (28%), Spain (23%), France (9%), Germany (6%), and Ireland (5%). 61% are female, 39% male. 39% are Gen Xers, 34% Millennials, and 24% are Baby Boomers. 47% are non-religious, 41% Christian, and 3% are Jewish. 51% are small donors, 34% micro, 12% mid-size, and 3% are major donors.
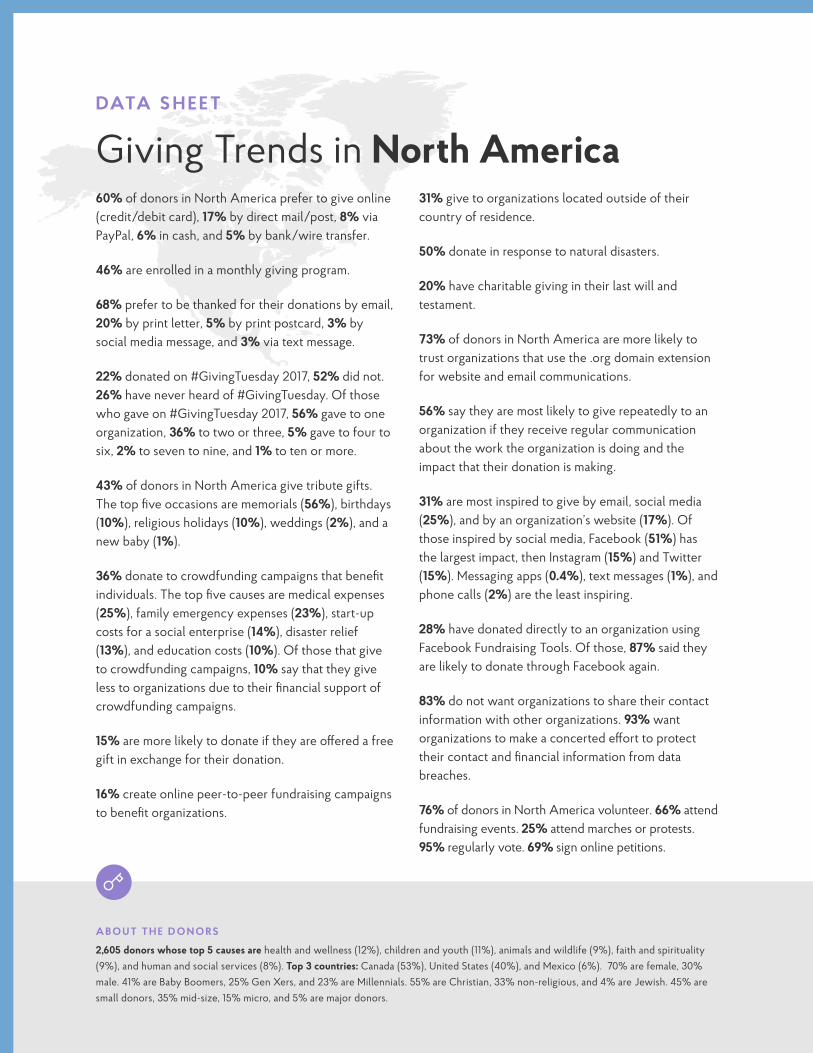
DATA S H E E T
Giving Trends in North America60% of donors in North America prefer to give online (credit/debit card), 17% by direct mail/post, 8% via PayPal, 6% in cash, and 5% by bank/wire transfer.
46% are enrolled in a monthly giving program.
68% prefer to be thanked for their donations by email, 20% by print letter, 5% by print postcard, 3% by social media message, and 3% via text message.
22% donated on #GivingTuesday 2017, 52% did not. 26% have never heard of #GivingTuesday. Of those who gave on #GivingTuesday 2017, 56% gave to one organization, 36% to two or three, 5% gave to four to six, 2% to seven to nine, and 1% to ten or more.
43% of donors in North America give tribute gifts. The top five occasions are memorials (56%), birthdays (10%), religious holidays (10%), weddings (2%), and a new baby (1%).
36% donate to crowdfunding campaigns that benefit individuals. The top five causes are medical expenses (25%), family emergency expenses (23%), start-up costs for a social enterprise (14%), disaster relief (13%), and education costs (10%). Of those that give to crowdfunding campaigns, 10% say that they give less to organizations due to their financial support of crowdfunding campaigns.
15% are more likely to donate if they are offered a free gift in exchange for their donation.
16% create online peer-to-peer fundraising campaigns to benefit organizations.
31% give to organizations located outside of their country of residence.
50% donate in response to natural disasters.
20% have charitable giving in their last will and testament.
73% of donors in North America are more likely to trust organizations that use the .org domain extension for website and email communications.
56% say they are most likely to give repeatedly to an organization if they receive regular communication about the work the organization is doing and the impact that their donation is making.
31% are most inspired to give by email, social media (25%), and by an organization’s website (17%). Of those inspired by social media, Facebook (51%) has the largest impact, then Instagram (15%) and Twitter (15%). Messaging apps (0.4%), text messages (1%), and phone calls (2%) are the least inspiring.
28% have donated directly to an organization using Facebook Fundraising Tools. Of those, 87% said they are likely to donate through Facebook again.
83% do not want organizations to share their contact information with other organizations. 93% want organizations to make a concerted effort to protect their contact and financial information from data breaches.
76% of donors in North America volunteer. 66% attend fundraising events. 25% attend marches or protests. 95% regularly vote. 69% sign online petitions.
A BO U T T H E D O N O R S
2,605 donors whose top 5 causes are health and wellness (12%), children and youth (11%), animals and wildlife (9%), faith and spirituality (9%), and human and social services (8%). Top 3 countries: Canada (53%), United States (40%), and Mexico (6%). 70% are female, 30% male. 41% are Baby Boomers, 25% Gen Xers, and 23% are Millennials. 55% are Christian, 33% non-religious, and 4% are Jewish. 45% are small donors, 35% mid-size, 15% micro, and 5% are major donors.
DATA S H E E T
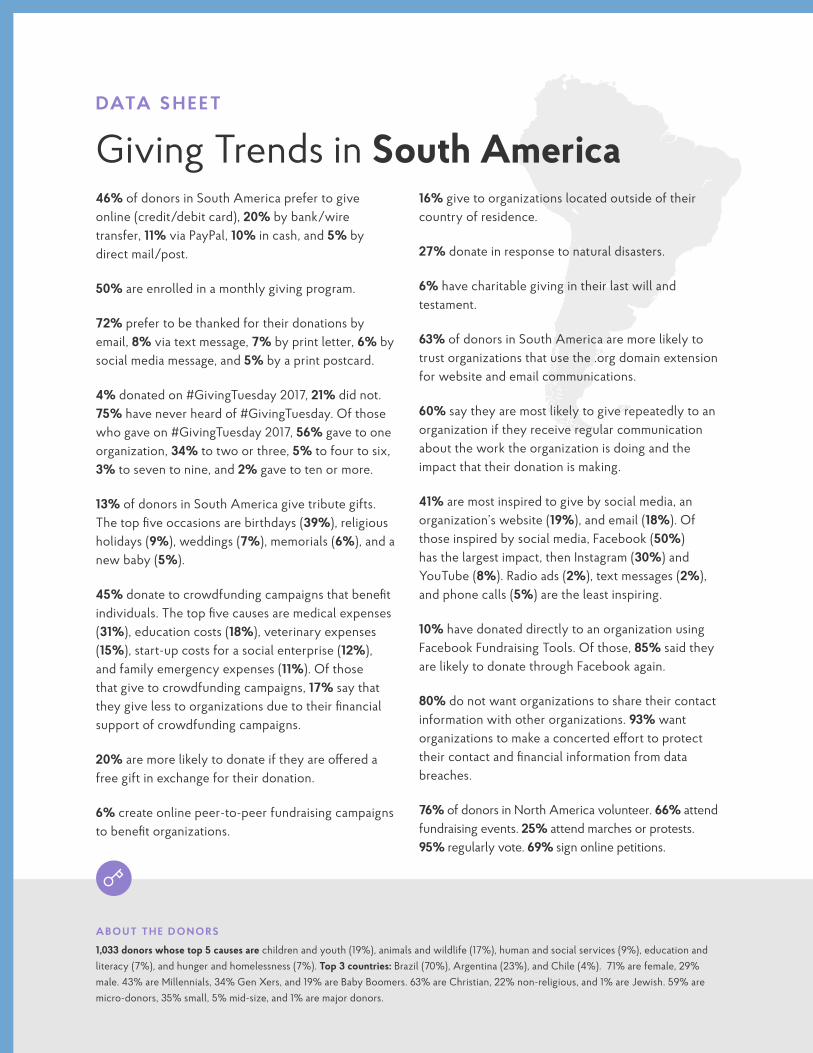
Giving Trends in South America46% of donors in South America prefer to give online (credit/debit card), 20% by bank/wire transfer, 11% via PayPal, 10% in cash, and 5% by direct mail/post.
50% are enrolled in a monthly giving program.
72% prefer to be thanked for their donations by email, 8% via text message, 7% by print letter, 6% by social media message, and 5% by a print postcard.
4% donated on #GivingTuesday 2017, 21% did not. 75% have never heard of #GivingTuesday. Of those who gave on #GivingTuesday 2017, 56% gave to one organization, 34% to two or three, 5% to four to six, 3% to seven to nine, and 2% gave to ten or more.
13% of donors in South America give tribute gifts. The top five occasions are birthdays (39%), religious holidays (9%), weddings (7%), memorials (6%), and a new baby (5%).
45% donate to crowdfunding campaigns that benefit individuals. The top five causes are medical expenses (31%), education costs (18%), veterinary expenses (15%), start-up costs for a social enterprise (12%), and family emergency expenses (11%). Of those that give to crowdfunding campaigns, 17% say that they give less to organizations due to their financial support of crowdfunding campaigns.
20% are more likely to donate if they are offered a free gift in exchange for their donation.
6% create online peer-to-peer fundraising campaigns to benefit organizations.
16% give to organizations located outside of their country of residence.
27% donate in response to natural disasters.
6% have charitable giving in their last will and testament.
63% of donors in South America are more likely to trust organizations that use the .org domain extension for website and email communications.
60% say they are most likely to give repeatedly to an organization if they receive regular communication about the work the organization is doing and the impact that their donation is making.
41% are most inspired to give by social media, an organization’s website (19%), and email (18%). Of those inspired by social media, Facebook (50%) has the largest impact, then Instagram (30%) and YouTube (8%). Radio ads (2%), text messages (2%), and phone calls (5%) are the least inspiring.
10% have donated directly to an organization using Facebook Fundraising Tools. Of those, 85% said they are likely to donate through Facebook again.
80% do not want organizations to share their contact information with other organizations. 93% want organizations to make a concerted effort to protect their contact and financial information from data breaches.
76% of donors in North America volunteer. 66% attend fundraising events. 25% attend marches or protests. 95% regularly vote. 69% sign online petitions.
A BO U T T H E D O N O R S
1,033 donors whose top 5 causes are children and youth (19%), animals and wildlife (17%), human and social services (9%), education and literacy (7%), and hunger and homelessness (7%). Top 3 countries: Brazil (70%), Argentina (23%), and Chile (4%). 71% are female, 29% male. 43% are Millennials, 34% Gen Xers, and 19% are Baby Boomers. 63% are Christian, 22% non-religious, and 1% are Jewish. 59% are micro-donors, 35% small, 5% mid-size, and 1% are major donors.
2 0 1 8 G LO BA L T R E N DS I N G I V I N G R E PO RT
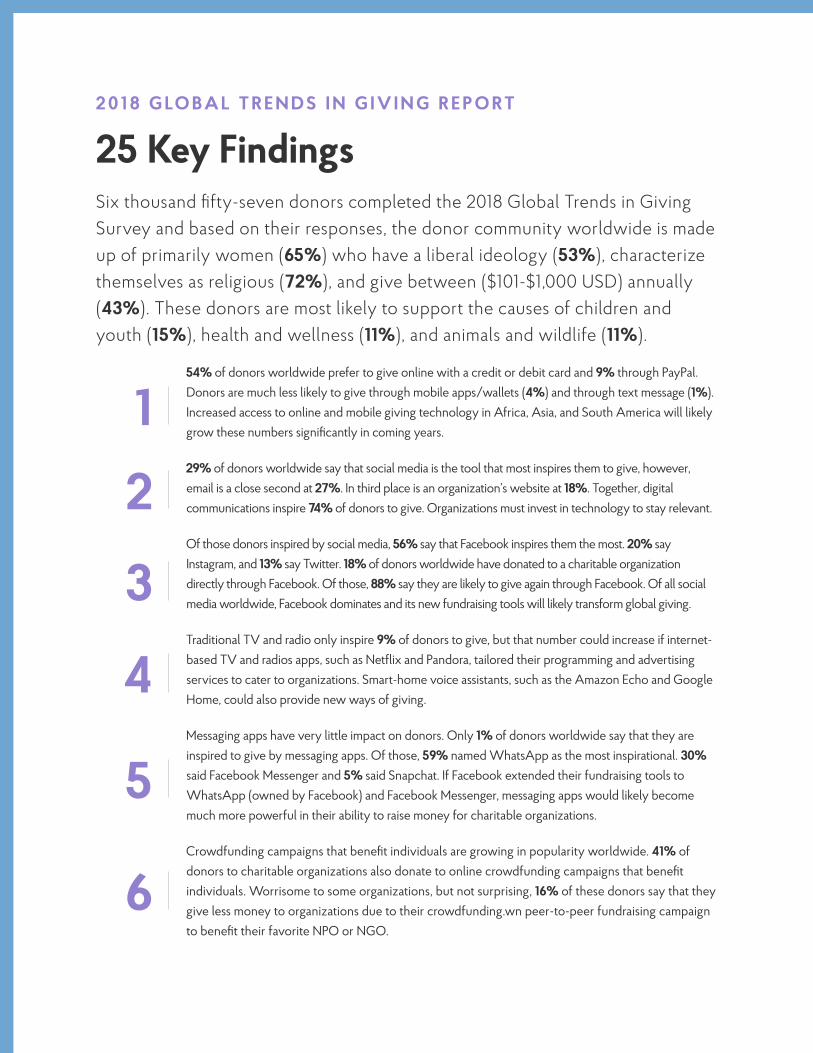
25 Key FindingsSix thousand fifty-seven donors completed the 2018 Global Trends in Giving Survey and based on their responses, the donor community worldwide is made up of primarily women (65%) who have a liberal ideology (53%), characterize themselves as religious (72%), and give between ($101-$1,000 USD) annually (43%). These donors are most likely to support the causes of children and youth (15%), health and wellness (11%), and animals and wildlife (11%).
154% of donors worldwide prefer to give online with a credit or debit card and 9% through PayPal. Donors are much less likely to give through mobile apps/wallets (4%) and through text message (1%). Increased access to online and mobile giving technology in Africa, Asia, and South America will likely grow these numbers significantly in coming years.
229% of donors worldwide say that social media is the tool that most inspires them to give, however, email is a close second at 27%. In third place is an organization’s website at 18%. Together, digital communications inspire 74% of donors to give. Organizations must invest in technology to stay relevant.
3Of those donors inspired by social media, 56% say that Facebook inspires them the most. 20% say Instagram, and 13% say Twitter. 18% of donors worldwide have donated to a charitable organization directly through Facebook. Of those, 88% say they are likely to give again through Facebook. Of all social media worldwide, Facebook dominates and its new fundraising tools will likely transform global giving.
4Traditional TV and radio only inspire 9% of donors to give, but that number could increase if internet-based TV and radios apps, such as Netflix and Pandora, tailored their programming and advertising services to cater to organizations. Smart-home voice assistants, such as the Amazon Echo and Google Home, could also provide new ways of giving.
5Messaging apps have very little impact on donors. Only 1% of donors worldwide say that they are inspired to give by messaging apps. Of those, 59% named WhatsApp as the most inspirational. 30% said Facebook Messenger and 5% said Snapchat. If Facebook extended their fundraising tools to WhatsApp (owned by Facebook) and Facebook Messenger, messaging apps would likely become much more powerful in their ability to raise money for charitable organizations.
6Crowdfunding campaigns that benefit individuals are growing in popularity worldwide. 41% of donors to charitable organizations also donate to online crowdfunding campaigns that benefit individuals. Worrisome to some organizations, but not surprising, 16% of these donors say that they give less money to organizations due to their crowdfunding.wn peer-to-peer fundraising campaign to benefit their favorite NPO or NGO.

733% of donors worldwide give tribute gifts and the top three occasions are memorials (43%), birthdays (25%), and religious holidays (10%). That said, very few organizations actively promote tribute giving and doing so would likely a result a steady revenue stream. Baby Boomers are most likely to give tribute gifts at 41%. 31% of Gen Xers give tribute gifts as do 26% of Millennials.ly to inspire giving while peace and non-violence is the least likely to inspire giving.
8Generational differences are lessening due to technological advances. Millennials, Gen Xers, and Baby Boomers all prefer to give online and digital communications significantly influence their giving. Baby Boomers are the generation most likely to give as a result of direct mail/post (18%), but overall, all generations are becoming more homogeneous and tech-based in their giving habits.
9Religious donors are more likely to give to charitable organizations that provide basic needs and support the causes of children and youth, health and wellness, and hunger and homelessness. Non-religious donors are more likely to give to the causes of animals and wildlife, human and civil rights, and international development and relief. Older and mid-size major donors are the most likely to be religious while younger micro and small donors are the most likely to be non-religious.
10Donors of all sizes prefer to give online, however, micro-donors are the most likely to give cash while major donors are the most likely to give through direct mail/post. That said, no matter how they give, the vast majority of donors (69%) prefer to be thanked for their donations via email.
11Donors are very involved with their favorite causes and charitable organizations offline. 67% volunteer locally, 9% volunteer internationally, and 56% attend fundraising events. Individuals that give money are also willing to give their time. Donors are also highly engaged in civic life. 91% vote regularly, 72% sign online petitions, and 27% attend marches and protests.
12 31% of donors worldwide give to organizations outside of their country of residence. Online giving technology—combined with access to a 24/7 global news cycle and more affordable international travel—has led to an increase in donors with an empathic worldview.
13Privacy rights are a growing concern for donors. 80% do not want organizations to share their contact information with other organizations and 92% want organizations to make a concerted effort to protect their contact and financial information from data breaches.
A F R I C A
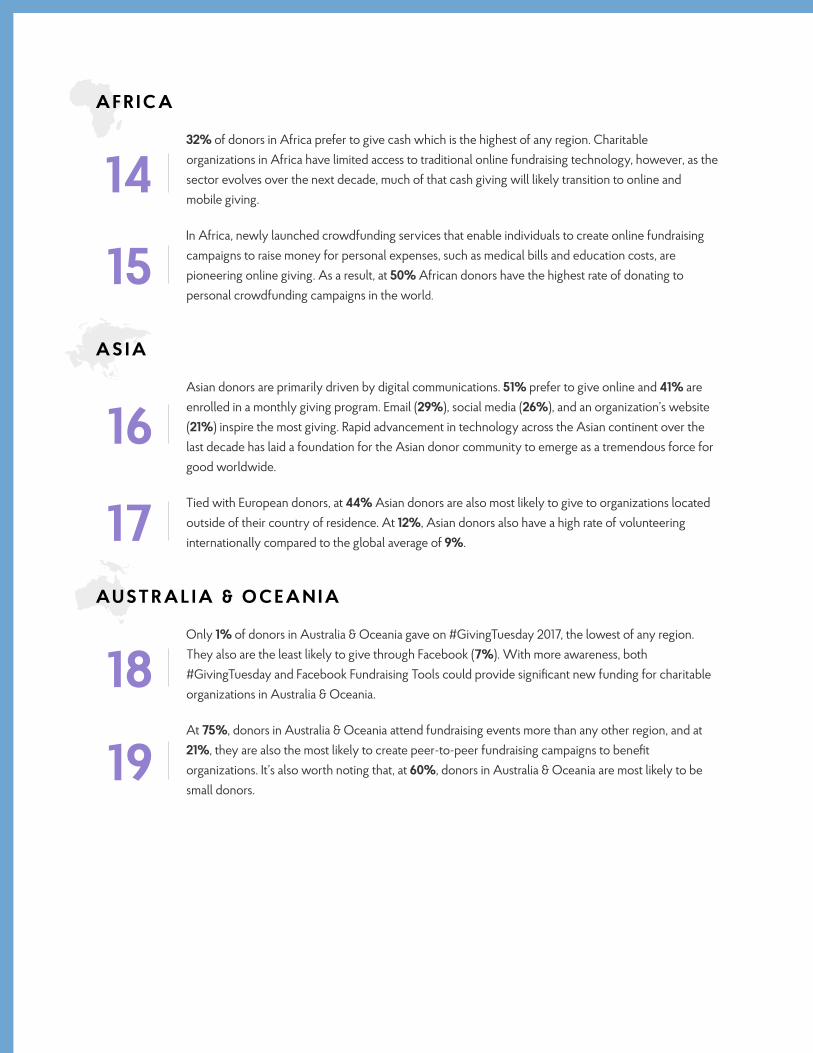
1432% of donors in Africa prefer to give cash which is the highest of any region. Charitable organizations in Africa have limited access to traditional online fundraising technology, however, as the sector evolves over the next decade, much of that cash giving will likely transition to online and mobile giving.
15In Africa, newly launched crowdfunding services that enable individuals to create online fundraising campaigns to raise money for personal expenses, such as medical bills and education costs, are pioneering online giving. As a result, at 50% African donors have the highest rate of donating to personal crowdfunding campaigns in the world.
AS I A
16Asian donors are primarily driven by digital communications. 51% prefer to give online and 41% are enrolled in a monthly giving program. Email (29%), social media (26%), and an organization’s website (21%) inspire the most giving. Rapid advancement in technology across the Asian continent over the last decade has laid a foundation for the Asian donor community to emerge as a tremendous force for good worldwide.
17Tied with European donors, at 44% Asian donors are also most likely to give to organizations located outside of their country of residence. At 12%, Asian donors also have a high rate of volunteering internationally compared to the global average of 9%.
AU ST R A L I A & O C E A N I A
18Only 1% of donors in Australia & Oceania gave on #GivingTuesday 2017, the lowest of any region. They also are the least likely to give through Facebook (7%). With more awareness, both #GivingTuesday and Facebook Fundraising Tools could provide significant new funding for charitable organizations in Australia & Oceania.
19At 75%, donors in Australia & Oceania attend fundraising events more than any other region, and at 21%, they are also the most likely to create peer-to-peer fundraising campaigns to benefit organizations. It’s also worth noting that, at 60%, donors in Australia & Oceania are most likely to be small donors.
SO U T H A M E R I C A
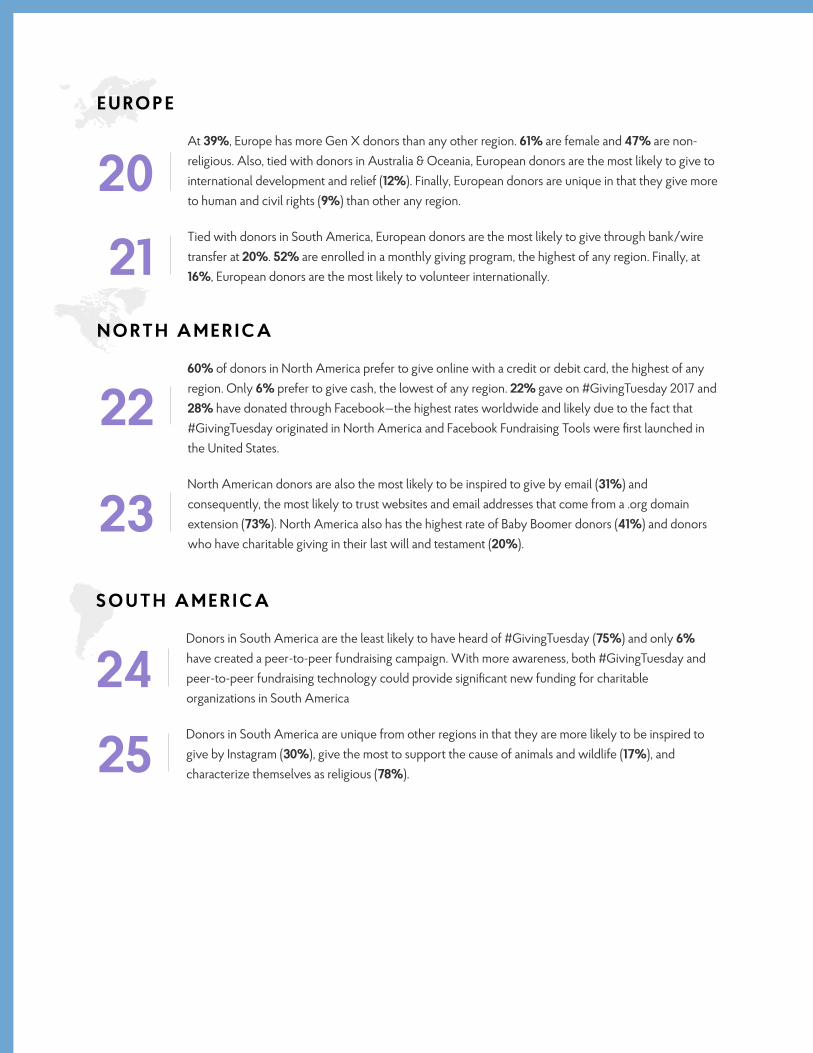
24Donors in South America are the least likely to have heard of #GivingTuesday (75%) and only 6% have created a peer-to-peer fundraising campaign. With more awareness, both #GivingTuesday and peer-to-peer fundraising technology could provide significant new funding for charitable organizations in South America
25Donors in South America are unique from other regions in that they are more likely to be inspired to give by Instagram (30%), give the most to support the cause of animals and wildlife (17%), and characterize themselves as religious (78%).
E U RO P E
20At 39%, Europe has more Gen X donors than any other region. 61% are female and 47% are non-religious. Also, tied with donors in Australia & Oceania, European donors are the most likely to give to international development and relief (12%). Finally, European donors are unique in that they give more to human and civil rights (9%) than other any region.
21Tied with donors in South America, European donors are the most likely to give through bank/wire transfer at 20%. 52% are enrolled in a monthly giving program, the highest of any region. Finally, at 16%, European donors are the most likely to volunteer internationally.
N O RT H A M E R I C A
2260% of donors in North America prefer to give online with a credit or debit card, the highest of any region. Only 6% prefer to give cash, the lowest of any region. 22% gave on #GivingTuesday 2017 and 28% have donated through Facebook—the highest rates worldwide and likely due to the fact that #GivingTuesday originated in North America and Facebook Fundraising Tools were first launched in the United States.
23North American donors are also the most likely to be inspired to give by email (31%) and consequently, the most likely to trust websites and email addresses that come from a .org domain extension (73%). North America also has the highest rate of Baby Boomer donors (41%) and donors who have charitable giving in their last will and testament (20%).

43% OF NON-DONORS SAY THE PRIMARY REASON THEY DO NOT GIVE MONEY TO NGOs, NPOs, AND CHARIT IES IS BECAUSE THEY DO NOT
HAVE THE F INANCIAL RESOURCES
52% OF NON-DONORS SAY IT IS UNLIKELY THEY WILL GIVE MONEY TO AN NPO,
NGO, OR CHARITY WITHIN THE NEXT 12 MONTHS
L IFESTYLE CHOICES OF NON-DONORS WORLDWIDE
About the Survey Respondents1 ,04 9 N O N - D O N O R S • 8 3 CO U N T R I E S
OTHER REASONS FOR NOT GIVING MONEY
20% VOLUNTEER IN LIEU OF MAKING A DONATION
17% DONATE GOODS AND/OR SERVICES IN LIEU OF MAKING A DONATION
12% DON’T TRUST ORGANIZATIONS TO SPEND THEIR MONEY WELL
★ 6% PREFER TO SPEND THEIR MONEY ON THEIR FAMILY AND FRIENDS
2% DON’T BELIEVE THAT ORGANIZATIONS MAKE A POSITIVE DIFFERENCE
52%
7% 15%
69%
38%
24%
60%
24%
46%81%
27%61%
VOLUNTEER LOCALLY
VOLUNTEER INTERNATIONALLY
ATTEND FUNDRAISING EVENTS
ATTEND MARCHES & PROTESTS
VOTE REGULARLY
SIGN ONLINE PETITIONS
RECYCLE
ARE VEGETARIANS
BUY HUMANELY-RAISED MEAT & DAIRY PRODUCTS
DONATE FOOD TO FOOD BANKS
DONATE TOYS TO LOW-INCOME FAMILIES DURING THE HOLIDAYS
HAVE ADOPTED A PET FROM AN ANIMAL SHELTER
RESEARCH BY NPTECHFORGOOD.COMSPONSORED BY P IR .ORG
#GIVINGTRENDS18
GIVINGREPORT.NGO
Thank you to the 6,057 donors and 1,049 non-donors worldwide that
participated in the 2018 Global Trends in Giving Survey.
Your contribution is greatly appreciated.
DESIGN BY BUREAUFORGOOD.COM