2018 full year results - riotinto.com · 2018 full year results . Page 1 of 51 . Rio Tinto...
51
2018 full year results Page 1 of 51 Rio Tinto announces record returns to shareholders of $13.5 billion including final dividend of $3.1 billion and special dividend of $4.0 billion 27 February 2019 Rio Tinto chief executive J-S Jacques said “We have once again announced record cash returns to shareholders of $13.5 billion on the back of $18 billion of underlying EBITDA and a Return on Capital Employed of 19%. These strong results reflect the efforts of the team to implement our value-over-volume strategy as we continued to strengthen the portfolio and invest in future growth. “Our world-class portfolio and strong balance sheet will serve us well in all market conditions, and underpin our ability to continue to invest in our business and deliver superior returns to shareholders in the short, medium and long term.” See footnotes on pages 3-4. • Sadly, we had three fatalities in 2018, two workplace related, one security incident. All Injury Frequency Rate (AIFR) of 0.44 (2017: 0.42). • $6.3 billion of cash returns from operations, comprising the $1.0 billion share buy-back announced in August 2018, and record $5.3 billion full year ordinary dividend (equivalent to 307 US cents per share) – 72% of underlying earnings 3 , including final dividend of $3.1 billion (equivalent to 180 US cents per share), announced today. • $7.2 billion of supplementary cash returns from divestments, comprising a special dividend of $4.0 billion announced today, equivalent to 243 US cents per share, and $3.2 billion of share buy-backs, $1.1 billion of which remains outstanding in Rio Tinto plc shares, to be completed no later than 28 February 2020. • This brings total cash returns declared in respect of 2018 to $13.5 billion. • Robust underlying EBITDA of $18.1 billion was just 2% below 2017, despite divestments and input cost pressures in aluminium and alumina. $0.4 billion exit rate from our mine-to-market productivity programme 6 was impacted by $0.3 billion higher costs from raw materials. At year end 2018 2017 Change Net cash generated from operating activities (US$ millions) 11,821 13,884 -15% Capital expenditure 1 (US$ millions) 5,430 4,482 +21% Free cash flow 2 (US$ millions) 6,977 9,540 -27% Underlying EBITDA 3 (US$ millions) 18,136 18,580 -2% Underlying earnings 3 (US$ millions) 8,808 8,627 +2% Net earnings (US$ millions) 13,638 8,762 +56% Underlying earnings 3 per share (US cents) 512.3 482.8 +6% Basic earnings per share (US cents) 793.2 490.4 +62% Ordinary dividend per share (US cents) 307.0 290.0 +6% Net cash/(debt) 4 (US$ millions) 255 (3,845) Net gearing ratio 5 -1% 7%
Transcript of 2018 full year results - riotinto.com · 2018 full year results . Page 1 of 51 . Rio Tinto...

2018 full year results
Page 1 of 51
Rio Tinto announces record returns to shareholders of $13.5 billion including final dividend of $3.1 billion and special dividend of $4.0 billion 27 February 2019 Rio Tinto chief executive J-S Jacques said “We have once again announced record cash returns to shareholders of $13.5 billion on the back of $18 billion of underlying EBITDA and a Return on Capital Employed of 19%. These strong results reflect the efforts of the team to implement our value-over-volume strategy as we continued to strengthen the portfolio and invest in future growth.
“Our world-class portfolio and strong balance sheet will serve us well in all market conditions, and underpin our ability to continue to invest in our business and deliver superior returns to shareholders in the short, medium and long term.”
See footnotes on pages 3-4.
• Sadly, we had three fatalities in 2018, two workplace related, one security incident. All Injury Frequency Rate (AIFR) of 0.44 (2017: 0.42).
• $6.3 billion of cash returns from operations, comprising the $1.0 billion share buy-back announced in August 2018, and record $5.3 billion full year ordinary dividend (equivalent to 307 US cents per share) – 72% of underlying earnings3, including final dividend of $3.1 billion (equivalent to 180 US cents per share), announced today.
• $7.2 billion of supplementary cash returns from divestments, comprising a special dividend of $4.0 billion announced today, equivalent to 243 US cents per share, and $3.2 billion of share buy-backs, $1.1 billion of which remains outstanding in Rio Tinto plc shares, to be completed no later than 28 February 2020.
• This brings total cash returns declared in respect of 2018 to $13.5 billion. • Robust underlying EBITDA of $18.1 billion was just 2% below 2017, despite divestments and input cost
pressures in aluminium and alumina. $0.4 billion exit rate from our mine-to-market productivity programme6 was impacted by $0.3 billion higher costs from raw materials.
At year end 2018 2017 Change Net cash generated from operating activities (US$ millions) 11,821 13,884 -15% Capital expenditure1 (US$ millions) 5,430 4,482 +21% Free cash flow2 (US$ millions) 6,977 9,540 -27% Underlying EBITDA3 (US$ millions) 18,136 18,580 -2% Underlying earnings3 (US$ millions) 8,808 8,627 +2% Net earnings (US$ millions) 13,638 8,762 +56% Underlying earnings3 per share (US cents) 512.3 482.8 +6% Basic earnings per share (US cents) 793.2 490.4 +62% Ordinary dividend per share (US cents) 307.0 290.0 +6% Net cash/(debt)4 (US$ millions) 255 (3,845) Net gearing ratio5 -1% 7%

Page 2 of 51
• $11.8 billion operating cash flow, 15% below 2017, driven primarily by the timing of tax payments related to 2017 earnings and higher inventory balances as a result of the increased price of raw materials.
• $7.0 billion free cash flow, with lower operating cash flow as described above and increasing investment in capital projects in line with guidance. $5.4 billion of capital expenditure with $2.9 billion invested in high value development projects including AutoHaul™ automated trains, Amrun bauxite and Oyu Tolgoi underground copper/gold mine. Koodaideri and Robe River replacement iron ore mines approved.
• $8.8 billion underlying earnings, 2% higher due to a strong contribution from Copper & Diamonds, offsetting lower underlying earnings in other product groups.
• $13.6 billion net earnings driven primarily by gains on disposals and foreign exchange movements. • 19% Return on Capital Employed (ROCE)7, a rise of one percentage point, as we continue our strategic
reshaping of the portfolio. • Strong balance sheet as net debt5 fell by $4.1 billion to a net cash5 position of $0.3 billion, including cash and
highly liquid investments of $13.3 billion. Cash flows were bolstered by $8.6 billion of pre-tax divestment proceeds, including our remaining Australian coal assets and Grasberg.
The financial results are prepared in accordance with IFRS and are audited. Footnotes are set out on pages 3-4.
Stability in revenues and EBITDA • $40.5 billion of consolidated sales revenue, $0.5 billion higher than 2017. Increased volumes of iron ore and
copper, and higher prices for aluminium and copper, offset the impact of lower iron ore prices and our coal divestments.
• Underlying EBITDA3 of $18.1 billion was 2% lower than 2017, with higher revenues outweighed by a rise in energy and raw material costs.
• Effective tax rate on underlying earnings3 was 29%, one percentage point higher than in 2017. • Net earnings of $13.6 billion, 56% higher than 2017, reflected $4.6 billion of gains on disposals of businesses and
land. See table on page 8.
Strong cash flow from operations and asset sales
See footnotes on pages 3-4.
• Cash generated from operating activities was down 15%, driven primarily by the timing of tax payments related to 2017 profits and by higher inventory balances as a result of the increased price of raw materials.
• Capital expenditure1 was $5.4 billion, of which $2.9 billion was on development projects and $2.5 billion to sustain capacity at our operations. Sales of property, plant and equipment primarily related to the wharf and land in Kitimat – see table below.
• Free cash flow2 of $7.0 billion, down 27%, due to the lower operating cash flow and higher capex. • $8.6 billion of proceeds from divestments – see table below. • Paid the 2017 final dividend of $3.2 billion and the 2018 interim dividend of $2.2 billion. • $5.4 billion of share buy-backs: $2.1 billion of Rio Tinto Limited shares bought off market and $3.3 billion of Rio
Tinto plc shares repurchased on market and cancelled. • Strengthened our balance sheet with a $4.1 billion decrease in net debt4 to end the year with $0.3 billion net
cash.
2018
US$m 2017
US$m7
Net cash generated from operating activities 11,821 13,884 Capital expenditure1 (5,430) (4,482) Sales of property, plant and equipment 586 138 Free cash flow2 6,977 9,540 Disposals 7,733 2,675 Dividends paid to equity shareholders (5,356) (4,250) Share buy back (5,386) (2,083) Other 132 (140) Reduction in net debt 4,100 5,742

Page 3 of 51
Cash inflows of $8.6 billion, pre-tax, from divestments in 2018
1 Net of completion adjustments. 2 Before a $0.1 billion attributable share of copper and gold revenues, net of Rio Tinto’s capital contribution for the year.
We expect to pay around $0.9 billion in tax on the above transactions in the first half of 2019.
Increased investment in growth projects and development • The world-class Oyu Tolgoi underground copper mine development in Mongolia has progressed in 2018,
including the signing of the Power Source Framework Agreement. There are challenges which further impact the forecasted ramp-up to sustainable production at this complex project. See pages 22-23.
• $1.9 billion Amrun bauxite project in Queensland shipped first tonnes six weeks ahead of schedule in December 2018. Amrun will increase our export capacity by around 10 Mt/a.
• $940 million AutoHaul™ project: by the end of 2018 we had fully deployed our Pilbara autonomous trains, the world’s first autonomous heavy haul rail system. This is expected to improve productivity and overall system throughput, by providing more flexibility and reducing bottlenecks.
• $2.6 billion Koodaideri replacement iron ore mine approved, including processing plant and 166-kilometre rail line. Koodaideri will have a 43 Mt annual capacity, underpinning production of our Pilbara Blend™, with first tonnes in late 2021 and significant potential for future expansion with a study underway.
• $488 million spend on exploration and evaluation, a 10% rise, mostly driven by increased activity at the Resolution copper project in Arizona and higher greenfield expenditure to underpin future growth projects.
• Encouraging copper mineralisation discovered in the Pilbara, Western Australia: 26 diamond holes drilled for 10 kilometres and we have commenced phase 2 drilling to ascertain scale.8
Guidance • Mine-to-market productivity programme6 to deliver an additional free cash flow run-rate of $1.5 billion from 2021,
as originally anticipated. In 2019 we expect the run-rate to be around $1.0 billion. • Capital expenditure1 to stay at around $6.0 billion in 2019 and around $6.5 billion in 2020. In 2021, we expect to
invest $6.5 billion in our business. Each year includes approximately $2-2.5 billion of sustaining capex. • Effective tax rate on underlying earnings of approximately 30% in 2019. • Pilbara unit cash costs of $13-14 per wet metric tonne (excluding freight) in 2019. • C1 unit costs at Rio Tinto Kennecott, Oyu Tolgoi and Escondida to average 110-120 US cents per pound in 2019. • Our 2019 production guidance is unchanged from our Fourth Quarter Operations Review.
1 Capital expenditure is presented gross, before taking into account any cash received from disposals of property, plant and equipment (PP&E).
The following financial performance indicators – which are non-GAAP measures - are those management uses internally to assess performance. They are therefore considered relevant to readers of this document. They are presented here to give more clarity around the underlying business performance of the Group’s operations. 2 Free cash flow is defined as net cash generated from operating activities less purchases of PP&E plus sales of PP&E. 3 Net and underlying earnings relate to profit attributable to the owners of Rio Tinto. Underlying EBITDA and earnings are defined on
page 14. Underlying earnings is reconciled to net earnings on page 49. 4 Net cash / debt is defined and reconciled to the balance sheet on page 44. 5 Net gearing ratio is defined as net debt divided by the sum of net debt and total equity at the end of each period. 6 Mine-to-market productivity improvements refer to the additional free cash flow generated from post-tax operating cash cost improvements
and post-tax volume gains from productivity programmes. 7 Return on Capital Employed (ROCE) is defined as underlying earnings excluding net interest divided by average capital employed (operating
assets before net debt).
Pre-tax proceeds received in 2018
US$bn Completion date Hail Creek coal mine and Valeria coal development project, both in Queensland, Australia, sold to Glencore 1.7 1 August Kestrel underground coal mine, Queensland, Australia, sold to EMR Capital and PT Adaro Energy Tbk 2.3 1 August Wharf and land in Kitimat, British Columbia, sold to LNG Canada 0.6 12 November Aluminium Dunkerque, France sold to Liberty House1 0.4 14 December Interest in Grasberg mine sold to Inalum (PT Indonesia Asahan Aluminium (Persero))2 3.4 21 December Other 0.2 Total (pre-tax) 8.6
Page 4 of 51
8 For full details, see the Notice to the ASX dated 27 February 2019 (“Rio Tinto Exploration Update – copper-gold mineralisation discovered in the Paterson Province in the far east Pilbara region of Western Australia”) and accompanying information provided in accordance with the Table 1 checklist in The Australasian Code for the Reporting of Exploration Results, Mineral Resources and Ore Reserves (The JORC Code, 2012 Edition). These materials are also available on riotinto.com.
Page 5 of 51
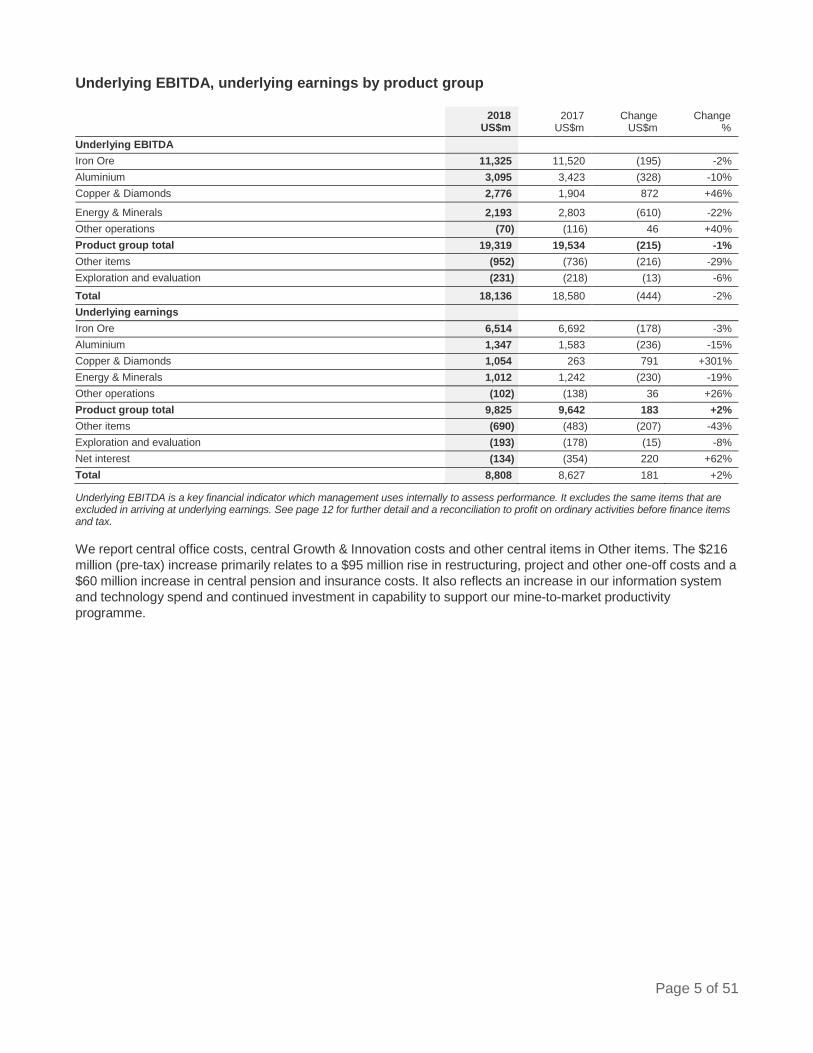
Underlying EBITDA, underlying earnings by product group
Underlying EBITDA is a key financial indicator which management uses internally to assess performance. It excludes the same items that are excluded in arriving at underlying earnings. See page 12 for further detail and a reconciliation to profit on ordinary activities before finance items and tax.
We report central office costs, central Growth & Innovation costs and other central items in Other items. The $216 million (pre-tax) increase primarily relates to a $95 million rise in restructuring, project and other one-off costs and a $60 million increase in central pension and insurance costs. It also reflects an increase in our information system and technology spend and continued investment in capability to support our mine-to-market productivity programme.
2018
US$m 2017
US$m Change
US$m Change
% Underlying EBITDA Iron Ore 11,325 11,520 (195) -2% Aluminium 3,095 3,423 (328) -10% Copper & Diamonds 2,776 1,904 872 +46%
Energy & Minerals 2,193 2,803 (610) -22% Other operations (70) (116) 46 +40% Product group total 19,319 19,534 (215) -1% Other items (952) (736) (216) -29% Exploration and evaluation (231) (218) (13) -6% Total 18,136 18,580 (444) -2% Underlying earnings Iron Ore 6,514 6,692 (178) -3% Aluminium 1,347 1,583 (236) -15% Copper & Diamonds 1,054 263 791 +301% Energy & Minerals 1,012 1,242 (230) -19% Other operations (102) (138) 36 +26% Product group total 9,825 9,642 183 +2% Other items (690) (483) (207) -43% Exploration and evaluation (193) (178) (15) -8% Net interest (134) (354) 220 +62% Total 8,808 8,627 181 +2%

Page 6 of 51
Commentary on financial results To provide additional insight into the performance of our business, we report underlying EBITDA and underlying earnings. The principal factors explaining the movements in underlying EBITDA are set out in this table.
Prices generally stable Commodity price movements in 2018 increased underlying EBITDA by $277 million compared with 2017. We have included a table of prices and exchange rates on page 48.
The FOB (free on board) Platts index for 62% iron Pilbara fines was 4% lower on average compared with 2017.
Average prices for copper and aluminium were up 6% and 7% respectively, compared with 2017. We also benefited from higher market premiums for aluminium, in particular the mid-west premium in the US which averaged $419 per tonne in 2018 – a 111% rise on 2017’s $199 per tonne.
On 1 March, the US government announced a 10% tariff on US imports of aluminium from Canada, which it implemented on 1 June. We do not expect this to have a significant financial impact on our business in the near term.
Weaker Australian dollar Compared with 2017, on average the US dollar strengthened by 3% against the Australian dollar, stayed flat against the Canadian dollar and weakened by 1% against the South African rand. Currency movements increased underlying EBITDA by $286 million relative to 2017.
Rise in our iron ore, copper and gold volumes Higher sales volumes increased underlying EBITDA by $863 million compared with 2017, mainly in iron ore and copper/gold. Our Pilbara iron ore shipments rose as we debottlenecked our rail network following full implementation of AutoHaul™ autonomous trains and ramped up production from our new Silvergrass mine. In copper, we benefited from better operating performance at Escondida including the absence of the labour disruption in 2017, as well as higher copper grades at Rio Tinto Kennecott and higher gold grades at Oyu Tolgoi.
Increase in energy prices Higher energy prices compared to 2017 reduced our underlying EBITDA by $436 million. This was mainly due to the average price of oil rising by roughly 31% in 2018 to $71 per barrel. Our Pacific Aluminium smelters were also affected by higher coal prices and a new power contract.
Continued cost pressures Our cash operating costs rose by $750 million compared with 2017. The considerable efficiencies we continue to see from our mine-to-market productivity programme were offset by the increasing costs of raw materials – in particular caustic soda, petroleum coke and tar pitch for Aluminium.
Higher expenditure on exploration and evaluation We spent $43 million more on exploration and evaluation compared with last year. This went to our highest value projects, particularly the Resolution copper project in Arizona.
US$m 2017 underlying EBITDA 18,580 Prices 277 Exchange rates 286 Volumes and mix 863 General inflation (301) Energy (436) Operating cash cost movements (750) Higher exploration and evaluation spend (43) One-off items (23) Non-cash costs/other (317) 2018 underlying EBITDA 18,136

Page 7 of 51
One-off items One-off items were $23 million more than in 2017. At Iron Ore Company of Canada, we suspended operations for two months in 2018 ($236 million impact) before reaching a new labour agreement. At Iron & Titanium, production was suspended after a fatality at our Sorel-Tracy plant and labour disruptions at Richards Bay Minerals ($132 million impact). In 2017, our most significant one-off item was the strike action at Escondida, which led to lower volumes and higher unit costs with a $316 million impact.
Non-cash costs/other The movements in our non-cash costs and other items lowered EBITDA by $317 million compared to 2017. We had $717 million less in underlying EBITDA following the sale of our coal businesses in 2017 and 2018. This was partly offset by the $278 million gain on sale of the Winchester South and Valeria coal development projects and a $167 million revaluation of a royalty receivable arising from the disposal of the Mount Pleasant coal project in 2016. Our restructuring costs were $95 million higher as we continued our reorganisation around four operating and commercial hubs.
Net earnings The principal factors explaining the movements in underlying earnings and net earnings are set out here.
Depreciation and amortisation, net interest and tax Our depreciation and amortisation charge was $391 million lower than in 2017, driven by the sale of the thermal coal assets in 2017 and a lower charge at Oyu Tolgoi due to some assets being fully depreciated.
Interest and finance items (pre-tax) were $385 million lower than 2017. This was due to a lower level of net debt, lower early redemption costs from bond purchases and an increase in capitalised interest. In 2018, we completed a bond tender, reducing our gross debt by a further $1.94 billion equivalent. We also incurred $94 million in early redemption costs from the bond tender, compared with $256 million in 2017. Since the start of 2016, we have reduced the nominal value of outstanding bonds from approximately $21 billion to around $7.8 billion equivalent, with an average weighted interest rate on the outstanding bonds of around 5%.
The 2018 effective corporate income tax rate on underlying earnings, excluding equity accounted units, was 29%, compared with 28% in 2017. The effective tax rate on underlying earnings in Australia in both years was just over 30%. We anticipate an effective tax rate on underlying earnings of approximately 30% in 2019. We expect to make a tax payment of A$1.8 billion (equivalent to $1.3 billion) in the first half of 2019, relating to our 2018 profits and profit from the sale of our Queensland coking coal assets.
US$m 2017 net earnings 8,762 Total changes in underlying EBITDA (444) Decrease in depreciation and amortisation (pre-tax) in underlying earnings 391 Decrease in interest and finance items (pre-tax) in underlying earnings 385 Increase in tax on underlying earnings (149) Increase in underlying earnings attributable to outside interests (2) Total changes in underlying earnings 181 Changes in exclusions from underlying earnings: Decrease in net impairment charges 377 Increase in gains on consolidation and gains on disposals 1,974 Movement in exchange differences and gains/losses on debt 1,514 Other 830 2018 net earnings 13,638

Page 8 of 51
Items excluded from underlying earnings Net impairment charges decreased by $377 million compared with 2017. In 2018, we recognised $104 million of post-tax charges, mainly relating to the carrying value of the ISAL aluminium smelter in Iceland following its reclassification to assets held for sale. In 2017, we recognised $481 million (post-tax) of impairment charges, relating primarily to the carrying values of the Roughrider uranium deposit in Canada, the Rössing Uranium mine in Namibia and the Argyle diamond mine in Australia.
2018 net gains on consolidation and disposal of interests in businesses were $2.0 billion higher than last year. In 2018, we realised net gains of $4.0 billion (post-tax) primarily from the sale of our Hail Creek and Kestrel coking coal businesses in Australia, the sale of our interest in Grasberg in Indonesia and the formation of the Elysis joint venture (JV) in Canada. We created this JV in May with Alcoa to develop and commercialise a carbon-free aluminium smelting process and recognised a gain of $141 million (post-tax) for the fair value uplift on forming the JV. In 2017, we realised net gains on disposal of interests in businesses of $2.0 billion from the sale of the Coal & Allied thermal coal business in Australia.
Amounts relating to the undeveloped coal properties, Winchester South and Valeria, are included within underlying earnings.
In 2018, we recognised non-cash exchange and derivative gains of $0.7 billion. This was mainly on US dollar debt in non-US dollar functional currency Group companies, intragroup balances, and on the revaluation of certain derivatives which do not qualify for hedge accounting. These exchange gains were in contrast to our 2017 net exchange and derivative losses of $0.8 billion, giving rise to a positive year-on-year movement of $1.5 billion. The exchange gains are largely offset by currency translation losses recognised in equity. The quantum of US dollar debt is largely unaffected. We will repay it from US dollar sales receipts and US dollar divestment proceeds.
Changes in other exclusions of $0.8 billion include gains on the sale of surplus land at Kitimat in Canada ($0.6 billion) and the absence of non-cash tax charges recognised in 2017 ($0.6 billion). This is partially offset by charges recognised to increase closure provisions at ERA and Argyle in Australia ($0.3 billion).
Profit Net earnings and underlying earnings refer to amounts attributable to the owners of Rio Tinto. The net profit attributable to the owners of Rio Tinto in 2018 totalled $13.6 billion (2017: $8.8 billion). We recorded a profit in 2018 of $13.9 billion (2017: $8.9 billion) of which a profit of $287 million (2017: $89 million) was attributable to non-controlling interests.
Net earnings, underlying earnings and underlying EBITDA The differences between underlying earnings and net earnings are set out in this table (all numbers are after tax and exclude non-controlling interests).
2018
US$m 2017
US$m
Underlying earnings 8,808 8,627 Items excluded from underlying earnings Impairment charges (104) (481) Net gains on consolidation and disposal of interests in businesses 3,996 2,022 Foreign exchange and derivative gains/(losses) on US dollar net debt and intragroup balances and derivatives not qualifying for hedge accounting 704 (810) Gain on sale of wharf and land in Kitimat, Canada 569 – Changes in closure estimates (non-operating and fully impaired sites) (335) Changes in corporate tax rates – (439) Tax charge relating to expected divestments – (202) Other excluded items – 45 Net earnings 13,638 8,762

Page 9 of 51
The explanation of excluded items is on page 8. On pages 49 to 50 there is a detailed reconciliation from underlying earnings to net earnings, including pre-tax amounts and additional explanatory notes. The differences between underlying EBITDA, EBITDA and net earnings are set out in this table.
Cash flow We generated $11.8 billion in net cash from our operating activities, 15% lower than in 2017. This reduction was primarily driven by higher tax payments related to our 2017 profits and adverse working capital movements.
We invested $5.4 billion in capital expenditure, 21% more than in 2017 as our major projects ramped up. These included our Oyu Tolgoi underground copper mine in Mongolia, the completion of our Amrun bauxite project in Queensland and the full implementation of AutoHaul™, the automation of our Pilbara train system.
We generated $7.0 billion of free cash flow, 27% lower than 2017, in line with our lower operating cash flow and higher capital expenditure. This was partly offset by proceeds from the sale of property, plant and equipment including $0.5 billion received from the sale of surplus land at Kitimat. In 2018, our mine-to-market productivity programme exit rate was $0.4 billion, which was impacted by $0.3 billion of raw material cost headwinds. We are on track to be generating $1.5 billion per year in free cash flow from this programme from 2021.
We paid $5.4 billion in dividends to our shareholders. We also repurchased $5.4 billion of our shares: $2.1 billion of these were bought off-market in Australia and $3.3 billion on-market in the UK in 2018 as part of our ongoing programme.
Balance sheet Our net debt declined by $4.1 billion, giving rise to net cash of $0.3 billion (see page 44). This reflects our 2018 operating cash flows and divestment proceeds, offset by the increase in capital expenditure, payment of the final dividend and the ongoing share buy back.
Our net gearing ratio (net debt to total capital) decreased to -1% at 31 December 2018 (31 December 2017: 7%).
Total financing liabilities at 31 December 2018 were $13.0 billion (see page 44) and the weighted average maturity was around 11 years. At 31 December 2018, approximately 79% of Rio Tinto’s total borrowings were at floating interest rates. The maximum amount, within non-current borrowings, maturing in any one calendar year was $1.7 billion, which matures in 2025. These amounts are subject to revision following the implementation of IFRS 16 on 1 January 2019.
In 2018, we repaid $2.3 billion of borrowings, mainly through the early redemption of bonds. Cash and cash equivalents plus other short-term cash investments at 31 December 2018 were $13.3 billion (31 December 2017: $11.5 billion).
2018
US$m 2017
US$m Underlying EBITDA 18,136 18,580 Net gains on consolidation and disposal of interests in businesses 4,622 2,344 Gains/(losses) on embedded commodity derivatives not qualifying for hedge accounting (including exchange) 279 (505) Gain on sale of wharf and land in Kitimat, Canada 602 – Changes in closure estimates (376) – Other excluded items – 73 EBITDA 23,263 20,492 Depreciation and amortisation in subsidiaries excluding capitalised depreciation (3,909) (4,302) Impairment charges, net of reversals (132) (796) Depreciation and amortisation in equity accounted units (650) (648) Finance items in subsidiaries (33) (1,658) Taxation in subsidiaries (4,242) (3,965) Taxation and finance items in equity accounted units (372) (272) Less profit attributable to non-controlling interests (287) (89) Net earnings 13,638 8,762
Page 10 of 51
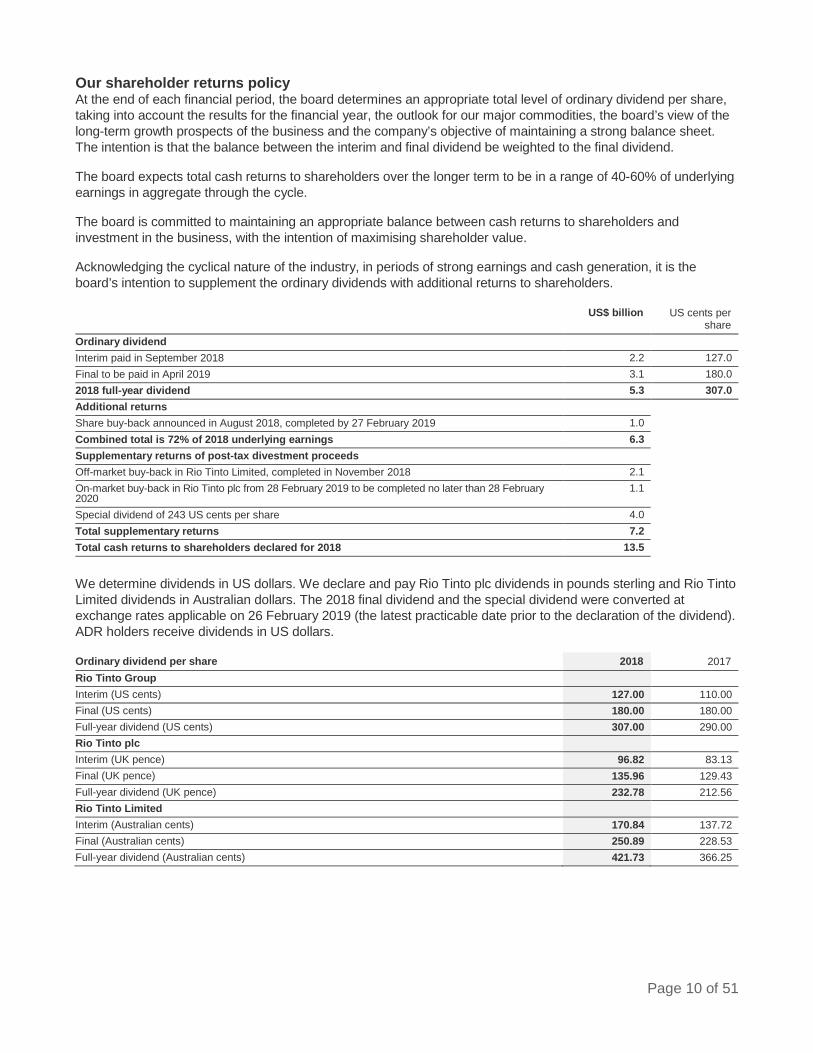
Our shareholder returns policy At the end of each financial period, the board determines an appropriate total level of ordinary dividend per share, taking into account the results for the financial year, the outlook for our major commodities, the board’s view of the long-term growth prospects of the business and the company’s objective of maintaining a strong balance sheet. The intention is that the balance between the interim and final dividend be weighted to the final dividend.
The board expects total cash returns to shareholders over the longer term to be in a range of 40-60% of underlying earnings in aggregate through the cycle.
The board is committed to maintaining an appropriate balance between cash returns to shareholders and investment in the business, with the intention of maximising shareholder value.
Acknowledging the cyclical nature of the industry, in periods of strong earnings and cash generation, it is the board’s intention to supplement the ordinary dividends with additional returns to shareholders.
We determine dividends in US dollars. We declare and pay Rio Tinto plc dividends in pounds sterling and Rio Tinto Limited dividends in Australian dollars. The 2018 final dividend and the special dividend were converted at exchange rates applicable on 26 February 2019 (the latest practicable date prior to the declaration of the dividend). ADR holders receive dividends in US dollars.
US$ billion US cents per share
Ordinary dividend Interim paid in September 2018 2.2 127.0 Final to be paid in April 2019 3.1 180.0 2018 full-year dividend 5.3 307.0 Additional returns Share buy-back announced in August 2018, completed by 27 February 2019 1.0 Combined total is 72% of 2018 underlying earnings 6.3 Supplementary returns of post-tax divestment proceeds Off-market buy-back in Rio Tinto Limited, completed in November 2018 2.1 On-market buy-back in Rio Tinto plc from 28 February 2019 to be completed no later than 28 February 2020
1.1
Special dividend of 243 US cents per share 4.0 Total supplementary returns 7.2 Total cash returns to shareholders declared for 2018 13.5
Ordinary dividend per share 2018 2017 Rio Tinto Group Interim (US cents) 127.00 110.00 Final (US cents) 180.00 180.00 Full-year dividend (US cents) 307.00 290.00 Rio Tinto plc Interim (UK pence) 96.82 83.13 Final (UK pence) 135.96 129.43 Full-year dividend (UK pence) 232.78 212.56 Rio Tinto Limited Interim (Australian cents) 170.84 137.72 Final (Australian cents) 250.89 228.53 Full-year dividend (Australian cents) 421.73 366.25

Page 11 of 51
Both the 2018 final dividend and the special dividend to be paid to our Rio Tinto Limited shareholders will be fully franked. The board expects Rio Tinto Limited to be in a position to pay fully franked dividends for the foreseeable future.
We will pay the 2018 final dividend and the special dividend on 18 April 2019 to holders of ordinary shares and ADRs on the register at the close of business on 8 March 2019. The ex-dividend date for both the 2018 final dividend and the special dividend for Rio Tinto Limited, Rio Tinto plc and Rio Tinto plc ADR shareholders is 7 March 2019.
Rio Tinto plc shareholders may choose to receive their dividend in Australian dollars, and Rio Tinto Limited shareholders may choose to receive theirs in pounds sterling. Currency conversions will be based on the pound sterling and Australian dollar exchange rates five business days before the dividend payment date. Rio Tinto plc and Rio Tinto Limited shareholders must register their currency elections by 28 March 2019.
We will operate our Dividend Reinvestment Plans for both the 2018 final dividend and the special dividend – see our website (riotinto.com) for details. Rio Tinto plc and Rio Tinto Limited shareholders’ election notice for the Dividend Reinvestment Plans must be received by 28 March 2019. Purchases under the Dividend Reinvestment Plan are made on or as soon as practicable after the dividend payment date and at prevailing market prices. There is no discount available.
Special dividend per share 2018
Rio Tinto Group US cents per share 243.00 Rio Tinto plc UK pence per share 183.55 Rio Tinto Limited Australian cents per share 338.70

Page 12 of 51
Rio Tinto financial information by business unit
Gross revenue(a) for the year ended
31 December
EBITDA(b) for the year ended
31 December
Net earnings(c) for the year
ended 31 December
Rio Tinto interest
% 2018
US$m 2017 US$m
2018 US$m
2017 US$m
2018 US$m
2017 US$m
Iron Ore Pilbara (d) 18,359 18,143 11,267 11,383 6,460 6,576 Evaluation projects/other 126 108 58 137 54 116 Total Iron Ore 18,485 18,251 11,325 11,520 6,514 6,692 Aluminium (e) Bauxite 2,324 2,019 790 804 412 463 Alumina 3,340 2,661 1,137 454 634 180 Intrasegment (861) (790) (7) (25) (5) (17) Bauxite & Alumina 4,803 3,890 1,920 1,233 1,041 626 Primary Metal 6,468 5,808 1,418 1,762 595 778 Pacific Aluminium 2,541 2,305 148 453 – 176 Inter-segment and other (3,226) (2,321) (88) (19) (67) (12) Integrated operations 10,586 9,682 3,398 3,429 1,569 1,568 Other product group items 1,479 1,214 (440) (132) (344) (100) Product group operations 12,065 10,896 2,958 3,297 1,225 1,468 Evaluation projects/other 126 109 137 126 122 115 Total Aluminium 12,191 11,005 3,095 3,423 1,347 1,583 Copper & Diamonds Rio Tinto Kennecott 100.0 1,862 1,352 785 539 293 78 Escondida 30.0 2,274 1,811 1,301 1,030 506 325 Grasberg joint venture (g) 457 33 281 (3) 217 (169) Oyu Tolgoi and Turquoise Hill (h) 1,180 940 375 256 69 36 Diamonds (i) 695 706 301 287 118 92 Product group operations 6,468 4,842 3,043 2,109 1,203 362 Evaluation projects/other – – (267) (205) (149) (99) Total Copper & Diamonds 6,468 4,842 2,776 1,904 1,054 263 Energy & Minerals Rio Tinto Coal Australia (j) 989 2,829 893 1,223 591 716 Iron Ore Company of Canada 58.7 1,583 1,867 586 770 166 235 Rio Tinto Iron & Titanium (k) 1,782 1,763 510 546 174 201 Rio Tinto Borates 100.0 622 630 197 244 111 126 Dampier Salt 68.4 246 215 56 27 18 3 Uranium (l) 415 417 18 15 (4) (26) Product group operations 5,637 7,721 2,260 2,825 1,056 1,255 Simandou iron ore project (m) – – (15) (13) (7) (6) Evaluation projects/other 60 43 (52) (9) (37) (7) Total Energy & Minerals 5,697 7,764 2,193 2,803 1,012 1,242 Other operations (n) 9 10 (70) (116) (102) (138) Inter-segment transactions (15) (15) – – – – Product group total 42,835 41,857 19,319 19,534 9,825 9,642 Central pension costs, share-based payments and insurance (128) (68) (90) (48) Restructuring, project and one-off costs (272) (177) (190) (124) Central costs (552) (491) (410) (311) Exploration and evaluation (231) (218) (193) (178) Net interest (134) (354) Underlying EBITDA/earnings 18,136 18,580 8,808 8,627 Items excluded from underlying EBITDA/earnings – 10 5,127 1,912 4,830 135 EBITDA/net earnings 23,263 20,492 13,638 8,762 Reconciliation to Group income statement Share of equity accounted unit sales and intra-subsidiary/equity accounted unit sales (2,313) (1,837) Depreciation & amortisation in subsidiaries excluding capitalised depreciation (3,909) (4,302) Impairment charges (132) (796) Depreciation & amortisation in equity accounted units (650) (648) Taxation and finance items in equity accounted units (372) (272) Consolidated sales revenue/profit on ordinary activities before finance items and taxation 40,522 40,030 18,200 14,474

Page 13 of 51
Rio Tinto financial information by business unit continued
Capital expenditure(o) for the year
ended 31 December
Depreciation & amortisation for the year
ended 31 December
Operating assets(p) as at
31 December
Rio Tinto interest
% 2018
US$m 2017 US$m
2018 US$m
2017 US$m
2018 US$m
2017 US$m
Iron Ore Pilbara (d) 1,288 1,201 1,682 1,645 14,486 16,535 Evaluation projects/other – – – – 2 2 Total Iron Ore 1,288 1,201 1,682 1,645 14,488 16,537 Aluminium (e) Bauxite 953 825 165 123 2,494 1,897 Alumina 218 108 194 209 2,721 2,733 Intrasegment – – – – (20) (18) Bauxite & Alumina 1,171 933 359 332 5,195 4,612 Primary Metal 595 389 615 665 9,306 9,946 Pacific Aluminium 115 109 149 196 1,156 1,016 Inter-segment and other – 5 (1) 6 789 772 Integrated Operations 1,881 1,436 1,122 1,199 16,446 16,346 Other product group items (f) (508) – – – – – Total Aluminium 1,373 1,436 1,122 1,199 16,446 16,346 Copper & Diamonds Rio Tinto Kennecott 100.0 318 249 427 422 1,864 1,936 Escondida 30.0 302 248 518 507 3,057 3,369 Grasberg joint venture (g) 171 138 30 42 – 1,137 Oyu Tolgoi and Turquoise Hill (h) 1,284 901 219 344 6,072 4,725 Diamonds (i) 64 85 118 132 267 441 Product group operations 2,139 1,621 1,312 1,447 11,260 11,608 Evaluation projects/other 11 1 5 5 129 135 Total Copper & Diamonds 2,150 1,622 1,317 1,452 11,389 11,743 Energy & Minerals Rio Tinto Coal Australia (j) 32 84 34 152 (837) 1,040 Iron Ore Company of Canada 58.7 189 202 154 157 975 988 Rio Tinto Iron & Titanium (k) 169 119 201 219 3,390 3,881 Rio Tinto Borates 100.0 44 28 62 65 518 523 Dampier Salt 68.4 14 13 20 22 165 150 Uranium (l) 8 21 4 37 (406) (327) Product group operations 456 467 475 652 3,805 6,255 Simandou iron ore project (m) – – – – 15 17 Evaluation projects/other – – – – 41 41 Total Energy & Minerals 456 467 475 652 3,861 6,313 Other operations (n) 12 (35) 26 32 (442) (328) Product group total 5,279 4,691 4,622 4,980 45,742 50,611 Inter-segment transactions 129 206 Net assets of disposal groups held for sale (q) 440 370 Other items 65 70 43 42 (2,880) (2,631) Less: equity accounted units (500) (417) (650) (647) – – Total 4,844 4,344 4,015 4,375 43,431 48,556 Add back: Proceeds from disposal of property, plant and equipment 586 138 Total capital expenditure per cash flow statement 5,430 4,482 Less: Net cash/(debt) 255 (3,845) Less: EAU funded balances excluded from net debt – – Equity attributable to owners of Rio Tinto 43,686 44,711

Page 14 of 51
Notes to financial information by business unit Business units are classified according to the Group’s management structure.
a) Gross sales revenue includes the sales revenue of equity accounted units on a proportionately consolidated basis (after adjusting for sales to subsidiaries) in addition to consolidated sales. Consolidated sales revenue includes subsidiary sales to equity accounted units which are not included in gross sales revenue.
b) EBITDA of subsidiaries and the Group’s share of EBITDA relating to equity accounted units represents profit before: tax, net finance items, depreciation and amortisation charged to the income statement in the period. Underlying EBITDA excludes the EBITDA impact of the same items that are excluded from underlying earnings.
c) Represents profit after tax for the period attributable to the owners of the Rio Tinto Group. Business unit earnings are stated before finance items but after the amortisation of discount related to provisions. Earnings attributed to business units do not include amounts that are excluded in arriving at underlying earnings.
d) Pilbara represents the Group’s 100% holding in Hamersley, 50% holding of Hope Downs Joint Venture and 65% holding of Robe River Iron Associates. The Group’s net beneficial interest in Robe River Iron Associates is 53%, as 30% is held through a 60% owned subsidiary and 35% is held through a 100% owned subsidiary.
e) Presented on an integrated operations basis, splitting activities between Bauxite & Alumina, Primary Metal, Pacific Aluminium and Other integrated operations (which reflect the results of the integrated production of aluminium) and other product group items which relate to other commercial activities.
f) Aluminium capital expenditure is reported net of US$508 million proceeds received on the sale of surplus land at Kitimat. These proceeds are not included in Aluminium’s free cash flow and the associated gain is excluded from business unit earnings and EBITDA.
g) Through a joint venture agreement with Freeport-McMoRan Inc. (Freeport), we were entitled to 40% of material mined above an agreed threshold as a consequence of expansions and developments of the Grasberg facilities since 1998 (until 21 December 2018). On 28 September 2018, we entered into a binding agreement to sell our entire interest in the Grasberg mine to PT Indonesia Asahan Aluminium (Persero) (Inalum). The sale completed on 21 December 2018.
h) Our interest in Oyu Tolgoi is held indirectly through our 50.8% investment in Turquoise Hill Resources Ltd (TRQ), where TRQ’s principal asset is its 66% investment in Oyu Tolgoi LLC, which owns the Oyu Tolgoi copper-gold mine.
i) Includes our interests in Argyle (100%) and Diavik (60%).
j) Includes our 82% interest in the Hail Creek coal mine (until 1 August 2018), our 80% interest in the Kestrel underground coal mine (until 1 August 2018) and interests in the Winchester South (until 1 June 2018) and Valeria development projects (until 1 August 2018).
On 1 June 2018, we sold our entire 75% interest in the Winchester South coal development project in Queensland, Australia, to Whitehaven Coal Limited for US$200 million.
On 1 August 2018, we sold our entire 82% interest in the Hail Creek coal mine and 71.2% interest in the Valeria coal development project in Queensland, Australia, to Glencore for US$1.7 billion.
On 1 August 2018, we sold our entire 80% interest in the Kestrel underground coal mine in Queensland, Australia, to a consortium comprising private equity manager EMR Capital (EMR) and PT Adaro Energy Tbk (Adaro), an Indonesian listed coal company, for US$2.25 billion.
On 1 September 2017, we sold our 100% shareholding in Coal & Allied Industries Limited to Yancoal Australia Limited for US$2.69 billion (before working capital adjustments).

Page 15 of 51
Rio Tinto Coal Australia’s operating assets of US$(837) million at 31 December 2018 include provisions for onerous contracts in relation to rail infrastructure capacity and capital gains tax payable on the divestments announced in the year, partly offset by financial assets and receivables relating to contingent royalties and disposal proceeds.
k) Includes our interests in Rio Tinto Fer et Titane (100%), QIT Madagascar Minerals (QMM, 80%) and Richards Bay Minerals (attributable interest of 74%).
l) Includes our interests in Energy Resources of Australia (68.4%) and Rössing Uranium Limited (Rössing) (68.6%). On 26 November 2018, we entered into a binding agreement with China National Uranium Corporation Limited (CNUC) to sell our entire 68.6% interest in the Rössing mine in Namibia, subject to certain conditions.
m) Simfer Jersey Limited, a company incorporated in Jersey in which the Group has a 53% interest, has an 85% interest in Simfer S.A., the company that manages the Simandou project in Guinea. The Group therefore has a 45.05% indirect interest in Simfer S.A. These entities are consolidated as subsidiaries and together referred to as the Simandou iron ore project.
n) Other operations include our 100% interest in the curtailed Gove alumina refinery and Rio Tinto Marine.
o) Capital expenditure is the net cash outflow on purchases less sales of property, plant and equipment, capitalised evaluation costs and purchases less sales of other intangible assets. The details provided include 100% of subsidiaries’ capital expenditure and Rio Tinto’s share of the capital expenditure of joint operations and equity accounted units.
p) Operating assets of subsidiaries is comprised of net assets excluding post-retirement assets and liabilities, net of tax, and before deducting net debt. Operating assets are stated after the deduction of non-controlling interests – these are calculated by reference to the net assets of the relevant companies (ie inclusive of such companies’ debt and amounts due to or from Rio Tinto Group companies).
q) Assets and liabilities held for sale at 31 December 2018 include our interest in Rössing Uranium Limited, the ISAL smelter, the Aluchemie anode plant, and the Alufluor aluminium fluoride plant.
Assets and liabilities held for sale at 31 December 2017 included our interest in the Dunkerque aluminium smelter and certain other separate assets.

Page 16 of 51
Review of operations
Iron Ore
1 Iron Ore Company of Canada and the Simandou iron ore project in Guinea are reported within Energy & Minerals, reflecting management responsibility.
2 The Pilbara underlying FOB EBITDA margin is defined as Pilbara underlying EBITDA divided by Pilbara revenues, excluding freight revenue.
Financial performance We continued to deliver strong results from our world-class iron ore assets. We benefited from robust demand for our high-quality products, we increased shipments and maintained unit costs. It was a solid year operationally although third quarter production was affected by a safety pause across all operations following the fatality at the Paraburdoo mine.
Underlying EBITDA of $11.3 billion in 2018 was 2% lower than 2017, primarily driven by lower prices and higher energy costs. The average FOB Platts index for 62% Pilbara fines dropped by 4%, which lowered our EBITDA by $0.5 billion relative to 2017. We partly offset this by increasing shipments by 2% to 338 million tonnes.
In 2018, Pilbara unit cash costs were marginally lower at $13.3 per tonne (2017: $13.4 per tonne). Higher volumes and the weakening of the Australian dollar offset headwinds including higher diesel prices, rises in labour and maintenance costs, and steeper hauls.
Our Pilbara operations delivered an underlying FOB EBITDA margin of 68% in 2018, consistent with 2017.
In 2018, we priced approximately 68% of our sales with reference to the current month average index; 17% with reference to the prior quarter’s average index lagged by one month; 5% with reference to the current quarter average; and 10% on the spot market. Approximately 32% of our sales were made on an FOB basis with the remainder sold including freight.
In 2018, we achieved an average iron ore price of $57.8 per wet metric tonne on an FOB basis (2017: $59.6 per wet metric tonne). This equates to $62.8 per dry metric tonne (2017: $64.8 per dry metric tonne), which compares with the average FOB Platts index of $61.2 per dry metric tonne for the 62% iron Pilbara fines product (2017: $64.1 per dry metric tonne).
Gross sales revenue for our Pilbara operations in 2018 included freight revenue of $1.69 billion (2017: $1.46 billion).
Net cash generated from operating activities of $8.3 billion was 2% lower than 2017, driven by the same trends as underlying EBITDA.
Free cash flow of $7.0 billion, 3% lower than 2017, reflected higher capital spend. This was largely sustaining capital, including rail improvements, structural integrity works and automation.
2018 results’ 2018 2017 Change Pilbara production (million tonnes – Rio Tinto share) 281.8 271.3 +4% Pilbara production (million tonnes – 100%) 337.8 329.8 +2% Pilbara shipments (million tonnes – Rio Tinto share) 280.8 272.0 +3% Pilbara shipments (million tonnes – 100%) 338.2 330.1 +2% Gross sales revenue (US$ millions) 18,485 18,251 +1% Underlying EBITDA (US$ millions) 11,325 11,520 -2% Pilbara underlying FOB EBITDA margin2 68% 68% Underlying earnings (US$ millions) 6,514 6,692 -3% Net cash generated from operating activities (US$ millions) 8,332 8,466 -2% Capital expenditure (US$ millions) (1,288) (1,201) +7% Free cash flow (US$ millions) 7,043 7,265 -3%

Page 17 of 51
Review of operations Our Pilbara mines in Western Australia produced 338 million tonnes in 2018 (with 282 million tonnes as Rio Tinto’s share) – 2% higher than 2017. This increase came from expanded mines and productivity improvements across the integrated system.
In December 2018, we successfully deployed AutoHaul™, the world’s first automated heavy-haul, long distance rail network. Since completing the first autonomous haulage run in July 2018, we have steadily increased the number of driverless journeys, with more than 1.6 million kilometres travelled autonomously in 2018. The programme will now focus on optimising autonomous operations.
New projects and growth options In 2018, the board approved three new investments to sustain our existing production capacity. We are set to invest $2.6 billion in the Koodaideri mine. This will be the most technologically advanced iron ore mine and, as a new production hub in the Pilbara, will create significant future flexibility in the system. It will incorporate a processing plant and infrastructure, including a 166-kilometre rail line connecting the mine to our existing infrastructure network. We expect construction to start in 2019, with first production in late 2021. Once complete, the initial mine development will have an annual capacity of 43 million tonnes.
We also received board approval for a $44 million pre-feasibility study into Koodaideri Phase 2. This will explore options for expanding annual capacity from our new production hub to 70 million tonnes and beyond, underpinning production of our Pilbara Blend™.
With our joint venture partners, Mitsui and Nippon Steel, we will invest $1.55 billion (Rio Tinto’s 53% share $820 million) to sustain production capacity at the Robe Valley and West Angelas mines. We expect construction on these projects to start in 2019, and production of first ore from 2021.
Markets and outlook Demand for the high-quality, higher grade iron ores we produce remained strong in 2018. This was driven by Chinese environmental policy and the supply-side reform of the steel sector. With Chinese steel mills continuing to chase productivity, prices for 62% iron ore remained relatively stable, while prices for 58% iron ore traded at a 42% discount (on average) to 62% iron ore in 2018. Around 90% of our Pilbara products are priced with reference to the 62% index.
Global steel markets were resilient in 2018, supported by record Chinese crude steel production of 928 million tonnes. Chinese steel inventories declined, highlighting healthy end-use demand. Steel demand outside China was also robust. India overtook Japan as the world’s second-largest steel producer, and Europe’s steel demand and production sustained its growth momentum. We have also seen US capacity utilisation recovering on the back of tariffs on steel imports imposed by section 232. With US annual steel imports representing just two and a half weeks of Chinese steel production, we continue to expect the impact of section 232 on China to be minimal.
2018 seaborne iron ore supply was essentially flat compared to 2017. Expansions from the major producers were mostly offset by high-cost, low-quality supply exiting the market, coupled with significant operational disruptions and industrial disputes. China’s domestic supply dropped to 240 million tonnes in 2018.
Scrap use increased, with up to 50 million tonnes of new electric arc furnace (EAF) capacity expected in the next five years. Scrap use will remain limited by availability, quality, location and economics, and we expect EAF utilisation rates to stay below 70%.
2019 guidance In 2019, we expect our Pilbara shipments to be 338 to 350 million tonnes (100% basis), subject to weather and market conditions. Following a plant fire at the port of Cape Lambert A on 10 January 2019, we expect limited disruption to Robe Valley lump and fines shipments. This is included in the above guidance.
In 2019, we expect our Pilbara unit cash costs to be $13-14 per wet metric tonne on an FOB basis.

Page 18 of 51
Aluminium
1 Equity accounted units 2 2018 capital expenditure excludes proceeds of $508 million from the sale of surplus land at Kitimat in Canada. These proceeds
are not included in Aluminium’s free cash flow and the associated gain on disposal is excluded from underlying EBITDA and underlying earnings.
Financial performance Our aluminium business was stable from an operational perspective, with higher premiums for our sales in North America offset by the US 10% tariff. The year was characterised by market volatility from tariffs, sanctions and alumina supply disruptions and rises in input prices for key raw materials.
Underlying EBITDA of $3.1 billion declined by 10% compared with 2017. The stronger pricing environment, in particular for primary metal in the first half of the year, helped to increase revenues. However, this was more than outweighed by the impact of legacy alumina sales contracts, raw material cost inflation and lower aluminium volumes. The lower volumes were primarily due to labour disruptions at the non-managed Becancour smelter in Canada and a power interruption at the Dunkerque smelter in France.
In 2018, we achieved an average realised aluminium price of $2,470 per tonne (2017: $2,231 per tonne). This comprised the LME price, a market premium and a value-added product (VAP) premium. The cash LME price averaged $2,110 per tonne, 7% higher than 2017. Market premiums increased in all regions. In our key US market, the mid-West premium rose 111% to $419 per tonne (2017: $199 per tonne), driven by the 10% US tariff implemented on 1 June which is included in our operating costs. VAP represented 57% of the primary metal we sold (2017: 57%) and generated attractive product premiums averaging $224 per tonne of VAP sold (2017: $221 per tonne). Overall, the improvement in prices increased our underlying EBITDA by $0.3 billion compared with 2017.
Although we are broadly balanced in alumina, we are exposed to approximately 2.2 million tonnes of legacy alumina sales contracts which have a fixed linkage to the LME price. These contracts date back to 2005 or earlier, and the majority expire between 2023 and 2030. The negative impact on EBITDA of these legacy contracts, following significant escalation in the alumina index due to industry supply disruptions, was $0.46 billion in 2018. This was $0.3 billion higher than in 2017.
In 2018, there was a significant impact from raw material cost headwinds – most notably caustic soda, petroleum coke and tar pitch. In addition, higher priced energy relating to stronger thermal coal pricing negatively impacted our Pacific Aluminium smelters in Australia. These headwinds resulted in around $0.5 billion (pre-tax) of cost inflation relative to the 2017 pricing of these inputs.
Despite these pressures, we maintained our position as the leading business in the sector, with an EBITDA margin from integrated operations of 32%.
Net cash from operating activities decreased by 12%, driven by the underlying EBITDA performance. Our overall free cash flow declined by 54%. This was partly due to the reduction in EBITDA and partly to 33% higher capital expenditures relating to the Amrun project, which we delivered ahead of schedule and below budget during the fourth quarter.
2018 results 2018 2017 Change Bauxite production (000 tonnes – Rio Tinto share) 50,421 50,796 -1% Alumina production (000 tonnes – Rio Tinto share) 7,980 8,131 -2% Aluminium production (000 tonnes – Rio Tinto share) 3,458 3,551 -3% Gross sales revenue (US$ millions) 12,191 11,005 +11% Underlying EBITDA (US$ millions) 3,095 3,423 -10% Underlying EBITDA margin (integrated operations) 32% 35% Underlying earnings (US$ millions) 1,347 1,583 -15% Net cash generated from operating activities (US$ millions) 2,331 2,648 -12% Capital expenditure – excluding EAUs1 (US$ millions)2 (1,683) (1,269) +33% Free cash flow (US$ millions) 638 1,380 -54%
Page 19 of 51
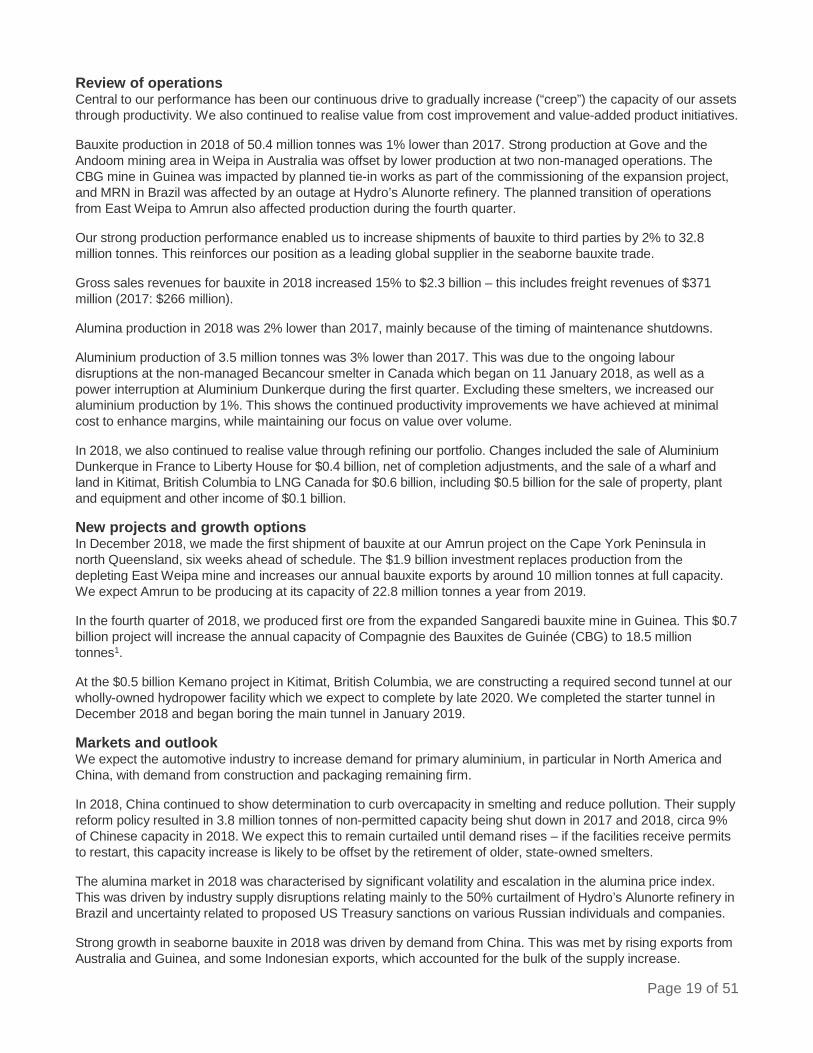
Review of operations Central to our performance has been our continuous drive to gradually increase (“creep”) the capacity of our assets through productivity. We also continued to realise value from cost improvement and value-added product initiatives.
Bauxite production in 2018 of 50.4 million tonnes was 1% lower than 2017. Strong production at Gove and the Andoom mining area in Weipa in Australia was offset by lower production at two non-managed operations. The CBG mine in Guinea was impacted by planned tie-in works as part of the commissioning of the expansion project, and MRN in Brazil was affected by an outage at Hydro’s Alunorte refinery. The planned transition of operations from East Weipa to Amrun also affected production during the fourth quarter.
Our strong production performance enabled us to increase shipments of bauxite to third parties by 2% to 32.8 million tonnes. This reinforces our position as a leading global supplier in the seaborne bauxite trade.
Gross sales revenues for bauxite in 2018 increased 15% to $2.3 billion – this includes freight revenues of $371 million (2017: $266 million).
Alumina production in 2018 was 2% lower than 2017, mainly because of the timing of maintenance shutdowns.
Aluminium production of 3.5 million tonnes was 3% lower than 2017. This was due to the ongoing labour disruptions at the non-managed Becancour smelter in Canada which began on 11 January 2018, as well as a power interruption at Aluminium Dunkerque during the first quarter. Excluding these smelters, we increased our aluminium production by 1%. This shows the continued productivity improvements we have achieved at minimal cost to enhance margins, while maintaining our focus on value over volume.
In 2018, we also continued to realise value through refining our portfolio. Changes included the sale of Aluminium Dunkerque in France to Liberty House for $0.4 billion, net of completion adjustments, and the sale of a wharf and land in Kitimat, British Columbia to LNG Canada for $0.6 billion, including $0.5 billion for the sale of property, plant and equipment and other income of $0.1 billion.
New projects and growth options In December 2018, we made the first shipment of bauxite at our Amrun project on the Cape York Peninsula in north Queensland, six weeks ahead of schedule. The $1.9 billion investment replaces production from the depleting East Weipa mine and increases our annual bauxite exports by around 10 million tonnes at full capacity. We expect Amrun to be producing at its capacity of 22.8 million tonnes a year from 2019.
In the fourth quarter of 2018, we produced first ore from the expanded Sangaredi bauxite mine in Guinea. This $0.7 billion project will increase the annual capacity of Compagnie des Bauxites de Guinée (CBG) to 18.5 million tonnes1.
At the $0.5 billion Kemano project in Kitimat, British Columbia, we are constructing a required second tunnel at our wholly-owned hydropower facility which we expect to complete by late 2020. We completed the starter tunnel in December 2018 and began boring the main tunnel in January 2019.
Markets and outlook We expect the automotive industry to increase demand for primary aluminium, in particular in North America and China, with demand from construction and packaging remaining firm.
In 2018, China continued to show determination to curb overcapacity in smelting and reduce pollution. Their supply reform policy resulted in 3.8 million tonnes of non-permitted capacity being shut down in 2017 and 2018, circa 9% of Chinese capacity in 2018. We expect this to remain curtailed until demand rises – if the facilities receive permits to restart, this capacity increase is likely to be offset by the retirement of older, state-owned smelters.
The alumina market in 2018 was characterised by significant volatility and escalation in the alumina price index. This was driven by industry supply disruptions relating mainly to the 50% curtailment of Hydro’s Alunorte refinery in Brazil and uncertainty related to proposed US Treasury sanctions on various Russian individuals and companies.
Strong growth in seaborne bauxite in 2018 was driven by demand from China. This was met by rising exports from Australia and Guinea, and some Indonesian exports, which accounted for the bulk of the supply increase.

Page 20 of 51
There are significant uncertainties around the direction of the bauxite market primarily due to the recent and substantial growth in bauxite mine capacity in Guinea and uncertainties regarding the impact of supply reforms underway in China.
2019 production guidance We expect our share of production in 2019 to be between 56 and 59 million tonnes of bauxite, 8.1 to 8.4 million tonnes of alumina and 3.2 to 3.4 million tonnes of aluminium.
1 100% basis. Rio Tinto’s share of capex and production is 45%.

Page 21 of 51
Copper & Diamonds
1 Net cash generated from operating activities excludes the operating cash flows of equity accounted units (Escondida) but includes dividends from the equity accounted units
2 Equity accounted units
Financial performance 2018 was a year of strong operational performance, with Escondida in Chile returning to capacity, productivity improvements at Rio Tinto Kennecott in the US and progress on the Oyu Tolgoi underground project in Mongolia. We rounded the year off by successfully completing the sale of our interest in the Grasberg mine in Indonesia for $3.5 billion.
Underlying EBITDA of $2.8 billion was 46% higher than 2017. Our strong performance was primarily driven by increased volumes of copper and gold, lower costs linked to productivity improvements at our managed operations, and Escondida running at full capacity after the 2017 strike. These drivers more than offset the impact of higher input costs and the increase in our evaluation expenditure as we advanced the Resolution copper project in Arizona.
Gross sales revenue of $6.5 billion was 34% higher than 2017. This reflected increased copper and gold volumes which were driven by higher grades. The rise is also connected to productivity improvements and increased plant throughput at Rio Tinto Kennecott, a return to capacity at Escondida, higher gold grades at Oyu Tolgoi, and a greater metal share at Grasberg.
Average copper prices increased 6% to 297 US cents per pound, and the average gold price rose 1% to $1,269 per ounce compared with 2017. These price rises were more than offset by provisional pricing movements, resulting in a $25 million decrease in underlying EBITDA compared with 2017.
In 2018, we generated $2.1 billion in cash from our operating activities, a 25% increase on the previous year. This included $786 million of dividends from Escondida, in line with the $780 million received in 2017. Working capital, productivity and cost management initiatives also contributed to favourable cash flows, partially offsetting the impact of raw materials and consumables inflation at certain sites. We also delivered free cash flow of $266 million, net of a $474 million increase in capital expenditure, as we ramped up activities at the Oyu Tolgoi underground project.
2018 results 2018 2017 Change Mined copper production (000 tonnes - Rio Tinto share) 633.5 478.1 +33% Refined copper production (000 tonnes - Rio Tinto share) 274.8 197.2 +39% Diamonds production (000 carats - Rio Tinto share) 18,427 21,627 -15% Gross sales revenue (US$ millions) 6,468 4,842 +34% Underlying EBITDA (US$ millions) 2,776 1,904 +46% Underlying EBITDA margin 43% 39% Underlying earnings (US$ millions) 1,054 263 +301% Net cash generated from operating activities (US$ millions)1 2,114 1,695 +25% Capital expenditure – excluding EAUs2 (US$ millions) (1,848) (1,374) +34% Free cash flow (US$ millions) 266 319 -17%

Page 22 of 51
Review of operations Mined copper production was 33% higher than 2017, attributable to:
• The commissioning of the Los Colorados concentrator at Escondida in the second half of 2017 and full recovery from the 2017 strike.
• Increases at Rio Tinto Kennecott as mining activity moved into a higher grade area of the pit and fleet productivity improved.
• Higher recoveries at Oyu Tolgoi. • An attributable metal share of 26 thousand tonnes from Grasberg.
Refined copper production was 39% higher, reflecting a return to normal operating activities both at Rio Tinto Kennecott, after the 2017 smelter shutdown, and at Escondida.
Rio Tinto Kennecott Mined copper production in 2018 was 37% up on 2017 as activity continued in a higher-grade area of the pit, productivity improved and plant throughput increased.
Refined copper was 55% higher than 2017 as better mine grades improved concentrate quality and smelting throughput.
Escondida 2018 mined copper production from our 30% stake in the Escondida mine was 29% higher than 2017. This reflected commissioning of the Los Colorados concentrator and full recovery from the 2017 strike.
Grasberg In 2018, we completed the sale of our entire interest in the Grasberg copper/gold mine in Indonesia for $3.5 billion. This was part of a series of transactions involving Inalum (PT Indonesia Asahan Aluminium (Persero)), Indonesia’s state mining company, and Freeport-McMoRan Inc. Total proceeds from the sale were $3.5 billion. This included $0.1 billion for the 2018 attributable metal share of 26 thousand tonnes of copper and 267 thousand ounces of gold, net of the capital contribution for the year.
Oyu Tolgoi Mined copper production from the open pit in 2018 was 1% higher than 2017, with higher copper recovery partly offset by lower plant throughput due to the processing of harder ore. Gold production was 150% higher than 2017 due to higher grades and recoveries.
Diamonds Diamond production was 15% lower than 2017. At Argyle, production was 18% less than 2017, when we enhanced production by processing higher grade alluvial tailings. At Diavik, production was 3% lower, with lower recovered grades partially offset by higher ore processing.
New projects and growth options The Oyu Tolgoi underground project continued to progress through 2018 with the construction of critical above and below ground infrastructure to develop Oyu Tolgoi into one of the largest copper mines in the world.
Detailed engineering design work and overall construction progress is mostly on track. The main focus in 2018 has been underground lateral development, the fit out of shaft 2 (our main production shaft), support infrastructure and the convey-to-surface decline. Recent achievements include the completion of the overland conveyor connecting shaft 2 to the coarse ore stockpile, significant progress on the second underground crusher and the expansion of the central heating plant.
Overall the underground lateral development has been proceeding well, with a total of 19.0km achieved at the end of January 2019 against our second annual reforecast target of 19.8km. With the structural, mechanical and electrical fitout of shaft 2, it is now clear that the completion of this technically complex installation and commissioning work will be delayed by several months. Delayed completion of the shaft, which provides additional hoist capacity to accelerate lateral development, will further delay the date we reach sustainable production beyond the 9 month delay indicated in October 2018.

Page 23 of 51
As announced at that time, difficult ground conditions encountered had slowed progress in some areas of the underground development. As the lateral development continues, we learn more about the rock mass around and under the orebody and have access to more detailed geotechnical data than was available from surface drilling. This data reveals there are areas of the mine footprint where the strength of the rock mass is more variable than anticipated in the feasibility study. This will require some potentially significant changes to the design of some future elements of the development and the development schedule.
Detailed design work is under way as is the work necessary to estimate the impact on cost and schedule from these changes and the delay in commissioning shaft 2.
At the end of 2018, we announced the signing of the Power Source Framework Agreement between Oyu Tolgoi and the government of Mongolia. This agreement is a binding framework and pathway for the construction of a power plant, and sets out an amended timetable for Oyu Tolgoi to meet its obligation to source power domestically as set out in the 2009 Investment Agreement. The 300MW plant will be majority owned by Oyu Tolgoi LLC and will be situated close to the Tavan Tolgoi coalfields. Construction is scheduled to start in 2020, with the commissioning of the plant by mid-2023. The agreement also paves the way for Oyu Tolgoi to supplement its power sourcing requirements with renewable energy.
In 2018, we progressed stripping activities at the $0.9 billion south wall pushback project at Rio Tinto Kennecott. This will allow us to continue open pit mining activities beyond 2019. We expect to access higher, more consistent grade ore from this project in late 2020. This will offset grade variability over the longer term.
We made further advances at our Resolution Copper project in Arizona. The board approved $368 million in late 2017 to improve infrastructure and facilitate permitting and mine planning as part of the pre-feasibility study.
This year we also completed the development of a fourth diamond pipe, known as A21, at the Diavik Diamond Mine in the Northwest Territories of Canada within budget and ahead of schedule. The pit is now at full production following four years of construction and a $350 million investment.
Markets and outlook Copper demand in the first half of 2018 was shaped by China’s gradual deceleration and buoyant and broad-based demand in the rest of the world. Certain factors reduced the copper price in the second half of the year: increasing geopolitical uncertainty, volatility in equity markets and a deterioration of macroeconomics in mature economies.
On the supply side, fewer major new projects or expansions, plus lower volumes from some of the largest producers, are expected to result in a decline in mined copper production growth in 2019. This is in contrast to growth of 3.4% in 2018.
In 2020, market expectations are for mined copper production to grow by around 4%, driven by a partial return of Indonesian supply, strong growth in the African copper belt, ramp-up of greenfield projects and no major mine disruptions.
Global trade in scrap copper has been disrupted by China’s low-quality scrap import restrictions, and disruptions are likely to continue into 2019. China’s smelters are importing more high-quality scrap, as well as more blister and concentrate, while manufacturers are importing more cathode. Gross scrap imports collapsed 32% compared with 2017.
Longer term, the market expects total copper demand to be solid at a compound annual growth rate (CAGR) of around 2% per year (2019-2023), driven by continued urbanisation, industrialisation and electrification in China and other emerging economies.
The global supply of natural rough diamonds in 2018 was lower than 2017. We expect this trend to continue into 2019, as new sources of supply are unable to satisfy growing demand. We saw a reduction in miners’ inventories over the first half of the year, coinciding with improved prices. However, in the latter part of 2018 there was an increase in inventories, predominantly of lower quality rough diamonds. This led to a softening of prices, particularly in lower-end categories.

Page 24 of 51
2019 guidance Guidance for our share of mined copper production for 2019 is between 550,000 and 600,000 tonnes, reflecting the divestment of Grasberg and increased grade variability at Rio Tinto Kennecott. Refined copper production guidance is between 220,000 and 250,000 tonnes. Diamond production guidance for 2019 is between 15 and 17 million carats.
In 2019, we expect C1 unit costs at Rio Tinto Kennecott, Oyu Tolgoi and Escondida to average 110-120 US cents per pound.

Page 25 of 51
Energy & Minerals
1 To allow production numbers to be compared on a like-for-like basis, production from asset divestments completed in 2017 have been excluded from the Rio Tinto share of prior year production data, but assets sold in 2018 remain in the comparative. Financial data above includes the results of divested assets up to the date of sale.
2 Iron Ore Company of Canada and the Simandou iron ore project in Guinea are reported within Energy & Minerals, reflecting management responsibility.
Financial performance 2018 was a challenging year for the business with disruptions to operations, including two fatalities at Rio Tinto Iron & Titanium and a strike at Iron Ore Company of Canada. The year also marked the completion of the sales of our remaining coking coal assets in Australia.
Underlying EBITDA, including coal, of $2.2 billion was 22% lower than 2017. Coal EBITDA in 2018 included a $278 million gain from the sales of the Winchester South and Valeria coal development projects and a $167 million pre-tax gain from the revaluation of a royalty receivable arising from the disposal of the Mount Pleasant coal project in 2016. Excluding the entire contribution from coal in both years, 2018 EBITDA of $1.3 billion was 18% lower than the 2017 comparative of $1.6 billion.
We benefited from higher prices, in particular for titanium dioxide feedstocks, zircon and metallics. However, our performance was affected by a number of events in the first half of the year. At Iron Ore Company of Canada, we suspended operations due to a two-month strike while collective bargaining negotiations took place. We also experienced disruptions at our titanium dioxide operations: in Canada we suspended activities for ten days following a fatality, and in South Africa we had intermittent stoppages related to labour disputes between contractors and their employees.
Gross sales revenue was $5.7 billion, including coal. Excluding the entire contribution from coal in both years, 2018 revenue of $4.7 billion was 5% lower than the 2017 comparative of $4.9 billion. This reflected lower volumes in iron ore and titanium dioxide feedstocks, partly offset by higher prices.
We generated net cash of $1.3 billion from our operating activities. This included $233 million of pre-tax divestment proceeds from the Winchester South and Valeria coal development projects.
Review of operations Energy In 2018 we sold our interests in the Kestrel and Hail Creek coking coal mines and the Valeria and Winchester South coal development projects. We completed these transactions by 1 August 2018, for a combined consideration of $4.15 billion. As of this date, we are no longer producing coal. We expect to pay approximately $0.9 billion in tax on these disposals to the Australian Taxation Office in the first half of 2019.
2018 results 2018 2017 Change Hard coking coal production (000 tonnes – Rio Tinto share) 3,988 7,704 -48% Thermal coal production1 (000 tonnes – Rio Tinto share) 2,527 4,065 -38% Iron ore pellets and concentrates production2 (000 tonnes – Rio Tinto share) 8,952 11,166 -20% Titanium dioxide slag production (000 tonnes – Rio Tinto share) 1,116 1,315 -15% Borates production (000 tonnes – Rio Tinto share) 512 517 -1% Salt production (000 tonnes – Rio Tinto share) 6,153 5,090 +21% Uranium production (000 lbs – Rio Tinto share) 6,764 6,650 +2% Gross sales revenue (US$ millions) 5,697 7,764 -27% Underlying EBITDA (US$ millions) 2,193 2,803 -22% Underlying EBITDA margin 38% 36% Underlying earnings (US$ millions) 1,012 1,242 -19% Net cash generated from operating activities (US$ millions) 1,262 1,939 -35% Capital expenditure (US$ millions) (456) (467) -2% Free cash flow (US$ millions) 798 1,467 -46%

Page 26 of 51
Uranium production was 2% higher than 2017. Energy Resources of Australia continued to process existing low-grade stockpiles, and production was 13% lower due to declining grades and completion of laterite processing. Production at Rössing Uranium was 17% higher due to higher mill grades.
On 26 November 2018, we announced that we had entered into a binding agreement with China National Uranium Corporation Limited for the sale of our entire 68.62% stake in Rössing Uranium. The transaction is subject to certain conditions, including merger approval from the Namibian Competition Commission. Subject to these conditions being met, we expect the transaction to complete in the first half of 2019.
Iron Ore Company of Canada (IOC) IOC production and sales in 2018 were affected by a two-month strike at the mine in the second quarter. Pellet production of 8.5 million tonnes (our share 5.0 million tonnes) was 18% lower than 2017, while concentrate production for sale of 6.7 million tonnes (our share 3.9 million tonnes) was 22% lower.
Total sales of pellets and concentrates in 2018 were 15.0 million tonnes (our share 8.8 million tonnes), 21% lower than 2017.
Minerals Titanium dioxide feedstock production was 15% lower in 2018 compared to 2017. This was mainly because of disruptions at Rio Tinto Fer et Titane (RTFT) in Canada, including the deflagration of a furnace, and intermittent stoppages related to labour disputes between contractors and their employees at Richards Bay Minerals (RBM) in South Africa in the first half of the year.
On 26 April 2018, a contractor suffered fatal injuries during an incident at RTFT. We immediately suspended operations while investigating the incident. In early July, we safely restarted and ramped up to normal operations.
On 10 July 2018, a serious incident occurred at RBM’s mining operation, resulting in the fatality of a security contractor. We suspended operations temporarily, and the incident was investigated by the police.
Production of borates and salt were 1% lower and 21% higher, respectively, with production aligned to customer demand.
New projects and growth options We completed the Wabush 3 open pit mine at IOC in the third quarter, ahead of schedule and on budget.
We have significant capacity for growth in titanium dioxide feedstocks, subject to market conditions. Three of the nine furnaces at RTFT are idle, two of which are currently being rebuilt. One of the four furnaces at RBM remains idle. Our focus is on maximising the productivity of the furnaces in operation, and we will decide when to restart idle furnaces with a view to maximising value over volume.
Work continued on the feasibility study for the Zulti South mine expansion at RBM, which has the potential to maintain RBM’s low-cost smelting capacity and zircon production. This project is geologically one of the best undeveloped mineral sand deposits in the industry, given its large ilmenite resource with high rutile and zircon content in the overall mineral suite. We will decide whether to proceed with the project in the first half of 2019.
We are continuing our pre-feasibility study at the Jadar lithium-borate project in Serbia to establish the economic business case for the project and to advance the environmental and socioeconomic impact assessments.
The non-binding heads of agreement, originally signed on 28 October 2016, for Chinalco to acquire our entire interest in the Simandou iron ore project in Guinea has lapsed. Rio Tinto and Chinalco, who respectively own 45.05% and 39.95% of Simandou, will continue to work with the government of Guinea to explore other options to realise value from the world-class Simandou iron ore deposit. The government of Guinea owns a 15% stake in the project.
Markets and outlook We saw stronger demand for titanium dioxide in 2018 as downstream volume growth supported high utilisation rates at pigment plants. The supply of high-grade mineral sands (titanium dioxide and zircon) remained tight due to

Page 27 of 51
a combination of grade decline and production disruptions – and this has underpinned robust prices. We expect long-term demand growth to be solid at 3% per year, driven by growth in emerging economies.
Medium- to long-term demand for borates is tied to increases in wealth and living standards. Demand for high-value borates remains firm and increased in line with global industrial production growth in 2018, supported by the agriculture and engineered materials sectors.
Iron ore pellet demand in 2018 continued to be supported by the structural trend towards increasing steelmaking efficiency and reducing the industry’s environmental footprint in China and beyond. Meanwhile, key competitor pellet operations remained offline and may only gradually resume production. In that context, the spot premium rallied to a record $90 per dry metric tonne in September. Although it has moderated since, pellet pricing outside China is expected to stay elevated in 2019.
2019 production guidance Guidance for our share of 2019 production is 11.3 to 12.3 million tonnes of iron ore pellets and concentrates from IOC, 0.5 million tonnes of B2O3 equivalent production and 1.2 to 1.4 million tonnes of titanium dioxide slag production.

Page 28 of 51
Other operations
Other operations are the Group’s shipping operations and its legacy sites including the Gove alumina refinery, where production stopped in 2014.
Other items (pre-tax) 2018 2017 Central pensions and insurance (US$ millions) (128) (68) Restructuring, project and one-off costs (US$ millions) (272) (177) Central costs (US$ millions) (552) (491) (952) (736) We report central office costs, central Growth & Innovation costs and other central items in Other items. The $216 million (pre-tax) increase primarily relates to a $95 million rise in restructuring, project and other one-off costs and a $60 million increase in central pension costs and insurance. It also reflects an increase in our information system and technology spend and continued investment in capability to support our mine-to-market productivity programme.
Exploration and evaluation
We have an extensive global exploration programme. This year we explored in 16 countries looking for eight commodities and generated more opportunities than ever before. Expenditure on exploration and evaluation in 2018 was $488 million, of which $231 million relates to the exploration and evaluation of our greenfield programmes and $257 million in our product groups, mostly in copper. We have had some early success in copper exploration in the Pilbara, Western Australia, at the Winu project1 where phase 2 drilling is now underway. The majority of our projects this year are in the early stages of drilling.
1 For full details, see the Notice to ASX dated 27 February 2019 (“Rio Tinto Exploration Update – copper-gold mineralisation discovered in the Paterson Province in the far east Pilbara region of Western Australia”) and accompanying information provided in accordance with the Table 1 checklist in The Australasian Code for the Reporting of Exploration Results, Mineral Resources and Ore Reserves (The JORC Code, 2012 Edition). These materials are also available on riotinto.com.
2018 2017 Underlying EBITDA (US$ millions) (70) (116) Underlying loss (US$ millions) (102) (138) Capital expenditure (US$ millions) (12) 35
2018 2017 Central exploration expense (US$ millions – pre-tax) (231) (218)
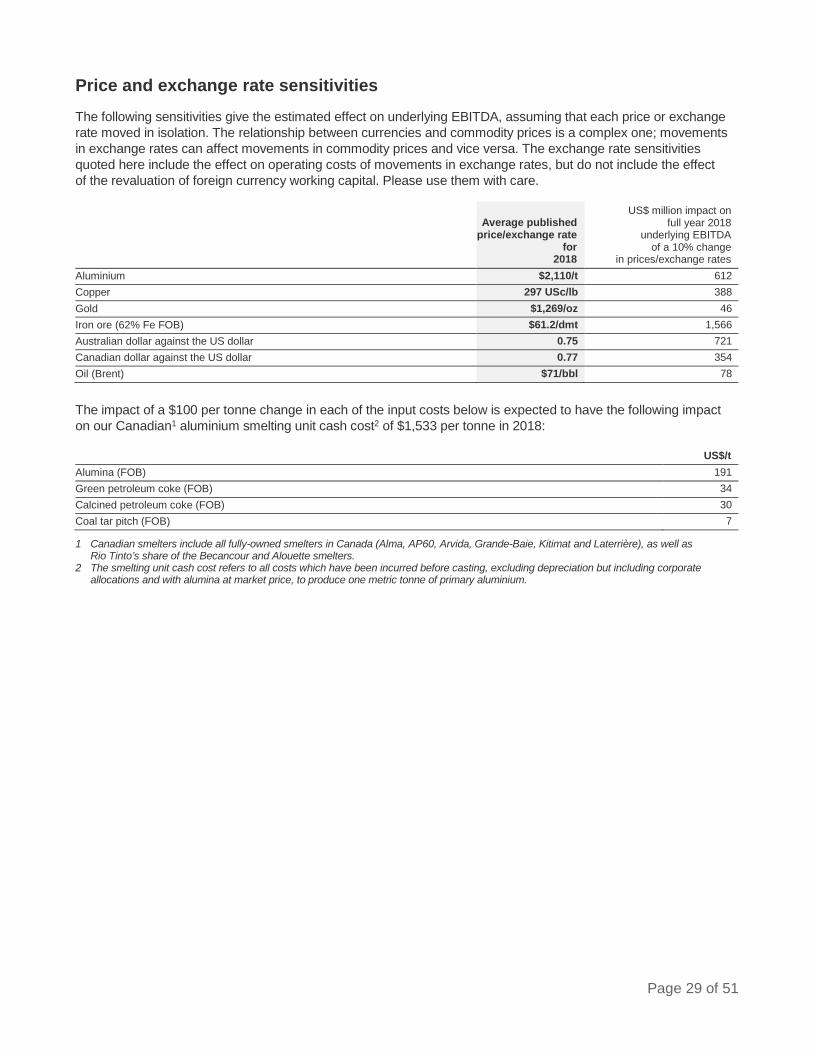
Page 29 of 51
Price and exchange rate sensitivities The following sensitivities give the estimated effect on underlying EBITDA, assuming that each price or exchange rate moved in isolation. The relationship between currencies and commodity prices is a complex one; movements in exchange rates can affect movements in commodity prices and vice versa. The exchange rate sensitivities quoted here include the effect on operating costs of movements in exchange rates, but do not include the effect of the revaluation of foreign currency working capital. Please use them with care.
The impact of a $100 per tonne change in each of the input costs below is expected to have the following impact on our Canadian1 aluminium smelting unit cash cost2 of $1,533 per tonne in 2018:
1 Canadian smelters include all fully-owned smelters in Canada (Alma, AP60, Arvida, Grande-Baie, Kitimat and Laterrière), as well as Rio Tinto’s share of the Becancour and Alouette smelters.
2 The smelting unit cash cost refers to all costs which have been incurred before casting, excluding depreciation but including corporate allocations and with alumina at market price, to produce one metric tonne of primary aluminium.
Average published
price/exchange rate for
2018
US$ million impact on full year 2018
underlying EBITDA of a 10% change
in prices/exchange rates Aluminium $2,110/t 612 Copper 297 USc/lb 388 Gold $1,269/oz 46 Iron ore (62% Fe FOB) $61.2/dmt 1,566 Australian dollar against the US dollar 0.75 721 Canadian dollar against the US dollar 0.77 354 Oil (Brent) $71/bbl 78
US$/t Alumina (FOB) 191 Green petroleum coke (FOB) 34 Calcined petroleum coke (FOB) 30 Coal tar pitch (FOB) 7

Page 30 of 51
Capital projects We have a programme of high-quality projects across a broad range of commodities.
Projects (Rio Tinto 100% owned unless otherwise stated)
Total approved
capital cost (100% unless
otherwise stated)
Approved capital remaining to be
spent from 1 January 2019 Status/Milestones
Completed in 2018 Development of A21 pipe at the Diavik Diamond Mine in Canada (Rio Tinto 60%)
$0.2bn (RT share)
–
First ore was delivered in March, with the pipe officially opened in August. The pit reached full production by the end of the year.
Development of the Amrun bauxite mine on the Cape York Peninsula in north Queensland, Australia, with a capacity of 22.8 million tonnes a year, replacing production from East Weipa
$1.9bn $0.1bn First shipment took place in December, six weeks ahead of schedule. We expect to reach full production during 2019 which will increase annual bauxite export capacity by around 10 million tonnes.
Project funding for Grasberg, Indonesia, for 2018 $0.1bn (RT share)
– We completed the sale of our interest in Grasberg in December.
Investment in AutoHaul™, the automation of the Pilbara iron ore train system in Western Australia
$0.9bn – In December, we successfully deployed AutoHaul™, following completion of the first autonomous haulage run in July 2018. The programme will now focus on optimising autonomous operations and rail debottlenecking.
Ongoing and approved Iron ore Investment in West Angelas and the Robe Valley in the Pilbara region of Western Australia to sustain production capacity
$0.8bn (RT share)
$0.8bn (RT share)
Approved in October 2018, the investments will enable us to sustain production of our Pilbara Blend™ and Robe Valley products. Construction is planned to begin in 2019 and first ore is expected in 2021.
Investment in Koodaideri, a new production hub in the Pilbara region of Western Australia, to sustain existing production in our iron ore system
$2.6bn $2.6bn Approved in November 2018, the investment incorporates a processing plant and infrastructure including a 166-kilometre rail line connecting the mine to our existing network. We will start construction in 2019 and expect first production in late 2021. Once complete, the mine will have an annual capacity of 43 million tonnes.
Aluminium Investment in the Compagnie des Bauxites de Guinée (CBG) bauxite mine to expand capacity from 14.5 to 18.5 million tonnes a year
$0.3bn (RT share)
$0.1bn
Approved in 2016. We produced first ore in the fourth quarter of 2018.
Investment in a second tunnel at the 1000MW Kemano hydropower facility at Kitimat, British Columbia, Canada
$0.5bn $0.3bn Approved in 2017. We expect to complete the project by late 2020. It will ensure the long-term reliability of the power supply to the modernised Kitimat smelter.
Copper & Diamonds Investment to extend mine life at Rio Tinto Kennecott, US, beyond 2019
$0.9bn $0.4bn Funding for the continuation of open pit mining via the push back of the south wall: the project largely consists of simple mine stripping activities. Further funding for increased levels of waste removal was approved in 2018 in response to further geotechnical information.
Development of the Oyu Tolgoi underground mine in Mongolia (Rio Tinto 34%)
$5.3bn $3.2bn The project was approved in May 2016. The detailed engineering design work and overall construction is mostly on track, but more detailed geo-technical information and difficult ground conditions have required a review of the mine design. This, combined with fit-out and commissioning challenges with the main production shaft, is ultimately expected to result in a further revised ramp-up schedule to sustainable first production (beyond the nine month delay indicated in October 2018). Detailed design work is underway to estimate the impact these issues will have on cost and schedule.
Page 31 of 51
Forward-looking statements This announcement includes "forward-looking statements" within the meaning of the Private Securities Litigation Reform Act of 1995. All statements other than statements of historical facts included in this announcement, including, without limitation, those regarding Rio Tinto’s financial position, business strategy, plans and objectives of management for future operations (including development plans and objectives relating to Rio Tinto’s products, production forecasts and reserve and resource positions), are forward-looking statements. The words “intend”, “aim”, “project”, “anticipate”, “estimate”, “plan”, “believes”, “expects”, “may”, “should”, “will”, “target”, “set to” or similar expressions, commonly identify such forward-looking statements.
Such forward-looking statements involve known and unknown risks, uncertainties and other factors which may cause the actual results, performance or achievements of Rio Tinto, or industry results, to be materially different from any future results, performance or achievements expressed or implied by such forward-looking statements. Such forward-looking statements are based on numerous assumptions regarding Rio Tinto’s present and future business strategies and the environment in which Rio Tinto will operate in the future. Among the important factors that could cause Rio Tinto’s actual results, performance or achievements to differ materially from those in the forward-looking statements are levels of actual production during any period, levels of demand and market prices, the ability to produce and transport products profitably, the impact of foreign currency exchange rates on market prices and operating costs, operational problems, political uncertainty and economic conditions in relevant areas of the world, the actions of competitors, activities by governmental authorities such as changes in taxation or regulation and such other risk factors identified in Rio Tinto's most recent Annual Report and Accounts in Australia and the United Kingdom and the most recent Annual Report on Form 20-F filed with the United States Securities and Exchange Commission (the "SEC") or Form 6-Ks furnished to, or filed with, the SEC. Forward-looking statements should, therefore, be construed in light of such risk factors and undue reliance should not be placed on forward-looking statements. These forward-looking statements speak only as of the date of this announcement. Rio Tinto expressly disclaims any obligation or undertaking (except as required by applicable law, the UK Listing Rules, the Disclosure Guidance and Transparency Rules of the Financial Conduct Authority and the Listing Rules of the Australian Securities Exchange) to release publicly any updates or revisions to any forward-looking statement contained herein to reflect any change in Rio Tinto’s expectations with regard thereto or any change in events, conditions or circumstances on which any such statement is based.
Nothing in this announcement should be interpreted to mean that future earnings per share of Rio Tinto plc or Rio Tinto Limited will necessarily match or exceed its historical published earnings per share.

Page 32 of 51
Group income statement Years ended 31 December
(a) Refer to Impairment charges note on page 40. (b) Refer to Acquisitions and disposals note on page 42. (c) Finance costs in the income statement are net of amounts capitalised of US$296 million (2017: US$224 million). (d) Refer to Taxation note on page 43. (e) For the purposes of calculating basic earnings per share, the weighted average number of Rio Tinto plc and Rio Tinto Limited shares
outstanding during the year was 1,719.3 million (2017: 1,786.7 million). The weighted average number of shares is calculated as the average number of Rio Tinto plc shares outstanding not held as treasury shares of 1,312.7 million (2017: 1,364.5 million) plus the average number of Rio Tinto Limited shares outstanding of 406.6 million (2017: 422.3 million) over the relevant period. No Rio Tinto Limited ordinary shares were held by Rio Tinto plc in any of the periods presented. The profit and loss figures used in the calculation of basic and diluted earnings per share are based on the profits and losses for the year attributable to owners of Rio Tinto.
For the purposes of calculating diluted earnings per share, the effect of dilutive securities of 12.4 million shares in 2018 and 12.8 million shares in 2017 is added to the weighted average number of shares described above. This effect is calculated under the treasury stock method.
2018
US$m 2017
US$m Consolidated operations Consolidated sales revenue 40,522 40,030 Net operating costs (excluding items shown separately) (27,115) (26,983) Impairment charges(a) (132) (796) Net gains on consolidation and disposal of interests in businesses(b) 4,622 2,344 Exploration and evaluation costs (488) (445) Profit/(loss) relating to interests in undeveloped projects 278 (15) Operating profit 17,687 14,135 Share of profit after tax of equity accounted units 513 339 Profit before finance items and taxation 18,200 14,474 Finance items Net exchange gains/(losses) on US external debt and intragroup balances 704 (601) Net (losses)/gains on derivatives not qualifying for hedge accounting (57) 33 Finance income 249 141 Finance costs(c) (552) (848) Amortisation of discount (377) (383) (33) (1,658) Profit before taxation 18,167 12,816 Taxation(d) (4,242) (3,965) Profit after tax for the year 13,925 8,851 – attributable to owners of Rio Tinto (net earnings) 13,638 8,762 – attributable to non-controlling interests 287 89 Basic earnings per share(e) 793.2c 490.4c Diluted earnings per share(e) 787.6c 486.9c

Page 33 of 51
Status of financial information The full year financial information contained in this announcement, which does not constitute statutory accounts as defined in Section 434 of the Companies Act 2006, has been derived from the statutory accounts for the year ended 31 December 2018. These statutory accounts have been audited, were approved by the Board on 27 February 2019, and will be filed with the Registrar of Companies in due course. Statutory accounts for the year ended 31 December 2017 have been filed with the Registrar of Companies.
Unless stated otherwise, financial information for the years ended 31 December 2018 and 31 December 2017 has been extracted from the full financial statements for that year prepared under the historical cost convention, as modified by the revaluation of certain derivative contracts and financial assets, the impact of fair value hedge accounting on the hedged items and the accounting for post-retirement assets and obligations.
The Auditors' reports on the full financial statements for the years ended 31 December 2018 and 31 December 2017 were both unqualified and did not contain a statement under section 498 (2) (regarding adequacy of accounting records and returns), or under section 498 (3) (regarding provision of necessary information and explanations) of the United Kingdom Companies Act 2006.

Page 34 of 51
Group statement of comprehensive income Years ended 31 December
(a) Excludes a currency translation charge of US$382 million (2017: gain of US$310 million) arising on Rio Tinto Limited’s share capital for the year ended 31 December 2018, which is recognised in the Group statement of changes in equity. Refer to Group statement of changes in equity on page 38.
(b) As part of the bond buy-back programme, cross-currency interest rate swaps hedging the bonds repurchased were closed out resulting in the reclassification of US$3 million cost of hedging to the income statement and recognised within finance costs.
2018
US$m 2017
US$m Profit after tax for the year 13,925 8,851 Other comprehensive income/(loss) Items that will not be reclassified to profit or loss: Actuarial gains on post-retirement benefit plans 907 6 Changes in the fair value of equity investments held at fair value through other comprehensive income (FVOCI) (13) – Tax relating to these components of other comprehensive income (271) (12) Share of other comprehensive losses of equity accounted units, net of tax (1) – Adjustments to deferred tax on post-retirement benefit plans due to changes in corporate tax rates in the US and France – (140) 622 (146) Items that have been/may be subsequently reclassified to profit or loss: Currency translation adjustment(a) (3,830) 3,096 Currency translation on companies disposed of, transferred to the income statement 14 78 Fair value movements: – Cash flow hedge gains 156 62 – Cash flow hedge losses/(gains) transferred to the income statement 40 (62) – Gains on revaluation of available for sale securities – 19 – Losses on revaluation of available for sale securities transferred to the income statement – 8 Net change in costs of hedging(b) (39) – Tax relating to these components of other comprehensive income (54) (1) Share of other comprehensive (loss)/income of equity accounted units, net of tax (48) 34 Other comprehensive (loss)/income for the year, net of tax (3,139) 3,088 Total comprehensive income for the year 10,786 11,939 – attributable to owners of Rio Tinto 10,663 11,691 – attributable to non-controlling interests 123 248

Page 35 of 51
Group cash flow statement Years ended 31 December
(b) We completed a US$1.9 billion (nominal value) bond buy-back programme in April 2018. The notes purchased and redeemed have been cancelled. Net interest paid includes US$80 million being the payment of the premiums and the accelerated interest associated with the bond redemption.
In 2017, we completed a US$2.5 billion (nominal value) bond buy-back programme. Net interest paid includes US$259 million being the payment of the premiums and the accelerated interest associated with the bond redemption.
(c) Capital expenditure includes US$330 million (2017: US$215 million) capitalised in accordance with IFRIC 20 “Stripping costs in the production phase of a surface mine”; a significant proportion of stripping costs capitalised relate to the Group’s Copper operations.
2018
US$m 2017
US$m Cash flows from consolidated operations(a) 15,655 16,670 Dividends from equity accounted units 800 817 Cash flows from operations 16,455 17,487 Net interest paid(b) (612) (897) Dividends paid to holders of non-controlling interests in subsidiaries (420) (399) Tax paid (3,602) (2,307) Net cash generated from operating activities 11,821 13,884 Cash flows from investing activities Purchases of property, plant and equipment and intangible assets(c) (5,430) (4,482) Disposals of subsidiaries, joint ventures, unincorporated joint operations, and associates(d) 7,733 2,675 Purchases of financial assets(e) (1,572) (723) Sales of financial assets(e) 19 40 Sales of property, plant and equipment and intangible assets 586 138 Net funding of equity accounted units (9) (3) Acquisitions of subsidiaries, joint ventures and associates (5) – Other investing cash flows (1) (18) Net cash generated/(used) in investing activities 1,321 (2,373) Cash flows before financing activities 13,142 11,511 Cash flows from financing activities Equity dividends paid to owners of Rio Tinto (5,356) (4,250) Proceeds from additional borrowings 54 18 Repayment of borrowings(b) (2,300) (2,795) Proceeds from issue of equity to non-controlling interests 85 170 Own shares purchased from owners of Rio Tinto (5,386) (2,083) Purchase of non-controlling interests(f) – (194) Other financing cash flows (48) (7) Net cash flows used in financing activities (12,951) (9,141) Effects of exchange rates on cash and cash equivalents 151 (12) Net increase in cash and cash equivalents 342 2,358 Opening cash and cash equivalents less overdrafts 10,547 8,189 Closing cash and cash equivalents less overdrafts(g) 10,889 10,547 (a) Cash flows from consolidated operations Profit after tax for the year 13,925 8,851 Adjustments for: – Taxation 4,242 3,965 – Finance items 33 1,658 – Share of profit after tax of equity accounted units (513) (339) – Net gains on consolidation and disposal of interests in businesses (4,622) (2,344) – Impairment charges 132 796 – Depreciation and amortisation 4,015 4,375 – Provisions (including exchange differences on provisions) 1,011 535 Utilisation of provisions (620) (714) Utilisation of provision for post-retirement benefits (219) (339) Change in inventories (587) (482) Change in trade and other receivables (421) (138) Change in trade and other payables 476 421 Other items(h) (1,197) 425 15,655 16,670

Page 36 of 51
Group cash flow statement (continued) (d) Refer to Acquisitions and disposals note on page 42. (e) During 2018, we invested US$1.6 billion (2017: US$0.7 billion) in a separately managed portfolio of fixed income instruments. As there was
significant turnover in both years, we have elected to report the purchases and sales of these securities on a net cash flow basis within “Purchases of financial assets”.
(f) In May 2017, our subsidiary, Simfer Jersey Limited (Rio Tinto share: 53%) purchased a 4.25% interest in Simfer S.A. from International Finance Corporation (IFC) for US$194 million in accordance with a put option exercised by IFC. As a result, we increased our effective share of Simfer S.A. from 42.80% to 45.05%.
(g) Closing cash and cash equivalents less overdrafts at 31 December 2018 differ from cash and cash equivalents on the balance sheet as they include overdrafts of US$1 million (2017: US$3 million) and US$117 million of cash included in assets held for sale at 31 December 2018 (2017: US$nil).
(h) Includes adjustments to add back mark-to-market gains of US$288 million (2017: losses of US$501 million) mainly relating to derivative contracts transacted for operational purposes and not designated in a hedge relationship. This also includes adjustments to add back a gain of US$549 million on the sale of surplus land at Kitimat and a gain of US$167 million on the revaluation of a financial asset arising from the disposal of the Mount Pleasant coal project in 2016.

Page 37 of 51
Group balance sheet At 31 December
(a) At 31 December 2018, assets and liabilities held for sale include Rio Tinto’s interest in the Rössing Uranium mine (US$106 million) and the ISAL Smelter, the Aluchemie anode plant and the Alufluor aluminium fluoride plant (US$334 million).
At 31 December 2017, assets and liabilities held for sale included Rio Tinto's interest in the Dunkerque aluminium smelter (US$355 million) and certain other separate assets.
(b) At 31 December 2018, Rio Tinto plc had 1,278.2 million ordinary shares in issue and held by the public, and Rio Tinto Limited had 371.2 million shares in issue and held by the public. No shares in Rio Tinto Limited were held by Rio Tinto plc at 31 December 2018 (31 December 2017: nil). As required to be disclosed under the ASX Listing Rules, the net tangible assets per share amounted to US$24.25 (31 December 2017: US$23.12).
2018
US$m 2017
US$m Non-current assets Goodwill 912 1,037 Intangible assets 2,779 3,119 Property, plant and equipment 56,361 62,093 Investments in equity accounted units 4,299 4,486 Inventories 152 160 Deferred tax assets 3,137 3,395 Trade and other receivables 1,585 1,724 Tax recoverable 8 30 Other financial assets (including loans to equity accounted units) 814 510 70,047 76,554 Current assets Inventories 3,447 3,472 Trade and other receivables 3,179 3,443 Tax recoverable 77 129 Other financial assets (including loans to equity accounted units) 2,692 1,084 Cash and cash equivalents 10,773 10,550 20,168 18,678 Assets of disposal groups held for sale(a) 734 494 Total assets 90,949 95,726 Current liabilities Borrowings and other financial liabilities (1,073) (904) Trade and other payables (6,600) (7,061) Tax payable (1,842) (1,985) Provisions including post-retirement benefits (1,056) (1,275) (10,571) (11,225) Non-current liabilities Borrowings and other financial liabilities (12,847) (15,148) Trade and other payables (841) (856) Tax payable (348) (263) Deferred tax liabilities (3,673) (3,628) Provisions including post-retirement benefits (12,552) (13,367) (30,261) (33,262) Liabilities of disposal groups held for sale(a) (294) (124) Total liabilities (41,126) (44,611) Net assets 49,823 51,115 Capital and reserves Share capital(b) – Rio Tinto plc 211 220 – Rio Tinto Limited 3,477 4,140 Share premium account 4,312 4,306 Other reserves 8,661 12,284 Retained earnings 27,025 23,761 Equity attributable to owners of Rio Tinto 43,686 44,711 Attributable to non-controlling interests 6,137 6,404 Total equity 49,823 51,115

Page 38 of 51
Group statement of changes in equity
Year ended 31 December 2018
Attributable to owners of Rio Tinto
Non-controlling
interests US$m
Total equity US$m
Share capital US$m
Share premium account
US$m
Other reserves
US$m
Retained earnings
US$m Total
US$m Opening balance 4,360 4,306 12,284 23,761 44,711 6,404 51,115 Adjustment for transition to new accounting standards(a) – – 10 (179) (169) – (169) Restated opening balance 4,360 4,306 12,294 23,582 44,542 6,404 50,946 Total comprehensive income for the year(b) – – (3,600) 14,263 10,663 123 10,786 Currency translation arising on Rio Tinto Limited’s share capital (382) – – – (382) – (382) Dividends(c) – – – (5,356) (5,356) (415) (5,771) Share buy-back(d) (290) – 9 (5,423) (5,704) – (5,704) Own shares purchased from Rio Tinto shareholders to satisfy share options(e) – – (114) (140) (254) – (254) Change in equity interest held by Rio Tinto – – – 60 60 (60) – Treasury shares reissued and other movements – 6 – – 6 – 6 Equity issued to holders of non-controlling interests – – – – – 85 85 Employee share options and other IFRS 2 charges to the income statement – – 50 61 111 – 111 Transfers and other movements – – 22 (22) – – – Closing balance 3,688 4,312 8,661 27,025 43,686 6,137 49,823
(a) The impact of the transition to new accounting standards; IFRS 9 “Financial Instruments” and IFRS 15 “Revenue from Contracts with Customers” on 1 January 2018. Further information on this impact was previously provided in our 2018 interim results announcement, published on 1 August 2018.
(b) Refer to Group statement of comprehensive income for further details. Adjustments to other reserves include currency translation attributable to owners of Rio Tinto, other than that arising on Rio Tinto Limited’s share capital.
(c) The dividends paid in 2018 are based on the following US cents per share amounts: 2017 final – 180.0 cents, 2018 interim – 127.0 cents (2017 dividends paid: 2016 final – 125.0 cents, 2017 interim – 110.0 cents). Dividends per share: proposed in the announcement of the results for 2018 are ordinary dividend per share of US$180.0 cents (2017: US$180.0 cents) and special dividend per share of US$243.0 cents (2017: US$nil cents)
(d) In 2018, the total amount of US$5,704 million includes own shares purchased from the owners of Rio Tinto as per the cash flow statement of US$5,386 million and a financial liability recognised in respect of an irrevocable contract in place as at 31 December 2018 to cover the share buy-back programme, less amounts paid during the year in respect of a similar irrevocable contract in place at 31 December 2017. In 2017, the total amount of US$2,397 million includes own shares purchased from the owners of Rio Tinto as per the cash flow statement of US$2,083 million and a financial liability recognised in respect of the irrevocable contract in place as at 31 December 2017.
(e) Net of contributions received from employees for share options.
Year ended 31 December 2017
Attributable to owners of Rio Tinto
Non-controlling interests
US$m
Total equity US$m
Share capital US$m
Share premium account
US$m
Other reserves
US$m
Retained earnings
US$m Total
US$m Opening balance 4,139 4,304 9,216 21,631 39,290 6,440 45,730 Total comprehensive income for the year(b) – – 3,078 8,613 11,691 248 11,939 Currency translation arising on Rio Tinto Limited’s share capital 310 – – – 310 – 310 Dividends(c) – – – (4,250) (4,250) (403) (4,653) Share buy-back(d) (89) – 4 (2,312) (2,397) – (2,397) Companies no longer consolidated – – (124) 130 6 (8) (2) Own shares purchased from Rio Tinto shareholders to satisfy share options(e) – – (64) (18) (82) – (82) Change in equity interest held by Rio Tinto – – – 43 43 (43) – Treasury shares reissued and other movements – 2 – – 2 – 2 Equity issued to holders of non-controlling interests – – – – – 170 170 Employee share options and other IFRS 2 charges to the income statement – – 41 57 98 – 98 Transfers and other movements – – 133 (133) – – –
Closing balance 4,360 4,306 12,284 23,761 44,711 6,404 51,115

Page 39 of 51
Reconciliation with Australian Accounting Standards
The Group’s financial statements have been prepared in accordance with IFRS, as defined in the accounting policies’ notes in this report, which differs in certain respects from the version of International Financial Reporting Standards that is applicable in Australia, referred to as Australian Accounting Standards (AAS).
Prior to 1 January 2004, the Group’s financial statements were prepared in accordance with UK GAAP. Under IFRS, goodwill on acquisitions prior to 1998, which was eliminated directly against equity in the Group’s UK GAAP financial statements, has not been reinstated. This was permitted under the rules governing the transition to IFRS set out in IFRS 1. The equivalent Australian Standard, AASB 1, does not provide for the netting of goodwill against equity. As a consequence, shareholders’ funds under AAS include the residue of such goodwill, which amounted to US$379 million at 31 December 2018 (2017: US$557 million).
Save for the exception described above, the Group’s financial statements drawn up in accordance with IFRS are consistent with the requirements of AAS.
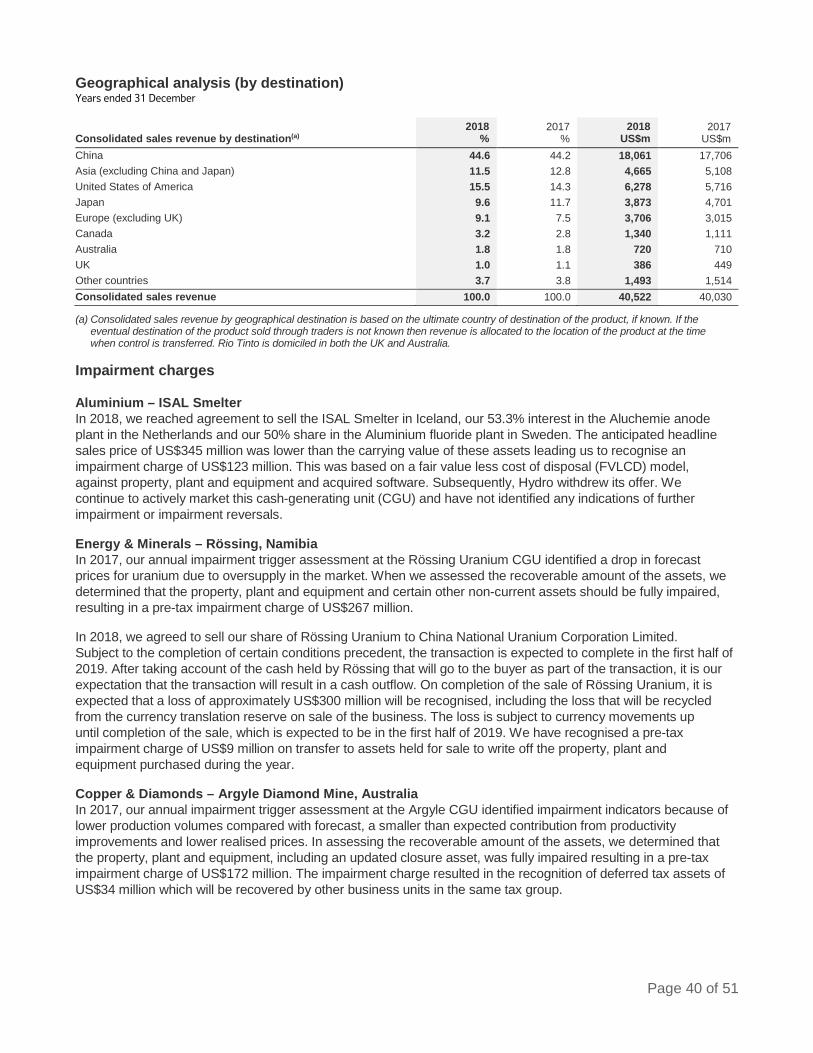
Page 40 of 51
Geographical analysis (by destination) Years ended 31 December
(a) Consolidated sales revenue by geographical destination is based on the ultimate country of destination of the product, if known. If the eventual destination of the product sold through traders is not known then revenue is allocated to the location of the product at the time when control is transferred. Rio Tinto is domiciled in both the UK and Australia.
Impairment charges Aluminium – ISAL Smelter In 2018, we reached agreement to sell the ISAL Smelter in Iceland, our 53.3% interest in the Aluchemie anode plant in the Netherlands and our 50% share in the Aluminium fluoride plant in Sweden. The anticipated headline sales price of US$345 million was lower than the carrying value of these assets leading us to recognise an impairment charge of US$123 million. This was based on a fair value less cost of disposal (FVLCD) model, against property, plant and equipment and acquired software. Subsequently, Hydro withdrew its offer. We continue to actively market this cash-generating unit (CGU) and have not identified any indications of further impairment or impairment reversals.
Energy & Minerals – Rössing, Namibia In 2017, our annual impairment trigger assessment at the Rössing Uranium CGU identified a drop in forecast prices for uranium due to oversupply in the market. When we assessed the recoverable amount of the assets, we determined that the property, plant and equipment and certain other non-current assets should be fully impaired, resulting in a pre-tax impairment charge of US$267 million.
In 2018, we agreed to sell our share of Rössing Uranium to China National Uranium Corporation Limited. Subject to the completion of certain conditions precedent, the transaction is expected to complete in the first half of 2019. After taking account of the cash held by Rössing that will go to the buyer as part of the transaction, it is our expectation that the transaction will result in a cash outflow. On completion of the sale of Rössing Uranium, it is expected that a loss of approximately US$300 million will be recognised, including the loss that will be recycled from the currency translation reserve on sale of the business. The loss is subject to currency movements up until completion of the sale, which is expected to be in the first half of 2019. We have recognised a pre-tax impairment charge of US$9 million on transfer to assets held for sale to write off the property, plant and equipment purchased during the year.
Copper & Diamonds – Argyle Diamond Mine, Australia In 2017, our annual impairment trigger assessment at the Argyle CGU identified impairment indicators because of lower production volumes compared with forecast, a smaller than expected contribution from productivity improvements and lower realised prices. In assessing the recoverable amount of the assets, we determined that the property, plant and equipment, including an updated closure asset, was fully impaired resulting in a pre-tax impairment charge of US$172 million. The impairment charge resulted in the recognition of deferred tax assets of US$34 million which will be recovered by other business units in the same tax group.
Consolidated sales revenue by destination(a) 2018
% 2017
% 2018
US$m 2017
US$m China 44.6 44.2 18,061 17,706 Asia (excluding China and Japan) 11.5 12.8 4,665 5,108 United States of America 15.5 14.3 6,278 5,716 Japan 9.6 11.7 3,873 4,701 Europe (excluding UK) 9.1 7.5 3,706 3,015 Canada 3.2 2.8 1,340 1,111 Australia 1.8 1.8 720 710 UK 1.0 1.1 386 449 Other countries 3.7 3.8 1,493 1,514 Consolidated sales revenue 100.0 100.0 40,522 40,030

Page 41 of 51
Impairment charges (continued) Energy & Minerals – Roughrider, Canada In 2017, after reassessing our planned exploration spend, we decided not to plan or budget for evaluating the Roughrider deposit. We identified this as an impairment indicator under IFRS 6, and, due to uncertainty around whether there are viable quantities of uranium there, set a recoverable amount of US$nil for the evaluation and exploration assets. In light of this, we recorded an impairment charge of US$357 million to write off the mineral interests recognised when we acquired Roughrider.
Copper & Diamonds – Oyu Tolgoi, Mongolia As noted in the Strategic report for Copper & Diamonds, the Group has observed a deterioration in some internal and external indicators of value for the Oyu Tolgoi CGU and has therefore prepared an assessment of recoverable amount.
The net present value of post-tax cash flows, based on the IAS 36 fair value less costs of disposal (FVLCD) methodology, for the Oyu Tolgoi CGU, discounted at 8% in real-terms, exceeds the carrying value by US$3.1 billion. As such, no impairment charge has been recognised. The recoverable amount incorporates a reduction in value of approximately US$1.1 billion, compared with the 2017 forecast, as a result of those changes to the project schedule, cost and scope, including the location of the power station, where the extent of those changes, and their value impacts, can be reasonably assessed at this time. This reduction was offset by value accretion of US$1.3 billion due to the annual unwind of the discount for the timing of expected cash inflows and inflation.
The individual assumptions subject to the most estimation uncertainty for the FVLCD calculation are the copper price and the discount rate. To illustrate these sensitivities, the valuation headroom would be eliminated by an increase to the discount rate of 1.9%, or a reduction of US$0.39 per pound to the forecast copper price throughout the life of mine, if all other inputs remained constant. In the long term, this price sensitivity is the equivalent to a 13% reduction in copper prices. These cash flows have been calculated in line with the accounting policy set out in note 1(i) of the 2017 Annual Report.
As set out in the Copper & Diamonds review of operations, in October 2018 we announced our annual reforecast of the development schedule which at that time suggested a nine month delay in the schedule to sustainable production, primarily caused by delays in completing and equipping the primary production shaft and by some zones of variable rock strength that had been encountered. In December 2018, we announced the signing of the Power Source Framework Agreement, which sets out an amended timetable for Oyu Tolgoi to meet its obligation to source power domestically. These updates, together with an estimate of the financial impact of a potential further delay in the commissioning of the primary production shaft, have been reflected in the recoverable amount of the CGU as set out above.
Since then, our mine design teams have continued to work with the more comprehensive geotechnical data that has become available as the underground development continues, and it is clear that potentially significant changes to the design of some future elements of the development, and to the development schedule, will be needed, to allow for zones of particularly variable rock strength which have been encountered in the footprint of the mine. The detailed design work is under way, as is the work necessary to estimate the impact on cost and schedule that these changes may have. Given the very early status of this work, no adjustments have at this time been made to the recoverable amount. The Group will continue to review the CGU for further indicators of impairment as this work progresses.
Recognising the uncertainties noted above, as well as the time remaining through to ramp-up of commercial production, the Group highlights that it does not consider the current headroom to be indicative of an impairment reversal at this time.
Page 42 of 51
Acquisitions and disposals Acquisitions Over the past three years, we have made no material acquisitions. However, on 10 May 2018 we created a joint venture, Elysis, with Alcoa and other partners to develop and commercialise a carbon-free aluminium smelting process. We are treating this as an acquisition for accounting purposes. We have accounted for our interest in Elysis using the equity method, with the initial purchase price allocation based on an independent valuation. We invested cash of US$5 million and contributed patents and licensed intellectual property (IP) to the venture. The patents and IP had no carrying value; however, on formation of the arrangement, they were recorded at fair value to reflect the contributions of the other parties in the joint venture. This value was US$171 million (US$141 million after tax).
Also, in May 2017, our subsidiary, Simfer Jersey Limited (Rio Tinto share: 53%) purchased a 4.25% interest in Simfer S.A. from International Finance Corporation (IFC) for US$194 million in accordance with a put option exercised by IFC. As a result, we increased our effective share of Simfer S.A. from 42.80% to 45.05%.
2018 disposals On 1 June 2018, we disposed of our entire 75% interest in the Winchester South coal development project in Queensland, Australia to Whitehaven Coal Limited for US$200 million. This comprised US$150 million cash which was received in the year and recognised within “net cash generated from operating activities” within the cash flow statement and an unconditional cash payment of US$50 million due in June 2019. A gain on disposal of US$195 million was recognised within “profit relating to interests in undeveloped projects” in the income statement.
On 1 August 2018, we completed the sale of our entire interest in the Hail Creek coal mine (82.0%) and the Valeria coal development project (71.2%) in Queensland, Australia to Glencore for a total consideration of US$1.7 billion.
We received net proceeds of US$1,545 million after completion adjustments in respect of the Hail Creek component of this transaction, resulting in a pre-tax gain of US$1,141 million. We also received cash proceeds of US$170 million in respect of Valeria. Of this amount, US$87 million relating to the sale of land and investments in associates was included in investing cash flow, resulting in a pre-tax gain of US$18 million. The remaining US$83 million proceeds were recognised in operating cash flow, resulting in a pre-tax gain of US$83 million in ‘profit relating to interests in undeveloped projects’.
Also on 1 August 2018, we completed the sale of our entire interest in the Kestrel underground coal mine (80.0%) for US$2.25 billion to a consortium comprising EMR Capital (EMR) and PT Adaro Energy Tbk (Adaro). We received net cash proceeds of US$2,270 million, resulting in a pre-tax gain of US$1,010 million.
On 14 December 2018, we completed the sale of the Dunkerque aluminium smelter in northern France to Liberty House for US$500 million. In 2018 we received net cash proceeds of US$385 million after adjustments and expect to receive a further US$52 million in 2019. We recognised a pre-tax gain on disposal of US$128 million.

Page 43 of 51
Acquisitions and disposals (continued) On 21 December 2018, we sold our interest in the Grasberg mine for US$3.5 billion as part of a series of transactions involving Inalum (PT Indonesia Asahan Aluminium (Persero)) and Freeport McMoRan Inc. Of the US$3.5 billion received, US$107 million relates to our attributable share of copper and gold revenues for 2018, net of our capital contribution for the year. The remaining net proceeds of US$3,392 million were included in investing cash flow and gave rise to a gain on disposal of US$2,146 million.
2017 disposals On 1 September 2017, we disposed of our 100% shareholding in Coal & Allied Industries Limited to Yancoal Australia Limited for a total consideration of US$2.69 billion (before working capital adjustments). This comprises US$2.45 billion in cash paid on the closing date and a further US$240 million of unconditional guaranteed royalty payments. During 2017, we received US$110 million; total net cash proceeds received in 2017, net of working capital adjustments, transaction costs and cash transferred, were US$2.54 billion. We received a further US$90 million of unconditional guaranteed royalty payments in 2018 and expect to receive the remaining US$40 million between 2019 and 2021.
Prima facie tax reconciliation Years ended 31 December
(a) The impact for each item includes the effect of tax rates applicable outside the UK. (b) In 2017, deferred tax assets were remeasured to reflect lower corporate income tax rates in the US and France as a result of tax legislation
changes substantively enacted in December 2017. (c) In 2017, deferred tax assets were derecognised as a result of revised profit forecasts in France due to expected divestments of Dunkerque
and ISAL. The Dunkerque divestment completed in 2018. (d) The write-down of previously recognised deferred tax assets in 2017 primarily relates to a reduction in recognised deferred tax assets on
brought forward losses in Grasberg. (e) Other items include various adjustments to provisions for taxation of prior periods. (f) This tax reconciliation relates to the Group’s parent companies, subsidiaries and joint operations. The Group’s share of profit of equity
accounted units is net of tax charges of US$273 million (2017: US$191 million).
2018
US$m 2017 US$m
Profit before taxation 18,167 12,816 Deduct: share of profit after tax of equity accounted units (513) (339) Parent companies’ and subsidiaries’ profit before tax 17,654 12,477 Prima facie tax payable at UK rate of 19% (2017: 19%) 3,354 2,371 Higher rate of taxation on Australian underlying earnings 1,106 1,069 Impact of items excluded in arriving at underlying earnings(a): – Impairment charges – 10 – Net gains on consolidation and disposal of interests in businesses (251) (123) – Exchange and gains/(losses) on derivatives 32 (48) – Losses from increases to closure estimates (non-operating and fully impaired sites) 30 – – Gain relating to surplus land at Kitimat (81) – – Changes in corporate tax rates in the US and France(b) – 439 – Tax charge relating to expected divestments(c) – 202 – Other exclusions – 14 Impact of changes in tax rates and laws 47 21 Other tax rates applicable outside the UK and Australia on underlying earnings (47) (92) Resource depletion and other depreciation allowances (46) (33) Recognition of previously unrecognised deferred tax assets – (40) Write-down of previously recognised deferred tax assets(d) 13 160 Other items(e) 85 15
Total taxation charge(f) 4,242 3,965

Page 44 of 51
Consolidated net cash/(debt)
Year ended 31 December 2018
Financing liabilities(b) Other assets
Net (debt)/cash
US$m
Borrowings (including
finance leases) excluding overdrafts(a)
US$m
Debt-related derivatives
(included in Other financial
assets/ liabilities)
US$m
Cash/ overdrafts(b)
US$m
Other investments(c)
US$m Analysis of changes in consolidated net cash/(debt) Opening balance (15,173) (177) 10,547 958 (3,845) Foreign exchange adjustment 126 (64) 151 – 213 Cash movements excluding exchange movements 2,246 51 191 1,557 4,045 Other non-cash movements 50 (98) (117) 7 (158) Closing balance (12,751) (288) 10,772 2,522 255
(a) Borrowings (including finance leases) at 31 December 2018 differ from total borrowings on the balance sheet as they exclude overdrafts of US$1 million (31 December 2017: US$3 million), other current financial liabilities of US$761 million (31 December 2017: US$352 million) and other non-current financial liabilities US$407 million (31 December 2017: US$524 million).
(b) Closing cash/overdrafts at 31 December 2018 differ from cash and cash equivalents on the balance sheet as they include overdrafts of US$1 million which have been classified as a financial liability (31 December 2017: US$3 million). Other non-cash movements represents the reclassification of cash and cash equivalents in disposal groups to assets held for sale.
(c) Other investments comprise US$2,522 million (2017: US$958 million) of highly liquid financial assets held in managed investment funds classified as held for trading.
Events after the balance sheet date There were no significant events identified after the balance sheet date that are required to be disclosed.
Accounting policies The condensed consolidated financial statements included in this report have been prepared on a going concern basis in accordance with the Companies Act 2006 applicable to companies reporting under International Financial Reporting Standards and in accordance with applicable UK law, applicable Australian law as amended by the Australian Securities and Investments Commission Order dated 14 December 2015, Article 4 of the European Union IAS regulation and also with:
• International Financial Reporting Standards as issued by the International Accounting Standards Board (IASB) and interpretations issued from time to time by the IFRS Interpretations Committee (IFRS IC) both as adopted by the European Union (EU) and which are mandatory for EU reporting as at 31 December 2018; and
• International Financial Reporting Standards as issued by the IASB and interpretations issued from time to time by the IFRS IC which are mandatory as at 31 December 2018.
The above accounting standards and interpretations are collectively referred to as “IFRS” in this report. Whilst the financial information included in this report has been prepared in accordance with IFRS the report does not contain all the information required to comply with IFRS. The Group will publish full financial statements that comply with IFRS on 27 February 2019.
Year ended 31 December 2017
Financing liabilities(b) Other assets
Net debt
US$m
Borrowings (including
finance leases) excluding overdrafts(a)
US$m
Debt-related derivatives
(included in Other financial
assets/ liabilities)
US$m
Cash/ overdrafts(b)
US$m
Other investments(c)
US$m
Analysis of changes in consolidated net debt Opening balance (17,618) (408) 8,189 250 (9,587) Foreign exchange adjustment (303) 245 (12) – (70) Cash movements excluding exchange movements 2,777 7 2,370 705 5,859 Other non-cash movements (29) (21) – 3 (47) Closing balance (15,173) (177) 10,547 958 (3,845)
Page 45 of 51
The Group has not early adopted any amendments, standards or interpretations that have been issued but are not yet mandatory.
The Group’s financial statements have been prepared on the basis of accounting policies consistent with those applied in the financial statements for the year ended 31 December 2017, except for the changes in accounting requirements set out below, all of which were effective as at 1 January 2018 without restatement of prior years.
The Group adopted IFRS 9 ‘Financial Instruments’, IFRS 15 ‘Revenue from Contracts with Customers’ and IFRIC 22 ‘Foreign Currency Transactions and Advance Consideration’ and a number of other minor amendments to IFRS on 1 January 2018. All of these pronouncements have been endorsed by the European Union (‘EU’). Information on the transition impact of these new pronouncements was presented in the Group’s condensed consolidated interim financial statements for the period ended 30 June 2018, and will be included in the Group’s 2018 Annual Report.
IFRIC 23 ‘Uncertainty over Income Tax Treatments’, IFRS 16 ‘Leases’ and a number of minor amendments to IFRS are mandatory in 2019. The 2018 Conceptual Framework for Financial Reporting is effective in 2020 for preparers that develop an accounting policy based on the Framework. IFRS 17 ‘Insurance Contracts’ is mandatory in 2021.
The impact of adopting IFRIC 23 is not currently expected to be material.
The IASB revised its Conceptual Framework in April 2018. Where specific accounting policies are not covered by IFRS they must be in accordance with the principles in the Framework by 2020. The Group will consider during the course of 2019 whether it will be impacted by this change to the Conceptual Framework.
IFRS 17 provides consistent principles for all aspects of accounting for insurance contracts. The Group is currently evaluating this pronouncement.
IFRS 16 Leases The Group will implement the standard as at 1 January 2019. For contracts in place at this date, the Group will continue to apply its existing definition of leases under current accounting standards (“grandfathering”), instead of reassessing whether existing contracts are or contain a lease at the date of application of the new standard.
For transition, as permitted by IFRS 16, the Group will apply the modified retrospective approach to existing operating leases which will be capitalised under the new standard (ie retrospectively, with the cumulative effect recognised at the date of initial application as an adjustment to the opening balance of retained earnings with no restatement of comparative information in the financial statements). For existing finance leases, the carrying amounts before transition will represent the 31 December 2018 values assigned to the right of use asset and lease liability.
The Group has made the following additional choices, as permitted by IFRS 16, for existing operating leases:
• Not to bring short term leases (12 months or fewer to run as at 1 January 2019 including reasonably certain options to extend) or low value leases on balance sheet. Costs for these items will continue to be expensed directly to the income statement.
• For all leases, the lease liability will be measured at 1 January 2019 as the present value of any future lease payments discounted using the appropriate incremental borrowing rate. The carrying value of the right of use asset for property, vessels and certain other leases will generally be measured as if the lease had been in place since commencement date. For all other leases the right of use asset will be measured as equal to the lease liability and adjusted for any accruals or prepayments already on the balance sheet. The Group will also exclude any initial direct costs (eg legal fees) from the measurement of the right of use assets at transition.
• An impairment review must be performed on right of use assets at initial application of the standard. The Group has elected to rely on its onerous lease assessments under IAS 37 ”Provisions, Contingent Liabilities and Contingent Assets”, as at 31 December 2018 as permitted by IFRS 16. Any existing onerous lease provision is set against the right of use asset carrying value upon transition.

Page 46 of 51
• To apply the use of hindsight when reviewing the lease arrangements for determination of the measurement or term of the lease under the retrospective option.
• To separate non-lease components from lease components for vessels and properties for the first time as part of the transition adjustment.
• To continue not to apply lease accounting to intangible assets. • In some cases, to apply a single discount rate to a portfolio of leases with reasonably similar characteristics.
The impact of transition to IFRS 16 on the Group’s 1 January 2019 balance sheet is expected to be an increase in lease liabilities (debt) of US$1.2 billion, an increase in right of use assets/net investments in leases of US$1.1 billion, net adjustments to other assets and liabilities of US$0.1 billion, and a charge of less than US$0.1 billion to retained earnings.
The weighted average incremental borrowing rate applied to the Group’s lease liabilities to be recognised in the balance sheet at 1 January 2019 is 4.7%.
The Group’s undiscounted non-cancellable operating lease commitments of US$1.7 billion at 31 December 2018 under IAS 17 ‘Leases’. The most significant differences between these lease commitments and the lease liability recorded on transition of US$1.3 billion will be disclosed in the Group’s 2018 Annual Report.
The lease liability of US$1.3 billion (inclusive of amounts already reported as finance leases under IAS 17) will be included in net debt as at 1 January 2019.
The Group has implemented a lease accounting system which will be used for the majority of the Group’s leases. A separate contract linked system will be used for the Group’s shipping leases.
Contracts signed after 1 January 2019 will be assessed against the lease identification criteria under IFRS 16. This may increase or decrease the number of contracts which are deemed to be leases. Practical application of IFRS 16 continues to develop and the Group continues to monitor this.
In future periods EBITDA, as disclosed in the Financial Information by Business Unit on page 12 will increase as the operating lease cost is charged against EBITDA under IAS 17 whereas under IFRS 16 the charge will be included in depreciation and interest, which are excluded from EBITDA (although included in net earnings). Short- term leasing costs and non-lease components will continue to be charged against EBITDA. In 2018, an operating lease expense of US$787 million has been recorded in net operating costs. This includes arrangements entered into and maturing during 2018 and therefore not disclosed as non-cancellable operating lease commitments at 31 December 2017. The Group has US$0.5 billion of disclosable non-cancellable operating lease commitments due within one year at 31 December 2018, approximately US$0.3 billion of which are not expected to be charged against EBITDA in 2019 as a result of implementing IFRS 16.
More detailed information on transition for IFRS 16 and progress to date on the other new accounting pronouncements will be included in the Group’s 2018 financial statements.

Page 47 of 51
Non-GAAP measures The Group presents certain non-GAAP financial measures, including underlying earnings, which are reconciled to directly comparable IFRS financial measures on page 49 of this report. These non-GAAP measures are used internally by management to assess the performance of the business and may therefore be useful to investors. They are not a substitute for the IFRS measures and should be considered alongside those measures.
Summary financial data in Australian dollars, sterling and US dollars
(a) Underlying earnings exclude net gains on disposal of businesses and other charges of US$4,830 million (2017: net gains on disposal of businesses and other charges of US$135 million), which are analysed on page 49.
(b) Basic earnings per ordinary share and basic underlying earnings per ordinary share do not recognise the dilution resulting from share options on issue.
(c) The Australian dollar and sterling amounts are based on the US dollar amounts, retranslated at average or closing rates as appropriate, except for the dividends which are the actual amounts.
2018 A$m
2017 A$m
2018 £m
2017 £m
2018 US$m
2017 US$m
57,113 54,373 31,966 32,455 Gross sales revenue 42,835 41,867 54,029 51,987 30,240 31,031 Consolidated sales revenue 40,522 40,030 24,223 16,644 13,557 9,935 Profit before tax from continuing operations 18,167 12,816 18,567 11,495 10,392 6,861 Profit for the year from continuing operations 13,925 8,851 18,184 11,379 10,178 6,792 Net earnings attributable to Rio Tinto shareholders 13,638 8,762 24,181 24,130 13,534 14,403 Underlying EBITDA 18,136 18,580 11,744 11,204 6,573 6,688 Underlying earnings(a) 8,808 8,627
1,057.6c 636.9c 592.0p 380.2p Basic earnings per ordinary share(b) 793.2c 490.4c 683.1c 627.1c 382.3p 374.3p Basic underlying earnings per ordinary share(a) (b) 512.3c 482.8c
Dividends per share to Rio Tinto shareholders(c) 399.37c 301.34c 226.25p 183.69p – paid 307.0c 235.0c 250.89c 228.53c 135.96p 129.43p – proposed - ordinary dividend 180.0c 180.0c 338.70c – 183.55p – – proposed - special dividend 243.0c – 17,523 14,949 9,807 8,923 Cash flow before financing activities 13,142 11,511
364 (4,929) 201 (2,869) Net cash/(debt) 255 (3,845) 62,409 57,322 34,398 33,366 Equity attributable to Rio Tinto shareholders 43,686 44,711

Page 48 of 51
Metal prices and exchange rates
2018 2017 Increase/
(Decrease) Metal prices - average for the year Copper – US cents/lb 297c 281c 6% Aluminium – US$/tonne $ US2,110 $ US1,969 7% Gold – US$/troy oz $ US1,269 $ US1,257 1%
Average exchange rates against the US dollar Sterling 1.34 1.29 4% Australian dollar 0.75 0.77 (3%) Canadian dollar 0.77 0.77 0% Euro 1.18 1.13 4% South African rand 0.076 0.075 1%
Year-end exchange rates against the US dollar Sterling 1.27 1.34 (5%) Australian dollar 0.70 0.78 (10%) Canadian dollar 0.73 0.79 (8%) Euro 1.14 1.20 (5%) South African rand 0.069 0.081 (15%)

Page 49 of 51
Reconciliation of net earnings to underlying earnings Underlying earnings are reported by Rio Tinto to provide greater understanding of the underlying business performance of its operations. Underlying earnings and net earnings both represent amounts attributable to owners of Rio Tinto. Exclusions from underlying earnings relating to equity accounted units are stated after tax and included in the column ‘Pre-tax’. Items (a) to (i) below are excluded from net earnings in arriving at underlying earnings.
(a) On 10 May 2018, Rio Tinto and Alcoa announced they had launched a new joint venture, Elysis, to develop and commercialise a carbon-free aluminium smelting process. Rio Tinto’s interest in the joint venture has been accounted for using the equity method. The patents contributed and intellectual property licensed to the arrangement by Rio Tinto had no carrying value, and therefore a gain has been recognised for the fair value uplift on formation of the arrangement. This gain has been reduced so that it only represents the proportion contributed by outside shareholders, resulting in a pre-tax gain of US$171 million (US$141 million after tax). On 1 August 2018, a pre-tax gain of US$1,141 million (US$836 million after tax) was recognised on the sale of the Hail Creek coal mine and a pre-tax gain of US$1,010 million (US$724 million after tax) was recognised on the sale of the Kestrel underground coal mine. On 14 December 2018, a pre-tax gain of US$128 million (US$122 million after tax) was recognised on the sale of the Dunkerque aluminium smelter. On 21 December 2018, a pre-tax gain of US$2,146 million was recognised on the sale of Grasberg. No tax is payable on this gain. Amounts relating to the sale of undeveloped properties, Winchester South and Valeria, are included within underlying earnings.
In 2017, the net gain related mainly to the sale of Coal & Allied Industries Limited, which completed on 1 September 2017. (b) Exchange gains/(losses) on external US dollar net debt and intragroup balances comprise of post-tax foreign exchange losses on US dollar
denominated net debt in non-US dollar functional currency companies of US$386 million loss and post-tax gains of US$936 million on intragroup balances, primarily as a result of the Australian and Canadian dollars both weakening against the US dollar.
Net exchange gains in 2017 comprise post-tax foreign exchange gains of US$420 million on US dollar denominated net debt, and US$908 million losses on intragroup balances.
(c) Valuation changes on currency and interest rate derivatives, which are ineligible for hedge accounting, other than those embedded in commercial contracts, and the currency revaluation of embedded US dollar derivatives contained in contracts held by entities whose functional currency is not the US dollar.
(d) Valuation changes on derivatives, embedded in commercial contracts, that are ineligible for hedge accounting, but for which there will be an offsetting change in future Group earnings. From 1 January 2018, all mark-to-market movements on commodity derivatives entered into with the commercial objective of achieving spot pricing for the underlying transaction at the date of settlement are now included within underlying earnings. In 2017 and previous years, valuation changes on this type of commodity derivative were excluded from underlying earnings. The impact of this change on the reported comparatives is insignificant, and therefore the comparatives have not been restated.
(e) The pre-feasibility study for the Argyle mine closure was completed in late 2018, resulting in an increase to the closure provision. As the assets at Argyle have been fully impaired, this increase has not been capitalised and has instead been recognised in the income statement. The impairment charge in respect of Argyle recognised in 2017 (see page 40) was based on preliminary findings from the pre-feasibility study. On this basis, the charge arising from the finalisation of this study in 2018 of US$134 million (US$93 million after tax) has been excluded from underlying earnings.
On 6 December 2018, Energy Resources of Australia (ERA) (68% owned by Rio Tinto and listed on the Australian Stock Exchange) announced a likely increase to its closure provision of A$296 million pending finalisation of the Ranger Project Area closure feasibility study. The final assessment has indicated an increase equivalent to US$242 million. As the assets of ERA have been fully impaired, this increase has not been capitalised and has instead been recognised in the income statement. There is no tax impact in respect of this item.
(f) In November 2018, Rio Tinto completed the lease and sale of a wharf and land in Kitimat. This resulted in a pre-tax gain of US$549 million on disposal of Property, plant and equipment and Other income of US$53 million (total impact of US$569 million after tax). This has been excluded from underlying earnings on the grounds of materiality.
Exclusions from underlying earnings
Pre-tax(j) 2018
US$m
Taxation 2018
US$m
Non-controlling
interests 2018
US$m
Net amount
2018 US$m
Net amount
2017 US$m
Impairment charges (page 40) (132) 25 3 (104) (481) Net gains on consolidation and disposal of interests in businesses(a) 4,622 (626) – 3,996 2,022 Exchange and derivative gains/(losses): - Exchange gains/(losses) on US dollar net debt, intragroup balances and derivatives(b) 694 (136) (8) 550 (488) - (Losses)/gains on currency and interest rate derivatives not qualifying for hedge accounting(c) (59) 11 – (48) 30 - Gains/(losses) on embedded commodity derivatives not qualifying for hedge accounting(d) 288 (83) (3) 202 (352) Losses from increases to closure estimates (non-operating and fully impaired sites)(e) (376) 41 – (335) – Gain relating to surplus land at Kitimat(f) 602 (33) – 569 – Changes in corporate tax rates in the US and France(g) – – – – (439) Rio Tinto Kennecott insurance settlement(h) – – – – 45 Tax charge relating to expected divestments(i) – – – – (202) Total excluded from underlying earnings 5,639 (801) (8) 4,830 135 Net earnings 18,167 (4,242) (287) 13,638 8,762 Underlying earnings 12,528 (3,441) (279) 8,808 8,627

Page 50 of 51
Reconciliation of net earnings to underlying earnings (continued) (g) In 2017, deferred tax assets were remeasured to reflect lower corporate income tax rates in the US and France as a result of tax legislation
changes substantively enacted in December 2017. (h) In 2017, Rio Tinto received the final settlement on the insurance claims related to the 2013 slide at Rio Tinto Kennecott’s Bingham Canyon
mine. The amounts excluded from underlying earnings were consistent with the previous excluded losses to which they related, in line with the treatment of the 2013 and 2015 settlement payments.
(i) In 2017, deferred tax assets were derecognised as a result of revised profit forecasts in France due to the expected divestments of Dunkerque and ISAL. The Dunkerque divestment completed in 2018.
(j) Exclusions from underlying earnings relating to equity accounted units are stated after tax and are included in the column “Pre-tax”.

Page 51 of 51
Contacts [email protected] riotinto.com
Follow @RioTinto on Twitter
Media Relations, United Kingdom Illtud Harri M +44 7920 503 600 David Outhwaite T +44 20 7781 1623 M +44 7787 597 493 Media Relations, Americas Matthew Klar T +1 514 608 4429 Media Relations, Asia Grant Donald T +65 6679 9290 M +65 9722 6028
Media Relations, Australia Jonathan Rose T +61 3 9283 3088 M +61 447 028 913 Matt Chambers T +61 (0) 3 9283 3087 M +61 433 525 739 Jesse Riseborough T +61 8 6211 6013 M +61 436 653 412
Investor Relations, United Kingdom John Smelt T +44 20 7781 1654 M +44 7879 642 675 David Ovington T +44 20 7781 2051 M +44 7920 010 978 Nick Parkinson M +61 436 637 571
Investor Relations, Australia Natalie Worley T +61 3 9283 3063 M +61 409 210 462 Rachel Storrs T +61 3 9283 3628 M +61 417 401 018
Rio Tinto plc 6 St James’s Square London SW1Y 4AD United Kingdom T +44 20 7781 2000 Registered in England No. 719885
Rio Tinto Limited Level 7, 360 Collins Street Melbourne 3000 Australia T +61 3 9283 3333 Registered in Australia ABN 96 004 458 404