2018 EU-wide Stress Test · LEI Code 81560097964CBDAED282 Country Code IT Un 2018 EU-wide Stress...
34
Bank Name Unione di Banche Italiane Società Per Azioni LEI Code 81560097964CBDAED282 Country Code IT Un 2018 EU-wide Stress Test
Transcript of 2018 EU-wide Stress Test · LEI Code 81560097964CBDAED282 Country Code IT Un 2018 EU-wide Stress...
Bank Name Unione di Banche Italiane Società Per Azioni
LEI Code 81560097964CBDAED282
Country Code ITUn
2018 EU-wide Stress Test
2018 EU-wide Stress Test: Summary
Unione di Banche Italiane Società Per Azioni
Actual
(starting year)
Restated
(starting year)
(mln EUR, %) 31/12/2017 31/12/2017 31/12/2018 31/12/2019 31/12/2020 31/12/2018 31/12/2019 31/12/2020
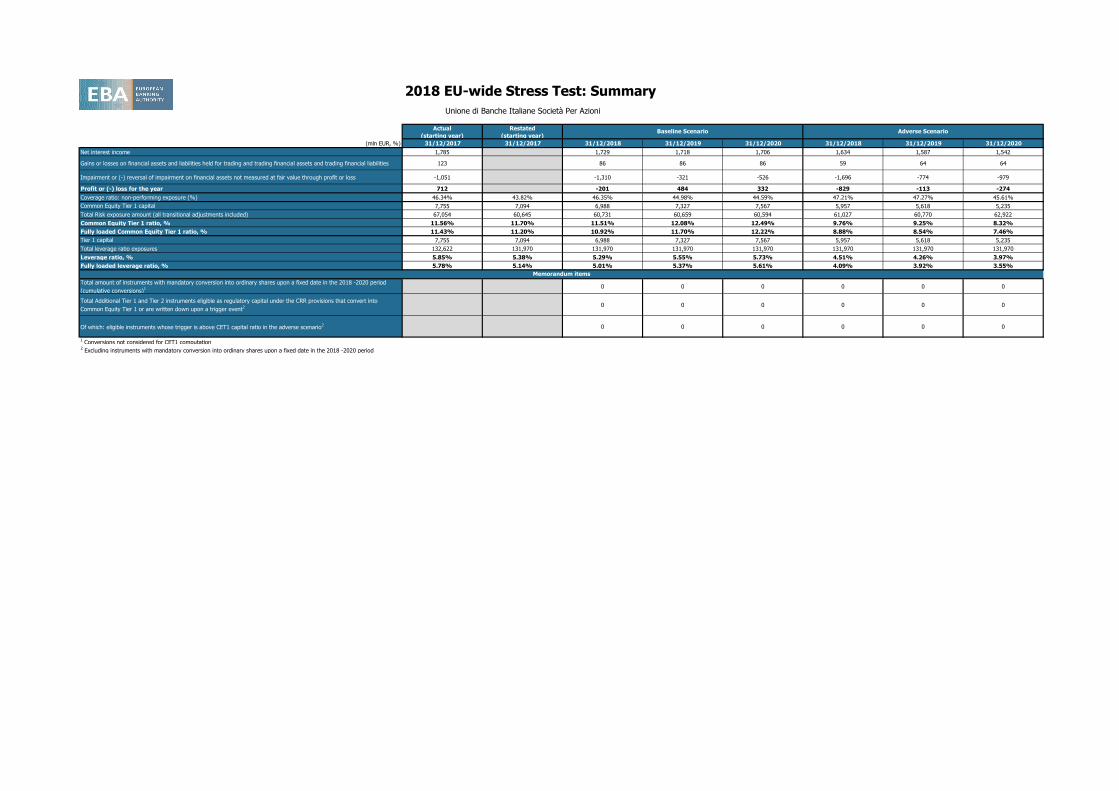
Net interest income 1,785 1,729 1,718 1,706 1,634 1,587 1,542
Gains or losses on financial assets and liabilities held for trading and trading financial assets and trading financial liabilities 123 86 86 86 59 64 64
Impairment or (-) reversal of impairment on financial assets not measured at fair value through profit or loss -1,051 -1,310 -321 -526 -1,696 -774 -979
Profit or (-) loss for the year 712 -201 484 332 -829 -113 -274
Coverage ratio: non-performing exposure (%) 46.34% 43.82% 46.35% 44.98% 44.59% 47.21% 47.27% 45.61%
Common Equity Tier 1 capital 7,755 7,094 6,988 7,327 7,567 5,957 5,618 5,235
Total Risk exposure amount (all transitional adjustments included) 67,054 60,645 60,731 60,659 60,594 61,027 60,770 62,922
Common Equity Tier 1 ratio, % 11.56% 11.70% 11.51% 12.08% 12.49% 9.76% 9.25% 8.32%
Fully loaded Common Equity Tier 1 ratio, % 11.43% 11.20% 10.92% 11.70% 12.22% 8.88% 8.54% 7.46%
Tier 1 capital 7,755 7,094 6,988 7,327 7,567 5,957 5,618 5,235
Total leverage ratio exposures 132,622 131,970 131,970 131,970 131,970 131,970 131,970 131,970
Leverage ratio, % 5.85% 5.38% 5.29% 5.55% 5.73% 4.51% 4.26% 3.97%
Fully loaded leverage ratio, % 5.78% 5.14% 5.01% 5.37% 5.61% 4.09% 3.92% 3.55%
Total amount of instruments with mandatory conversion into ordinary shares upon a fixed date in the 2018 -2020 period
(cumulative conversions)1 0 0 0 0 0 0
Total Additional Tier 1 and Tier 2 instruments eligible as regulatory capital under the CRR provisions that convert into
Common Equity Tier 1 or are written down upon a trigger event2 0 0 0 0 0 0
Of which: eligible instruments whose trigger is above CET1 capital ratio in the adverse scenario2 0 0 0 0 0 0
1 Conversions not considered for CET1 computation
2 Excluding instruments with mandatory conversion into ordinary shares upon a fixed date in the 2018 -2020 period
Baseline Scenario Adverse Scenario
Memorandum items

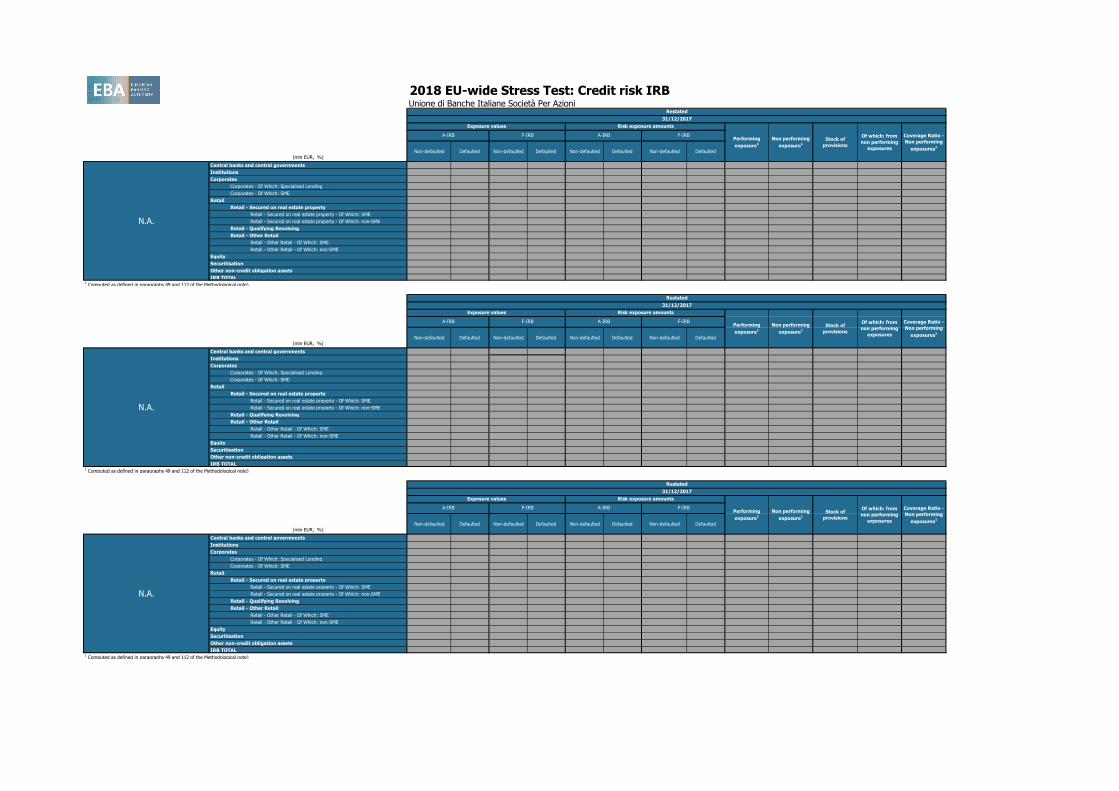
2018 EU-wide Stress Test: Credit risk IRBUnione di Banche Italiane Società Per Azioni
(mln EUR, %)Non-defaulted Defaulted Non-defaulted Defaulted Non-defaulted Defaulted Non-defaulted Defaulted
Central banks and central governments 0 0 0 0 0 0 0 0 0 0 0 0 -
Institutions 0 0 0 0 0 0 0 0 0 0 0 0 -
Corporates 32,601 5,421 0 0 18,485 1,062 0 0 32,451 5,309 2,246 2,008 37.8%
Corporates - Of Which: Specialised Lending 1,954 62 0 0 1,792 0 0 0 1,830 59 25 8 13.3%
Corporates - Of Which: SME 10,072 2,069 0 0 4,805 454 0 0 10,066 2,050 857 738 36.0%
Retail 29,468 4,038 0 0 5,279 1,505 0 0 29,457 4,031 1,822 1,665 41.3%
Retail - Secured on real estate property 25,535 3,343 0 0 4,174 1,422 0 0 25,539 3,339 1,312 1,206 36.1%
Retail - Secured on real estate property - Of Which: SME 3,360 1,413 0 0 916 553 0 0 3,361 1,412 624 593 42.0%
Retail - Secured on real estate property - Of Which: non-SME 22,175 1,930 0 0 3,258 869 0 0 22,178 1,927 689 613 31.8%
Retail - Qualifying Revolving 0 0 0 0 0 0 0 0 0 0 0 0 -
Retail - Other Retail 3,932 695 0 0 1,105 83 0 0 3,918 692 509 459 66.3%
Retail - Other Retail - Of Which: SME 3,932 695 0 0 1,105 83 0 0 3,918 692 509 459 66.3%
Retail - Other Retail - Of Which: non-SME 0 0 0 0 0 0 0 0 0 0 0 0 -
Equity 0 0 0 0 -
Securitisation
Other non-credit obligation assets 0 0 0 0 -
IRB TOTAL 62,068 9,459 0 0 23,764 2,567 0 0 61,908 9,340 4,068 3,673 39.3%1 Computed as defined in paragraphs 49 and 112 of the Methodological note)
(mln EUR, %)Non-defaulted Defaulted Non-defaulted Defaulted Non-defaulted Defaulted Non-defaulted Defaulted
Central banks and central governments 0 0 0 0 0 0 0 0 0 0 0 0 -
Institutions 0 0 0 0 0 0 0 0 0 0 0 0 -
Corporates 32,097 5,389 0 0 18,131 1,054 0 0 31,947 5,278 2,226 1,990 37.7%
Corporates - Of Which: Specialised Lending 1,927 62 0 0 1,732 0 0 0 1,803 59 24 8 13.3%
Corporates - Of Which: SME 10,062 2,059 0 0 4,801 451 0 0 10,056 2,040 855 736 36.1%
Retail 29,439 4,032 0 0 5,273 1,502 0 0 29,429 4,025 1,820 1,664 41.3%
Retail - Secured on real estate property 25,510 3,337 0 0 4,170 1,419 0 0 25,514 3,333 1,312 1,205 36.1%
Retail - Secured on real estate property - Of Which: SME 3,358 1,413 0 0 916 552 0 0 3,359 1,411 623 593 42.0%
Retail - Secured on real estate property - Of Which: non-SME 22,153 1,925 0 0 3,254 867 0 0 22,155 1,922 688 612 31.8%
Retail - Qualifying Revolving 0 0 0 0 0 0 0 0 0 0 0 0 -
Retail - Other Retail 3,929 694 0 0 1,103 83 0 0 3,915 692 509 459 66.3%
Retail - Other Retail - Of Which: SME 3,929 694 0 0 1,103 83 0 0 3,915 692 509 459 66.3%
Retail - Other Retail - Of Which: non-SME 0 0 0 0 0 0 0 0 0 0 0 0 -
Equity 0 0 0 0 -
Securitisation
Other non-credit obligation assets 0 0 0 0 -
IRB TOTAL 61,536 9,421 0 0 23,404 2,557 0 0 61,376 9,303 4,046 3,653 39.3%1 Computed as defined in paragraphs 49 and 112 of the Methodological note)
(mln EUR, %)Non-defaulted Defaulted Non-defaulted Defaulted Non-defaulted Defaulted Non-defaulted Defaulted
Central banks and central governments 0 0 0 0 0 0 0 0 0 0 0 0 -
Institutions 0 0 0 0 0 0 0 0 0 0 0 0 -
Corporates 0 0 0 0 0 0 0 0 0 0 0 0 -
Corporates - Of Which: Specialised Lending 0 0 0 0 0 0 0 0 0 0 0 0 -
Corporates - Of Which: SME 0 0 0 0 0 0 0 0 0 0 0 0 -
Retail 0 0 0 0 0 0 0 0 0 0 0 0 -
Retail - Secured on real estate property 0 0 0 0 0 0 0 0 0 0 0 0 -
Retail - Secured on real estate property - Of Which: SME 0 0 0 0 0 0 0 0 0 0 0 0 -
Retail - Secured on real estate property - Of Which: non-SME 0 0 0 0 0 0 0 0 0 0 0 0 -
Retail - Qualifying Revolving 0 0 0 0 0 0 0 0 0 0 0 0 -
Retail - Other Retail 0 0 0 0 0 0 0 0 0 0 0 0 -
Retail - Other Retail - Of Which: SME 0 0 0 0 0 0 0 0 0 0 0 0 -
Retail - Other Retail - Of Which: non-SME 0 0 0 0 0 0 0 0 0 0 0 0 -
Equity 0 0 0 0 -
Securitisation
Other non-credit obligation assets 0 0 0 0 -
IRB TOTAL 0 0 0 0 0 0 0 0 0 0 0 0 -1 Computed as defined in paragraphs 49 and 112 of the Methodological note)
Restated
31/12/2017
A-IRB F-IRB A-IRB F-IRB
Exposure values Risk exposure amounts
Performing
exposure1
Non performing
exposure1
Stock of
provisions
Of which: from
non performing
exposures
Coverage Ratio -
Non performing
exposures1
Unione di Banche Italiane
Società Per Azioni
Restated
31/12/2017
A-IRB F-IRB A-IRB F-IRB
Exposure values Risk exposure amounts
Performing
exposure1
Non performing
exposure1
Stock of
provisions
Of which: from
non performing
exposures
Coverage Ratio -
Non performing
exposures1
Italy
Restated
31/12/2017
A-IRB F-IRB A-IRB F-IRB
Exposure values Risk exposure amounts
Performing
exposure1
Non performing
exposure1
Stock of
provisions
Of which: from
non performing
exposures
Coverage Ratio -
Non performing
exposures1
N.A.

2018 EU-wide Stress Test: Credit risk IRBUnione di Banche Italiane Società Per Azioni
(mln EUR, %)Non-defaulted Defaulted Non-defaulted Defaulted Non-defaulted Defaulted Non-defaulted Defaulted
Central banks and central governments 0 0 0 0 0 0 0 0 0 0 0 0 -
Institutions 0 0 0 0 0 0 0 0 0 0 0 0 -
Corporates 0 0 0 0 0 0 0 0 0 0 0 0 -
Corporates - Of Which: Specialised Lending 0 0 0 0 0 0 0 0 0 0 0 0 -
Corporates - Of Which: SME 0 0 0 0 0 0 0 0 0 0 0 0 -
Retail 0 0 0 0 0 0 0 0 0 0 0 0 -
Retail - Secured on real estate property 0 0 0 0 0 0 0 0 0 0 0 0 -
Retail - Secured on real estate property - Of Which: SME 0 0 0 0 0 0 0 0 0 0 0 0 -
Retail - Secured on real estate property - Of Which: non-SME 0 0 0 0 0 0 0 0 0 0 0 0 -
Retail - Qualifying Revolving 0 0 0 0 0 0 0 0 0 0 0 0 -
Retail - Other Retail 0 0 0 0 0 0 0 0 0 0 0 0 -
Retail - Other Retail - Of Which: SME 0 0 0 0 0 0 0 0 0 0 0 0 -
Retail - Other Retail - Of Which: non-SME 0 0 0 0 0 0 0 0 0 0 0 0 -
Equity 0 0 0 0 -
Securitisation
Other non-credit obligation assets 0 0 0 0 -
IRB TOTAL 0 0 0 0 0 0 0 0 0 0 0 0 -1 Computed as defined in paragraphs 49 and 112 of the Methodological note)
Restated
31/12/2017
A-IRB F-IRB A-IRB F-IRB
Exposure values Risk exposure amounts
Performing
exposure1
Non performing
exposure1
Stock of
provisions
Of which: from
non performing
exposures
Coverage Ratio -
Non performing
exposures1
N.A.
Restated
31/12/2017
A-IRB F-IRB A-IRB F-IRB
Exposure values Risk exposure amounts
Performing
exposure1
Non performing
exposure1
Stock of
provisions
Of which: from
non performing
exposures
Coverage Ratio -
Non performing
exposures1
N.A.
Restated
31/12/2017
A-IRB F-IRB A-IRB F-IRB
Exposure values Risk exposure amounts
Performing
exposure1
Non performing
exposure1
Stock of
provisions
Of which: from
non performing
exposures
Coverage Ratio -
Non performing
exposures1
N.A.

2018 EU-wide Stress Test: Credit risk IRBUnione di Banche Italiane Società Per Azioni
(mln EUR, %)Non-defaulted Defaulted Non-defaulted Defaulted Non-defaulted Defaulted Non-defaulted Defaulted
Central banks and central governments 0 0 0 0 0 0 0 0 0 0 0 0 -
Institutions 0 0 0 0 0 0 0 0 0 0 0 0 -
Corporates 0 0 0 0 0 0 0 0 0 0 0 0 -
Corporates - Of Which: Specialised Lending 0 0 0 0 0 0 0 0 0 0 0 0 -
Corporates - Of Which: SME 0 0 0 0 0 0 0 0 0 0 0 0 -
Retail 0 0 0 0 0 0 0 0 0 0 0 0 -
Retail - Secured on real estate property 0 0 0 0 0 0 0 0 0 0 0 0 -
Retail - Secured on real estate property - Of Which: SME 0 0 0 0 0 0 0 0 0 0 0 0 -
Retail - Secured on real estate property - Of Which: non-SME 0 0 0 0 0 0 0 0 0 0 0 0 -
Retail - Qualifying Revolving 0 0 0 0 0 0 0 0 0 0 0 0 -
Retail - Other Retail 0 0 0 0 0 0 0 0 0 0 0 0 -
Retail - Other Retail - Of Which: SME 0 0 0 0 0 0 0 0 0 0 0 0 -
Retail - Other Retail - Of Which: non-SME 0 0 0 0 0 0 0 0 0 0 0 0 -
Equity 0 0 0 0 -
Securitisation
Other non-credit obligation assets 0 0 0 0 -
IRB TOTAL 0 0 0 0 0 0 0 0 0 0 0 0 -1 Computed as defined in paragraphs 49 and 112 of the Methodological note)
(mln EUR, %)Non-defaulted Defaulted Non-defaulted Defaulted Non-defaulted Defaulted Non-defaulted Defaulted
Central banks and central governments 0 0 0 0 0 0 0 0 0 0 0 0 -
Institutions 0 0 0 0 0 0 0 0 0 0 0 0 -
Corporates 0 0 0 0 0 0 0 0 0 0 0 0 -
Corporates - Of Which: Specialised Lending 0 0 0 0 0 0 0 0 0 0 0 0 -
Corporates - Of Which: SME 0 0 0 0 0 0 0 0 0 0 0 0 -
Retail 0 0 0 0 0 0 0 0 0 0 0 0 -
Retail - Secured on real estate property 0 0 0 0 0 0 0 0 0 0 0 0 -
Retail - Secured on real estate property - Of Which: SME 0 0 0 0 0 0 0 0 0 0 0 0 -
Retail - Secured on real estate property - Of Which: non-SME 0 0 0 0 0 0 0 0 0 0 0 0 -
Retail - Qualifying Revolving 0 0 0 0 0 0 0 0 0 0 0 0 -
Retail - Other Retail 0 0 0 0 0 0 0 0 0 0 0 0 -
Retail - Other Retail - Of Which: SME 0 0 0 0 0 0 0 0 0 0 0 0 -
Retail - Other Retail - Of Which: non-SME 0 0 0 0 0 0 0 0 0 0 0 0 -
Equity 0 0 0 0 -
Securitisation
Other non-credit obligation assets 0 0 0 0 -
IRB TOTAL 0 0 0 0 0 0 0 0 0 0 0 0 -1 Computed as defined in paragraphs 49 and 112 of the Methodological note)
Restated
31/12/2017
A-IRB F-IRB A-IRB F-IRB
Exposure values Risk exposure amounts
Performing
exposure1
Non performing
exposure1
Stock of
provisions
Of which: from
non performing
exposures
Coverage Ratio -
Non performing
exposures1
N.A.
Restated
31/12/2017
A-IRB F-IRB A-IRB F-IRB
Exposure values Risk exposure amounts
Performing
exposure1
Non performing
exposure1
Stock of
provisions
Of which: from
non performing
exposures
Coverage Ratio -
Non performing
exposures1
N.A.
(mln EUR, %)
Central banks and central governments
Institutions
Corporates
Corporates - Of Which: Specialised Lending
Corporates - Of Which: SME
Retail
Retail - Secured on real estate property
Retail - Secured on real estate property - Of Which: SME
Retail - Secured on real estate property - Of Which: non-SME
Retail - Qualifying Revolving
Retail - Other Retail
Retail - Other Retail - Of Which: SME
Retail - Other Retail - Of Which: non-SME
Equity
Securitisation
Other non-credit obligation assets
IRB TOTAL1 Computed as defined in paragraphs 49 and 112 of the Methodological note)
Unione di Banche Italiane
Società Per Azioni
Italy
N.A.
2018 EU-wide Stress Test: Credit risk IRBUnione di Banche Italiane Società Per Azioni
0 0 0 0 - 0 0 0 0 - 0 0 0 0 -
0 0 0 0 - 0 0 0 0 - 0 0 0 0 -
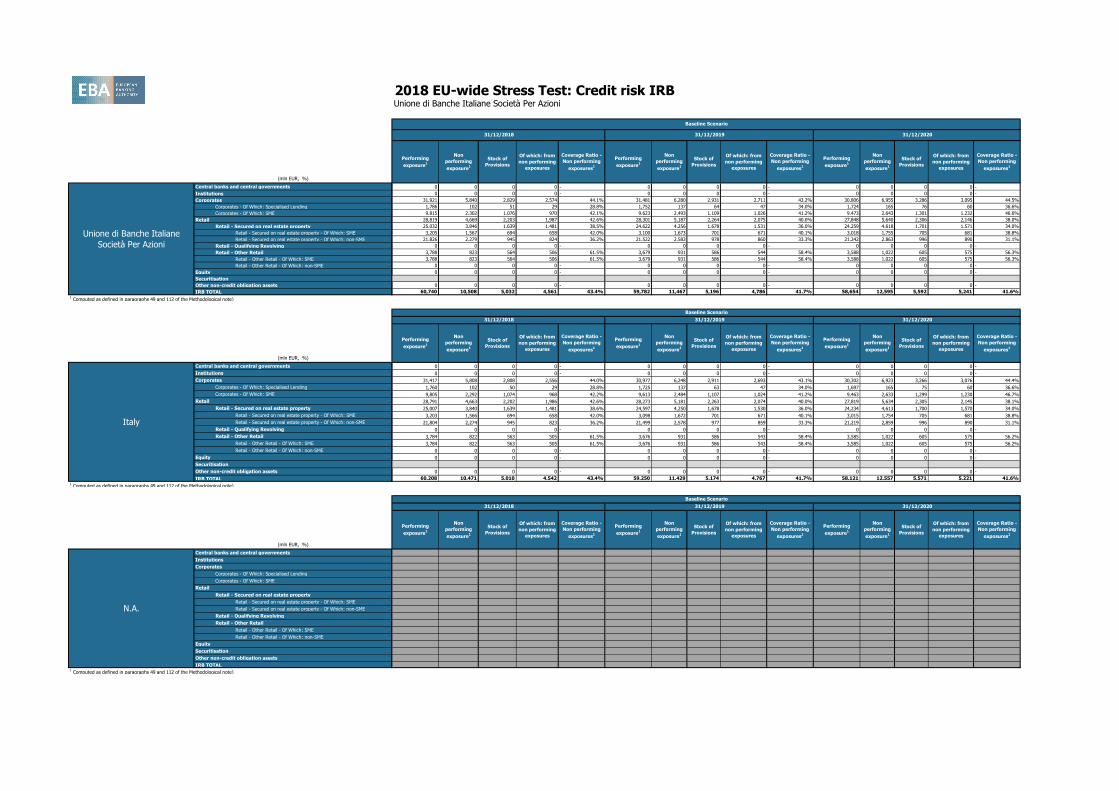
31,921 5,840 2,829 2,574 44.1% 31,481 6,280 2,931 2,711 43.2% 30,806 6,955 3,286 3,095 44.5%
1,786 102 51 29 28.8% 1,752 137 64 47 34.0% 1,724 165 76 60 36.6%
9,815 2,302 1,076 970 42.1% 9,623 2,493 1,109 1,026 41.2% 9,473 2,643 1,301 1,232 46.6%
28,819 4,669 2,203 1,987 42.6% 28,301 5,187 2,264 2,075 40.0% 27,848 5,640 2,306 2,146 38.0%
25,032 3,846 1,639 1,481 38.5% 24,622 4,256 1,678 1,531 36.0% 24,259 4,618 1,701 1,571 34.0%
3,205 1,567 694 658 42.0% 3,100 1,673 701 671 40.1% 3,018 1,755 705 681 38.8%
21,826 2,279 945 824 36.2% 21,522 2,583 978 860 33.3% 21,242 2,863 996 890 31.1%
0 0 0 0 - 0 0 0 0 - 0 0 0 0 -
3,788 823 564 506 61.5% 3,679 931 586 544 58.4% 3,588 1,022 605 575 56.3%
3,788 823 564 506 61.5% 3,679 931 586 544 58.4% 3,588 1,022 605 575 56.3%
0 0 0 0 - 0 0 0 0 - 0 0 0 0 -
0 0 0 0 - 0 0 0 0 - 0 0 0 0 -
0 0 0 0 - 0 0 0 0 - 0 0 0 0 -
60,740 10,508 5,032 4,561 43.4% 59,782 11,467 5,196 4,786 41.7% 58,654 12,595 5,592 5,241 41.6%
0 0 0 0 - 0 0 0 0 - 0 0 0 0 -
0 0 0 0 - 0 0 0 0 - 0 0 0 0 -
31,417 5,808 2,808 2,556 44.0% 30,977 6,248 2,911 2,693 43.1% 30,302 6,923 3,266 3,076 44.4%
1,760 102 50 29 28.8% 1,725 137 63 47 34.0% 1,697 165 75 60 36.6%
9,805 2,292 1,074 968 42.2% 9,613 2,484 1,107 1,024 41.2% 9,463 2,633 1,299 1,230 46.7%
28,791 4,663 2,202 1,986 42.6% 28,273 5,181 2,263 2,074 40.0% 27,819 5,634 2,305 2,145 38.1%
25,007 3,840 1,639 1,481 38.6% 24,597 4,250 1,678 1,530 36.0% 24,234 4,613 1,700 1,570 34.0%
3,203 1,566 694 658 42.0% 3,098 1,672 701 671 40.1% 3,015 1,754 705 681 38.8%
21,804 2,274 945 823 36.2% 21,499 2,578 977 859 33.3% 21,219 2,859 996 890 31.1%
0 0 0 0 - 0 0 0 0 - 0 0 0 0 -
3,784 822 563 505 61.5% 3,676 931 586 543 58.4% 3,585 1,022 605 575 56.2%
3,784 822 563 505 61.5% 3,676 931 586 543 58.4% 3,585 1,022 605 575 56.2%
0 0 0 0 - 0 0 0 0 - 0 0 0 0 -
0 0 0 0 - 0 0 0 0 - 0 0 0 0 -
0 0 0 0 - 0 0 0 0 - 0 0 0 0 -
60,208 10,471 5,010 4,542 43.4% 59,250 11,429 5,174 4,767 41.7% 58,121 12,557 5,571 5,221 41.6%
0 0 0 0 - 0 0 0 0 - 0 0 0 0 -
0 0 0 0 - 0 0 0 0 - 0 0 0 0 -
0 0 0 0 - 0 0 0 0 - 0 0 0 0 -
0 0 0 0 - 0 0 0 0 - 0 0 0 0 -
0 0 0 0 - 0 0 0 0 - 0 0 0 0 -
0 0 0 0 - 0 0 0 0 - 0 0 0 0 -
0 0 0 0 - 0 0 0 0 - 0 0 0 0 -
0 0 0 0 - 0 0 0 0 - 0 0 0 0 -
0 0 0 0 - 0 0 0 0 - 0 0 0 0 -
0 0 0 0 - 0 0 0 0 - 0 0 0 0 -
0 0 0 0 - 0 0 0 0 - 0 0 0 0 -
0 0 0 0 - 0 0 0 0 - 0 0 0 0 -
0 0 0 0 - 0 0 0 0 - 0 0 0 0 -
0 0 0 0 - 0 0 0 0 - 0 0 0 0 -
0 0 0 0 - 0 0 0 0 - 0 0 0 0 -
0 0 0 0 - 0 0 0 0 - 0 0 0 0 -
Baseline Scenario
31/12/2018 31/12/2019 31/12/2020
Performing
exposure1
Non
performing
exposure1
Stock of
Provisions
Of which: from
non performing
exposures
Coverage Ratio -
Non performing
exposures1
Performing
exposure1
Performing
exposure1
Non
performing
exposure1
Stock of
Provisions
Of which: from
non performing
exposures
Coverage Ratio -
Non performing
exposures1
Non
performing
exposure1
Stock of
Provisions
Of which: from
non performing
exposures
Coverage Ratio -
Non performing
exposures1

(mln EUR, %)
Central banks and central governments
Institutions
Corporates
Corporates - Of Which: Specialised Lending
Corporates - Of Which: SME
Retail
Retail - Secured on real estate property
Retail - Secured on real estate property - Of Which: SME
Retail - Secured on real estate property - Of Which: non-SME
Retail - Qualifying Revolving
Retail - Other Retail
Retail - Other Retail - Of Which: SME
Retail - Other Retail - Of Which: non-SME
Equity
Securitisation
Other non-credit obligation assets
IRB TOTAL1 Computed as defined in paragraphs 49 and 112 of the Methodological note)
N.A.
N.A.
N.A.
2018 EU-wide Stress Test: Credit risk IRBUnione di Banche Italiane Società Per Azioni
0 0 0 0 - 0 0 0 0 - 0 0 0 0 -
0 0 0 0 - 0 0 0 0 - 0 0 0 0 -
0 0 0 0 - 0 0 0 0 - 0 0 0 0 -
0 0 0 0 - 0 0 0 0 - 0 0 0 0 -
0 0 0 0 - 0 0 0 0 - 0 0 0 0 -
0 0 0 0 - 0 0 0 0 - 0 0 0 0 -
0 0 0 0 - 0 0 0 0 - 0 0 0 0 -
0 0 0 0 - 0 0 0 0 - 0 0 0 0 -
0 0 0 0 - 0 0 0 0 - 0 0 0 0 -
0 0 0 0 - 0 0 0 0 - 0 0 0 0 -
0 0 0 0 - 0 0 0 0 - 0 0 0 0 -
0 0 0 0 - 0 0 0 0 - 0 0 0 0 -
0 0 0 0 - 0 0 0 0 - 0 0 0 0 -
0 0 0 0 - 0 0 0 0 - 0 0 0 0 -
0 0 0 0 - 0 0 0 0 - 0 0 0 0 -
0 0 0 0 - 0 0 0 0 - 0 0 0 0 -
0 0 0 0 - 0 0 0 0 - 0 0 0 0 -
0 0 0 0 - 0 0 0 0 - 0 0 0 0 -
0 0 0 0 - 0 0 0 0 - 0 0 0 0 -
0 0 0 0 - 0 0 0 0 - 0 0 0 0 -
0 0 0 0 - 0 0 0 0 - 0 0 0 0 -
0 0 0 0 - 0 0 0 0 - 0 0 0 0 -
0 0 0 0 - 0 0 0 0 - 0 0 0 0 -
0 0 0 0 - 0 0 0 0 - 0 0 0 0 -
0 0 0 0 - 0 0 0 0 - 0 0 0 0 -
0 0 0 0 - 0 0 0 0 - 0 0 0 0 -
0 0 0 0 - 0 0 0 0 - 0 0 0 0 -
0 0 0 0 - 0 0 0 0 - 0 0 0 0 -
0 0 0 0 - 0 0 0 0 - 0 0 0 0 -
0 0 0 0 - 0 0 0 0 - 0 0 0 0 -
0 0 0 0 - 0 0 0 0 - 0 0 0 0 -
0 0 0 0 - 0 0 0 0 - 0 0 0 0 -
0 0 0 0 - 0 0 0 0 - 0 0 0 0 -
0 0 0 0 - 0 0 0 0 - 0 0 0 0 -
0 0 0 0 - 0 0 0 0 - 0 0 0 0 -
0 0 0 0 - 0 0 0 0 - 0 0 0 0 -
0 0 0 0 - 0 0 0 0 - 0 0 0 0 -
0 0 0 0 - 0 0 0 0 - 0 0 0 0 -
0 0 0 0 - 0 0 0 0 - 0 0 0 0 -
0 0 0 0 - 0 0 0 0 - 0 0 0 0 -
0 0 0 0 - 0 0 0 0 - 0 0 0 0 -
0 0 0 0 - 0 0 0 0 - 0 0 0 0 -
0 0 0 0 - 0 0 0 0 - 0 0 0 0 -
0 0 0 0 - 0 0 0 0 - 0 0 0 0 -
0 0 0 0 - 0 0 0 0 - 0 0 0 0 -
0 0 0 0 - 0 0 0 0 - 0 0 0 0 -
0 0 0 0 - 0 0 0 0 - 0 0 0 0 -
0 0 0 0 - 0 0 0 0 - 0 0 0 0 -
Baseline Scenario
31/12/2018 31/12/2019 31/12/2020
Performing
exposure1
Non
performing
exposure1
Stock of
Provisions
Of which: from
non performing
exposures
Coverage Ratio -
Non performing
exposures1
Performing
exposure1
Performing
exposure1
Non
performing
exposure1
Stock of
Provisions
Of which: from
non performing
exposures
Coverage Ratio -
Non performing
exposures1
Non
performing
exposure1
Stock of
Provisions
Of which: from
non performing
exposures
Coverage Ratio -
Non performing
exposures1

(mln EUR, %)
Central banks and central governments
Institutions
Corporates
Corporates - Of Which: Specialised Lending
Corporates - Of Which: SME
Retail
Retail - Secured on real estate property
Retail - Secured on real estate property - Of Which: SME
Retail - Secured on real estate property - Of Which: non-SME
Retail - Qualifying Revolving
Retail - Other Retail
Retail - Other Retail - Of Which: SME
Retail - Other Retail - Of Which: non-SME
Equity
Securitisation
Other non-credit obligation assets
IRB TOTAL1 Computed as defined in paragraphs 49 and 112 of the Methodological note)
N.A.
N.A.
N.A.
2018 EU-wide Stress Test: Credit risk IRBUnione di Banche Italiane Società Per Azioni
0 0 0 0 - 0 0 0 0 - 0 0 0 0 -
0 0 0 0 - 0 0 0 0 - 0 0 0 0 -
0 0 0 0 - 0 0 0 0 - 0 0 0 0 -
0 0 0 0 - 0 0 0 0 - 0 0 0 0 -
0 0 0 0 - 0 0 0 0 - 0 0 0 0 -
0 0 0 0 - 0 0 0 0 - 0 0 0 0 -
0 0 0 0 - 0 0 0 0 - 0 0 0 0 -
0 0 0 0 - 0 0 0 0 - 0 0 0 0 -
0 0 0 0 - 0 0 0 0 - 0 0 0 0 -
0 0 0 0 - 0 0 0 0 - 0 0 0 0 -
0 0 0 0 - 0 0 0 0 - 0 0 0 0 -
0 0 0 0 - 0 0 0 0 - 0 0 0 0 -
0 0 0 0 - 0 0 0 0 - 0 0 0 0 -
0 0 0 0 - 0 0 0 0 - 0 0 0 0 -
0 0 0 0 - 0 0 0 0 - 0 0 0 0 -
0 0 0 0 - 0 0 0 0 - 0 0 0 0 -
0 0 0 0 - 0 0 0 0 - 0 0 0 0 -
0 0 0 0 - 0 0 0 0 - 0 0 0 0 -
0 0 0 0 - 0 0 0 0 - 0 0 0 0 -
0 0 0 0 - 0 0 0 0 - 0 0 0 0 -
0 0 0 0 - 0 0 0 0 - 0 0 0 0 -
0 0 0 0 - 0 0 0 0 - 0 0 0 0 -
0 0 0 0 - 0 0 0 0 - 0 0 0 0 -
0 0 0 0 - 0 0 0 0 - 0 0 0 0 -
0 0 0 0 - 0 0 0 0 - 0 0 0 0 -
0 0 0 0 - 0 0 0 0 - 0 0 0 0 -
0 0 0 0 - 0 0 0 0 - 0 0 0 0 -
0 0 0 0 - 0 0 0 0 - 0 0 0 0 -
0 0 0 0 - 0 0 0 0 - 0 0 0 0 -
0 0 0 0 - 0 0 0 0 - 0 0 0 0 -
0 0 0 0 - 0 0 0 0 - 0 0 0 0 -
0 0 0 0 - 0 0 0 0 - 0 0 0 0 -
0 0 0 0 - 0 0 0 0 - 0 0 0 0 -
0 0 0 0 - 0 0 0 0 - 0 0 0 0 -
0 0 0 0 - 0 0 0 0 - 0 0 0 0 -
0 0 0 0 - 0 0 0 0 - 0 0 0 0 -
0 0 0 0 - 0 0 0 0 - 0 0 0 0 -
0 0 0 0 - 0 0 0 0 - 0 0 0 0 -
0 0 0 0 - 0 0 0 0 - 0 0 0 0 -
0 0 0 0 - 0 0 0 0 - 0 0 0 0 -
0 0 0 0 - 0 0 0 0 - 0 0 0 0 -
0 0 0 0 - 0 0 0 0 - 0 0 0 0 -
0 0 0 0 - 0 0 0 0 - 0 0 0 0 -
0 0 0 0 - 0 0 0 0 - 0 0 0 0 -
0 0 0 0 - 0 0 0 0 - 0 0 0 0 -
0 0 0 0 - 0 0 0 0 - 0 0 0 0 -
0 0 0 0 - 0 0 0 0 - 0 0 0 0 -
0 0 0 0 - 0 0 0 0 - 0 0 0 0 -
Baseline Scenario
31/12/2018 31/12/2019 31/12/2020
Performing
exposure1
Non
performing
exposure1
Stock of
Provisions
Of which: from
non performing
exposures
Coverage Ratio -
Non performing
exposures1
Performing
exposure1
Performing
exposure1
Non
performing
exposure1
Stock of
Provisions
Of which: from
non performing
exposures
Coverage Ratio -
Non performing
exposures1
Non
performing
exposure1
Stock of
Provisions
Of which: from
non performing
exposures
Coverage Ratio -
Non performing
exposures1
Baseline Scenario
31/12/2018 31/12/2019 31/12/2020
Performing
exposure1
Non
performing
exposure1
Stock of
Provisions
Of which: from
non performing
exposures
Coverage Ratio -
Non performing
exposures1
Performing
exposure1
Performing
exposure1
Non
performing
exposure1
Stock of
Provisions
Of which: from
non performing
exposures
Coverage Ratio -
Non performing
exposures1
Non
performing
exposure1
Stock of
Provisions
Of which: from
non performing
exposures
Coverage Ratio -
Non performing
exposures1
Baseline Scenario
31/12/2018 31/12/2019 31/12/2020
Performing
exposure1
Non
performing
exposure1
Stock of
Provisions
Of which: from
non performing
exposures
Coverage Ratio -
Non performing
exposures1
Performing
exposure1
Performing
exposure1
Non
performing
exposure1
Stock of
Provisions
Of which: from
non performing
exposures
Coverage Ratio -
Non performing
exposures1
Non
performing
exposure1
Stock of
Provisions
Of which: from
non performing
exposures
Coverage Ratio -
Non performing
exposures1
(mln EUR, %)
Central banks and central governments
Institutions
Corporates
Corporates - Of Which: Specialised Lending
Corporates - Of Which: SME
Retail
Retail - Secured on real estate property
Retail - Secured on real estate property - Of Which: SME
Retail - Secured on real estate property - Of Which: non-SME
Retail - Qualifying Revolving
Retail - Other Retail
Retail - Other Retail - Of Which: SME
Retail - Other Retail - Of Which: non-SME
Equity
Securitisation
Other non-credit obligation assets
IRB TOTAL1 Computed as defined in paragraphs 49 and 112 of the Methodological note)
N.A.
N.A.
2018 EU-wide Stress Test: Credit risk IRBUnione di Banche Italiane Società Per Azioni
0 0 0 0 - 0 0 0 0 - 0 0 0 0 -
0 0 0 0 - 0 0 0 0 - 0 0 0 0 -
0 0 0 0 - 0 0 0 0 - 0 0 0 0 -
0 0 0 0 - 0 0 0 0 - 0 0 0 0 -
0 0 0 0 - 0 0 0 0 - 0 0 0 0 -
0 0 0 0 - 0 0 0 0 - 0 0 0 0 -
0 0 0 0 - 0 0 0 0 - 0 0 0 0 -
0 0 0 0 - 0 0 0 0 - 0 0 0 0 -
0 0 0 0 - 0 0 0 0 - 0 0 0 0 -
0 0 0 0 - 0 0 0 0 - 0 0 0 0 -
0 0 0 0 - 0 0 0 0 - 0 0 0 0 -
0 0 0 0 - 0 0 0 0 - 0 0 0 0 -
0 0 0 0 - 0 0 0 0 - 0 0 0 0 -
0 0 0 0 - 0 0 0 0 - 0 0 0 0 -
0 0 0 0 - 0 0 0 0 - 0 0 0 0 -
0 0 0 0 - 0 0 0 0 - 0 0 0 0 -
0 0 0 0 - 0 0 0 0 - 0 0 0 0 -
0 0 0 0 - 0 0 0 0 - 0 0 0 0 -
0 0 0 0 - 0 0 0 0 - 0 0 0 0 -
0 0 0 0 - 0 0 0 0 - 0 0 0 0 -
0 0 0 0 - 0 0 0 0 - 0 0 0 0 -
0 0 0 0 - 0 0 0 0 - 0 0 0 0 -
0 0 0 0 - 0 0 0 0 - 0 0 0 0 -
0 0 0 0 - 0 0 0 0 - 0 0 0 0 -
0 0 0 0 - 0 0 0 0 - 0 0 0 0 -
0 0 0 0 - 0 0 0 0 - 0 0 0 0 -
0 0 0 0 - 0 0 0 0 - 0 0 0 0 -
0 0 0 0 - 0 0 0 0 - 0 0 0 0 -
0 0 0 0 - 0 0 0 0 - 0 0 0 0 -
0 0 0 0 - 0 0 0 0 - 0 0 0 0 -
0 0 0 0 - 0 0 0 0 - 0 0 0 0 -
0 0 0 0 - 0 0 0 0 - 0 0 0 0 -
Baseline Scenario
31/12/2018 31/12/2019 31/12/2020
Performing
exposure1
Non
performing
exposure1
Stock of
Provisions
Of which: from
non performing
exposures
Coverage Ratio -
Non performing
exposures1
Performing
exposure1
Performing
exposure1
Non
performing
exposure1
Stock of
Provisions
Of which: from
non performing
exposures
Coverage Ratio -
Non performing
exposures1
Non
performing
exposure1
Stock of
Provisions
Of which: from
non performing
exposures
Coverage Ratio -
Non performing
exposures1
(mln EUR, %)
Central banks and central governments
Institutions
Corporates
Corporates - Of Which: Specialised Lending
Corporates - Of Which: SME
Retail
Retail - Secured on real estate property
Retail - Secured on real estate property - Of Which: SME
Retail - Secured on real estate property - Of Which: non-SME
Retail - Qualifying Revolving
Retail - Other Retail
Retail - Other Retail - Of Which: SME
Retail - Other Retail - Of Which: non-SME
Equity
Securitisation
Other non-credit obligation assets
IRB TOTAL1 Computed as defined in paragraphs 49 and 112 of the Methodological note)
Unione di Banche Italiane
Società Per Azioni
Italy
N.A.
2018 EU-wide Stress Test: Credit risk IRBUnione di Banche Italiane Società Per Azioni
0 0 0 0 - 0 0 0 0 - 0 0 0 0 -
0 0 0 0 - 0 0 0 0 - 0 0 0 0 -
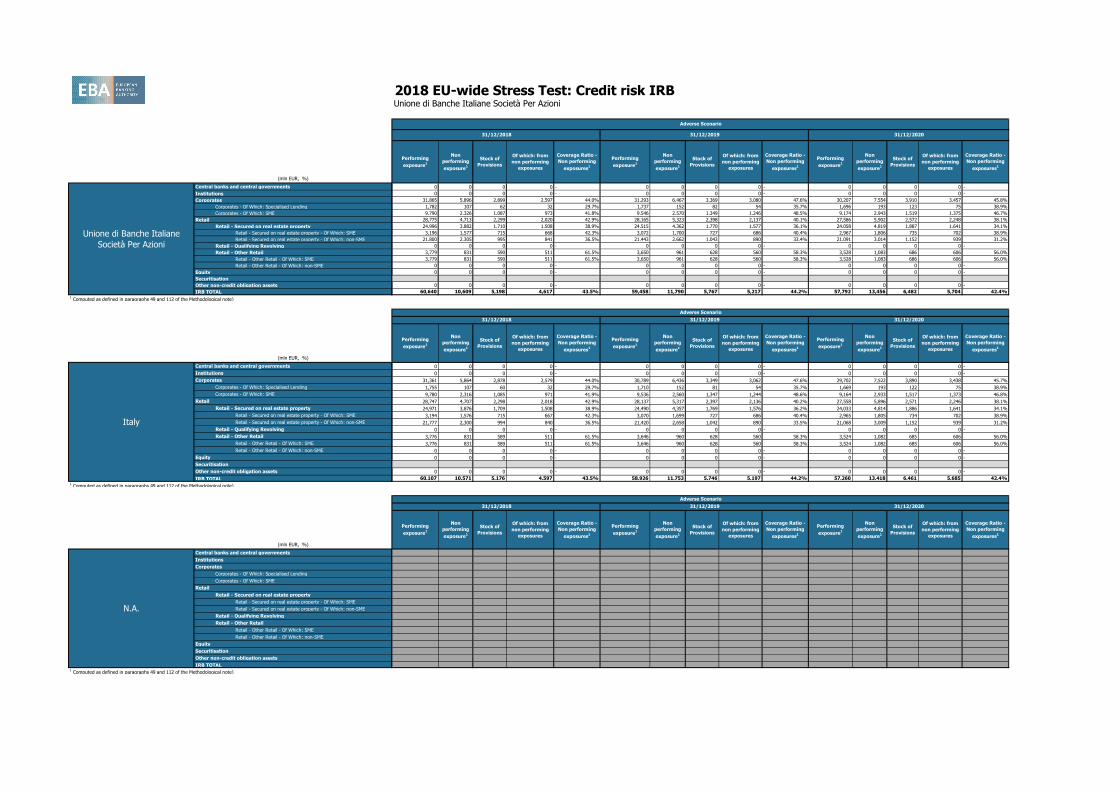
31,865 5,896 2,899 2,597 44.0% 31,293 6,467 3,369 3,080 47.6% 30,207 7,554 3,910 3,457 45.8%
1,782 107 62 32 29.7% 1,737 152 82 54 35.7% 1,696 193 123 75 38.9%
9,790 2,326 1,087 973 41.8% 9,546 2,570 1,349 1,246 48.5% 9,174 2,943 1,519 1,375 46.7%
28,775 4,713 2,299 2,020 42.9% 28,165 5,323 2,398 2,137 40.1% 27,586 5,902 2,572 2,248 38.1%
24,996 3,882 1,710 1,508 38.9% 24,515 4,362 1,770 1,577 36.1% 24,058 4,819 1,887 1,641 34.1%
3,196 1,577 715 668 42.3% 3,072 1,700 727 686 40.4% 2,967 1,806 735 702 38.9%
21,800 2,305 995 841 36.5% 21,443 2,662 1,043 890 33.4% 21,091 3,014 1,152 939 31.2%
0 0 0 0 - 0 0 0 0 - 0 0 0 0 -
3,779 831 590 511 61.5% 3,650 961 628 560 58.3% 3,528 1,083 686 606 56.0%
3,779 831 590 511 61.5% 3,650 961 628 560 58.3% 3,528 1,083 686 606 56.0%
0 0 0 0 - 0 0 0 0 - 0 0 0 0 -
0 0 0 0 - 0 0 0 0 - 0 0 0 0 -
0 0 0 0 - 0 0 0 0 - 0 0 0 0 -
60,640 10,609 5,198 4,617 43.5% 59,458 11,790 5,767 5,217 44.2% 57,792 13,456 6,482 5,704 42.4%
0 0 0 0 - 0 0 0 0 - 0 0 0 0 -
0 0 0 0 - 0 0 0 0 - 0 0 0 0 -
31,361 5,864 2,878 2,579 44.0% 30,789 6,436 3,349 3,062 47.6% 29,702 7,522 3,890 3,438 45.7%
1,755 107 60 32 29.7% 1,710 152 81 54 35.7% 1,669 193 122 75 38.9%
9,780 2,316 1,085 971 41.9% 9,536 2,560 1,347 1,244 48.6% 9,164 2,933 1,517 1,373 46.8%
28,747 4,707 2,298 2,018 42.9% 28,137 5,317 2,397 2,136 40.2% 27,558 5,896 2,571 2,246 38.1%
24,971 3,876 1,709 1,508 38.9% 24,490 4,357 1,769 1,576 36.2% 24,033 4,814 1,886 1,641 34.1%
3,194 1,576 715 667 42.3% 3,070 1,699 727 686 40.4% 2,965 1,805 734 702 38.9%
21,777 2,300 994 840 36.5% 21,420 2,658 1,042 890 33.5% 21,068 3,009 1,152 939 31.2%
0 0 0 0 - 0 0 0 0 - 0 0 0 0 -
3,776 831 589 511 61.5% 3,646 960 628 560 58.3% 3,524 1,082 685 606 56.0%
3,776 831 589 511 61.5% 3,646 960 628 560 58.3% 3,524 1,082 685 606 56.0%
0 0 0 0 - 0 0 0 0 - 0 0 0 0 -
0 0 0 0 - 0 0 0 0 - 0 0 0 0 -
0 0 0 0 - 0 0 0 0 - 0 0 0 0 -
60,107 10,571 5,176 4,597 43.5% 58,926 11,753 5,746 5,197 44.2% 57,260 13,418 6,461 5,685 42.4%
0 0 0 0 - 0 0 0 0 - 0 0 0 0 -
0 0 0 0 - 0 0 0 0 - 0 0 0 0 -
0 0 0 0 - 0 0 0 0 - 0 0 0 0 -
0 0 0 0 - 0 0 0 0 - 0 0 0 0 -
0 0 0 0 - 0 0 0 0 - 0 0 0 0 -
0 0 0 0 - 0 0 0 0 - 0 0 0 0 -
0 0 0 0 - 0 0 0 0 - 0 0 0 0 -
0 0 0 0 - 0 0 0 0 - 0 0 0 0 -
0 0 0 0 - 0 0 0 0 - 0 0 0 0 -
0 0 0 0 - 0 0 0 0 - 0 0 0 0 -
0 0 0 0 - 0 0 0 0 - 0 0 0 0 -
0 0 0 0 - 0 0 0 0 - 0 0 0 0 -
0 0 0 0 - 0 0 0 0 - 0 0 0 0 -
0 0 0 0 - 0 0 0 0 - 0 0 0 0 -
0 0 0 0 - 0 0 0 0 - 0 0 0 0 -
0 0 0 0 - 0 0 0 0 - 0 0 0 0 -
Adverse Scenario
31/12/2018 31/12/2019 31/12/2020
Coverage Ratio -
Non performing
exposures1
Of which: from
non performing
exposures
Coverage Ratio -
Non performing
exposures1
Performing
exposure1
Non
performing
exposure1
Stock of
Provisions
Of which: from
non performing
exposures
Stock of
Provisions
Of which: from
non performing
exposures
Coverage Ratio -
Non performing
exposures1
Performing
exposure1
Non
performing
exposure1
Stock of
Provisions
Performing
exposure1
Non
performing
exposure1

(mln EUR, %)
Central banks and central governments
Institutions
Corporates
Corporates - Of Which: Specialised Lending
Corporates - Of Which: SME
Retail
Retail - Secured on real estate property
Retail - Secured on real estate property - Of Which: SME
Retail - Secured on real estate property - Of Which: non-SME
Retail - Qualifying Revolving
Retail - Other Retail
Retail - Other Retail - Of Which: SME
Retail - Other Retail - Of Which: non-SME
Equity
Securitisation
Other non-credit obligation assets
IRB TOTAL1 Computed as defined in paragraphs 49 and 112 of the Methodological note)
N.A.
N.A.
N.A.
2018 EU-wide Stress Test: Credit risk IRBUnione di Banche Italiane Società Per Azioni
0 0 0 0 - 0 0 0 0 - 0 0 0 0 -
0 0 0 0 - 0 0 0 0 - 0 0 0 0 -
0 0 0 0 - 0 0 0 0 - 0 0 0 0 -
0 0 0 0 - 0 0 0 0 - 0 0 0 0 -
0 0 0 0 - 0 0 0 0 - 0 0 0 0 -
0 0 0 0 - 0 0 0 0 - 0 0 0 0 -
0 0 0 0 - 0 0 0 0 - 0 0 0 0 -
0 0 0 0 - 0 0 0 0 - 0 0 0 0 -
0 0 0 0 - 0 0 0 0 - 0 0 0 0 -
0 0 0 0 - 0 0 0 0 - 0 0 0 0 -
0 0 0 0 - 0 0 0 0 - 0 0 0 0 -
0 0 0 0 - 0 0 0 0 - 0 0 0 0 -
0 0 0 0 - 0 0 0 0 - 0 0 0 0 -
0 0 0 0 - 0 0 0 0 - 0 0 0 0 -
0 0 0 0 - 0 0 0 0 - 0 0 0 0 -
0 0 0 0 - 0 0 0 0 - 0 0 0 0 -
0 0 0 0 - 0 0 0 0 - 0 0 0 0 -
0 0 0 0 - 0 0 0 0 - 0 0 0 0 -
0 0 0 0 - 0 0 0 0 - 0 0 0 0 -
0 0 0 0 - 0 0 0 0 - 0 0 0 0 -
0 0 0 0 - 0 0 0 0 - 0 0 0 0 -
0 0 0 0 - 0 0 0 0 - 0 0 0 0 -
0 0 0 0 - 0 0 0 0 - 0 0 0 0 -
0 0 0 0 - 0 0 0 0 - 0 0 0 0 -
0 0 0 0 - 0 0 0 0 - 0 0 0 0 -
0 0 0 0 - 0 0 0 0 - 0 0 0 0 -
0 0 0 0 - 0 0 0 0 - 0 0 0 0 -
0 0 0 0 - 0 0 0 0 - 0 0 0 0 -
0 0 0 0 - 0 0 0 0 - 0 0 0 0 -
0 0 0 0 - 0 0 0 0 - 0 0 0 0 -
0 0 0 0 - 0 0 0 0 - 0 0 0 0 -
0 0 0 0 - 0 0 0 0 - 0 0 0 0 -
0 0 0 0 - 0 0 0 0 - 0 0 0 0 -
0 0 0 0 - 0 0 0 0 - 0 0 0 0 -
0 0 0 0 - 0 0 0 0 - 0 0 0 0 -
0 0 0 0 - 0 0 0 0 - 0 0 0 0 -
0 0 0 0 - 0 0 0 0 - 0 0 0 0 -
0 0 0 0 - 0 0 0 0 - 0 0 0 0 -
0 0 0 0 - 0 0 0 0 - 0 0 0 0 -
0 0 0 0 - 0 0 0 0 - 0 0 0 0 -
0 0 0 0 - 0 0 0 0 - 0 0 0 0 -
0 0 0 0 - 0 0 0 0 - 0 0 0 0 -
0 0 0 0 - 0 0 0 0 - 0 0 0 0 -
0 0 0 0 - 0 0 0 0 - 0 0 0 0 -
0 0 0 0 - 0 0 0 0 - 0 0 0 0 -
0 0 0 0 - 0 0 0 0 - 0 0 0 0 -
0 0 0 0 - 0 0 0 0 - 0 0 0 0 -
0 0 0 0 - 0 0 0 0 - 0 0 0 0 -
Adverse Scenario
31/12/2018 31/12/2019 31/12/2020
Coverage Ratio -
Non performing
exposures1
Of which: from
non performing
exposures
Coverage Ratio -
Non performing
exposures1
Performing
exposure1
Non
performing
exposure1
Stock of
Provisions
Of which: from
non performing
exposures
Stock of
Provisions
Of which: from
non performing
exposures
Coverage Ratio -
Non performing
exposures1
Performing
exposure1
Non
performing
exposure1
Stock of
Provisions
Performing
exposure1
Non
performing
exposure1

(mln EUR, %)
Central banks and central governments
Institutions
Corporates
Corporates - Of Which: Specialised Lending
Corporates - Of Which: SME
Retail
Retail - Secured on real estate property
Retail - Secured on real estate property - Of Which: SME
Retail - Secured on real estate property - Of Which: non-SME
Retail - Qualifying Revolving
Retail - Other Retail
Retail - Other Retail - Of Which: SME
Retail - Other Retail - Of Which: non-SME
Equity
Securitisation
Other non-credit obligation assets
IRB TOTAL1 Computed as defined in paragraphs 49 and 112 of the Methodological note)
N.A.
N.A.
N.A.
2018 EU-wide Stress Test: Credit risk IRBUnione di Banche Italiane Società Per Azioni
0 0 0 0 - 0 0 0 0 - 0 0 0 0 -
0 0 0 0 - 0 0 0 0 - 0 0 0 0 -
0 0 0 0 - 0 0 0 0 - 0 0 0 0 -
0 0 0 0 - 0 0 0 0 - 0 0 0 0 -
0 0 0 0 - 0 0 0 0 - 0 0 0 0 -
0 0 0 0 - 0 0 0 0 - 0 0 0 0 -
0 0 0 0 - 0 0 0 0 - 0 0 0 0 -
0 0 0 0 - 0 0 0 0 - 0 0 0 0 -
0 0 0 0 - 0 0 0 0 - 0 0 0 0 -
0 0 0 0 - 0 0 0 0 - 0 0 0 0 -
0 0 0 0 - 0 0 0 0 - 0 0 0 0 -
0 0 0 0 - 0 0 0 0 - 0 0 0 0 -
0 0 0 0 - 0 0 0 0 - 0 0 0 0 -
0 0 0 0 - 0 0 0 0 - 0 0 0 0 -
0 0 0 0 - 0 0 0 0 - 0 0 0 0 -
0 0 0 0 - 0 0 0 0 - 0 0 0 0 -
0 0 0 0 - 0 0 0 0 - 0 0 0 0 -
0 0 0 0 - 0 0 0 0 - 0 0 0 0 -
0 0 0 0 - 0 0 0 0 - 0 0 0 0 -
0 0 0 0 - 0 0 0 0 - 0 0 0 0 -
0 0 0 0 - 0 0 0 0 - 0 0 0 0 -
0 0 0 0 - 0 0 0 0 - 0 0 0 0 -
0 0 0 0 - 0 0 0 0 - 0 0 0 0 -
0 0 0 0 - 0 0 0 0 - 0 0 0 0 -
0 0 0 0 - 0 0 0 0 - 0 0 0 0 -
0 0 0 0 - 0 0 0 0 - 0 0 0 0 -
0 0 0 0 - 0 0 0 0 - 0 0 0 0 -
0 0 0 0 - 0 0 0 0 - 0 0 0 0 -
0 0 0 0 - 0 0 0 0 - 0 0 0 0 -
0 0 0 0 - 0 0 0 0 - 0 0 0 0 -
0 0 0 0 - 0 0 0 0 - 0 0 0 0 -
0 0 0 0 - 0 0 0 0 - 0 0 0 0 -
0 0 0 0 - 0 0 0 0 - 0 0 0 0 -
0 0 0 0 - 0 0 0 0 - 0 0 0 0 -
0 0 0 0 - 0 0 0 0 - 0 0 0 0 -
0 0 0 0 - 0 0 0 0 - 0 0 0 0 -
0 0 0 0 - 0 0 0 0 - 0 0 0 0 -
0 0 0 0 - 0 0 0 0 - 0 0 0 0 -
0 0 0 0 - 0 0 0 0 - 0 0 0 0 -
0 0 0 0 - 0 0 0 0 - 0 0 0 0 -
0 0 0 0 - 0 0 0 0 - 0 0 0 0 -
0 0 0 0 - 0 0 0 0 - 0 0 0 0 -
0 0 0 0 - 0 0 0 0 - 0 0 0 0 -
0 0 0 0 - 0 0 0 0 - 0 0 0 0 -
0 0 0 0 - 0 0 0 0 - 0 0 0 0 -
0 0 0 0 - 0 0 0 0 - 0 0 0 0 -
0 0 0 0 - 0 0 0 0 - 0 0 0 0 -
0 0 0 0 - 0 0 0 0 - 0 0 0 0 -
Adverse Scenario
31/12/2018 31/12/2019 31/12/2020
Coverage Ratio -
Non performing
exposures1
Of which: from
non performing
exposures
Coverage Ratio -
Non performing
exposures1
Performing
exposure1
Non
performing
exposure1
Stock of
Provisions
Of which: from
non performing
exposures
Stock of
Provisions
Of which: from
non performing
exposures
Coverage Ratio -
Non performing
exposures1
Performing
exposure1
Non
performing
exposure1
Stock of
Provisions
Performing
exposure1
Non
performing
exposure1
Adverse Scenario
31/12/2018 31/12/2019 31/12/2020
Coverage Ratio -
Non performing
exposures1
Of which: from
non performing
exposures
Coverage Ratio -
Non performing
exposures1
Performing
exposure1
Non
performing
exposure1
Stock of
Provisions
Of which: from
non performing
exposures
Stock of
Provisions
Of which: from
non performing
exposures
Coverage Ratio -
Non performing
exposures1
Performing
exposure1
Non
performing
exposure1
Stock of
Provisions
Performing
exposure1
Non
performing
exposure1
Adverse Scenario
31/12/2018 31/12/2019 31/12/2020
Coverage Ratio -
Non performing
exposures1
Of which: from
non performing
exposures
Coverage Ratio -
Non performing
exposures1
Performing
exposure1
Non
performing
exposure1
Stock of
Provisions
Of which: from
non performing
exposures
Stock of
Provisions
Of which: from
non performing
exposures
Coverage Ratio -
Non performing
exposures1
Performing
exposure1
Non
performing
exposure1
Stock of
Provisions
Performing
exposure1
Non
performing
exposure1

(mln EUR, %)
Central banks and central governments
Institutions
Corporates
Corporates - Of Which: Specialised Lending
Corporates - Of Which: SME
Retail
Retail - Secured on real estate property
Retail - Secured on real estate property - Of Which: SME
Retail - Secured on real estate property - Of Which: non-SME
Retail - Qualifying Revolving
Retail - Other Retail
Retail - Other Retail - Of Which: SME
Retail - Other Retail - Of Which: non-SME
Equity
Securitisation
Other non-credit obligation assets
IRB TOTAL1 Computed as defined in paragraphs 49 and 112 of the Methodological note)
(mln EUR, %)
Central banks and central governments
Institutions
Corporates
Corporates - Of Which: Specialised Lending
Corporates - Of Which: SME
Retail
Retail - Secured on real estate property
Retail - Secured on real estate property - Of Which: SME
Retail - Secured on real estate property - Of Which: non-SME
Retail - Qualifying Revolving
Retail - Other Retail
Retail - Other Retail - Of Which: SME
Retail - Other Retail - Of Which: non-SME
Equity
Securitisation
Other non-credit obligation assets
IRB TOTAL1 Computed as defined in paragraphs 49 and 112 of the Methodological note)
N.A.
N.A.
2018 EU-wide Stress Test: Credit risk IRBUnione di Banche Italiane Società Per Azioni
0 0 0 0 - 0 0 0 0 - 0 0 0 0 -
0 0 0 0 - 0 0 0 0 - 0 0 0 0 -
0 0 0 0 - 0 0 0 0 - 0 0 0 0 -
0 0 0 0 - 0 0 0 0 - 0 0 0 0 -
0 0 0 0 - 0 0 0 0 - 0 0 0 0 -
0 0 0 0 - 0 0 0 0 - 0 0 0 0 -
0 0 0 0 - 0 0 0 0 - 0 0 0 0 -
0 0 0 0 - 0 0 0 0 - 0 0 0 0 -
0 0 0 0 - 0 0 0 0 - 0 0 0 0 -
0 0 0 0 - 0 0 0 0 - 0 0 0 0 -
0 0 0 0 - 0 0 0 0 - 0 0 0 0 -
0 0 0 0 - 0 0 0 0 - 0 0 0 0 -
0 0 0 0 - 0 0 0 0 - 0 0 0 0 -
0 0 0 0 - 0 0 0 0 - 0 0 0 0 -
0 0 0 0 - 0 0 0 0 - 0 0 0 0 -
0 0 0 0 - 0 0 0 0 - 0 0 0 0 -
0 0 0 0 - 0 0 0 0 - 0 0 0 0 -
0 0 0 0 - 0 0 0 0 - 0 0 0 0 -
0 0 0 0 - 0 0 0 0 - 0 0 0 0 -
0 0 0 0 - 0 0 0 0 - 0 0 0 0 -
0 0 0 0 - 0 0 0 0 - 0 0 0 0 -
0 0 0 0 - 0 0 0 0 - 0 0 0 0 -
0 0 0 0 - 0 0 0 0 - 0 0 0 0 -
0 0 0 0 - 0 0 0 0 - 0 0 0 0 -
0 0 0 0 - 0 0 0 0 - 0 0 0 0 -
0 0 0 0 - 0 0 0 0 - 0 0 0 0 -
0 0 0 0 - 0 0 0 0 - 0 0 0 0 -
0 0 0 0 - 0 0 0 0 - 0 0 0 0 -
0 0 0 0 - 0 0 0 0 - 0 0 0 0 -
0 0 0 0 - 0 0 0 0 - 0 0 0 0 -
0 0 0 0 - 0 0 0 0 - 0 0 0 0 -
0 0 0 0 - 0 0 0 0 - 0 0 0 0 -
Adverse Scenario
31/12/2018 31/12/2019 31/12/2020
Coverage Ratio -
Non performing
exposures1
Of which: from
non performing
exposures
Coverage Ratio -
Non performing
exposures1
Performing
exposure1
Non
performing
exposure1
Stock of
Provisions
Of which: from
non performing
exposures
Stock of
Provisions
Of which: from
non performing
exposures
Coverage Ratio -
Non performing
exposures1
Performing
exposure1
Non
performing
exposure1
Stock of
Provisions
Performing
exposure1
Non
performing
exposure1

2018 EU-wide Stress Test: Credit risk STAUnione di Banche Italiane Società Per Azioni
(mln EUR, %)
Non-defaulted Defaulted Non-defaulted Defaulted
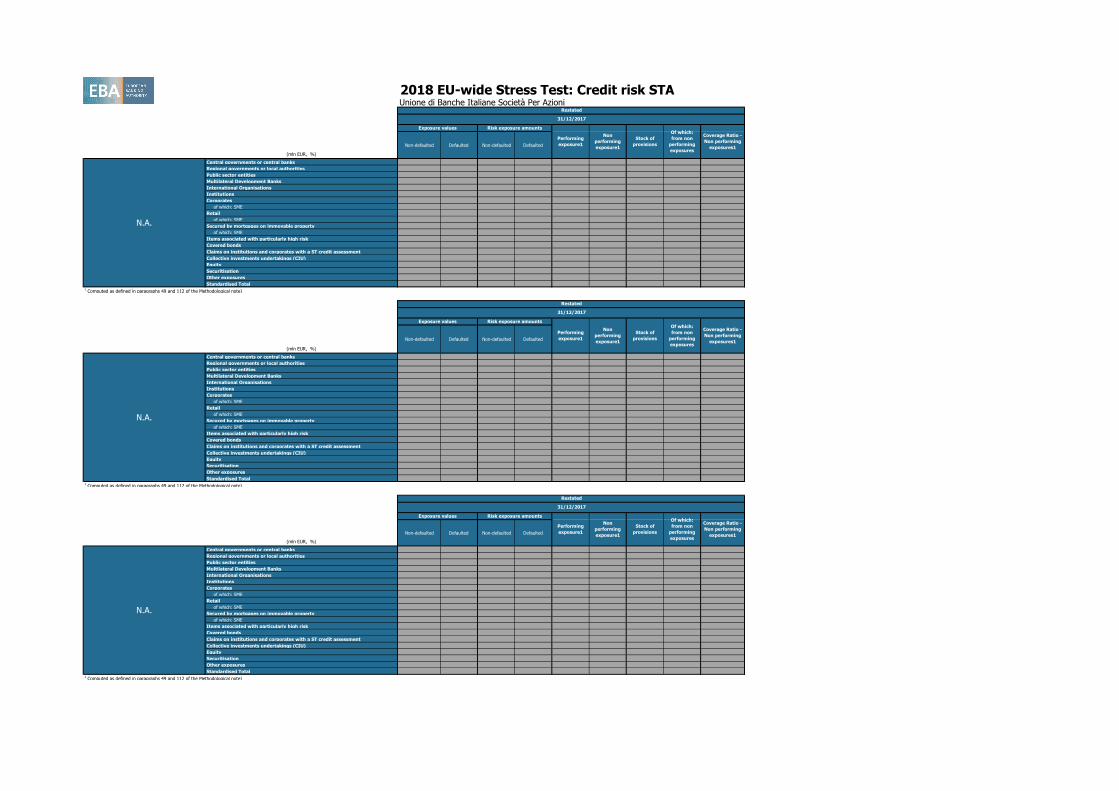
Central governments or central banks 24,284 58 2,813 3 14,605 58 3 1 1.1%
Regional governments or local authorities 728 35 145 42 726 45 14 10 22.8%
Public sector entities 380 2 154 2 381 4 3 2 57.6%
Multilateral Development Banks 0 0 0 0 0 0 0 0 0.0%
International Organisations 0 0 0 0 0 0 0 0 0.0%
Institutions 4,027 58 1,718 28 3,229 64 17 7 10.5%
Corporates 9,763 574 8,965 670 9,018 1,060 596 519 48.9%
of which: SME 2,798 122 2,711 145 2,763 220 160 115 52.1%
Retail 8,135 230 5,698 306 8,399 1,139 1,003 921 80.9%
of which: SME 2,754 180 1,688 225 2,795 495 375 326 65.8%
Secured by mortgages on immovable property 5,101 1,264 2,136 1,532 5,163 2,245 1,046 988 44.0%
of which: SME 1,275 1,099 622 1,323 1,315 1,574 517 481 30.5%
Items associated with particularly high risk 12 0 19 0 4 0 0 0 0.0%
Covered bonds 5 0 1 0 0 0 0 0 0.0%
Claims on institutions and corporates with a ST credit assessment 0 0 0 0 0 0 0 0 0.0%
Collective investments undertakings (CIU) 225 0 672 0 5 0 0 0 0.0%
Equity 1,438 0 405 0 0 0 0.0%
Securitisation
Other exposures 2,154 3 3,502 17 2 1 8.5%
Standardised Total 57,022 2,234 25,912 2,585 45,435 4,632 2,684 2,450 52.9%1 Computed as defined in paragraphs 49 and 112 of the Methodological note)
(mln EUR, %)
Non-defaulted Defaulted Non-defaulted Defaulted
Central governments or central banks 21,469 58 2,706 3 14,456 58 3 1 1.1%
Regional governments or local authorities 728 35 145 42 726 45 14 10 22.8%
Public sector entities 336 2 109 2 336 4 3 2 57.6%
Multilateral Development Banks 0 0 0 0 0 0 0 0 0.0%
International Organisations 0 0 0 0 0 0 0 0 0.0%
Institutions 1,033 53 1,074 20 2,197 58 15 5 8.5%
Corporates 8,357 463 7,802 506 8,197 921 556 490 53.2%
of which: SME 2,715 122 2,628 145 2,680 220 160 115 52.1%
Retail 8,082 229 5,663 305 8,344 1,134 999 918 80.9%
of which: SME 2,718 180 1,666 225 2,759 495 374 325 65.8%
Secured by mortgages on immovable property 5,089 1,259 2,131 1,527 5,151 2,234 1,039 981 43.9%
of which: SME 1,275 1,099 622 1,323 1,315 1,574 517 481 30.5%
Items associated with particularly high risk 12 0 19 0 4 0 0 0 0.0%
Covered bonds 5 0 1 0 0 0 0 0 0.0%
Claims on institutions and corporates with a ST credit assessment 0 0 0 0 0 0 0 0 0.0%
Collective investments undertakings (CIU) 225 0 672 0 5 0 0 0 0.0%
Equity 405 0 0 0 0.0%
Securitisation
Other exposures 3,498 17 2 1 8.5%
Standardised Total 49,691 2,114 23,908 2,408 43,318 4,471 2,631 2,409 53.9%1 Computed as defined in paragraphs 49 and 112 of the Methodological note)
(mln EUR, %)
Non-defaulted Defaulted Non-defaulted Defaulted
Central governments or central banks 0 0 0 0 0 0 0 0 0.0%
Regional governments or local authorities 0 0 0 0 0 0 0 0 0.0%
Public sector entities 0 0 0 0 0 0 0 0 0.0%
Multilateral Development Banks 0 0 0 0 0 0 0 0 0.0%
International Organisations 0 0 0 0 0 0 0 0 0.0%
Institutions 0 0 0 0 0 0 0 0 0.0%
Corporates 0 0 0 0 0 0 0 0 0.0%
of which: SME 0 0 0 0 0 0 0 0 0.0%
Retail 0 0 0 0 0 0 0 0 0.0%
of which: SME 0 0 0 0 0 0 0 0 0.0%
Secured by mortgages on immovable property 0 0 0 0 0 0 0 0 0.0%
of which: SME 0 0 0 0 0 0 0 0 0.0%
Items associated with particularly high risk 0 0 0 0 0 0 0 0 0.0%
Covered bonds 0 0 0 0 0 0 0 0 0.0%
Claims on institutions and corporates with a ST credit assessment 0 0 0 0 0 0 0 0 0.0%
Collective investments undertakings (CIU) 0 0 0 0 0 0 0 0 0.0%
Equity 0 0 0 0 0.0%
Securitisation
Other exposures 0 0 0 0 0.0%
Standardised Total 0 0 0 0 0 0 0 0 0.0%1 Computed as defined in paragraphs 49 and 112 of the Methodological note)
Restated
31/12/2017
Coverage Ratio -
Non performing
exposures1
Exposure values Risk exposure amounts
Performing
exposure1
Non
performing
exposure1
Stock of
provisions
Of which:
from non
performing
exposures
Unione di Banche Italiane
Società Per Azioni
Restated
31/12/2017
Exposure values Risk exposure amounts
Performing
exposure1
Non
performing
exposure1
Stock of
provisions
Of which:
from non
performing
exposures
Coverage Ratio -
Non performing
exposures1
Italy
Restated
31/12/2017
Coverage Ratio -
Non performing
exposures1
Exposure values Risk exposure amounts
Performing
exposure1
Non
performing
exposure1
Stock of
provisions
Of which:
from non
performing
exposures
N.A.

2018 EU-wide Stress Test: Credit risk STAUnione di Banche Italiane Società Per Azioni
(mln EUR, %)
Non-defaulted Defaulted Non-defaulted Defaulted
Central governments or central banks 0 0 0 0 0 0 0 0 0.0%
Regional governments or local authorities 0 0 0 0 0 0 0 0 0.0%
Public sector entities 0 0 0 0 0 0 0 0 0.0%
Multilateral Development Banks 0 0 0 0 0 0 0 0 0.0%
International Organisations 0 0 0 0 0 0 0 0 0.0%
Institutions 0 0 0 0 0 0 0 0 0.0%
Corporates 0 0 0 0 0 0 0 0 0.0%
of which: SME 0 0 0 0 0 0 0 0 0.0%
Retail 0 0 0 0 0 0 0 0 0.0%
of which: SME 0 0 0 0 0 0 0 0 0.0%
Secured by mortgages on immovable property 0 0 0 0 0 0 0 0 0.0%
of which: SME 0 0 0 0 0 0 0 0 0.0%
Items associated with particularly high risk 0 0 0 0 0 0 0 0 0.0%
Covered bonds 0 0 0 0 0 0 0 0 0.0%
Claims on institutions and corporates with a ST credit assessment 0 0 0 0 0 0 0 0 0.0%
Collective investments undertakings (CIU) 0 0 0 0 0 0 0 0 0.0%
Equity 0 0 0 0 0.0%
Securitisation
Other exposures 0 0 0 0 0.0%
Standardised Total 0 0 0 0 0 0 0 0 0.0%1 Computed as defined in paragraphs 49 and 112 of the Methodological note)
Restated
31/12/2017
Exposure values Risk exposure amounts
Performing
exposure1
Non
performing
exposure1
Stock of
provisions
Of which:
from non
performing
exposures
Coverage Ratio -
Non performing
exposures1
N.A.
Restated
31/12/2017
Coverage Ratio -
Non performing
exposures1
Exposure values Risk exposure amounts
Performing
exposure1
Non
performing
exposure1
Stock of
provisions
Of which:
from non
performing
exposures
N.A.
Restated
31/12/2017
Exposure values Risk exposure amounts
Performing
exposure1
Non
performing
exposure1
Stock of
provisions
Of which:
from non
performing
exposures
Coverage Ratio -
Non performing
exposures1
N.A.
2018 EU-wide Stress Test: Credit risk STAUnione di Banche Italiane Società Per Azioni
(mln EUR, %)
Non-defaulted Defaulted Non-defaulted Defaulted
Central governments or central banks 0 0 0 0 0 0 0 0 0.0%
Regional governments or local authorities 0 0 0 0 0 0 0 0 0.0%
Public sector entities 0 0 0 0 0 0 0 0 0.0%
Multilateral Development Banks 0 0 0 0 0 0 0 0 0.0%
International Organisations 0 0 0 0 0 0 0 0 0.0%
Institutions 0 0 0 0 0 0 0 0 0.0%
Corporates 0 0 0 0 0 0 0 0 0.0%
of which: SME 0 0 0 0 0 0 0 0 0.0%
Retail 0 0 0 0 0 0 0 0 0.0%
of which: SME 0 0 0 0 0 0 0 0 0.0%
Secured by mortgages on immovable property 0 0 0 0 0 0 0 0 0.0%
of which: SME 0 0 0 0 0 0 0 0 0.0%
Items associated with particularly high risk 0 0 0 0 0 0 0 0 0.0%
Covered bonds 0 0 0 0 0 0 0 0 0.0%
Claims on institutions and corporates with a ST credit assessment 0 0 0 0 0 0 0 0 0.0%
Collective investments undertakings (CIU) 0 0 0 0 0 0 0 0 0.0%
Equity 0 0 0 0 0.0%
Securitisation
Other exposures 0 0 0 0 0.0%
Standardised Total 0 0 0 0 0 0 0 0 0.0%1 Computed as defined in paragraphs 49 and 112 of the Methodological note)
(mln EUR, %)
Non-defaulted Defaulted Non-defaulted Defaulted
Central governments or central banks 0 0 0 0 0 0 0 0 0.0%
Regional governments or local authorities 0 0 0 0 0 0 0 0 0.0%
Public sector entities 0 0 0 0 0 0 0 0 0.0%
Multilateral Development Banks 0 0 0 0 0 0 0 0 0.0%
International Organisations 0 0 0 0 0 0 0 0 0.0%
Institutions 0 0 0 0 0 0 0 0 0.0%
Corporates 0 0 0 0 0 0 0 0 0.0%
of which: SME 0 0 0 0 0 0 0 0 0.0%
Retail 0 0 0 0 0 0 0 0 0.0%
of which: SME 0 0 0 0 0 0 0 0 0.0%
Secured by mortgages on immovable property 0 0 0 0 0 0 0 0 0.0%
of which: SME 0 0 0 0 0 0 0 0 0.0%
Items associated with particularly high risk 0 0 0 0 0 0 0 0 0.0%
Covered bonds 0 0 0 0 0 0 0 0 0.0%
Claims on institutions and corporates with a ST credit assessment 0 0 0 0 0 0 0 0 0.0%
Collective investments undertakings (CIU) 0 0 0 0 0 0 0 0 0.0%
Equity 0 0 0 0 0.0%
Securitisation
Other exposures 0 0 0 0 0.0%
Standardised Total 0 0 0 0 0 0 0 0 0.0%1 Computed as defined in paragraphs 49 and 112 of the Methodological note)
(mln EUR, %)
Non-defaulted Defaulted Non-defaulted Defaulted
Central governments or central banks 0 0 0 0 0 0 0 0 0.0%
Regional governments or local authorities 0 0 0 0 0 0 0 0 0.0%
Public sector entities 0 0 0 0 0 0 0 0 0.0%
Multilateral Development Banks 0 0 0 0 0 0 0 0 0.0%
International Organisations 0 0 0 0 0 0 0 0 0.0%
Institutions 0 0 0 0 0 0 0 0 0.0%
Corporates 0 0 0 0 0 0 0 0 0.0%
of which: SME 0 0 0 0 0 0 0 0 0.0%
Retail 0 0 0 0 0 0 0 0 0.0%
of which: SME 0 0 0 0 0 0 0 0 0.0%
Secured by mortgages on immovable property 0 0 0 0 0 0 0 0 0.0%
of which: SME 0 0 0 0 0 0 0 0 0.0%
Items associated with particularly high risk 0 0 0 0 0 0 0 0 0.0%
Covered bonds 0 0 0 0 0 0 0 0 0.0%
Claims on institutions and corporates with a ST credit assessment 0 0 0 0 0 0 0 0 0.0%
Collective investments undertakings (CIU) 0 0 0 0 0 0 0 0 0.0%
Equity 0 0 0 0 0.0%
Securitisation
Other exposures 0 0 0 0 0.0%
Standardised Total 0 0 0 0 0 0 0 0 0.0%1 Computed as defined in paragraphs 49 and 112 of the Methodological note)
Restated
31/12/2017
Coverage Ratio -
Non performing
exposures1
Exposure values Risk exposure amounts
Performing
exposure1
Non
performing
exposure1
Stock of
provisions
Of which:
from non
performing
exposures
N.A.
Restated
31/12/2017
Exposure values Risk exposure amounts
Performing
exposure1
Non
performing
exposure1
Stock of
provisions
Of which:
from non
performing
exposures
Coverage Ratio -
Non performing
exposures1
N.A.
Restated
31/12/2017
Coverage Ratio -
Non performing
exposures1
Exposure values Risk exposure amounts
Performing
exposure1
Non
performing
exposure1
Stock of
provisions
Of which:
from non
performing
exposures
N.A.

2018 EU-wide Stress Test: Credit risk STAUnione di Banche Italiane Società Per Azioni
(mln EUR, %)
Non-defaulted Defaulted Non-defaulted Defaulted
Central governments or central banks 0 0 0 0 0 0 0 0 0.0%
Regional governments or local authorities 0 0 0 0 0 0 0 0 0.0%
Public sector entities 0 0 0 0 0 0 0 0 0.0%
Multilateral Development Banks 0 0 0 0 0 0 0 0 0.0%
International Organisations 0 0 0 0 0 0 0 0 0.0%
Institutions 0 0 0 0 0 0 0 0 0.0%
Corporates 0 0 0 0 0 0 0 0 0.0%
of which: SME 0 0 0 0 0 0 0 0 0.0%
Retail 0 0 0 0 0 0 0 0 0.0%
of which: SME 0 0 0 0 0 0 0 0 0.0%
Secured by mortgages on immovable property 0 0 0 0 0 0 0 0 0.0%
of which: SME 0 0 0 0 0 0 0 0 0.0%
Items associated with particularly high risk 0 0 0 0 0 0 0 0 0.0%
Covered bonds 0 0 0 0 0 0 0 0 0.0%
Claims on institutions and corporates with a ST credit assessment 0 0 0 0 0 0 0 0 0.0%
Collective investments undertakings (CIU) 0 0 0 0 0 0 0 0 0.0%
Equity 0 0 0 0 0.0%
Securitisation
Other exposures 0 0 0 0 0.0%
Standardised Total 0 0 0 0 0 0 0 0 0.0%1 Computed as defined in paragraphs 49 and 112 of the Methodological note)
(mln EUR, %)
Non-defaulted Defaulted Non-defaulted Defaulted
Central governments or central banks 0 0 0 0 0 0 0 0 0.0%
Regional governments or local authorities 0 0 0 0 0 0 0 0 0.0%
Public sector entities 0 0 0 0 0 0 0 0 0.0%
Multilateral Development Banks 0 0 0 0 0 0 0 0 0.0%
International Organisations 0 0 0 0 0 0 0 0 0.0%
Institutions 0 0 0 0 0 0 0 0 0.0%
Corporates 0 0 0 0 0 0 0 0 0.0%
of which: SME 0 0 0 0 0 0 0 0 0.0%
Retail 0 0 0 0 0 0 0 0 0.0%
of which: SME 0 0 0 0 0 0 0 0 0.0%
Secured by mortgages on immovable property 0 0 0 0 0 0 0 0 0.0%
of which: SME 0 0 0 0 0 0 0 0 0.0%
Items associated with particularly high risk 0 0 0 0 0 0 0 0 0.0%
Covered bonds 0 0 0 0 0 0 0 0 0.0%
Claims on institutions and corporates with a ST credit assessment 0 0 0 0 0 0 0 0 0.0%
Collective investments undertakings (CIU) 0 0 0 0 0 0 0 0 0.0%
Equity 0 0 0 0 0.0%
Securitisation
Other exposures 0 0 0 0 0.0%
Standardised Total 0 0 0 0 0 0 0 0 0.0%1 Computed as defined in paragraphs 49 and 112 of the Methodological note)
Restated
31/12/2017
Exposure values Risk exposure amounts
Performing
exposure1
Non
performing
exposure1
Stock of
provisions
Of which:
from non
performing
exposures
Coverage Ratio -
Non performing
exposures1
N.A.
Restated
31/12/2017
Coverage Ratio -
Non performing
exposures1
Exposure values Risk exposure amounts
Performing
exposure1
Non
performing
exposure1
Stock of
provisions
Of which:
from non
performing
exposures
N.A.

(mln EUR, %)
Central governments or central banks
Regional governments or local authorities
Public sector entities
Multilateral Development Banks
International Organisations
Institutions
Corporates
of which: SME
Retail
of which: SME
Secured by mortgages on immovable property
of which: SME
Items associated with particularly high risk
Covered bonds
Claims on institutions and corporates with a ST credit assessment
Collective investments undertakings (CIU)
Equity
Securitisation
Other exposures
Standardised Total1 Computed as defined in paragraphs 49 and 112 of the Methodological note)
Unione di Banche Italiane
Società Per Azioni
Italy
N.A.
2018 EU-wide Stress Test: Credit risk STAUnione di Banche Italiane Società Per Azioni
14,586 76 38 30 40.0% 14,568 94 45 38 40.0% 14,550 112 52 45 40.0%
725 46 14 11 23.3% 723 48 15 11 23.9% 722 49 15 12 24.3%
377 8 5 4 50.6% 374 11 7 5 47.5% 370 15 8 7 45.8%
0 0 0 0 23.3% 0 0 0 0 23.1% 0 0 0 0 22.9%
0 0 0 0 0.0% 0 0 0 0 0.0% 0 0 0 0 0.0%
3,210 83 22 15 18.3% 3,191 102 32 24 23.4% 3,170 122 41 33 27.0%
8,873 1205 697 576 47.8% 8,745 1333 730 626 47.0% 8,635 1444 759 670 46.4%
2,684 300 216 146 48.7% 2,617 366 231 172 47.0% 2,563 421 245 193 45.9%
8,137 1400 1,181 1,058 75.6% 7,934 1603 1,267 1,166 72.7% 7,769 1769 1,334 1,244 70.3%
2,717 573 405 356 62.1% 2,652 639 420 381 59.7% 2,596 694 434 402 57.9%
5,061 2347 1,070 1,016 43.3% 4,973 2435 1,087 1,038 42.6% 4,895 2512 1,102 1,057 42.1%
1,267 1623 527 498 30.7% 1,230 1660 536 511 30.8% 1,200 1690 544 521 30.9%
4 0 0 0 45.0% 4 0 0 0 45.0% 4 0 0 0 45.0%
0 0 0 0 0.0% 0 0 0 0 0.0% 0 0 0 0 0.0%
0 0 0 0 0.0% 0 0 0 0 0.0% 0 0 0 0 0.0%
5 0 0 0 45.0% 5 0 0 0 45.0% 5 0 0 0 45.0%
405 0 0 0 0.0% 405 0 0 0 0.0% 405 0 0 0 0.0%
3,502 17 1 1 8.5% 3,502 17 1 1 8.5% 3,502 17 1 1 8.5%
44,884 5182 3,030 2,712 52.3% 44,424 5643 3,183 2,910 51.6% 44,027 6040 3,313 3,069 50.8%
14,438 76 37 30 40.0% 14,420 94 44 38 40.0% 14,403 111 51 44 40.0%
725 46 14 11 23.3% 723 48 15 11 23.9% 722 49 15 12 24.3%
333 8 5 4 50.8% 329 11 6 5 47.7% 326 14 8 6 46.0%
0 0 0 0 23.3% 0 0 0 0 23.1% 0 0 0 0 22.9%
0 0 0 0 0.0% 0 0 0 0 0.0% 0 0 0 0 0.0%
2,183 72 16 11 15.5% 2,169 86 23 17 20.3% 2,154 101 30 24 24.0%
8,054 1064 657 546 51.4% 7,928 1189 690 596 50.1% 7,820 1298 719 639 49.2%
2,600 300 216 146 48.7% 2,534 366 231 172 47.0% 2,480 420 245 193 46.0%
8,083 1395 1,177 1,054 75.6% 7,880 1598 1,262 1,162 72.7% 7,715 1763 1,330 1,240 70.3%
2,682 572 404 355 62.1% 2,616 637 419 380 59.7% 2,561 692 432 401 57.9%
5,049 2336 1,064 1,009 43.2% 4,961 2424 1,081 1,031 42.6% 4,884 2501 1,095 1,051 42.0%
1,266 1623 527 498 30.7% 1,229 1660 536 511 30.8% 1,199 1690 544 521 30.9%
4 0 0 0 45.0% 4 0 0 0 45.0% 4 0 0 0 45.0%
0 0 0 0 0.0% 0 0 0 0 0.0% 0 0 0 0 0.0%
0 0 0 0 0.0% 0 0 0 0 0.0% 0 0 0 0 0.0%
5 0 0 0 45.0% 5 0 0 0 45.0% 5 0 0 0 45.0%
405 0 0 0 0.0% 405 0 0 0 0.0% 405 0 0 0 0.0%
3,498 17 1 1 8.5% 3,498 17 1 1 8.5% 3,498 17 1 1 8.5%
42,776 5013 2,972 2,667 53.2% 42,323 5466 3,123 2,862 52.4% 41,935 5854 3,249 3,018 51.5%
0 0 0 0 0.0% 0 0 0 0 0.0% 0 0 0 0 0.0%
0 0 0 0 0.0% 0 0 0 0 0.0% 0 0 0 0 0.0%
0 0 0 0 0.0% 0 0 0 0 0.0% 0 0 0 0 0.0%
0 0 0 0 0.0% 0 0 0 0 0.0% 0 0 0 0 0.0%
0 0 0 0 0.0% 0 0 0 0 0.0% 0 0 0 0 0.0%
0 0 0 0 0.0% 0 0 0 0 0.0% 0 0 0 0 0.0%
0 0 0 0 0.0% 0 0 0 0 0.0% 0 0 0 0 0.0%
0 0 0 0 0.0% 0 0 0 0 0.0% 0 0 0 0 0.0%
0 0 0 0 0.0% 0 0 0 0 0.0% 0 0 0 0 0.0%
0 0 0 0 0.0% 0 0 0 0 0.0% 0 0 0 0 0.0%
0 0 0 0 0.0% 0 0 0 0 0.0% 0 0 0 0 0.0%
0 0 0 0 0.0% 0 0 0 0 0.0% 0 0 0 0 0.0%
0 0 0 0 0.0% 0 0 0 0 0.0% 0 0 0 0 0.0%
0 0 0 0 0.0% 0 0 0 0 0.0% 0 0 0 0 0.0%
0 0 0 0 0.0% 0 0 0 0 0.0% 0 0 0 0 0.0%
0 0 0 0 0.0% 0 0 0 0 0.0% 0 0 0 0 0.0%
0 0 0 0 0.0% 0 0 0 0 0.0% 0 0 0 0 0.0%
0 0 0 0 0.0% 0 0 0 0 0.0% 0 0 0 0 0.0%
0 0 0 0 0.0% 0 0 0 0 0.0% 0 0 0 0 0.0%
Baseline Scenario
31/12/2018 31/12/2019 31/12/2020
Performing
exposure1
Non
performing
exposure1
Stock of
provisions
Of which:
from non
performing
exposures
Coverage Ratio -
Non performing
exposures1
Of which:
from non
performing
exposures
Coverage Ratio -
Non performing
exposures1
Performing
exposure1
Non
performing
exposure1
Stock of
provisions
Of which:
from non
performing
exposures
Coverage Ratio -
Non performing
exposures1
Performing
exposure1
Baseline Scenario
31/12/2018 31/12/2019 31/12/2020
Non
performing
exposure1
Stock of
provisions
Non
performing
exposure1
Performing
exposure1
Of which:
from non
performing
exposures
Coverage Ratio -
Non performing
exposures1
Stock of
provisions
Of which:
from non
performing
exposures
Coverage Ratio -
Non performing
exposures1
Performing
exposure1
Non
performing
exposure1
Stock of
provisions
Non
performing
exposure1
Stock of
provisions
Of which:
from non
performing
exposures
Coverage Ratio -
Non performing
exposures1
Performing
exposure1
Baseline Scenario
31/12/2018 31/12/2019 31/12/2020
Performing
exposure1
Non
performing
exposure1
Stock of
provisions
Of which:
from non
performing
exposures
Coverage Ratio -
Non performing
exposures1
Of which:
from non
performing
exposures
Coverage Ratio -
Non performing
exposures1
Performing
exposure1
Non
performing
exposure1
Stock of
provisions
Of which:
from non
performing
exposures
Coverage Ratio -
Non performing
exposures1
Performing
exposure1
Non
performing
exposure1
Stock of
provisions

(mln EUR, %)
Central governments or central banks
Regional governments or local authorities
Public sector entities
Multilateral Development Banks
International Organisations
Institutions
Corporates
of which: SME
Retail
of which: SME
Secured by mortgages on immovable property
of which: SME
Items associated with particularly high risk
Covered bonds
Claims on institutions and corporates with a ST credit assessment
Collective investments undertakings (CIU)
Equity
Securitisation
Other exposures
Standardised Total1 Computed as defined in paragraphs 49 and 112 of the Methodological note)
N.A.
N.A.
N.A.
2018 EU-wide Stress Test: Credit risk STAUnione di Banche Italiane Società Per Azioni
0 0 0 0 0.0% 0 0 0 0 0.0% 0 0 0 0 0.0%
0 0 0 0 0.0% 0 0 0 0 0.0% 0 0 0 0 0.0%
0 0 0 0 0.0% 0 0 0 0 0.0% 0 0 0 0 0.0%
0 0 0 0 0.0% 0 0 0 0 0.0% 0 0 0 0 0.0%
0 0 0 0 0.0% 0 0 0 0 0.0% 0 0 0 0 0.0%
0 0 0 0 0.0% 0 0 0 0 0.0% 0 0 0 0 0.0%
0 0 0 0 0.0% 0 0 0 0 0.0% 0 0 0 0 0.0%
0 0 0 0 0.0% 0 0 0 0 0.0% 0 0 0 0 0.0%
0 0 0 0 0.0% 0 0 0 0 0.0% 0 0 0 0 0.0%
0 0 0 0 0.0% 0 0 0 0 0.0% 0 0 0 0 0.0%
0 0 0 0 0.0% 0 0 0 0 0.0% 0 0 0 0 0.0%
0 0 0 0 0.0% 0 0 0 0 0.0% 0 0 0 0 0.0%
0 0 0 0 0.0% 0 0 0 0 0.0% 0 0 0 0 0.0%
0 0 0 0 0.0% 0 0 0 0 0.0% 0 0 0 0 0.0%
0 0 0 0 0.0% 0 0 0 0 0.0% 0 0 0 0 0.0%
0 0 0 0 0.0% 0 0 0 0 0.0% 0 0 0 0 0.0%
0 0 0 0 0.0% 0 0 0 0 0.0% 0 0 0 0 0.0%
0 0 0 0 0.0% 0 0 0 0 0.0% 0 0 0 0 0.0%
0 0 0 0 0.0% 0 0 0 0 0.0% 0 0 0 0 0.0%
0 0 0 0 0.0% 0 0 0 0 0.0% 0 0 0 0 0.0%
0 0 0 0 0.0% 0 0 0 0 0.0% 0 0 0 0 0.0%
0 0 0 0 0.0% 0 0 0 0 0.0% 0 0 0 0 0.0%
0 0 0 0 0.0% 0 0 0 0 0.0% 0 0 0 0 0.0%
0 0 0 0 0.0% 0 0 0 0 0.0% 0 0 0 0 0.0%
0 0 0 0 0.0% 0 0 0 0 0.0% 0 0 0 0 0.0%
0 0 0 0 0.0% 0 0 0 0 0.0% 0 0 0 0 0.0%
0 0 0 0 0.0% 0 0 0 0 0.0% 0 0 0 0 0.0%
0 0 0 0 0.0% 0 0 0 0 0.0% 0 0 0 0 0.0%
0 0 0 0 0.0% 0 0 0 0 0.0% 0 0 0 0 0.0%
0 0 0 0 0.0% 0 0 0 0 0.0% 0 0 0 0 0.0%
0 0 0 0 0.0% 0 0 0 0 0.0% 0 0 0 0 0.0%
0 0 0 0 0.0% 0 0 0 0 0.0% 0 0 0 0 0.0%
0 0 0 0 0.0% 0 0 0 0 0.0% 0 0 0 0 0.0%
0 0 0 0 0.0% 0 0 0 0 0.0% 0 0 0 0 0.0%
0 0 0 0 0.0% 0 0 0 0 0.0% 0 0 0 0 0.0%
0 0 0 0 0.0% 0 0 0 0 0.0% 0 0 0 0 0.0%
0 0 0 0 0.0% 0 0 0 0 0.0% 0 0 0 0 0.0%
0 0 0 0 0.0% 0 0 0 0 0.0% 0 0 0 0 0.0%
0 0 0 0 0.0% 0 0 0 0 0.0% 0 0 0 0 0.0%
0 0 0 0 0.0% 0 0 0 0 0.0% 0 0 0 0 0.0%
0 0 0 0 0.0% 0 0 0 0 0.0% 0 0 0 0 0.0%
0 0 0 0 0.0% 0 0 0 0 0.0% 0 0 0 0 0.0%
0 0 0 0 0.0% 0 0 0 0 0.0% 0 0 0 0 0.0%
0 0 0 0 0.0% 0 0 0 0 0.0% 0 0 0 0 0.0%
0 0 0 0 0.0% 0 0 0 0 0.0% 0 0 0 0 0.0%
0 0 0 0 0.0% 0 0 0 0 0.0% 0 0 0 0 0.0%
0 0 0 0 0.0% 0 0 0 0 0.0% 0 0 0 0 0.0%
0 0 0 0 0.0% 0 0 0 0 0.0% 0 0 0 0 0.0%
0 0 0 0 0.0% 0 0 0 0 0.0% 0 0 0 0 0.0%
0 0 0 0 0.0% 0 0 0 0 0.0% 0 0 0 0 0.0%
0 0 0 0 0.0% 0 0 0 0 0.0% 0 0 0 0 0.0%
0 0 0 0 0.0% 0 0 0 0 0.0% 0 0 0 0 0.0%
0 0 0 0 0.0% 0 0 0 0 0.0% 0 0 0 0 0.0%
0 0 0 0 0.0% 0 0 0 0 0.0% 0 0 0 0 0.0%
0 0 0 0 0.0% 0 0 0 0 0.0% 0 0 0 0 0.0%
0 0 0 0 0.0% 0 0 0 0 0.0% 0 0 0 0 0.0%
0 0 0 0 0.0% 0 0 0 0 0.0% 0 0 0 0 0.0%
Baseline Scenario
31/12/2018 31/12/2019 31/12/2020
Non
performing
exposure1
Performing
exposure1
Of which:
from non
performing
exposures
Coverage Ratio -
Non performing
exposures1
Stock of
provisions
Of which:
from non
performing
exposures
Coverage Ratio -
Non performing
exposures1
Performing
exposure1
Non
performing
exposure1
Stock of
provisions
Non
performing
exposure1
Stock of
provisions
Of which:
from non
performing
exposures
Coverage Ratio -
Non performing
exposures1
Performing
exposure1
Baseline Scenario
31/12/2018 31/12/2019 31/12/2020
Performing
exposure1
Non
performing
exposure1
Stock of
provisions
Of which:
from non
performing
exposures
Coverage Ratio -
Non performing
exposures1
Of which:
from non
performing
exposures
Coverage Ratio -
Non performing
exposures1
Performing
exposure1
Non
performing
exposure1
Stock of
provisions
Of which:
from non
performing
exposures
Coverage Ratio -
Non performing
exposures1
Performing
exposure1
Baseline Scenario
31/12/2018 31/12/2019 31/12/2020
Non
performing
exposure1
Stock of
provisions
Non
performing
exposure1
Performing
exposure1
Of which:
from non
performing
exposures
Coverage Ratio -
Non performing
exposures1
Stock of
provisions
Of which:
from non
performing
exposures
Coverage Ratio -
Non performing
exposures1
Performing
exposure1
Non
performing
exposure1
Stock of
provisions
Non
performing
exposure1
Stock of
provisions
Of which:
from non
performing
exposures
Coverage Ratio -
Non performing
exposures1
Performing
exposure1

(mln EUR, %)
Central governments or central banks
Regional governments or local authorities
Public sector entities
Multilateral Development Banks
International Organisations
Institutions
Corporates
of which: SME
Retail
of which: SME
Secured by mortgages on immovable property
of which: SME
Items associated with particularly high risk
Covered bonds
Claims on institutions and corporates with a ST credit assessment
Collective investments undertakings (CIU)
Equity
Securitisation
Other exposures
Standardised Total1 Computed as defined in paragraphs 49 and 112 of the Methodological note)
N.A.
N.A.
N.A.
2018 EU-wide Stress Test: Credit risk STAUnione di Banche Italiane Società Per Azioni
0 0 0 0 0.0% 0 0 0 0 0.0% 0 0 0 0 0.0%
0 0 0 0 0.0% 0 0 0 0 0.0% 0 0 0 0 0.0%
0 0 0 0 0.0% 0 0 0 0 0.0% 0 0 0 0 0.0%
0 0 0 0 0.0% 0 0 0 0 0.0% 0 0 0 0 0.0%
0 0 0 0 0.0% 0 0 0 0 0.0% 0 0 0 0 0.0%
0 0 0 0 0.0% 0 0 0 0 0.0% 0 0 0 0 0.0%
0 0 0 0 0.0% 0 0 0 0 0.0% 0 0 0 0 0.0%
0 0 0 0 0.0% 0 0 0 0 0.0% 0 0 0 0 0.0%
0 0 0 0 0.0% 0 0 0 0 0.0% 0 0 0 0 0.0%
0 0 0 0 0.0% 0 0 0 0 0.0% 0 0 0 0 0.0%
0 0 0 0 0.0% 0 0 0 0 0.0% 0 0 0 0 0.0%
0 0 0 0 0.0% 0 0 0 0 0.0% 0 0 0 0 0.0%
0 0 0 0 0.0% 0 0 0 0 0.0% 0 0 0 0 0.0%
0 0 0 0 0.0% 0 0 0 0 0.0% 0 0 0 0 0.0%
0 0 0 0 0.0% 0 0 0 0 0.0% 0 0 0 0 0.0%
0 0 0 0 0.0% 0 0 0 0 0.0% 0 0 0 0 0.0%
0 0 0 0 0.0% 0 0 0 0 0.0% 0 0 0 0 0.0%
0 0 0 0 0.0% 0 0 0 0 0.0% 0 0 0 0 0.0%
0 0 0 0 0.0% 0 0 0 0 0.0% 0 0 0 0 0.0%
0 0 0 0 0.0% 0 0 0 0 0.0% 0 0 0 0 0.0%
0 0 0 0 0.0% 0 0 0 0 0.0% 0 0 0 0 0.0%
0 0 0 0 0.0% 0 0 0 0 0.0% 0 0 0 0 0.0%
0 0 0 0 0.0% 0 0 0 0 0.0% 0 0 0 0 0.0%
0 0 0 0 0.0% 0 0 0 0 0.0% 0 0 0 0 0.0%
0 0 0 0 0.0% 0 0 0 0 0.0% 0 0 0 0 0.0%
0 0 0 0 0.0% 0 0 0 0 0.0% 0 0 0 0 0.0%
0 0 0 0 0.0% 0 0 0 0 0.0% 0 0 0 0 0.0%
0 0 0 0 0.0% 0 0 0 0 0.0% 0 0 0 0 0.0%
0 0 0 0 0.0% 0 0 0 0 0.0% 0 0 0 0 0.0%
0 0 0 0 0.0% 0 0 0 0 0.0% 0 0 0 0 0.0%
0 0 0 0 0.0% 0 0 0 0 0.0% 0 0 0 0 0.0%
0 0 0 0 0.0% 0 0 0 0 0.0% 0 0 0 0 0.0%
0 0 0 0 0.0% 0 0 0 0 0.0% 0 0 0 0 0.0%
0 0 0 0 0.0% 0 0 0 0 0.0% 0 0 0 0 0.0%
0 0 0 0 0.0% 0 0 0 0 0.0% 0 0 0 0 0.0%
0 0 0 0 0.0% 0 0 0 0 0.0% 0 0 0 0 0.0%
0 0 0 0 0.0% 0 0 0 0 0.0% 0 0 0 0 0.0%
0 0 0 0 0.0% 0 0 0 0 0.0% 0 0 0 0 0.0%
0 0 0 0 0.0% 0 0 0 0 0.0% 0 0 0 0 0.0%
0 0 0 0 0.0% 0 0 0 0 0.0% 0 0 0 0 0.0%
0 0 0 0 0.0% 0 0 0 0 0.0% 0 0 0 0 0.0%
0 0 0 0 0.0% 0 0 0 0 0.0% 0 0 0 0 0.0%
0 0 0 0 0.0% 0 0 0 0 0.0% 0 0 0 0 0.0%
0 0 0 0 0.0% 0 0 0 0 0.0% 0 0 0 0 0.0%
0 0 0 0 0.0% 0 0 0 0 0.0% 0 0 0 0 0.0%
0 0 0 0 0.0% 0 0 0 0 0.0% 0 0 0 0 0.0%
0 0 0 0 0.0% 0 0 0 0 0.0% 0 0 0 0 0.0%
0 0 0 0 0.0% 0 0 0 0 0.0% 0 0 0 0 0.0%
0 0 0 0 0.0% 0 0 0 0 0.0% 0 0 0 0 0.0%
0 0 0 0 0.0% 0 0 0 0 0.0% 0 0 0 0 0.0%
0 0 0 0 0.0% 0 0 0 0 0.0% 0 0 0 0 0.0%
0 0 0 0 0.0% 0 0 0 0 0.0% 0 0 0 0 0.0%
0 0 0 0 0.0% 0 0 0 0 0.0% 0 0 0 0 0.0%
0 0 0 0 0.0% 0 0 0 0 0.0% 0 0 0 0 0.0%
0 0 0 0 0.0% 0 0 0 0 0.0% 0 0 0 0 0.0%
0 0 0 0 0.0% 0 0 0 0 0.0% 0 0 0 0 0.0%
0 0 0 0 0.0% 0 0 0 0 0.0% 0 0 0 0 0.0%
Baseline Scenario
31/12/2018 31/12/2019 31/12/2020
Performing
exposure1
Non
performing
exposure1
Stock of
provisions
Of which:
from non
performing
exposures
Coverage Ratio -
Non performing
exposures1
Of which:
from non
performing
exposures
Coverage Ratio -
Non performing
exposures1
Performing
exposure1
Non
performing
exposure1
Stock of
provisions
Of which:
from non
performing
exposures
Coverage Ratio -
Non performing
exposures1
Performing
exposure1
Baseline Scenario
31/12/2018 31/12/2019 31/12/2020
Non
performing
exposure1
Stock of
provisions
Non
performing
exposure1
Performing
exposure1
Of which:
from non
performing
exposures
Coverage Ratio -
Non performing
exposures1
Stock of
provisions
Of which:
from non
performing
exposures
Coverage Ratio -
Non performing
exposures1
Performing
exposure1
Non
performing
exposure1
Stock of
provisions
Non
performing
exposure1
Stock of
provisions
Of which:
from non
performing
exposures
Coverage Ratio -
Non performing
exposures1
Performing
exposure1
Baseline Scenario
31/12/2018 31/12/2019 31/12/2020
Performing
exposure1
Non
performing
exposure1
Stock of
provisions
Of which:
from non
performing
exposures
Coverage Ratio -
Non performing
exposures1
Of which:
from non
performing
exposures
Coverage Ratio -
Non performing
exposures1
Performing
exposure1
Non
performing
exposure1
Stock of
provisions
Of which:
from non
performing
exposures
Coverage Ratio -
Non performing
exposures1
Performing
exposure1
Non
performing
exposure1
Stock of
provisions
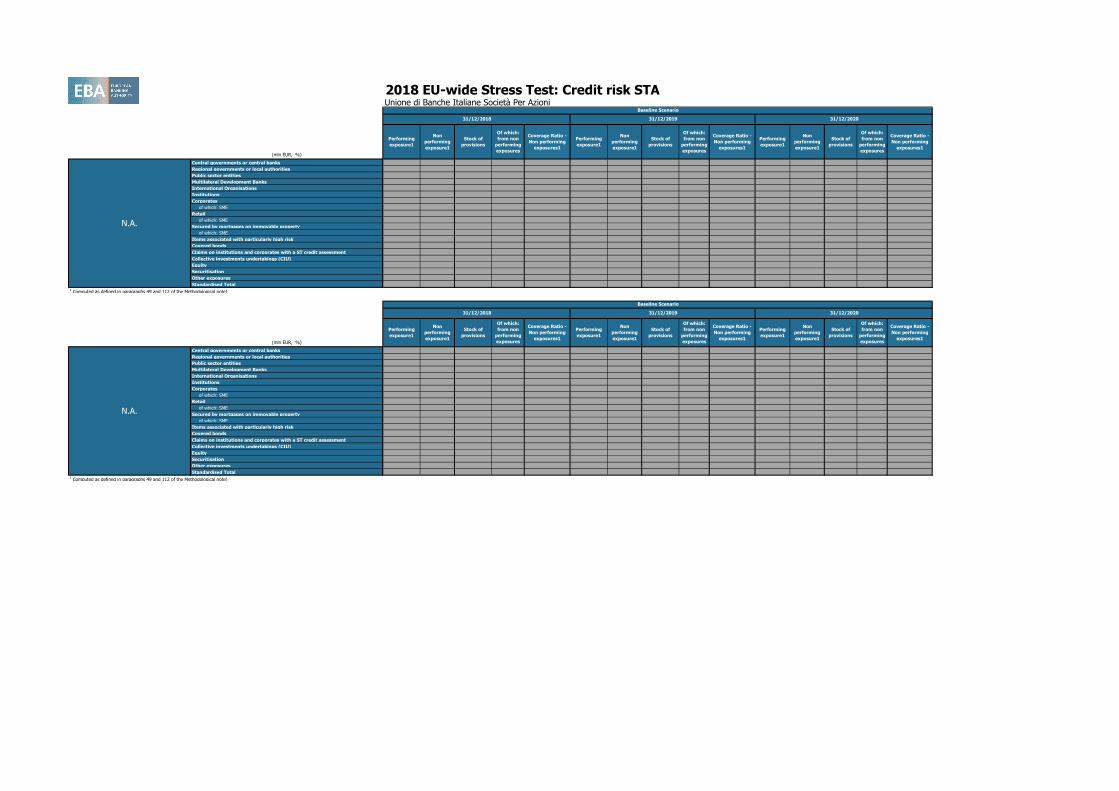
(mln EUR, %)
Central governments or central banks
Regional governments or local authorities
Public sector entities
Multilateral Development Banks
International Organisations
Institutions
Corporates
of which: SME
Retail
of which: SME
Secured by mortgages on immovable property
of which: SME
Items associated with particularly high risk
Covered bonds
Claims on institutions and corporates with a ST credit assessment
Collective investments undertakings (CIU)
Equity
Securitisation
Other exposures
Standardised Total1 Computed as defined in paragraphs 49 and 112 of the Methodological note)
N.A.
N.A.
2018 EU-wide Stress Test: Credit risk STAUnione di Banche Italiane Società Per Azioni
0 0 0 0 0.0% 0 0 0 0 0.0% 0 0 0 0 0.0%
0 0 0 0 0.0% 0 0 0 0 0.0% 0 0 0 0 0.0%
0 0 0 0 0.0% 0 0 0 0 0.0% 0 0 0 0 0.0%
0 0 0 0 0.0% 0 0 0 0 0.0% 0 0 0 0 0.0%
0 0 0 0 0.0% 0 0 0 0 0.0% 0 0 0 0 0.0%
0 0 0 0 0.0% 0 0 0 0 0.0% 0 0 0 0 0.0%
0 0 0 0 0.0% 0 0 0 0 0.0% 0 0 0 0 0.0%
0 0 0 0 0.0% 0 0 0 0 0.0% 0 0 0 0 0.0%
0 0 0 0 0.0% 0 0 0 0 0.0% 0 0 0 0 0.0%
0 0 0 0 0.0% 0 0 0 0 0.0% 0 0 0 0 0.0%
0 0 0 0 0.0% 0 0 0 0 0.0% 0 0 0 0 0.0%
0 0 0 0 0.0% 0 0 0 0 0.0% 0 0 0 0 0.0%
0 0 0 0 0.0% 0 0 0 0 0.0% 0 0 0 0 0.0%
0 0 0 0 0.0% 0 0 0 0 0.0% 0 0 0 0 0.0%
0 0 0 0 0.0% 0 0 0 0 0.0% 0 0 0 0 0.0%
0 0 0 0 0.0% 0 0 0 0 0.0% 0 0 0 0 0.0%
0 0 0 0 0.0% 0 0 0 0 0.0% 0 0 0 0 0.0%
0 0 0 0 0.0% 0 0 0 0 0.0% 0 0 0 0 0.0%
0 0 0 0 0.0% 0 0 0 0 0.0% 0 0 0 0 0.0%
0 0 0 0 0.0% 0 0 0 0 0.0% 0 0 0 0 0.0%
0 0 0 0 0.0% 0 0 0 0 0.0% 0 0 0 0 0.0%
0 0 0 0 0.0% 0 0 0 0 0.0% 0 0 0 0 0.0%
0 0 0 0 0.0% 0 0 0 0 0.0% 0 0 0 0 0.0%
0 0 0 0 0.0% 0 0 0 0 0.0% 0 0 0 0 0.0%
0 0 0 0 0.0% 0 0 0 0 0.0% 0 0 0 0 0.0%
0 0 0 0 0.0% 0 0 0 0 0.0% 0 0 0 0 0.0%
0 0 0 0 0.0% 0 0 0 0 0.0% 0 0 0 0 0.0%
0 0 0 0 0.0% 0 0 0 0 0.0% 0 0 0 0 0.0%
0 0 0 0 0.0% 0 0 0 0 0.0% 0 0 0 0 0.0%
0 0 0 0 0.0% 0 0 0 0 0.0% 0 0 0 0 0.0%
0 0 0 0 0.0% 0 0 0 0 0.0% 0 0 0 0 0.0%
0 0 0 0 0.0% 0 0 0 0 0.0% 0 0 0 0 0.0%
0 0 0 0 0.0% 0 0 0 0 0.0% 0 0 0 0 0.0%
0 0 0 0 0.0% 0 0 0 0 0.0% 0 0 0 0 0.0%
0 0 0 0 0.0% 0 0 0 0 0.0% 0 0 0 0 0.0%
0 0 0 0 0.0% 0 0 0 0 0.0% 0 0 0 0 0.0%
0 0 0 0 0.0% 0 0 0 0 0.0% 0 0 0 0 0.0%
0 0 0 0 0.0% 0 0 0 0 0.0% 0 0 0 0 0.0%
Baseline Scenario
31/12/2018 31/12/2019 31/12/2020
Non
performing
exposure1
Performing
exposure1
Of which:
from non
performing
exposures
Coverage Ratio -
Non performing
exposures1
Stock of
provisions
Of which:
from non
performing
exposures
Coverage Ratio -
Non performing
exposures1
Performing
exposure1
Non
performing
exposure1
Stock of
provisions
Non
performing
exposure1
Stock of
provisions
Of which:
from non
performing
exposures
Coverage Ratio -
Non performing
exposures1
Performing
exposure1
Baseline Scenario
31/12/2018 31/12/2019 31/12/2020
Coverage Ratio -
Non performing
exposures1
Performing
exposure1
Performing
exposure1
Non
performing
exposure1
Stock of
provisions
Of which:
from non
performing
exposures
Coverage Ratio -
Non performing
exposures1
Non
performing
exposure1
Stock of
provisions
Of which:
from non
performing
exposures
Coverage Ratio -
Non performing
exposures1
Performing
exposure1
Non
performing
exposure1
Stock of
provisions
Of which:
from non
performing
exposures

(mln EUR, %)
Central governments or central banks
Regional governments or local authorities
Public sector entities
Multilateral Development Banks
International Organisations
Institutions
Corporates
of which: SME
Retail
of which: SME
Secured by mortgages on immovable property
of which: SME
Items associated with particularly high risk
Covered bonds
Claims on institutions and corporates with a ST credit assessment
Collective investments undertakings (CIU)
Equity
Securitisation
Other exposures
Standardised Total1 Computed as defined in paragraphs 49 and 112 of the Methodological note)
Unione di Banche Italiane
Società Per Azioni
Italy
N.A.
2018 EU-wide Stress Test: Credit risk STAUnione di Banche Italiane Società Per Azioni
14,584 78 40 31 40.0% 14,561 102 50 41 40.0% 14,536 126 60 51 40.0%
725 46 15 11 23.4% 723 48 18 12 24.0% 721 50 19 12 24.7%
374 11 8 5 48.1% 368 17 10 8 45.3% 362 23 12 10 44.1%
0 0 0 0 26.2% 0 0 0 0 26.5% 0 0 0 0 26.8%
0 0 0 0 0.0% 0 0 0 0 0.0% 0 0 0 0 0.0%
3,183 110 56 30 27.7% 3,134 159 77 56 35.2% 3,090 203 96 79 38.8%
8,861 1218 728 581 47.7% 8,706 1373 777 642 46.8% 8,559 1519 842 700 46.1%
2,676 308 231 149 48.3% 2,595 389 255 180 46.4% 2,520 463 300 209 45.2%
8,151 1387 1,190 1,050 75.8% 7,916 1621 1,284 1,162 71.6% 7,711 1827 1,431 1,262 69.1%
2,711 579 425 360 62.2% 2,632 659 451 393 59.6% 2,557 734 471 424 57.8%
5,053 2355 1,211 1,146 48.6% 4,949 2459 1,237 1,175 47.8% 4,850 2558 1,257 1,202 47.0%
1,263 1626 659 625 38.5% 1,219 1670 672 641 38.4% 1,180 1709 682 656 38.4%
4 0 0 0 45.0% 4 0 0 0 45.0% 4 0 0 0 45.0%
0 0 0 0 0.0% 0 0 0 0 0.0% 0 0 0 0 0.0%
0 0 0 0 0.0% 0 0 0 0 0.0% 0 0 0 0 0.0%
5 0 0 0 45.0% 5 0 0 0 45.0% 5 0 0 0 45.0%
405 0 0 0 0.0% 405 0 0 0 0.0% 405 0 0 0 0.0%
3,502 17 1 1 8.5% 3,502 17 1 1 8.5% 3,502 17 1 1 8.5%
44,846 5221 3,249 2,856 54.7% 44,271 5796 3,454 3,096 53.4% 43,743 6323 3,718 3,318 52.5%
14,436 78 40 31 40.0% 14,413 101 50 40 40.0% 14,388 125 59 50 40.0%
725 46 15 11 23.4% 723 48 18 12 24.0% 721 50 19 12 24.7%
330 10 8 5 48.5% 324 16 9 7 45.6% 319 21 11 9 44.3%
0 0 0 0 26.2% 0 0 0 0 26.5% 0 0 0 0 26.8%
0 0 0 0 0.0% 0 0 0 0 0.0% 0 0 0 0 0.0%
2,163 92 38 22 24.3% 2,127 128 55 41 32.1% 2,095 160 69 58 36.0%
8,043 1075 686 551 51.2% 7,891 1226 734 611 49.8% 7,748 1370 799 668 48.7%
2,593 307 231 149 48.4% 2,512 388 254 180 46.4% 2,438 462 300 209 45.2%
8,097 1382 1,185 1,047 75.8% 7,862 1616 1,279 1,158 71.6% 7,657 1821 1,427 1,258 69.1%
2,676 578 423 360 62.2% 2,597 657 449 392 59.7% 2,522 732 470 423 57.8%
5,041 2344 1,204 1,139 48.6% 4,937 2447 1,230 1,168 47.7% 4,838 2547 1,250 1,196 46.9%
1,263 1626 659 625 38.5% 1,219 1670 672 641 38.4% 1,180 1709 682 656 38.4%
4 0 0 0 45.0% 4 0 0 0 45.0% 4 0 0 0 45.0%
0 0 0 0 0.0% 0 0 0 0 0.0% 0 0 0 0 0.0%
0 0 0 0 0.0% 0 0 0 0 0.0% 0 0 0 0 0.0%
5 0 0 0 45.0% 5 0 0 0 45.0% 5 0 0 0 45.0%
405 0 0 0 0.0% 405 0 0 0 0.0% 405 0 0 0 0.0%
3,498 17 1 1 8.5% 3,498 17 1 1 8.5% 3,498 17 1 1 8.5%
42,746 5043 3,178 2,807 55.7% 42,189 5600 3,377 3,039 54.3% 41,678 6111 3,636 3,252 53.2%
0 0 0 0 0.0% 0 0 0 0 0.0% 0 0 0 0 0.0%
0 0 0 0 0.0% 0 0 0 0 0.0% 0 0 0 0 0.0%
0 0 0 0 0.0% 0 0 0 0 0.0% 0 0 0 0 0.0%
0 0 0 0 0.0% 0 0 0 0 0.0% 0 0 0 0 0.0%
0 0 0 0 0.0% 0 0 0 0 0.0% 0 0 0 0 0.0%
0 0 0 0 0.0% 0 0 0 0 0.0% 0 0 0 0 0.0%
0 0 0 0 0.0% 0 0 0 0 0.0% 0 0 0 0 0.0%
0 0 0 0 0.0% 0 0 0 0 0.0% 0 0 0 0 0.0%
0 0 0 0 0.0% 0 0 0 0 0.0% 0 0 0 0 0.0%
0 0 0 0 0.0% 0 0 0 0 0.0% 0 0 0 0 0.0%
0 0 0 0 0.0% 0 0 0 0 0.0% 0 0 0 0 0.0%
0 0 0 0 0.0% 0 0 0 0 0.0% 0 0 0 0 0.0%
0 0 0 0 0.0% 0 0 0 0 0.0% 0 0 0 0 0.0%
0 0 0 0 0.0% 0 0 0 0 0.0% 0 0 0 0 0.0%
0 0 0 0 0.0% 0 0 0 0 0.0% 0 0 0 0 0.0%
0 0 0 0 0.0% 0 0 0 0 0.0% 0 0 0 0 0.0%
0 0 0 0 0.0% 0 0 0 0 0.0% 0 0 0 0 0.0%
0 0 0 0 0.0% 0 0 0 0 0.0% 0 0 0 0 0.0%
0 0 0 0 0.0% 0 0 0 0 0.0% 0 0 0 0 0.0%
Adverse Scenario
31/12/2018 31/12/2019 31/12/2020
Performing
exposure1
Non
performing
exposure1
Coverage Ratio -
Non performing
exposures1
Adverse Scenario
31/12/2018
Of which:
from non
performing
exposures
Coverage Ratio -
Non performing
exposures1
Performing
exposure1
Non
performing
exposure1
Stock of
provisions
Of which:
from non
performing
exposures
Stock of
provisions
Of which:
from non
performing
exposures
Coverage Ratio -
Non performing
exposures1
Performing
exposure1
Non
performing
exposure1
Stock of
provisions
31/12/2019 31/12/2020
Performing
exposure1
Non
performing
exposure1
Stock of
provisions
Of which:
from non
performing
exposures
Coverage Ratio -
Non performing
exposures1
Coverage Ratio -
Non performing
exposures1
Performing
exposure1
Non
performing
exposure1
Stock of
provisions
Of which:
from non
performing
exposures
Coverage Ratio -
Non performing
exposures1
Performing
exposure1
Non
performing
exposure1
Stock of
provisions
Of which:
from non
performing
exposures
Adverse Scenario
31/12/2018 31/12/2019 31/12/2020
Performing
exposure1
Non
performing
exposure1
Coverage Ratio -
Non performing
exposures1
Of which:
from non
performing
exposures
Coverage Ratio -
Non performing
exposures1
Performing
exposure1
Non
performing
exposure1
Stock of
provisions
Of which:
from non
performing
exposures
Stock of
provisions
Of which:
from non
performing
exposures
Coverage Ratio -
Non performing
exposures1
Performing
exposure1
Non
performing
exposure1
Stock of
provisions

(mln EUR, %)
Central governments or central banks
Regional governments or local authorities
Public sector entities
Multilateral Development Banks
International Organisations
Institutions
Corporates
of which: SME
Retail
of which: SME
Secured by mortgages on immovable property
of which: SME
Items associated with particularly high risk
Covered bonds
Claims on institutions and corporates with a ST credit assessment
Collective investments undertakings (CIU)
Equity
Securitisation
Other exposures
Standardised Total1 Computed as defined in paragraphs 49 and 112 of the Methodological note)
N.A.
N.A.
N.A.
2018 EU-wide Stress Test: Credit risk STAUnione di Banche Italiane Società Per Azioni
0 0 0 0 0.0% 0 0 0 0 0.0% 0 0 0 0 0.0%
0 0 0 0 0.0% 0 0 0 0 0.0% 0 0 0 0 0.0%
0 0 0 0 0.0% 0 0 0 0 0.0% 0 0 0 0 0.0%
0 0 0 0 0.0% 0 0 0 0 0.0% 0 0 0 0 0.0%
0 0 0 0 0.0% 0 0 0 0 0.0% 0 0 0 0 0.0%
0 0 0 0 0.0% 0 0 0 0 0.0% 0 0 0 0 0.0%
0 0 0 0 0.0% 0 0 0 0 0.0% 0 0 0 0 0.0%
0 0 0 0 0.0% 0 0 0 0 0.0% 0 0 0 0 0.0%
0 0 0 0 0.0% 0 0 0 0 0.0% 0 0 0 0 0.0%
0 0 0 0 0.0% 0 0 0 0 0.0% 0 0 0 0 0.0%
0 0 0 0 0.0% 0 0 0 0 0.0% 0 0 0 0 0.0%
0 0 0 0 0.0% 0 0 0 0 0.0% 0 0 0 0 0.0%
0 0 0 0 0.0% 0 0 0 0 0.0% 0 0 0 0 0.0%
0 0 0 0 0.0% 0 0 0 0 0.0% 0 0 0 0 0.0%
0 0 0 0 0.0% 0 0 0 0 0.0% 0 0 0 0 0.0%
0 0 0 0 0.0% 0 0 0 0 0.0% 0 0 0 0 0.0%
0 0 0 0 0.0% 0 0 0 0 0.0% 0 0 0 0 0.0%
0 0 0 0 0.0% 0 0 0 0 0.0% 0 0 0 0 0.0%
0 0 0 0 0.0% 0 0 0 0 0.0% 0 0 0 0 0.0%
0 0 0 0 0.0% 0 0 0 0 0.0% 0 0 0 0 0.0%
0 0 0 0 0.0% 0 0 0 0 0.0% 0 0 0 0 0.0%
0 0 0 0 0.0% 0 0 0 0 0.0% 0 0 0 0 0.0%
0 0 0 0 0.0% 0 0 0 0 0.0% 0 0 0 0 0.0%
0 0 0 0 0.0% 0 0 0 0 0.0% 0 0 0 0 0.0%
0 0 0 0 0.0% 0 0 0 0 0.0% 0 0 0 0 0.0%
0 0 0 0 0.0% 0 0 0 0 0.0% 0 0 0 0 0.0%
0 0 0 0 0.0% 0 0 0 0 0.0% 0 0 0 0 0.0%
0 0 0 0 0.0% 0 0 0 0 0.0% 0 0 0 0 0.0%
0 0 0 0 0.0% 0 0 0 0 0.0% 0 0 0 0 0.0%
0 0 0 0 0.0% 0 0 0 0 0.0% 0 0 0 0 0.0%
0 0 0 0 0.0% 0 0 0 0 0.0% 0 0 0 0 0.0%
0 0 0 0 0.0% 0 0 0 0 0.0% 0 0 0 0 0.0%
0 0 0 0 0.0% 0 0 0 0 0.0% 0 0 0 0 0.0%
0 0 0 0 0.0% 0 0 0 0 0.0% 0 0 0 0 0.0%
0 0 0 0 0.0% 0 0 0 0 0.0% 0 0 0 0 0.0%
0 0 0 0 0.0% 0 0 0 0 0.0% 0 0 0 0 0.0%
0 0 0 0 0.0% 0 0 0 0 0.0% 0 0 0 0 0.0%
0 0 0 0 0.0% 0 0 0 0 0.0% 0 0 0 0 0.0%
0 0 0 0 0.0% 0 0 0 0 0.0% 0 0 0 0 0.0%
0 0 0 0 0.0% 0 0 0 0 0.0% 0 0 0 0 0.0%
0 0 0 0 0.0% 0 0 0 0 0.0% 0 0 0 0 0.0%
0 0 0 0 0.0% 0 0 0 0 0.0% 0 0 0 0 0.0%
0 0 0 0 0.0% 0 0 0 0 0.0% 0 0 0 0 0.0%
0 0 0 0 0.0% 0 0 0 0 0.0% 0 0 0 0 0.0%
0 0 0 0 0.0% 0 0 0 0 0.0% 0 0 0 0 0.0%
0 0 0 0 0.0% 0 0 0 0 0.0% 0 0 0 0 0.0%
0 0 0 0 0.0% 0 0 0 0 0.0% 0 0 0 0 0.0%
0 0 0 0 0.0% 0 0 0 0 0.0% 0 0 0 0 0.0%
0 0 0 0 0.0% 0 0 0 0 0.0% 0 0 0 0 0.0%
0 0 0 0 0.0% 0 0 0 0 0.0% 0 0 0 0 0.0%
0 0 0 0 0.0% 0 0 0 0 0.0% 0 0 0 0 0.0%
0 0 0 0 0.0% 0 0 0 0 0.0% 0 0 0 0 0.0%
0 0 0 0 0.0% 0 0 0 0 0.0% 0 0 0 0 0.0%
0 0 0 0 0.0% 0 0 0 0 0.0% 0 0 0 0 0.0%
0 0 0 0 0.0% 0 0 0 0 0.0% 0 0 0 0 0.0%
0 0 0 0 0.0% 0 0 0 0 0.0% 0 0 0 0 0.0%
0 0 0 0 0.0% 0 0 0 0 0.0% 0 0 0 0 0.0%
Adverse Scenario
31/12/2018 31/12/2019 31/12/2020
Performing
exposure1
Non
performing
exposure1
Stock of
provisions
Of which:
from non
performing
exposures
Coverage Ratio -
Non performing
exposures1
Coverage Ratio -
Non performing
exposures1
Performing
exposure1
Non
performing
exposure1
Stock of
provisions
Of which:
from non
performing
exposures
Coverage Ratio -
Non performing
exposures1
Performing
exposure1
Non
performing
exposure1
Stock of
provisions
Of which:
from non
performing
exposures
Adverse Scenario
31/12/2018 31/12/2019 31/12/2020
Performing
exposure1
Non
performing
exposure1
Coverage Ratio -
Non performing
exposures1
Adverse Scenario
31/12/2018
Of which:
from non
performing
exposures
Coverage Ratio -
Non performing
exposures1
Performing
exposure1
Non
performing
exposure1
Stock of
provisions
Of which:
from non
performing
exposures
Stock of
provisions
Of which:
from non
performing
exposures
Coverage Ratio -
Non performing
exposures1
Performing
exposure1
Non
performing
exposure1
Stock of
provisions
31/12/2019 31/12/2020
Performing
exposure1
Non
performing
exposure1
Stock of
provisions
Of which:
from non
performing
exposures
Coverage Ratio -
Non performing
exposures1
Coverage Ratio -
Non performing
exposures1
Performing
exposure1
Non
performing
exposure1
Stock of
provisions
Of which:
from non
performing
exposures
Coverage Ratio -
Non performing
exposures1
Performing
exposure1
Non
performing
exposure1
Stock of
provisions
Of which:
from non
performing
exposures

(mln EUR, %)
Central governments or central banks
Regional governments or local authorities
Public sector entities
Multilateral Development Banks
International Organisations
Institutions
Corporates
of which: SME
Retail
of which: SME
Secured by mortgages on immovable property
of which: SME
Items associated with particularly high risk
Covered bonds
Claims on institutions and corporates with a ST credit assessment
Collective investments undertakings (CIU)
Equity
Securitisation
Other exposures
Standardised Total1 Computed as defined in paragraphs 49 and 112 of the Methodological note)
N.A.
N.A.
N.A.
2018 EU-wide Stress Test: Credit risk STAUnione di Banche Italiane Società Per Azioni
0 0 0 0 0.0% 0 0 0 0 0.0% 0 0 0 0 0.0%
0 0 0 0 0.0% 0 0 0 0 0.0% 0 0 0 0 0.0%
0 0 0 0 0.0% 0 0 0 0 0.0% 0 0 0 0 0.0%
0 0 0 0 0.0% 0 0 0 0 0.0% 0 0 0 0 0.0%
0 0 0 0 0.0% 0 0 0 0 0.0% 0 0 0 0 0.0%
0 0 0 0 0.0% 0 0 0 0 0.0% 0 0 0 0 0.0%
0 0 0 0 0.0% 0 0 0 0 0.0% 0 0 0 0 0.0%
0 0 0 0 0.0% 0 0 0 0 0.0% 0 0 0 0 0.0%
0 0 0 0 0.0% 0 0 0 0 0.0% 0 0 0 0 0.0%
0 0 0 0 0.0% 0 0 0 0 0.0% 0 0 0 0 0.0%
0 0 0 0 0.0% 0 0 0 0 0.0% 0 0 0 0 0.0%
0 0 0 0 0.0% 0 0 0 0 0.0% 0 0 0 0 0.0%
0 0 0 0 0.0% 0 0 0 0 0.0% 0 0 0 0 0.0%
0 0 0 0 0.0% 0 0 0 0 0.0% 0 0 0 0 0.0%
0 0 0 0 0.0% 0 0 0 0 0.0% 0 0 0 0 0.0%
0 0 0 0 0.0% 0 0 0 0 0.0% 0 0 0 0 0.0%
0 0 0 0 0.0% 0 0 0 0 0.0% 0 0 0 0 0.0%
0 0 0 0 0.0% 0 0 0 0 0.0% 0 0 0 0 0.0%
0 0 0 0 0.0% 0 0 0 0 0.0% 0 0 0 0 0.0%
0 0 0 0 0.0% 0 0 0 0 0.0% 0 0 0 0 0.0%
0 0 0 0 0.0% 0 0 0 0 0.0% 0 0 0 0 0.0%
0 0 0 0 0.0% 0 0 0 0 0.0% 0 0 0 0 0.0%
0 0 0 0 0.0% 0 0 0 0 0.0% 0 0 0 0 0.0%
0 0 0 0 0.0% 0 0 0 0 0.0% 0 0 0 0 0.0%
0 0 0 0 0.0% 0 0 0 0 0.0% 0 0 0 0 0.0%
0 0 0 0 0.0% 0 0 0 0 0.0% 0 0 0 0 0.0%
0 0 0 0 0.0% 0 0 0 0 0.0% 0 0 0 0 0.0%
0 0 0 0 0.0% 0 0 0 0 0.0% 0 0 0 0 0.0%
0 0 0 0 0.0% 0 0 0 0 0.0% 0 0 0 0 0.0%
0 0 0 0 0.0% 0 0 0 0 0.0% 0 0 0 0 0.0%
0 0 0 0 0.0% 0 0 0 0 0.0% 0 0 0 0 0.0%
0 0 0 0 0.0% 0 0 0 0 0.0% 0 0 0 0 0.0%
0 0 0 0 0.0% 0 0 0 0 0.0% 0 0 0 0 0.0%
0 0 0 0 0.0% 0 0 0 0 0.0% 0 0 0 0 0.0%
0 0 0 0 0.0% 0 0 0 0 0.0% 0 0 0 0 0.0%
0 0 0 0 0.0% 0 0 0 0 0.0% 0 0 0 0 0.0%
0 0 0 0 0.0% 0 0 0 0 0.0% 0 0 0 0 0.0%
0 0 0 0 0.0% 0 0 0 0 0.0% 0 0 0 0 0.0%
0 0 0 0 0.0% 0 0 0 0 0.0% 0 0 0 0 0.0%
0 0 0 0 0.0% 0 0 0 0 0.0% 0 0 0 0 0.0%
0 0 0 0 0.0% 0 0 0 0 0.0% 0 0 0 0 0.0%
0 0 0 0 0.0% 0 0 0 0 0.0% 0 0 0 0 0.0%
0 0 0 0 0.0% 0 0 0 0 0.0% 0 0 0 0 0.0%
0 0 0 0 0.0% 0 0 0 0 0.0% 0 0 0 0 0.0%
0 0 0 0 0.0% 0 0 0 0 0.0% 0 0 0 0 0.0%
0 0 0 0 0.0% 0 0 0 0 0.0% 0 0 0 0 0.0%
0 0 0 0 0.0% 0 0 0 0 0.0% 0 0 0 0 0.0%
0 0 0 0 0.0% 0 0 0 0 0.0% 0 0 0 0 0.0%
0 0 0 0 0.0% 0 0 0 0 0.0% 0 0 0 0 0.0%
0 0 0 0 0.0% 0 0 0 0 0.0% 0 0 0 0 0.0%
0 0 0 0 0.0% 0 0 0 0 0.0% 0 0 0 0 0.0%
0 0 0 0 0.0% 0 0 0 0 0.0% 0 0 0 0 0.0%
0 0 0 0 0.0% 0 0 0 0 0.0% 0 0 0 0 0.0%
0 0 0 0 0.0% 0 0 0 0 0.0% 0 0 0 0 0.0%
0 0 0 0 0.0% 0 0 0 0 0.0% 0 0 0 0 0.0%
0 0 0 0 0.0% 0 0 0 0 0.0% 0 0 0 0 0.0%
0 0 0 0 0.0% 0 0 0 0 0.0% 0 0 0 0 0.0%
Adverse Scenario
31/12/2018 31/12/2019 31/12/2020
Performing
exposure1
Non
performing
exposure1
Coverage Ratio -
Non performing
exposures1
Adverse Scenario
31/12/2018
Of which:
from non
performing
exposures
Coverage Ratio -
Non performing
exposures1
Performing
exposure1
Non
performing
exposure1
Stock of
provisions
Of which:
from non
performing
exposures
Stock of
provisions
Of which:
from non
performing
exposures
Coverage Ratio -
Non performing
exposures1
Performing
exposure1
Non
performing
exposure1
Stock of
provisions
31/12/2019 31/12/2020
Performing
exposure1
Non
performing
exposure1
Stock of
provisions
Of which:
from non
performing
exposures
Coverage Ratio -
Non performing
exposures1
Coverage Ratio -
Non performing
exposures1
Performing
exposure1
Non
performing
exposure1
Stock of
provisions
Of which:
from non
performing
exposures
Coverage Ratio -
Non performing
exposures1
Performing
exposure1
Non
performing
exposure1
Stock of
provisions
Of which:
from non
performing
exposures
Adverse Scenario
31/12/2018 31/12/2019 31/12/2020
Performing
exposure1
Non
performing
exposure1
Coverage Ratio -
Non performing
exposures1
Of which:
from non
performing
exposures
Coverage Ratio -
Non performing
exposures1
Performing
exposure1
Non
performing
exposure1
Stock of
provisions
Of which:
from non
performing
exposures
Stock of
provisions
Of which:
from non
performing
exposures
Coverage Ratio -
Non performing
exposures1
Performing
exposure1
Non
performing
exposure1
Stock of
provisions
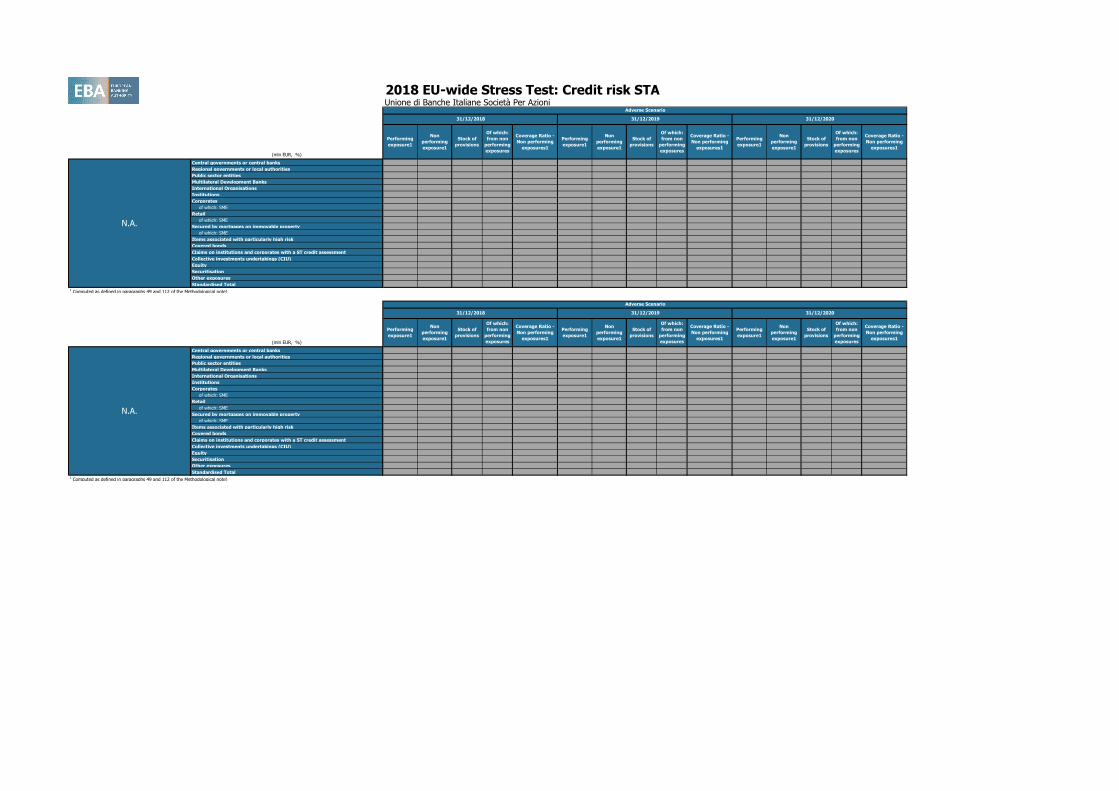
(mln EUR, %)
Central governments or central banks
Regional governments or local authorities
Public sector entities
Multilateral Development Banks
International Organisations
Institutions
Corporates
of which: SME
Retail
of which: SME
Secured by mortgages on immovable property
of which: SME
Items associated with particularly high risk
Covered bonds
Claims on institutions and corporates with a ST credit assessment
Collective investments undertakings (CIU)
Equity
Securitisation
Other exposures
Standardised Total1 Computed as defined in paragraphs 49 and 112 of the Methodological note)
N.A.
N.A.
2018 EU-wide Stress Test: Credit risk STAUnione di Banche Italiane Società Per Azioni
0 0 0 0 0.0% 0 0 0 0 0.0% 0 0 0 0 0.0%
0 0 0 0 0.0% 0 0 0 0 0.0% 0 0 0 0 0.0%
0 0 0 0 0.0% 0 0 0 0 0.0% 0 0 0 0 0.0%
0 0 0 0 0.0% 0 0 0 0 0.0% 0 0 0 0 0.0%
0 0 0 0 0.0% 0 0 0 0 0.0% 0 0 0 0 0.0%
0 0 0 0 0.0% 0 0 0 0 0.0% 0 0 0 0 0.0%
0 0 0 0 0.0% 0 0 0 0 0.0% 0 0 0 0 0.0%
0 0 0 0 0.0% 0 0 0 0 0.0% 0 0 0 0 0.0%
0 0 0 0 0.0% 0 0 0 0 0.0% 0 0 0 0 0.0%
0 0 0 0 0.0% 0 0 0 0 0.0% 0 0 0 0 0.0%
0 0 0 0 0.0% 0 0 0 0 0.0% 0 0 0 0 0.0%
0 0 0 0 0.0% 0 0 0 0 0.0% 0 0 0 0 0.0%
0 0 0 0 0.0% 0 0 0 0 0.0% 0 0 0 0 0.0%
0 0 0 0 0.0% 0 0 0 0 0.0% 0 0 0 0 0.0%
0 0 0 0 0.0% 0 0 0 0 0.0% 0 0 0 0 0.0%
0 0 0 0 0.0% 0 0 0 0 0.0% 0 0 0 0 0.0%
0 0 0 0 0.0% 0 0 0 0 0.0% 0 0 0 0 0.0%
0 0 0 0 0.0% 0 0 0 0 0.0% 0 0 0 0 0.0%
0 0 0 0 0.0% 0 0 0 0 0.0% 0 0 0 0 0.0%
0 0 0 0 0.0% 0 0 0 0 0.0% 0 0 0 0 0.0%
0 0 0 0 0.0% 0 0 0 0 0.0% 0 0 0 0 0.0%
0 0 0 0 0.0% 0 0 0 0 0.0% 0 0 0 0 0.0%
0 0 0 0 0.0% 0 0 0 0 0.0% 0 0 0 0 0.0%
0 0 0 0 0.0% 0 0 0 0 0.0% 0 0 0 0 0.0%
0 0 0 0 0.0% 0 0 0 0 0.0% 0 0 0 0 0.0%
0 0 0 0 0.0% 0 0 0 0 0.0% 0 0 0 0 0.0%
0 0 0 0 0.0% 0 0 0 0 0.0% 0 0 0 0 0.0%
0 0 0 0 0.0% 0 0 0 0 0.0% 0 0 0 0 0.0%
0 0 0 0 0.0% 0 0 0 0 0.0% 0 0 0 0 0.0%
0 0 0 0 0.0% 0 0 0 0 0.0% 0 0 0 0 0.0%
0 0 0 0 0.0% 0 0 0 0 0.0% 0 0 0 0 0.0%
0 0 0 0 0.0% 0 0 0 0 0.0% 0 0 0 0 0.0%
0 0 0 0 0.0% 0 0 0 0 0.0% 0 0 0 0 0.0%
0 0 0 0 0.0% 0 0 0 0 0.0% 0 0 0 0 0.0%
0 0 0 0 0.0% 0 0 0 0 0.0% 0 0 0 0 0.0%
0 0 0 0 0.0% 0 0 0 0 0.0% 0 0 0 0 0.0%
0 0 0 0 0.0% 0 0 0 0 0.0% 0 0 0 0 0.0%
0 0 0 0 0.0% 0 0 0 0 0.0% 0 0 0 0 0.0%
Adverse Scenario
31/12/2018 31/12/2019 31/12/2020
Performing
exposure1
Non
performing
exposure1
Stock of
provisions
Of which:
from non
performing
exposures
Coverage Ratio -
Non performing
exposures1
Coverage Ratio -
Non performing
exposures1
Performing
exposure1
Non
performing
exposure1
Stock of
provisions
Of which:
from non
performing
exposures
Coverage Ratio -
Non performing
exposures1
Performing
exposure1
Non
performing
exposure1
Stock of
provisions
Of which:
from non
performing
exposures
Adverse Scenario
31/12/2018 31/12/2019 31/12/2020
Coverage Ratio -
Non performing
exposures1
Of which:
from non
performing
exposures
Coverage Ratio -
Non performing
exposures1
Performing
exposure1
Non
performing
exposure1
Stock of
provisions
Of which:
from non
performing
exposures
Stock of
provisions
Of which:
from non
performing
exposures
Coverage Ratio -
Non performing
exposures1
Performing
exposure1
Non
performing
exposure1
Stock of
provisions
Performing
exposure1
Non
performing
exposure1
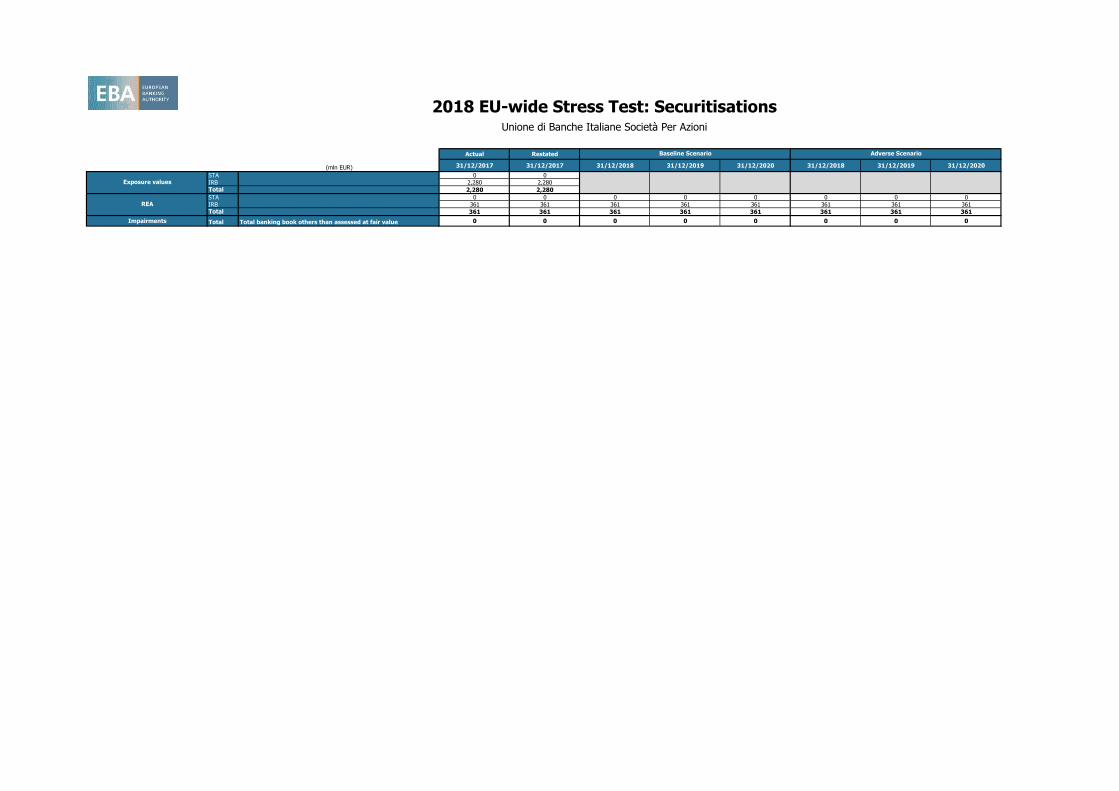
Actual Restated
(mln EUR) 31/12/2017 31/12/2017 31/12/2018 31/12/2019 31/12/2020 31/12/2018 31/12/2019 31/12/2020
STA 0 0
IRB 2,280 2,280Total 2,280 2,280
STA 0 0 0 0 0 0 0 0
IRB 361 361 361 361 361 361 361 361Total 361 361 361 361 361 361 361 361
Impairments Total Total banking book others than assessed at fair value 0 0 0 0 0 0 0 0
REA
2018 EU-wide Stress Test: SecuritisationsUnione di Banche Italiane Società Per Azioni
Baseline Scenario Adverse Scenario
Exposure values
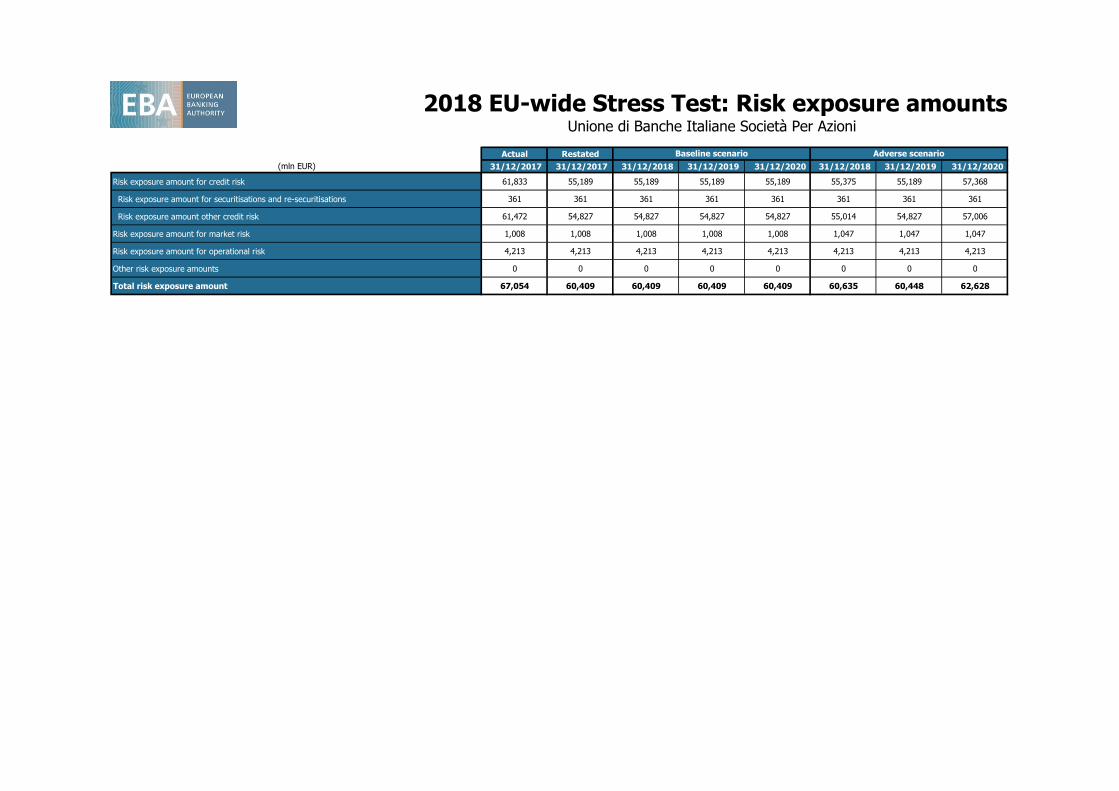
2018 EU-wide Stress Test: Risk exposure amountsUnione di Banche Italiane Società Per Azioni
Actual Restated
(mln EUR) 31/12/2017 31/12/2017 31/12/2018 31/12/2019 31/12/2020 31/12/2018 31/12/2019 31/12/2020
Risk exposure amount for credit risk 61,833 55,189 55,189 55,189 55,189 55,375 55,189 57,368
Risk exposure amount for securitisations and re-securitisations 361 361 361 361 361 361 361 361
Risk exposure amount other credit risk 61,472 54,827 54,827 54,827 54,827 55,014 54,827 57,006
Risk exposure amount for market risk 1,008 1,008 1,008 1,008 1,008 1,047 1,047 1,047
Risk exposure amount for operational risk 4,213 4,213 4,213 4,213 4,213 4,213 4,213 4,213
Other risk exposure amounts 0 0 0 0 0 0 0 0
Total risk exposure amount 67,054 60,409 60,409 60,409 60,409 60,635 60,448 62,628
Baseline scenario Adverse scenario

2018 EU-wide Stress Test: Capital
Unione di Banche Italiane Società Per Azioni
Actual Restated
(mln EUR,%) 31/12/2017 31/12/2017 2018 2019 2020 2018 2019 2020
A OWN FUNDS 9,475 8,657 8,721 9,060 9,300 7,691 7,352 6,982
A.1COMMON EQUITY TIER 1 CAPITAL (net of deductions and after applying transitional
adjustments)7,755 7,094 6,988 7,327 7,567 5,957 5,618 5,235
A.1.1 Capital instruments eligible as CET1 Capital (including share premium and net own capital instruments) 6,112 6,112 6,112 6,112 6,112 6,112 6,112 6,112
A.1.1.1 Of which: CET1 instruments subscribed by Government 0 0 0 0 0 0 0 0
A.1.2 Retained earnings 1,815 1,815 1,588 1,863 2,047 964 829 533
A.1.3 Accumulated other comprehensive income -120 -40 -40 -40 -40 -304 -304 -304
A.1.3.1 Arising from full revaluation, cash flow hedge and liquidity reserves -68 12 12 12 12 -252 -252 -252
A.1.3.2 OCI Impact of defined benefit pension plans [gain or (-) loss] 0 0 0 0 0 0 0 0
A.1.3.3 Other OCI contributions -52 -52 -52 -52 -52 -52 -52 -52
A.1.4 Other Reserves 1,959 1,093 1,093 1,093 1,093 1,093 1,093 1,093
A.1.5 Funds for general banking risk 0 0 0 0 0 0 0 0
A.1.6 Minority interest given recognition in CET1 capital 0 0 0 0 0 0 0 0
A.1.7 Adjustments to CET1 due to prudential filters -8 -8 -8 -8 -8 -8 -8 -8
A.1.8 (-) Intangible assets (including Goodwill) -1,723 -1,723 -1,723 -1,723 -1,723 -1,723 -1,723 -1,723
A.1.9 (-) DTAs that rely on future profitability and do not arise from temporary differences net of associated DTLs -331 -331 -427 -230 -97 -691 -744 -867
A.1.10 (-) IRB shortfall of credit risk adjustments to expected losses -39 -149 0 0 0 0 0 0
A.1.11 (-) Defined benefit pension fund assets -1 -1 -1 -1 -1 -1 -1 -1
A.1.12 (-) Reciprocal cross holdings in CET1 Capital 0 0 0 0 0 0 0 0
A.1.13 (-) Excess deduction from AT1 items over AT1 Capital -7 -18 0 0 0 0 0 0
A.1.14 (-) Deductions related to assets which can alternatively be subject to a 1.250% risk weight 0 0 0 0 0 0 0 0
A.1.14.1 Of which: from securitisation positions (-) 0 0 0 0 0 0 0 0
A.1.15(-) Holdings of CET1 capital instruments of financial sector entities where the institiution does not have a
significant investment0 0 0 0 0 0 0 0
A.1.16 (-) Deductible DTAs that rely on future profitability and arise from temporary differences 0 0 0 0 0 0 0 0
A.1.17 (-) CET1 instruments of financial sector entities where the institiution has a significant investment 0 0 0 0 0 0 0 0
A.1.18 (-) Amount exceding the 17.65% threshold 0 0 0 0 0 -55 -88 -162
A.1.19 (-) Additional deductions of CET1 Capital due to Article 3 CRR 0 0 0 0 0 0 0 0
A.1.20 CET1 capital elements or deductions - other 0 0 0 0 0 0 0 0
A.1.21 Memo item: Gross cumulative IFRS 9 impact on capital (net of taxes) -787
A.1.21.1 Of which: subject to transitional arrangements -255 -414 -308 -264 -600 -534 -804
A.1.21.1.1 Increase in IFRS 9 ECL provisions net of EL compared to related IAS 39 figures as at 31/12/17 255 255 255 255 255 255 255
A.1.21.1.2Increase in non-credit-impaired IFRS 9 ECL provisions net of EL compared to related IFRS 9
figures as at 01/01/20180 159 53 9 345 279 549
A.1.21.1.3 Increase of CET1 capital due to the tax deductibility of the amounts above 0 0 0 0 0 0 0
A.1.22 Transitional adjustments 96 345 394 262 185 570 454 563
A.1.22.1 Transitional adjustments due to grandfathered CET1 Capital instruments (+/-) 0 0 0 0 0 0 0 0
A.1.22.2 Transitional adjustments due to additional minority interests (+/-) 9 9 0 0 0 0 0 0
A.1.22.3 Adjustments due to IFRS 9 transitional arrangements 242 394 262 185 570 454 563
A.1.22.3.1 From the increased IFRS 9 ECL provisions net of EL 242 394 262 185 570 454 563
A.1.22.3.2 From the amount of DTAs that is deducted from CET1 capital 0 0 0 0 0 0 0
A.1.22.4 Other transitional adjustments to CET1 Capital 88 94 0 0 0 0 0 0
A.1.22.4.1Of which: due to DTAs that rely on future profitability and do not arise from temporary
differences66 66 0 0 0 0 0 0
A.1.22.4.2Of which: due to DTAs that rely on future profitability and arise from temporary differences and
CET1 instruments of financial sector entities where the institution has a significant investment0 0 0 0 0 0 0 0
A.1.22.4.3 Of which: Transitional adjustments to CET1 Capital from unrealised gains/losses (+/-) 14 -2
Baseline Scenario Adverse Scenario
OWN FUNDS
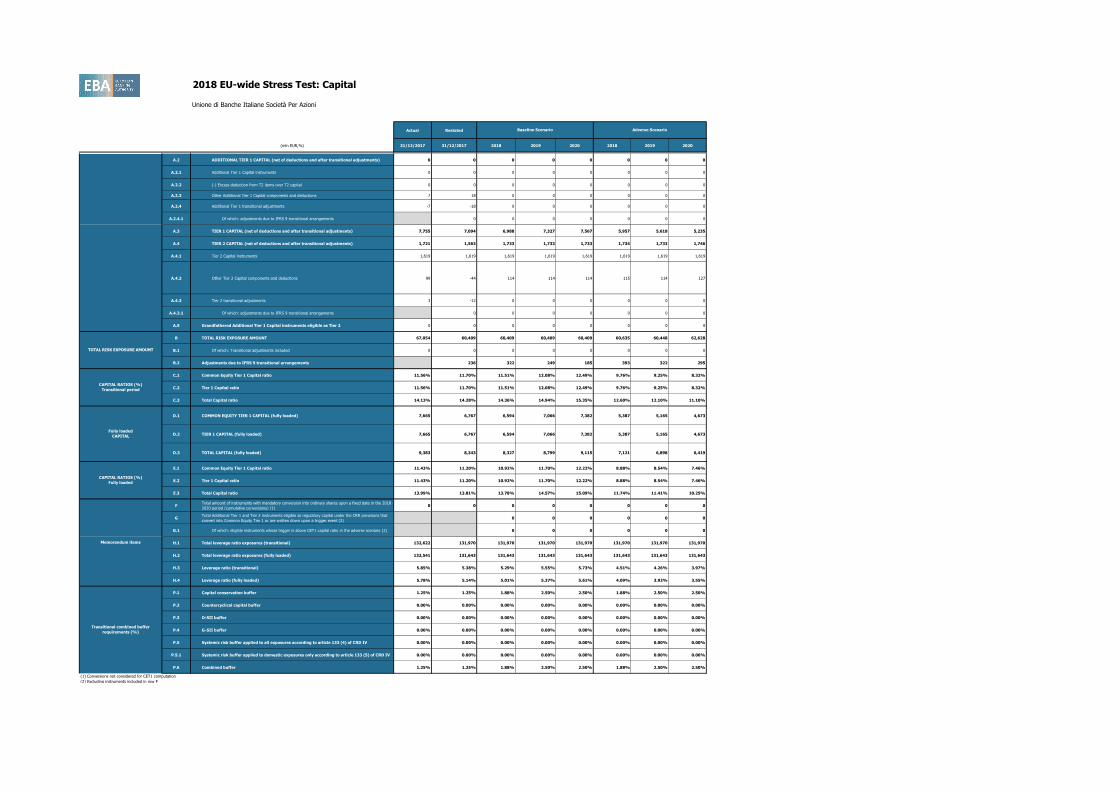
2018 EU-wide Stress Test: Capital
Unione di Banche Italiane Società Per Azioni
Actual Restated
(mln EUR,%) 31/12/2017 31/12/2017 2018 2019 2020 2018 2019 2020
Baseline Scenario Adverse Scenario
OWN FUNDS
A.2 ADDITIONAL TIER 1 CAPITAL (net of deductions and after transitional adjustments) 0 0 0 0 0 0 0 0
A.2.1 Additional Tier 1 Capital instruments 0 0 0 0 0 0 0 0
A.2.2 (-) Excess deduction from T2 items over T2 capital 0 0 0 0 0 0 0 0
A.2.3 Other Additional Tier 1 Capital components and deductions 7 18 0 0 0 0 0 0
A.2.4 Additional Tier 1 transitional adjustments -7 -18 0 0 0 0 0 0
A.2.4.1 Of which: adjustments due to IFRS 9 transitional arrangements 0 0 0 0 0 0 0
A.3 TIER 1 CAPITAL (net of deductions and after transitional adjustments) 7,755 7,094 6,988 7,327 7,567 5,957 5,618 5,235
A.4 TIER 2 CAPITAL (net of deductions and after transitional adjustments) 1,721 1,563 1,733 1,733 1,733 1,734 1,733 1,746
A.4.1 Tier 2 Capital instruments 1,619 1,619 1,619 1,619 1,619 1,619 1,619 1,619
A.4.2 Other Tier 2 Capital components and deductions 99 -44 114 114 114 115 114 127
A.4.3 Tier 2 transitional adjustments 3 -12 0 0 0 0 0 0
A.4.3.1 Of which: adjustments due to IFRS 9 transitional arrangements 0 0 0 0 0 0 0
A.5 Grandfathered Additional Tier 1 Capital instruments eligible as Tier 2 0 0 0 0 0 0 0 0
B TOTAL RISK EXPOSURE AMOUNT 67,054 60,409 60,409 60,409 60,409 60,635 60,448 62,628
B.1 Of which: Transitional adjustments included 0 0 0 0 0 0 0 0
B.2 Adjustments due to IFRS 9 transitional arrangements 236 322 249 185 393 322 295
C.1 Common Equity Tier 1 Capital ratio 11.56% 11.70% 11.51% 12.08% 12.49% 9.76% 9.25% 8.32%
C.2 Tier 1 Capital ratio 11.56% 11.70% 11.51% 12.08% 12.49% 9.76% 9.25% 8.32%
C.3 Total Capital ratio 14.13% 14.28% 14.36% 14.94% 15.35% 12.60% 12.10% 11.10%
D.1 COMMON EQUITY TIER 1 CAPITAL (fully loaded) 7,665 6,767 6,594 7,066 7,382 5,387 5,165 4,673
D.2 TIER 1 CAPITAL (fully loaded) 7,665 6,767 6,594 7,066 7,382 5,387 5,165 4,673
D.3 TOTAL CAPITAL (fully loaded) 9,383 8,343 8,327 8,799 9,115 7,121 6,898 6,419
E.1 Common Equity Tier 1 Capital ratio 11.43% 11.20% 10.92% 11.70% 12.22% 8.88% 8.54% 7.46%
E.2 Tier 1 Capital ratio 11.43% 11.20% 10.92% 11.70% 12.22% 8.88% 8.54% 7.46%
E.3 Total Capital ratio 13.99% 13.81% 13.78% 14.57% 15.09% 11.74% 11.41% 10.25%
FTotal amount of instruments with mandatory conversion into ordinary shares upon a fixed date in the 2018 -
2020 period (cumulative conversions) (1)0 0 0 0 0 0 0 0
GTotal Additional Tier 1 and Tier 2 instruments eligible as regulatory capital under the CRR provisions that
convert into Common Equity Tier 1 or are written down upon a trigger event (2)0 0 0 0 0 0
G.1 Of which: eligible instruments whose trigger is above CET1 capital ratio in the adverse scenario (2) 0 0 0 0 0 0
H.1 Total leverage ratio exposures (transitional) 132,622 131,970 131,970 131,970 131,970 131,970 131,970 131,970
H.2 Total leverage ratio exposures (fully loaded) 132,541 131,643 131,643 131,643 131,643 131,643 131,643 131,643
H.3 Leverage ratio (transitional) 5.85% 5.38% 5.29% 5.55% 5.73% 4.51% 4.26% 3.97%
H.4 Leverage ratio (fully loaded) 5.78% 5.14% 5.01% 5.37% 5.61% 4.09% 3.92% 3.55%
P.1 Capital conservation buffer 1.25% 1.25% 1.88% 2.50% 2.50% 1.88% 2.50% 2.50%
P.2 Countercyclical capital buffer 0.00% 0.00% 0.00% 0.00% 0.00% 0.00% 0.00% 0.00%
P.3 O-SII buffer 0.00% 0.00% 0.00% 0.00% 0.00% 0.00% 0.00% 0.00%
P.4 G-SII buffer 0.00% 0.00% 0.00% 0.00% 0.00% 0.00% 0.00% 0.00%
P.5 Systemic risk buffer applied to all exposures according to article 133 (4) of CRD IV 0.00% 0.00% 0.00% 0.00% 0.00% 0.00% 0.00% 0.00%
P.5.1 Systemic risk buffer applied to domestic exposures only according to article 133 (5) of CRD IV 0.00% 0.00% 0.00% 0.00% 0.00% 0.00% 0.00% 0.00%
P.6 Combined buffer 1.25% 1.25% 1.88% 2.50% 2.50% 1.88% 2.50% 2.50%
(1) Conversions not considered for CET1 computation
(2) Excluding instruments included in row F
CAPITAL RATIOS (%)
Fully loaded
Memorandum items
Transitional combined buffer
requirements (%)
OWN FUNDS
TOTAL RISK EXPOSURE AMOUNT
CAPITAL RATIOS (%)
Transitional period
Fully loaded
CAPITAL

2018 EU-wide Stress Test: P&L
Actual
31/12/2017 31/12/2018 31/12/2019 31/12/2020 31/12/2018 31/12/2019 31/12/2020
Net interest income1,785
1,729 1,718 1,706 1,634 1,587 1,542
Interest income 2,395 2,176 2,252 2,440 2,497 2,629 2,816
Interest expense -610 -447 -535 -734 -863 -1,042 -1,274
Dividend income 13 13 13 13 7 7 7
Net fee and commission income 1,554 1,554 1,554 1,554 1,399 1,399 1,399
Gains or losses on financial assets and liabilities held for trading and trading financial assets and trading
financial liabilities 123 86 86 86 59 64 64
Gains or losses on non-trading financial assets mandatorily at fair value through profit or loss by
instrument and Gains or losses on financial assets and liabilities designated at fair value through profit or
loss
-112
Other operating income not listed above, net 450 332 332 332 342 332 332
Total operating income, net 3,925 3,713 3,703 3,691 3,328 3,389 3,343
Impairment or (-) reversal of impairment on financial assets not measured at fair value through profit or
loss-1,051 -1,310 -321 -526 -1,696 -774 -979
Other income and expenses not listed above, net -2,084 -2,701 -2,700 -2,700 -2,821 -2,782 -2,760
Profit or (-) loss before tax from continuing operations 790 -297 681 465 -1,189 -166 -396
Tax expenses or (-) income related to profit or loss from continuing operations -78 96 -197 -132 360 53 122
Profit or (-) loss after tax from discontinued operations 0
Profit or (-) loss for the year 712 -201 484 332 -829 -113 -274
Amount of dividends paid and minority interests after MDA-related adjustments 133 26 209 148 22 22 22
Attributable to owners of the parent net of estimated dividends 579 -227 275 184 -851 -135 -296
Memo row: Impact of one-off adjustments 108 108 108 108 108 108
The results include distribution restrictions for MDA adjustments No No No No No No
Unione di Banche Italiane Società Per Azioni
(mln EUR)
Baseline scenario Adverse scenario

Impact on Common Equity
Tier 1
mln EUR
Raising of capital instruments eligible as CET1 capital (+) 0
Repayment of CET1 capital, buybacks (-) 0
Conversion to CET1 of hybrid instruments (+) 0
Impact on Additional Tier
1 and Tier 2
mln EUR
Net issuance of Additional Tier 1 and T2 Instruments with a trigger at or above bank's post stress test CET1
ratio in the adverse scenario during the stress test horizon (+/-)0
Net issuance of Additional Tier 1 and T2 Instrument with a trigger below bank's post stress test CET1 ratio in
the adverse scenario during the stress test horizon (+/-)0
Realised fines/litigation costs (net of provisions) (-) 0
Other material losses and provisions (-) 0
Issuance of CET 1 Instruments 01 January to 30 June 2018
Net issuance of Additional Tier 1 and Tier 2 Instruments 01 January to 30 June 2018
Realised losses 01 January to 30 June 2018 mln EUR
2018 EU-wide Stress Test:
Major capital measures and realised losses
Unione di Banche Italiane Società Per Azioni

2018 EU-wide Stress TestInformation on performing and non-performing exposures
1
Unione di Banche Italiane Società Per Azioni
(mln EUR)
Of which:
defaulted
Debt securities (including at amortised cost and fair value) 13,558 0 32 32 0 14 0
Central banks 0 0 0 0 0 0 0
General governments 12,758 0 0 0 0 0 0
Credit institutions 228 0 0 0 0 0 0
Other financial corporations 217 0 0 0 0 0 0
Non-financial corporations 356 0 32 32 0 14 0
Loans and advances(including at amortised cost and fair value) 105,158 1,066 12,651 12,651 411 4,491 7,014
Central banks 5,900 0 0 0 0 0 0
General governments 834 17 44 44 5 8 1
Credit institutions 2,022 41 0 0 0 0 0
Other financial corporations 5,132 10 197 197 18 81 81
Non-financial corporations 50,449 371 8,182 8,182 282 2,811 4,603
Households 40,821 627 4,228 4,228 106 1,591 2,329
DEBT INSTRUMENTS other than HFT 118,716 1,066 12,683 12,683 411 4,506 7,014
OFF-BALANCE SHEET EXPOSURES 43,011 664 664 -32 -15 2241 For the definition of non-performing exposures please refer to COMMISSION IMPLEMENTING REGULATION (EU) 2015/227 of 9 January 2015, ANNEX V, Part 2-Template related instructions, subtitle 29
2 Institutions report here collective allowances for incurred but not reported losses (instruments at amortised cost) and changes in fair value of performing exposures due to credit risk and provisions (instruments at fair value other than HFT)
3 Institutions report here specific allowances for financial assets, individually and collectively estimated (instruments at amortised cost) and changes in fair value of NPE due to credit risk and provisions (instruments at fair value other than HFT)
Actual
31/12/2017
Gross carrying amount
Accumulated impairment,
accumulated changes in fair value due
to credit risk and provisions Collaterals and
financial
guarantees
received on non-
performing
exposures
Of which performing
but past due >30 days
and <=90 days
Of which non-performing
On performing
exposures2
On non-performing
exposures3

2018 EU-wide Stress TestInformation on performing and forborne exposures
1
Unione di Banche Italiane Società Per Azioni
(mln EUR)
Of which non-
performing
exposures with
forbearance
measures
Of which on non-
performing
exposures with
forbearance
measures
Debt securities (including at amortised cost and fair value) 29 29 14 14 0
Central banks 0 0 0 0 0
General governments 0 0 0 0 0
Credit institutions 0 0 0 0 0
Other financial corporations 0 0 0 0 0
Non-financial corporations 29 29 14 14 0
Loans and advances (including at amortised cost and fair value) 6,218 3,825 1,003 959 4,621
Central banks 0 0 0 0 0
General governments 5 0 0 0 0
Credit institutions 0 0 0 0 0
Other financial corporations 86 69 22 22 49
Non-financial corporations 4,098 2,763 760 727 2,872
Households 2,029 992 221 210 1,700
DEBT INSTRUMENTS other than HFT 6,247 3,854 1,017 973 4,621
Loan commitments given 166 126 0 0 531 For the definition of forborne exposures please refer to COMMISSION IMPLEMENTING REGULATION (EU) 2015/227 of 9 January 2015, ANNEX V, Part 2-Template related instructions, subtitle 30
Actual
31/12/2017
Gross carrying amount of exposures
with forbearance measures
Accumulated impairment, accumulated
changes in fair value due to credit risk
and provisions for exposures with
forbearance measures Collateral and financial
guarantees received on
exposures with forbearance
measures