2018 Annual Results
10
2018 Annual Results Press Release Íslandsbanki hf. 13 February 2019
Transcript of 2018 Annual Results

2018 Annual Results
Press Release
Íslandsbanki hf.
13 February 2019
1
islandsbanki.is
Haga
smár
i 3
201
Kópa
vogu
r
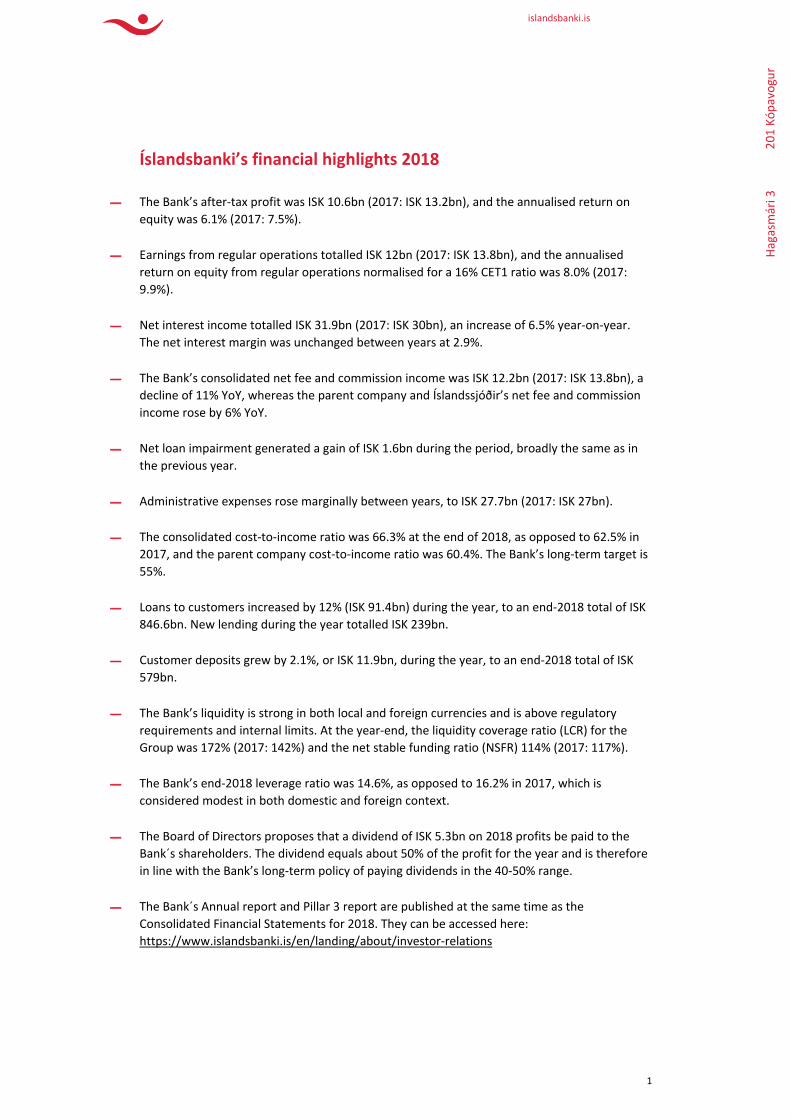
Íslandsbanki’s financial highlights 2018
− The Bank’s after-tax profit was ISK 10.6bn (2017: ISK 13.2bn), and the annualised return on equity was 6.1% (2017: 7.5%).
− Earnings from regular operations totalled ISK 12bn (2017: ISK 13.8bn), and the annualised return on equity from regular operations normalised for a 16% CET1 ratio was 8.0% (2017: 9.9%).
− Net interest income totalled ISK 31.9bn (2017: ISK 30bn), an increase of 6.5% year-on-year. The net interest margin was unchanged between years at 2.9%.
− The Bank’s consolidated net fee and commission income was ISK 12.2bn (2017: ISK 13.8bn), a decline of 11% YoY, whereas the parent company and Íslandssjóðir’s net fee and commission income rose by 6% YoY.
− Net loan impairment generated a gain of ISK 1.6bn during the period, broadly the same as in the previous year.
− Administrative expenses rose marginally between years, to ISK 27.7bn (2017: ISK 27bn).
− The consolidated cost-to-income ratio was 66.3% at the end of 2018, as opposed to 62.5% in 2017, and the parent company cost-to-income ratio was 60.4%. The Bank’s long-term target is 55%.
− Loans to customers increased by 12% (ISK 91.4bn) during the year, to an end-2018 total of ISK 846.6bn. New lending during the year totalled ISK 239bn.
− Customer deposits grew by 2.1%, or ISK 11.9bn, during the year, to an end-2018 total of ISK 579bn.
− The Bank’s liquidity is strong in both local and foreign currencies and is above regulatory requirements and internal limits. At the year-end, the liquidity coverage ratio (LCR) for the Group was 172% (2017: 142%) and the net stable funding ratio (NSFR) 114% (2017: 117%).
− The Bank’s end-2018 leverage ratio was 14.6%, as opposed to 16.2% in 2017, which is considered modest in both domestic and foreign context.
− The Board of Directors proposes that a dividend of ISK 5.3bn on 2018 profits be paid to the Bank´s shareholders. The dividend equals about 50% of the profit for the year and is therefore in line with the Bank’s long-term policy of paying dividends in the 40-50% range.
− The Bank´s Annual report and Pillar 3 report are published at the same time as the Consolidated Financial Statements for 2018. They can be accessed here: https://www.islandsbanki.is/en/landing/about/investor-relations

2
islandsbanki.is
Fourth quarter (Q4/18) financial highlights
− The Bank’s after-tax profit totalled ISK 1.4bn (Q4/2017: ISK 3.1bn). The annualised return on equity was 3.2% (Q4/2017: 6.9%).
− Earnings from regular operations totalled ISK 2.1bn (2017: ISK 3.6bn), and the annualised return on equity from regular operations normalised for a 16% CET1 ratio was 5.3% (Q4/2017: 10.3%).
− Net interest income amounted to ISK 8.3bn (2017: ISK 7.3bn), and the net interest margin was 3% (Q4/2017: 2.8%).
− Net fee and commission income was ISK 3.5bn (Q4/2017: ISK 3.6bn).
Key figures and ratios
Birna Einarsdóttir, Íslandsbanki Chief Executive Officer: Íslandsbanki prioritised digital advancements in 2018. We launched a new core system, the largest tech project undertaken by the Bank since its establishment, and we rolled out a large number of new digital solutions for our customers. We are delighted to rank #1 for banking services in Iceland among customers, and for the sixth year in a row we topped the Icelandic Customer Satisfaction Index. We will continue to offer reliable and outstanding service and to enable our customers to do their banking whenever they want, wherever they are. The Bank’s loan book grew by 12% during the year, including a strong increase in corporate lending, and surveys have shown that Íslandsbanki is in the lead in terms of corporate
2018 2017 2016 2015 2014
PROFITABILITY ROE 16% CET1 (regular operations)¹ 8.0% 9.9% 10.3% 11.9% 11.4%ROE (after tax) 6.1% 7.5% 10.2% 10.8% 12.8%Net interest margin (of total assets) 2.9% 2.9% 3.1% 2.9% 3.0%Cost to income ratio² 66.3% 62.5% 56.9% 56.2% 57.7%After tax profit, ISK m 10,645 13,226 20,158 20,578 22,750Earnings from regular operations, ISK m³ 12,042 13,848 15,138 16,198 14,846
31.12.2018 31.12.2017 31.12.2016 31.12.2015 31.12.2014
CAPITAL Total equity, ISK m 176,313 181,045 178,925 202,227 185,487
Tier 1 capital ratio 20.3% 22.6% 24.9% 28.3% 26.5%
Total capital ratio 22.2% 24.1% 25.2% 30.1% 29.6%
Leverage ratio 14.6% 16.2% 16.0% 18.1% 19.5%
BALANCE SHEET Total assets, ISK m 1,130,403 1,035,822 1,047,554 1,045,769 911,328
Loans to customers, ISK m 846,599 755,175 687,840 665,711 634,799
Deposits from Customers, ISK m 578,959 567,029 594,187 593,245 529,447
Customer deposit / customer loan ratio 68.4% 75.1% 84.2% 84.6% 79.0%
1. Return from regular operations on normalised CET1 of 16%, adjusted for risk free interest on excess capital. From January 2018 the definition of regular operations has been revised to include from discontinued operations as the Bank has successfully divested all non-core business related assets2. Calculated as (Administrative expenses + Contribution to the Depositors´ and Investors´ Guarantee Fund – One off items) / (Total operating income – one off items)3. Earnings from regular operations is defined as earnings excluding one off items. As the future level of bank tax is unclear, it is regarded as one off item in these calculations

3
islandsbanki.is
customers’ satisfaction. We have carved out a position as a leader in syndicated lending, our Corporate Finance and FX brokerage teams had an excellent year, and our subsidiary, Íslandssjóðir, launched Iceland’s first green bond fund during the year. The Bank and Íslandssjóðir turned in a good operating performance during the year, with a consolidated profit of ISK 10.6bn, while operational difficulties among other subsidiaries cut into the year’s earnings. The Bank’s funding activities were successful during the year, its liquidity position is strong in both domestic and foreign currencies, and its risk is moderate and well managed. In the past year, we have focused on modernising the Bank and building up a responsible busi-ness and risk culture. We intend to continue on that path in the coming year by formulating strategies that we are certain will make our Bank even better, for the benefit of the entire community. We welcome the publication of the new White Paper on a Future Vision for the Financial System, issued at the end of the year, which confirms how much the Icelandic banking system has reformed in recent years. The White Paper also points out how heavy a tax burden the Icelandic banking system bears. This situation is mainly harmful to Icelandic consumers, and we hope to see it change.
Fourth quarter (Q4/18) operational highlights
− Íslandsbanki announced its participation in Nordic CEOs for a Sustainable Future, in support of the UN Sustainable Development Goals
− Íslandsbanki announced its cooperation with the world’s largest fintech centre
− Íslandsbanki announced an investment of ISK 410m in Meniga
− Íslandsbanki and international fund management company Vanguard celebrated 20-year collaboration
− Íslandssjóðir established a new fund, IS Green Bonds
− Íslandsbanki held a meeting on the status of women in the Icelandic labour market: “Where do women want to work?”

4
islandsbanki.is
Income statement
Total income rose marginally between years
− Total income in 2018 amounted to ISK 45bn, an increase of 1.8% YoY.
− Net interest income totalled ISK 32bn, an increase of 6.5% between years as the loan portfolio grew. The net interest margin was 2.9%, which is broadly unchanged from the prior year. It is expected to remain just below 3.0% in the short and medium term.
− Net fee and commission income totalled ISK 12.2bn, as compared with ISK 13.8bn for the same period in the previous year. The decline is due mainly to reduced fee and commission income from two of the Bank’s subsidiaries, as the parent company and Íslandssjóðir recorded an increase of 6% YoY.
− Income from core operations (net interest income and fee and commission income) accounted for some 98% of total operating income for 2018. The Bank continues to place strong empha-sis on maintaining strong core income and stable long-term income flows.
− The Bank’s net financial income was negative by ISK 962m, compared to a negative net financial income of ISK 715m in 2017, owing largely to losses on financial assets and financial liabilities mandatorily at fair value through profit and loss, which amounted to ISK 720m.
− Other operating income totalled ISK 1.8bn in 2018, as opposed to ISK 628m in 2017, and derives from the sale of a real estate development subsidiary.
ISK m 2018 2017 ∆ 4Q18 4Q17 ∆
Net interest income 31,937 29,999 1,938 8,294 7,338 956
Net fee and commission income 12,227 13,750 (1,523) 3,478 3,632 (154)
Net financial income (962) (715) (247) (637) 260 (897)
Net foreign exchange gain 1 527 (526) 76 81 (5)
Other operating income 1,784 628 1,156 120 122 (2)
Total operating income 44,987 44,189 798 11,331 11,433 (102)
Salaries and related expenses (15,500) (15,233) (267) (4,047) (4,297) 250
Other operating expenses (12,150) (11,735) (415) (3,418) (3,358) (60)
Administrative expenses (27,650) (26,968) (682) (7,465) (7,655) 190
Depositors' and Investors' Guarantee Fund (1,173) (1,083) (90) (299) (288) (11)
Bank tax (3,281) (2,892) (389) (740) (614) (126)
Total operating expenses (32,104) (30,943) (1,161) (8,504) (8,557) 53
Profit before net impairment on financial assets 12,883 13,246 (363) 2,827 2,876 (49)
Net impairment on financial assets 1,584 1,556 28 (297) 969 (1,266)
Profit before tax 14,467 14,802 (335) 2,530 3,845 (1,315)
Income tax expense (4,734) (4,151) (583) (1,118) (816) (302)
Profit for the period from continuing operations 9,733 10,651 (918) 1,412 3,029 (1,617)
Profit from discontinued operations net of income tax 912 2,575 (1,663) (8) 83 (91)
Profit for the period 10,645 13,226 (2,581) 1,404 3,112 (1,708)

5
islandsbanki.is
− Administrative expenses rose by ISK 682m YoY, or 2.5%, mainly as a result of collective wage increases and costs relating to the implementation and launch of the Bank’s new core deposits and payments system.
− In 2018, the average number of full-time position equivalents (FTE) was 873 for the parent company (2017: 915) and 1,076 for the group (2017: 1,098). At the end of 2018, there were 834 non-seasonal parent company employees (2017: 860) and 1,075 non-seasonal employees at the group level (2017: 1,042).
− The year-end cost-to-income ratio was 66.3%, as opposed to 62.5% at the end of 2017, above the Bank’s long-term target of 55%. The calculation of the cost-to-income ratio excludes the bank tax and one-off items. The parent company’s cost-to-income ratio was 60.4% for the period.
− The after-tax profit from discontinued operations was ISK 912m in 2018, as opposed to ISK 2.6bn in 2017. The profit for the period was due to asset sales and income from appropriated assets. Positive net loan impairment
− Net loan impairment generated a gain of ISK 1.6bn in 2018, comparable to that in the prior year, and derived largely from the removal of obligations due to foreign-denominated loans. Taxes and levies continue to affect profits and dividend payment capacity
− Income tax for 2018 totalled ISK 4.7bn, as compared with ISK 4.2bn in 2017. The effective tax rate was 32.7%, as opposed to 28.0% in 2017. The increase is due primarily to an increase in non-deductible expenses and tax-exempt levies. The bank tax amounted to ISK 3.3bn in 2018, as compared with ISK 2.9bn in 2017. The bank tax increased substantially in 2013 and was presented as a temporary measure, but according to the Government’s long-term plans, it is expected to decrease gradually from the current 0.376% to 0.145% by 2023. The Bank pays a special 6% financial administration tax on profits in excess of ISK 1bn, as well as contributing to the Depositors' and Investors' Guarantee Fund (DIGF), the Financial Supervisory Authority (FME), and the Debtors' Ombudsman. The contribution to the DIGF totalled ISK 1.2bn in 2018, slightly higher than in the previous year. Total taxes and levies amounted to ISK 10.6bn in 2018, as opposed to ISK 9.5bn in 2017. Standard international NPL metric not available since implementation of IFRS 9
− Following the adoption of the international financial reporting standard IFRS 9, no consensus has been reached among banks on a defined metric for loan portfolio quality. It is therefore difficult to compare the Bank’s loan book with those of other credit institutions and analyse historical developments, as the metrics published by different banks are frequently non-comparable. The European Banking Authority (EBA) has defined such a metric as the ratio of non-performing loans (NPL) to the gross book value of the total loan book. In this context, NPLs are defined as loans in arrears by more than 90 days or those deemed unlikely to be paid. At the end of 2018, Íslandsbanki’s NPL ratio thus calculated was 1.7%, as compared with the European average of 3.4% as of end-September 2018. The NPL ratio in terms of the gross

6
islandsbanki.is
book value of loans to customers was 2.0% at the end of 2018, and in terms of net book value it was 1.6%. Profit in line with expectations
− The Bank’s after-tax profit was ISK 10.6bn (2017: ISK 13.2bn), and the annualised return on equity was 6.1% (2107: 7.5%), in line with expectations. Earnings from regular operations totalled ISK 12bn (2017: ISK 13.8bn), and the annualised return on equity from regular operations normalised for a 16% CET1 ratio was 8.0%, as compared with 9.9% in 2017. The profit from regular operations contracted by ISK 1.8bn, owing primarily to a reduction in fee and commission income from two subsidiaries and to negative financial items.
Balance Sheet Assets — balance sheet expands through continued strong credit growth
− The Bank’s balance sheet grew by 9.1% during the year, to ISK 1,130bn at the end of 2018. Loans to customers increased by 12.1% (ISK 91.4bn) in 2018. The increase in lending was distributed across all of the Bank’s lending units, although large companies were the largest borrowers. Mortgage lending increased by ISK 23.5bn in 2018. New loans totalled ISK 239bn during the period, up 20% from the previous year’s total of ISK 199bn. As a share of the Bank’s broadly diversified total loan portfolio, lending to the tourism industry has declined YoY, to 12% (2017: 13%).
− Loans are generally backed by strong assets, with real estate and ships the most important types of collateral. The weighted average loan-to-value (LTV) ratio of the Bank’s residential mortgage portfolio was 61% in the end of 2018, as compared with 63% a year earlier. LTV has decreased since year-end 2017 which is mainly due to the increase in published tax value of properties that raised housing valuations of about 12.8% from its previous publication.
Assets, ISK m 31.12.2018 31.12.2017 Δ
Cash and balances with CB 135,056 189,045 (53,989)
Bonds and debt instruments 69,415 27,090 42,325
Shares and equity instruments 13,074 10,177 2,897
Derivatives 4,550 2,896 1,654
Loans to credit institutions 41,577 26,617 14,960
Loans to customers 846,599 755,175 91,424
Investment in associates 682 704 (22)
Property and equipment 5,271 7,128 (1,857)
Intangible assets 5,002 4,231 771 Other assets 7,947 9,993 (2,046)Non-current assets held for sale 1,230 2,766 (1,536)
Total assets 1,130,403 1,035,822 94,581

7
islandsbanki.is
Liabilities — diversified domestic and foreign funding
− The Bank’s total liabilities amounted to ISK 954bn, an increase of 11.6% since the beginning of the year. The Bank maintained a strong liquidity position in both foreign currencies and ISK. Liquidity ratios were well above regulatory requirements and internal limits. At the end of 2018, the liquidity coverage ratio (LCR) was 172% in all currencies for the Group, 111% in ISK for the Group and 153% (all currencies) for the parent company. The net stable funding ratio (NSFR) was 114% for the Group in all currencies, 149% for the Group in foreign currencies and 151% for the parent company.
− Customer deposits increased by 2.1% during the year, to ISK 579bn. Deposits are the Bank’s largest funding item, and concentration risk is closely monitored. The ratio of customer deposits to customer loans declined to 68.4% in 2018, from 75.1% at the end of 2017. The Bank’s asset encumbrance ratio was 18.0% at end of year, compared to 15.2% at end of 2017.
− The Bank’s debt issuance continued to be successful during the year, with the issue of domestic bills and covered bonds, as well as foreign currency denominated bonds. The aim of the issues is to mitigate risk through increased diversification of funding. Covered bond issues totalled ISK 24bn in 2018, in line with the Bank’s funding plan. Íslandsbanki remains the largest issuer of covered bonds in Iceland.
− In January 2018, the Bank issued a EUR 300 million (approx. ISK 38bn) six-year bond. The bond is callable by the issuer after five years (6NC5). It bears a fixed interest rate of 1.125%, or the equivalent of a 75-bp margin over the mid-swaps rate. The orders for the new bond totalled EUR 1,255m from 121 investors, thus oversubscribing the issue by a factor of four. The bonds were sold to a broad group of investors, including from the UK, mainland Europe, the Nordic region, and Asia. The transaction was notable as it was simultaneously the longest-dated and most tightly-priced foreign bond issued by an Icelandic financial institution since 2008. The Bank also issued other bonds during the year, for a total value of SEK 1,700m.
− In August 2018, the Bank issued a ten-year subordinated bond in the amount of SEK 500m. The bond is callable by the issuer after five years (10NC5). The Tier 2 issue bears a floating
Liabilities & equity, ISK m 31.12.2018 31.12.2017 Δ
Deposits from CB and credit inst. 15,619 11,189 4,430
Deposits from customers 578,959 567,029 11,930
Derivatives and short positions 5,521 5,492 29
Debt issued and other borrowed funds 300,976 217,748 83,228
Subordinated loans 16,216 9,505 6,711
Tax liabilities 7,150 7,787 (637)
Other liabilities 29,643 35,947 (6,304)Non-current liabilities held for sale 6 80 (74)
Total liabilities 954,089 854,777 99,312
Total equity 176,313 181,045 (4,732)
Total liabilities and equity 1,130,403 1,035,822 94,581

8
islandsbanki.is
interest rate of 250 bp above the three-month Swedish interbank rate (STIBOR). This second subordinated issue follows from a successful SEK 750m Tier 2 issue in November 2017, the first subordinated bond issued by an Icelandic financial institution in foreign markets since 2008. Equity
− The Bank’s total equity amounted to ISK 176bn at the end of 2018, as compared with ISK 181bn a year earlier, ISK 2.3bn of that total is attributable to non-controlling interests. At the Annual General Meeting in March 2018, the Board of Directors agreed to pay shareholders a dividend of ISK 13bn on 2017 profits. The nominal value of the Bank’s share capital was ISK 10bn at the end of 2018, and total share capital amounted to ISK 65bn.
− The Bank’s capital ratio was 22.2% at year-end 2018, as compared with 24.1% at the end of 2017, and was above the Bank’s internal target and regulatory requirement. Its Tier 1 ratio was 20.3% at the end of 2018, as opposed to 22.6% at year-end 2017
− A year ago, the Bank announced for the first time a new long-term capital target. The target is based on the Bank’s internal capital adequacy assessment (ICAAP) and the FME’s supervisory review and evaluation process (SREP). The target assumes that the Bank will maintain a management buffer in excess of the SREP requirement so as to ensure that short-term fluctuations do not cause the ratio to fall below the regulatory minimum. The capital target supports the Bank’s business strategy and takes into account changes or uncertainties in the operating environment. It can change over time, reflecting changes in the Bank’s risk profile, business strategy, and external environment. In view of changes to capital requirements and the economic environment, the Bank decided in September 2018 to increase the management buffer from 0.5-1.5% to 0.5-2.0%. In October, the FME lowered Íslandsbanki’s required total capital ratio from 19.8% to 18.8%, in recognition of the Bank’s reduced market risk.
− In May 2018, the FME announced that the countercyclical capital buffer would be increased by 0.5%, to 1.75%, effective in May 2019. In January 2019, the FME also announced a 0.25% increase in the countercyclical capital buffer, effective in February 2020.
− Íslandsbanki uses the standardised method to calculate its risk-weighted assets, which amounted to ISK 845.9bn at the end of 2018, or 74.8% of total assets, about the same as in the prior year. At the end of December 2018, the leverage ratio was 14.6%, as compared with 16.2% as of end-2017, which is considered modest.
− The Board of Directors of Íslandsbanki proposes that ISK 5.3 billion will be paid in dividends to shareholders for the 2018 financial year. The dividend corresponds to about 50% of after-tax profits for 2018 and is consistent with the Bank’s dividend pay-out ratio target of 40-50%. The Board may convene a special shareholder meeting later in the year where a proposal

9
islandsbanki.is
regarding payment of dividends of profit for the previous financial years could be suggested.
Credit ratings
− Íslandsbanki has been the only bank in Iceland with credit ratings from two international rating agencies, Fitch Ratings and S&P Global Ratings (S&P).
− In January 2019, the Bank announced it would terminate its credit rating agreement with Fitch Ratings, a decision which was driven primarily from a cost perspective. In November 2018, Fitch had affirmed the Bank’s rating of BBB/F3, with a stable outlook.
− In October 2017, S&P upgraded the Bank to BBB+/A-2, with a stable outlook. S&P affirmed the ratings in July 2018.
Investor relations Investor call in English at 09:30 (GMT). On 14 February 2019 at 09:30 (GMT), the Bank will hold an investor call. The call will begin with a short update on the Icelandic economy, followed by a review of the Bank’s financial re-sults. The call will be in English. Please register by sending an e-mail to: [email protected]. Dial-in details and presenta-tions will be sent out to registered participants prior to the call. Market participants meeting in Icelandic at 10:30 (GMT). A meeting with market participants in Icelandic will take place on 14 February 2019 at 10:30 (GMT). The presentation will take place at the Íslandsbanki headquarters, Hagasmári 3, 9 floor, 201 Kópavogur. The presentation will be in Icelandic. Please register by sending an e-mail to: [email protected] Further information All materials relating to the Bank’s operating results, together with information on the financial calendar and silent periods, can be found here: https://www.islandsbanki.is/en/landing/about/investor-relations
Financial calendar The Bank plans to publish its annual and in-terim statements on the following dates:
- Annual report and results for 2018 — 13 February 2019
- Annual General Meeting — 21 March 2019
- Q1/2019 results — 8 May 2019 - Q2/2019 results — 31 July 2019 - Q3/2019 results — 30 October 2019
Please note that these dates are subject to change.