
2018 ANNUAL REPORTS & FINANCIAL STATEMENTS
89
2018 ANNUAL REPORTS & FINANCIAL STATEMENTS
Transcript of 2018 ANNUAL REPORTS & FINANCIAL STATEMENTS
2018 ANNUAL REPORTS &FINANCIAL STATEMENTS

01
OUR MISSION
TABLE OF CONTENT
OUR VALUES
Contents Pages
Financial highlights 4 Notice of meeting 5 - 6 Chairman’s review 7 - 12 Managing Director’s review 13 - 15 Corporate Governance 16 - 17 Report of the Audit Committee 18 Report of the Directors 19 - 21 Independent Auditor’s Report 22 - 24
Financial Statements Statement of financial position 25 Statement of comprehensive income 26 Statement of cash flows 27 Statement of changes in equity 28 Notes 29 - 71
Other Information Analysis of shareholding 72 Five-year financial summary 73 Other disclosures 74 Proxy form 75
2018 annual reports & financial statements Sustaining Growth with Purposeful Brands

02
2018 annual reports & financial statements Sustaining Growth with Purposeful Brands

03
CORPORATE INFORMATION
BOARD OF DIRECTORS Edward Effah (Chairman) Gladys Amoah (New Managing Director, Appointed 1/11/18) Adesola Sotande-Peters Philip Odotei Sowah Alfred Yaw Oduro Nsarkoh Angela Peasah Edith Dankwa Nazaire Djako Nana Yaa Owusu-Ansah Micheal Odinakachi Ubeh (Appointed 1/11/18) Yeo Ziobeieton (Former Managing Director, Resigned, 1/11/18)
SECRETARY Ama Adadzewa Agyemang
AUDITOR KPMG Chartered Accountants 13 Yiyiwa Drive, Abelenkpe P O Box GP 242 Accra
SOLICITORS Sam Okudzeto & Associates Kimathi Partners, Corporate Attorneys Aryitey & Associates
REGISTERED OFFICE Unilever Ghana Limited Tema Factory, Plot No. Ind/A/2/3A-4 P O Box 721 Tema
BANKERS Access Bank Ghana Limited Barclays Bank of Ghana Limited Ecobank Ghana Limited First Atlantic Bank Limited Guaranty Trust Bank Limited Société Generale Ghana Limited Standard Chartered Bank Limited Stanbic Bank Limited United Bank for Africa Limited Universal Merchant Bank Limited
2018 annual reports & financial statements Sustaining Growth with Purposeful Brands

04
Financial Highlights(All amounts are expressed in thousands of Ghana cedis)
2018 2017 Change % Revenue 632,152 575,765 9.8% Operating profit 253,258 67,204 276.8% Profit before taxation 250,322 65,360 283.0% Profit after taxation 190,825 48,149 296.3% Cash (used in)/generated from operating activities (9,982) 90,786 (111.0)% Shareholders’ funds 295,141 120,597 144.7% Capital expenditure 60,914 21,005 190.0%
Basic earnings per share (GH¢) 3.0532 0.7704 296.3% Diluted earnings per share (GH¢) 3.0532 0.7704 296.3% Dividend per share 0.8000 0.2500 220.0% Net assets per share (GH¢) 4.7223 1.9295 144.7%
Profit before taxation margin (%) 39.6 11.4 Profit after taxation margin (%) 30.2 8.4
2018 annual reports & financial statements Sustaining Growth with Purposeful Brands
05
Notice of Meeting
Notice is hereby given that the Annual General Meeting of the Members of Unilever Ghana Limited will be held at the Ghana College of Physicians and Surgeons, Ridge, Accra on Friday, 24 May 2019 at 10.00 a.m. for the following purposes:
AGENDA1. To receive the Report of the Directors, the financial position as at 31 December, 2018 together with the Accounts for the year ended on that date and the Report of the Auditors thereon.
2. To declare Dividend.
3. To re-elect the following Directors: a. Mrs. Adesola Sotande-Peters b. Mrs. Nana Yaa Owusu-Ansah c. Mr. Alfred Yaw Nsarkoh d. Mr. Michael Odinakachi Ubeh
4. To approve the terms of appointment of a Director.
5. To approve Directors’ fees.
6. To authorise the Directors to fix the remuneration of the Auditor.
7. To pass the following resolution;
SPECIAL BUSINESS1. To amend Regulation 53 (1) and (2) of the Company’s Regulations to include Regulation 53 (3) (a) and (b) as
follows:
a. The electronic version of the Annual Report and Financial Statement shall be posted on the Business’ website as follows: www.unileverghana.com and same forwarded to the e-mail addresses of shareholders before Annual General Meetings.
b. A limited number of hard copies of the Annual Report will be made available to shareholders at the grounds of the Annual General Meeting for use by shareholders attending the meeting.
A Member of the Company entitled to attend and vote is entitled to appoint a proxy to attend and vote instead of him. A proxy need not be a Member. A form of proxy is attached and if it is to be valid for the purposes of the Meeting, it must be completed and deposited at the Registered Office of the Registrars of the Company, Universal Merchant Bank Limited, not less than 48 hours before the Meeting.
Dated this 8 day of March 2019.
By Order of the Board
Ama A. Agyemang (Mrs)Secretary
Registered Office, Unilever Ghana Limited, Tema Factory, Plot No. Ind/A/2/3A-4, P O Box 721, Tema.
2018 annual reports & financial statements Sustaining Growth with Purposeful Brands
06
Notice of Meeting (Continued)
Dividend WarrantsWhen the declaration of dividend is made, the warrants of GH¢ 0.30 ordinary dividend would be posted on the 24 of June 2019 and a special dividend of GH¢ 0.50 would be posted in Quarter 4 of 2019 to holders of shares whose names are registered in the Register of members at the close of day on the 17 of May 2019.
Board of Directors & SecretaryMr Edward Effah; Chairman, Mrs Gladys Amoah; Managing Director, Mr Michael Odinakachi Ubeh, Dr. Mrs Edith Dankwa, Mrs Nana Yaa Owusu-Ansah, Mr Alfred Yaw Oduro Nsarkoh, Mrs Angela Peasah, Mr Nazaire Djako, Mrs Adesola Sotande-Peters, Mr. Philip Odotei Sowah, and Mrs Ama Adadzewa Agyemang, Secretary.
Board Audit CommitteeMrs Angela Peasah, Dr. Mrs Edith Dankwa, Mrs Adesola Sotande-Peters and Mr. Philip Odotei Sowah.
Registrars OfficeUniversal Merchant Bank Ltd, Registrars Department, Kwame Nkrumah Avenue, Sethi Plaza, Adabraka, Accra P. O. Box 401, Accra, Ghana.
2018 annual reports & financial statements Sustaining Growth with Purposeful Brands

Chairman’s ReviewIntroduction
Distinguished shareholders, ladies and gentlemen, I am delighted to welcome all of you to the 45th Annual General Meeting of your Company - Unilever Ghana Ltd. It is also my pleasure and privilege to address and present to you the Directors’ Annual Report and the Audited Financial Statements for the year ended 31 December 2018.
Review of the Global Economy;The global economy started 2018 on an upbeat note and was projected to grow at 3.7%, buoyed by a pickup in global manufacturing and trade through 2017. As investors’ confidence in the global economic outlook lost steam, so did the upswing. One reason behind this loss in momentum is the implementation of tariffs by major economies—especially the United States—and retaliatory measures taken by others, including China. The increasingly protectionist rhetoric on trade has meant higher uncertainty about trade policy, which weighs on future investment decisions.
Despite these actions, the US economy expanded at a fast pace in 2018, as tax cuts and spending increases stimulated demand. The US Federal Reserve has continued to raise the policy interest rate as a result. Interest rates on US long-term bonds have increased, as investors see risks to future growth and value the safety of US Treasury securities.
As growth and interest rates in the United States have outpaced those in other major economies, the US dollar has appreciated against most other currencies in 2018.
Some vulnerable emerging market economies have come under strain as the US dollar gained value and the level of risk that global financial investors were prepared to accept dropped.
Most of these countries have seen increases in their external borrowing costs, but the extent of these increases varied widely.
These developments affected the performance of the Ghanaian economy in 2018 and by extension our Company, Unilever Ghana Ltd.
Review of the Economy of Ghana:After two years of sluggish growth from 2014 to 2016, Ghana’s economy accelerated
to 8.5% in 2017 making it the second-fastest growing African economy, trailing only Ethiopia. The year was off to a strong start; growth for the first
quarter of 2018 was 6.8%, above 6.7% recorded in 2017 primarily driven by the continued expansion of oil production. Overall GDP growth for 2018 is estimated at 5.6%. In September 2018, Ghana rebased its GDP from 2006 to 2013. The rebased 2017 GDP is 24.6% greater than the previous 2017 GDP. Private consumption increased by 6.2% of GDP in 2018. The economy is projected to grow by 7.3% in 2019 and a slower 5.4% in 2020 as the effects of
increased oil production from new wells fade.Inflation trended downwards from 11.8% in December 2017 to 9.4% in December 2018, remaining broadly anchored within the medium-term target band of 8±2 percent. It is the lowest inflation rate since December 2012, as prices slowed for both food and non-food products. The decline in inflation was
mainly driven by non-food prices on account of relatively stable exchange rate developments.
07
2018 annual reports & financial statements Sustaining Growth with Purposeful Brands

08
The recapitalization exercise ended in December 2018 with a total of 23 banks meeting the minimum requirement. These banks are sound, liquid and well-capitalized, and well-positioned to translate the gains made so far from two years of far-reaching reforms to the rest of the economy, according to the Bank of Ghana. At the end of December 2018, total assets of the banking sector grew by 14.7% year-on-year to GH¢107.3 billion. Going forward, growth in industry assets is expected to rebound as banks deploy their newly-injected capital towards financial intermediation.
The Ghanaian cedi stabilized against major currencies, except for a slight depreciation against the US dollar in the second quarter of 2018. The cedi depreciated by 8.4% in 2018 to the dollar compared with 4.9% in 2017. Against the Euro, it recorded a depreciation of 3.9% in 2018 vs 16.2% in 2017.
Despite the positive outlook, Ghana faces potential domestic and global headwinds. On the domestic front, the government faces a challenge in bridging its financing needs, with domestic revenues at about 10% of GDP and gross financing needs of more than 20% of GDP. This challenge is compounded by a high external debt–to-GDP ratio. On the external front, dependence on primary commodity exports continues to expose the economy to international commodity price shocks, which could weaken GDP growth.
Ghana is gradually building industrial capacity, and growth in industry is projected at 9.8% in 2019 and 5.9% in 2020. Recent trends reflect more machinery in the country’s import basket. Between 2000 and 2017, the total value of machinery imports increased fourfold, to $670 million. This rapid increase in machinery imports had a substantial adverse effect on the country’s current account balance, but it reflects a gradual shift toward industrialisation.
Review of the Political Environment:Political stability will remain underpinned by Ghana’s strong democratic credentials. The government prioritizes industrialisation as a means of job creation and economic growth, but a tight fiscal policy will restrain the pace of progress. Headline economic growth will be strong but will be concentrated around the oil and gas sector, with the non-oil sector expected to pick up from 2019 onwards underpinned by pro-business reforms and steady improvement in power supply.
Business Performance:Unilever Ghana Limited results for the year ended 31 December 2018 shows a revenue growth of 10% from GH¢ 575m in 2017 to GH¢ 632m in 2018 mostly due to increase in volumes sold. Operating profit before tax of GH¢ 250m, representing 283% increase over 2017’s GH¢ 65m. Profit after tax therefore improved by 296% to GH¢ 191m compared to GH¢ 48m in 2017. Included in the operating profit for the year is an amount of GH¢ 89m, being profit on disposal of spreads business and reversal of management and technical services fees provision amounting GH¢ 111m.
Dividends:The Board of Directors hereby propose a dividend pay-out of GH¢0.80 per share from the 2018 profits, amounting to a total of GH¢ 50,000,000.
Board Changes:Mr Ziobeieton Yeo, Managing Director resigned from the Company on 1 of November 2018.
Mrs. Gladys Amoah, formerly the Customer Development Director and a member of the Board was promoted to the position of Managing Director effective 1 November 2018.
Mr. Michael Ubeh was appointed as the Customer Development Director effective 1 November 2018.
Mr Michael Ubeh has been with Unilever for the last 16 years with experience spanning over Customer
Chairman’s Review Continued
2018 annual reports & financial statements Sustaining Growth with Purposeful Brands

09
Management, Customer Operations and Customer Marketing. He has previously worked with the Customer Development Centre of Excellence Hindustan Unilever India in the capacity of Customer Development Operations Manager, where his key task, in addition to day to day Customer Operations, was to lead the delivery of leading edge capability in the front end, measured by delivery of many projects that deliver efficiency and cost effectiveness in operations and looking at current sales and Management processes, understanding, taking insights from evolving technology and defining a service and product mix that can ensure a quantum jump in the process efficiency.
Michael, prior to his international assignment held various positions in Unilever Nigeria - The Route to Market (RTM) & Wholesale transformation Lead Nigeria, General Sales Manager East, Regional Sales Manager South East, Customer Marketing Manager Foods, Trade category Manager Foods and Field Sales Manager across various regions in Northern and Southern Nigeria.
Until his recent appointment, he was the Customer Development Director for Distributive Trade in Nigeria.
Michael believes that good people are valuable assets to the organisation and must be developed, inspired and motivated for greater level of achievements. Building talents & teams and growth mind sets are his strongest leadership skills. He loves meeting people, travelling and has a keen interest in understanding and following trends in wealth creation & Management institutions, projects that involve system, process and institutional changes.
Michael is a Nigerian born in Nkawkaw, Ghana in 1975. He is married with Children.
The following is the list of the subsisting Directors and their Profiles
1. Mr. Edward Effah2. Mrs. Gladys Amoah 3. Mr. Nazaire Djako4. Dr. Mrs. Edith Dankwa5. Mr. Philip Odotei Sowah 6. Mr. Alfred Yaw Oduro Nsarkoh7. Mrs. Angela Peasah8. Mrs. Adesola Sotande-Peters9. Mrs. Nana Yaa Owusu-Ansah
Profile of Subsisting Directors
Mr. Edward EffahMr. Edward Effah established The Fidelity Group in October 1998 after a successful career as a senior finance executive. Currently, Mr. Effah is the Group CEO and Board Chairman of the Fidelity Group. Under his leadership, Fidelity has been able to establish itself as a leader in its markets in Ghana in terms of reputation, profitability and assets under management.
Edward is a Chartered Accountant by profession and is a member of the Institute of Chartered Accountants in England and Wales. Edward is also a member of the Institute of Directors (UK).
Edward has extensive experience in business strategy formulation, calculated risk taking, strategy execution, team building, mentoring, business innovation, finance, technology strategy, capital raising, investor relations, managing Boards and effective communication with key stakeholders.
Chairman’s Review Continued
2018 annual reports & financial statements Sustaining Growth with Purposeful Brands

10
Chairman’s Review Continued
Mrs. Gladys Amoah.Gladys Amoah was appointed as the Managing Director for Unilever Ghana Limited effective 1 November 2018. Prior to her appointment as the Managing Director, she was appointed the Customer Development Director, Ghana effective 1 November 2016. Gladys has 17 years’ experience in FMCG and has held roles in both Customer Development and Marketing. She has also got experience in Foods, Out of Home (restaurant markets), Personal Care and more recently Homecare. She has both South African and the rest of Africa experience.
She holds Bachelor of Science in Zoology and Microbiology from University of Cape Town.
Mr. Nazaire DjakoMr Nazaire joined Unilever in 1997 as a Management Trainee in CDI, working his way up from Oil Refinery Engineer to Factory Manager Foods, before moving over to Ghana in 2008 where he started as the Chief Engineer and later as the Plant Manager HPC/Foods. Thereafter, he took over as the lead Supply Chain manager for Ghana in 2010. In 2012, he was promoted to the position of GTM SC Director for Unilever West Africa (UWA) till 2014. Nazaire had assignments working in South East Asia as SC Projects Director in Indonesia, where he landed crucial projects before returning to CDI in 2016. He is currently the Supply Chain Director for Unilever Ghana Limited.
Dr. Mrs. Edith DankwaDr. Mrs. Edith Dankwa has built a solid reputation over the years in rendering consultancy services on marketing communications and has served as a market entry strategist for foreign businesses seeking to extend their operations to Africa. She is also the Group Publisher and CEO of Business Times Africa Magazine (BT), Energy Today Magazine (ET) and Africa’s leading source of credible and relevant business information, the Business & Financial Times (B&FT) newspaper and BIA Conferences, and Urban Press.
She holds a Bachelor of Arts degree in Management Studies from the University of Cape Coast, a Post Graduate Diploma in Marketing from the Chartered Institute of Marketing - Ghana, a Post Graduate Certificate in Newspaper Management from Inwent International Institute of Journalism, Germany, Executive MBA from the GIMPA Business School and a doctoral degree in Business Administration (International Business) from Walden University in the USA.
Over the past decade, Edith Dankwa has effectively developed and transformed Ghana’s most successful business media house, Business & Financial Times Limited, into a formidable entity. Under her visionary leadership, B&FT Limited has extended its product and service range to serve both local and international markets through the publishing of her company’s flagship product Business & Financial Times Newspaper. As a publisher, Edith also runs the Pan-African business monthly, Business Times Magazine and the quarterly Pan-African energy industry publication, Energy Today Magazine both circulated in South Africa, Zimbabwe, Nigeria, Ghana and other emerging markets in Africa and beyond.
Mr. Philip Odotei SowahPhilip Sowah is a management consultant with 27+ years Senior Management experience in telecommunications, general management, information technology, and management consulting with Big 4
2018 annual reports & financial statements Sustaining Growth with Purposeful Brands

11
Chairman’s Review Continued
and Fortune 500 companies across the US, Africa and the Middle East. He is currently a Partner at Nubuke Investment Business Advisory. Prior to Nubuke, Philip was the managing director of Airtel Ghana for six years where he managed the aggressive growth of the company to become the 3rd largest Mobile Network Operator (MNO) in terms of revenue. At Zain, which later became Airtel, Philip led the start-up and launch of a new mobile operator and brand, Zain, as the first full 3G network in Ghana.
A team player and an empowering leader, under his leadership Airtel won several awards including Telecoms Company of the Year in 2010 and 2012 organized by the Chartered Institute of Marketing Ghana (CIMG). He is also the recipient of three CEO of the Year awards having picked two from the Mobile World Ghana Telecoms Awards in 2011 and 2013 respectively and one from PWC’s Ghana’s Most Respected Company and CEO Awards in 2010. He is passionate about sustainable CSR (Corporate Social Responsibility) projects and has degrees in Physics and Mechanical Engineering from Grinnell College and Washington University- St. Louis respectively both in the USA. Philip is happily married and has 4 daughters.
Mr. Alfred Yaw Oduro NsarkohYaw Nsarkoh was appointed as Unilever Nigeria’s Managing Director effective 1st January 2014. Until this appointment, he served as the Managing Director, Unilever East and Southern Africa based in Kenya. He has served as a Strategic Assistant to Unilever Executive member and President of Unilever Asia, Africa, Central and Eastern Europe based in the United Kingdom. He also served as Marketing Director Unilever Ghana and has done many other jobs in Ghana and in South Africa.
Mr. Nsarkoh holds an Honors Degree in Chemical Engineering from the University of Science and Technology, Kumasi, Ghana and a Post Graduate Diploma in Management from Henley Management College, Henley-on- Thames, United Kingdom.
Mrs. Angela PeasahMrs. Angela Peasah is a chartered accountant by profession and was admitted into the membership of the Institute of Chartered Accountants (Ghana) in 1995. She holds an Executive MBA from the University of Ghana, Legon. She is also a product of the Institute of Professional Studies now University of Professional Studies (UPSA), Accra. She trained with Coopers & Lybrand from 1991 and has worked with PricewaterhouseCoopers, Saltpond Offshore, WaterAid, an International NGO in various capacities.
She is currently the Director of Public Accounts at the Controller and Accountant General’s Department (CAGD). She has managed many audit jobs including World Bank and ADF funded projects, mining, insurance and commercial organizations. Angela is a Past President of The Institute of Chartered Accountants (Ghana).
Mrs. Adesola Sotande-PetersMrs. Adesola Sotande-Peters is a Finance Executive (FCCA) with a strong Business Finance leaning and with over 23 years varied professional experience (spanning various organizations such as the British Broadcasting Corporation (BBC) UK, Informa Group UK, Openwave Telecoms UK, Diageo Plc (Guinness Nigeria Plc, East
2018 annual reports & financial statements Sustaining Growth with Purposeful Brands

12
2018 annual reports & financial statements Sustaining Growth with Purposeful Brands
African Breweries Limited (Kenya), and Guinness Cameroon SA) where she has held various senior finance roles in commercial/strategic finance, financial management consultancy/analysis, with a strong focus on people development/mentoring.
She holds a bachelor degree in Business Administration and Economics from Richmond College, The American International University in London. She also holds an MBA for finance professionals from Manchester Business School. She is a fellow of the Association of Certified Chartered Accountants (FCCA) and a member of the Institute of Chartered Accountants of Nigeria (ICAN).
She was appointed to the Board of Unilever Nigeria Plc. in January, 2015 and responsible as the CFO for Unilever Nigeria to proactively provide strategic finance leadership to ensure optimal allocation of the Company’s resources in the planning and execution of the business strategy to create and maximise shareholder value. In January 2018, she was promoted to the position of Vice-President Finance, Ghana Nigeria.
Mrs. Nana Yaa Owusu-AnsahMrs Nana Yaa Owusu-Ansah is a seasoned marketer with over 13 years work experience in cross-functional roles within Unilever.
She has multi country and category experience in various positions including Personal Care Category Manager for Unilever Ghana and Skin Cleansing Category
Manager for Unilever West Africa. Before being appointed as Brand Building Director for Unilever Ghana in January 2016, she was the Head of Marketing for Africa Emerging Markets now Central Africa with responsibility for a number of markets including Angola, Cameroon DRC, Mauritius, Gabon and Southern African markets. In 2017, she was promoted to the position of Personal Care Director, Ghana-Nigeria.
She holds a Post Graduate Diploma in Business and Marketing Strategy from EduQual and a Masters’ degree in Marketing and Innovation from the London
School of Marketing.
Biographical information of Directors
Age category Number of DirectorsUp to – 40 years -41 – 60 years 10Above 60 years -

13
Managing Director’s ReviewIntroduction:Let me take this opportunity to welcome you all to this Annual General meeting as I present to you management’s review of our operations in 2018.It is management’s expectation to build on the strong platform provided in 2018 to deliver its growth ambitions in 2019 and beyond.
Customer Service Development:As the sales function at Unilever, we continue to make our first priority, driving of product and brand availability and visibility to all shoppers throughout all the shopping occasions.
Through the partnerships with our Key Distributors and Key accounts, we were able to extend our coverage directly to over 64,000 Customers over the last year. We further expanded our nationwide distributive footprint with Sub-Distributors, Tricycle deployment and the ‘Shakti’ model, route-to-market solutions that have allowed us to tap into the previously unexploited grey areas across the country. This has contributed strongly to our profitable and sustainable growth agenda. Over 110 youth have been employed through the tricycle salesman deployment project in Southern Ghana and an additional 100 women have been empowered economically under the Shakti program in the North as well.
We remain firmly committed to positively impacting our society and growing our business sustainably and profitably through accelerating the growth of our purpose led brands.
Home and Personal CategoriesUnilever still maintained its leadership position in Home care in spite of the very fierce competitive landscape both in Powders and the Bars segments.
Our Fabric Solutions - Laundry Powders-achieved a double-digit volume growth driven mainly by Sunlight powder through its aggressive market and consumer activations across all regions in 2018. Key driver of the growth was the 200g pack size which was introduced end of 2017 to meet a growing consumer need. The influx of many GH1.00 laundry bars, continue to impact on the bar segments growth. Nonetheless,
Unilever was able to achieve marginal value growth, leveraging the growing wrapped bars segment with Key Brilliant & BF leading the growth.
Sunlight Dish-wash Liquid under the Home & Hygiene category also achieved impressive growth through its trade and shopper incentive activations to appeal to more consumers.
Underpinning the 2018 performance was the implementation of the first ever USLP activation dubbed “Clothes to the Nation” (CTTN). Unilever solicited and donated over 11,000 clothes to the less privileged in the society. Overall, about 7,000 beneficiaries received the donation within the Greater Accra Region. Beauty and Personal Care Unilever continued to spearhead its dominant position in the personal care category through innovative product launches, consumer activities and value accretive business initiatives.
Our personal care business growth was driven by all brands especially, Pepsodent in the Oral Care category, Geisha in our skin cleansing category and Rexona in our deodorant category.
The successful roll-out of Geisha in-market activations across major markets nationwide to establish the brand’s long-lasting proposition was able to garner tremendous consumer and shopper support leading to an appreciable rise in the brand’s sales.
Our disruptive Rexona-Chelsea ‘Be the Next Champion’ consumer activation done
in partnership with Chelsea football club and world-renowned footballer, Michael Essien – the first of its kind in Ghana – leveraged the strong consumer love and grass root support for football in Ghana to successfully whip up consumer interest for the brand culminating into positive sales and growth for Rexona.
With social impact being a forefront of our business, both Pepsodent and
Lifebuoy commemorated World Oral Health Day and Global Handwashing Day
with month long campaigns to drive awareness on the need to brush twice daily to prevent cavities
2018 annual reports & financial statements Sustaining Growth with Purposeful Brands

14
Managing Director’s Review Continued
and wash hands regularly with soap on the five key occasions to prevent the spread of communicable diseases.
Through the Pepsodent and Lifebuoy educational campaign in Schools, and communities nationwide, Unilever reached over 2 million Ghanaians in 2018, with the message of “Brush 2x daily” & “Hand washing with soap & Water” on all 5 critical occasions (Before Breakfast, Lunch & Super, after using the Toilet and during Bathing). Foods and RefreshmentRefreshment had an impressive volume recovery of over 20% mainly driven through a price correction of Lipton yellow label in response to market conditions which increased rate of sale. A trade and consumer promotion during Ramadan as well as a new brand communication message on TV supported in driving awareness and repeat purchase. Glen, a second-tier affordable brand was also launched and will be a source of growth in the coming years. Foods had a fair growth across all brands. Blueband delivered volume growth over the first half of the year while owned by Unilever through improved distribution across more stores as well as through the continued multi-purpose campaign of the Original variant. Annapurna achieved a double-digit volume growth over the year driven by shopper & trade activities which stimulated consumer & retailer appeal.
Operating and Financial Review:Financial results for the year ended 31 December 2018 shows a good improvement compared with 2017 performance. Revenue increased by 10% from GH¢ 575m in 2017 to GH¢ 632m in 2018 largely due to increase in volumes sold. Operating profit before tax was recoreded as GH¢ 250m, representing 283% increase over 2017’s GH¢ 65m. Profit after tax therefore improved by 296% to GH¢ 191m compared to GH¢ 48m in 2017.
Cash Flow:Cash and cash equivalent is in deficit of GH¢ 65.5m in 2018 compared with GH¢ 53.18 in 2017 largely due to challenging environment during the period under review leading to less collections from customers.
Investment As a company, we continue to prioritize our investment
in building efficient process equipment as a means of meeting our customers’ continuous demand and thereby achieving our ambitious growth. Investment of more than GH¢ 39m was undertaken in areas of a Biomass Boiler, heating, an Oral onshore project, a Ghana Tea Bag sachet onshoring project amongst many others to improve efficiency of our operations.
Creating a brighter future for our society2018 was another great year of delivering tangible results, reflective of the objectives of our Unilever Sustainable Living Plan (USLP). We made great strides in supporting the improvement of the Health and Hygiene needs of Ghanaians; worked on projects to ensure a cleaner environment; and extended support to deprived communities to enhance livelihoods of Ghanaians. The following activities give details of our activities during the year under review:• The campaign on hand washing with soap under
Lifebuoy, was able to reach over 1 million people with the message of washing hands with soap under running water, during the 5 critical periods in a day- before breakfast, before lunch, before dinner, after using the toilet and during our daily baths. The Lifebuoy brand sponsored the Global Hand Washing Day celebrations, as it had done in the past, and extended the 2018 edition to the Central Region, where it held a durbar which attracted chiefs, health workers, educational authorities, school children and members of the public.
• The event in Accra was graced by the 2nd Lady of the Republic of Ghana, H.E. Samira Bawumia. Other dignitaries who joined her at the event grounds included the Minister for Women, Gender & Social Protection, Cynthia Morrison; Deputy ministers for Water & Sanitation and Education. Also in attendance was the Dutch Ambassador to Ghana, H.E. Ron Strikker. Representatives of NGOs in the Water and sanitation sector as well as educational authorities and about 3,000 school children were in attendance.
• The Orals team, through the Pepsodent brand, effectively utilized the platform of the World Oral Health Day celebrations to run a spirited campaign that reached many more Ghanaians with the message of brushing teeth twice daily. The brand sponsored the celebrations with an event in Accra, attended by many dignitaries in the health and education sectors with support from the Ghana Dental Association. About 4, 000 school children took part in a mass teeth brushing session during
2018 annual reports & financial statements Sustaining Growth with Purposeful Brands

15
Managing Director’s Review Continued
the event. The brand was able to directly reach over 1.5 million people with the message on the benefits of brushing one’s teeth twice daily. Their effort won them the prestigious and coveted CIMG Brand Activation of the year.
• The Unilever Ghana Foundation again partnered with Global Communities, a USAID sponsored NGO in the water and sanitation sector, to construct ten new hygiene stations for selected schools in the Tema, Ashaiman and Kpone-Katamanso areas. The newly constructed hygiene stations will be handed over to the following schools: Kpone Presbyterian Basic school A, Kpone Presbyterian Basic school B, Tema Manhean Anglican Primary A, Tema Manhean Anglican Primary B, Tema Manhean Anglican Primary C, Sakumono Holy Child Roman Catholic Basic, Ashiaman SDA Primary School, Ashaiman St Augustine’s Primary, Kotobabi No. 2 TMA JHS, and Ashaiman AME Zion Bethel JHS.
• The Foundation also supported the relaunch of the Livelihood Enhancement project ‘Shakti’, in Ghana. Under this Livelihood Enhancement project, 100 women from deprived communities in the Upper West region of Ghana have been selected and trained in basic financial management and how to start small businesses of their own. Unilever Ghana gave product loans of assorted Unilever products, from which they are expected to sell, keep the profit and use the capital to restock. The Foundation and Unilever are projecting to recruit 100 more women under this project in 2019. This speaks directly to the USLP objective of enhancing the livelihood of Ghanaians.
• Also, under the USLP objective of enhancing livelihood of Ghanaians, Unilever Ghana extended support to the Ghana Prison Service, Ghana Blind Union and the Sisters of Mother Theresa Charities by donating assorted Unilever products for the upkeep of inmates of the respective facilities.
• On the environment, Unilever worked through the Ghana Recycling Initiative by Private Enterprises (GRIPE), to engage more with government and other stakeholders involved in the discussion on plastic waste. GRIPE, working through the Association of Ghana Industries (AGI) has made good progress on sharing the views and concerns of industry with decision makers. The coalition is fast tracking efforts to introduce second life solutions. Pilots run in this respect have yielded some positive results. Building blocks have been molded from plastic waste and projected to be used in building hygiene stations across the country.
The efforts of the company in its line of doing business and extending support to Ghanaians on its USLP missions did not go unnoticed as awards of approvals were received. Some of the awards are as stated below:• FRIEND OF THE NATIONAL SCIENCE AND MATHS
QUIZ – PLATINUM AWARD• 2018 GHANA MANUFACTURING AWARDS -
MANUFACTURING COMPANY OF THE YEAR.• GHANA PROCUREMENT AND SUPPLY CHAIN
AWARDS • CHARTERED INSTITUTE OF MARKETING GHANA,
AWARDS • JOBBERMAN BEST 100 COMPANIES TO WORK
FOR, RECOGNIZES UNILEVER FOR EMERGING ONE OF THE BEST 100 COMPANIES TO WORK FOR IN GHANA
• 3RD EHS AWARDS; SAFETY COMPLIANT COMPANY OF THE YEAR, UNILEVER GHANA.
• GHANA BUSINESS AWARDS; BEST CONTRIBUTING COMPANY TO THE ECONOMY OF GHANA, UNILEVER GHANA.
• SUSTAINABILITY AND SOCIAL INVESTMENT AWARDS; BEST COMPANY FOR LIVELIHOOD EMPOWERMENT, BEST COMPANY IN PROVIDING SANITATION FACILITIES
• MARKETING WORLD AWARDS; ACTIVATION OF THE YEAR WITH REXONA; CONSUMER BRAND OF THE YEAR WITH BLUE BAND MARGARINE
• GHANA CLUB 100 AWARD BY THE GHANA INVESTMENT PROMOTION CENTER
• CSR AWARD FOR GREENING & ENVIRONMENTAL PROTECTION
• CSR AWARD FOR PRODUCTION STANDARDIZATION
We are encouraged by the recognition that our efforts have attracted from these prestigious award institutions. It urges us on to do more. We will stay committed to the production and distribution of products that meet the health and hygiene needs of Ghanaians daily and invest in ventures that would always enhance the livelihoods of Ghanaians.
We look forward to a more fruitful year in 2019.
Outlook for 2019Considering the level of growth achieved with our ‘connected for Growth’ strategy, we cannot afford to drop the bar, but to build on the strong platform achieved in 2018 and increase the operational intensity with customer focus to achieve our continuous growth ambition.
2018 annual reports & financial statements Sustaining Growth with Purposeful Brands
16
CORPORATE GOVERNANCE
Introduction
Unilever recognises the importance of good corporate governance as a means of sustaining viability of the business in the long term, and further believes that the attainment of business objectives is directly aligned to good corporate behaviour. In line with this, and alongside the need to meet its responsibility to its shareholders and other stake holders, the company strives to meet expectations of the community in which it operates.
In the conduct of its business, Unilever has sought to comply with all statutory requirements, adopted, tried and proven best practices to protect the environment and its employees, invested in the community in which it operates, and strived to enhance shareholder value in the process. Unilever adopts both medium and long term growth strategies, and allocates resources in order to guarantee the creation of wealth. It utilises modern technology and continuously innovates in order to satisfy changing consumer and customer needs, and in so doing, stay ahead of the competition. Unilever promotes and recognises excellence through its employee development programmes.
The company has put in place sound operational control systems in order to safeguard the interests of shareholders and stakeholders. As indicated in the Statement of Responsibility of Directors and Notes to the Accounts, the business adopts standard accounting practices to facilitate transparency in the disclosure of information and to give assurance to the reliability of the Financial Statements.
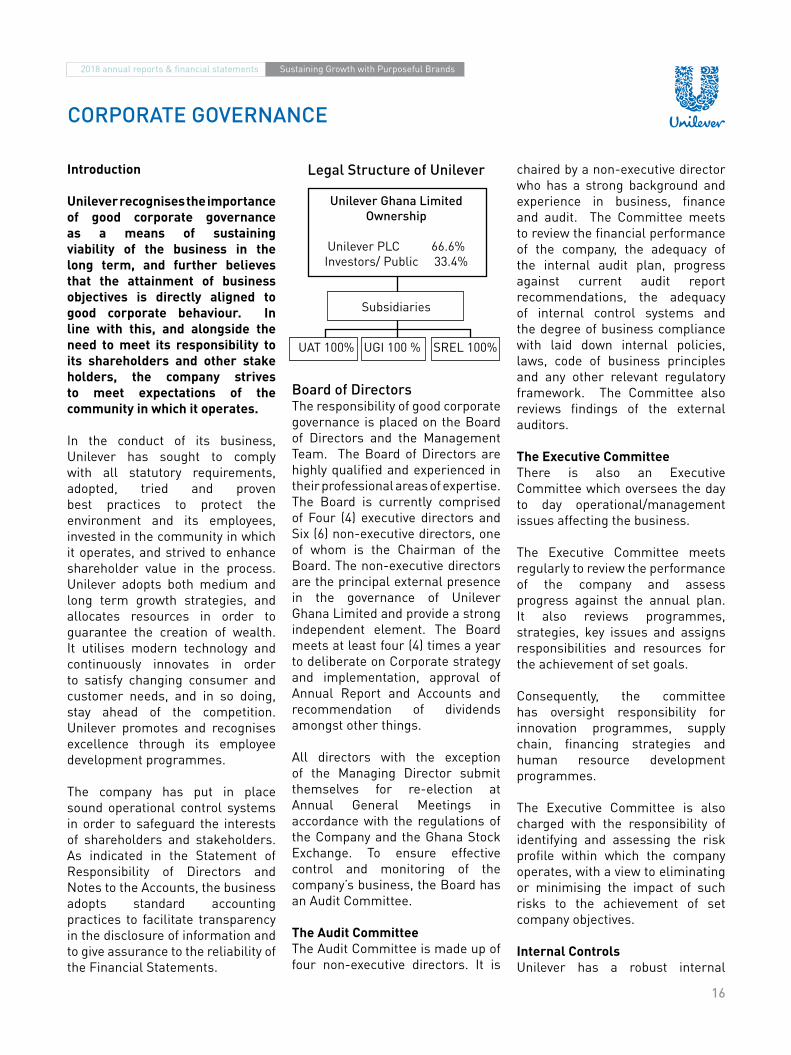
Legal Structure of Unilever
Unilever Ghana Limited Ownership
Unilever PLC 66.6%Investors/ Public 33.4%
Subsidiaries
UAT 100% UGI 100 % SREL 100%
Board of DirectorsThe responsibility of good corporate governance is placed on the Board of Directors and the Management Team. The Board of Directors are highly qualified and experienced in their professional areas of expertise. The Board is currently comprised of Four (4) executive directors and Six (6) non-executive directors, one of whom is the Chairman of the Board. The non-executive directors are the principal external presence in the governance of Unilever Ghana Limited and provide a strong independent element. The Board meets at least four (4) times a year to deliberate on Corporate strategy and implementation, approval of Annual Report and Accounts and recommendation of dividends amongst other things.
All directors with the exception of the Managing Director submit themselves for re-election at Annual General Meetings in accordance with the regulations of the Company and the Ghana Stock Exchange. To ensure effective control and monitoring of the company’s business, the Board has an Audit Committee.
The Audit CommitteeThe Audit Committee is made up of four non-executive directors. It is
chaired by a non-executive director who has a strong background and experience in business, finance and audit. The Committee meets to review the financial performance of the company, the adequacy of the internal audit plan, progress against current audit report recommendations, the adequacy of internal control systems and the degree of business compliance with laid down internal policies, laws, code of business principles and any other relevant regulatory framework. The Committee also reviews findings of the external auditors.
The Executive CommitteeThere is also an Executive Committee which oversees the day to day operational/management issues affecting the business.
The Executive Committee meets regularly to review the performance of the company and assess progress against the annual plan. It also reviews programmes, strategies, key issues and assigns responsibilities and resources for the achievement of set goals.
Consequently, the committee has oversight responsibility for innovation programmes, supply chain, financing strategies and human resource development programmes.
The Executive Committee is also charged with the responsibility of identifying and assessing the risk profile within which the company operates, with a view to eliminating or minimising the impact of such risks to the achievement of set company objectives.
Internal ControlsUnilever has a robust internal
2018 annual reports & financial statements Sustaining Growth with Purposeful Brands

17
CORPORATE GOVERNANCE Continued
control system, which is well documented and regularly reviewed. The system incorporates internal control procedures, which are designed to provide reasonable assurance that assets are safeguarded and that the risks facing the business are being managed to eliminate or minimise their impact. The Board of Unilever Ghana has put in place a clear organizational structure and Board authorities are delegated to middle and lower level management in line with delegated responsibilities as defined by the said structure.
Unilever’s corporate internal audit function plays a key role in providing an objective assessment of the adequacy and effectiveness of the internal control systems in the business.
Code of Business Principles.Unilever has a documented Code of Business Principles to guide all employees and business partners in the discharge of their duties. This code sets the standard of professionalism and integrity required for business operations which among other things cover the following areas: compliance with the law, conflicts of interest, acquisition of company shares, public activities, product assurance, environmental management, accuracy and reliability of financial reporting, bribery, etc, and procedures for handling instances of non-compliance.
2018 annual reports & financial statements Sustaining Growth with Purposeful Brands

BE STRONG AND LAST LONG

18
REPORT OF THE AUDIT COMMITTEE
MEMBERSHIP OF AUDIT COMMITTEE OF THE BOARDThe Unilever Ghana Audit committee is comprised of three non-executive Directors and the Vice President, Finance of the Company. The Committee is chaired by Mrs Angela Peasah a Chartered Accountant, non-executive Director with an extensive background in general management, accounting, finance and audit. The Unilever Audit & Risk Manager is always in attendance at the meetings and from time to time the external auditor, KPMG, is also invited to make presentations to the Committee.
ROLE OF THE AUDIT COMMITTEE The Audit Committee meets quarterly to review:• The financial performance of the Company• The adequacy of the plan of internal audit• Current audit reports; statutory and internal audit• The adequacy of internal controls • The degree of compliance to laid down policies, laws, code of ethics and business practices of the Company
and• Compliance with the Sarbannes Oxley Act on Operational Control Assessment.
SUMMARY OF THE AUDIT COMMITTEE’S ACTIVITIES IN 2018In 2018, the Unilever Ghana Limited Audit Committee met five times on 23 January, 2018, 7 March 2018, 24 April 2018, 24 July 2018 and 26 October 2018.
REVIEW OF THE FINANCIAL PERFORMANCE OF THE COMPANYAt the 23 January and 7 March 2018 meetings, the committee reviewed the financial performance of the Company for the financial year ended 31 December 2017 and the audited accounts for the 2017 financial year. The Committee was updated on the Company’s performance in 2018 during the 24 April 2018, 24 July 2018 and 26 October 2018 meetings.
INTERNAL AUDIT The Internal Audit team updated the committee on the status of audit plan, risk and actions and outlined the Ghana Business Risk matrix for the quarter.
The Total controls tested were Four (4). Recommendations for improvement were all remediated during the year.
The audit team also updated the committee regularly on the Company’s audit and risk management assessment findings.
EXTERNAL AUDITThe external Auditor updated the Committee on the audit plan and strategy for the year ending 31 December 2018. The Key focus areas were provision for and payment for management and technical service fees, disposal of spread business, revenue recognition, existence and valuation of inventories and management override of controls and transition adjustments for International Financial Reports Standards (IFRSs) 9 &15.
The audit team also updated the committee regularly on the company’s audit and risk management assessment findings.
2018 annual reports & financial statements Sustaining Growth with Purposeful Brands

19
DIRECTORS’ REPORTThe Directors have the pleasure in submitting to the members, the Company’s Financial Statements for the year ended 31 December 2018.
DIRECTORS’ RESPONSIBILITY STATEMENTThe Directors are responsible for the preparation of financial statements that give a true and fair view of Unilever Ghana Limited, comprising the statement of financial position at 31 December 2018 and the statements of comprehensive income, changes in equity and cash flows for the year then ended and the notes to the financial statements which include a summary of significant accounting policies and other explanatory notes, in accordance with International Financial Reporting Standards and in the manner required by the Companies Act, 1963 (Act 179). In addition, the Directors are responsible for the preparation of the Directors’ report.
The Directors are also responsible for such internal control as the directors determine is necessary to enable the preparation of financial statements that are free from material misstatement, whether due to fraud or error and for maintaining adequate accounting records and an effective system of risk management.
The Directors have made an assessment of the ability of the Company to continue as a going concern and have no reason to believe that the business will not be a going concern in the year ahead. The auditor is responsible for reporting on whether the financial statements give a true and fair view in accordance with the applicable financial reporting framework.
FIVE YEAR FINANCIAL HIGHLIGHTSDetails of the Company’s five-year financial highlights are disclosed on page 73.
FINANCIAL STATEMENTS/BUSINESS REVIEWThe financial results for the year ended 31 December 2018 is reflected in the accompanying financial statements.
The Directors propose a dividend of GH¢ 0.80 (2017: GH¢ 0.25) per share amounting to GH¢50,000,000 (2017: GH¢15,625,000).
The Directors consider the state of the Company’s affairs to be satisfactory.
NATURE OF BUSINESS/PRINCIPAL ACTIVITIESThe Company is registered to carry on the business of manufacturing and marketing of fast-moving consumer goods primarily in the home care, personal care and foods categories. There was no change in the nature of business of the Company during the year.
OBJECTIVES OF THE COMPANYThe objective of the Company is to make sustainable living commonplace. HOLDING COMPANYThe Company is 66.6% owned by Unilever Plc, a company incorporated in the United Kingdom.
RELATED PARTY TRANSACTIONSInformation regarding Directors’ interests in ordinary shares of the Company and remuneration is disclosed in Note 33 and analysis of shareholders on page 72 to the financial statements. No Director has any other interest in any shares or loan stock of the Company. Other than service contracts, no Director had a material interest in any contract to which the Company was a party to during the year. Related party transactions and balances are also disclosed in note 32 to the financial statements.
AUDITORThe Audit Committee has responsibility delegated by the Board of Directors for making recommendations on the appointment, reappointment, removal and remuneration of the external auditor. KPMG has been the auditor of Unilever Ghana Limited for five years. KPMG does not provide non-audit services to the Company.
2018 annual reports & financial statements Sustaining Growth with Purposeful Brands

20
DIRECTORS’ REPORT ContinuedProfile
Executive Qualification Outside board and management position
Gladys Amoah o Holds Bachelor of Science in Zoology and Microbiology- University of Cape Town
Nil
Nazaire Djako o Master of Science in Crude Oil (Petroleum), French Institute of Petroleum, Rueil-Malmaison – France.
o Chemical and Process Engineer from University of Science and Technology, Compeiegne France.
o Advance Certificate in Technology from Institute of Technology, University of Rheims, Champagne, France.
Nil
Nana Yaa Owusu-Ansah
o Master of Arts –Marketing & Innovation from London School of Marketing.o Post graduate Diploma – Business & Marketing Strategy Eduqual Extended
Programmeo Bachelor of Education – Psychology from University of Cape Coast
Nil
Michael Odinakachi Ubeh
o BSc (Hons) in Applied Chemistry- Federal University of Uyo Akwa Ibom Nigeria
o Master in business administration Federal University of Technology -Yola Nigeria
o Post Graduate Certificate in Management- University of Cumbria- London.
Nil
Non-executive
Edward Effah o Chartered Accountanto Member of the Institute of Chartered Accountants in England & Wales.o Member of the Institute of Directors (UK).
o Fidelity Bank – Chairmano Africa Capital LLC – Directoro Legacy Bonds Limited - Director
Edith Dankwa
o Doctor of Business Administration (DBA) – Walden University USAo Master of Business Administration (MBA), Ghana Institute of Management &
Public Administration.o Post Graduate Certificate – Newspaper Management International Institute
of Journalism (Germany).o Post Graduate Diploma – Marketing, Chartered Institute of Marketing,
Ghana.o B A Management Studies, University of Cape Coast
o Business & Financial Times Limitedo Conbiz Construction & Investment Limitedo Urban Presso Executive Women Network
Alfred Yaw Oduro Nsarkoh
o Degree in Chemical Engineering – University of Science & Technology, Kumasi, Ghanao Post Graduate Diploma in Management – Henley Management College, Henley-on-Thames, UK
Nil
Angela Peasah
o Chartered Accountant of the Institute of Chartered Accounts, Ghana. o Executive MBA from the University of Ghana Business School, University of
Ghana, Legon.o Institute of Professional Studies (IPS)
Nil
Adesola Sotande-Peters
o Bachelor degree in Business Administration & Economics from Richmond College, The American International University in London.
o MBA for finance professionals – Manchester Business School.o Fellow of the Association of Certified Chartered Accountants (FCCA).o Member of the Institute of Chartered Accountants of Nigeria (ICAN).
Nil
Philip Odotei Sowah
o BSc Mechanical Engineering, Washington University Missouri, USAo BA Physics, Grinnell College, Iowa, USAo Airtel Leadership in Action Program –INSEAD Business School, Singapore campus
o Barclays Bank of Ghana Limited – Directoro Afriwave Telecom – Directoro Qualtek Limited – Directoro TxtGroup Limited - Director
Biographical information of directors
Age Category Number of Directors • Up to – 40 years -• 41 – 60 years 10• Above 60 years -
2018 annual reports & financial statements Sustaining Growth with Purposeful Brands
Director Director 21
DIRECTORS’ REPORT ContinuedROLE OF THE BOARDThe Directors are responsible for the long-term success of the Company to, determine the strategic direction of the Company and review operating, financial and risk performance. There is a formal schedule of matters reserved for the Board of Directors, including approval of the Company’s annual business plan, strategy, acquisitions, disposals and capital expenditure projects above certain thresholds, all guarantees, treasury policies, the financial statements, the Company’s dividend policy, transactions involving the issue or purchase of company shares, borrowing powers, appointments to the Board, alterations to the memorandum and articles of association, legal actions brought by or against the company and the scope of delegations to Board Committees, subsidiary boards and the management committee. Responsibility for thedevelopment of policy and strategy and operational management is delegated to the Executive Directors and a management committee, which as at the date of this report includes the Executive Directors and five senior managers.
INTERNAL CONTROL SYSTEMSThe Directors have overall responsibility for the Company’s internal control systems and annually review their effectiveness, including a review of financial, operational, compliance and risk management controls. The implementation and maintenance of the risk management and internal control systems are the responsibility of the Executive Directors and other senior management. The systems are designed to manage rather than eliminate the risk of failure to achieve business objectives and to provide reasonable, but not absolute, assurance against material misstatement or loss. The Directors have reviewed the effectiveness of the internal control systems, including controls related to financial, operational and reputational risks identified by the company as at the reporting date and no significant failings or weaknesses were identified during this review.
DIRECTORS’ PERORMANCE EVALUATIONEvery year the performance and effectiveness of the Board of Directors (“the Board”), its committees and individual Directors are evaluated. The evaluation is conducted by the completion of detailed and comprehensive written survey questionnaires. The results of the evaluation is shared with all members
of the Board. Overall, it was noted that the Board of Directors and its committees were operating in an effective manner and performing satisfactorily, with no major issues identified.
PROFESSIONAL DEVELOPMENT AND TRAININGOn appointment to the Board, directors are provided with a full, formal and tailored programme of induction, to familiarise them with the company’s business, the risks and strategic challenges it faces, and the economic, competitive, legal and regulatory environment in which the company operates. A programme of strategic and other reviews, together with the other training provided during the year, ensures that directors continually update their skills, their knowledge and familiarity with the Company’s businesses, and their awareness of sector, risk, regulatory, legal, financial and other developments to enable them to fulfil effectively their role on the Board and committees of the Board.
CONFLICTS OF INTERESTThe Company has established appropriate conflicts authorisation procedures, whereby actual or potential conflicts are regularly reviewed, and authorisations sought as appropriate. During the year, no such conflicts arose, and no such authorisations were sought.
BOARD BALANCE AND INDEPENDENCEThe composition of the Board of Directors and its Committees is regularly reviewed to ensure that the balance and mix of skills, independence, knowledge and experience is maintained. The Board considers that the Chairman is independent on appointment and all non-Executive Directors are independent as it pertains to the management of the Company. The continuing independent and objective judgement of the non-Executive Directors has been confirmed by the Board of Directors.
CORPORATE RESPONSIBILITYCorporate responsibilities activities can be found on pages 14 and 15.
APPROVAL OF THE FINANCIAL STATEMENTSThe financial statements of Unilever Ghana Limited, as identified in the first paragraph, were approved by the Board of Directors on the 28 March 2019 and signed on their behalf by:
2018 annual reports & financial statements Sustaining Growth with Purposeful Brands

22
INDEPENDENT AUDITOR’S REPORTTO THE MEMBERS OF UNILEVER GHANA LIMITED
Report on the Audit of Financial Statements
OpinionWe have audited the financial statements of Unilever Ghana Limited (“the Company”), which comprise the statement of financial position as at 31 December 2018 and the statements of comprehensive income, changes in equity and cash flows for the year then ended, and the notes to the financial statements which include a summary of significant accounting policies and other explanatory notes, as set out on pages 25 to 71.
In our opinion, these financial statements give a true and fair view of the financial position of Unilever Ghana Limited as at 31 December 2018 and of its financial performance and cash flows for the year then ended in accordance with International Financial Reporting Standards (IFRSs) and in the manner required by the Companies Act, 1963 (Act 179).
Basis for OpinionWe conducted our audit in accordance with International Standards on Auditing (ISAs). Our responsibilities under those standards are further described in the Auditor’s Responsibilities for the Audit of the Financial Statements section of our report. We are independent of the Company in accordance with the International Ethics Standards Board for Accountants’ Code of Ethics for Professional Accountants (IESBA Code) together with the ethical requirements that are relevant to our audit of the schedule in Ghana, and we have fulfilled our other ethical responsibilities in accordance with the IESBA Code. We believe that the audit evidence we have obtained is sufficient and appropriate to provide a basis for our opinion.
Key Audit MattersKey audit matters are those matters that, in our professional judgment, were of most significance in our audit of the financial statements of the current period. These matters were addressed in the context of our audit of the financial statements as a whole and in forming our opinion thereon, and we do not provide a separate opinion on these matters.
Revenue recognition GH¢632 million
Refer to Note 5 of the financial statements
The key audit matterRevenue is measured based on the consideration specified in a contract with a customer. The Company recognises revenue when goods are delivered to a customer and thus control has been transferred. There is a time lag between issue of goods to distributors and receipts of those goods close to the year end. Revenue may be recorded when control has not been transferred to the customer. How the matter was addressed in our auditWe evaluated the design and implementation and tested the operating effectiveness of controls over the initiation, recording and processing of revenue. We assessed whether sales transactions posted before and after the balance sheet dates as well as credit notes issued after year end were recognised in the current period. We also developed an expectation of the current year revenue balance based on trend analysis, taking into account historical monthly sales and returns information. We then compared the expectation to actual results and ascertained reasons for variances. We also considered the adequacy of the Company’s disclosures in respect of revenue in line with IFRS 15.
Existence, accuracy and valuation of inventory GH¢53 million
Refer to Note 19 of the financial statements

The key audit matterThe Company keeps a large number of inventory lines with significant values for the all segments. Inventory may not be measured appropriately due to nonexistence, obsolescence or inaccurate unit costs assigned to items with significant values.
How the matter was addressed in our auditWe evaluated the design and implementation and tested the operating effectiveness of controls over periodic inventory counts and management review of inventory reconciliation. We also observed year- end inventory counts and agreed results with the Company’s records. On a sample basis, we recomputed the unit costs of inventory used in the year-end of inventory valuation by agreeing the costs to supporting documentation such as purchase invoices and landed costs. We enquired into identified slow moving inventory and assessed reasonableness of impairment allowance recognised on such inventory. We also considered the adequacy of disclosures in relation to inventory recognised in the financial statements.
Other InformationThe Directors are responsible for the other information. The other information comprises the information Report of the Directors, as required by the Companies Act, 1963 (Act 179), the Report of the Audit Committee, Managing Director’s Review, the Chairman’s Review and Corporate Governance which we obtained prior to the date of this auditor’s report..
Other information does not include the financial statements and our auditor’s report thereon.
In connection with our audit of the financial statements, our responsibility is to read the other information and, in doing so, consider whether the other information is materially inconsistent with the financial statements or our knowledge obtained in the audit, or otherwise appears to be materially misstated. If, based on the work we have performed, we conclude that there is a material misstatement of this other information, we are required to report that fact. We have nothing to report in this regard.
Responsibilities of the Directors for the Financial StatementsThe Directors are responsible for the preparation of financial statements that give a true and fair view in accordance with International Financial Reporting Standards and in the manner required by the Companies Act, 1963 (Act 179), and for such internal control as the Directors determine is necessary to enable the preparation of financial statements that are free from material misstatement, whether due to fraud or error.
In preparing the financial statements, the Directors are responsible for assessing the Company’s ability to continue as a going concern, disclosing, as applicable, matters related to going concern and using the going concern basis of accounting unless the Directors either intend to liquidate the Company or to cease operations, or have no realistic alternative but to do so.
The Directors are responsible for overseeing the Company’s financial reporting process.
Auditor’s Responsibilities for the Audit of the Financial Statements Our objectives are to obtain reasonable assurance about whether the financial statements as a whole are free from material misstatement, whether due to fraud or error and to issue an auditor’s report that includes our opinion. Reasonable assurance is a high level of assurance but is not a guarantee that an audit conducted in accordance with ISAs will always detect a material misstatement when it exists. Misstatements can arise from fraud or error and are considered material if, individually or in the aggregate, they could reasonably be expected to influence the economic decisions of users taken on the basis of these financial statements.
As part of an audit in accordance with ISAs, we exercise professional judgment and maintain professional scepticism throughout the audit. We also:o Identify and assess the risks of material misstatement of the financial statements, whether due to fraud or
error, design and perform audit procedures responsive to those risks, and obtain audit evidence that is sufficient
INDEPENDENT AUDITOR’S REPORTTO THE MEMBERS OF UNILEVER GHANA LIMITED (CONTINUED)
23

24
and appropriate to provide a basis for our opinion. The risk of not detecting a material misstatement resulting from fraud is higher than for one resulting from error, as fraud may involve collusion, forgery, intentional omissions, misrepresentations, or the override of internal control.
o Obtain an understanding of internal control relevant to the audit in order to design audit procedures that are appropriate in the circumstances, but not for the purpose of expressing an opinion on the effectiveness of the Company’s internal control.
o Evaluate the appropriateness of accounting policies used and the reasonableness of accounting estimates and related disclosures made by management.
o Conclude on the appropriateness of the Directors’ use of the going concern basis of accounting and, based on the audit evidence obtained, whether a material uncertainty exists related to events or conditions that may cast significant doubt on the Company’s ability to continue as a going concern. If we conclude that a material uncertainty exists, we are required to draw attention in our auditor’s report to the related disclosures in the financial statements or, if such disclosures are inadequate, to modify our opinion. Our conclusions are based on the audit evidence obtained up to the date of our auditor’s report. However, future events or conditions may cause the Company to cease to continue as a going concern.
o Evaluate the overall presentation, structure and content of the financial statements, including the disclosures, and whether the financial statements represent the underlying transactions and events in a manner that achieves fair presentation.
We communicate with the Directors regarding, among other matters, the planned scope and timing of the audit and significant audit findings, including any significant deficiencies in internal control that we identify during our audit.
Report on Other Legal and Regulatory Requirements
Compliance with the requirements of Section 133 of the Companies Act 1963(Act 179)
We have obtained all the information and explanations which, to the best of our knowledge and belief were necessary for the purpose of our audit.
In our opinion, proper books of account have been kept and the statements of financial position and comprehensive income are in agreement with the books of account.
The engagement partner of the audit resulting in this independent auditor’s report is Anthony Kwasi Sarpong (ICAG/P/1369).
…………………………..…………FOR AND ON BEHALF OF:KPMG: (ICAG/F/2019/038)CHARTERED ACCOUNTANTS13 YIYIWA DRIVE, ABELENKPEP O BOX GP 242ACCRA
28 March 2019
INDEPENDENT AUDITOR’S REPORTTO THE MEMBERS OF UNILEVER GHANA LIMITED (CONTINUED)

FOR SOFT ANDFRAGRANT SKIN
FLORAL BEAUTY OIL™NEW FLONEW

25
Statement of financial position as at 31 December(All amounts are expressed in thousands of Ghana cedis)
…………………………………. …………………………………. Director Director
The notes on pages 29 to 71 form an integral part of these financial statements.
Notes 2018 2017Assets Property, plant and equipment 15a 144,194 113,738Intangible assets 16 - 7Investment in subsidiaries 18 10 10 --------- ---------Non-current assets 144,204 113,755 --------- ---------
Inventories 19 53,436 53,618Trade and other receivables 24 270,261 93,937Prepayments 25 22,740 28,747Related party receivables 32c 227,904 125,259Current tax asset 14b - 112Cash and bank balances 28 7,945 53,203 --------- ----------Current assets 582,286 354,876 --------- ----------Total assets 726,490 468,631 ====== ======EquityShare capital 21a 1,200 1,200Capital surplus account 22 204 204Retained earnings 21b 293,656 119,112Share deals account 23 81 81 ---------- ---------Total equity 295,141 120,597 ---------- --------- Non-current liabilitiesEmployee benefit obligations 17b 4,113 4,364Deferred tax liability 14c 8,842 8,644 -------- --------Non-current liabilities 12,955 13,008 -------- --------
Current liabilitiesBank overdraft 28 73,508 14Trade and other payables 26 69,836 74,009Related party payables 32d 231,651 154,407Dividend payables 20 3,044 3,044Provisions 29 13,743 103,552Current tax liability 14b 26,612 - ---------- ----------Current liabilities 418,394 335,026 ---------- ----------Total liabilities 431,349 348,034 ---------- ----------Total liabilities and equity 726,490 468,631 ======= =======
2018 annual reports & financial statements Sustaining Growth with Purposeful Brands

26
Statement of comprehensive income for the year ended 31 December(All amounts are expressed in thousands of Ghana cedis)
The notes from pages 29-71 are an intergral part of these financial statements.
Note 2018 2017
Revenue 5 632,152 575,765
Cost of sales 7 (440,991) (401,712) ---------- ----------Gross profit 191,161 174,053
Distribution expenses 8 (17,732) (13,156)Brand and marketing investment 9 (39,999) (27,537)Administrative expenses 10 (67,867) (56,113)Restructuring costs 29 (9,620) (10,906)Impairment on trade receivables 34c(i) (10,575) (346)Other Income 11a 118,844 1,209Gain on disposal of Spread business 11b 89,046 - ---------- --------Operating profit 253,258 67,204
Finance income 12 440 160Finance costs 12 (3,376) (2,004) --------- --------Profit before taxation 250,322 65,360Income tax expense 14a (59,497) (17,211) --------- --------Profit for the year 190,825 48,149 --------- --------
Other comprehensive income
Items that will not be reclassified to profit or lossActuarial gain (loss) 17b 620 (18)Related tax 14b, c (155) 4 ----- ---Other comprehensive income, net of tax 465 (14) --------- --------Total comprehensive income 191,290 48,135 ======= ======Earnings per share for profit attributable to equity holders of the CompanyBasic earnings per share 3.0532 0.7704Diluted earnings per share 3.0532 0.7704
2018 annual reports & financial statements Sustaining Growth with Purposeful Brands

27
Statement of cash flows for the year ended 31 December(All amounts are expressed in thousands of Ghana cedis)
Notes 2018 2017Cash flows from operating activitiesCash generated from operations 27 (9,928) 90,786Interest paid 12 (3,376) (2,004)Interest received 12 440 160Tax paid 14b (32,356) (15,411) --------- --------Net cash (used in)/generated from operating activities (45,220) 73,531 --------- --------Cash flows from investing activitiesPurchase of property, plant and equipment 15a (60,914) (21,005) --------- --------Net cash used in investing activities (60,914) (21,005) --------- --------
Cash flows used in financing activitiesDividend paid 20 (15,625) (3,125) -------- -------Net cash used in financing activities (15,625) (3,125) -------- -------
(Decrease)/increase in cash and cash equivalents (121,759) 49,401Cash and cash equivalents at 1 January 53,189 3,476Effect of movement in exchange rate on cash and bank 3,007 312 --------- --------Cash and cash equivalents at 31 December 28 (65,563) 53,189 ======= ======
The notes from pages 29-71 are an intergral part of these financial statements.
2018 annual reports & financial statements Sustaining Growth with Purposeful Brands

28
Statement of changes in equity as at 31 December(All amounts are expressed in thousands of Ghana cedis)
The notes from pages 29-71 are an intergral part of these financial statements.
Share Capital Retained Share Total capital surplus earnings deals equity Balance at 1 January 2018 1,200 204 119,112 81 120,597Adjustment-initial application -IFRS-9 (net of tax) - - (1,121) - (1,121) ------- ------ ------- ------- --------Restated balance at 1 January 2018 1,200 204 117,991 81 119,476 ------- ------ ------- ------- --------Total comprehensive income Profit for the year - - 190,825 - 190,825Other comprehensive income (Note 14b, 17b) - - 465 - 465 ------- ------ ------- ------- ---------Total comprehensive income - - 191,290 - 191,290 ------- ------ ------- ------- ---------Transactions with owners of the CompanyDistributionDividend declared - - (15,625) - (15,625) ------- ------ --------- ------- ---------Total distribution - - (15,625) - (15,625) ------- ------- --------- ------- ---------Balance at 31 December 2018 1,200 204 293,656 81 295,141 ==== === ======= == =======
Balance at 1 January 2017 1,200 204 74,102 81 75,587 ------- ----- -------- ---- --------Total comprehensive incomeProfit for the year - - 48,149 - 48,149Other comprehensive income (Note 14b, 17b) - - (14) - (14) --------- -------- -------- --------- --------Total comprehensive income - - 48,135 - 48,135 --------- --------- -------- --------- --------Transactions with owners of the CompanyDistributionDividend declared - - (3,125) - (3,125) --------- --------- ------- --------- --------Total distribution - - (3,125) - (3,125) ===== ===== ====== ===== ======Balance at 31 December 2017 1,200 204 119,112 81 120,597 ===== === ====== == ======
2018 annual reports & financial statements Sustaining Growth with Purposeful Brands

29
1. REPORTING ENTITYUnilever Ghana Limited is registered and domiciled in Ghana. The Company manufactures and sells consumer products. The Company is listed on the Ghana Stock Exchange. For Companies Act, 1963 (Act 179) reporting purposes, the balance sheet is represented by the statement of financial position and the profit and loss account by the statement of comprehensive income, in these financial statements. The financial statements at and for the year ended 31 December 2018 comprise the separate financial statements of the Company.
2. BASIS OF ACCOUNTING
a. Statement of complianceThe financial statements have been prepared in accordance with International Financial Reporting Standards (IFRS) and in the manner required by the Companies Act, 1963 (Act 179). The financial statements were authorised on 28 March, 2019.
This is the first set of the Company’s annual financial statement in which IFRS 15 Revenue from Contracts with customers and IFRS 9 Financial Instruments have been applied. The Company adopted the requirements of IFRS 15 Revenue from Contracts and IFRS 9 Financial Instruments for its financial period beginning 1 January 2018. Changes to the significant accounting policies are described in note 3.
b. Basis of measurementThe financial statements are prepared on the historical cost convention except for defined benefit obligations measured at present value of the future benefit to employees.
c. Functional and presentation currencyThe financial statements are presented in Ghana cedis (GH¢) which is the Company’s functional currency. All financial information are expressed in thousands of Ghana cedis, unless otherwise indicated.
d. Use of estimates and judgmentThe preparation of financial statements in conformity with IFRS requires management to make judgements, estimates and assumptions that affect the application of policies and reported amounts of assets and liabilities, income and expenses. The estimates and associated assumptions are based on historical experience and various other factors that are believed to be reasonable under the circumstances, the results of which form the basis of making judgements about the carrying values of assets and liabilities that are not readily apparent from other sources. Actual results may differ from these estimates.
The estimates and underlying assumptions are reviewed on an ongoing basis. Revisions to accounting estimates are recognised in the period in which the estimates are revised if the revision affects only that period, or in the period of the revision and future periods, if the revision affects both current and future periods.
e. Assumption and estimated uncertainties(i) Information about assumption and estimation uncertainties that have a significant risk of resulting in a material adjustment in the year ending 31 December 2018, is included in the following notes:
o Note 17: measurement of defined benefit obligation: Key actuarial assumptions; ando Note 34(c)(i) : measurement of ECL allowance for trade receivables: Key assumptions in determining the weighted –average loss rate
Financial StatementsNotes to the financial statements
2018 annual reports & financial statements Sustaining Growth with Purposeful Brands

FDI recognizes that twice daily brushing with a fluoride toothpaste such as Closeup Deep Action is beneficial to oral health.
30
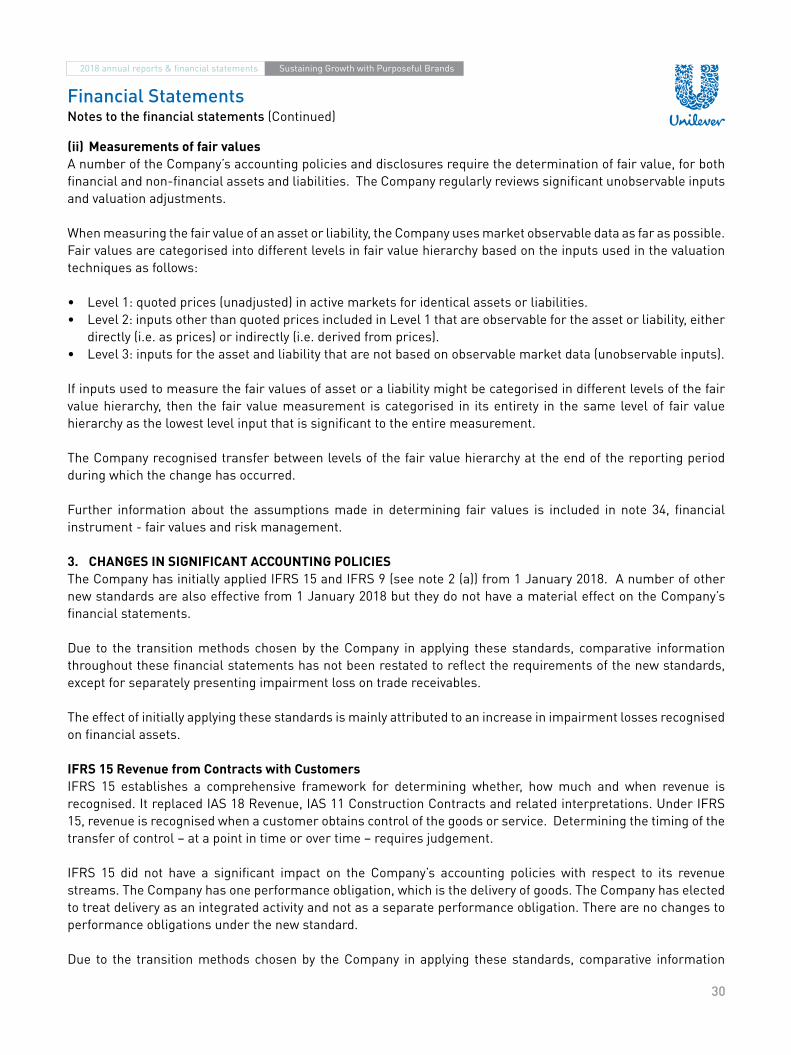
(ii) Measurements of fair valuesA number of the Company’s accounting policies and disclosures require the determination of fair value, for both financial and non-financial assets and liabilities. The Company regularly reviews significant unobservable inputs and valuation adjustments.
When measuring the fair value of an asset or liability, the Company uses market observable data as far as possible. Fair values are categorised into different levels in fair value hierarchy based on the inputs used in the valuation techniques as follows:
• Level 1: quoted prices (unadjusted) in active markets for identical assets or liabilities.• Level 2: inputs other than quoted prices included in Level 1 that are observable for the asset or liability, either directly (i.e. as prices) or indirectly (i.e. derived from prices).• Level 3: inputs for the asset and liability that are not based on observable market data (unobservable inputs).
If inputs used to measure the fair values of asset or a liability might be categorised in different levels of the fair value hierarchy, then the fair value measurement is categorised in its entirety in the same level of fair value hierarchy as the lowest level input that is significant to the entire measurement.
The Company recognised transfer between levels of the fair value hierarchy at the end of the reporting period during which the change has occurred.
Further information about the assumptions made in determining fair values is included in note 34, financial instrument - fair values and risk management.
3. CHANGES IN SIGNIFICANT ACCOUNTING POLICIESThe Company has initially applied IFRS 15 and IFRS 9 (see note 2 (a)) from 1 January 2018. A number of other new standards are also effective from 1 January 2018 but they do not have a material effect on the Company’s financial statements.
Due to the transition methods chosen by the Company in applying these standards, comparative information throughout these financial statements has not been restated to reflect the requirements of the new standards, except for separately presenting impairment loss on trade receivables.
The effect of initially applying these standards is mainly attributed to an increase in impairment losses recognised on financial assets.
IFRS 15 Revenue from Contracts with CustomersIFRS 15 establishes a comprehensive framework for determining whether, how much and when revenue is recognised. It replaced IAS 18 Revenue, IAS 11 Construction Contracts and related interpretations. Under IFRS 15, revenue is recognised when a customer obtains control of the goods or service. Determining the timing of the transfer of control – at a point in time or over time – requires judgement.
IFRS 15 did not have a significant impact on the Company’s accounting policies with respect to its revenue streams. The Company has one performance obligation, which is the delivery of goods. The Company has elected to treat delivery as an integrated activity and not as a separate performance obligation. There are no changes to performance obligations under the new standard.
Due to the transition methods chosen by the Company in applying these standards, comparative information
Financial StatementsNotes to the financial statements (Continued)
2018 annual reports & financial statements Sustaining Growth with Purposeful Brands
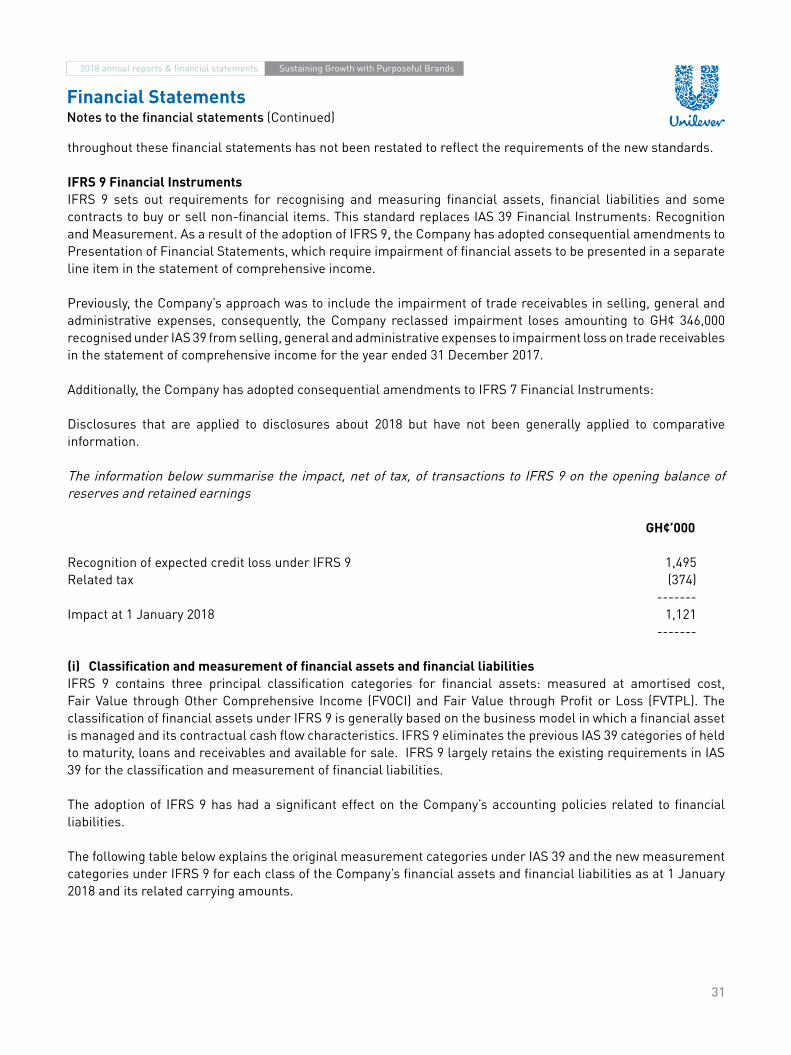
31
throughout these financial statements has not been restated to reflect the requirements of the new standards.
IFRS 9 Financial InstrumentsIFRS 9 sets out requirements for recognising and measuring financial assets, financial liabilities and some contracts to buy or sell non-financial items. This standard replaces IAS 39 Financial Instruments: Recognition and Measurement. As a result of the adoption of IFRS 9, the Company has adopted consequential amendments to Presentation of Financial Statements, which require impairment of financial assets to be presented in a separate line item in the statement of comprehensive income.
Previously, the Company’s approach was to include the impairment of trade receivables in selling, general and administrative expenses, consequently, the Company reclassed impairment loses amounting to GH¢ 346,000 recognised under IAS 39 from selling, general and administrative expenses to impairment loss on trade receivables in the statement of comprehensive income for the year ended 31 December 2017.
Additionally, the Company has adopted consequential amendments to IFRS 7 Financial Instruments:
Disclosures that are applied to disclosures about 2018 but have not been generally applied to comparative information.
The information below summarise the impact, net of tax, of transactions to IFRS 9 on the opening balance of reserves and retained earnings
GH¢’000
Recognition of expected credit loss under IFRS 9 1,495Related tax (374) -------Impact at 1 January 2018 1,121 -------
(i) Classification and measurement of financial assets and financial liabilitiesIFRS 9 contains three principal classification categories for financial assets: measured at amortised cost, Fair Value through Other Comprehensive Income (FVOCI) and Fair Value through Profit or Loss (FVTPL). The classification of financial assets under IFRS 9 is generally based on the business model in which a financial asset is managed and its contractual cash flow characteristics. IFRS 9 eliminates the previous IAS 39 categories of held to maturity, loans and receivables and available for sale. IFRS 9 largely retains the existing requirements in IAS 39 for the classification and measurement of financial liabilities.
The adoption of IFRS 9 has had a significant effect on the Company’s accounting policies related to financial liabilities.
The following table below explains the original measurement categories under IAS 39 and the new measurement categories under IFRS 9 for each class of the Company’s financial assets and financial liabilities as at 1 January 2018 and its related carrying amounts.
Financial StatementsNotes to the financial statements (Continued)
2018 annual reports & financial statements Sustaining Growth with Purposeful Brands

32
In GH¢’000 Original classification under IAS 39
New classification under IFRS 9
Original carrying amount
under IAS 39
New carrying amount under
IFRS 9Financial assetsTrade and other receivables (Note 24)
Loans and receiv-ables
Amortised cost 93,937 93,937
Related party receivable (Note 32c) Loans and receiv-ables
Amortised cost 125,259 125,259
Cash and cash equivalents (Note 28)
Loans and receiv-ables
Amortised cost 53,189 53,189
Total financial assets 272,385 272,385Financial liabilitiesTrade and other payables (Note 26) Other financial
liabilitiesOther financial liabilities
74,009 74,009
Related party payable (Note 32d) Other financial liabilities
Other financial liabilities
154,407 154,407
Dividend payable (Note 20) Other financial liabilities
Other financial liabilities
3,044 3,044
Total financial liabilities 231,460 231,460
The following table reconciles the carrying amounts of financial assets under IAS 39 to the carrying amounts under IFRS 9 on transition to IFRS 9 on 1 January 2018.
IAS 39 Remeasurement/ IFRS 9 Carrying amount reclassification carrying amountFinancial asset GH¢’000 GH¢’000 GH¢’000
Amortised costTrade and other receivables:Brought forward: Loans and receivable: 93,938 - 93,938Re-measurement (346) (1,495) (1,841) --------- --------- ---------Carried forward: amortised cost 93,592 (1,495) 92,097 --------- --------- ---------
(ii) Impairment of financial assetsIFRS 9 replaces the ‘incurred loss’ model in IAS 39 with an ‘expected credit loss’ (ECL) model. The new impairment model applies to financial assets measured at amortised cost, contract assets and debt investments at FVOCI, but not to investments in equity instruments.
Under IFRS 9, credit losses are recognised earlier than under IAS 39. For assets in the scope of the IFRS 9 impairment model, impairment losses are generally expected to increase and become more volatile.
The Company has determined that the application of IFRS 9’s impairment requirements at 1 January 2018 will
Financial StatementsNotes to the financial statements (Continued)
2018 annual reports & financial statements Sustaining Growth with Purposeful Brands

33
result in an additional allowance for impairment at said date and have hence passed an equity adjustment to reflect same as follows:
GH¢’000
Loss Allowance as at 31 December 2017 under IAS 39 346Additional Impairment recognised at 1 January 2018 1,495Loss Allowance as at 1 January 2018 1,841
(iii) TransitionChanges in accounting policies resulting from the adoption of IFRS 9 have been applied retrospectively, except as described below.
• The Company has used an exemption not to restate comparative information for prior periods with respect to classification and measurement (including impairment) requirements. Differences in the carrying amounts of financial assets and financial liabilities resulting from the adoption of IFRS 9 are recognised in retained earnings as at 1 January 2018. Accordingly, the information presented for 2017 does not generally reflect the requirements of IFRS 9, but rather those of IAS 39.
• The determination of the business model within which a financial asset is held have been made on the basis of the facts and circumstances that existed at the date of initial application.
4. SIGNIFICANT ACCOUNTING POLICIESThe principal accounting policies applied in the preparation of these financial statements are set out below. These policies have been consistently applied to all periods presented except if mentioned otherwise (see note 3).
a. Investment in subsidiariesInvestment in subsidiaries are stated at cost less impairment allowance.
b. Property, plant and equipment
(i) Recognition and measurementItems of property, plant and equipment are measured at cost less accumulated depreciation and any impairment losses. Cost includes expenditures that are directly attributable to the acquisition of the asset. When parts of an item of property, plant and equipment have different useful lives, they are accounted for as separate items (major components).
(ii) Subsequent costsThe cost of replacing part of an item of property, plant and equipment is recognised in the carrying amount of the item if it is probable that the future economic benefits embodied within the part will flow to the Company and its cost can be measured reliably. The costs of the day-to-day servicing of property, plant and equipment are recognised in profit or loss, as incurred. Spare parts, stand-by and servicing equipment held by the Company generally are classified as inventories. However, if major spare parts and stand-by equipment are expected to be used for more than one period or can be used only in connection with an item of property, plant and equipment, then they are classified as property, plant and equipment.
(iii) DepreciationDepreciation is recognised in profit or loss on a straight-line basis over the estimated useful lives of each class
Financial StatementsNotes to the financial statements (Continued)
2018 annual reports & financial statements Sustaining Growth with Purposeful Brands
34
of an item of property, plant and equipment. The estimated useful lives for the current and comparative periods are as follows:
Leasehold land & buildings - 40 yearsPlant and machinery - 14 yearsComputer equipment - 5 yearsFurniture and fittings - 4 yearsOffice equipment and others - 5 yearsMoulds & dies - 4 years
Depreciation methods, useful lives and residual values are reassessed at each reporting date. Gains and losses on derecognition of property, plant and equipment are determined by comparing proceeds from disposal with the carrying amounts of property, plant and equipment and are recognised in profit or loss.
(iv) Capital work in-progressProperty, plant and equipment under construction is stated at initial cost and depreciated from the date the asset is made available for use over its estimated useful life. Assets are transferred from capital work in progress to an appropriate category of property, plant and equipment when commissioned and ready for its intended use.
c. Intangible assets
SoftwareSoftware acquired is measured at cost less accumulated amortisation and accumulated impairment losses. Subsequent expenditure on software assets is capitalised only when it increases the future economic benefits embodied in the specific asset to which it relates. All other expenditure is expensed as incurred.
Amortisation is recognised in profit or loss on a straight line basis over the estimated useful life of the software from the date it is available for use. The estimated useful life for software is five years. Amortisation methods, useful lives and residual values are reviewed at each reporting date and adjusted if appropriate.
d. Leases
(i) Determining whether an arrangement contains a leaseAt inception of an arrangement, the Company determines whether the arrangement is or contains a lease. At inception or on reassessment of an arrangement that contains a lease, the Company separates payments and other consideration required by the arrangement into those for the lease and those for other elements on the basis of their relative fair values. If the Company concludes on a finance lease that it is impracticable to separate the payments reliably, then an asset and a liability are recognised at an amount equal to the fair value of the underlying asset; subsequently, the liability is reduced as payments are made and an imputed finance cost on the liability is recognised using the Company’s incremental borrowing rate.
(ii) Lease assets - LeaseeAssets held by the Company under leases that transfer to the Company substantially all of the risks and rewards of ownership are classified as finance leases. The leased asset is initially measured at an amount equal to the lower of its fair value and present value of the minimum lease payments.
Subsequent to initial recognition, the asset is accounted for in accordance with the accounting policy applicable to that asset. Assets held under other leases are classified as operating leases and are not recognised in the Company’s statement of financial position.
Financial StatementsNotes to the financial statements (Continued)
2018 annual reports & financial statements Sustaining Growth with Purposeful Brands

35
(iii) Lease paymentsPayments made under operating leases are recognised in profit or loss on a straight-line basis over the term of the lease. Lease incentives received are recognised as an integral part of the total lease expense, over the term of the lease.
e. InventoriesInventories are measured at the lower of cost and net realisable value using the weighted average cost principle. The cost of inventories includes expenditure incurred in acquiring inventories and bringing them to their existing location and condition. Net realisable value is the estimated selling price in the ordinary course of business, less estimated selling expenses.
The cost of inventories comprises all costs of purchase, costs of conversion and other costs incurred in bringing the inventories to their present location and condition. The costs of purchase of inventories comprise the purchase price, import duties and other taxes (other than those subsequently recoverable by the entity from the taxing authorities), transport, handling and other costs directly attributable to the acquisition of finished goods, materials and services.
f. Financial instruments
(i) Recognition and initial measurementTrade receivables and debt securities issued are initially recognised when they are originated. All other financial assets and financial liabilities are initially recognised when the Company becomes a party to the contractual provisions of the instrument.
A financial asset (unless it is a trade receivable without a significant financing component) or financial liability is initially measured at fair values plus, for an item not at FVTPL, transaction costs that are directly attributable to its acquisition or issue. A trade receivable without a significant financing component is initially measured at the transaction price.
(ii) Classification and subsequent measurement
(a) Financial assets - Policy applicable from 1 January 2018On initial recognition, a financial asset is classified as measured at: amortized cost; FVOCI – debt investment; FVOCI – equity investment; or FVTPL.
Financial assets are not reclassified subsequent to their initial recognition unless the Company changes its business model for managing financial assets, in which case all affected financial assets are reclassified on the first day of the first reporting period following the change in the business model.
A financial asset is measured at amortised cost if it meets both of the following conditions and is not designated as at FVTPL:• it is held within a business model whose objective is to hold assets to collect contractual cash flows; and
• its contractual terms give rise on specified dates to cash flows that are solely payments of principal and interest on the principal amount outstanding.
All financial assets not classified as measured at amortised cost or FVOCI are measured at FVTPL. On initial recognition, the Company may irrevocably designate a financial asset that otherwise meets the requirement to be
Financial StatementsNotes to the financial statements (Continued)
2018 annual reports & financial statements Sustaining Growth with Purposeful Brands

36
measured at amortised cost or at FVOCI as at FVTPL if doing so eliminates or significantly reduces an accounting mismatch that would otherwise arise.
(b) Financial assets - Business model assessment: Policy applicable from 1 January 2018The Company makes an assessment of the objective of the business model in which a financial asset is held at a portfolio level because this best reflects the way the business is managed, and information is provided to management. The information considered includes:
• the stated policies and objectives for the portfolio and the operation of those policies in practice. These include whether management’s strategy focuses on earning contractual interest income, maintaining a particular interest rate profile, matching the duration of the financial assets to the duration of any related liabilities or expected cash outflows or realising cash flows through the sale of the assets;
• how the performance of the portfolio is evaluated and reported to the Company’s management;
• the risks that affect the performance of the business model (and the financial assets held within that business model) and how those risks are managed;
• how managers of the business are compensated - e.g. whether compensation is based on the fair value of the
assets managed or the contractual cash flows collected; and
• the frequency, volume and timing of sales of financial assets in prior periods, the reasons for such sales and expectations about future sales activity.
Transfers of financial assets to third parties in transactions that do not qualify for derecognition are not considered sales for this purpose, consistent with the Company’s continuing recognition of the assets.
Financial assets that are held for trading or are managed and whose performance is evaluated on a fair value basis are measured at FVTPL.
(c) Financial assets-Assessment whether contractual cash flows are solely payments of principal and interest: policy applicable from 1 January 2018
For the purposes of this assessment, ‘principal’ is defined as the fair value of the financial asset on initial recognition. ‘Interest’ is defined as consideration for the time value of money and for the credit risk associated with the principal amount outstanding during a particular period of time and for other basic lending risks and costs {e.g. liquidity risk and administrative costs), as well as a profit margin.
In assessing whether the contractual cash flows are solely payments of principal and interest, the Company considers the contractual terms of the instrument. This includes assessing whether the financial asset contains a contractual term that could change the timing or amount of contractual cash flows such that it would not meet this condition. In making this assessment, the Company considers:
• contingent events that would change the amount or timing of cash flows;• terms that may adjust the contractual coupon rate, including variable-rate features;• prepayment and extension features; and• terms that limit the Company’s claim to cash flows from specified assets (e.g. non-recourse features).
Financial StatementsNotes to the financial statements (Continued)
2018 annual reports & financial statements Sustaining Growth with Purposeful Brands
37
A prepayment feature is consistent with the sole payments of principal and interest criterion if the prepayment amount substantially represents unpaid amounts of principal and interest on the principal amount outstanding, which may include reasonable additional compensation for early termination of the contract.
Additionally, for a financial asset acquired at a discount or premium to its contractual par amount, a feature that permits or requires prepayment at an amount that substantially represents the contractual par amount plus accrued (but unpaid) contractual interest (which may also include reasonable additional compensation for early termination) is treated as consistent with this criterion if the fair value of the prepayment feature is insignificant at initial recognition.
(d) Financial assets - Subsequent measurement and gains and losses: Policy applicable from 1 January 2018
Financial assets at amortised costThese assets are subsequently measured at amortised cost using the effective interest method. The amortised cost is reduced by impairment losses. Interest income, foreign exchange gains and losses and impairment are recognised in profit or loss. Any gain or loss on derecognition is recognised in profit or loss.
(e) Financial assets - Policy applicable before 1 January 2018The Company classified its financial assets into the loans and receivables category - loans and receivables; Financial assets - Subsequent measurement and gains and losses: Policy applicable before 1 January 2018
Loans and receivables were measured at amortised cost using the effective interest method.
(f) Financial liabilities - Classification, subsequent measurement and gains and lossesFinancial liabilities are classified as measured at amortised cost. Other financial liabilities are subsequently measured at amortised cost using the effective interest method. Interest expense and foreign exchange gains and losses are recognised in profit or loss. Any gain or loss on derecognition is also recognised in profit or loss.
(iii) Derecognition
(a) Financial assetsThe Company derecognises a financial asset when the contractual rights to the cash flows from the financial asset expire, or it transfers the rights to receive the contractual cash flows in a transaction in which substantially all of the risks and rewards of ownership of the financial asset are transferred or in which the Company neither transfers nor retains substantially all of the risks and rewards of ownership and it does not retain control of the financial asset.
The Company enters into transactions whereby it transfers assets recognised in its statement of financial position but retains either all or substantially all of the risks and rewards of the transferred assets. In these cases, the transferred assets are not derecognised.
(b) Financial liabilitiesThe Company derecognises a financial liability when its contractual obligations are discharged or cancelled or expire. The Company also derecognises a financial liability when its terms are modified, and the cash flows of the modified liability are substantially different, in which case a new financial liability based on the modified terms is recognised at fair value.
On derecognition of a financial liability, the difference between the carrying amount extinguished and the
Financial StatementsNotes to the financial statements (Continued)
2018 annual reports & financial statements Sustaining Growth with Purposeful Brands

38
consideration paid (including any non-cash assets transferred or liabilities assumed) is recognised in profit or loss.
(c) Impairment
(i) Non-derivative financial assets
Policy applicable from 1 January 2018
Financial instruments and contract assetsThe Company recognises loss allowances for Expected Credit Losses (ECLs) on financial assets measured at amortised cost.
The Company measures loss allowances at an amount equal to lifetime ECLs, except for bank balances for which credit risk (i.e. the risk of default occurring over the expected life of the financial instrument) has not increased significantly since initial recognition are measured at 12 month ECLs.
Loss allowances for trade receivables are always measured at an amount equal to lifetime ECLs.
When determining whether the credit risk of a financial asset has increased significantly since initial recognition and when estimating ECLs, the Company considers reasonable and supportable information that is relevant and available without undue cost or effort. This includes both quantitative and qualitative information and analysis, based on the Company’s historical experience and informed credit assessment and including forward-looking information.
The Company assumes that the credit risk on a financial asset has increased significantly if it is more than 30 days past due.
The Company considers a financial asset to be in default when:
• the debtor is unlikely to pay its credit obligations to the Company in full due to bankruptcy• there are adverse changes in the payment status of debtors
Lifetime ECLs are the ECLs that result from all possible default events over the expected life of a financial instrument.
12 month ECLs are the portion of ECLs that result from default events that are possible within the 12 months after the reporting date (or a shorter period if the expected life of the instrument is less than 12 months).
The maximum period considered when estimating ECLs is the maximum contractual period over which the Company is exposed to credit risk.
Measurement of ECLsECLs are a probability-weighted estimate of credit losses. Credit losses are measured as the present value of all cash shortfalls (i.e. the difference between the cash flows due to the entity in accordance with the contract and the cash flows that the Company expects to receive).
ECLs are discounted at the effective interest rate of the financial asset.
Financial StatementsNotes to the financial statements (Continued)
2018 annual reports & financial statements Sustaining Growth with Purposeful Brands

39
Credit-impaired financial assetsAt each reporting date, the Company assesses whether financial assets carried at amortised cost are credit-impaired. A financial asset is ‘credit-impaired’ when one or more events that have a detrimental impact on the estimated future cash flows of the financial asset have occurred.
Evidence that a financial asset is credit-impaired includes the following observable data:• significant financial difficulty of the borrower or issuer;• a breach of contract such as a default • the restructuring of a loan or advance by the Company on terms that the Company would not consider otherwise;• it is probable that the borrower will enter bankruptcy or other financial reorganisation; or
Presentation of allowance for ECL in the statement of financial positionLoss allowances for financial assets measured at amortised cost are deducted from the gross carrying amount of the assets.
Write-offThe gross carrying amount of a financial asset is written off when the Company has no reasonable expectations of recovering a financial asset in its entirety or a portion thereof. The Company individually makes an assessment with respect to the timing and amount of write-off based on whether there is a reasonable expectation of recovery. The Company expects no significant recovery from the amount written off. However, financial assets that are written off could still be subject to enforcement activities in order to comply with the Company’s procedures for recovery of amounts due.
Policy applicable before 1 January 2018
Non-derivative financial assetsFinancial assets not classified as at fair value through profit or loss, are assessed at each reporting date to determine whether there is objective evidence of impairment. Objective evidence that financial assets are impaired includes default or delinquency by a debtor, restructuring of an amount due to the Company on terms that the Company would not consider otherwise and indications that a debtor will enter bankruptcy.
An impairment loss in respect of a financial asset measured at amortised cost is calculated as the difference between it carrying amount, and the present value of the estimated future cash flows discounted at the asset’s original effective interest rate. Losses are recognised in profit or loss and reflected in an allowance account against loans and receivables. Interest on the impaired asset continues to be recognised. When an event occurring after the impairment was recognised causes the amount of impairment loss to decrease, the decrease in impairment loss is reversed through profit and loss. When the Company considers that there are no realistic prospects of recovery of the asset, the relevant amounts are written off
The Company considers evidence of impairment for these assets at both individual and collective level. All individually significant financial assets are tested for impairment on an individual basis. Those found not to be impaired are then collectively assessed for any impairment that has been incurred but not yet individually identified. Assets that are not individually significant are collectively assessed for impairment. Collective assessment is carried out by grouping together assets with similar risk characteristics.
In assessing collective impairment, the Company uses historical information on the timing of recoveries and the amount of loss incurred and makes an adjustment if current economic and credit conditions are such that the
Financial StatementsNotes to the financial statements (Continued)
2018 annual reports & financial statements Sustaining Growth with Purposeful Brands

40
actual losses are likely to be greater or lesser than suggested by historical trends.
(ii) Non-financial assetsThe carrying amounts of the Company’s non-financial assets other than inventories and deferred tax assets are reviewed at each reporting date to determine whether there is any indication of impairment. If any such indication exists, then the asset’s recoverable amount is estimated.
For impairment testing, assets are grouped together into the smallest group of assets that generate cash inflows from continuing use that are largely independent of the cash inflows of other assets.
The recoverable amount of the asset is the greater of its value in use and its fair value less cost to sell. Value in use is based on the estimated future cash flows, discounted to their present value using a pre-tax discount rate that reflects current market assessments of the time value of money and risks specific to the asset.An impairment loss is recognised if the carrying amount of the asset exceeds its recoverable amount.
All impairment losses are recognised in profit or loss. Impairment loss is reversed only to the extent that the asset’s carrying amount does not exceed the carrying amount that would have been determined, net of depreciation or amortisation, if no impairment loss had been recognised.
(iii) Offsetting Financial assets and financial liabilities are offset and the net amount presented in the statement of financial position when, and only when, the Company has a legally enforceable right to set off the amounts and it intends either to settle them on a net basis or to realise the asset and settle the liability simultaneously.
Other financial liabilities comprise trade and other payables, related party payables, bank overdraft and dividend payables.
(iv) Share capital
Ordinary Shares
Proceeds from issue of ordinary shares are classified as equity. Incremental costs directly attributable to the issue of ordinary shares, net of any tax effects are recognised as a deduction from equity.
g. Income taxIncome tax expenses comprises current and deferred tax. It is recognised in profit or loss except to the extent that it relates to a business combination, or items recognised directly in equity or in OCI.
(i) Current taxCurrent tax comprises the expected tax payable or receivable on the taxable income or loss for the year and any adjustment to the tax payable or receivable in respect of previous years. The amount of current tax payable or receivable is the best estimate of the tax amount expected to be paid or received that reflects uncertainty related to income taxes, if any. It is measured using tax rates enacted or substantively enacted at the reporting date. Current tax also includes any tax arising from dividend.
Financial StatementsNotes to the financial statements (Continued)
2018 annual reports & financial statements Sustaining Growth with Purposeful Brands


41
Current tax assets and liabilities
Current tax assets and liabilities are offset only if the Company:a. has a legally enforceable right to set off the recognised amounts; andb. intends either to settle on a net basis, or to realise the asset and settle the liability simultaneously.
(ii) Deferred taxDeferred tax is recognised in respect of temporary differences between the carrying amounts of the assets and liabilities for financial reporting purposes and the amounts used for taxation purpose. Deferred tax is not recognised for temporary differences on the initial recognition of assets or liabilities in a transaction that is not a business combination and that affects neither accounting nor taxable profit or loss.
Deferred tax assets are recognised for unused tax losses, unused tax credits and deductible temporary differences to the extent that it is probable that future taxable profits will be available against which they can be used. Future taxable profits are determined based on business plans and the reversal of temporary differences. Deferred tax assets are reviewed at each reporting date and are reduced to the extent that it is no longer probable that future taxable profits will be available against which they can be used.
Unrecognised deferred tax assets are reassessed at each reporting date and recognised to the extent that it has become probable that future taxable profits will be available against which they can be used.
Deferred tax is measured at the tax rates that are expected to be applied to temporary differences, differences when they reverse, using tax rates enacted or substantially enacted at the reporting date.
Deferred tax assets and liabilities are offset only if:
a. the Company has a legally enforceable right to set off current tax asset against current tax liabilities; and b. the deferred tax assets and the deferred tax liabilities relate to income taxes levied by the same taxation authority on either; • the same taxable entity; or • different taxable entities which intend either to settle current tax liabilities and assets on a net basis, or to realise the assets and settle the liabilities simultaneously, in each future period in which significant amounts of deferred tax liabilities or assets are expected to be settled or recovered.
h. ProvisionProvisions for environmental restoration, restructuring costs and legal claims are recognised when the Company has a present legal or constructive obligation as a result of past events; it is probable that an outflow of resources will be required to settle the obligation; and the amount has been reliably estimated. Restructuring provisions comprise lease termination penalties and employee termination payments. Provisions are not recognised for future operating losses. Where there are a number of similar obligations, the likelihood that an outflow will be required in settlement is determined by considering the class of obligations as a whole.
A provision is recognised even if the likelihood of an outflow with respect to any one item included in the same class of obligations may be small. Provisions are measured at the present value of the expenditure expected to be required to settle the obligation using a pre-tax rate that reflects current market assessments of the time value of money and the risks specific to the obligation. The increase in the provision due to passage of time is recognised as interest expense in the profit or loss.
Financial StatementsNotes to the financial statements (Continued)
2018 annual reports & financial statements Sustaining Growth with Purposeful Brands
42
i. Employee benefitsThe Company operates various pension schemes. Some of the schemes are generally funded through payments to trustee-administered funds, determined by periodic actuarial calculations. The Company has both defined benefit and defined contribution plans.
(i) Short term benefitsShort-term employee benefit obligations are measured on an undiscounted basis and are expensed as the related service is provided. A provision is recognised for the amount expected to be paid under short-term cash bonus or profit-sharing incentive scheme if the Company has a present legal or constructive obligation to pay this amount as a result of past service provided by the employee and the obligation can be estimated reliably.
(ii) Defined Contribution planA defined contribution plan is a post-employment benefit plan under which an entity pays fixed contributions into a separate entity and will have no legal or constructive obligation to pay further contributions if the fund does not hold sufficient assets to pay all employee benefits relating to employee service in the current and prior periods. Obligations for contributions to defined contribution schemes are recognised as an expense in profit or loss in periods during which services are rendered by employees.
a. Social Security ContributionUnder a national pension scheme, the Company contributes 13% of employee’s basic salary to the Social Security and National Insurance Trust (SSNIT) for employee pensions. The Company’s obligation is limited to the relevant contributions, which have been recognised in the financial statements. The pension liabilities and obligations, however, rest with SSNIT.
b. Tier 3 Pension fund and saving schemeThe Company have a Tier 3 Pension fund and Saving Scheme for staff and management under which the Company contribute 5% and 2.5% respectively to the scheme.
(iii) Defined benefit planThe Company’s net obligation in respect of defined benefit plans is calculated separately for each plan by estimating the amount of the future benefit that employees have earned in the current and prior periods, discounting that amount and deducting the fair value of any plan assets.
The calculation of defined benefit obligation is performed annually by a qualified actuary using the projected unit credit method. When the calculation results in a potential asset for the Company, the recognised asset is limited to the present value of the economic benefit available in the form of any future refunds from the plan or reductions in future contributions to the plan. To calculate the present value of future economic benefit, consideration is given to any applicable minimum funding requirements.
Re-measurement of the net defined benefit liability which comprise actuarial gains and losses, the return on plan assets (excluding interest) and the effect of asset ceiling (if any, excluding interest), are recognised immediately in other comprehensive income. The Company determines the net interest expense (Income on the net defined benefit liability (asset) for the period by applying the discount rate used to measure the defined benefit obligation at the beginning of the annual period to the then-net defined benefit liability (asset), taking into account any changes in the net defined liability (asset) during the period as a result of contribution and benefit payment. Net interest expense and other expenses relating to defined benefit plans are recognised in profit or loss. When the benefits of a plan are changed or when a plan is curtailed, the resulting change in benefits that relates to the past service or the gain or loss on curtailment is recognised immediately in profit or loss. The Company recognises
Financial StatementsNotes to the financial statements (Continued)
2018 annual reports & financial statements Sustaining Growth with Purposeful Brands

43
gains and losses on the settlement of a defined benefit plan when the settlement occurs.
(iv) TerminationTermination benefits are payable when employment is terminated by the Company before the normal retirement date, or whenever an employee accepts voluntary redundancy in exchange for these benefits. Termination benefits are expensed at the earlier of when the Company can no longer withdraw the offer of those benefits and when the Company recognised cost for restructuring. In the case of an offer made to encourage voluntary redundancy, the termination benefits are measured based on the number of employees expected to accept the offer. Benefits falling due more than 12 months after the end of the reporting period are discounted to their present value.
(v) Other long term benefitLong Service Award accrue to employees based on graduated periods of uninterrupted and dedicated service to the Company. Staff who serve for ten years and above are awarded with cash donations, bundles of aluminium roofing sheets and testimonial. The plan is not funded and the awards accrue over the service life of employees.
(j) Revenue from contracts with customers
(i) Sale of goodsThe Company generates revenue primarily from the sale of its products from foods, home care and personal care. Refer to note (35) segmental information.
Revenue recognition under IFRS 15 (applicable from 1 January 2018)Revenue is measured based on the consideration specified in a contract with a customer. The Company recognises revenue when it transfers control over a good or service to a customer.
Customers obtain control of goods when they are delivered to the customer. Goods are considered delivered once the customer acknowledges receipt of the promised goods. Invoices are generated at that point in time. Most sales are on cash basis and credit sales are usually payable within 30 days. The Company may allow some customers to return items at their own discretion. Returned goods are exchanged for new goods or cash.
Revenue recognition under IAS 18 (applicable before 1 January 2018)
Revenue recognitionRevenue from the sale of goods is measured at the fair value of consideration received or receivable, net of returns, trade discounts, taxes and volume rebates. Revenue is recognised when significant risks and rewards of ownership have been transferred to the buyer, there is no continuing management involvement in the goods, recovery of the consideration is probable, associated costs and possible return of goods can be estimated reliably and the amount of revenue can be measured reliably. Transfer of risks and rewards occurs when the goods are delivered to the customer.
(ii) Sale of goods to key distributors and modern tradeThe Company manufactures and sells a range of fast moving consumer goods to its key distributors and modern trades. Sale of the goods are recognised when the Company has delivered products to the key distributor and modern trades.
Delivery does not occur until the products have been shipped to the specified location, the risk of obsolescence and loss have been transferred to the distributor and either the distributor has accepted the products in accordance with the sales contract, the acceptance provisions have lapsed or the Company has objective evidence that all
Financial StatementsNotes to the financial statements (Continued)
2018 annual reports & financial statements Sustaining Growth with Purposeful Brands

44
criteria for acceptance have been satisfied.
(k) Finance income and finance costsFinance income comprises interest income on funds invested or held in bank accounts. Interest income is recognised in profit or loss using the effective interest method.
Finance costs comprise interest expense on borrowings. Borrowing costs that are not directly attributable to the acquisition, construction or production of a qualifying asset are recognised in profit or loss using the effective interest method.
(l) Foreign currency translation
Transactions and balancesForeign currency transactions are translated into the functional currency using the exchange rates prevailing at the dates of the transactions or valuation where items are re-measured. Foreign exchange gains and losses resulting from the settlement of such transactions and from the translation at year-end exchange rates of monetary assets and liabilities denominated in foreign currencies are recognised in profit or loss. Foreign exchange gains and losses are presented in the profit or loss within other income or other expenses.
Monetary assets and liabilities denominated in foreign currencies at the reporting date are translated to functional currency at exchange rate prevailing at that date. Non-monetary items that are measured at historical cost in a foreign currency are translated using the spot exchange rate at the date of the transaction.
(m) DividendDividend is recognised as a liability in the period in which they are declared by the Board.
(n) Segmental reportingOperating segments are reported in a manner consistent with the internal reporting provided to the Chief Operating Decision-Maker (CODM). The CODM, who is responsible for allocating resources and assessing performance of the operating segments, has been identified as the Board of Directors. The operating segments report are based on product category which is classified as home care products, personal care products and foods products, because they require different technology and marketing strategies.
(p) Earnings per shareThe Company presents basic and diluted earnings per share (EPS) data for its ordinary shares. Basic EPS is calculated by dividing the profit or loss attributable to ordinary shareholders of the Company by the weighted average number of ordinary shares outstanding during the period. Diluted EPS is determined by adjusting the profit or loss attributable to ordinary shareholders and the weighted average number of ordinary shares outstanding for the effects of all dilutive potential ordinary shares.
This excludes ordinary shares purchased by the Company and held as treasury shares. 2018 2017 GH¢’000 GH¢’000
Profit attributable to equity holders 190,825 48,149Weighted average number of ordinary shares in issue (Note 21) 62,500 62,500
Basic earnings per share 3.0532 0.7704Diluted earnings per share 3.0532 0.7704
Financial StatementsNotes to the financial statements (Continued)
2018 annual reports & financial statements Sustaining Growth with Purposeful Brands

45
At the reporting date, the basic earnings per share and the diluted earnings per share were the same because there were no outstanding shares on conversion which could increase the weighted average number of ordinary shares in issue.
4. NEW STANDARDS AND INTERPRETATIONS ISSUED BUT NOT EFFECTIVEA number of new standards, amendments to standards and interpretations are effective for annual periods beginning after 1 January 2019 and earlier application is permitted; however, the Company has not early adopted them in preparing the financial statements. The Company does not plan to adopt these standards early.
Of those standards that are not yet effective, IFRS 16 is expected to have a significant impact on the Company’s financial statements in the period of initial application.
Standard Name Issue Date Effective DateIFRS 16 Leases 13 January 2016 1 January 2019IFRIC 23 Uncertainty over Income Tax treatment 7 June 2017 1 January 2019
IFRS 16 LeasesIFRS 16 was published in January 2016. It sets out the principles for the recognition, measurement, presentation and disclosure of leases for both parties to a contract, that is the customer (‘lessee’) and the supplier (‘lessor’).
IFRS 16 replaces the previous leases standard, IAS 17 Leases and related interpretations. IFRS 16 has one model for lessees, which will result in almost all leases being included on the Statement of Financial position. No significant changes have been included for lessors. The standard is effective for annual periods beginning on or after 1 January 2019, with early adoption permitted only if the entity also adopts IFRS 15. The transitional requirements are different for lessees and lessors.
IFRIC 23 Uncertainty over Income Tax treatmentsIFRIC 23 clarifies the accounting for income tax treatments that have yet to be accepted by tax authorities. Specifically, IFRIC 23 provides clarity on how to incorporate this uncertainty into the measurement of tax as reported in the financial statements.
IFRIC 23 does not introduce any new disclosures but reinforces the need to comply with existing disclosure requirements about:• judgments made; • assumptions and other estimates used; and • the potential impact of uncertainties that are not reflected.
IFRIC 23 applies for annual periods beginning on or after 1 January 2019. Earlier adoption is permitted.
Financial StatementsNotes to the financial statements (Continued)
2018 annual reports & financial statements Sustaining Growth with Purposeful Brands

46
5. REVENUERevenue is recognised when the Company transfers control over a good to a customer. Revenue comprises the value of goods and services invoiced less VAT, discounts and rebates.
2018 2017 GH¢’000 GH¢’000
Gross sales value 832,443 754,764Value added tax/NHIL (121,969) (105,573)Discounts and rebates (78,322) (73,426) --------- ----------Revenue 632,152 575,765 ======= =======By customer:Third parties 617,037 542,925Related parties (Notes 32b) 15,115 32,840 -------- ---------- 632,152 575,765 ======= ========
6. PROFIT BEFORE TAX 2018 2017 GH¢’000 GH¢’000is stated after charging:
Staff cost (Note 13a, b) 42,158 34,891Depreciation 9,526 8,333Auditors’ remuneration 387 397Directors’ remuneration 3,842 3,933 ====== =====
7. COST OF SALESCost of goods sold comprises raw materials, conversion costs and materials sourcing expenses.
2018 2017 GH¢’000 GH¢’000
Raw materials & conversion costs 385,041 349,574Supply Support 5,528 3,428Foreign exchange losses 4,238 6,281Trade mark & knowhow fees 19,084 15,646Depreciation (Note 15a&b) 8,286 7,440Amortisation of intangible assets (Note 16) 6 1,012Material sourcing expenses 515 1,610Staff costs (Note 13a) 17,886 16,623Operating lease expense 407 98 -------- ---------- 440,991 401,712 ======= =======
Included in raw materials & conversion costs are damaged and obsolete inventories amounting to GH¢2,075,937 (2017: GH¢1,561,469).
Financial StatementsNotes to the financial statements (Continued)
2018 annual reports & financial statements Sustaining Growth with Purposeful Brands
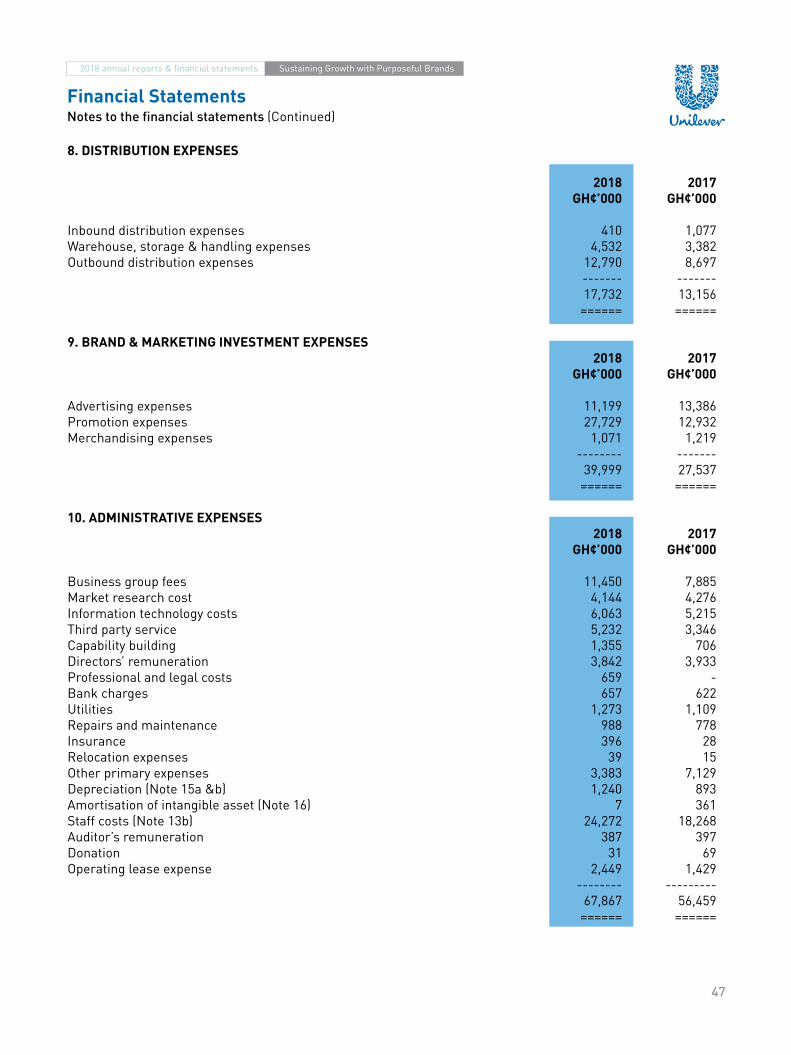
47
8. DISTRIBUTION EXPENSES
2018 2017 GH¢’000 GH¢’000
Inbound distribution expenses 410 1,077Warehouse, storage & handling expenses 4,532 3,382Outbound distribution expenses 12,790 8,697 ------- ------- 17,732 13,156 ====== ======
9. BRAND & MARKETING INVESTMENT EXPENSES 2018 2017 GH¢’000 GH¢’000
Advertising expenses 11,199 13,386Promotion expenses 27,729 12,932Merchandising expenses 1,071 1,219 -------- ------- 39,999 27,537 ====== ======
10. ADMINISTRATIVE EXPENSES 2018 2017 GH¢’000 GH¢’000
Business group fees 11,450 7,885Market research cost 4,144 4,276Information technology costs 6,063 5,215Third party service 5,232 3,346Capability building 1,355 706Directors’ remuneration 3,842 3,933Professional and legal costs 659 -Bank charges 657 622Utilities 1,273 1,109Repairs and maintenance 988 778Insurance 396 28Relocation expenses 39 15Other primary expenses 3,383 7,129Depreciation (Note 15a &b) 1,240 893Amortisation of intangible asset (Note 16) 7 361Staff costs (Note 13b) 24,272 18,268Auditor’s remuneration 387 397Donation 31 69Operating lease expense 2,449 1,429 -------- --------- 67,867 56,459 ====== ======
Financial StatementsNotes to the financial statements (Continued)
2018 annual reports & financial statements Sustaining Growth with Purposeful Brands

48
11a. OTHER INCOME 2018 2017 GH¢’000 GH¢’000
Management fees 4,464 1,012Sale of scrap 311 137Provision for professional and legal fees - 60Exchange gain 3,022 -Provision no longer required* 111,047 - --------- ------- 118,844 1,209 ======= =====
* This represents the reversal of provision for management and technical service fees for the period covering 2009 to October 2017 for which GIPC approval was not granted.
11b. Gain on disposal of spread business
2018 2017 GH¢’000 GH¢’000
89,046 - ====== ====
This represents the gain on the disposal of the Company’s Spreads (Blue Band margarine) and all assets attached.
12. FINANCE INCOME AND COST
2018 2017 GH¢’000 GH¢’000
Interest on deposits and call 440 160 === ===
Interest on bank overdrafts (3,376) (2,004) ====== ======
13. STAFF COSTSStaff costs are charged to cost of sales and administrative expenses as below. The average number of employees at the end of the year was 348 (2017: 373).
a. Cost of sales 2018 2017 GH¢’000 GH¢’000
Wages & salaries to employees 16,254 15,112Defined contribution scheme 599 529Social security 1,033 982 -------- -------- 17,886 16,623 ====== ======
Financial StatementsNotes to the financial statements (Continued)
2018 annual reports & financial statements Sustaining Growth with Purposeful Brands

49
b. Administrative expenses 2018 2017 GH¢’000 GH¢’000
Wages & salaries to employees 20,890 15,120Defined contribution scheme 754 572Defined benefit scheme (Note 17b) 1,513 1,472Actuarial gain on long service award (Note 17b) (557) (281)Social security 1,306 995Interest on staff loans 366 390 -------- -------- 24,272 18,268 ====== ======14(a) Income tax expense 2018 2017 GH¢’000 GH¢’000
Current tax 59,080 14,923Deferred tax 417 2,288 -------- -------- 59,497 17,211 ====== ======(b) Current tax (asset)/liability Charge Payment/WHT Balance to profit credit during Balance at 1 January or loss the year at 31Dec. GH¢’000 GH¢’000 GH¢’000 GH¢’000
Prior to 2013 (3,336) - - (3,336) 2013-2015 1,800 - - 1,800 2016 - - - - 2017 1,424 - (1,414) 10 2018 - 59,080 (30,942) 28,138 ----- --------- --------- -------- Current tax (112) 59,080 (32,356) 26,612 ==== ====== ======= ====== The above tax position is subject to agreement with the tax authorities.
(c) Deferred tax2018
Net balance Recognised Recognised Tax on transition Deferred Deferred at 1 January in profit in OCI adjustment NET tax asset tax liability GH¢’000 GH¢’000 GH¢’000 GH¢’000 GH¢’000 GH¢’000
Property, plant and equipment 8,529 8,345 - - 16,874 - 16,874Provisions (1,088) (5,523) - (374) (6,985) (6,985) -Derecognition of previously recognised deductible temporary differences 662 (662) - - - - -Revaluation of assets 60 (60 - - - - -Employee benefits (458) 458 - - - - -Employee benefits 939 (2,141) 155 - (1,047) (1,047) - ------ ------- ----- ------- -------- -------- --------Deferred tax liability 8,644 417 155 (374) 8,842 (8,032) 16,874 ===== === === ==== ===== ====== ======
Financial StatementsNotes to the financial statements (Continued)
2018 annual reports & financial statements Sustaining Growth with Purposeful Brands

50
2017 Net balance Recognised Recognised Tax on transition Deferred Deferred at 1 January in profit in OCI adjustment NET tax asset tax liability GH¢’000 GH¢’000 GH¢’000 GH¢’000 GH¢’000 GH¢’000
Property, plant and equipment 6,973 1,556 - - 8,529 - 8,529Provisions (1,088) - - - (1,088) (1,088) -Derecognition of previously recognised deductible temporary differences - 662 - - 662 662 -Revaluation of assets 60 - - - 60 - 60Employee benefits (458) - - - (458) (458) -Employee benefits 873 70 (4) - 939 - 939 ------- ------- ----- ------- ------- ------- -------Deferred tax liability 6,360 2,288 (4) - 8,644 (884) 9,528 ===== ===== === ==== ===== ==== =====
d. Tax reconciliationThe tax charged on the profit before income tax differs from the theoretical amount that would arise using the statutory income tax rate. This is explained as follows:
2018 2017 GH¢’000 GH¢’000
Profit before taxation 250,322 65,360 ====== =====
Tax calculated at the statutory income tax rate of 25% 62,581 16,340Tax effect of:Disallowable expenses 21,860 4,780Exempt income (24,658) (3,978)Tax incentive (703) (593)Derecognition of previously recognised deductible temporary differences 417 662 --------- --------Income tax expense 59,497 17,211 ====== ======
Effective tax rate 24% 26% ==== ====
Financial StatementsNotes to the financial statements (Continued)
2018 annual reports & financial statements Sustaining Growth with Purposeful Brands

51
15(a) PROPERTY, PLANT AND EQUIPMENT
Leasehold Office Capital Land & Plant & Computer Furniture equipment Moulds work in- buildings machinery equipment & fittings & others & die progress Total GH¢’000 GH¢’000 GH¢’000 GH¢’000 GH¢’000 GH¢’000 GH¢’000 GH¢’000 Cost At 1/1/18 25,693 77,479 3,128 3,476 8,602 3,815 30,626 152,819 Additions 12,239 - - 313 - - 48,362 60,914 Capitalisation/transfers 1,429 29,176 429 - 1,247 1,088 (33,369) - Write-offs during the year (2,459) (28,262) (5) (2,888) (1,232) (4,625) - (39,471) -------- --------- ------- ------- -------- ------- --------- --------- At 31/12/18 36,902 78,393 3,552 901 8,617 278 45,619 174,262 ====== ====== ===== === ==== ==== ====== ======= Accumulated depreciation At 1/1/18 2,893 22,913 1,798 2,105 5,764 3,608 - 39,081 Charge for the year 881 6,149 607 4 1,663 222 - 9,526 Write-offs during the year (398) (11,136) (5) (1,232) (2,194) (3,574) - (18,539) ------- --------- ------- ------- ------- ------- ------- -------- At 31/12/18 3,376 17,926 2,400 877 5,233 256 - 30,068 ===== ====== ===== === ==== === ==== ====== Carrying amount 31/12/18 33,526 60,467 1,152 24 3,384 22 45,619 144,194 ====== ====== ==== === ==== === ====== ======
Leasehold Office Capital Land & Plant & Computer Furniture equipment Moulds work in- buildings machinery equipment & fittings & others & die progress Total GH¢’000 GH¢’000 GH¢’000 GH¢’000 GH¢’000 GH¢’000 GH¢’000 GH¢’000 Cost At 1/1/17 21,077 59,156 2,916 3,476 5,483 3,815 35,891 131,814 Additions 555 4,029 212 - 1,112 - 15,097 21,005 Capitalisation/transfers 4,061 14,294 - - 2,007 - (20,362) - -------- --------- ------- ------- -------- ------- --------- --------- At 31/12/17 25,693 77,479 3,128 3,476 8,602 3,815 30,626 152,819 ===== ===== ==== ==== ===== ===== ====== ====== Accumulated depreciation At 1/1/17 2,303 17,975 1,187 1,972 4,264 3,047 - 30,748 Charge for the year 590 4,938 611 133 1,500 561 - 8,333 ------- --------- ------- ------- ------- ------- ------- -------- At 31/12/17 2,893 22,913 1,798 2,105 5,764 3,608 - 39,081 ===== ====== ==== ===== ===== ===== ==== ======
Carrying amount 31/12/17 22,800 54,566 1,330 1,371 2,838 207 30,626 113,738 ====== ====== ==== ==== ===== ==== ====== ======
Depreciation has been charged to the statement of comprehensive income as follows:
2018 2017 GH¢’000 GH¢’000
Cost of sales (Note 7) 8,286 7,440Administrative expenses (Note 10) 1,240 893 ------- ------- 9,526 8,333 ===== =====
There was no charge on the property, plant and equipment of the Company at the reporting date.
Financial StatementsNotes to the financial statements (Continued)
2018 annual reports & financial statements Sustaining Growth with Purposeful Brands

52
Financial StatementsNotes to the financial statements (Continued)
b. Assets written off Leasehold Office Land & Plant & Computer Furniture equipment building machinery equipment & fittings & others Total GH¢’000 GH¢’000 GH¢’000 GH¢’000 GH¢’000 GH¢’000
Gross book value 2,459 28,262 5 2,888 5,858 39,472 Accumulated depreciation (398) (11,136) (5) (1,232) (5,768) (18,539) ------- --------- ------ ------- ------ --------- Carrying amount 2,061 17,126 - 1,656 90 20,933 ===== ====== === ===== === ======
16. INTANGIBLE ASSETS 2018 2017 GH¢’000 GH¢’000CostBalance at 1 January 12,138 12,138 -------- --------Balance at 31 December 12,138 12,138 -------- --------Accumulated amortisationBalance at 1 January 12,131 10,759Charge for the year 7 1,372 -------- --------Balance at 31 December 12,138 12,131 -------- --------
Carry amount at 31 December - 7 ==== ==
Intangible assets represent software that are used in managing employee information and processing of the Company’s business transactions.
Amortisation has been charged to profit or loss as follows: 2018 2017 GH¢’000 GH¢’000
Cost of sales (Note 7) 7 1,012Administrative expenses (Note 10) - 360 ---- ------- 7 1,372 === =====17. POST EMPLOYMENT BENEFITSThe Company has a defined benefit scheme comprising the following post-employment benefit plans:
(i) Ex-gratia pensionsEx-gratia pensions is an unfunded scheme to retired employees of UAC (Africa) Ghana Limited. These unfunded pensions were granted to bring the total pension (including Social Security) received by retired members from UAC (Africa) Pension Fund to an agreed percentage. For current members of the Managers’ Pension Scheme, this practice is not applicable.
2018 annual reports & financial statements Sustaining Growth with Purposeful Brands


53
(ii) Other Long term Benefits Long Service award which is an unfunded scheme to reward staff for their continuous and dedicated service to the Company. Staff who serve for ten years and above are awarded with cash donations, bundles of aluminium roofing sheets and testimonials. The plan is not funded. The awards vary depending on the number of years served by employees who meet the criteria.
For the above schemes, a full and independent actuarial valuation was carried out at the end of the year using the Projected Unit Credit Method in accordance with IAS 19 revised.
a. AssumptionsThe major assumptions used by the actuaries for the two major schemes are as follows:
2018 2017
Discount rate 21.5% 17.0%Salary inflation 16.0% 16.0%Pension inflation 9.5% 12.5%
Financial StatementsNotes to the financial statements (Continued)
2018 annual reports & financial statements Sustaining Growth with Purposeful Brands

54
Financial StatementsNotes to the financial statements (Continued)
b. Post-employment benefits 2018 2017 Long Service Long service Unfunded award Total Unfunded award Total GH¢’000 GH¢’000 GH¢’000 GH¢’000 GH¢’000 GH¢’000Changes in liabilityBalance at 1 January 2,677 1687 4,364 2,539 1,509 4,048Service cost - 756 756 - 756 756Interest cost 430 328 758 429 287 716Actuarial (gain)/loss arising from financial assumptions - - - (170) (204) (374)Actuarial (gain)/loss arising from other sources (620) (557) (1,177) 188 (77) 111Benefits paid/settlement (303) (285) (588) (309) (584) (893) ------- ------- ------- ------- ------- -------Balance at 31 December 2,184 1,929 4,113 2,677 1,687 4,364 ===== ===== ===== ===== ===== =====Interest cost % 16.0% - 8.76% 17.0% 0.0% 8.76%
Financial positionProjected benefit obligation 2,184 1,929 4,113 2,677 1,687 4,364 ------- ------- ------- ------- ------- -------Net defined benefit liability 2,184 1,929 4,113 2,677 1,687 4,364 ===== ===== ===== ===== ===== =====Included in profit or lossService cost - 756 756 - 756 756Interest cost 430 328 758 429 287 716 ------- ------- ------- ----- ----- ------Net interest cost less interest and expected return on plan asset 430 1,084 1,514 429 1,043 1,472Actuarial (gain)/loss - (557) (557) - (281) (281) ----- ------ ------ ----- ----- -------Amount recognised in profit or loss 430 527 957 429 762 1,191 ==== ==== ==== ==== ==== =====Other comprehensive income Actuarial gain/(loss) 620 - 620 (18) - (18) === ==== === === ==== ===Reconciliation of statement of financial positionOpening value 2,677 1,687 4,364 2,539 1,509 4,048Employer contribution (303) (285) (588) (309) (584) (893)Amount recognised in profit or loss 430 527 957 429 762 1,191Amount recognised in other comprehensive income (620) - (620) 18 - 18 ------- ------- ------- ------- ------- -------Net defined obligation 2,184 1,929 4,113 2,677 1,687 4,364 ===== ===== ===== ===== ===== =====
c. Sensitivity AnalysisReasonably possible changes at the reporting date to one of the relevant actuarial assumptions, holding other assumptions constant, would have affected the defined benefit obligation by the amounts shown below:
2018 annual reports & financial statements Sustaining Growth with Purposeful Brands

55
Financial StatementsNotes to the financial statements (Continued)
2018 2017 Increase Decrease Increase Decrease GH¢’000 GH¢’000 GH¢’000 GH¢’000
Discount rate (2% movement) 237 (211) 279 (320)Salary inflation (2% movement) 74 70 (73) 68Future pension growth (2% movement) 155 (140) (227) 200
Although the analysis does not take account of the full distribution of cash flow expected under the plan, it does provide an approximation of the sensitivity of the assumptions shown.
18. INVESTMENT IN SUBSIDIARIES 2018 2017 GH¢’000 GH¢’000
Unilever Ghana Investments Limited 10 10 == ==
Name of subsidiary Nature of % held in Country of business 2018 & 2017 incorporation
United Africa Trust Limited Investment management 100.00 Ghana Swanzy Real Estate Real Estate Development 100.00 Ghana Unilever Ghana Investments Limited Holding Company 100.00 Ghana
Investments in United Africa Trust Limited and Swanzy Real Estate are less than GH¢1,000 and so do not reflect in Note 18 above. In the opinion of Directors, the result and the financial position of the subsidiaries above have not been consolidated with that of the Company because the subsidiaries did not operate in the year and are considered less significant to Unilever Ghana Limited’s financial results and position.
19. INVENTORIES 2018 2017 GH¢’000 GH¢’000
Raw and packing material 15,532 9,759Work in process 10,000 1,564Finished goods 13,728 26,060Non-trade stock 8,511 4,085Goods in transit 5,665 12,150 ------- ------- 53,436 53,618 ====== ======
Inventories are stated at the lower of cost and net realisable value and at 31 December 2018, there were no inventories pledged as security (2017: Nil). The written-down values of raw materials and consumables and changes in work in process and finished goods included in cost of sales amounted to GH¢387,546 (2017: GH¢353,002). Inventories items are written down when they are close to expiry. Upon consumption of these inventory items before expiry, the written-down values are reversed. No reversal of write-down was recognised during the year (2017: Nil).
2018 annual reports & financial statements Sustaining Growth with Purposeful Brands
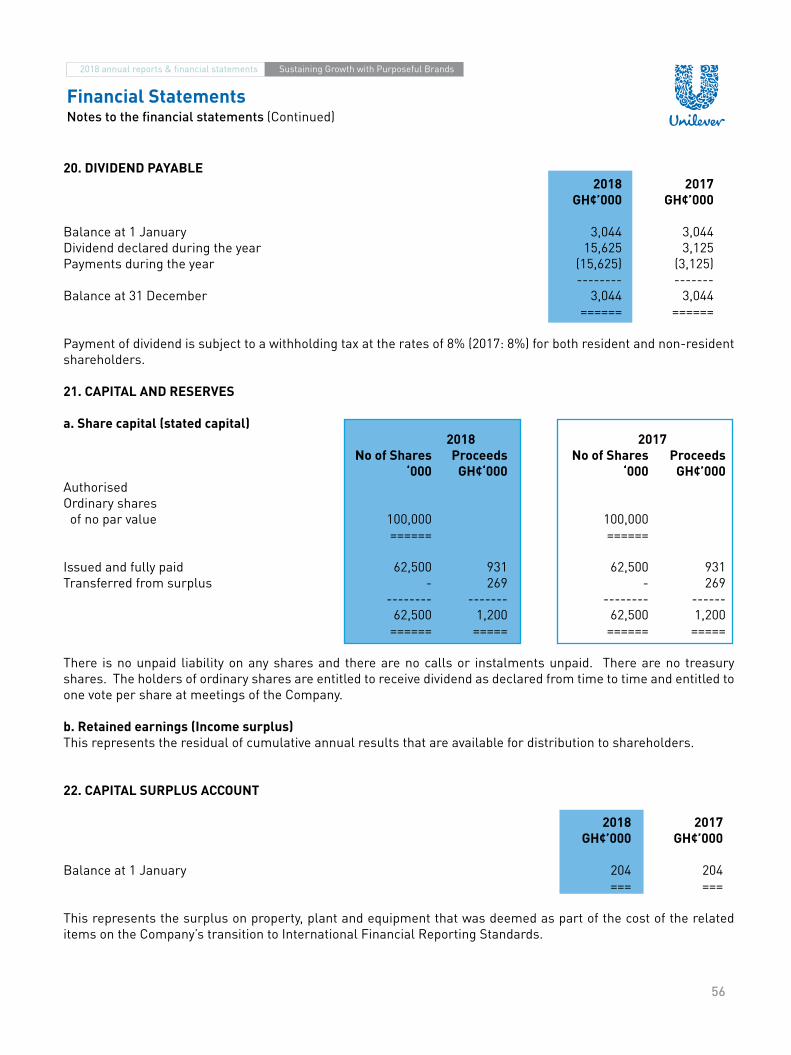
56
Financial StatementsNotes to the financial statements (Continued)
20. DIVIDEND PAYABLE 2018 2017 GH¢’000 GH¢’000
Balance at 1 January 3,044 3,044Dividend declared during the year 15,625 3,125Payments during the year (15,625) (3,125) -------- -------Balance at 31 December 3,044 3,044 ====== ====== Payment of dividend is subject to a withholding tax at the rates of 8% (2017: 8%) for both resident and non-resident shareholders.
21. CAPITAL AND RESERVES
a. Share capital (stated capital) 2018 2017 No of Shares Proceeds No of Shares Proceeds ‘000 GH¢‘000 ‘000 GH¢’000AuthorisedOrdinary shares of no par value 100,000 100,000 ====== ======
Issued and fully paid 62,500 931 62,500 931Transferred from surplus - 269 - 269 -------- ------- -------- ------ 62,500 1,200 62,500 1,200 ====== ===== ====== =====
There is no unpaid liability on any shares and there are no calls or instalments unpaid. There are no treasury shares. The holders of ordinary shares are entitled to receive dividend as declared from time to time and entitled to one vote per share at meetings of the Company.
b. Retained earnings (Income surplus)This represents the residual of cumulative annual results that are available for distribution to shareholders.
22. CAPITAL SURPLUS ACCOUNT
2018 2017 GH¢’000 GH¢’000
Balance at 1 January 204 204 === ===
This represents the surplus on property, plant and equipment that was deemed as part of the cost of the related items on the Company’s transition to International Financial Reporting Standards.
2018 annual reports & financial statements Sustaining Growth with Purposeful Brands

57
Financial StatementsNotes to the financial statements (Continued)
23. SHARE DEALS ACCOUNT 2018 2017 GH¢’000 GH¢’000
Balance at 1 January 81 81 == ==
The share deals account was created in line with section 63 of the Companies Act 1963 (Act 179) to purchase the Company’s own shares.
24. TRADE AND OTHER RECEIVABLES
2018 2017 GH¢’000 GH¢’000
Trade receivables 250,266 85,618Impairment allowance (12,417) (346) ---------- --------Net trade receivables 237,849 85,272
Amounts due from officers 28 156Other receivables 32,384 2,806Plan asset on curtailment (Note 17a) - 5,703 --------- -------- 270,261 93,937 ======= ======
The maximum indebtedness from officers of the Company amounted to GH¢27,900 (2017: GH¢156,322). Plan assets relates to surplus arising from curtailment of employee benefit obligation.
Investment in Twifo Oil Palm Plantation (TOPP)Included in other receivables is an amount of GH¢2,500,000 receivable from the Government of Ghana for the purchase of shares in Twifo Oil Palm Plantation (TOPP).
In 2008, the Company bought shares in TOPP valued at GH¢2,500,000 from the Government of Ghana. Subsequent to the acquisition, a law suit was brought against the Company by PS Investment Limited challenging the sale of the Government shares in TOPP to the Company.
In 2012, the Supreme Court gave a ruling to set aside the sale of the shares in TOPP to the Company. Following the Supreme Court ruling TOPP ceased to be a subsidiary and the cost of the investment in TOPP in the books of the Company was reclassified to receivables from the Government of Ghana. Subsequent to the Supreme Court ruling, the case has been taken to Alternative Dispute Resolution (ADR). As at year end the ADR process is yet to be completed.
In the opinion of the Directors, the full amount is recoverable hence no impairment allowance has been made.
2018 annual reports & financial statements Sustaining Growth with Purposeful Brands

58
Financial StatementsNotes to the financial statements (Continued)
25. PREPAYMENTS
2018 2017 GH¢’000 GH¢’000
At 1 January 28,747 18,427Additions during the year 275,031 123,515Utilised during the year (281,038) (113,195) --------- ---------At 31 December 22,740 28,747 ======= ======
26. TRADE AND OTHER PAYABLES 2018 2017 GH¢’000 GH¢’000
Trade payables 46,723 50,615Accrued liabilities 21,099 11,075Other payables 2,014 12,319 --------- -------- 69,836 74,009 ======= ======
27. CASH (USED IN)/GENERATED FROM OPERATION 2018 2017 GH¢’000 GH¢’000
Profit before taxation 250,322 65,360Depreciation (Note 15a &b) 9,526 8,333Amortisation of intangible asset (Note 16) 13 1,372Unrealised exchange difference (2,762) (312)Impairment allowance inventories & trade receivable (1,495) -Employment benefit and retirement plan expense (Note 17b) 956 1,191(Increase)/decrease in inventories 182 662Increase in trade and other receivables (176,324) (32,018)Increase in prepayment 6,007 (10,320)(Increase)/decrease in related party receivables (102,645) 8,290Increase/(decrease) in trade and other payables (4,172) (11,734)Increase/(decrease) in related party payables 77,244 (41,390)Increase in provisions (89,809) 100,401Increase in employee benefits obligation (252) -Interest charge (Note 12) 3,376 2,004Interest income (Note 12) (440) (160)Benefits paid (588) (893)Net asset write off (15b) 20,933 - -------- -------Cash (used in)/ generated from operation (9,928) 90,786 ====== ======
2018 annual reports & financial statements Sustaining Growth with Purposeful Brands

59
Financial StatementsNotes to the financial statements (Continued)
28. CASH AND CASH EQUIVALENTS 2018 2017 GH¢’000 GH¢’000
Bank balances 7,945 53,203 ------- --------Cash and bank balances in the statement of financial position 7,945 53,203
Bank overdrafts (73,508) (14) --------- --------Cash and cash equivalents in the statement of cashflows (65,563) 53,189 ======= ======
The Company had no restriction on cash and bank balances at 31 December 2018 (2017: Nil).
Bank overdraft facilitiesAt the reporting date, the Company had approved unsecured overdraft facilities with certain local banks to support working capital needs. Interest is payable at the banks base rates minus a spread. The facilities are scheduled for renewal in 2019.
29. PROVISIONS
2018 Restructuring Legal Other Total GH¢’000 GH¢’000 GH¢’000 GH¢’000
Balance at 1 January 2,747 619 100,186 103,552Management and technical services fees* - - (99,438) (99,438)Charge during the year 9,620 - 16,478 26,098Payments during the year - - (16,469) (16,469) -------- ----- --------- ---------Balance at 31 December 12,367 619 757 (13,743) ====== === === =======
* This represents the reversal of provision for management and technical service fees for the period 2009 to October 2017 for which GIPC approval was not granted.
2017 Restructuring Legal Other Total GH¢’000 GH¢’000 GH¢’000 GH¢’000
Balance at 1 January 1,576 723 852 3,151Reclassification from related party - - 99,436 99,436Charge during the year 10,906 - 1,569 12,475Payments during the year (9,735) (104) (1,671) (11,510) -------- ------ ---------- ---------Balance at 31 December 2,747 619 100,186 103,552 ====== === ======= =======
Included in the other provision is an amount of GH¢99.4 million net relating to management and technical service fees from 2009 to October 2017 for which management is yet to obtain approval from the GIPC. Management has sent a formal request to the GIPC during the period for the approval to be granted for these fees.
2018 annual reports & financial statements Sustaining Growth with Purposeful Brands
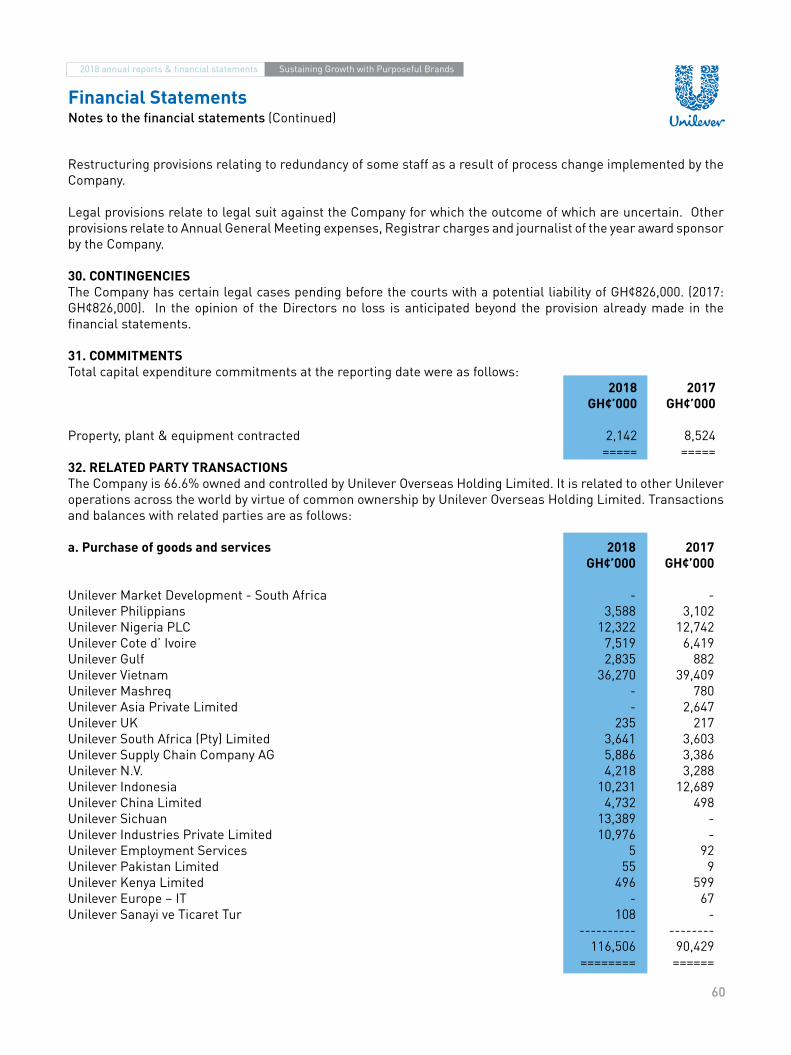
60
Financial StatementsNotes to the financial statements (Continued)
Restructuring provisions relating to redundancy of some staff as a result of process change implemented by the Company.
Legal provisions relate to legal suit against the Company for which the outcome of which are uncertain. Other provisions relate to Annual General Meeting expenses, Registrar charges and journalist of the year award sponsor by the Company.
30. CONTINGENCIESThe Company has certain legal cases pending before the courts with a potential liability of GH¢826,000. (2017: GH¢826,000). In the opinion of the Directors no loss is anticipated beyond the provision already made in the financial statements.
31. COMMITMENTSTotal capital expenditure commitments at the reporting date were as follows: 2018 2017 GH¢’000 GH¢’000
Property, plant & equipment contracted 2,142 8,524 ===== =====32. RELATED PARTY TRANSACTIONSThe Company is 66.6% owned and controlled by Unilever Overseas Holding Limited. It is related to other Unilever operations across the world by virtue of common ownership by Unilever Overseas Holding Limited. Transactions and balances with related parties are as follows:
a. Purchase of goods and services 2018 2017 GH¢’000 GH¢’000
Unilever Market Development - South Africa - -Unilever Philippians 3,588 3,102Unilever Nigeria PLC 12,322 12,742Unilever Cote d’ Ivoire 7,519 6,419Unilever Gulf 2,835 882Unilever Vietnam 36,270 39,409Unilever Mashreq - 780Unilever Asia Private Limited - 2,647Unilever UK 235 217Unilever South Africa (Pty) Limited 3,641 3,603Unilever Supply Chain Company AG 5,886 3,386Unilever N.V. 4,218 3,288Unilever Indonesia 10,231 12,689Unilever China Limited 4,732 498Unilever Sichuan 13,389 -Unilever Industries Private Limited 10,976 -Unilever Employment Services 5 92Unilever Pakistan Limited 55 9Unilever Kenya Limited 496 599Unilever Europe – IT - 67Unilever Sanayi ve Ticaret Tur 108 - ---------- -------- 116,506 90,429 ======== ======
2018 annual reports & financial statements Sustaining Growth with Purposeful Brands


61
Financial StatementsNotes to the financial statements (Continued)
b. Sale of good and services 2018 2017 GH¢’000 GH¢’000
Unilever Nigeria Plc 257 31,224Unilever Cote d’Ivoire 14,858 1,105Unilever Lipton Ceylon Limited - 511 -------- -------- 15,115 32,840 ====== ======The following are balances due from and to related parties at year end.
c. Related party receivables 2018 2017 GH¢’000 GH¢’000
Unilever Nigeria Plc 105,338 105,678Unilever Cote d’Ivoire 18,777 17,873Unilever Kenya - 6Unilever South Africa 153 329Unilever Malawi 107 161Unilever Lipton Ceylon Limited 512 512Unilever Overseas Holdings Limited - 700Unilever UK 102,747 -Unilever Ethiopia 270 - -------- -------- 227,904 125,259 ======= ======d. Related party payables 2018 2017 GH¢’000 GH¢’000
Unilever UK 31,549 7,112Unilever South Africa (Party) Limited 2,886 1,912Unilever Nigeria Plc 63,176 47,682Unilever N. V 593 1,783Unilever Cote d’ Ivoire 46,572 44,994Unilever Gulf 2,215 2,476Unilever Asia Private Limited 3,847 137Unilever Vietnam 55,878 23,330Unilever Mashreq 752 2,420Unilever Philippians 1,502 2,157Unilever Indonesia 4,634 12,434Unilever China Limited 2,697 1,011Unilever Industries Private Limited 634 674Unilever Supply Chain 7,476 5,642Unilever Sichuan 6,525 -Other Related Parties 715 643 --------- --------- 231,651 154,407 ======= =======
2018 annual reports & financial statements Sustaining Growth with Purposeful Brands
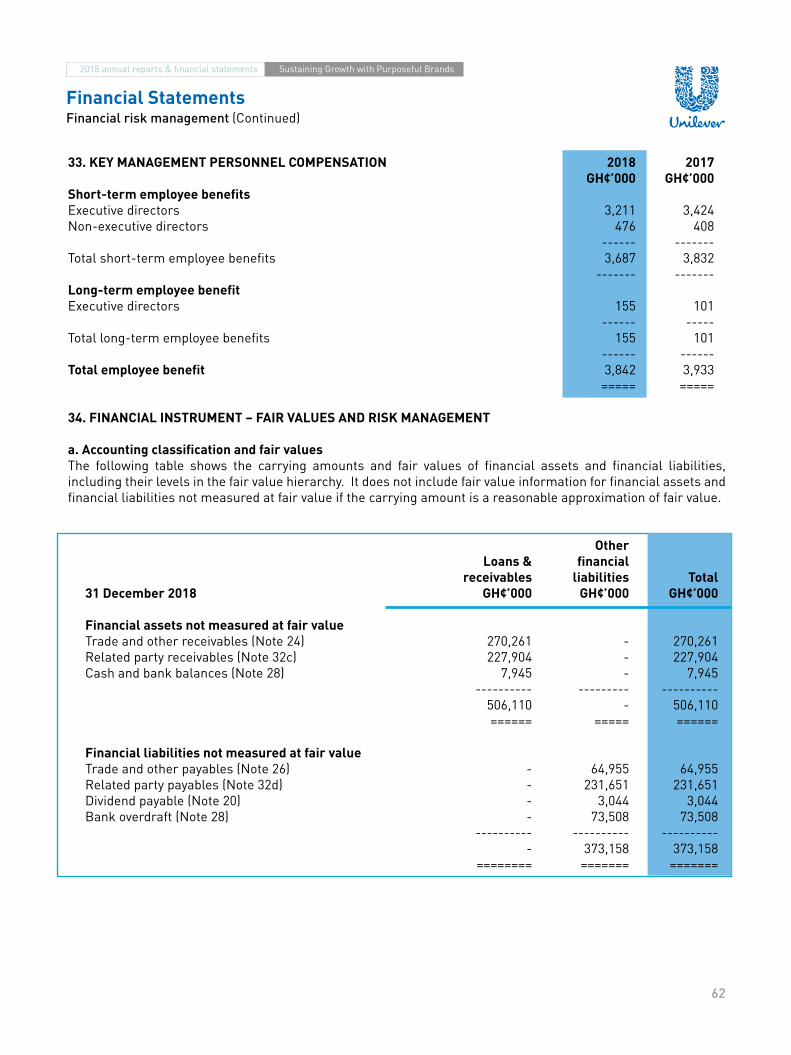
62
Financial StatementsFinancial risk management (Continued)
33. KEY MANAGEMENT PERSONNEL COMPENSATION 2018 2017 GH¢’000 GH¢’000Short-term employee benefitsExecutive directors 3,211 3,424Non-executive directors 476 408 ------ -------Total short-term employee benefits 3,687 3,832 ------- -------Long-term employee benefitExecutive directors 155 101 ------ -----Total long-term employee benefits 155 101 ------ ------Total employee benefit 3,842 3,933 ===== =====
34. FINANCIAL INSTRUMENT – FAIR VALUES AND RISK MANAGEMENT
a. Accounting classification and fair valuesThe following table shows the carrying amounts and fair values of financial assets and financial liabilities, including their levels in the fair value hierarchy. It does not include fair value information for financial assets and financial liabilities not measured at fair value if the carrying amount is a reasonable approximation of fair value.
Other Loans & financial receivables liabilities Total 31 December 2018 GH¢’000 GH¢’000 GH¢’000
Financial assets not measured at fair value Trade and other receivables (Note 24) 270,261 - 270,261 Related party receivables (Note 32c) 227,904 - 227,904 Cash and bank balances (Note 28) 7,945 - 7,945 ---------- --------- ---------- 506,110 - 506,110 ====== ===== ======
Financial liabilities not measured at fair value Trade and other payables (Note 26) - 64,955 64,955 Related party payables (Note 32d) - 231,651 231,651 Dividend payable (Note 20) - 3,044 3,044 Bank overdraft (Note 28) - 73,508 73,508 ---------- ---------- ---------- - 373,158 373,158 ======== ======= =======
2018 annual reports & financial statements Sustaining Growth with Purposeful Brands

63
Financial StatementsFinancial risk management (Continued)
Other Loans & financial receivables liabilities Total 31 December 2017 GH¢’000 GH¢’000 GH¢’000 Financial assets not measured at fair value Trade and other receivables (Note 24) 93,937 - 93,937 Related party receivables (Note 32c) 125,259 - 125,259 Cash and bank balances (Note 28) 53,203 - 53,203 ---------- --------- ---------- 272,399 - 272,399 ====== ===== ====== Financial liabilities not measured at fair value Trade and other payables (Note 26) - 71,932 71,932 Related party payables (Note 32d) - 154,407 154,407 Dividend payable (Note 20) - 3,044 3,044 Bank overdraft - 14 14 ---------- --------- --------- - 229,397 229,397 ====== ======= =======
Excluded from trade and other payables are statutory taxes payable of GH¢4,881,000 (2017: GH¢2,077,273).
b. Risk managementThe Company’s activities expose it to a variety of financial risks: market risk (including currency risk, fair value interest rate risk, cash flow interest rate risk and price risk), credit risk and liquidity risk. The Company’s overall risk management programme focuses on the unpredictability of financial markets and seeks to minimise potential adverse effects on the Company’s financial performance. Risk management is carried out by a Treasury department under policies approved by the Board of Directors and the parent, Unilever Overseas Holding Limited.
(i) Market riskMarket risk is the risk that changes in market prices such as foreign exchange rates, interest rates and equity prices will affect the Company’s income or the value of its holdings of financial instruments. The objective of market risk management is to manage and control market risk exposures within acceptable parameters, while optimising the return. (ii) Foreign exchange riskThe risk of adverse movements in exchange rates which leads the Company to experience actual or balance sheet losses. The Company operates internationally and is exposed to foreign exchange risk arising from various currency exposures, primarily with respect to the United States Dollar (US$), Euro (£), British pound (GBP) and South African Rand (ZAR). Foreign exchange risk arises from recognised assets and liabilities denominated in a currency that is not the entity’s functional currency.
Currency exposure arising from liabilities denominated in foreign currencies is managed primarily through the holding of bank balances in the relevant foreign currencies.
Exposure for monetary assets and liabilities denominated in foreign currencies is kept at an acceptable level by buying or selling foreign currencies at spot rates when necessary to address short term imbalances.
2018 annual reports & financial statements Sustaining Growth with Purposeful Brands

64
Financial StatementsFinancial risk management (Continued)
The Company’s exposure to foreign currency risk was as follows based on notional amounts.
2018 USD EURO GBP ZAR
Bank balances 1,016 602 29 3,082Related party receivables 20,941 3,502 - -Trade payables (7,646) (2,670) (301) (738)Related party payables (23,278) 10,235 (34) (6,689) ------- -------- ----- --------Net exposure (8,967) 11,669 (306) 4,345 ====== ====== ==== =====
2017 USD EURO GBP ZAR
Bank balances 729 599 320 606Related party receivables 23,103 3,499 - -Trade payables (456) 34 (20) (338)Related party payables (19,718) (9,269) (39) (3,699) -------- ------- ----- -------Net exposure 3,658 (5,137) 261 (3,431) ===== ====== === ======
The following significant exchange rates applied during the year.
Average Rate Reporting Rate
Cedis 2018 2017 2018 2017
USD 1 4.65 4.53 4.83 4.54EUR 1 5.52 5.36 5.52 5.43GBP 1 6.24 6.06 6.12 6.10ZAR 1 0.34 0.34 0.34 0.37
Sensitivity analysis on currency risksThe following table shows the effect of a strengthening or weakening of GH¢ against all other currencies on the Company’s profit or loss and equity. This sensitivity analysis indicates the potential impact on profit or loss and equity based upon the foreign currency exposures recorded at 31 December (see “foreign exchange risk”) and it does not represent actual or future gains or losses. The sensitivity analysis is based on the percentage difference between the closing exchange rate and the average exchange rate per currency recorded in the course of the respective financial year.
A strengthening/weakening of the GH¢, by the rates shown in the table, against the following currencies at 31 December would have increased/decreased equity and profit or loss by the amounts shown below. This analysis assumes that all other variables, in particular interest rates, remain constant.
2018 annual reports & financial statements Sustaining Growth with Purposeful Brands

65
Financial StatementsFinancial risk management (Continued)
As of 31 December
2018 2017
Currency % Change Profit or loss/ impact:
StrengtheningGH¢’000
Profitor loss/ impact: Weakening
GH¢’000
% Change Profit or loss/ impact:
StrengtheningGH¢’000
Profit or loss/ impact: Weakening
GH¢’000USD ±5 (2,212) 2,212 ±3 (498) 498EUR ±6 3,864 (3,864) ±8 (2,229) 2,229GBP ±6 (113) 113 ±6 95 (95)ZAR ±10 (146) 146 ±10 (126) 126
As of 31 December
2018 2017
Currency % Change Equity, net of tax impact:
StrengtheningGH¢’000
Equity, net of tax impact: Weakening
GH¢’000
% Change Equity, net of tax impact:
StrengtheningGH¢’000
Equity, net of tax impact: Weakening
GH¢’000USD ±5 (1,659) 1,659 ±3 (374) 374EUR ±6 2,898 (2,898) ±8 (1,672) 1,672GBP ±6 (84) 84 ±6 71 (71)ZAR ±10 (109) 109 ±10 (95) 95
(iii) Interest rate risk
The risk of a company’s profit being adversely affected by movement in interest rates. The Company’s only interest-bearing financial instruments are the bank overdraft and bank balances, which are at variable rates, and on which they are therefore exposed to cash flow interest rate risk. The Company regularly monitors financing options available to ensure optimum interest rates are obtained.
A 200 basis points increase in interest rates at the reporting date would have increased/(decreased) equity and profit or loss by the amounts shown below. This analysis assumes that all other variables in particular foreign currency rates remain constant. The analysis is performed on the same basis for 2017.
Fixed rate instrument
The Company has no fixed rate financial instruments (2017: Nil). Variable rate instrument
2018 2017 GH¢‘000 GH¢‘000
Bank overdraft 73,508 14 ====== ==
2018 annual reports & financial statements Sustaining Growth with Purposeful Brands

66
Financial StatementsFinancial risk management (Continued)
2018 2017 200bp 200bp 200bp 200bp Increase Decrease Increase Decrease
Bank overdraft 82,329 (82,329) 232 (232) ====== ======= === ===
Cash flow sensitivity analysis for variable rate instrumentA 2% additional increase in interest rate at the reporting date would have increased (decreased) profit or loss by the amounts shown below. This analysis assumes that all other variables, foreign currency rates, remain constant. The analysis is performed on the same basis for 2017.
As of 31 December
2018 2017
% Change Income statement
impactGH¢’000
EquityGH¢’000
% Change Income statement
impactGH¢’000
EquityGH¢’000
Bank overdraft ±2 (501) 501 ±2 (1) 1
c. Credit riskCredit risk is the risk of financial loss to the company if a customer or counterparty to a financial instrument fails to meet its contractual obligations and arises principally from trade and other receivables.
(i) Trade and other receivablesThe Company does not have any significant concentrations of credit risk. The credit controller assesses the credit quality of each customer, taking into account its financial position, past experience and other factors. Individual risk limits are set based on internal or external ratings in accordance with limits set by the Board. The utilisation of credit limits is regularly monitored. The Company’s maximum exposure to credit risk at 31 December 2018 and 2017 is the same as the trade and other receivables in the statement of financial position.
There is no off-balance sheet credit risk exposure.
No collateral is held for any of the above assets. The Company does not grade the credit quality of receivables. All receivables that are neither past due nor impaired are within their approved credit limits, and no receivables have had their terms renegotiated. The maximum exposure to credit risk at 31 December 2018 was as follows:
2018 annual reports & financial statements Sustaining Growth with Purposeful Brands

67
Financial StatementsFinancial risk management (Continued)
2018 2017 GH¢‘000 GH¢‘000
Trade and other receivables (Note 24) 270,261 93,937Amount due from related companies (Note 32c) 227,904 125,259Cash and bank balances (Note 28) 7,945 53,203 ---------- ---------- 506,110 272,399 ====== ======Trade and other receivables by type of counter party:Key distributors 242,216 78,293Modern trade 5,074 4,380Institutions and companies 22,942 11,108Amount due from officers 29 156 --------- -------- 270,261 93,937 ======= ======
Impairment analysis of trade and other receivables
Expected credit loss assessment for customers as at 1 January 2018 and 31 December 2018The Company uses an allowance matrix to measure the ECLs of trade receivables from customers, which comprise a very large number of small balances. Loss rates are calculated using a ‘roll rate’ method based on the probability of a receivable progressing through successive stages of delinquency to write-off. Roll rates are calculated separately for exposures in different segments based on the age of the receivables. Loss rates are based on actual credit loss experience over the past three years.
The following table provides information about the exposure to credit risk and ECLs for trade receivables and contract assets from customers as at 31 December 2018.
Weighted carrying Loss Credit- average amount allowance impaired loss rate GH¢ GH
Current (not past due) 0.50% 81,088 364 Yes 1 to 3 months past due 1.25% 123,777 1,579 Yes 3-6 months past due 15% 37,869 6,488 Yes 6-12 months past due 30% 5,195 3,640 Yes Past due above 1 year 75% 2,337 346 Yes --------- ------- 250,266 12,417 ======= ======
Movements in the allowance for impairment in respect of trade receivables and contract assets
The movement in the allowance for impairment in respect of trade receivables during the year was as follows. Comparative amounts for 2017 represent the allowance account for impairment losses under IAS 39.
2018 annual reports & financial statements Sustaining Growth with Purposeful Brands

68
Financial StatementsFinancial risk management (Continued)
2018 2017 GH¢ GH¢
Opening balance 1 January under IAS 39 346 346Adjustment on initial application of IFRS 9 1,495 - ------- -----Balance at January under IFRS 9 1,841 346Impairment loss on trade receivable 10,575 - -------- ----- 12,416 346 ====== ====
At 31 December 2018, the impairment loss of GH¢12,416,000 (2017: GH¢346,000) related to customers whose balances were outstanding for over 180 days and some debts that were specifically impaired.
Cash and cash equivalentThe Company’s cash and cash equivalents position was GH¢(65,563) as at 31 December 2018 (2017: GH¢53,189). The cash and cash equivalents are held with bank and financial institution counterparties.
Impairment on cash and cash equivalents has been measured on a 12-month expected loss basis and reflects the short maturities of the exposures.
The Company considers that its cash and cash equivalents have low credit risk based on the external credit ratings of the counterparties.
On initial application of IFRS 9, the Company did not recognise an impairment allowance on cash and cash equivalent as at 1 January 2018 due to the insignificance of the amount.
The amount of the allowance did not change during 2018.
(ii) Related party receivablesThe Company’s exposure to credit risk in respect of the amounts due from related parties is minimised. The Company has transacted business with related parties over the years and there has been no defaults in payment of outstanding debts.
(ii) Related party receivables (cont’d)The Company held bank balances of GH¢(65.5)m million at 31 December 2018 (2017: GH¢53.2 million) which represents its maximum exposure. The bank balances are held with the company’s bankers.
d. Liquidity riskLiquidity risk is the risk that the Company will encounter difficulty in meeting the obligation associated with its financial liabilities that are settled by delivering cash or another financial asset. The Company manages liquidity risk by maintaining adequate cash reserves and calling on short term borrowing and funding from related parties. Prudent liquidity risk management includes maintaining sufficient cash balances, and the availability of funding from an adequate amount of committed credit facilities. Due to the dynamic nature of the underlying businesses, the finance department maintains flexibility in funding by maintaining availability under committed credit lines. Management monitors rolling forecasts of the Company’s liquidity reserve on the basis of expected cash flow.
The table below analyses the Company’s financial liabilities into relevant maturity groupings based on the remaining period at the reporting date to the contractual maturity date. Balances due within 12 months equal their carrying balances, as the impact of discounting is not significant. Since discounting is not applied to any of these disclosed amounts, the amounts per the table can be reconciled to the amounts disclosed in the statement of financial position.
2018 annual reports & financial statements Sustaining Growth with Purposeful Brands
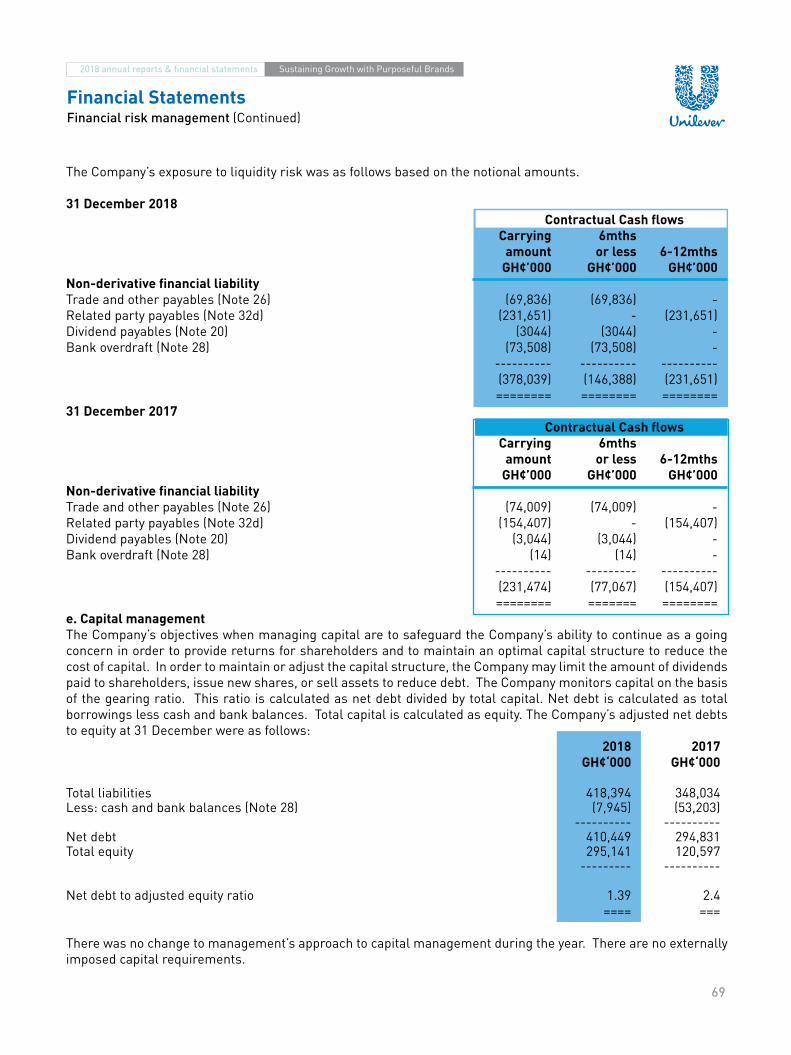
69
Financial StatementsFinancial risk management (Continued)
The Company’s exposure to liquidity risk was as follows based on the notional amounts.
31 December 2018 Contractual Cash flows Carrying 6mths amount or less 6-12mths GH¢’000 GH¢’000 GH¢’000Non-derivative financial liabilityTrade and other payables (Note 26) (69,836) (69,836) -Related party payables (Note 32d) (231,651) - (231,651)Dividend payables (Note 20) (3044) (3044) -Bank overdraft (Note 28) (73,508) (73,508) - ---------- ---------- ---------- (378,039) (146,388) (231,651) ======== ======== ========31 December 2017 Contractual Cash flows Carrying 6mths amount or less 6-12mths GH¢’000 GH¢’000 GH¢’000Non-derivative financial liabilityTrade and other payables (Note 26) (74,009) (74,009) -Related party payables (Note 32d) (154,407) - (154,407)Dividend payables (Note 20) (3,044) (3,044) -Bank overdraft (Note 28) (14) (14) - ---------- --------- ---------- (231,474) (77,067) (154,407) ======== ======= ========e. Capital managementThe Company’s objectives when managing capital are to safeguard the Company’s ability to continue as a going concern in order to provide returns for shareholders and to maintain an optimal capital structure to reduce the cost of capital. In order to maintain or adjust the capital structure, the Company may limit the amount of dividends paid to shareholders, issue new shares, or sell assets to reduce debt. The Company monitors capital on the basis of the gearing ratio. This ratio is calculated as net debt divided by total capital. Net debt is calculated as total borrowings less cash and bank balances. Total capital is calculated as equity. The Company’s adjusted net debts to equity at 31 December were as follows: 2018 2017 GH¢‘000 GH¢‘000
Total liabilities 418,394 348,034Less: cash and bank balances (Note 28) (7,945) (53,203) ---------- ----------Net debt 410,449 294,831Total equity 295,141 120,597 --------- ----------
Net debt to adjusted equity ratio 1.39 2.4 ==== ===
There was no change to management’s approach to capital management during the year. There are no externally imposed capital requirements.
2018 annual reports & financial statements Sustaining Growth with Purposeful Brands
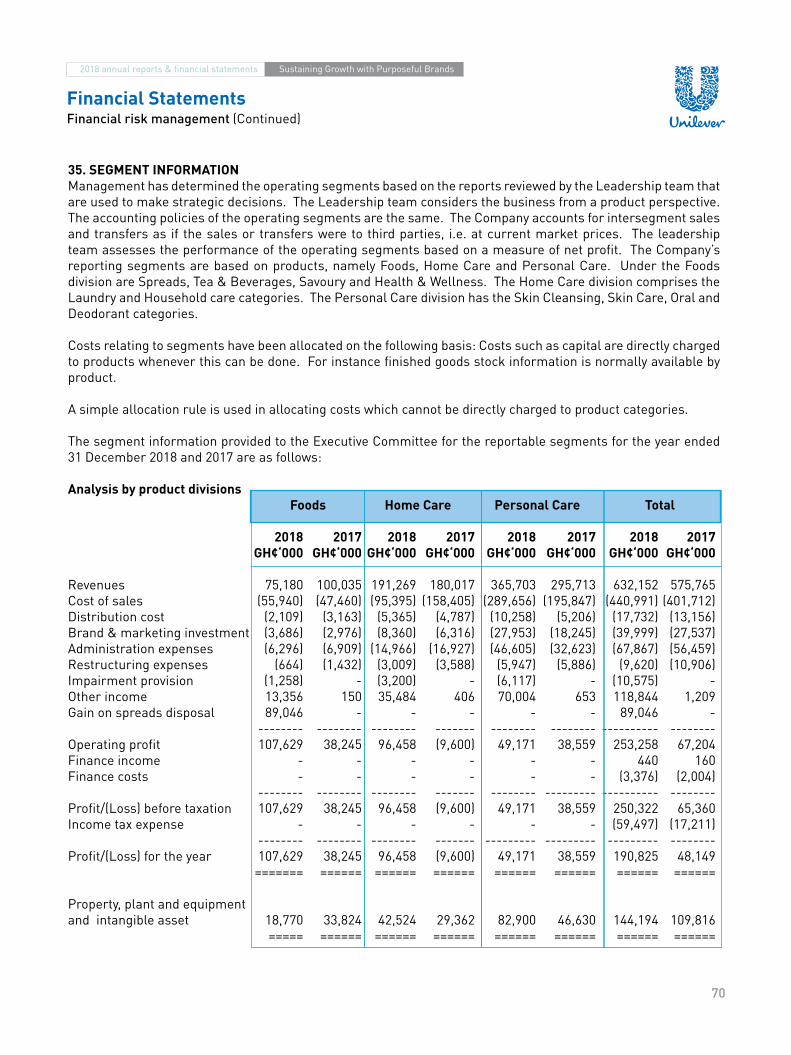
70
Financial StatementsFinancial risk management (Continued)
35. SEGMENT INFORMATIONManagement has determined the operating segments based on the reports reviewed by the Leadership team that are used to make strategic decisions. The Leadership team considers the business from a product perspective. The accounting policies of the operating segments are the same. The Company accounts for intersegment sales and transfers as if the sales or transfers were to third parties, i.e. at current market prices. The leadership team assesses the performance of the operating segments based on a measure of net profit. The Company’s reporting segments are based on products, namely Foods, Home Care and Personal Care. Under the Foods division are Spreads, Tea & Beverages, Savoury and Health & Wellness. The Home Care division comprises the Laundry and Household care categories. The Personal Care division has the Skin Cleansing, Skin Care, Oral and Deodorant categories.
Costs relating to segments have been allocated on the following basis: Costs such as capital are directly charged to products whenever this can be done. For instance finished goods stock information is normally available by product.
A simple allocation rule is used in allocating costs which cannot be directly charged to product categories.
The segment information provided to the Executive Committee for the reportable segments for the year ended 31 December 2018 and 2017 are as follows:
Analysis by product divisions Foods Home Care Personal Care Total
2018 2017 2018 2017 2018 2017 2018 2017 GH¢‘000 GH¢‘000 GH¢‘000 GH¢‘000 GH¢‘000 GH¢‘000 GH¢‘000 GH¢‘000
Revenues 75,180 100,035 191,269 180,017 365,703 295,713 632,152 575,765Cost of sales (55,940) (47,460) (95,395) (158,405) (289,656) (195,847) (440,991) (401,712)Distribution cost (2,109) (3,163) (5,365) (4,787) (10,258) (5,206) (17,732) (13,156)Brand & marketing investment (3,686) (2,976) (8,360) (6,316) (27,953) (18,245) (39,999) (27,537)Administration expenses (6,296) (6,909) (14,966) (16,927) (46,605) (32,623) (67,867) (56,459)Restructuring expenses (664) (1,432) (3,009) (3,588) (5,947) (5,886) (9,620) (10,906)Impairment provision (1,258) - (3,200) - (6,117) - (10,575) -Other income 13,356 150 35,484 406 70,004 653 118,844 1,209Gain on spreads disposal 89,046 - - - - - 89,046 - -------- -------- -------- ------- -------- -------- ---------- --------Operating profit 107,629 38,245 96,458 (9,600) 49,171 38,559 253,258 67,204Finance income - - - - - - 440 160Finance costs - - - - - - (3,376) (2,004) -------- -------- -------- ------- -------- --------- ---------- --------Profit/(Loss) before taxation 107,629 38,245 96,458 (9,600) 49,171 38,559 250,322 65,360Income tax expense - - - - - - (59,497) (17,211) -------- -------- -------- ------- --------- --------- --------- --------Profit/(Loss) for the year 107,629 38,245 96,458 (9,600) 49,171 38,559 190,825 48,149 ======= ====== ====== ====== ====== ====== ====== ======
Property, plant and equipment and intangible asset 18,770 33,824 42,524 29,362 82,900 46,630 144,194 109,816 ===== ====== ====== ====== ====== ====== ====== ======
2018 annual reports & financial statements Sustaining Growth with Purposeful Brands

71
Financial StatementsNotes to the financial statements (Continued)
Reconciliation of information on reportable segment
2018 2017 GH¢‘000 GH¢‘000
Consolidated total assets 62,335 109,816Unallocated amounts 81,555 3,939 --------- --------Total assets for reportable entities 143,890 113,755 ======= =======Geographical information
2018 2017 GH¢‘000 GH¢‘000In Ghana 617,037 542,925Outside Ghana 15,115 32,840 --------- --------- 632,152 575,765 ======= =======
No individual customer contributed 10% or more to revenue. Segment revenue is based on the geographical location of customers, whilst segment asset is based on the geographical location of the assets.
2018 annual reports & financial statements Sustaining Growth with Purposeful Brands
Assets
Revenues
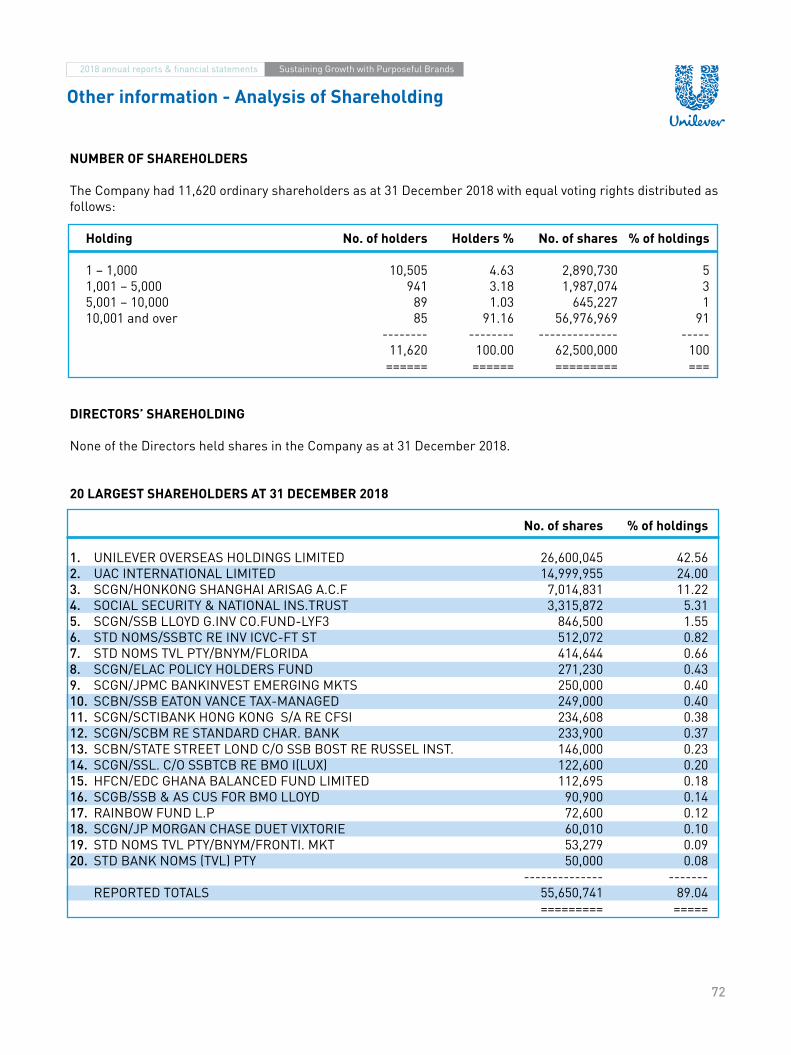
72
NUMBER OF SHAREHOLDERS
The Company had 11,620 ordinary shareholders as at 31 December 2018 with equal voting rights distributed as follows:
Holding No. of holders Holders % No. of shares % of holdings
1 – 1,000 10,505 4.63 2,890,730 5 1,001 – 5,000 941 3.18 1,987,074 3 5,001 – 10,000 89 1.03 645,227 1 10,001 and over 85 91.16 56,976,969 91 -------- -------- -------------- ----- 11,620 100.00 62,500,000 100 ====== ====== ========= ===
DIRECTORS’ SHAREHOLDING
None of the Directors held shares in the Company as at 31 December 2018.
20 LARGEST SHAREHOLDERS AT 31 DECEMBER 2018
No. of shares % of holdings
1. UNILEVER OVERSEAS HOLDINGS LIMITED 26,600,045 42.562. UAC INTERNATIONAL LIMITED 14,999,955 24.003. SCGN/HONKONG SHANGHAI ARISAG A.C.F 7,014,831 11.224. SOCIAL SECURITY & NATIONAL INS.TRUST 3,315,872 5.315. SCGN/SSB LLOYD G.INV CO.FUND-LYF3 846,500 1.556. STD NOMS/SSBTC RE INV ICVC-FT ST 512,072 0.827. STD NOMS TVL PTY/BNYM/FLORIDA 414,644 0.668. SCGN/ELAC POLICY HOLDERS FUND 271,230 0.439. SCGN/JPMC BANKINVEST EMERGING MKTS 250,000 0.4010. SCBN/SSB EATON VANCE TAX-MANAGED 249,000 0.4011. SCGN/SCTIBANK HONG KONG S/A RE CFSI 234,608 0.3812. SCGN/SCBM RE STANDARD CHAR. BANK 233,900 0.3713. SCBN/STATE STREET LOND C/O SSB BOST RE RUSSEL INST. 146,000 0.2314. SCGN/SSL. C/O SSBTCB RE BMO I(LUX) 122,600 0.2015. HFCN/EDC GHANA BALANCED FUND LIMITED 112,695 0.1816. SCGB/SSB & AS CUS FOR BMO LLOYD 90,900 0.1417. RAINBOW FUND L.P 72,600 0.1218. SCGN/JP MORGAN CHASE DUET VIXTORIE 60,010 0.1019. STD NOMS TVL PTY/BNYM/FRONTI. MKT 53,279 0.0920. STD BANK NOMS (TVL) PTY 50,000 0.08 -------------- ------- REPORTED TOTALS 55,650,741 89.04 ========= =====
Other information - Analysis of Shareholding
2018 annual reports & financial statements Sustaining Growth with Purposeful Brands
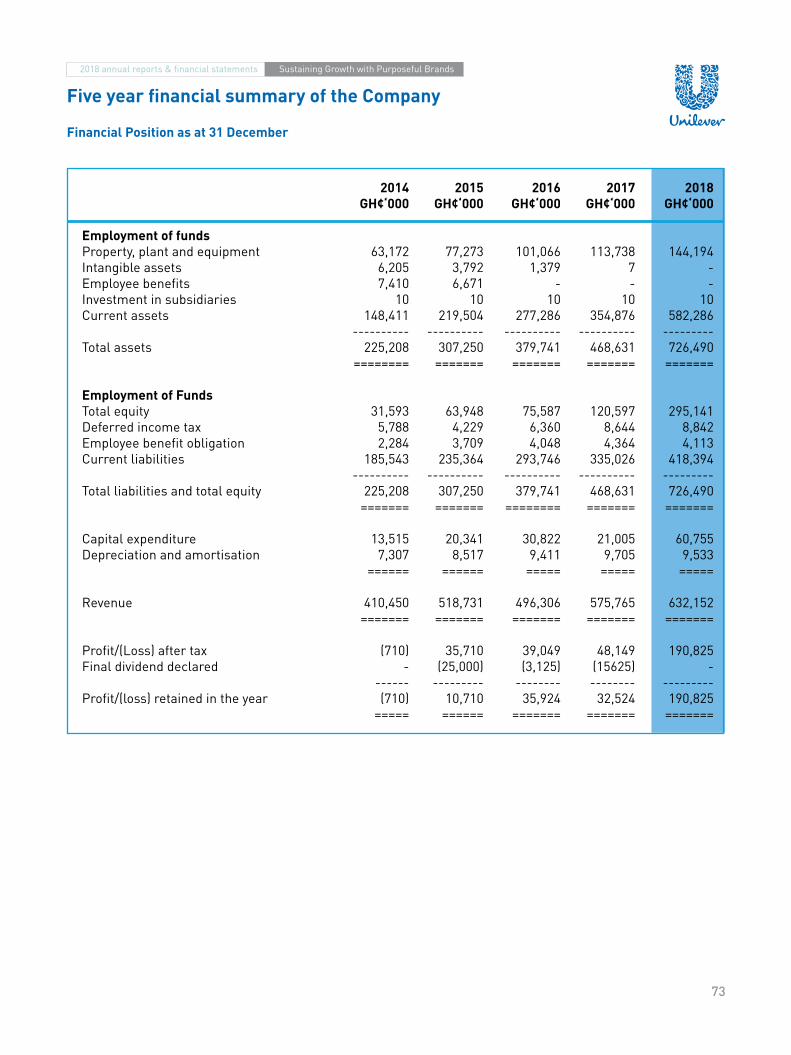
73
Five year financial summary of the Company
Financial Position as at 31 December
2014 2015 2016 2017 2018 GH¢‘000 GH¢‘000 GH¢‘000 GH¢‘000 GH¢‘000
Employment of funds Property, plant and equipment 63,172 77,273 101,066 113,738 144,194 Intangible assets 6,205 3,792 1,379 7 - Employee benefits 7,410 6,671 - - - Investment in subsidiaries 10 10 10 10 10 Current assets 148,411 219,504 277,286 354,876 582,286 ---------- ---------- ---------- ---------- --------- Total assets 225,208 307,250 379,741 468,631 726,490 ======== ======= ======= ======= =======
Employment of Funds Total equity 31,593 63,948 75,587 120,597 295,141 Deferred income tax 5,788 4,229 6,360 8,644 8,842 Employee benefit obligation 2,284 3,709 4,048 4,364 4,113 Current liabilities 185,543 235,364 293,746 335,026 418,394 ---------- ---------- ---------- ---------- --------- Total liabilities and total equity 225,208 307,250 379,741 468,631 726,490 ======= ======= ======== ======= =======
Capital expenditure 13,515 20,341 30,822 21,005 60,755 Depreciation and amortisation 7,307 8,517 9,411 9,705 9,533 ====== ====== ===== ===== =====
Revenue 410,450 518,731 496,306 575,765 632,152 ======= ======= ======= ======= =======
Profit/(Loss) after tax (710) 35,710 39,049 48,149 190,825 Final dividend declared - (25,000) (3,125) (15625) - ------ --------- -------- -------- --------- Profit/(loss) retained in the year (710) 10,710 35,924 32,524 190,825 ===== ====== ======= ======= =======
2018 annual reports & financial statements Sustaining Growth with Purposeful Brands

74
Existence of succession planUnilever Ghana has in place internal and external succession plans for all key roles. Succession plans are built based on readiness status (ready in less than 1 year, ready in 1-3 years, ready in 3-5years), job experience and performance. The criteria used is:
a. Minimum three (3) successors for each key roleb. 50% of mapped candidates should be femalesc. Minimum one (1) ready now candidate
This ensures we have a ready pool of talent to fill vacant positions and thus reduces turnaround time for recruitments. This ultimately results in minimal business disruptions when a role becomes vacant.
Training/courses for leadership team membersDuring the year the leadership team attended the following courses:
Unilever leadership development programme This is a world class, senior leadership development experience centred on understanding the concept of
authentic, purpose led leadership.
The outcome is an exceptionally powerful and important personal development plan, supported by coaching/mentoring by Unilever executives.
Excelerator programme for senior managers This is aimed to accelerate development of individuals through a holistic approach with focus on assessment
and self-awareness, individual development planning, leadership & behavioural capabilities, business acumen, cross functional perspectives, and network building. Other courses include: Hope in the midst of crisis, Financial modelling and advance excel and Gold for senior managers.
Other disclosures
2018 annual reports & financial statements Sustaining Growth with Purposeful Brands

TOOTHPASTE
BENEFITS IN
A Smile changes everything

ANNUAL GENERAL MEETING TO BE HELD at 10.00 a.m. on Friday, 24th May, 2019 at The Ghana College of Physicians and Surgeons, Accra
For Company’s Use No. of Shares
I/We ................................................. (Insert full name)
RESOLUTION FOR AGAINST ABSTAIN
To declare a Dividend
of ...................................................... (Insert full address)
To re-elect Mrs Nana Yaa Owusu-Ansah as a Director
To re-elect Mrs. Adesola Sotande-Peters as a Director
being a member(s) of Unilever Ghana Limited, hereby appoint
………………….........................…………… (insert full name)
To re-elect Mr Alfred Yaw Oduro Nsarkoh as a Director
To re-elect Mr. Michael Odinakachi Ubeh as a Director
To approve the terms of appointment of Mr Michael Obinakachi Ubeh as a Manager
To approve Directors’ Fees
or failing him the Chairman of the Meeting as my/our proxy to vote for me/us and on my/our behalf at the Annual General Meeting of that Company to be held on Friday, 24th May 2019 and at any and every adjournment thereof.
To authorise the Directors to fix the Remuneration of the Auditors.
To amend Regulation 53 (1) and (2) of the Company’s Regulations to include Regulation 53 (3) (a) and (b) as follows:
a. The electronic version of the Annual Report and Financial Statement shall be posted on the Business’ website as follows: www.unileverghana.com and same forwarded to the e-mail addresses of shareholders before Annual General Meetings.
b. A limited number of hard copies of the Annual Report will be made available to shareholders at the grounds of the Annual General Meeting for use by shareholders attending the meeting.
Please indicate with an “X” in the appropriate square how you wish your votes to be cast on the resolution referred to above. Unless otherwise instructed the proxy will vote or abstain from voting at his discretion.
Dated this ...……...day of May, 2019.
75
Shareholder’s signature: ......................... (before posting the above form, please tear off this part and retain it)
THIS PROXY FORM SHOULD NOT BE COMPLETED AND SENT TO THE REGISTRARS IF THE MEMBER WILL BE ATTENDING THE MEETINGNOTES (1) In the case of joint holders, each should sign.(2) If executed by a Corporation, the Proxy Form should bear its Common Seal or be signed on its behalf by a Director. (3) Please sign the above Proxy Form and post it so as to reach the address shown overleaf not later than 11.00 a.m. on 22nd May 2019.
Proxy FormSerial No.
2018 annual reports & financial statements Sustaining Growth with Purposeful Brands

76
Fourth fold here
Third fold hereS
econ
d fo
ld h
ere
Firs
t fol
d he
re
plea
se fi
xst
amp
The
Reg
istr
ars
Uni
vers
al M
erch
ant B
ank
Lim
ited
123
Kw
ame
Nkr
umah
Ave
nue
Seth
i Pla
za, A
dabr
aka
P. O
. Box
401
Accr
a, G
hana
2018 annual reports & financial statements Sustaining Growth with Purposeful Brands


77
2018 annual reports & financial statements Sustaining Growth with Purposeful Brands

UNILEVER GHANA LIMITEDUnilever Head Office and Factory
P. O. Box 721 Tema, Ghana. www.unileverghana.com
T +0302 (0)20 7822 5252F +0302 (0)20 7822 5951
WWW.UNILEVER.COM


![[600]* Auditors' reports on financial statements](https://static.fdocuments.us/doc/165x107/544fbf2caf7959cb398b7270/600-auditors-reports-on-financial-statements.jpg)


