2018 Annual Report - s21.q4cdn.com · 2018 For further discussion of “organic sales,”...
99
2016 Watts Water Technologies, Inc. 2018 Annual Report 2018 Annual Report
Transcript of 2018 Annual Report - s21.q4cdn.com · 2018 For further discussion of “organic sales,”...
2016W
atts Water Techno
log
ies, Inc. 2018
Annual R
epo
rt
2018 Annual Report

Watts at a Glance
Our Brands
R
We are a dynamic global organization that provides the world with water and gas
products that contribute to energy efficiency, improved safety, and the conserva-
tion and sustainability of water supplies. Our products control the flow of water into,
throughout, and exiting some of the world’s largest buildings and hotel chains. Renowned
professional sports stadiums use our radiant heating technology to keep their outdoor
field turf from freezing. Leading brands in the restaurant industry rely on our water
heaters, gas solutions, and drains to ensure their kitchens run safely and smoothly. Our
residential applications protect homes from gas leaks and water scalding, and provide
families with clean drinking water. We remain true to our roots, keeping residential and
commercial properties safe with pressure regulator solutions and backflow preventers.
Our 4,800+ employees are keenly aware of this. They are incredibly proud because our
products and services directly improve the comfort, safety, and quality of life for people
around the world.

To improve comfort, safety, and quality of life for people around the world through our expertise in a wide
range of water technologies. To be the best in the eyes of our employees, customers, and shareholders.
Our MissionOur Mission
HeadquartersAmericas & Corporate Headquarters:
North Andover, Massachusetts, USA
European Headquarters:
Amsterdam, Netherlands
Asia-Pacific, Middle East &
Africa Headquarters:
Shanghai, China
Our Corporate StrategyOur Corporate StrategyOur strategy focuses on 5 key pillars:
1. Growth
2. Operational Excellence
3. Commercial Excellence
4. One Watts
5. Talent & Performance Culture
PatentsPatentsWatts has a portfolio of over 400
listed patents worldwide.
Focus AreasFocus AreasOur solutions offer customers
benefits in 3 key areas:
1. Safety & Regulation
2. Energy Efficiency
3. Water Conservation
Solutions for:Solutions for:• Plumbing & Flow Control
• HVAC• Water Reuse & Drainage
• Water Quality & Conditioning• Municipal Waterworks
Our CustomersOur Customers• Contractors/Installers
• Wholesalers• Engineers/Designers
• OEMs• Consumers
• Facility Managers/Owners
FoundedFounded1874 by Joseph Watts
Lawrence, MA
RegionsRegionsWe have over 4,800 employees
on 5 continents, located in more than 24 countries, and
they collectively speak more than 18 languages.
934853nar.indd 3 3/14/19 7:03 PM

We are proud to report that Watts successfully executed on its operational and financial commitments in 2018. Watts delivered record financial performance and continued to grow, while reinvesting millions of dollars back into our business. Our strong topline performance enabled us to accelerate funding for growth with a heavy focus on our smart and connected strategy and productivity; and our increased customer intimacy and innovation have positioned our Company well for future success.
To Our Shareholders
Robert J. Pagano, Jr., Chief Executive Officer and President; Shashank Patel, Chief Financial Officer; Photographed in the Watts Works Learning Center in North Andover, Massachusetts.
934853nar.indd 4 3/14/19 7:14 PM

2018
For further discussion of “organic sales,” “adjusted operating margin,” “adjusted earnings per share,” and “free cash flow,” which are non-GAAP financial measures, and the comparable GAAP measures, see the section titled “Management’s Discussion and Analysis of Financial Condition and Results of Operations” in our Form 10-K included in this Annual Report to Shareholders.
2018 Financial Highlights
Sales for the full year were $1.57 billion, up $108 million, or 7 percent, on a reported basis and an all-time record for Watts. This increase was primar-ily driven by organic sales growth of $89 million or 6 percent. Favorable foreign currency movements contributed $19 million or 1 percent.
Organically, sales increased in all three regions, with Americas up approximately 8 percent, while Europe and Asia-Pacific, Middle East and Africa (APMEA) each increased approximately 2 percent.
Adjusted operating margin was 12.3 percent, a record result for the Company. We expanded our
adjusted operating margin while simultaneously investing an incremental $16 million in sales and marketing, research and development, information technology and continuous improvement initia-tives. Adjusted Earnings Per Share of $3.74, another record, increased 24 percent driven by strong operations, the benefits of tax reform, lower interest expense and favorable foreign currency transaction movements.
In 2018, free cash flow approximated $136 million, a 7 percent increase year-over-year. We achieved this while spending 16 percent more in net capital expenditures to upgrade and enhance our manu-facturing and training capabilities that support productivity and help increase customer intimacy.
Total Net Sales
1,45712.3%
2017
Adjusted Operating Margin
11.9%
2017 20182018
$3.02
$3.74
2017 2018
Adjusted Earnings Per Share
$ M
illion
s
1,565
Growth
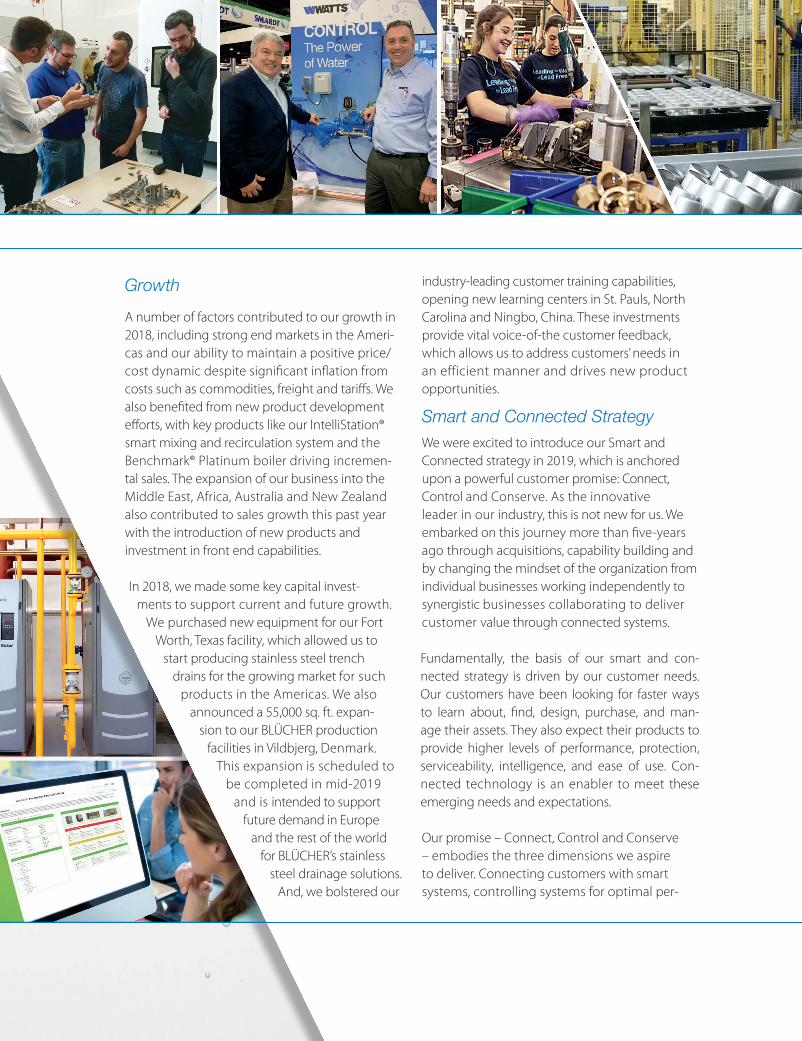
A number of factors contributed to our growth in 2018, including strong end markets in the Ameri-cas and our ability to maintain a positive price/ cost dynamic despite significant inflation from costs such as commodities, freight and tariffs. We also benefited from new product development efforts, with key products like our IntelliStation® smart mixing and recirculation system and the Benchmark® Platinum boiler driving incremen-tal sales. The expansion of our business into the Middle East, Africa, Australia and New Zealand also contributed to sales growth this past year with the introduction of new products and investment in front end capabilities.
In 2018, we made some key capital invest-ments to support current and future growth.
We purchased new equipment for our Fort Worth, Texas facility, which allowed us to
start producing stainless steel trench drains for the growing market for such
products in the Americas. We also announced a 55,000 sq. ft. expan-
sion to our BLÜCHER production facilities in Vildbjerg, Denmark.
This expansion is scheduled to be completed in mid-2019
and is intended to support future demand in Europe
and the rest of the world for BLÜCHER’s stainless
steel drainage solutions. And, we bolstered our
industry-leading customer training capabilities, opening new learning centers in St. Pauls, North Carolina and Ningbo, China. These investments provide vital voice-of-the customer feedback, which allows us to address customers’ needs in an efficient manner and drives new product opportunities.
Smart and Connected Strategy We were excited to introduce our Smart and Connected strategy in 2019, which is anchored upon a powerful customer promise: Connect, Control and Conserve. As the innovative leader in our industry, this is not new for us. We embarked on this journey more than five-years ago through acquisitions, capability building and by changing the mindset of the organization from individual businesses working independently to synergistic businesses collaborating to deliver customer value through connected systems.
Fundamentally, the basis of our smart and con-nected strategy is driven by our customer needs. Our customers have been looking for faster ways to learn about, find, design, purchase, and man-age their assets. They also expect their products to provide higher levels of performance, protection, serviceability, intelligence, and ease of use. Con-nected technology is an enabler to meet these emerging needs and expectations.
Our promise – Connect, Control and Conserve – embodies the three dimensions we aspire to deliver. Connecting customers with smart systems, controlling systems for optimal per-
934853narcx.indd 6 3/14/19 6:47 PM

2018
formance and conserving critical resources by increasing efficiency and driving sustainability. Our vision is clear: deliver superior customer value through smart and connected solutions.
In 2018, we began accelerating our efforts and invested over $10 million into smart and con-nected initiatives including IoT architecture development, launching our new Watts website and several new product development projects such as our SynctaSM mobile software solution and our SentryPlus Alert™ flood protection system.
Our goal is to derive 25 percent of our revenue from this strategy by 2023. Our teams around the globe are committed to achieving this goal. To put this in perspective, in 2014 our connected prod-uct sales were in the low single digits. We ended 2018 in the high single digits.
We intend to leverage our new connected products to expand the digital experiences that engineers, contractors and owners have with Watts. In the long-term, we will be ramping up our analytics capabilities to help drive continuous prod-uct improvement and new product concepts. We look forward to updating you on our progress as we continue to execute on our transformational strategic vision.
Corporate Social Responsibility Watts demonstrated its commitment to corporate social responsibility through our efforts to give back to the communities we serve and to protect the environment.
Many Watts products keep water systems safe, save energy and conserve water. In 2018, we standardized our RainCycle™ rainwater har-vesting product, which captures, stores, pumps, and treats rainwater for nonpotable reuse and reduces storm water runoff to sewers. Our modu-lar systems are customizable to match project needs and contribute to LEED certification. In fact, our RainCycle™ rainwater harvesting system is in use at our new training center in St. Pauls.
In 2018, we issued our second annual Sustain-ability Report, which details our commitment to Environmental, Social, and Governance (ESG) issues. We are proud of this year’s report, which includes more robust tracking of our company’s water consumption, greenhouse gas emissions and use of electricity, natural gas, propane, acety-lene, diesel and heating oil.
Last year, we advanced our global volunteer efforts to provide safe water to those in need. We entered our third year of partnership with Planet Water Foundation, a U.S.-based non-profit orga-nization that works to bring clean water to the world’s most disadvantaged communities. As part of this collaboration, Watts funded and assisted with the installation of four water filtration sys-tems in Puerto Rico and Cambodia.
Additionally, more than 80 employees volun-teered in 2018 to remove trash and other debris from the Merrimack River, which runs near our global headquarters in Massachusetts. The water-way has a strong connection to our company’s

roots and rich history and Watts is committed to protecting this important natural resource.
Moreover, local Watts sites around the world collectively donated hundreds of thousands of dollars to support a variety of charitable efforts and volunteered countless hours of time. Employ-ees raised awareness for social causes like breast cancer, child abuse, equal opportunity and mul-tiple sclerosis; donated supplies to food pantries, local schools and blood banks; and provided funding to assist disabled veterans.
Talent and Culture At Watts, we understand the importance of supporting our employees’ professional develop-ment by providing them with opportunities to learn new skills. We offer a variety of programs at
all levels and regions – from the factory floor to executive management – in an effort to
attract, build, and retain a strong workforce.
In 2018, we piloted “Manager as Coach” leadership and development pro-
grams for supervisors and managers. Based on positive feedback, Watts
will deploy additional programs throughout 2019. Moreover, in
November 2018, we gathered our top 100 leaders and
held a three-day conference where employees were trained in cross-cultural communication and business acumen.
We continue to work with colleges and univer-sities to support our global early-in-career programs (internships, co-ops and rotational). We also partnered with Lakes Region Com-munity College, where more than two dozen Franklin, New Hampshire-based employees earned Advanced Manufacturing Certificates.
We continued to make significant headway to promote our One Watts culture. In October 2018, we conducted a brief pulse survey as a follow-up to 2017’s global employee engagement survey. With a remarkable 80 percent response rate, we continue to drive employee engagement. We have plans to launch another comprehensive survey to all employees in late 2019.
Looking Ahead Over the last four years, we have made substan-tial progress in our journey to become a leaner, more customer-centric organization. We intend to maintain that focus while driving our smart and connected strategy to further address our customers’ needs. I am confident that our team will once again deliver on our commitments for 2019 and beyond.
Robert J. Pagano, Jr.
Chief Executive Officer and President

UNITED STATES SECURITIES AND EXCHANGE COMMISSION
Washington, D.C. 20549
FORM 10-K
ANNUAL REPORT PURSUANT TO SECTION 13 OR 15(d) OF THE SECURITIES EXCHANGE ACT OF 1934
For the fiscal year ended December 31, 2018
Or
TRANSITION REPORT PURSUANT TO SECTION 13 OR 15(d) OF THE SECURITIES EXCHANGE ACT OF 1934
Commission file number 001-11499
WATTS WATER TECHNOLOGIES, INC. (Exact name of registrant as specified in its charter)
Delaware 04-2916536 (State or Other Jurisdiction of (I.R.S. Employer Incorporation or Organization) Identification No.)
815 Chestnut Street, North Andover, MA 01845
(Address of Principal Executive Offices) (Zip Code)
Registrant’s telephone number, including area code: (978) 688-1811
Securities registered pursuant to Section 12(b) of the Act:
Title of Each Class Name of Each Exchange on Which Registered
Class A common stock, par value $0.10 per share New York Stock Exchange
Securities registered pursuant to Section 12(g) of the Act: None
Indicate by check mark if the registrant is a well-known seasoned issuer, as defined in Rule 405 of the Securities Act. Yes No
Indicate by check mark if the registrant is not required to file reports pursuant to Section 13 or Section 15(d) of the Exchange Act. Yes No
Indicate by check mark whether the registrant (1) has filed all reports required to be filed by Section 13 or 15(d) of the Securities Exchange Act of 1934 during the preceding 12 months (or for such shorter period that the registrant was required to file such reports), and (2) has been subject to such filing requirements for the past 90 days. Yes No
Indicate by check mark whether the registrant has submitted electronically every Interactive Data File required to be submitted pursuant to Rule 405 of Regulation S-T during the preceding 12 months (or for such shorter period that the registrant was required to submit and post such files). Yes No
Indicate by check mark if disclosure of delinquent filers pursuant to Item 405 of Regulation S-K is not contained herein, and will not be contained, to the best of registrant’s knowledge, in definitive proxy or information statements incorporated by reference in Part III of this Form 10-K or any amendment to this Form 10-K.
Indicate by check mark whether the registrant is a large accelerated filer, an accelerated filer, a non-accelerated filer, a smaller reporting company, or an emerging growth company. See the definitions of “large accelerated filer,” “accelerated filer,” “smaller reporting company,” and “emerging growth company” in Rule 12b-2 of the Exchange Act.
Large accelerated filer Accelerated filer Non-accelerated filer Smaller reporting company Emerging growth company
If an emerging growth company, indicate by check mark if the registrant has elected not to use the extended transition period for complying with any new or revised financial accounting standards provided pursuant to Section 13(a) of the Exchange Act.
Indicate by check mark whether the registrant is a shell company (as defined in Rule 12b-2 of the Exchange Act). Yes No
As of June 29, 2018, the aggregate market value of the registrant’s common stock held by non-affiliates of the registrant was approximately $2,164,731,408 based on the closing sale price as reported on the New York Stock Exchange.
Indicate the number of shares outstanding of each of the issuer’s classes of common stock, as of the latest practicable date.
Class Outstanding at January 27, 2019 Class A common stock, $0.10 par value per share 27,623,445 shares Class B common stock, $0.10 par value per share 6,329,290 shares
DOCUMENTS INCORPORATED BY REFERENCE
Portions of the Registrant’s Proxy Statement for its Annual Meeting of Stockholders to be held on May 17, 2019 are incorporated by reference into Part III of this Annual Report on Form 10-K.

2
TABLE OF CONTENTS Page
PART I.
Item 1. BUSINESS 3Item 1A. RISK FACTORS 11Item 1B. UNRESOLVED STAFF COMMENTS 18Item 2. PROPERTIES 18Item 3. LEGAL PROCEEDINGS 19Item 4. MINE SAFETY DISCLOSURES 19
PART II
Item 5. MARKET FOR REGISTRANT’S COMMON EQUITY, RELATED STOCKHOLDER MATTERS AND ISSUER PURCHASES OF EQUITY SECURITIES
19
Item 6. SELECTED FINANCIAL DATA 21Item 7. MANAGEMENT’S DISCUSSION AND ANALYSIS OF FINANCIAL CONDITION
AND RESULTS OF OPERATIONS
22
Item 7A. QUANTITATIVE AND QUALITATIVE DISCLOSURES ABOUT MARKET RISK 39Item 8. FINANCIAL STATEMENTS AND SUPPLEMENTARY DATA 40Item 9. CHANGES IN AND DISAGREEMENTS WITH ACCOUNTANTS ON
ACCOUNTING AND FINANCIAL DISCLOSURE 40Item 9A. CONTROLS AND PROCEDURES 40Item 9B. OTHER INFORMATION 43
PART III
Item 10. DIRECTORS, EXECUTIVE OFFICERS AND CORPORATE GOVERNANCE 44Item 11. EXECUTIVE COMPENSATION 44Item 12. SECURITY OWNERSHIP OF CERTAIN BENEFICIAL OWNERS AND
MANAGEMENT AND RELATED STOCKHOLDER MATTERS
44
Item 13. CERTAIN RELATIONSHIPS AND RELATED TRANSACTIONS, AND DIRECTOR INDEPENDENCE
45
Item 14. PRINCIPAL ACCOUNTING FEES AND SERVICES 45
PART IV Item 15. EXHIBITS, FINANCIAL STATEMENT SCHEDULES 46Item 16. FORM 10-K SUMMARY. 46 EXHIBIT INDEX 86SIGNATURES 89

3
PART I
Item 1. BUSINESS. This Annual Report on Form 10-K contains statements that are not historical facts and are considered forward-looking within the meaning of the Private Securities Litigation Reform Act of 1995. These forward-looking statements contain projections of our future results of operations or our financial position or state other forward-looking information. In some cases you can identify these forward-looking statements by words such as “anticipate,” “believe,” “could,” “estimate,” “expect,” “intend,” “may,” “should,” and “would” or similar words. You should not rely on forward-looking statements because they involve known and unknown risks, uncertainties and other factors, some of which are beyond our control. These risks, uncertainties and other factors may cause our actual results, performance or achievements to differ materially from the anticipated future results, performance or achievements expressed or implied by the forward-looking statements. Some of the factors that might cause these differences are described under Item 1A — “Risk Factors.” You should carefully review all of these factors, and you should be aware that there may be other factors that could cause these differences. These forward-looking statements were based on information, plans and estimates at the date of this report, and, except as required by law, we undertake no obligation to update any forward-looking statements to reflect changes in underlying assumptions or factors, new information, future events or other changes.
In this Annual Report on Form 10-K, references to “the Company,” “Watts Water,” “we,” “us” or “our” refer to Watts Water Technologies, Inc. and its consolidated subsidiaries.
Overview Watts Regulator Co. was founded by Joseph E. Watts in 1874 in Lawrence, Massachusetts. Watts Regulator Co. started as a small machine shop supplying parts to the New England textile mills of the 19th century and grew into a global manufacturer of products and systems focused on the control, conservation and quality of water and the comfort and safety of the people using it. Watts Water Technologies, Inc. was incorporated in Delaware in 1985 and is the parent company of Watts Regulator Co.
Our strategy is to be the preferred supplier of differentiated products, solutions and systems that manage and conserve the flow of fluids and energy into, through and out of buildings in the commercial and residential markets of the Americas, Europe, and Asia-Pacific, Middle East and Africa (“APMEA”), our three geographic segments. Within this framework, we focus upon three themes: safety & regulation, energy efficiency and water conservation. This strategy enables us to continue to increase our earnings via sales growth, both organic and inorganic, and the systematic reduction of manufacturing costs and operational expenses.
We intend to continue to expand organically by introducing new complementary products and solutions in existing markets, by enhancing our preferred brands, by promoting plumbing code development to drive the need for safety and quality products and by continually improving merchandising in our wholesale distribution channels. We focus on selling solutions to our customers that integrate a variety of our product offerings. We target selected new products and geographic markets based on growth potential, including our ability to leverage our existing distribution channels. Additionally, we leverage our distribution channels through the introduction of new products and solutions, as well as the integration of products of our acquired companies. The Internet of Things “IoT” has allowed companies to transform components into smart and connected devices. Over the last few years we have been building our smart and connected foundation by expanding our internal capabilities and making strategic acquisitions. In 2018, we began accelerating our efforts and initiatives related to our Smart and Connected strategy by investing in IoT architecture development, enhancing digital tools used by our customers, and launching our new Watts’ website and several new smart and connected product development projects. Our strategy is to deliver superior customer value through smart and connected products and solutions. The strategy we will focus on has three dimensions: Connect, Control and Conserve. We intend to introduce products that will connect our customers with smart systems, control systems for optimal performance, and conserve critical resources by increasing operability, efficiency and safety. Our goal is to derive 25 percent of our revenue from smart and connected products by 2023.
We intend to continue to generate incremental growth by targeting selected acquisitions, both in our core markets as well as new complementary markets. We have completed 11 acquisitions in the last decade. Our acquisition strategy focuses
4
on businesses that manufacture preferred brand name products that address our themes of safety & regulation, energy efficiency and water conservation in our primary or related complementary markets. We target businesses that will provide us with one or more of the following: an entry into new markets, an increase in shelf space with existing customers, strong brand names, a new or improved technology or an expansion of the breadth of our product and solution offerings.
We are committed to reducing our manufacturing and operating costs using Lean methodologies to drive improvement across all key processes. We have a number of manufacturing facilities in lower-cost regions. In recent years, we have announced global restructuring plans which reduced our manufacturing and distribution footprint in order to reduce our costs and to realize incremental operating efficiencies.
Additionally, a majority of our manufacturing facilities are ISO 9000, 9001 or 9002 certified by the International Organization for Standardization.
The majority of our sales are for products that have been approved under regulatory standards incorporated into state and municipal plumbing, heating, building and fire protection codes in the Americas, Europe, and certain countries within APMEA. We have consistently advocated for the development and enforcement of plumbing codes and are committed to providing products to meet these standards. Products We have a broad range of products in terms of design distinction, size and configuration. We classify our many products into four global product lines. These product lines are:
• Residential & commercial flow control products—includes products typically sold into plumbing and hot
water applications such as backflow preventers, water pressure regulators, temperature and pressure relief valves, and thermostatic mixing valves. Residential & commercial flow control products accounted for approximately 52% of our total sales in 2018 and 2017, and 56% of our total sales in 2016.
• HVAC & gas products—includes commercial high-efficiency boilers, water heaters and heating solutions, hydronic and electric heating systems for under-floor radiant applications, custom heat and hot water solutions, hydronic pump groups for boiler manufacturers and alternative energy control packages, and flexible stainless steel connectors for natural and liquid propane gas in commercial food service and residential applications. HVAC & gas products accounted for approximately 32% of our total sales in 2018 and 2017, and 29% of our total sales in 2016. HVAC is an acronym for heating, ventilation and air conditioning.
• Drainage & water re-use products—includes drainage products and engineered rain water harvesting solutions for commercial, industrial, marine and residential applications. Drainage & water re-use products accounted for approximately 10% of our total sales in 2018 and 2017, and 9% of our total sales in 2016.
• Water quality products—includes point-of-use and point-of-entry water filtration, conditioning and scale
prevention systems for both commercial and residential applications. Water quality products accounted for 6% of our total sales in 2018, 2017 and 2016.
Commercial and Operational Excellence We strive to invest in product innovation that meets the wants and needs of our customers. Our focus is on differentiated products and solutions that will provide greater opportunity to distinguish and defend ourselves in the market place. Conversely, we continue to migrate away from commoditized products where we cannot add value. Our goal is to be a solutions provider, not merely a components supplier. We refer to this customer-facing mindset as commercial excellence, and we are continually looking for strategic opportunities to invest or divest, where necessary, in order to meet those objectives. In conjunction with this customer-centric focus, we continually review our operations to ensure we can efficiently and effectively produce and deliver products to customers. We are striving to simplify our administrative operations as well to drive further efficiencies. We call this aspect of our business operational excellence.
5
Customers and Markets We sell our products to plumbing, heating and mechanical wholesale distributors and dealers, original equipment manufacturers (OEMs), specialty product distributors, and major DIY chains. Wholesalers. Approximately 61%, 63%, and 57% of our sales in 2018, 2017, and 2016, respectively, were to wholesale distributors for commercial and residential applications.
OEMs. Approximately 15%, 16%, and 21% of our sales in 2018, 2017, and 2016, respectively, were to OEMs. In the Americas, our typical OEM customers are water heater manufacturers and equipment and water systems manufacturers needing flow control devices and other products. Our sales to OEMs in Europe are primarily to boiler manufacturers and radiant system manufacturers. Our sales to OEMs in APMEA are primarily to water heater, air conditioning, and appliance manufacturers.
Specialty. Approximately 20%, 17%, and 18%, of our sales in 2018, 2017, and 2016, respectively, were through our specialty channel. The specialty channel primarily includes sales related to high-efficiency boilers and water heaters, water filtration and conditioning products, specialty floor and tile products, and food service products. DIY Chains. Approximately 4% of our sales in 2018, 2017, and 2016 were to DIY chains. The DIY channel primarily includes sales related to ball valve and a portion of our water quality products. In 2018, 2017 and 2016, no customer accounted for more than 10% of our total net sales. Our top ten customers accounted for approximately $329.5 million, or 21.1%, of our total net sales in 2018; $300.6 million, or 21%, of our total net sales in 2017; and $275.2 million, or 20%, of our total net sales in 2016. Thousands of other customers constituted the balance of our net sales in each of those years.
Marketing and Sales For product sales in the Americas, we rely primarily on commissioned manufacturers’ representatives to market our product lines, some of which maintain a consigned inventory of our products. These representatives sell primarily to plumbing and heating wholesalers and contractors or supply DIY stores. Our specialty channel products in the Americas are sold through independent representatives, dealers and distributors. We also sell products directly to wholesalers, OEMs and private label accounts primarily in Europe and APMEA, and, to a lesser extent, in the Americas. Manufacturing We have integrated and automated manufacturing capabilities, including a state of the art lead-free foundry and a traditional brass and bronze foundry, machining, plastic extrusion and injection molding and assembly operations. Our foundry operations include metal pouring systems, automatic core making, and brass and bronze die-castings. Our machining operations feature computer-controlled machine tools, high-speed chucking machines with robotics, robotic assembly capability, laser cutting technology, and automatic screw machines for machining bronze, brass and steel components. Our heating and hot water product manufacturing capabilities include all phases of light and heavy gage metal fabrication including laser cutting and the latest technology welding and brazing processes including automated and robotic applications, as well as metal finishing including chemical passivation of stainless steel. We have invested in recent years to expand our manufacturing capabilities and to adopt the most efficient and productive equipment. We are committed to maintaining our manufacturing equipment at a level consistent with current technology in order to maintain high levels of quality and manufacturing efficiencies. In 2018, we continued to invest in our systems and in our manufacturing and training facilities.
Capital expenditures and depreciation for each of the last three years were as follows:
Years Ended December 31, 2018 2017 2016 (in millions)
Capital expenditures $ 35.9 $ 29.4 $ 36.0 Depreciation $ 28.9 $ 29.7 $ 30.4

6
Raw Materials We require substantial amounts of raw materials to produce our products, including bronze, brass, cast iron, stainless steel, steel, plastic, and other materials used in our products. Substantially all of the raw materials we require are purchased from outside sources. The commodity markets have experienced volatility over the past several years, including the imposition of tariffs, particularly with respect to copper and stainless steel. Tariffs could increase the cost of our products and the components and raw materials that go into manufacturing them. These increased costs could adversely impact the gross margin we earn on our products. Because we internationally source a significant amount of raw materials, several months of raw materials and work in process are moving through our supply chain at any point in time. We are not able to predict whether commodity costs, including copper and stainless steel, will significantly increase or decrease in the future. If commodity costs increase in the future and we are not able to reduce or eliminate the effect of the cost increases by reducing production costs or implementing price increases, our profit margins could decrease. If commodity costs were to decline, we may experience pressures from customers to reduce our selling prices. The timing of any price reductions and decreases in commodity costs may not align. As a result, our margins could be affected.
With limited exceptions, we have multiple suppliers for our commodities and other raw materials. We believe our relationships with our key suppliers are good and that an interruption in supply from any one supplier would not materially affect our ability to meet our immediate demands while another supplier is qualified. We regularly review our suppliers to evaluate their strengths. If a supplier is unable to meet our demands, we believe that in most cases our inventory of raw materials will allow for sufficient time to identify and obtain the necessary commodities and other raw materials from an alternate source. We believe that the nature of the commodities and other raw materials used in our business are such that multiple sources are generally available in the market.
Code Compliance Products representing a majority of our sales are subject to regulatory standards and code enforcement, which typically require that these products meet stringent performance criteria. Standards in the Americas are established by such industry test and certification organizations as the American Society of Mechanical Engineers (ASME), the America Water Works Association (AWWA), the Canadian Standards Association (CSA), the American Society of Sanitary Engineering (ASSE), the American National Standards Institute—Leadership in Energy & Environmental Design (LEED), the University of Southern California Foundation for Cross-Connection Control and Hydraulic Research (USC FCCC & HR), FM Global (FM), NSF International (NSF) and Underwriters Laboratories (UL), the National Board (NB), the Environmental Protection Agency (EPA), and the Californian Energy Commission (CEC). International standards are established by such organizations as the International Code Council (ICC) and the International Association of Plumbing and Mechanical Officials (IAPMO). Many of these standards are incorporated into state and municipal plumbing and heating, building and fire protection codes.
National regulatory standards in Europe vary by country. The major standards and/or guidelines that our products must meet are AFNOR (France), DVGW (Germany), UNI/ICIM (Italy), KIWA (Netherlands), SVGW (Switzerland), SITAC (Sweden), WRAS (United Kingdom) and CEN (Denmark). Further, there are local regulatory standards requiring compliance as well.
We have consistently advocated for the development and enforcement of plumbing codes. We maintain stringent quality control and testing procedures at each of our manufacturing facilities in order to manufacture products that comply with code requirements. We believe that product-testing capability and investment in plant and equipment are needed to manufacture products that comply with code requirements. Our product-testing capabilities and dedicated investments are areas of strength for us. Additionally, a majority of our manufacturing facilities are ISO 9000, 9001 or 9002 certified by the International Organization for Standardization.
New Product Development and Engineering We retain our own product development staff, design teams, and testing laboratories in the Americas, Europe and APMEA that work to enhance our existing products and develop new products and solutions. We maintain sophisticated product development and testing laboratories and are committed to investing more in this area. We have a new-product development program that is used globally to drive, manage and invest in innovation and product offerings. In 2016 and 2017, we continued to drive innovation to our markets, including the successful roll out of the IntelliStation™ smart

7
mixing and recirculation system and the AERCO Benchmark® Platinum boiler. In 2018 we launched the IntelliStation Jr™ digital mixing valve to further our digital mixing product lines as well as a number of new drains products (cast iron and stainless steel). We continued to focus and invest in our global program to leverage our electronics capabilities to drive our Smart and Connected Strategy.
Competition The domestic and international markets for energy efficient products, water conservation devices, and products that address the safety & regulation for the flow of fluids, are intensely competitive and require us to compete against some companies possessing greater financial, marketing and other resources than ours. Due to the breadth of our product offerings, the number and identities of our competitors vary by product line and market. We consider quality, brand preference, delivery times, engineering specifications, plumbing code requirements, price, technological expertise, breadth of product offerings and integrated solutions offerings to be the primary competitive factors. We believe that new product development and product engineering are also important to success in the water industry and that our position in the industry is attributable in part to our ability to develop new and innovative products quickly and to adapt and enhance existing products. We continue to develop new and innovative products to enhance our market position and are continuing to implement manufacturing and design programs to reduce costs. We cannot be certain that our efforts to develop new products will be successful or that our customers will accept our new products. Although we own certain patents and trademarks that we consider to be of importance, we do not believe that our business and competitiveness as a whole are dependent on any one of our patents or trademarks or on patent or trademark protection generally.
Backlog Backlog was approximately $103.2 million at January 27, 2019 and approximately $86.3 million at January 28, 2018. We do not believe that our backlog at any point in time is indicative of future operating results and we expect our entire current backlog to be converted to sales in 2019.
Employees As of December 31, 2018, we employed approximately 4,800 people worldwide. With the exception of two subsidiaries, one in Canada and the other in New York, none of our employees in the Americas or APMEA are covered by collective bargaining agreements. In some European countries, our employees are subject to traditional national collective bargaining agreements. We believe that our employee relations are good.
Product Liability, Environmental and Other Litigation Matters We are subject to a variety of potential liabilities connected with our business operations, including potential liabilities and expenses associated with possible product defects or failures and compliance with environmental laws. We maintain product liability and other insurance coverage, which we believe to be generally in accordance with industry practices. Nonetheless, such insurance coverage may not be adequate to protect us fully against substantial damage claims. See “Item 1A. Risk Factors” and Note 16 of the Notes to the Consolidated Financial Statements, both of which are incorporated herein by reference. Environmental Remediation We have been named as a potentially responsible party with respect to a limited number of identified contaminated sites. The levels of contamination vary significantly from site to site as do the related levels of remediation efforts. Environmental liabilities are recorded based on the most probable cost, if known, or on the estimated minimum cost of remediation. Accruals are not discounted to their present value, unless the amount and timing of expenditures are fixed and reliably determinable. We accrue estimated environmental liabilities based on assumptions, which are subject to a number of factors and uncertainties. Circumstances that can affect the reliability and precision of these estimates include identification of additional sites, environmental regulations, level of clean-up required, technologies available, number and financial condition of other contributors to remediation and the time period over which remediation may occur. We recognize changes in estimates as new remediation requirements are defined or as new information becomes available. See Note 16 of the Notes to the Consolidated Financial Statements. See “Item 1A. Risk Factors” and Note 16 of the Notes to the Consolidated Financial Statements, both of which are incorporated herein by reference.

8
Asbestos Litigation We are defending approximately 300 lawsuits in different jurisdictions, alleging injury or death as a result of exposure to asbestos. The complaints in these cases typically name a large number of defendants and do not identify any of our particular products as a source of asbestos exposure. To date, discovery has failed to yield evidence of substantial exposure to any of our products and no judgments have been entered against us.
Other Litigation Other lawsuits and proceedings or claims, arising from the ordinary course of operations, are also pending or threatened against us.
Available Information We maintain a website with the address www.wattswater.com. The information contained on our website is not included as a part of, or incorporated by reference into, this Annual Report on Form 10-K. Other than an investor’s own internet access charges, we make available free of charge through our website our Annual Report on Form 10-K, quarterly reports on Form 10-Q and current reports on Form 8-K, and amendments to these reports, as soon as reasonably practicable after we have electronically filed such material with, or furnished such material to, the Securities and Exchange Commission (SEC).
Executive Officers and Directors Set forth below are the names of our executive officers and directors, their respective ages and positions with our Company and a brief summary of their business experience for at least the past five years:
Executive Officers Age Position
Robert J. Pagano, Jr. 56 Chief Executive Officer, President and Director
Shashank Patel 58 Chief Financial Officer Jennifer L. Congdon 49 Chief Human Resources Officer Kenneth R. Lepage
48
General Counsel, Executive Vice President & Secretary
Elie A. Melhem
55 President, Asia-Pacific, the Middle East & Africa
Munish Nanda 54 President, Americas & Europe Non-Employee Directors Christopher L. Conway(2)(3) 63 Director David A. Dunbar(1)(3) 57 Director Louise K. Goeser(2)(3) 65 Director Jes Munk Hansen(2)(3) 51 Director W. Craig Kissel(3) 68 Chairman of the Board and Director Joseph T. Noonan 37 Director Merilee Raines(1)(3) 63 Director Joseph W. Reitmeier(1)(3) 54 Director
(1) Member of the Audit Committee (2) Member of the Compensation Committee (3) Member of the Nominating and Corporate Governance Committee
Robert J. Pagano, Jr. has served as Chief Executive Officer, President and a director of our Company since May 2014. He also served as interim Chief Financial Officer from October 2014 to April 2015 and from April 2018 to July 2018. Mr. Pagano previously served as Senior Vice President of ITT Corporation and President, ITT Industrial Process from April 2009 to May 2014. Mr. Pagano originally joined ITT in 1997 and served in several additional management roles during his career at ITT, including as Vice President Finance, Corporate Controller, and President of Industrial Products.

9
ITT Corporation is a diversified manufacturer of highly engineered critical components and customized technology solutions for the energy, transportation and industrial markets. Prior to joining ITT, Mr. Pagano worked at KPMG LLP. Mr. Pagano is a Certified Public Accountant. Mr. Pagano has also served as a member of the Board of Directors of Applied Industrial Technologies, Inc. since August 2017. Applied Industrial Technologies is a distributor of bearings, power transmission products, fluid power components and other industrial supplies and provides engineering, design and systems integration for industrial and fluid power applications, as well as customized mechanical, fabricated rubber and fluid power shop services.
Shashank Patel has served as Chief Financial Officer of our Company since July 2018. Mr. Patel previously worked at Xylem Inc. from the time of its spin-off from ITT Corporation in 2011 until June 2018. While at Xylem, Mr. Patel served as Vice President, Finance for Xylem Applied Water Systems, Dewatering and the America’s Commercial Team from July 2017 to June 2018, Integration Leader for the Sensus business from August 2016 to June 2017, Vice President, Finance for Global Operations from April 2016 to July 2016, Interim Chief Financial Officer of Xylem from July 2015 to March 2016, and Vice President, Finance for the Applied Water Systems division from 2011 to July 2015. Mr. Patel also served in several leadership roles in finance, operations and engineering at ITT from 1996 until the spin-off of Xylem in 2011. Xylem is a global designer, manufacturer and equipment and service provider for water and wastewater applications.
Jennifer L. Congdon has served as Chief Human Resources Officer since December 2016. Ms. Congdon previously served as Vice President, Human Resources, Applied Water Systems and Business Transformation and Continuous Improvement with Xylem Inc. from August 2012 to December 2016. Xylem is a global designer, manufacturer and equipment and service provider for water and wastewater applications. From 2010 to August 2012, Ms. Congdon served as Vice President, Human Resources, Power Transmission for Rexnord Corporation. Rexnord Corporation is a multi - industry manufacturer and marketer of highly engineered mechanical power transmission components and water management products. From 2004 to 2010, Ms. Congdon held several human resources management positions of increasing responsibility with Honeywell International Inc. Prior to joining Honeywell, Ms. Congdon was a Human Resources Manager with Cisco Systems, Inc. and worked as a human resources consultant.
Kenneth R. Lepage has served as General Counsel, Executive Vice President and Secretary of the Company since August 2008. He also served as Executive Vice President of Human Resources from December 2009 to October 2015. Mr. Lepage originally joined our Company in September 2003 as Assistant General Counsel and Assistant Secretary. Prior to joining our Company, he was a junior partner at the law firm of Hale and Dorr LLP (now Wilmer Cutler Pickering Hale and Dorr LLP).
Elie A. Melhem has served as President, Asia Pacific, Middle East & Africa since February 2016. Mr. Melhem originally joined our Company in July 2011 as President, Asia Pacific. Mr. Melhem was previously the Managing Director of China for Ariston Thermo Group, a global manufacturer of heating and hot water products, from 2008 to July 2011. Prior to joining Ariston, Mr. Melhem spent eleven years with ITT Industries in China where he held several management positions, including serving as President of ITT’s Residential and Commercial Water Group in China and President of ITT’s Water Technology Group in Asia.
Munish Nanda has served as President, Americas & Europe since February 2016. Mr. Nanda originally joined our Company in April 2015 as President, Americas. Mr. Nanda previously served as President of Control Technologies for ITT Corporation from April 2011 to March 2015. Mr. Nanda also served as Group Vice President of ITT Corporation’s Fluid and Motion Control Group from April 2008 to April 2011. ITT Corporation is a diversified manufacturer of highly engineered critical components and customized technology solutions for the energy, transportation and industrial markets. Prior to joining ITT Corporation, Mr. Nanda held several operating leadership and general management positions with Thermo Fisher Scientific Corporation and Honeywell International Inc. Mr. Nanda has also served as a member of the Board of Directors of CECO Environmental Corp. since June 2018. CECO Environmental provides air quality and fluid handling products and solutions serving the energy, industrial and other niche markets. Christopher L. Conway has served as a director of our Company since June 2015. Mr. Conway was President, Chief Executive Officer and Chairman of the Board of CLARCOR Inc. from December 2011 until it was acquired in February 2017. Mr. Conway is now retired. Mr. Conway originally joined CLARCOR in 2006 and served in several senior management roles prior to becoming President and Chief Executive Officer, including Chief Operating Officer, President of CLARCOR’s PECOFacet division, President of Facet USA, Inc., an affiliate of CLARCOR, and Vice President of Manufacturing of Baldwin Filters, Inc., another affiliate of CLARCOR. CLARCOR was a diversified

10
marketer and manufacturer of mobile, industrial and environmental filtration products sold in domestic and international markets. Prior to joining CLARCOR, Mr. Conway served for two years as the Chief Operating Officer of Cortron Corporation, Inc., a manufacturing start-up based in Minneapolis, Minnesota. Mr. Conway also served for seven years in various management positions at Pentair, Inc., an international provider of products, services, and solutions for its customers' diverse needs in water and other fluids, thermal management, and equipment protection. David A. Dunbar has served as a director of our Company since February 2017. Mr. Dunbar has served as President and Chief Executive Officer and a member of the Board of Directors of Standex International Corporation since January 2014, and as Chairman since October 2016. Standex is a global, multi-industry manufacturer in five broad business segments: Food Service Equipment Group, Engineering Technologies Group, Engraving Group, Electronics Group, and Hydraulics Group. Mr. Dunbar previously served as President of the valves and controls global business unit of Pentair Ltd. from October 2009 to December 2013. The unit was initially owned by Tyco Flow Control and Tyco Flow Control and Pentair merged in 2012. Pentair is a global provider of products and services relating to energy, water, thermal management and equipment protection. Prior to his tenure at Pentair, Mr. Dunbar held a number of senior positions at Emerson Electric Co., including President of each of the following: Emerson Process Management Europe; Machinery Health Management; and Emerson Climate Technologies Refrigeration. Louise K. Goeser has served as a director of our Company since March 2018. Ms. Goeser served as President and Chief Executive Officer of Grupo Siemens S.A. de C.V. from March 2009 until her retirement in May 2018. In this position, Ms. Goeser was responsible for Siemens Mesoamérica, which is the Mexican, Central American and Caribbean unit of multinational Siemens AG, a global engineering company operating in the industrial, energy and healthcare sectors. Ms. Goeser previously served as President and Chief Executive Officer of Ford of Mexico from January 2005 to November 2008. Prior to this position, she served as Vice President, Global Quality for Ford Motor Company from 1999 to 2005. Prior to 1999, Ms. Goeser served as General Manager, Refrigeration and Vice President, Corporate Quality at Whirlpool Corporation and held various leadership positions with Westinghouse Electric Corporation. Ms. Goeser has served as a member of the Board of Directors of MSC Industrial Direct Co., Inc. since December 2009. MSC is a North American distributor of metal working and maintenance, repair, and operations products and services. Ms. Goeser previously served as a member of the boards of directors of Talen Energy from June 2015 to December 2016, PPL Corporation from March 2003 to June 2015, and Witco Corporation from 1997 to 1999.
Jes Munk Hansen has served as a director of our Company since February 2017. He most recently served as Chief Executive Officer OSRAM USA and Head of Global Sales for OSRAM GmbH from July 2018 to January 2019. OSRAM is a global lighting manufacturer with a portfolio ranging from high-tech applications based on semiconductor technology to smart and connected lighting solutions in buildings and cities. It has been announced that Mr. Hansen will join Terma A/S on April 1, 2019 and become President and Chief Executive Officer of Terma effective June 1, 2019. Terma develops and manufactures mission-critical products and solutions for the aerospace, defense and security sectors. Mr. Hansen previously served as Chief Executive Officer of LEDVANCE GmbH from July 2015 to December 2017. LEDVANCE is the general lighting lamps business unit of OSRAM GmbH. Prior to his tenure at LEDVANCE, Mr. Hansen served as Chief Executive Officer of the classical lamps and ballast business unit of OSRAM from January 2015 to July 2015 and as Chief Executive Officer of OSRAM Americas and President of OSRAM Sylvania from October 2013 to January 2015. Prior to his tenure at OSRAM, Mr. Hansen served in several senior management roles with Grundfos from 2000 to October 2013, including as Chief Executive Officer and President of Grundfos North America from 2007 to October 2013. Grundfos is a leading global manufacturer of pumps as well as motors and electronics for monitoring and controlling pumps. W. Craig Kissel has served as a director of our Company since October 2011. Mr. Kissel previously was employed by American Standard Companies Inc. from 1980 until his retirement in September, 2008. American Standard was a leading worldwide supplier of air conditioning and heating systems, vehicle control systems, and bathroom china and faucet ware. During his time at American Standard, Mr. Kissel served as President of Trane Commercial Systems from 2004 to June, 2008, President of WABCO Vehicle Control Systems from 1998 to 2003, President of the Trane North American Unitary Products Group from 1994 to 1997, Vice President of Trane Marketing of the North American Unitary Products Group from 1992 to 1994 and held various other management positions at Trane from 1980 to 1991. From 2001 to 2008, Mr. Kissel served as Chairman of American Standard’s Corporate Ethics and Integrity Council, which was responsible for developing the company’s ethical business standards. Mr. Kissel also served in the U.S. Navy from 1973 to 1978. Mr. Kissel served as a director of Chicago Bridge & Iron Company from May 2009 until its merger with McDermott International, Inc. in May 2018 and Mr. Kissel has served as a member of the board of directors of

11
McDermott International since the merger. McDermott International is a global provider of technology, engineering and construction solutions for the energy industry. Joseph T. Noonan has served as a director of our Company since May 2013. Mr. Noonan is currently an active entrepreneur, investor and start-up advisor. From November 2013 to January 2018, Mr. Noonan served as Chief Executive Officer of Homespun Design, Inc., an online marketplace for American-made furniture and home accents. Mr. Noonan previously worked as an independent digital strategy consultant from November 2012 to November 2013. Mr. Noonan was employed by Wayfair LLC from April 2008 to November 2012. During his time at Wayfair, Mr. Noonan served as Senior Director of Wayfair International from June 2011 to November 2012, Director of Category Management and Merchandising from February 2009 to June 2011 and Manager of Wayfair’s Business-to-Business Division from April 2008 to February 2009. Wayfair is an online retailer of home furnishings, décor and home improvement products. Prior to joining Wayfair, Mr. Noonan worked as a venture capitalist at Polaris Partners and as an investment banker at Cowen & Company. Merilee Raines has served as a director of our Company since February 2011. Ms. Raines served as Chief Financial Officer of IDEXX Laboratories, Inc. from October 2003 until her retirement in May 2013. Prior to becoming Chief Financial Officer, Ms. Raines held several management positions with IDEXX Laboratories, including Corporate Vice President of Finance, Vice President and Treasurer of Finance, Director of Finance, and Controller. IDEXX Laboratories develops, manufactures and distributes diagnostic and information technology based products and services for companion animals, livestock, poultry, water quality and food safety, and human point of care diagnostics. Ms. Raines served as a member of the Board of Directors of Affymetrix, Inc., a provider of life science and molecular diagnostic products that enable analysis of biological systems at the gene, protein and cell level, from January 2015 until it was acquired in March 2016. Ms. Raines is currently a member of the Board of Directors of Aratana Therapeutics, Inc., a pet therapeutics company focused on licensing, developing and commercializing biopharmaceutical products for companion animals. Ms. Raines also serves as a member of the Board of Directors of Benchmark Electronics, Inc., a worldwide provider of engineering services, integrated technology solutions and electronic manufacturing services.
Joseph W. Reitmeier has served as a director of our Company since February 2016. Mr. Reitmeier has served as Executive Vice President & Chief Financial Officer of Lennox International Inc. since July 2012. Mr. Reitmeier had served as Vice President of Finance for the LII Commercial business segment of Lennox International from 2007 to July 2012 and as Director of Internal Audit from 2005 to 2007. Lennox International is a leading global provider of climate control solutions and designs, manufactures and markets a broad range of products for the heating, ventilation, air conditioning and refrigeration markets. Before joining Lennox International, Mr. Reitmeier held financial leadership roles at Cummins Inc. and PolyOne Corporation.
Item 1A. RISK FACTORS. Economic cycles, particularly those involving reduced levels of commercial and residential starts and remodeling, may have adverse effects on our revenues and operating results. We have experienced and expect to continue to experience fluctuations in revenues and operating results due to economic and business cycles. The businesses of most of our customers, particularly plumbing and heating wholesalers and OEM manufacturers, are cyclical. Therefore, the level of our business activity has been cyclical, fluctuating with economic cycles. An economic downturn may also affect the financial stability of our customers, which could affect their ability to pay amounts owed to their vendors, including us. We also believe our level of business activity is influenced by commercial and residential starts and renovation and remodeling, which are, in turn, heavily influenced by interest rates, consumer debt levels, changes in disposable income, employment growth and consumer confidence. Credit market conditions may prevent commercial and residential builders or developers from obtaining the necessary capital to continue existing projects or to start new projects. This may result in the delay or cancellation of orders from our customers or potential customers and may adversely affect our revenues and our ability to manage inventory levels, collect customer receivables and maintain profitability. If economic conditions worsen in the future or if economic recovery were to dissipate, our revenues and profits could decrease or trigger additional goodwill, indefinite-lived intangible assets, or long-lived asset impairments and could have a material effect on our financial condition and results of operations.
12
We face intense competition and, if we are not able to respond to competition in our markets, our revenues and profits may decrease. Competitive pressures in our markets could adversely affect our competitive position, leading to a possible loss of market share or a decrease in prices, either of which could result in decreased revenues and profits. We encounter intense competition in all areas of our business. Additionally, we believe our customers are attempting to reduce the number of vendors from which they purchase in order to reduce the size and diversity of their inventories and their transaction costs. To remain competitive, we will need to invest continually in manufacturing, product development, marketing, customer service and support and our distribution networks. We may not have sufficient resources to continue to make such investments and we may be unable to maintain our competitive position. In addition, we may have to reduce the prices of some of our products to stay competitive, potentially resulting in a reduction in the profit margin for, and inventory valuation of, these products. Some of our competitors are based in foreign countries and have cost structures and prices in foreign currencies. Accordingly, currency fluctuations could cause our U.S. dollar costed products to be less competitive than our competitors’ products costed in other currencies.
Changes in the costs of raw materials, including the imposition of tariffs, could reduce our profit margins. Reductions or interruptions in the supply of components or finished goods from international sources could adversely affect our ability to meet our customer delivery commitments. We require substantial amounts of raw materials, including bronze, brass, cast iron, stainless steel and plastic, and substantially all of the raw materials we require are purchased from outside sources. The costs of raw materials may be subject to change due to, among other things, interruptions in production by suppliers, changes in exchange rates, imposition of tariffs, and worldwide price and demand levels. We typically do not enter into long-term supply agreements. Our inability to obtain supplies of raw materials for our products at favorable costs could have a material adverse effect on our business, financial condition or results of operations by decreasing our profit margins. The commodity markets have experienced tremendous volatility over the past several years, including the imposition of tariffs, particularly copper and stainless-steel. Should commodity costs increase substantially, we may not be able to recover such costs, through selling price increases to our customers or other product cost reductions, which would have a negative effect on our financial results. If commodity costs decline, we may experience pressure from customers to reduce our selling prices. Additionally, we continue to purchase increased levels of components and finished goods from international sources. In limited cases, these components or finished goods are single-sourced. The availability of components and finished goods from international sources could be adversely impacted by, among other things, interruptions in production by suppliers, suppliers’ allocations to other purchasers and new laws, tariffs, or regulations. We are subject to risks associated with changing technology, manufacturing techniques, distribution channels and business continuity, which could place us at a competitive disadvantage. The successful implementation of our business strategy requires us to continually evolve our existing products and introduce new products to meet customers’ needs in the industries we serve. Our products are characterized by stringent performance and specification requirements that mandate a high degree of manufacturing and engineering expertise. If we fail to meet these requirements, our business could be at risk. We believe that our customers rigorously evaluate their suppliers on the basis of a number of factors, including product quality, price competitiveness, technical and manufacturing expertise, development and product design capability, new product innovation, reliability and timeliness of delivery, operational flexibility, customer service and overall management. Our success will depend on our ability to continue to meet customers’ changing specifications with respect to these criteria. We cannot ensure that we will be able to address technological advances or introduce new products that may be necessary to remain competitive within our business. We cannot ensure that we can adequately protect any of our technological developments to produce a sustainable competitive advantage. Furthermore, we may be subject to business continuity risk in the event of an unexpected loss of a material facility or operation. We cannot ensure that we adequately protect against such loss.
Our business and financial performance may be adversely affected by information technology and other business disruptions. Our business may be impacted by disruptions, including information technology attacks or failures, threats to physical security, as well as damaging weather or other acts of nature, pandemics or other public health crises. Cyber security attacks, in particular, are evolving and include, but are not limited to, malicious software, attempts to gain unauthorized access to data, and other electronic security breaches that could lead to disruptions in systems, unauthorized release of

13
confidential or otherwise protected information and corruption of data. Cyber security may also be breached due to employee error, malfeasance, system errors or vulnerabilities, including vulnerabilities of our customers, vendors, suppliers, and their products. In addition, we have designed products and services that connect to and are part of the “Internet of Things” which may also be vulnerable to cyber security breaches. We attempt to provide adequate security measures to safeguard our products from cyber security attacks, however the potential for a breach remains. We have experienced cyber security attacks and may continue to experience them going forward, potentially with more frequency. Given the unpredictability of the timing, nature and scope of such disruptions, we could potentially be subject to production downtimes, operational delays, other detrimental impacts on our operations or ability to provide products to our customers, the compromising of confidential or otherwise protected information, misappropriation, destruction or corruption of data, security breaches, other manipulation or improper use of our systems, networks or our products, financial losses from remedial actions, loss of business or potential liability, and/or damage to our reputation, any of which could have a material adverse effect on our competitive position, results of operations, cash flows or financial condition. We are currently a decentralized company, which presents certain risks. We are currently a decentralized company, which sometimes places significant control and decision-making powers in the hands of local management. This presents various risks such as the risk of being slower to identify or react to problems affecting a key business. Additionally, we are implementing in a phased approach a company-wide initiative to standardize and upgrade our enterprise resource planning (ERP) systems. This initiative could be more challenging and costly to implement because divergent legacy systems currently exist. Further, if the ERP updates are not successful, we could incur substantial business interruption, including our ability to perform routine business transactions, which could have a material adverse effect on our financial results. Changes in regulations or standards could adversely affect our business. Our products and business are subject to a wide variety of statutory, regulatory and industry standards and requirements. A significant change to regulatory requirements, whether federal, foreign, state or local, or to industry standards, could substantially increase manufacturing costs, impact the size and timing of demand for our products, or put us at a competitive disadvantage, any of which could harm our business and have a material adverse effect on our financial condition, results of operations and cash flow.
Implementation of our acquisition strategy may not be successful, which could affect our ability to increase our revenues or our profitability. One of our strategies is to increase our revenues and profitability and expand our business through acquisitions that will provide us with complementary products and increase market share for our existing product lines. We cannot be certain that we will be able to identify, acquire or profitably manage additional companies or successfully integrate such additional companies without substantial costs, delays or other problems. Also, companies acquired recently and in the future may not achieve anticipated revenues, cost synergies, profitability or cash flows that justify our investment in them. We have faced increasing competition for acquisition candidates, which has resulted in significant increases in the purchase prices of many acquisition candidates. This competition, and the resulting purchase price increases, may limit the number of acquisition opportunities available to us, possibly leading to a decrease in the rate of growth of our revenues and profitability. In addition, acquisitions may involve a number of risks, including, but not limited to:
• inadequate internal controls over financial reporting and our ability to bring such controls into compliance
with the requirements of Section 404 of the Sarbanes-Oxley Act of 2002 in a timely manner; • adverse short-term effects on our reported operating results; • diversion of management’s attention; • investigations of, or challenges to, acquisitions by competition authorities; • loss of key personnel at acquired companies; • unanticipated management or operational problems or legal liabilities; and

14
• potential goodwill, indefinite-lived intangible assets, or long- lived asset impairment charges.
We are subject to risks related to product defects, which could result in product recalls and could subject us to warranty claims in excess of our warranty provisions or which are greater than anticipated due to the unenforceability of liability limitations. We cannot be certain that our quality controls and procedures, including the testing of raw materials and safety testing of selected finished products, will reveal latent defects in our products or the materials from which they are made, which may not become apparent until after the products have been sold into the market. We also cannot be certain that our suppliers will always eliminate latent defects in products we purchase from them. Accordingly, there is a risk that product defects will occur, which could require a product recall. Product recalls can be expensive to implement and, if a product recall occurs during the product’s warranty period, we may be required to replace the defective product. In addition, a product recall may damage our relationship with our customers and we may lose market share with our customers. Our insurance policies may not cover the costs of a product recall.
Our standard warranties contain limits on damages and exclusions of liability for consequential damages and for misuse, improper installation, alteration, accident or mishandling while in the possession of someone other than us. We may incur additional operating expenses if our warranty provision does not reflect the actual cost of resolving issues related to defects in our products. If these additional expenses are significant, it could adversely affect our business, financial condition and results of operations.
We face risks from product liability and other lawsuits, which may adversely affect our business. We have been and expect to continue to be subject to various product liability claims or other lawsuits, including, among others, that our products include inadequate or improper instructions for use or installation, inadequate warnings concerning the effects of the failure of our products, alleged manufacturing or design defects, or allegations that our products contained asbestos. If we do not have adequate insurance or contractual indemnification, damages from these claims would have to be paid from our assets and could have a material adverse effect on our results of operations, liquidity and financial condition. Like other manufacturers and distributors of products designed to control and regulate fluids and gases, we face an inherent risk of exposure to product liability claims and other lawsuits in the event that the use of our products results in personal injury, property damage or business interruption to our customers. We cannot be certain that our products will be completely free from defect. In addition, in certain cases, we rely on third-party manufacturers for our products or components of our products. We cannot be certain that our insurance coverage will continue to be available to us at a reasonable cost, or, if available, will be adequate to cover any such liabilities. For more information, see Item 1. Business—Product Liability, Environmental and Other Litigation Matters” and Note 16 of the Notes to the Consolidated Financial Statements, both of which are incorporated herein by reference. We face risks from costs for environmental compliance and/or to address potential liabilities under environmental laws and regulations. Our operations and facilities worldwide are subject to laws and regulations related to pollution and the protection of the environment, health and safety, including, but not limited to those governing air emissions, discharges to water, the generation, handling, storage, treatment and disposal of hazardous wastes and other materials, and the remediation of contaminated sites. A failure by us to comply with applicable requirements or maintain the permits required for our operations could result in civil or criminal fines, penalties, enforcement actions, third-party claims for property damage and personal injury, requirements to clean up property or to pay for the costs of cleanup or regulatory or judicial orders enjoining or curtailing operations or requiring corrective measures, including the installation of pollution control equipment or remedial actions. Certain environmental laws and regulations impose on present and former owners and operators of facilities and sites, and on potentially responsible parties (“PRPs”) for sites to which such parties may have sent waste for disposal, requirements to investigate and remediate contamination. Such liability can be imposed without regard to fault and, under certain circumstances, may be joint and several, resulting in one PRP being held responsible for the entire obligation. Liability may also include damages to natural resources. On occasion we are involved in such investigations and/or cleanup, and also have been or could be named as a PRP in environmental matters.
15
The discovery of additional contamination, including at acquired facilities, the imposition of more stringent environmental, health and safety laws and regulations, including cleanup requirements, or the insolvency, or other grounds for refusing to participate, of other responsible parties could require us to incur capital expenditures or operating costs materially in excess of our accruals. Future investigations we undertake may lead to discoveries of contamination that must be remediated, and decisions to close facilities may trigger remediation requirements that are not currently applicable. We may also face liability for alleged personal injury or property damage due to exposure to hazardous substances used or disposed of by us, contained within our current or former products, or present in the soil or groundwater at our current or former facilities. We could incur significant costs in connection with such liabilities. See Item 1. Business—Product Liability, Environmental and Other Litigation Matters and Note 16 of the Notes to the Consolidated Financial Statements, both of which are incorporated herein by reference. Economic and other risks associated with international sales and operations could adversely affect our business and future operating results. Since we sell and manufacture our products worldwide, our business is subject to risks associated with doing business internationally. Our business and future operating results could be harmed by a variety of factors, including:
• unexpected geo-political events in foreign countries in which we operate, which could adversely affect
manufacturing and our ability to fulfill customer orders;
• our failure to comply with anti-corruption laws and regulations of the U.S. government and various international jurisdictions, such as the U.S. Foreign Corrupt Practices Act and the United Kingdom’s Bribery Act of 2010;
• trade protection measures and import or export duties or licensing requirements, which could increase our costs of doing business internationally;
• potentially negative consequences from changes in tax laws, including the Tax Cuts and Jobs Act of 2017 (“2017 Tax Act”), which could have an adverse impact on our profits;
• difficulty in staffing and managing widespread operations, which could reduce our productivity;
• costs of compliance with differing labor regulations, especially in connection with restructuring our overseas operations;
• laws of some foreign countries, which may not protect our intellectual property rights to the same extent as the laws of the U.S.;
• unexpected changes in regulatory requirements, which may be costly and require time to implement; and
• foreign exchange rate fluctuations, which could also materially affect our reported results. A portion of our sales and certain portions of our costs, assets and liabilities are denominated in currencies other than U.S. dollars. Approximately 38% of our sales during the year ended December 31, 2018 were from sales outside of the U.S. compared to 39% and 40% for the years ended December 31, 2017 and 2016, respectively. We cannot predict whether currencies such as the euro, Canadian dollar, Chinese yuan, or other currencies in which we transact will appreciate or depreciate against the U.S. dollar in future periods or whether future foreign exchange rate fluctuations will have a positive or negative impact on our reported results.
Our ability to achieve savings through our restructuring and business transformation activities may be adversely affected by management’s ability to fully execute the plans as a result of local regulations, geo-political risk or other factors within or beyond the control of management. We have implemented a number of restructuring and business transformation activities, which include steps that we believe are necessary to enhance the value and performance of the Company, including reducing operating costs and increasing efficiencies throughout our manufacturing, sales and distribution footprint. Factors within or beyond the control of management may change the total estimated costs or the timing of when the savings will be achieved under the plans. Further, if we are not successful in completing the restructuring or business transformation activities timely or

16
if additional or unanticipated issues such as labor disruptions, inability to retain key personnel during and after the transformation or higher exit costs arise, our expected cost savings may not be met and our operating results could be negatively affected. In addition, our restructuring and transformation activities may place substantial demands on our management, which could lead to diversion of management’s attention from other business priorities and result in a reduced customer focus.
Our operating results could be negatively affected by changes in tax rates, the adoption of new tax legislation, or exposure to additional tax liabilities. As a global company, we are subject to taxation in numerous countries, states and other jurisdictions. As a result, our effective rate is derived from a combination of applicable tax rates in the various places that we operate. Our future taxes could be affected by numerous factors including changes in the mix of our profitability from country to country, the results of examinations and audits of our tax filings, adjustments to our uncertain tax positions, changes in accounting for income taxes and changes in tax laws.
In the ordinary course of our business, there are many transactions and calculations where the ultimate tax determination is uncertain. Significant judgment is required in determining our global provision for income taxes, deferred tax assets or liabilities, and in evaluating our tax positions. Although we believe our estimates are reasonable, our tax filings are regularly under audit by tax authorities and the ultimate tax outcome may differ from the amounts recorded and may materially affect our financial results in the period or periods for which such determination is made. The U.S. federal government enacted the 2017 Tax Act on December 22, 2017. The 2017 Tax Act has resulted in significant changes to the U.S. corporate income tax system. These changes include lowering the corporate tax rate, implementing a territorial tax system, and imposing a one-time deemed repatriation Toll Tax on cumulative undistributed foreign earnings. Due to the timing of the enactment and the complexity involved applying the provisions of the 2017 Tax Act, we made reasonable estimates of the effects and recorded provisional amounts in our financial statements as of December 31, 2017. These provisional amounts were finalized as of December 31, 2018. If additional regulatory guidance is issued by the applicable taxing authorities or if certain accounting interpretations are issued, these developments could affect our tax obligations and effective tax rate in the period or periods in which the guidance changes. We identified a material weakness in our internal control over financial reporting relating to our accounting for the implementation of the 2017 Tax Act which, if not remediated appropriately or timely, could result in loss of investor confidence and adversely affect our stock price. As disclosed in Part II, Item 9A, during the fourth quarter of fiscal 2018, management identified a material weakness in internal controls related to our accounting for the implementation of the 2017 Tax Act. We did not have an effective risk assessment process to identify all relevant risks within the process we implemented to account for changes resulting from the recently enacted 2017 Tax Act. As a consequence, we did not design and implement an effective process level control activity over the impact of foreign tax credits on the accounting for the tax liabilities associated with the mandatory repatriation provisions of the 2017 Tax Act. As a result, management concluded that our internal control over financial reporting was not effective as of December 31, 2018. We are implementing remedial measures and, while there can be no assurance that our efforts will be successful, we plan to remediate the material weakness prior to the end of fiscal 2019. If we are unable to remediate the material weakness, or are otherwise unable to maintain effective internal control over financial reporting or disclosure controls and procedures, our ability to record, process and report financial information accurately, and to prepare financial statements within required time periods, could be adversely affected, which could subject us to litigation or investigations requiring management resources and payment of legal and other expenses, negatively affect investor confidence in our financial statements and adversely affect our stock price. The requirements to evaluate goodwill, indefinite-lived intangible assets and long-lived assets for impairment may result in a write-off of all or a portion of our recorded amounts, which would negatively affect our operating results and financial condition. As of December 31, 2018, our balance sheet included goodwill, indefinite-lived intangible assets, amortizable intangible assets and property, plant and equipment of $544.8 million, $36.2 million, $129.0 million and $201.9 million, respectively. In lieu of amortization, we are required to perform an annual impairment review of both goodwill and

17
indefinite-lived intangible assets. In 2018, 2017, and 2016, none of our goodwill reporting units were impaired. In 2018 and 2017, none of our indefinite-lived tradenames were impaired. In performing our annual review in 2016, we recognized a pre-tax non-cash indefinite-lived intangible asset impairment charge of approximately $0.4 million. We are also required to perform an impairment review of our long-lived assets if indicators of impairment exist. In 2018, none of our long-lived assets were impaired. In 2017 and 2016, we recognized pre-tax non-cash charges of $1.0 million and $0.1 million, respectively.
There can be no assurances that future goodwill, indefinite-lived intangible assets or other long-lived asset impairments will not occur. We perform our annual test for indications of goodwill and indefinite-lived intangible assets impairment in the fourth quarter of our fiscal year or sooner if indicators of impairment exist.
The loss or financial instability of major customers could have an adverse effect on our results of operations. In 2018, our top ten customers accounted for approximately 21% of our total net sales with no one customer accounting for more than 10% of our total net sales. Our customers generally are not obligated to purchase any minimum volume of products from us and are able to terminate their relationships with us at any time. In addition, increases in the prices of our products could result in a reduction in orders from our customers. A significant reduction in orders from, or change in terms of contracts with, any significant customers could have a material adverse effect on our future results of operations.
Certain indebtedness may limit our ability to pay dividends, incur additional debt and make acquisitions and other investments. Our revolving credit facility and other senior indebtedness contain operational and financial covenants that restrict our ability to make distributions to stockholders, incur additional debt and make acquisitions and other investments unless we satisfy certain financial tests and comply with various financial ratios. If we do not maintain compliance with these covenants, our creditors could declare a default under our revolving credit facility or senior notes and our indebtedness could be declared immediately due and payable. Our ability to comply with the provisions of our indebtedness may be affected by changes in economic or business conditions beyond our control. Further, one of our strategies is to increase our revenues and profitability and expand our business through acquisitions. We may require capital in excess of our available cash and the unused portion of our revolving credit facility to make large acquisitions, which we would generally obtain from access to the credit markets. There can be no assurance that if a large acquisition is identified that we would have access to sufficient capital to complete such acquisition. Should we require additional debt financing above our existing credit limit, we cannot be assured such financing would be available to us or available to us on reasonable economic terms.
One of our stockholders can exercise substantial influence over our Company. As of December 31, 2018, Timothy P. Horne beneficially owned 6,329,290 shares of Class B common stock. Our Class B common stock entitles its holders to ten votes for each share and our Class A common stock entitles its holders to one vote per share. As of December 31, 2018, Timothy P. Horne beneficially owned approximately 18.5% of our outstanding shares of Class A common stock (assuming conversion of all shares of Class B common stock beneficially owned by Mr. Horne into Class A common stock) and approximately 99.2% of our outstanding shares of Class B common stock, which represents approximately 69.1% of the total outstanding voting power. As long as Mr. Horne controls shares representing at least a majority of the total voting power of our outstanding stock, Mr. Horne will be able to unilaterally determine the outcome of most stockholder votes, and other stockholders will not be able to affect the outcome of any such votes.
Conversion and sale of a significant number of shares of our Class B common stock could adversely affect the market price of our Class A common stock. As of December 31, 2018, there were outstanding 27,646,465 shares of our Class A common stock and 6,329,290 shares of our Class B common stock. Shares of our Class B common stock may be converted into Class A common stock at any time on a one for one basis. Under the terms of a registration rights agreement with respect to outstanding shares of our Class B common stock, the holders of our Class B common stock have rights with respect to the registration of the underlying Class A common stock. Under these registration rights, the holders of Class B common stock may require, on up to two occasions that we register their shares for public resale. If we are eligible to use Form S-3 or a similar

18
short-form registration statement, the holders of Class B common stock may require that we register their shares for public resale up to two times per year. If we elect to register any shares of Class A common stock for any public offering, the holders of Class B common stock are entitled to include shares of Class A common stock into which such shares of Class B common stock may be converted in such registration. However, we may reduce the number of shares proposed to be registered in view of market conditions. We will pay all expenses in connection with any registration, other than underwriting discounts and commissions. If all of the available registered shares are sold into the public market the trading price of our Class A common stock could decline.
Item 1B. UNRESOLVED STAFF COMMENTS. None.
Item 2. PROPERTIES. We maintain 31 principal manufacturing, warehouse and distribution centers worldwide, including our corporate headquarters located in North Andover, Massachusetts. Additionally, we maintain numerous sales offices and other smaller manufacturing facilities and warehouses. The principal properties in each of our three geographic segments and their location, principal use and ownership status are set forth below:
Americas:
Location Principal Use Owned/Leased North Andover, MA Corporate Headquarters Owned Burlington, ON, Canada Distribution Center Owned Export, PA Manufacturing Owned Franklin, NH Manufacturing/Distribution Owned St. Pauls, NC Manufacturing Owned Fort Worth, TX Manufacturing/Distribution Owned San Antonio, TX Warehouse/Distribution Owned Spindale, NC Distribution Center Owned Blauvelt, NY Manufacturing/Distribution Leased Peoria, AZ Manufacturing/Distribution Leased Reno, NV Distribution Center Leased Vernon, BC, Canada Manufacturing/Distribution Leased Woodland, CA Manufacturing Leased Groveport, OH Distribution Center Leased
Europe
Location Principal Use Owned/Leased Biassono, Italy Manufacturing/Distribution Owned Hautvillers, France Manufacturing Owned Landau, Germany Manufacturing/Distribution Owned Méry, France Manufacturing Owned Plovdiv, Bulgaria Manufacturing Owned Sorgues, France Distribution Center Owned Vildbjerg, Denmark Manufacturing/Distribution Owned Virey-le-Grand, France Manufacturing/Distribution Owned Amsterdam, Netherlands Europe Headquarters Leased Gardolo, Italy Manufacturing Leased Monastir, Tunisia Manufacturing Leased Rosières, France Manufacturing/Distribution Leased St. Neots, United Kingdom Manufacturing/Distribution Leased

19
Asia-Pacific, Middle East, and Africa:
Location Principal Use Owned/Leased Ningbo, Beilun, China Manufacturing Owned Shanghai, China Asia-Pacific Headquarters Leased Ningbo, Beilun District, China Distribution Center Leased Auckland, New Zealand Manufacturing/Distribution Leased
Certain of our facilities are subject to capital lease arrangements and collateral assignments under loan agreements with long-term lenders. In general, we believe that our properties, including machinery, tools and equipment, are in good condition, well maintained and adequate and suitable for their intended uses.
Item 3. LEGAL PROCEEDINGS. We are from time to time involved in various legal and administrative proceedings. See Item 1. “Business—Product Liability, Environmental and Other Litigation Matters,” and Note 16 of the Notes to Consolidated Financial Statements, both of which are incorporated herein by reference.
Item 4. MINE SAFETY DISCLOSURES. Not applicable.
PART II
Item 5. MARKET FOR REGISTRANT’S COMMON EQUITY, RELATED STOCKHOLDER MATTERS AND ISSUER PURCHASES OF EQUITY SECURITIES.
Our Class A common stock is traded on the New York Stock Exchange under the trading symbol “WTS.” There is no established public trading market for our Class B common stock, which is held by members of the Horne family. The principal holders of such stock are subject to restrictions on transfer with respect to their shares. Each share of our Class B common stock (10 votes per share) is convertible into one share of Class A common stock (1 vote per share). The number of record holders of our Class A common stock as of January 27, 2019 was 178. The number of record holders of our Class B common stock as of January 27, 2019 was 11.
Aggregate common stock dividend payments in 2018 were $28.3 million, which consisted of $23.1 million and $5.2 million for Class A shares and Class B shares, respectively. Aggregate common stock dividend payments in 2017 were $25.9 million, which consisted of $21.1 million and $4.8 million for Class A shares and Class B shares, respectively. While we presently intend to continue to pay comparable cash dividends, the payment of future cash dividends depends upon the Board of Directors’ assessment of our earnings, financial condition, capital requirements and other factors.
We satisfy the minimum withholding tax obligation due upon the vesting of shares of restricted stock and the conversion of restricted stock units into shares of Class A common stock by automatically withholding from the shares being issued a number of shares with an aggregate fair market value on the date of such vesting or conversion that would satisfy the withholding amount due.
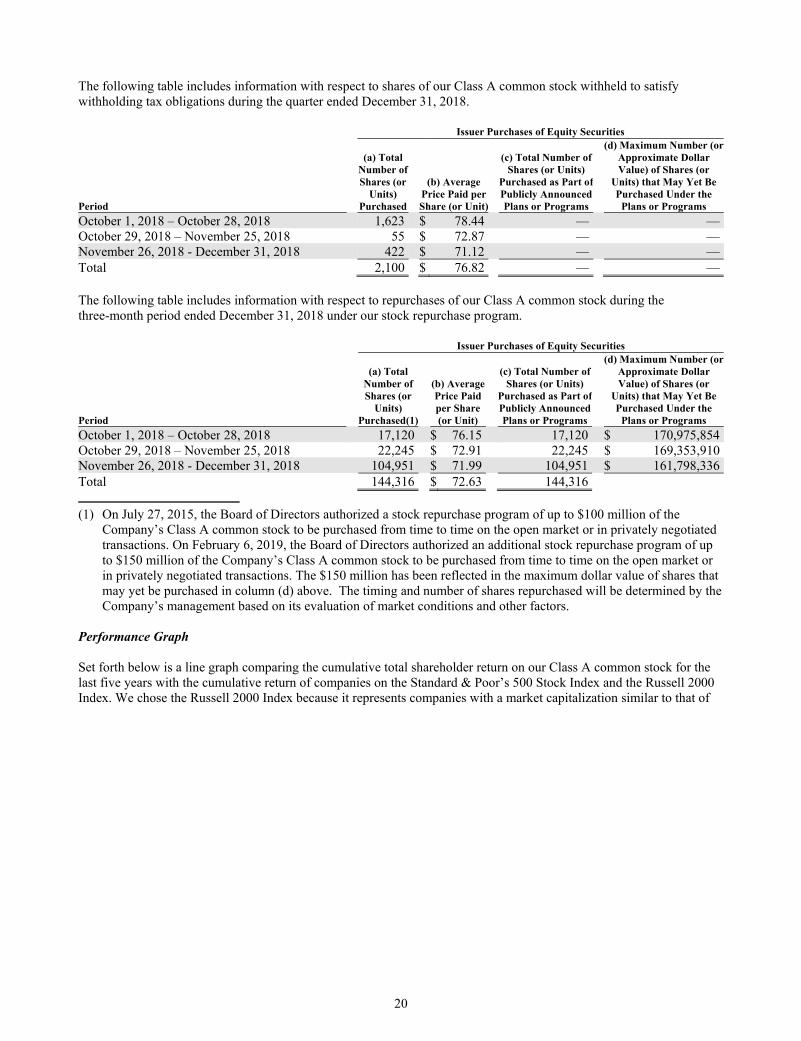
20
The following table includes information with respect to shares of our Class A common stock withheld to satisfy withholding tax obligations during the quarter ended December 31, 2018.
Issuer Purchases of Equity Securities (d) Maximum Number (or (a) Total (c) Total Number of Approximate Dollar Number of Shares (or Units) Value) of Shares (or Shares (or (b) Average Purchased as Part of Units) that May Yet Be Units) Price Paid per Publicly Announced Purchased Under the Period Purchased Share (or Unit) Plans or Programs Plans or Programs
October 1, 2018 – October 28, 2018 1,623 $ 78.44 — — October 29, 2018 – November 25, 2018 55 $ 72.87 — — November 26, 2018 - December 31, 2018 422 $ 71.12 — — Total 2,100 $ 76.82 — — The following table includes information with respect to repurchases of our Class A common stock during the three-month period ended December 31, 2018 under our stock repurchase program.
Issuer Purchases of Equity Securities (d) Maximum Number (or (a) Total (c) Total Number of Approximate Dollar Number of (b) Average Shares (or Units) Value) of Shares (or Shares (or Price Paid Purchased as Part of Units) that May Yet Be Units) per Share Publicly Announced Purchased Under the Period Purchased(1) (or Unit) Plans or Programs Plans or Programs
October 1, 2018 – October 28, 2018 17,120 $ 76.15 17,120 $ 170,975,854 October 29, 2018 – November 25, 2018 22,245 $ 72.91 22,245 $ 169,353,910 November 26, 2018 - December 31, 2018 104,951 $ 71.99 104,951 $ 161,798,336 Total 144,316 $ 72.63 144,316
(1) On July 27, 2015, the Board of Directors authorized a stock repurchase program of up to $100 million of the
Company’s Class A common stock to be purchased from time to time on the open market or in privately negotiated transactions. On February 6, 2019, the Board of Directors authorized an additional stock repurchase program of up to $150 million of the Company’s Class A common stock to be purchased from time to time on the open market or in privately negotiated transactions. The $150 million has been reflected in the maximum dollar value of shares that may yet be purchased in column (d) above. The timing and number of shares repurchased will be determined by the Company’s management based on its evaluation of market conditions and other factors.
Performance Graph Set forth below is a line graph comparing the cumulative total shareholder return on our Class A common stock for the last five years with the cumulative return of companies on the Standard & Poor’s 500 Stock Index and the Russell 2000 Index. We chose the Russell 2000 Index because it represents companies with a market capitalization similar to that of

21
Watts Water. The graph assumes that the value of the investment in our Class A common stock and each index was $100 at December 31, 2013 and that all dividends were reinvested.
* $100 invested on 12/31/13 in stock or index, including reinvestment of dividends. Fiscal year ending December 31.
Cumulative Total Return
12/31/13 12/31/14 12/31/15 12/31/16 12/31/17 12/31/18
Watts Water Technologies, Inc. 100.00 103.55 82.04 108.98 128.41 110.28 S & P 500 100.00 113.69 115.26 129.05 157.22 150.33 Russell 2000 100.00 104.89 100.26 121.63 139.44 124.09
The above Performance Graph and related information shall not be deemed “soliciting material” or to be “filed” with the Securities and Exchange Commission, nor shall such information be incorporated by reference into any future filing under the Securities Act of 1933 or Securities Exchange Act of 1934, each as amended, except to the extent that we specifically incorporate it by reference into such filing.
Item 6. SELECTED FINANCIAL DATA. The selected financial data set forth below should be read in conjunction with our consolidated financial statements, related Notes thereto and “Management’s Discussion and Analysis of Financial Condition and Results of Operations” included herein.

22
FIVE-YEAR FINANCIAL SUMMARY (Amounts in millions, except per share and cash dividend information)
Year Ended Year Ended Year Ended Year Ended Year Ended 12/31/18(1) 12/31/17(2) 12/31/16(3) 12/31/15(4) 12/31/14(5)
Statement of operations data: Net sales $ 1,564.9 $ 1,456.7 $ 1,398.4 $ 1,467.7 $ 1,513.7 Net income (loss) 128.0 73.1 84.2 (112.9) 50.3 DILUTED EPS Net income (loss) per share: 3.73 2.12 2.44 (3.24) 1.42 Cash dividends declared per common share $ 0.82 $ 0.75 $ 0.71 $ 0.66 $ 0.58 Balance sheet data (at year end): Total assets $ 1,653.7 $ 1,736.5 $ 1,763.2 $ 1,692.8 $ 1,948.0 Long-term debt, net of current portion 323.4 474.6 511.3 576.2 577.8
(1) For the year ended December 31, 2018, net income includes pre-tax restructuring charges of $3.4 million, or $2.5
million net after-tax cost. Net income also includes a tax benefit of $3.7 million related to the finalization of the impact of the 2017 Tax Act.
(2) For the year ended December 31, 2017, net income includes the following pre-tax costs: long-lived asset impairment charges of $1.0 million, deployment costs related to the Americas and Europe transformation programs of $2.9 million, restructuring charges of $6.8 million, and acquisition costs of $0.2 million. The net after-tax cost of these items was $7.3 million. Net income also includes a tax charge of $25.1 million related to the provisional impact of the 2017 Tax Act.
(3) For the year ended December 31, 2016, net income includes the following net pre-tax costs: long-lived asset impairment charges of $0.5 million, acquisition costs of $2.0 million, purchase accounting adjustments of $2.0 million, restructuring charges of $4.7 million, deployment costs related to the Americas, APMEA, and Europe transformation programs of $14.2 million, and debt issuance costs of $0.3 million. Net income also includes a pre-tax gain of $8.7 million related to the disposition of a subsidiary in China. The net after-tax cost of these items was $6.2 million.
(4) For the year ended December 31, 2015, net loss includes the following net pre-tax costs: goodwill and other
long-lived asset impairment of $130.5 million, acquisition related costs of $1.6 million, restructuring related costs of $21.4 million, Americas, APMEA, and Europe transformation deployment costs of $14.3 million, a $3.5 million charge for a settlement in principle relating to two class action lawsuits, a $2.5 million charge related to the resolution of certain product liability legacy claims for non-core products which we have exited, and long-term obligations settlements, including our pension plan and supplemental employee retirement plan obligations of $64.7 million. The net after-tax cost of these items was $197.3 million.
(5) For the year ended December 31, 2014, net income includes the following net pre-tax costs: goodwill and other
long-lived asset impairment of $14.2 million, acquisition related costs of $5.8 million, restructuring and severance related costs of $16.4 million, Europe and Americas transformation deployment costs of $9.3 million, and customs settlement costs of $1.9 million. The net after-tax cost of these items was $38.5 million.
Item 7. MANAGEMENT’S DISCUSSION AND ANALYSIS OF FINANCIAL CONDITION AND RESULTS OF
OPERATIONS. Overview We are a leading supplier of products and solutions that conserve water and manage the flow of fluids and energy into, through and out of buildings in the commercial and residential markets of the Americas, Europe and APMEA. For over 140 years, we have designed and produced valve systems that safeguard and regulate water systems, energy efficient heating and hydronic systems, drainage systems and water filtration technology that helps purify and conserve water. We earn revenue and income almost exclusively from the sale of our products. Our principal product lines include:

23
• Residential & commercial flow control products—includes products typically sold into plumbing and hot
water applications such as backflow preventers, water pressure regulators, temperature and pressure relief valves, and thermostatic mixing valves.
• HVAC & gas products—includes commercial high-efficiency boilers, water heaters and heating solutions, hydronic and electric heating systems for under-floor radiant applications, custom heat and hot water solutions, hydronic pump groups for boiler manufacturers and alternative energy control packages, and flexible stainless steel connectors for natural and liquid propane gas in commercial food service and residential applications. HVAC is an acronym for heating, ventilation and air conditioning.
• Drainage & water re-use products—includes drainage products and engineered rain water harvesting solutions for commercial, industrial, marine and residential applications.
• Water quality products—includes point-of-use and point-of-entry water filtration, conditioning and scale prevention systems for both commercial and residential applications.
Our business is reported in three geographic segments: Americas, Europe, and APMEA. We distribute our products through four primary distribution channels: wholesale, original equipment manufacturers (OEMs), specialty, and do – it - yourself (DIY).
We believe that the factors relating to our future growth include continued product innovation that meets the needs of our customers and our end markets, including smart and connected products and solutions; our ability to make selective acquisitions, both in our core markets as well as in new complementary markets; regulatory requirements relating to the quality and conservation of water and the safe use of water; increased demand for clean water; continued enforcement of plumbing and building codes; and a healthy economic environment. We have completed 11 acquisitions in the last decade. Our acquisition strategy focuses on businesses that promote our key macro themes around safety & regulation, energy efficiency and water conservation. We target businesses that will provide us with one or more of the following: an entry into new markets and/or new geographies, improved channel access, unique and/or proprietary technologies, advanced production capabilities or complementary solution offerings.
Our innovation strategy is focused on differentiated products and solutions that provide greater opportunity to distinguish ourselves in the market place. Conversely, we continue to migrate away from commoditized products where we cannot add value. Our goal is to be a solutions provider, not merely a components supplier. We continually look for strategic opportunities to invest in new products and markets or divest existing product lines where necessary in order to meet those objectives.
Products representing a majority of our sales are subject to regulatory standards and code enforcement, which typically require that these products meet stringent performance criteria. We have consistently advocated for the development and enforcement of such plumbing codes. We are focused on maintaining stringent quality control and testing procedures at each of our manufacturing facilities in order to manufacture products in compliance with code requirements and take advantage of the resulting demand for compliant products. We believe that the product development, product testing capability and investment in plant and equipment needed to manufacture products in compliance with code requirements, represent a competitive advantage for us.
In 2018, our financial performance was driven by strong organic sales growth in the Americas and modest growth in Europe and APMEA. We continued to drive margin expansion through higher sales price, volume, productivity initiatives and restructuring savings while simultaneously reinvesting in the business. We continued to drive commercial and operational excellence, and invest in product innovation as we strive to meet the needs of our customers. Overall, reported sales for 2018 increased 7.4%, or $108.2 million, driven by strong organic sales growth of 6.1%, or $88.9 million, primarily within the Americas. Foreign exchange contributed $19.3 million, or 1.3%, of sales growth, primarily related to the appreciation of the euro against the U.S dollar year over year. Reported sales by region in the Americas, Europe, and APMEA increased by 8.4%, 6.1%, and 2.0%, respectively, compared to 2017. Organic sales by region in the Americas, Europe, and APMEA increased 8.4%, 1.8%, and 1.6%, respectively, compared to 2017. The increase in organic sales was due to higher sales volume and increased price across all of our regions. Operating income of $188.4 million increased by $26.1 million, or 16.1% compared to 2017. This increase was driven by increased price,

24
higher sales volume, and productivity initiatives, partially offset by higher material costs, investments in strategic growth initiatives, and general inflation. Organic sales is a non-GAAP measure that excludes the impacts of acquisitions, divestitures and foreign exchange from year-over-year comparisons. Divested sales includes the exit of our non-core products through sale and through the discontinuation of product lines. Management believes reporting organic sales growth provides useful information to investors, potential investors and others, because it allows for a more complete understanding of underlying sales trends by providing sales growth on a consistent basis. We reconcile the change in organic sales to our reported sales for each region within our results below.
The 2017 Tax Act resulted in significant changes to the U.S. corporate income tax system and was enacted on December 22, 2017. These changes include a federal statutory rate reduction from 35% to 21% effective on January 1, 2018, the elimination or reduction of certain domestic deductions and credits, and limitations on the deductibility of interest expense and executive compensation. The 2017 Tax Act transitions international taxation from a worldwide system to a modified territorial system and includes base erosion prevention measures on non-U.S. earnings. The 2017 Tax Act also includes a one-time mandatory deemed repatriation tax on accumulated foreign subsidiaries' previously untaxed foreign earnings (“Toll Tax”).
Changes in tax rates and tax laws are accounted for in the period of enactment and deferred tax assets and liabilities are measured at the enacted tax rate. Therefore, during the year ended December 31, 2017, we recorded a charge totaling $25.1 million related to our estimate of the provisions of the 2017 Tax Act, including an estimated $23.3 million expense under the Toll Tax. During the year ended December 31, 2018 we finalized the impact of the 2017 Tax Act and recorded a benefit of $3.7 million, reducing the net impact to $21.4 million and increasing the Toll Tax to $33.5 million. The Toll Tax is being paid over an eight-year period, starting in 2018, and will not accrue interest. Recent Developments On February 6, 2019, we declared a quarterly dividend of twenty-one cents ($0.21) per share on each outstanding share of Class A common stock and Class B common stock payable on March 15, 2019 to stockholders of record on March 1, 2019. On February 6, 2019, the Board of Directors authorized a stock repurchase program of up to $150 million of our Class A common stock to be purchased from time to time on the open market or in privately negotiated transactions. The timing and number of shares repurchased will be determined by management based on its evaluation of market conditions and other factors. Results of Operations Year Ended December 31, 2018 Compared to Year Ended December 31, 2017 Net Sales. Our business is reported in three geographic segments: Americas, Europe and APMEA. Our net sales in each of these segments for the years ended December 31, 2018 and December 31, 2017 were as follows:
Year Ended Year Ended % Change to December 31, 2018 December 31, 2017 Consolidated Net Sales % Sales Net Sales % Sales Change Net Sales (dollars in millions)
Americas $ 1,032.1 66.0 % $ 951.9 65.4 % $ 80.2 5.5 %Europe 467.0 29.8 440.3 30.2 26.7 1.8 APMEA 65.8 4.2 64.5 4.4 1.3 0.1 Total $ 1,564.9 100.0 % $ 1,456.7 100.0 % $ 108.2 7.4 %

25
The change in net sales was attributable to the following:
Change As a % Change As a % of Consolidated Net Sales of Segment Net Sales Americas Europe APMEA Total Americas Europe APMEA Total Americas Europe APMEA (dollars in millions) Organic $ 80.2 $ 7.7 $ 1.0 $ 88.9 5.5 % 0.5 % 0.1 % 6.1 % 8.4 % 1.8 % 1.6 %Foreign exchange — 19.0 0.3 19.3 — 1.3 — 1.3 — 4.3 0.4 Total $ 80.2 $ 26.7 $ 1.3 $ 108.2 5.5 % 1.8 % 0.1 % 7.4 % 8.4 % 6.1 % 2.0 %
Our products are sold to wholesalers, OEMs, DIY chains, and through various specialty channels. The change in organic net sales by channel was attributable to the following:
Change As a % of Prior Year Sales Wholesale OEMs DIY Specialty Total Wholesale OEMs DIY Specialty (dollars in millions)
Americas $ 44.0 $ 4.3 $ 7.1 $ 24.8 $ 80.2 8.2 % 5.7 % 12.8 % 8.6 % Europe 7.8 1.1 (1.2) — 7.7 2.7 0.8 (31.1) — APMEA 4.0 (1.9) — (1.1) 1.0 7.1 (56.2) — (19.6) Total $ 55.8 $ 3.5 $ 5.9 $ 23.7 $ 88.9
The increase in Americas organic net sales was primarily due to higher sales volume and increased pricing in our valve, drainage, and water quality products, which are sold primarily through the Wholesale, OEM and DIYs channels, and higher volume in heating and hot water products, which are sold through the specialty channel.
Organic net sales in Europe increased $7.7 million primarily due to higher volume and increased pricing. The higher sales volume was driven by marine-based drains, electronics products, and certain water and plumbing products sold through the wholesale channel. This was partially offset by ongoing product rationalization, especially in the DIY channel, as we continue to focus on our core product lines.
Organic net sales in APMEA increased $1.0 million primarily due to increased sales in the Middle East, Australia, and New Zealand. These increases were partially offset by softness in China and Korea, and product rationalization in the OEM channel. The net increase in sales due to foreign exchange was mainly due to the appreciation of the euro against the U.S. dollar in 2018. We cannot predict whether foreign currencies will appreciate or depreciate against the U.S. dollar in future periods or whether future foreign exchange rate fluctuations will have a positive or negative impact on our net sales. Gross Profit. Gross profit and gross profit as a percent of net sales (gross margin) for 2018 and 2017 were as follows:
Year Ended December 31, 2018 2017 (dollars in millions)
Gross profit $ 656.5 $ 602.4 Gross margin 42.0 % 41.4 %
Gross profit and gross margin percentage increased compared to 2017, due to increased pricing, higher sales volume, productivity initiatives, and restructuring savings, which were partially offset by higher material costs, mainly due to increased copper and stainless steel commodity costs, as well as higher inbound transportation costs and general inflation.

26
Selling, General and Administrative Expenses. Selling, general and administrative, or SG&A, expenses increased $32.4 million, or 7.5%, in 2018 compared to 2017. The increase in SG&A expenses was attributable to the following:
(in millions) % Change
Organic $ 27.3 6.3 %Foreign exchange 5.1 1.2 Total $ 32.4 7.5 %
The organic increase was primarily related to investments in strategic growth initiatives of $16.7 million, including investments in research and development for new product initiatives, commercial excellence, and technology and information systems. The organic increase was also due to higher variable costs related to increased sales volume totaling $12.2 million, and inflation of $4.4 million primarily related to transportation costs. These increases were partially offset by restructuring savings within the Americas and Europe of $3.6 million, as well as a decrease in amortization costs of $3.2 million for certain intangible assets that reached the end of their useful lives. The increase in foreign exchange was mainly due to the appreciation of the euro against the U.S. dollar. Total SG&A expenses, as a percentage of sales, were 29.7% in 2018 and 2017. Restructuring. In 2018, we recorded a net charge of $3.4 million, primarily related to restructuring actions associated with our European headquarters and cost savings initiatives within certain manufacturing facilities in Europe, as compared to a net charge of $6.8 million in 2017. For a more detailed description of our current restructuring plans, see Note 3 of Notes to Consolidated Financial Statements in this Annual Report Form 10-K.
Other Long-Lived Asset Impairment Charges. In 2017, we recorded an impairment of $1.0 million, primarily related to a technology asset in the Americas operating segment. See Note 7 of Notes to Consolidated Financial Statements in this Annual Report on Form 10-K for additional information regarding this impairment. Operating Income (Loss). Operating income (loss) by geographic segment for 2018 and 2017 was as follows:
% Change to Year ended Consolidated
December 31,
2018 December 31,
2017 Change Operating
Income (dollars in millions)
Americas $ 171.1 $ 146.8 $ 24.3 15.0 %Europe 49.8 47.6 2.2 1.4 APMEA 7.2 4.7 2.5 1.5 Corporate (39.7) (36.8) (2.9) (1.8) Total $ 188.4 $ 162.3 $ 26.1 16.1 %
The increase (decrease) in operating income (loss) is attributable to the following:
Change As a % of Change As a % of Consolidated Operating Income Segment Operating Income Americas Europe APMEA Corporate Total Americas Europe APMEA Corporate Total Americas Europe APMEA Corporate (dollars in millions) Organic $ 20.2 $ 0.5 $ 2.1 $ (2.9) $ 19.9 12.5 % 0.3 % 1.3 % (1.8)% 12.3 % 13.8 % 1.1 % 44.7 % (7.9)%Foreign exchange — 1.9 (0.1) — 1.8 — 1.2 (0.1) — 1.1 — 4.0 (2.1) — Restructuring, impairment charges 4.1 (0.2) 0.5 — 4.4 2.5 (0.1) 0.3 — 2.7 2.7 (0.4) 10.6 — Total $ 24.3 $ 2.2 $ 2.5 $ (2.9) $ 26.1 15.0 % 1.4 % 1.5 % (1.8)% 16.1 % 16.5 % 4.7 % 53.2 % (7.9)%
Organic operating income increased $19.9 million in 2018 compared to 2017, mainly due to increased pricing, higher sales volume, productivity initiatives, operating savings from restructuring actions, and reduced transformation and restructuring costs. This increase in operating income was partially offset by higher material costs due to increases in the price of copper and stainless steel, investments in strategic growth initiatives and general inflation. Interest Expense. Interest expense decreased $2.8 million, or 14.7%, in 2018 compared 2017 due to a reduction in our principal balance of debt outstanding. As a result of the 2017 Tax Act, we repatriated approximately $127 million of undistributed foreign earnings and used the majority of that cash to reduce our outstanding debt. The impact of the lower
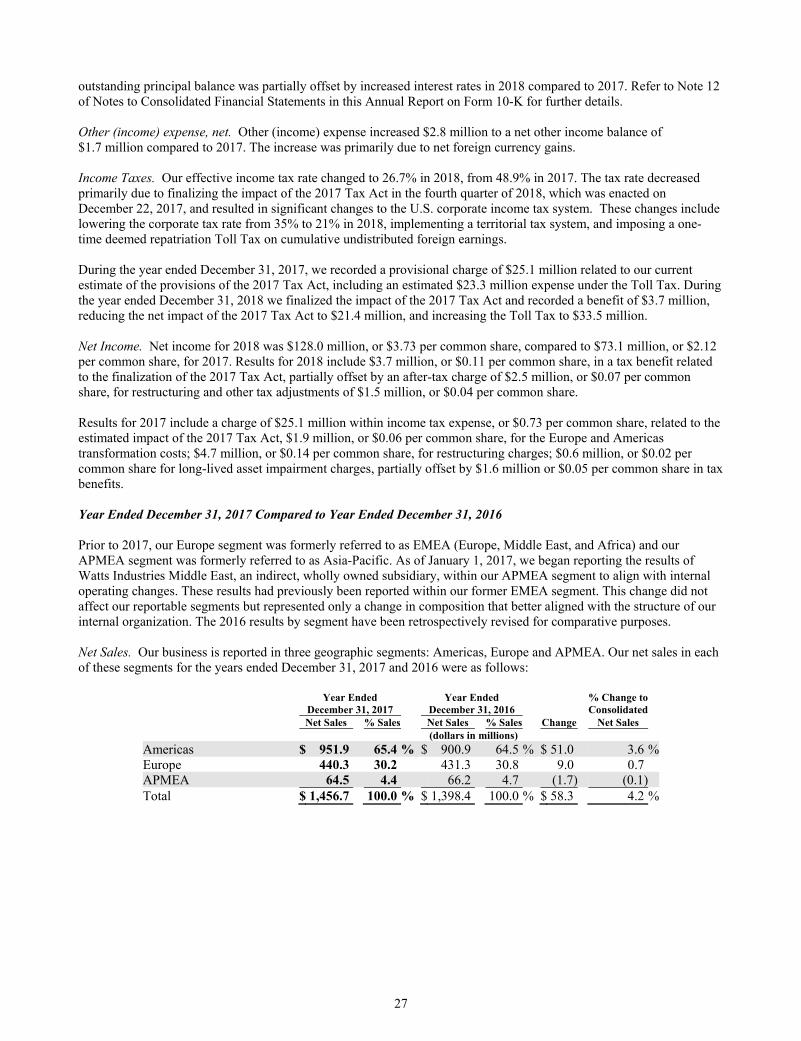
27
outstanding principal balance was partially offset by increased interest rates in 2018 compared to 2017. Refer to Note 12 of Notes to Consolidated Financial Statements in this Annual Report on Form 10-K for further details. Other (income) expense, net. Other (income) expense increased $2.8 million to a net other income balance of $1.7 million compared to 2017. The increase was primarily due to net foreign currency gains. Income Taxes. Our effective income tax rate changed to 26.7% in 2018, from 48.9% in 2017. The tax rate decreased primarily due to finalizing the impact of the 2017 Tax Act in the fourth quarter of 2018, which was enacted on December 22, 2017, and resulted in significant changes to the U.S. corporate income tax system. These changes include lowering the corporate tax rate from 35% to 21% in 2018, implementing a territorial tax system, and imposing a one-time deemed repatriation Toll Tax on cumulative undistributed foreign earnings. During the year ended December 31, 2017, we recorded a provisional charge of $25.1 million related to our current estimate of the provisions of the 2017 Tax Act, including an estimated $23.3 million expense under the Toll Tax. During the year ended December 31, 2018 we finalized the impact of the 2017 Tax Act and recorded a benefit of $3.7 million, reducing the net impact of the 2017 Tax Act to $21.4 million, and increasing the Toll Tax to $33.5 million. Net Income. Net income for 2018 was $128.0 million, or $3.73 per common share, compared to $73.1 million, or $2.12 per common share, for 2017. Results for 2018 include $3.7 million, or $0.11 per common share, in a tax benefit related to the finalization of the 2017 Tax Act, partially offset by an after-tax charge of $2.5 million, or $0.07 per common share, for restructuring and other tax adjustments of $1.5 million, or $0.04 per common share. Results for 2017 include a charge of $25.1 million within income tax expense, or $0.73 per common share, related to the estimated impact of the 2017 Tax Act, $1.9 million, or $0.06 per common share, for the Europe and Americas transformation costs; $4.7 million, or $0.14 per common share, for restructuring charges; $0.6 million, or $0.02 per common share for long-lived asset impairment charges, partially offset by $1.6 million or $0.05 per common share in tax benefits. Year Ended December 31, 2017 Compared to Year Ended December 31, 2016 Prior to 2017, our Europe segment was formerly referred to as EMEA (Europe, Middle East, and Africa) and our APMEA segment was formerly referred to as Asia-Pacific. As of January 1, 2017, we began reporting the results of Watts Industries Middle East, an indirect, wholly owned subsidiary, within our APMEA segment to align with internal operating changes. These results had previously been reported within our former EMEA segment. This change did not affect our reportable segments but represented only a change in composition that better aligned with the structure of our internal organization. The 2016 results by segment have been retrospectively revised for comparative purposes. Net Sales. Our business is reported in three geographic segments: Americas, Europe and APMEA. Our net sales in each of these segments for the years ended December 31, 2017 and 2016 were as follows:
Year Ended Year Ended % Change to December 31, 2017 December 31, 2016 Consolidated Net Sales % Sales Net Sales % Sales Change Net Sales (dollars in millions)
Americas $ 951.9 65.4 % $ 900.9 64.5 % $ 51.0 3.6 %Europe 440.3 30.2 431.3 30.8 9.0 0.7 APMEA 64.5 4.4 66.2 4.7 (1.7) (0.1) Total $ 1,456.7 100.0 % $ 1,398.4 100.0 % $ 58.3 4.2 %

28
The change in net sales was attributable to the following:
Change as a % Change as a % of Consolidated Net Sales of Segment Net Sales Americas Europe APMEA Total Americas Europe APMEA Total Americas Europe APMEA (dollars in millions) Organic $ 7.4 $ 2.5 $ (2.9) $ 7.0 0.5 % 0.2 % (0.2)% 0.5 % 0.8 % 0.6 % (4.6)%Foreign exchange 1.4 6.5 (0.1) 7.8 0.1 0.5 — 0.6 0.1 1.5 — Divested (3.5) — — (3.5) (0.3) — — (0.3) (0.4) — — Acquisitions 45.7 — 1.3 47.0 3.3 — 0.1 3.4 5.1 — 2.0 Total $ 51.0 $ 9.0 $ (1.7) $ 58.3 3.6 % 0.7 % (0.1)% 4.2 % 5.6 % 2.1 % (2.6)%
The change in organic net sales as a percentage of consolidated net sales and of segment net sales in the Americas excludes divested sales for both periods presented. Our products are sold to wholesalers, OEMs, DIY chains and through various specialty channels. The change in organic net sales by channel was attributable to the following:
Change As a % of Prior Year Sales Wholesale OEMs DIY Specialty Total Wholesale OEMs DIY Specialty (dollars in millions)
Americas $ 19.9 $ 1.9 $ (5.0) $ (9.4) $ 7.4 3.9 % 2.6 % (8.4)% (3.7)%Europe 7.6 (3.3) (1.8) — 2.5 2.7 (2.3) (32.9) — APMEA 2.0 (4.9) — — (2.9) 3.4 (59.6) — — Total $ 29.5 $ (6.3) $ (6.8) $ (9.4) $ 7.0
The organic sales increase of $7.0 million was partially muted by the $15.1 million impact of our ongoing product rationalization efforts across our regions, as we continue to focus on our core product lines. The product rationalization mainly affected our DIY and OEM channels. Organic net sales in the Americas increased $7.4 million mainly from growth in the wholesale channel, driven by valve, HVAC, and drainage products. This increase was partially offset by declines in the specialty channels, where we experienced weakness in our tankless water heater and condensing boiler products. There was also a decrease in the DIY channel due to the product rationalization discussed above.
Organic net sales in Europe increased $2.5 million primarily due to growth in the wholesale channel from increased sales of our drains products. This increase was also due to higher demand for our electronics products in Germany. These increases were partially offset by product rationalization and reduced demand for our HVAC products in Italy.
Organic net sales in APMEA decreased $2.9 million driven primarily by the impact of product rationalization. This decrease was offset partly by higher demand in China for our residential underfloor heating products and commercial valves products, as well as growth in South Korea from an expanded product offering.
The net increase in sales due to foreign exchange was primarily due to the appreciation of the euro and the Canadian dollar against the U.S. dollar in 2017. We cannot predict whether foreign currencies will appreciate or depreciate against the U.S. dollar in future periods or whether future foreign exchange rate fluctuations will have a positive or negative impact on our net sales.
The decrease in total net sales due to divested products of $3.5 million relates to the discontinuation of product lines we divested by the end of the first quarter of 2016 in the Americas segment as part of our Americas transformation program.
The increase in net sales from acquisitions in the Americas and APMEA segments are related to the fourth quarter 2016 acquisition of PVI and the first quarter 2016 acquisition of Watts Korea, respectively.

29
Gross Profit. Gross profit and gross profit as a percent of net sales (gross margin) for 2017 and 2016 were as follows:
Year Ended December 31, 2017 December 31, 2016 (dollars in millions)
Gross profit $ 602.4 $ 565.6 Gross margin 41.4 % 40.5 %
The increase in gross margin percentage is attributable to increased volume, manufacturing productivity, changes to our product mix, and incremental savings from our transformation and restructuring programs primarily within the Americas and Europe. Selling, General and Administrative Expenses. Selling, general and administrative, or SG&A, expenses increased $8.2 million, or 1.9%, in 2017 compared to 2016. The increase in SG&A expenses was attributable to the following:
(in millions) % Change
Organic $ (7.3) (1.7)%Foreign exchange 1.7 0.4 Acquisitions 13.8 3.2 Total $ 8.2 1.9 %
SG&A expenses increased primarily as a result of our 2016 acquisitions of PVI and Watts Korea, as well as increases in foreign exchange primarily from the appreciation of the euro and the Canadian dollar against the U.S. dollar compared to 2016. Organically SG&A expenses decreased $7.3 million compared to 2016, primarily related to a decline in product liability costs of $9.4 million, lower transformation costs of $8.1 million as we completed our transformation program in 2017, and lower property tax and other tax charges of $1.1 million. The decline in product liability costs was primarily due to the resolution of the class action lawsuits related to certain legacy claims for undifferentiated products which we have exited, and the associated reduction in reported claims. The organic decrease was partially offset by $8.2 million for investments in strategic initiatives, which includes $2.5 million in research and development costs, and $4.2 million of higher distribution and freight costs. Total SG&A expenses, as a percentage of sales, were 29.7% in 2017 compared to 30.3% in 2016. Restructuring. In 2017, we recorded a net charge of $6.8 million, primarily for the transformation of our Americas business, involuntary terminations and other costs incurred as part of our restructuring initiatives, as compared to a net charge of $4.7 million in 2016. For a more detailed description of our current restructuring plans, see Note 3 of Notes to Consolidated Financial Statements in this Annual Report Form 10-K. Other Long-Lived Asset Impairment Charges. In 2017, we recorded an impairment of $1.0 million, primarily related to a technology asset in the Americas operating segment. In 2016, we recorded impairment charges of $0.5 million, primarily related to an indefinite lived tradename in the Europe operating segment. See Note 7 of Notes to Consolidated Financial Statements in this Annual Report on Form 10‑K for additional information regarding these impairments.
Gain on disposition. In the second quarter of 2016, we recorded a pre-tax gain of $8.7 million related to the sale of a China subsidiary that was dedicated to the production of non-core products and part of the transformation of our Americas and APMEA businesses. The pre-tax gain included a non-cash accumulated currency translation adjustment of $7.3 million.

30
Operating Income (loss). Operating income (loss) by geographic segment for 2017 and 2016 was as follows:
% Change to Year Ended Consolidated December 31, December 31, Operating 2017 2016 Change Income (Dollars in millions)
Americas $ 146.8 $ 127.1 $ 19.7 13.6 %Europe 47.6 40.0 7.6 5.2 APMEA 4.7 15.1 (10.4) (7.2) Corporate (36.8) (37.2) 0.4 0.3 Total $ 162.3 $ 145.0 $ 17.3 11.9 %
The increase (decrease) in operating income (loss) is attributable to the following:
Change as a % of Change as a % of Consolidated Operating Income Segment Operating Income Americas Europe APMEA Corporate Total Americas Europe APMEA Corporate Total Americas Europe APMEA Corporate (Dollars in millions) Organic $ 19.1 $ 6.5 $ (1.4) $ 1.0 $ 25.2 13.2 % 4.5 % (1.0)% 0.7 % 17.4 % 15.0 % 16.3 % (9.3)% 2.7 % Foreign exchange 0.2 0.4 — — 0.6 0.1 0.3 — — 0.4 0.2 1.0 — — Acquisitions 2.9 — — — 2.9 2.0 — — — 2.0 2.3 — — — Gain on disposition — — (8.7) — (8.7) — — (6.0) — (6.0) — — (57.6) — Restructuring (2.5) 0.7 (0.3) (0.6) (2.7) (1.7) 0.4 (0.2) (0.4) (1.9) (2.0) 1.7 (2.0) (1.6) Total $ 19.7 $ 7.6 $ (10.4) $ 0.4 $ 17.3 13.6 % 5.2 % (7.2)% 0.3 % 11.9 % 15.5 % 19.0 % (68.9)% 1.1 %
The increase in consolidated operating income was primarily driven by increased volume and gross margin improvements in the Americas, as well as savings from our restructuring initiatives in Europe. The increase in operating income was also driven by reduced transformation costs compared to 2016 in the Americas and APMEA as our transformation program was completed in 2017. Contributing to the increase in consolidated operating income was $2.9 million from the acquisition of PVI. Included in operating income in 2016 was an $8.7 million gain on a disposition of a China subsidiary. Interest Expense. Interest expense decreased $3.5 million, or 15.5%, in 2017 from 2016 as we repaid over $150 million in outstanding debt during 2017. Further, our weighted average interest rate decreased marginally year to year as we retired higher cost private placement debt in the middle of 2016, and replaced it with lower cost revolver debt. We also replaced certain U.S. based revolver debt with lower cost euro denominated debt in late 2016. Refer to Note 12 of the Notes to Consolidated Financial Statements in this Annual Report on Form 10-K for further details. Other expense (income), net. Other expense (income), net, decreased $5.5 million to a net expense balance of $1.1 million in 2017 as compared to a net other income balance of ($4.4) million in 2016. Included in other income in 2016 was a $1.7 million non-cash gain recognized on the acquisition of Watts Korea. The remaining decrease is primarily due to net foreign currency transaction losses in 2017. Income Taxes. Our effective income tax rate changed to 48.9% in 2017, from 34.1% in 2016. The tax rate increased primarily due to the impact of the 2017 Tax Act, which was enacted on December 22, 2017, and has resulted in significant changes to the U.S. corporate income tax system. These changes include lowering the corporate tax rate from 35% to 21% in 2018, implementing a territorial tax system, and imposing a one-time deemed repatriation Toll Tax on cumulative undistributed foreign earnings. Net Income. Net income for 2017 was $73.1 million, or $2.12 per common share, compared to $84.2 million, or $2.44 per common share, for 2016. Results for 2017 include a charge of $25.1 million within income tax expense, or $0.73 per common share, related to the impact of the 2017 Tax Act, $1.9 million, or $0.06 per common share, for the Europe and Americas transformation costs; $4.7 million, or $0.14 per common share, for restructuring charges; $0.6 million, or $0.02 per common share for long-lived asset impairment charges, partially offset by $1.6 million or $0.05 per common share in tax benefits. Results for 2016 include after-tax benefits of $8.3 million, or $0.24 per common share, for a gain on disposition and $1.0 million, or $0.03 per common share, for a gain on acquisition of Watts Korea, offset by an after-tax charge of $8.8 million, or $0.26 per common share, for the Europe and Americas transformation deployment costs; $3.2 million, or

31
$0.09 per common share, for restructuring charges; $1.3 million, or $0.04 per common share, for purchase accounting adjustments related to our acquisitions in 2016; $1.2 million, or $0.03 per common share, for acquisition costs in 2016; and $2.6 million, or $0.08 per common share for other items, primarily related to tax charges related to the transformation. Liquidity and Capital Resources 2018 Cash Flows We generated $169.4 million of net cash from operating activities in 2018 as compared to $155.9 million of net cash generated from operating activities in 2017. The increase was primarily related to higher net income partially offset by the timing of working capital fluctuations, additional tax payments, including payments made for the Toll Tax and withholdings on repatriated cash as a result of the 2017 Tax Act.
We used $35.9 million of net cash for investing activities in 2018 compared to $27.3 million in 2017. We used $6.5 million more cash in 2018 to purchase capital equipment and used $1.6 million for immaterial acquisitions and other investments. We received $1.1 million less in cash proceeds from the sale of assets and property, plant and equipment compared to 2017. We anticipate investing between $35 million to $40 million in capital equipment in 2019 to improve our manufacturing capabilities. We used $202.9 million of net cash from financing activities in 2018 primarily due to payments of long-term debt of $194.5 million, dividend payments of $28.3 million, and payments to repurchase approximately 340,000 shares of Class A common stock at a cost of $26.0 million. This was partially offset by proceeds from additional drawdowns on our line of credit of $50.0 million during 2018.
On February 12, 2016, we entered into the Credit Agreement among the Company, certain subsidiaries of the Company who become borrowers under the Credit Agreement, JPMorgan Chase Bank, N.A., as Administrative Agent, Swing Line Lender and Letter of Credit Issuer, and the other lenders referred to therein. The Credit Agreement provides for a $500 million, five-year, senior unsecured revolving credit facility (the “Revolving Credit Facility”) with a sublimit of up to $100 million in letters of credit. The Credit Agreement also provided for a $300 million, five-year, term loan facility (the “Term Loan Facility”) available to us in a single draw. The Credit Agreement matures on February 12, 2021, subject to extension under certain circumstances and subject to the terms of the Credit Agreement. As of December 31, 2018, we had $255.0 million of borrowings outstanding on the Term Loan Facility and $25.0 million drawn on the Revolving Credit Facility; had $25.8 million of stand-by letters of credit outstanding and had $449.2 million of unused and available credit under the Revolving Credit Facility. We have historically financed our operating and capital needs primarily through cash flows generated by our operations. We expect to continue funding future operating requirements principally through our cash flows from operations, in addition to existing cash resources. We believe that our existing funds, when combined with cash generated from operations and our ability to access additional financing resources, if needed, are sufficient to satisfy our operating, working capital, strategic initiatives, capital expenditure and debt service requirements for the foreseeable future. In addition, we may choose to opportunistically return cash to shareholders and pursue other business initiatives, including acquisition activities. We may, from time to time, also seek additional funding through a combination of equity and debt financings should we identify a significant new opportunity.
As of December 31, 2018, we held $204.1 million in cash and cash equivalents. Of this amount, $164.4 million of cash and cash equivalents were held by foreign subsidiaries. The 2017 Tax Act requires us to pay a one-time deemed repatriation toll charge on cumulative undistributed foreign earnings as of December 31, 2017, for which we had not previously recorded U.S. taxes. Cumulative earnings in the form of cash and cash equivalents, as defined in the 2017 Tax Act, were taxed at a rate of 15.5% and all other earnings were taxed at a rate of 8.0%. Our obligation associated with this one-time deemed repatriation toll charge is $33.5 million, which is being paid in installments over eight years, starting in 2018, and will not accrue interest. We have paid $14.6 million of the Toll Tax as of December 31, 2018. During 2018, we repatriated approximately $127 million of cash back to the U.S. on cumulative undistributed foreign earnings as of December 31, 2017, and have used the majority of that cash to reduce our outstanding debt. Our U.S. operations typically generate sufficient cash flows to meet our domestic obligations. However, if we did have to borrow to fund some or all of our expected cash outlay, we can do so at reasonable interest rates by utilizing the uncommitted borrowings under our Revolving Credit Facility. Subsequent to recording the Toll Tax, our intent is to permanently

32
reinvest undistributed earnings of foreign subsidiaries, and we do not have any current plans to repatriate foreign earnings to fund operations in the United States. However, if amounts held by foreign subsidiaries were needed to fund operations in the United States, we could be required to accrue and pay taxes to repatriate these funds. Such charges may include potential state income taxes and other tax charges.
Covenant compliance
Under the Credit Agreement, we are required to satisfy and maintain specified financial ratios and other financial condition tests as of December 31, 2018. The financial ratios included a consolidated interest coverage ratio based on consolidated earnings before income taxes, interest expense, depreciation, and amortization (Consolidated EBITDA) to consolidated interest expense, as defined in the Credit Agreement. Our Credit Agreement defined Consolidated EBITDA to exclude unusual or non-recurring charges and gains. We were also required to maintain a consolidated leverage ratio of consolidated funded debt to Consolidated EBITDA. Consolidated funded debt, as defined in the Credit Agreement, included all long and short-term debt, capital lease obligations and any trade letters of credit that are outstanding, less cash on the balance sheet that exceeded $50 million. As of December 31, 2018, our actual financial ratios calculated in accordance with our Credit Agreement compared to the required levels under the Credit Agreement were as follows:
Actual Ratio Required Level
Minimum level Interest Charge Coverage Ratio 15.68 to 1.00 3.50 to 1.00 Maximum levelLeverage Ratio 0.80 to 1.00 3.25 to 1.00
As of December 31, 2018, we were in compliance with all covenants related to the Credit Agreement.
We have one senior note agreement as further detailed in Note 12 of Notes to Consolidated Financial Statements in this Annual Report Form 10-K. This senior note agreement requires us to maintain a fixed charge coverage ratio of consolidated EBITDA plus consolidated rent expense during the period to consolidated fixed charges. Consolidated fixed charges are the sum of consolidated interest expense for the period and consolidated rent expense.
As of December 31, 2018, our actual fixed charge coverage ratio calculated in accordance with our senior note agreements compared to the required ratio therein was as follows:
Actual Ratio Required Level
Minimum levelFixed Charge Coverage Ratio 8.03 to 1.00 2.00 to 1.00
In addition to financial ratios, the Credit Agreement and senior note agreement contain affirmative and negative covenants that include limitations on disposition or sale of assets, prohibitions on assuming or incurring any liens on assets with limited exceptions and limitations on making investments other than those permitted by the agreements.
Working capital (defined as current assets less current liabilities) as of December 31, 2018 was $372.6 million compared to $456.2 million as of December 31, 2017. The ratio of current assets to current liabilities was 2.1 to 1 as of December 31, 2018 compared to 2.4 to 1 as of December 31, 2017. The decrease in working capital is primarily related to a reduction in cash and cash equivalents as a result of using repatriated cash to reduce our outstanding debt. 2017 Cash Flows We generated $155.9 million of net cash from operating activities in 2017 as compared to $138.1 million of net cash generated from operating activities in 2016. The increase was primarily related to higher net income after excluding the non-cash effect of the 2017 Tax Act and the impact of non-cash adjustments, partially offset by the timing of working capital fluctuations compared to 2016. We generated $126.9 million of free cash flow (a non‑GAAP financial measure, which we reconcile below, defined as net cash provided by operating activities minus capital expenditures plus proceeds from sale of assets), compared to free cash flow of $102.2 million in 2016.

33
We used $27.3 million of net cash for investing activities in 2017 compared to $114.0 million in 2016. We used $88.1 million less cash in 2017 for acquisitions as 2016 included the acquisition of PVI and Watts Korea. We used $6.6 million less cash for purchases of capital equipment compared to 2016. The decrease in cash used for investing activities was partially offset by a $1.5 million purchase of additional intangible assets, and $6.8 million less cash generated from the sale of assets in 2017. We used $205.3 million of net cash from financing activities in 2017 primarily due to payments of long-term debt of $178.0 million, dividend payments of $25.9 million, and payments to repurchase approximately 278,000 shares of Class A common stock at a cost of $18.2 million. This was partially offset by proceeds from an additional draw on our line of credit of $20.0 million during 2017. In 2016, we generated $27.7 million of net cash from financing activities, primarily due to net proceeds from long-term borrowings of $74.4 million, offset by dividend payments of $24.5 million, and payments to repurchase Class A common stock at a cost of $26.8 million On December 16, 2016, Watts International Holdings Limited (“Watts International”), a wholly owned subsidiary of the Company, entered into a Facility Agreement (the “Facility Agreement”) among Watts International, as original borrower and original guarantor, Watts Water Technologies EMEA B.V., a wholly owned subsidiary of the Company (“Watts EMEA”), as original guarantor, JPMorgan Chase Bank, N.A., as sole bookrunner and sole lead arranger (“JP Morgan Chase Bank”), J.P. Morgan Europe Limited, as agent to the financial parties, and the other lenders referred to therein. The Facility Agreement provided for a €110 million, 364 day, term loan facility available to the Company in a single draw. On December 20, 2016, Watts International borrowed the full amount available for borrowing under the Facility Agreement. The loan included interest at a rate per annum equal to (i) the Euro InterBank Offered Rate (EURIBOR), provided that if such rate is less than zero, then EURIBOR shall be deemed to be zero, plus (ii) a margin of 1.875%, provided that if no event of default is continuing and Watts International’s consolidated leverage ratio was at a specified level, the margin shall decrease to 1.50%.Substantially all of the proceeds of the borrowings made on December 20, 2016 under the Facility Agreement were used to pay down $113 million outstanding under the Revolving Credit Facility. As of the third quarter of 2017, we had repaid in full the Facility Agreement. Non-GAAP Financial Measures In accordance with the SEC's Regulation G and item 10(e) of Regulation S-K, the following provides definitions of the non-GAAP measures used by management. We believe that these measures provide for a more complete perspective of underlying business results and trends. These non-GAAP measures are not intended to be considered by the user in place of the related GAAP measure, but rather as supplemental information to more fully understand our business results. These non-GAAP measures may not be the same as similar measures used by other companies due to possible differences in method and in the items or events being adjusted. Organic sales growth is a non-GAAP measure of sales growth that excludes the impacts of acquisitions, divestitures and foreign exchange from period-over-period comparisons. A reconciliation to the most closely related U.S.GAAP measure, net sales, has been included in our discussion within “Results of Operations” above. Organic net sales should be considered in addition to, and not as a replacement for or as a superior measure to net sales. Management believes reporting organic sales growth provides useful information to investors, potential investors and others, by facilitating easier comparisons of our revenue performance with prior and future periods. Adjusted operating income, adjusted operating margins, adjusted net income, and adjusted earnings per share are non - GAAP measures that exclude certain benefits and expenses that relate primarily to our global restructuring programs, transformation costs, acquisition related costs, gain on acquisitions, other long-lived asset impairments, the related income tax impacts on these items and other tax adjustments, including the impact of the 2017 Tax Act. Management believes reporting these financial measures provides useful information to investors, potential investors and others, by facilitating easier comparisons of our performance with prior and future periods.

34
A reconciliation of U.S. GAAP results to these adjusted non-GAAP measures is provided below:
Year Ended December 31, December 31, 2018 2017
Net sales $ 1,564.9 $ 1,456.7 Operating income - as reported 188.4 162.3 Operating margin % 12.0 % 11.1 % Adjustments for special items: Impairment charges and other costs — 1.2 Restructuring 3.4 6.8 Transformation costs — 2.9 Total adjustments for special items $ 3.4 $ 10.9 Operating income - as adjusted $ 191.8 $ 173.2 Adjusted operating margin % 12.3 % 11.9 % Net income - as reported $ 128.0 $ 73.1 Adjustments for special items - tax effected: Impairment charges and other costs — 0.7 Restructuring 2.5 4.7 Transformation costs — 1.9 Other tax items 1.5 — The 2017 Tax Act (3.7) 23.5 Total adjustments for special items - tax effected: $ 0.3 $ 30.8 Net income as adjusted $ 128.3 $ 103.9 Diluted earnings per share - as reported 3.73 2.12 Adjustments for special items 0.01 0.90 Diluted earnings per share - as adjusted $ 3.74 $ 3.02
Free cash flow is a non-GAAP measure that does not represent cash generated from operating activities in accordance with U.S. GAAP. Therefore it should not be considered an alternative to net cash provided by operating activities as an indication of our performance. The cash conversion rate of free cash flow to net income is also a measure of our performance in cash flow generation. We believe free cash flow to be an appropriate supplemental measure of our operating performance because it provides investors with a measure of our ability to generate cash, repay debt, pay dividends, repurchase stock and fund acquisitions. A reconciliation of net cash provided by operating activities to free cash flow and calculation of our cash conversion rate is provided below:
Year Ended December 31, 2018 2017 2016 (in millions)
Net cash provided by operating activities $ 169.4 $ 155.9 $ 138.1 Less: additions to property, plant, and equipment (35.9) (29.4) (36.0) Plus: proceeds from the sale of property, plant, and equipment 2.2 0.4 0.1 Free cash flow $ 135.7 $ 126.9 $ 102.2 Net income —as reported $ 128.0 $ 73.1 $ 84.2 Cash conversion rate of free cash flow to net income 106.0 % 173.6 % 121.4 %
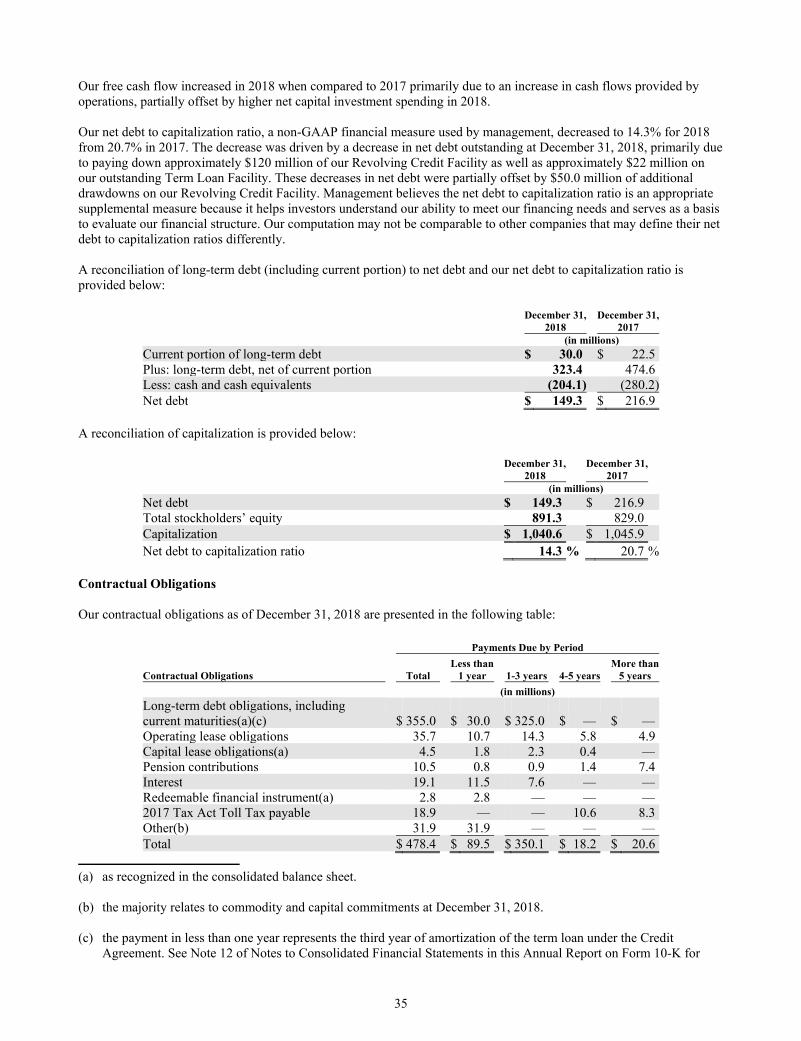
35
Our free cash flow increased in 2018 when compared to 2017 primarily due to an increase in cash flows provided by operations, partially offset by higher net capital investment spending in 2018.
Our net debt to capitalization ratio, a non-GAAP financial measure used by management, decreased to 14.3% for 2018 from 20.7% in 2017. The decrease was driven by a decrease in net debt outstanding at December 31, 2018, primarily due to paying down approximately $120 million of our Revolving Credit Facility as well as approximately $22 million on our outstanding Term Loan Facility. These decreases in net debt were partially offset by $50.0 million of additional drawdowns on our Revolving Credit Facility. Management believes the net debt to capitalization ratio is an appropriate supplemental measure because it helps investors understand our ability to meet our financing needs and serves as a basis to evaluate our financial structure. Our computation may not be comparable to other companies that may define their net debt to capitalization ratios differently.
A reconciliation of long-term debt (including current portion) to net debt and our net debt to capitalization ratio is provided below:
December 31, December 31, 2018 2017 (in millions)
Current portion of long-term debt $ 30.0 $ 22.5 Plus: long-term debt, net of current portion 323.4 474.6 Less: cash and cash equivalents (204.1) (280.2)Net debt $ 149.3 $ 216.9
A reconciliation of capitalization is provided below:
December 31, December 31, 2018 2017 (in millions)
Net debt $ 149.3 $ 216.9 Total stockholders’ equity 891.3 829.0 Capitalization $ 1,040.6 $ 1,045.9 Net debt to capitalization ratio 14.3 % 20.7 %
Contractual Obligations Our contractual obligations as of December 31, 2018 are presented in the following table:
Payments Due by Period
Less than More thanContractual Obligations Total 1 year 1-3 years 4-5 years 5 years
(in millions)
Long-term debt obligations, including current maturities(a)(c) $ 355.0 $ 30.0 $ 325.0 $ — $ — Operating lease obligations 35.7 10.7 14.3 5.8 4.9 Capital lease obligations(a) 4.5 1.8 2.3 0.4 — Pension contributions 10.5 0.8 0.9 1.4 7.4 Interest 19.1 11.5 7.6 — — Redeemable financial instrument(a) 2.8 2.8 — — — 2017 Tax Act Toll Tax payable 18.9 — — 10.6 8.3 Other(b) 31.9 31.9 — — — Total $ 478.4 $ 89.5 $ 350.1 $ 18.2 $ 20.6
(a) as recognized in the consolidated balance sheet. (b) the majority relates to commodity and capital commitments at December 31, 2018. (c) the payment in less than one year represents the third year of amortization of the term loan under the Credit
Agreement. See Note 12 of Notes to Consolidated Financial Statements in this Annual Report on Form 10-K for
36
further details of our financing arrangements. We maintain letters of credit that guarantee our performance or payment to third parties in accordance with specified terms and conditions. Amounts outstanding were approximately $25.8 million as of December 31, 2018 and $25.7 million as of December 31, 2017. Our letters of credit are primarily associated with insurance coverage and, to a lesser extent, foreign purchases and generally expire within one year of issuance. These instruments may exist or expire without being drawn down; therefore they do not necessarily represent future cash flow obligations and are not included in the table above.
Off-Balance Sheet Arrangements Except for operating lease commitments, we have no off-balance sheet arrangements that have or are reasonably likely to have a current or future effect on our financial condition, changes in financial condition, revenues or expenses, results of operations, liquidity, capital expenditures or capital resources that is material to investors.
Application of Critical Accounting Policies and Key Estimates The preparation of our consolidated financial statements in accordance with U.S. GAAP requires management to make judgments, assumptions and estimates that affect the amounts reported. A critical accounting estimate is an assumption about highly uncertain matters and could have a material effect on the consolidated financial statements if another, also reasonable, amount were used, or, a change in the estimate is reasonably likely from period to period. We base our assumptions on historical experience and on other estimates that we believe are reasonable under the circumstances. Actual results could differ significantly from these estimates. There were no significant changes in our accounting policies or significant changes in our accounting estimates during 2018, with the exception of the change in our revenue recognition accounting policy resulting from the adoption of ASC 606 as described in Note 4 in the Notes to the Consolidated Financial Statements in this Annual Report on Form 10-K.
We periodically discuss the development, selection and disclosure of the estimates with our Audit Committee. Management believes the following critical accounting policies reflect our more significant estimates and assumptions.
Revenue recognition We recognize revenue under the core principle to depict the transfer of control to our customers in an amount reflecting the consideration to which we expect to be entitled. In order to achieve that core principle, we apply the following five - step approach: (1) identify the contract with a customer, (2) identify the performance obligations in the contract, (3) determine the transaction price, (4) allocate the transaction price to the performance obligations in the contract, and (5) recognize revenue when a performance obligation is satisfied. Our revenue for product sales is recognized on a point in time model, at the point control transfers to the customer, which is generally when products are shipped from the Company’s manufacturing or distribution facilities or when delivered to the customer’s named location. Sales tax, value - added tax, or other taxes collected concurrent with revenue producing activities are excluded from revenue. Freight costs billed to customers for shipping and handling activities are included in revenue with the related cost included in selling, general and administrative expenses. See Note 4 for further disclosures and detail regarding revenue recognition. Inventory valuation Inventories are stated at the lower of cost or net realizable value with costs determined primarily on a first-in first-out basis. We utilize both specific product identification and historical product demand as the basis for determining our excess or obsolete inventory reserve. We identify all inventories that exceed a range of one to three years in sales. This is determined by comparing the current inventory balance against unit sales for the trailing twelve months. New products added to inventory within the past twelve months are excluded from this analysis. A portion of our products contain recoverable materials, therefore the excess and obsolete reserve is established net of any recoverable amounts. Changes in market conditions, lower-than- expected customer demand or changes in technology or features could result in additional obsolete inventory that is not saleable and could require additional inventory reserve provisions.
In certain countries, additional inventory reserves are maintained for potential shrinkage experienced in the manufacturing process. The reserve is established based on the prior year’s inventory losses adjusted for any change in the gross inventory balance.

37
Goodwill and other intangibles We have made numerous acquisitions over the years and have recognized a significant amount of goodwill. Goodwill is tested for impairment annually or more frequently if an event or circumstance indicates that an impairment loss may have been incurred. Application of the goodwill impairment test requires judgment, including the identification of reporting units, assignment of assets and liabilities to reporting units, and determination of the fair value of each reporting unit. We estimate the fair value of our reporting units using an income approach based on the present value of estimated future cash flows, and when appropriate, guideline public company and guideline transaction market approaches.
Accounting guidance allows us to review goodwill for impairment utilizing either qualitative or quantitative analyses. We have the option to first assess qualitative factors to determine whether the existence of events or circumstances leads to a determination that it is more likely than not that the fair value of a reporting unit is less than its carrying amount. If, after assessing the totality of events and circumstances, we determine it is more likely than not that the fair value of a reporting unit is greater than its carrying amount, then performing the quantitative impairment test is unnecessary.
We first identify those reporting units that we believe could pass a qualitative assessment to determine whether further impairment testing is necessary. For each reporting unit identified, our qualitative analysis includes:
1) A review of the most recent fair value calculation to identify the extent of the cushion between fair value
and carrying amount, to determine if a substantial cushion existed. 2) A review of events and circumstances that have occurred since the most recent fair value calculation to
determine if those events or circumstances would have affected our previous fair value assessment. Items identified and reviewed include macroeconomic conditions, industry and market changes, cost factor changes, events that affect the reporting unit, and financial performance against expectations and the reporting unit’s performance relative to peers.
We then compile this information and make our assessment of whether it is more likely than not that the fair value of the reporting unit is less than its carrying amount. If we determine it is not more likely than not, then no further quantitative analysis is required.
In 2018, we had eight reporting units. One of these reporting units, Water Quality, had no goodwill. We performed a qualitative analysis for each of the seven remaining reporting units, which include Blücher, Dormont, US Drains, Europe, Residential and Commercial, Heating and Hot Water Solutions (“HHWS”), and APMEA.
As of our October 28, 2018 testing date, we had $544.3 million of goodwill on our balance sheet. As a result of our qualitative analyses, we determined that the fair values of the seven reporting units noted above were more likely than not greater than the carrying amounts. In 2018, we did not need to proceed beyond the qualitative analysis, and no goodwill impairments were recorded. In 2017, we performed a quantitative impairment analysis for the HHWS reporting unit in connection with the annual strategic plan and due to underperformance to budget, primarily caused by continuing softness in the condensing boiler market, weakness in our tankless water heater products and competitive pricing pressure. We estimated the fair value of the reporting unit using a weighted calculation of the income approach and the market approach. Inherent in our development of the fair value of the reporting unit are the assumptions and estimates used in the income, and where appropriate, market approaches. The income approach calculates the present value of future cash flow projections based on assumptions and estimates derived from a review of our operating results, business plans, expected growth rates, the appropriate revenue and EBITDA multiples, and discount rates. We also made certain assumptions about future economic conditions and market data. We developed our assumptions based on our historical results, including sales growth, operating profits, working capital levels and income tax rates. The market approach calculates the estimated fair value based on valuation multiples derived from stock prices and enterprise values of publicly traded companies that are comparable to the reporting unit and based on valuation multiples are derived from actual transactions for comparable public companies when appropriate. The estimated fair value of the reporting unit exceeded the carrying value in 2017 and therefore, no impairment was recorded.

38
Intangible assets such as trademarks and trade names are generally recorded in connection with a business acquisition. Values assigned to intangible assets are determined by an independent valuation firm based on our estimates and judgments regarding expectations of the success and life cycle of products and technology acquired. Accounting guidance allows us to perform a qualitative impairment assessment of indefinite-lived intangible assets consistent with the goodwill guidance noted previously. For our 2018 impairment assessment, which occurred as of October 28, 2018, we performed quantitative assessments for all indefinite-lived intangible assets. The methodology we employed was the relief from royalty method, a subset of the income approach. During 2018 and 2017, no impairment was recognized on our indefinite-lived intangible assets. In 2016, we recognized a non-cash pre-tax charge of approximately $0.4 million related to an indefinite lived tradename in our Europe reporting unit.
Product liability Because of retention requirements associated with our insurance policies, we are generally self-insured for potential product liability claims. We are subject to a variety of potential liabilities in connection with product liability cases, and we maintain a high self-insured retention limit within our product liability and general liability coverage, which we believe to be generally in accordance with industry practices. Management establishes its product liability accrual, which includes legal costs associated with accrued claims, by utilizing third-party actuarial valuations which incorporate historical trend factors and our specific claims experience derived from loss reports provided by third-party administrators. We maintain excess liability insurance to minimize our risks related to claims in excess of our primary insurance policies. The product liability accrual is established after considering any applicable insurance coverage. For the remainder of our operations we maintain insurance and calculate potential product liability accruals which includes legal costs associated with the accrued claims on a case by case basis. Changes in the nature of product liability claims, legal costs, or the actual settlement amounts could affect the adequacy of the estimates and require changes to the accrual. Because the liability is an estimate, the ultimate liability may be more or less than reported.
We determine the trend factors for product liability based on consultation with outside actuaries. Any material change in the aforementioned factors could have an adverse impact on our operating results.
Legal contingencies We are a defendant in numerous legal matters including those involving environmental issues and product liability as discussed in more detail in Part I, Item 1. “Business—Product Liability, Environmental and Other Litigation Matters” and Note 16. As required by GAAP, we determine whether an estimated loss from a loss contingency should be accrued by assessing whether a loss is deemed probable and the loss amount can be reasonably estimated. When it is possible to estimate reasonably possible loss or range of loss above the amount accrued, that estimate is aggregated and disclosed. Estimates of potential outcomes of these contingencies are often developed in consultation with outside counsel. While this assessment is based upon all available information, litigation is inherently uncertain and the actual liability to fully resolve litigation cannot be predicted with any assurance of accuracy. In the event of an unfavorable outcome in one or more legal matters, the ultimate liability may be in excess of amounts currently accrued, if any, and may be material to our operating results or cash flows for a particular quarterly or annual period. However, based on information currently known to us, management believes that the ultimate outcome of all legal contingencies, as they are resolved over time, is not likely to have a material adverse effect on our financial condition, though the outcome could be material to our operating results for any particular period depending, in part, upon the operating results for such period. Income taxes We are subject to income taxes in the U.S. (federal and state) and foreign jurisdictions. Significant judgment is required in evaluating our uncertain tax positions, determining our provision for income taxes, and evaluating the impact of the 2017 Tax Act. We estimate and use our expected annual effective income tax rates to accrue income taxes. Effective tax rates are determined based on budgeted earnings before taxes, including our best estimate of permanent items that will affect the effective rate for the year. Management periodically reviews these rates with outside tax advisors and changes are made if material variances from expectations are identified. Income taxes are accounted for under the asset and liability method. Deferred tax assets and liabilities are recognized for the future tax consequences attributable to differences between the financial statement carrying amounts of existing

39
assets and liabilities and their respective tax basis and operating loss and tax credit carry forwards. Deferred tax assets and liabilities are measured using enacted tax rates expected to apply to taxable income in the years in which those temporary differences are expected to be recovered or settled. The effect on deferred tax assets and liabilities of a change in tax rates is recognized in income in the period that includes the enactment date. A valuation allowance is provided to offset any net deferred tax assets if, based upon the available evidence, it is more likely than not that some or all of the deferred tax assets will not be realized. We consider estimated future taxable income and future reversals of the deferred tax liabilities in assessing the need for a valuation allowance. The 2017 Tax Act was enacted on December 22, 2017 and introduced significant changes to U.S. income tax law. Effective in 2018, the 2017 Tax Act reduced the U.S. statutory tax rate from 35% to 21% and created new taxes on certain foreign-sourced earnings and certain related-party payments, which are referred to as the global intangible low - taxed income tax and the base erosion tax, respectively. In addition, in 2017 we were subject to the Toll Tax, a one-time transition tax on accumulated foreign subsidiary earnings not previously subject to U.S. income tax. Accounting for the income tax effects of the 2017 Tax Act at December 31, 2017 required significant judgments and estimates in the interpretation and calculations of the provisions of the 2017 Tax Act. We are required to recognize the effect of the tax law changes in the period of enactment, such as determining the Toll Tax, remeasuring our U.S. deferred tax assets and liabilities as well as reassessing the net realizability of our deferred tax assets and liabilities. Due to the timing of the enactment and the complexity involved in applying the provisions of the 2017 Tax Act, we made reasonable estimates of the effects and recorded provisional amounts in our financial statements for the year ended December 31, 2017. In December 2017, the SEC staff issued Staff Accounting Bulletin No. 118, Income Tax Accounting Implications of the Tax Cuts and Jobs Act (SAB 118), which allows us to record provisional amounts during a measurement period not to extend beyond one year of the enactment date. December 22, 2018 marked the end of the measurement period for purposes of SAB 118. As such, we have completed the analysis based on legislative updates relating to the Act currently available, which resulted in an additional tax benefit of $3.7 million in the fourth quarter of 2018 and a final total tax charge of $21.4 million related to implementation of the 2017 Tax Act.
New Accounting Standards A discussion of recent accounting pronouncements is included in Note 2 of the Notes to Consolidated Financial Statements in this Annual Report on Form 10-K.
Item 7A. QUANTITATIVE AND QUALITATIVE DISCLOSURES ABOUT MARKET RISK. We use derivative financial instruments primarily to reduce exposure to adverse fluctuations in foreign exchange rates, interest rates and costs of certain raw materials used in the manufacturing process. We do not enter into derivative financial instruments for trading purposes. As a matter of policy, all derivative positions are used to reduce risk by hedging underlying economic exposure. The derivatives we use are instruments with liquid markets. See Note 17 of Notes to the Consolidated Financial Statements for further details.
Our consolidated earnings, which are reported in United States dollars, are subject to translation risks due to changes in foreign currency exchange rates. This risk is concentrated in the exchange rate between the U.S. dollar and the euro; the U.S. dollar and the Canadian dollar; and the U.S. dollar and the Chinese yuan. Our non-U.S. subsidiaries transact most business, including certain intercompany transactions, in foreign currencies. Such transactions are principally purchases or sales of materials and are denominated in European currencies or the U.S. or Canadian dollar. We use foreign currency forward exchange contracts from time to time to manage the risk related to intercompany loans, intercompany purchases that occur during the course of a year, and certain open foreign currency denominated commitments to sell products to third parties. Beginning in the first quarter of 2018, we entered into forward exchange contracts that settle quarterly and which hedge approximately 70% of the forecasted intercompany purchases between one of our Canadian and U.S. operating subsidiaries over a rolling twelve-month period. We record the effective portion of the designated foreign currency hedge contracts in other comprehensive income until inventory turns and is sold to a third-party. Once the third-party transaction occurs associated with the hedged forecasted transaction, the effective portion of any related gain or loss on the designated foreign currency hedge will be reclassified into earnings. The fair value of our designated foreign hedge contracts outstanding as of December 31, 2018 was $0.3 million.

40
For each facility under the Credit Agreement, we can choose either an Adjusted LIBOR or Alternative Base Rate (“ABR”). Accordingly, the Company’s earnings and cash flows are exposed to interest rate risk from changes in Adjusted LIBOR. In order to manage our exposure to changes in cash flows attributable to fluctuations in LIBOR - indexed interest payments related to our floating rate debt, in February 2016, we entered into two interest rate swaps. For each interest rate swap, we receive the three-month USD-LIBOR subject to a 0% floor, and pay a fixed rate of 1.31375% on a notional amount of $225.0 million. Information about our long-term debt including principal amounts and related interest rates appears in Note 12 of Notes to the Consolidated Financial Statements. We purchase significant amounts of bronze ingot, brass rod, cast iron, stainless steel and plastic, which are utilized in manufacturing our many product lines. Our operating results can be adversely affected by changes in commodity prices if we are unable to pass on related price increases to our customers. We manage this risk by monitoring related market prices, working with our suppliers to achieve the maximum level of stability in their costs and related pricing, seeking alternative supply sources when necessary and passing increases in commodity costs to our customers, to the maximum extent possible, when they occur.
Item 8. FINANCIAL STATEMENTS AND SUPPLEMENTARY DATA. The financial statements listed in section (a) (1) of “Part IV, Item 15. Exhibits, Financial Statement Schedules” of this Annual Report are incorporated herein by reference.
Item 9. CHANGES IN AND DISAGREEMENTS WITH ACCOUNTANTS ON ACCOUNTING AND FINANCIAL
DISCLOSURE. None.
Item 9A. CONTROLS AND PROCEDURES. Evaluation of Disclosure Controls and Procedures As required by Rule 13a-15(b) under the Securities Exchange Act of 1934, as amended, or Exchange Act, as of the end of the period covered by this report, we carried out an evaluation under the supervision and with the participation of our management, including our Chief Executive Officer and Chief Financial Officer, of the effectiveness of our disclosure controls and procedures. In designing and evaluating our disclosure controls and procedures, we recognize that any controls and procedures, no matter how well designed and operated, can provide only reasonable assurance of achieving the desired control objectives, and our management necessarily applies its judgment in evaluating and implementing possible controls and procedures. The effectiveness of our disclosure controls and procedures is also necessarily limited by the staff and other resources available to us and the geographic diversity of our operations. Based upon that evaluation, the Chief Executive Officer and Chief Financial Officer concluded that, as of the end of the period covered by this report, our disclosure controls and procedures were not effective due to a material weakness in internal control over financial reporting discussed below in Management’s Annual Report on Internal Control Over Financial Reporting. Management’s Annual Report on Internal Control Over Financial Reporting Management of the Company is responsible for establishing and maintaining adequate internal control over financial reporting as defined in Rules 13a-15(f) and 15d-15(f) under the Securities Exchange Act of 1934. The Company’s internal control over financial reporting is designed to provide reasonable assurance regarding the reliability of financial reporting and the preparation of financial statements for external purposes in accordance with generally accepted accounting principles. The Company’s internal control over financial reporting includes those policies and procedures that:
(i) pertain to the maintenance of records that, in reasonable detail, accurately and fairly reflect the transactions
and dispositions of the assets of the Company; (ii) provide reasonable assurance that transactions are recorded as necessary to permit preparation of financial
statements in accordance with generally accepted accounting principles, and that receipts and
41
expenditures of the Company are being made only in accordance with authorizations of management and directors of the Company; and
(iii) provide reasonable assurance regarding prevention or timely detection of unauthorized acquisition, use or
disposition of the Company’s assets that could have a material effect on the financial statements.
Because of its inherent limitations, internal control over financial reporting may not prevent or detect misstatements. Also, projections of any evaluation of effectiveness to future periods are subject to the risk that controls may become inadequate because of changes in conditions, or that the degree of compliance with the policies or procedures may deteriorate. A material weakness is a deficiency, or a combination of deficiencies, in internal control over financial reporting, such that there is a reasonable possibility that a material misstatement of our annual or interim financial statements will not be prevented or detected on a timely basis.
Management, including our Chief Executive Officer and Chief Financial Officer, assessed the effectiveness of the Company’s internal control over financial reporting as of December 31, 2018. In making this assessment, management used the criteria set forth by the Committee of Sponsoring Organizations of the Treadway Commission (COSO) in Internal Control—Integrated Framework (2013). Based on this assessment, management has concluded that our internal control over financial reporting was not effective as of December 31, 2018, due to the material weakness in our internal control over financial reporting discussed below. We did not have an effective risk assessment process to identify all relevant risks within the process we implemented to account for changes resulting from the recently enacted Tax Cuts and Jobs Act of 2017 (“Tax Act”). As a consequence, we did not design and implement an effective process level control activity over the impact of foreign tax credits on the accounting for the tax liabilities associated with the mandatory repatriation provisions of the Tax Act. The material weakness resulted in a material misstatement in the accrued tax liability and provision for income taxes balances that was corrected prior to the issuance of the 2018 consolidated financial statements included in this Form 10-K. The material weakness created a reasonable possibility that a material misstatement of our annual or interim consolidated financial statements would not be prevented or detected on a timely basis. Therefore, we concluded that our internal control over financial reporting was not effective as of December 31, 2018. The independent registered public accounting firm that audited the Company’s consolidated financial statements included elsewhere in this Annual Report on Form 10-K has issued an adverse opinion on the effectiveness of the Company’s internal control over financial reporting. That report appears immediately following this report. Remediation Management has begun implementing a remediation plan to address the control deficiency that led to the material weakness. The remediation plan includes enhancing our risk assessment process over the judgments and estimates included in new and emerging financial reporting matters. Based on certain outcomes of future risk assessments, we may involve external experts and internal audit may assist in the design of process level control activities. As the Tax Act was a one-time change, there is no remediation required relating to the Tax Act risk assessment process. We currently plan to have our enhanced risk assessment process in place and operating in the first quarter of 2019. Our goal is to remediate this material weakness by the end of 2019.
42
Changes in Internal Control Over Financial Reporting Except for the control deficiency discussed above that has been assessed as a material weakness as of December 31, 2018, and except for the change in our revenue recognition controls resulting from the adoption of ASC 606 as described in Note 2 in the Notes to Consolidated Financial Statements, there were no changes in our internal control over financial reporting that occurred during the quarter ended December 31, 2018, that has materially affected, or is reasonably likely to materially affect, our internal control over financial reporting. Although the new revenue standard is expected to have an immaterial impact on our ongoing revenue recognition, we did implement changes to our processes related to revenue recognition and control activities within them. These included the development of new policies based on the five-step model provided in the new revenue standard, employee training, ongoing contract review and certification requirements, and gathering information provided for disclosures. We will continue to review and document our disclosure controls and procedures, including our internal control over financial reporting, and may from time to time make changes aimed at enhancing their effectiveness and to ensure that our systems evolve with our business.
Report of Independent Registered Public Accounting Firm
To the Stockholders and Board of Directors Watts Water Technologies, Inc.:
Opinion on Internal Control Over Financial Reporting
We have audited Watts Water Technologies, Inc. and subsidiaries (the Company) internal control over financial reporting as of December 31, 2018, based on criteria established in Internal Control – Integrated Framework (2013) issued by the Committee of Sponsoring Organizations of the Treadway Commission. In our opinion, because of the effect of the material weakness, described below, on the achievement of the objectives of the control criteria, the Company has not maintained effective internal control over financial reporting as of December 31, 2018, based on criteria established in Internal Control – Integrated Framework (2013) issued by the Committee of Sponsoring Organizations of the Treadway Commission.
We also have audited, in accordance with the standards of the Public Company Accounting Oversight Board (United States) (PCAOB), the consolidated balance sheets of the Company as of December 31, 2018 and 2017, the related consolidated statements of operations, comprehensive income, stockholders’ equity, and cash flows for each of the years in the three-year period ended December 31, 2018, and the related notes and financial statement Schedule II – Valuation and Qualifying Accounts (collectively, the “consolidated financial statements”), and our report dated February 22, 2019 expressed an unqualified opinion on those consolidated financial statements.
A material weakness is a deficiency, or a combination of deficiencies, in internal control over financial reporting, such that there is a reasonable possibility that a material misstatement of the company’s annual or interim financial statements will not be prevented or detected on a timely basis. A material weakness related to ineffective risk assessment and ineffective process level control activities over the accounting for tax liabilities associated with the Tax Cuts and Jobs Act of 2017 has been identified and included in management’s assessment. The material weakness was considered in determining the nature, timing, and extent of audit tests applied in our audit of the 2018 consolidated financial statements, and this report does not affect our report on those consolidated financial statements. Basis for Opinion The Company’s management is responsible for maintaining effective internal control over financial reporting and for its assessment of the effectiveness of internal control over financial reporting, included in the accompanying Management’s Annual Report on Internal Control Over Financial Reporting. Our responsibility is to express an opinion on the Company’s internal control over financial reporting based on our audit. We are a public accounting firm registered with the PCAOB and are required to be independent with respect to the Company in accordance with the U.S. federal securities laws and the applicable rules and regulations of the Securities and Exchange Commission and the PCAOB. We conducted our audit in accordance with the standards of the PCAOB. Those standards require that we plan and perform the audit to obtain reasonable assurance about whether effective internal control over financial reporting was maintained in all material respects. Our audit of internal control over financial reporting included obtaining an understanding of internal control over financial reporting, assessing the risk that a material weakness exists, and testing

43
and evaluating the design and operating effectiveness of internal control based on the assessed risk. Our audit also included performing such other procedures as we considered necessary in the circumstances. We believe that our audit provides a reasonable basis for our opinion.
Definition and Limitations of Internal Control Over Financial Reporting
A company’s internal control over financial reporting is a process designed to provide reasonable assurance regarding the reliability of financial reporting and the preparation of financial statements for external purposes in accordance with generally accepted accounting principles. A company’s internal control over financial reporting includes those policies and procedures that (1) pertain to the maintenance of records that, in reasonable detail, accurately and fairly reflect the transactions and dispositions of the assets of the company; (2) provide reasonable assurance that transactions are recorded as necessary to permit preparation of financial statements in accordance with generally accepted accounting principles, and that receipts and expenditures of the company are being made only in accordance with authorizations of management and directors of the company; and (3) provide reasonable assurance regarding prevention or timely detection of unauthorized acquisition, use, or disposition of the company’s assets that could have a material effect on the financial statements.
Because of its inherent limitations, internal control over financial reporting may not prevent or detect misstatements. Also, projections of any evaluation of effectiveness to future periods are subject to the risk that controls may become inadequate because of changes in conditions, or that the degree of compliance with the policies or procedures may deteriorate.
/s/ KPMG LLP Boston, Massachusetts February 22, 2019 Item 9B. OTHER INFORMATION.
None.

44
PART III
Item 10. DIRECTORS, EXECUTIVE OFFICERS AND CORPORATE GOVERNANCE. Information with respect to the executive officers of the Company is set forth in Part I, Item 1 of this Report under the caption “Executive Officers and Directors” and is incorporated herein by reference. The information provided under the captions “Information as to Nominees for Director,” “Corporate Governance,” and “Section 16(a) Beneficial Ownership Reporting Compliance” in our definitive Proxy Statement for our 2019 Annual Meeting of Stockholders to be held on May 17, 2019 is incorporated herein by reference.
We have adopted a Code of Business Conduct applicable to all officers, employees and Board members. The Code of Business Conduct is posted in the Investors section of our website, www.wattswater.com. We will provide you with a print copy of our Code of Business Conduct free of charge on written request to our Corporate Secretary, Watts Water Technologies, Inc., 815 Chestnut Street, North Andover, MA 01845. Any amendments to, or waivers of, the Code of Business Conduct which apply to our Chief Executive Officer, Chief Financial Officer, Corporate Controller or any person performing similar functions will be disclosed on our website promptly following the date of such amendment or waiver.
Item 11. EXECUTIVE COMPENSATION. The information provided under the captions “Director Compensation,” “Corporate Governance,” “Compensation Discussion and Analysis,” “Executive Compensation,” “Compensation Committee Interlocks and Insider Participation,” and “Compensation Committee Report” in our definitive Proxy Statement for our 2019 Annual Meeting of Stockholders to be held on May 17, 2019 is incorporated herein by reference.
The “Compensation Committee Report” contained in our Proxy Statement shall not be deemed “soliciting material” or “filed” with the Securities and Exchange Commission or otherwise subject to the liabilities of Section 18 of the Securities Exchange Act of 1934, nor shall it be deemed incorporated by reference in any filings under the Securities Act of 1933 or the Exchange Act, except to the extent we specifically request that such information be treated as soliciting material or specifically incorporate such information by reference into a document filed under the Securities Act or Exchange Act.
Item 12. SECURITY OWNERSHIP OF CERTAIN BENEFICIAL OWNERS AND MANAGEMENT AND
RELATED STOCKHOLDER MATTERS. The information appearing under the caption “Principal Stockholders” in our definitive Proxy Statement for our 2019 Annual Meeting of Stockholders to be held on May 17, 2019 is incorporated herein by reference.

45
Securities Authorized for Issuance Under Equity Compensation Plans The following table provides information as of December 31, 2018, about the shares of Class A common stock that may be issued upon the exercise of stock options, settlement of performance stock awards and vesting of deferred stock awards issued under the Company’s Second Amended and Restated 2004 Stock Incentive Plan, and the settlement of restricted stock units granted under our Management Stock Purchase Plan as well as the number of shares remaining for future issuance under our Second Amended and Restated 2004 Stock Incentive Plan and Management Stock Purchase Plan.
Equity Compensation Plan Information Number of securities remaining Number of securities to be available for future issuance issued upon exercise of Weighted-average exercise under equity compensation outstanding options, price of outstanding options, plan (excluding securities warrants and rights warrants and rights reflected in column (a)) Plan Category (a) (b) (c)
Equity compensation plans approved by security holders 475,298 (1) $ — 1,982,558 (2) Equity compensation plans not approved by security holders None None None Total 475,298 (1) $ — 1,982,558 (2)
(1) Represents 48,751 outstanding options, 248,832 performance stock awards and 23,542 deferred stock awards under
the Second Amended and Restated 2004 Stock Incentive Plan, and 154,173 outstanding restricted stock units under the Management Stock Purchase Plan.
(2) Includes 1,232,137 shares available for future issuance under the Second Amended and Restated 2004 Stock
Incentive Plan, and 750,421 shares available for future issuance under the Management Stock Purchase Plan. Item 13. CERTAIN RELATIONSHIPS AND RELATED TRANSACTIONS, AND DIRECTOR INDEPENDENCE. The information provided under the captions “Corporate Governance” and “Certain Relationships and Related Transactions” in our definitive Proxy Statement for our 2019 Annual Meeting of Stockholders to be held on May 17, 2019 is incorporated herein by reference. Item 14. PRINCIPAL ACCOUNTING FEES AND SERVICES. The information provided under the caption “Ratification of Independent Registered Public Accounting Firm” in our definitive Proxy Statement for our 2019 Annual Meeting of Stockholders to be held on May 17, 2019 is incorporated herein by reference.

46
PART IV
Item 15. EXHIBITS, FINANCIAL STATEMENT SCHEDULES. (a)(1) Financial Statements The following financial statements are included in a separate section of this Report commencing on the page numbers specified below:
Report of Independent Registered Public Accounting Firm 47Consolidated Statements of Operations for the years ended December 31, 2018, 2017 and 2016 48Consolidated Statements of Comprehensive Income for the years ended December 31, 2018, 2017 and 2016 49Consolidated Balance Sheets as of December 31, 2018 and 2017 50Consolidated Statements of Stockholders’ Equity for the years ended December 31, 2018, 2017 and 2016 51Consolidated Statements of Cash Flows for the years ended December 31, 2018, 2017 and 2016 52Notes to Consolidated Financial Statements 53
(a)(2) Schedules
Schedule II—Valuation and Qualifying Accounts for the years ended December 31, 2018, 2017 and 2016 85
All other required schedules for which provision is made in the applicable accounting regulations of the Securities and Exchange Commission are included in the Notes to the Consolidated Financial Statements.
(a)(3) Exhibits The exhibits listed in the Exhibit Index immediately preceding the signature page hereto are filed as part of this Annual Report on Form 10-K. Item 16. FORM 10-K SUMMARY. None.

47
Report of Independent Registered Public Accounting Firm
To the Stockholders and Board of Directors Watts Water Technologies, Inc.:
Opinion on the Consolidated Financial Statements
We have audited the accompanying consolidated balance sheets of Watts Water Technologies, Inc. and subsidiaries (the Company) as of December 31, 2018 and 2017, the related consolidated statements of operations, comprehensive income, stockholders’ equity, and cash flows for each of the years in the three-year period ended December 31, 2018, and the related notes and financial statement Schedule II – Valuation and Qualifying Accounts (collectively, the “consolidated financial statements”). In our opinion, the consolidated financial statements present fairly, in all material respects, the financial position of the Company as of December 31, 2018 and 2017, and the results of its operations and its cash flows for each of the years in the three-year period ended December 31, 2018, in conformity with U.S. generally accepted accounting principles.
We also have audited, in accordance with the standards of the Public Company Accounting Oversight Board (United States) (PCAOB), the Company’s internal control over financial reporting as of December 31, 2018, based on criteria established in Internal Control – Integrated Framework (2013) issued by the Committee of Sponsoring Organizations of the Treadway Commission, and our report dated February 22, 2019 expressed an adverse opinion on the effectiveness of the Company’s internal control over financial reporting.
Basis for Opinion
These consolidated financial statements are the responsibility of the Company’s management. Our responsibility is to express an opinion on these consolidated financial statements based on our audits. We are a public accounting firm registered with the PCAOB and are required to be independent with respect to the Company in accordance with the U.S. federal securities laws and the applicable rules and regulations of the Securities and Exchange Commission and the PCAOB.
We conducted our audits in accordance with the standards of the PCAOB. Those standards require that we plan and perform the audit to obtain reasonable assurance about whether the consolidated financial statements are free of material misstatement, whether due to error or fraud. Our audits included performing procedures to assess the risks of material misstatement of the consolidated financial statements, whether due to error or fraud, and performing procedures that respond to those risks. Such procedures included examining, on a test basis, evidence regarding the amounts and disclosures in the consolidated financial statements. Our audits also included evaluating the accounting principles used and significant estimates made by management, as well as evaluating the overall presentation of the consolidated financial statements. We believe that our audits provide a reasonable basis for our opinion.
/s/ KPMG LLP We have served as the Company’s auditor since 1997.
Boston, Massachusetts February 22, 2019
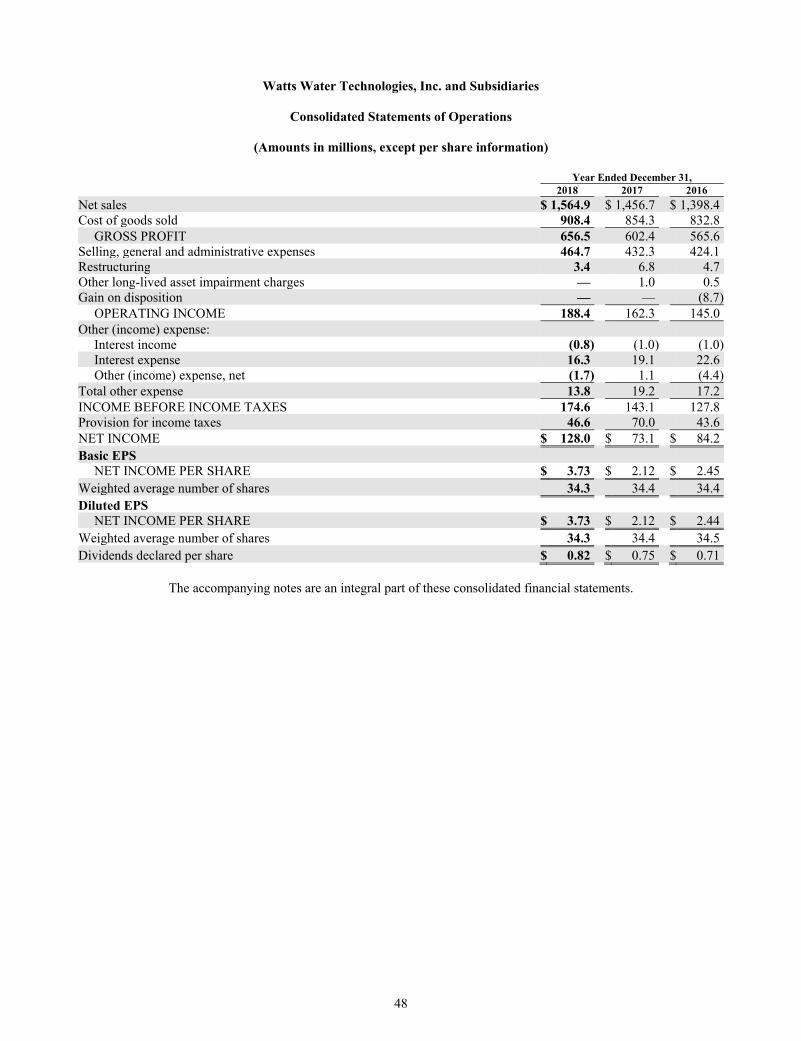
48
Watts Water Technologies, Inc. and Subsidiaries
Consolidated Statements of Operations
(Amounts in millions, except per share information)
Year Ended December 31, 2018 2017 2016
Net sales $ 1,564.9 $ 1,456.7 $ 1,398.4 Cost of goods sold 908.4 854.3 832.8
GROSS PROFIT 656.5 602.4 565.6 Selling, general and administrative expenses 464.7 432.3 424.1 Restructuring 3.4 6.8 4.7 Other long-lived asset impairment charges — 1.0 0.5 Gain on disposition — — (8.7)
OPERATING INCOME 188.4 162.3 145.0 Other (income) expense:
Interest income (0.8) (1.0) (1.0)Interest expense 16.3 19.1 22.6 Other (income) expense, net (1.7) 1.1 (4.4)
Total other expense 13.8 19.2 17.2 INCOME BEFORE INCOME TAXES 174.6 143.1 127.8 Provision for income taxes 46.6 70.0 43.6 NET INCOME $ 128.0 $ 73.1 $ 84.2 Basic EPS
NET INCOME PER SHARE $ 3.73 $ 2.12 $ 2.45 Weighted average number of shares 34.3 34.4 34.4 Diluted EPS
NET INCOME PER SHARE $ 3.73 $ 2.12 $ 2.44 Weighted average number of shares 34.3 34.4 34.5 Dividends declared per share $ 0.82 $ 0.75 $ 0.71
The accompanying notes are an integral part of these consolidated financial statements.

49
Watts Water Technologies, Inc. and Subsidiaries
Consolidated Statements of Comprehensive Income
(Amounts in millions)
Year Ended December 31, 2018 2017 2016
Net income $ 128.0 $ 73.1 $ 84.2 Other comprehensive (loss) income, net of tax: Foreign currency translation adjustments (23.7) 51.1 (32.4)Reversal of foreign currency translation for sale of foreign entity, net of tax — — 6.9 Cash flow hedges 1.7 0.6 2.9 Other comprehensive (loss) income (22.0) 51.7 (22.6)Comprehensive income $ 106.0 $ 124.8 $ 61.6
The accompanying notes are an integral part of these consolidated financial statements.

50
Watts Water Technologies, Inc. and Subsidiaries
Consolidated Balance Sheets
(Amounts in millions, except share information)
December 31, 2018 2017
ASSETS CURRENT ASSETS:
Cash and cash equivalents $ 204.1 $ 280.2 Trade accounts receivable, less allowance for doubtful accounts of $15.0 million at December 31, 2018 and $14.3 million at December 31, 2017 205.5 216.1 Inventories, net 286.8 259.1 Prepaid expenses and other current assets 24.9 26.7 Assets held for sale — 1.5
Total Current Assets 721.3 783.6 PROPERTY, PLANT AND EQUIPMENT
Property, plant and equipment, at cost 537.4 525.8 Accumulated depreciation (335.5) (327.3)Property, plant and equipment, net 201.9 198.5
OTHER ASSETS: Goodwill 544.8 550.5 Intangible assets, net 165.2 185.2 Deferred income taxes 1.6 1.6 Other, net 18.9 17.1
TOTAL ASSETS $ 1,653.7 $ 1,736.5 LIABILITIES AND STOCKHOLDERS’ EQUITY CURRENT LIABILITIES:
Accounts payable $ 127.2 $ 123.8 Accrued expenses and other liabilities 130.6 125.8 Accrued compensation and benefits 60.9 55.3 Current portion of long-term debt 30.0 22.5
Total Current Liabilities 348.7 327.4 LONG-TERM DEBT, NET OF CURRENT PORTION 323.4 474.6 DEFERRED INCOME TAXES 38.5 55.2 OTHER NONCURRENT LIABILITIES 51.8 50.3 STOCKHOLDERS’ EQUITY:
Preferred Stock, $0.10 par value; 5,000,000 shares authorized; no shares issued or outstanding — — Class A common stock, $0.10 par value; 80,000,000 shares authorized; 1 vote per share; issued and outstanding, 27,646,465 shares at December 31, 2018 and 27,724,192 shares at December 31, 2017 2.8 2.8 Class B common stock, $0.10 par value; 25,000,000 shares authorized; 10 votes per share; issued and outstanding, 6,329,290 shares at December 31, 2018 and 6,379,290 shares at December 31, 2017 0.6 0.6 Additional paid-in capital 568.3 551.8 Retained earnings 440.7 372.9 Accumulated other comprehensive loss (121.1) (99.1)
Total Stockholders’ Equity 891.3 829.0 TOTAL LIABILITIES AND STOCKHOLDERS’ EQUITY $ 1,653.7 $ 1,736.5
The accompanying notes are an integral part of these consolidated financial statements.
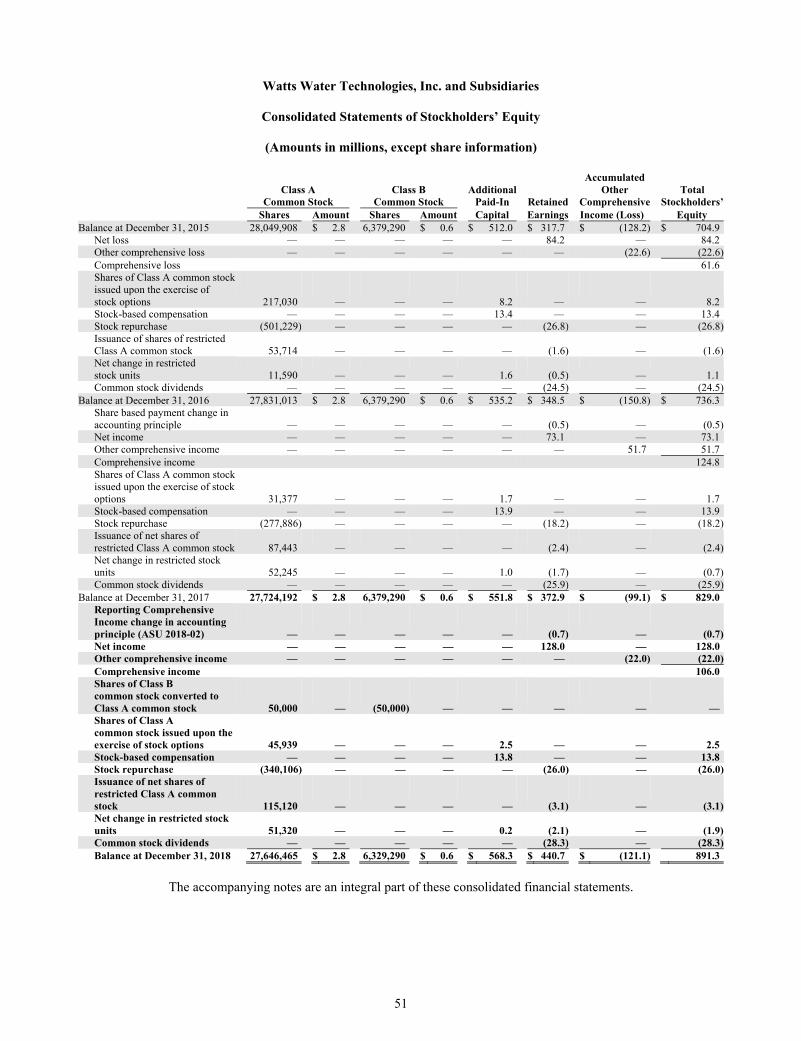
51
Watts Water Technologies, Inc. and Subsidiaries
Consolidated Statements of Stockholders’ Equity
(Amounts in millions, except share information)
Accumulated Class A Class B Additional Other Total Common Stock Common Stock Paid-In Retained Comprehensive Stockholders’ Shares Amount Shares Amount Capital Earnings Income (Loss) Equity Balance at December 31, 2015 28,049,908 $ 2.8 6,379,290 $ 0.6 $ 512.0 $ 317.7 $ (128.2) $ 704.9
Net loss — — — — — 84.2 — 84.2 Other comprehensive loss — — — — — — (22.6) (22.6)Comprehensive loss 61.6 Shares of Class A common stock issued upon the exercise of stock options 217,030 — — — 8.2 — — 8.2 Stock-based compensation — — — — 13.4 — — 13.4 Stock repurchase (501,229) — — — — (26.8) — (26.8)Issuance of shares of restricted Class A common stock 53,714 — — — — (1.6) — (1.6)Net change in restricted stock units 11,590 — — — 1.6 (0.5) — 1.1 Common stock dividends — — — — — (24.5) — (24.5)
Balance at December 31, 2016 27,831,013 $ 2.8 6,379,290 $ 0.6 $ 535.2 $ 348.5 $ (150.8) $ 736.3 Share based payment change in accounting principle — — — — — (0.5) — (0.5)Net income — — — — — 73.1 — 73.1 Other comprehensive income — — — — — — 51.7 51.7 Comprehensive income 124.8 Shares of Class A common stock issued upon the exercise of stock options 31,377 — — — 1.7 — — 1.7 Stock-based compensation — — — — 13.9 — — 13.9 Stock repurchase (277,886) — — — — (18.2) — (18.2)Issuance of net shares of restricted Class A common stock 87,443 — — — — (2.4) — (2.4)Net change in restricted stock units 52,245 — — — 1.0 (1.7) — (0.7)Common stock dividends — — — — — (25.9) — (25.9)
Balance at December 31, 2017 27,724,192 $ 2.8 6,379,290 $ 0.6 $ 551.8 $ 372.9 $ (99.1) $ 829.0 Reporting Comprehensive Income change in accounting principle (ASU 2018-02) — — — — — (0.7) — (0.7)Net income — — — — — 128.0 — 128.0 Other comprehensive income — — — — — — (22.0) (22.0)Comprehensive income 106.0 Shares of Class B common stock converted to Class A common stock 50,000 — (50,000) — — — — — Shares of Class A common stock issued upon the exercise of stock options 45,939 — — — 2.5 — — 2.5 Stock-based compensation — — — — 13.8 — — 13.8 Stock repurchase (340,106) — — — — (26.0) — (26.0)Issuance of net shares of restricted Class A common stock 115,120 — — — — (3.1) — (3.1)Net change in restricted stock units 51,320 — — — 0.2 (2.1) — (1.9)Common stock dividends — — — — — (28.3) — (28.3)Balance at December 31, 2018 27,646,465 $ 2.8 6,329,290 $ 0.6 $ 568.3 $ 440.7 $ (121.1) 891.3
The accompanying notes are an integral part of these consolidated financial statements.
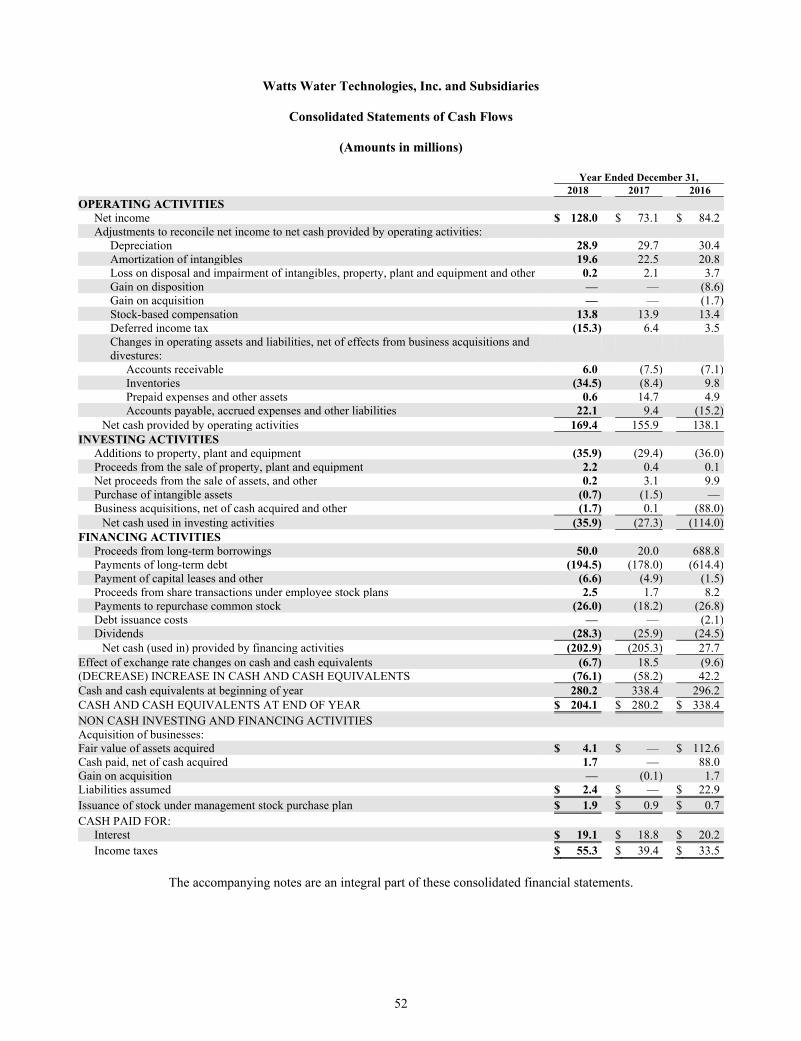
52
Watts Water Technologies, Inc. and Subsidiaries
Consolidated Statements of Cash Flows
(Amounts in millions)
Year Ended December 31, 2018 2017 2016 OPERATING ACTIVITIES
Net income $ 128.0 $ 73.1 $ 84.2 Adjustments to reconcile net income to net cash provided by operating activities:
Depreciation 28.9 29.7 30.4 Amortization of intangibles 19.6 22.5 20.8 Loss on disposal and impairment of intangibles, property, plant and equipment and other 0.2 2.1 3.7 Gain on disposition — — (8.6)Gain on acquisition — — (1.7)Stock-based compensation 13.8 13.9 13.4 Deferred income tax (15.3) 6.4 3.5 Changes in operating assets and liabilities, net of effects from business acquisitions and divestures:
Accounts receivable 6.0 (7.5) (7.1)Inventories (34.5) (8.4) 9.8 Prepaid expenses and other assets 0.6 14.7 4.9 Accounts payable, accrued expenses and other liabilities 22.1 9.4 (15.2)
Net cash provided by operating activities 169.4 155.9 138.1 INVESTING ACTIVITIES
Additions to property, plant and equipment (35.9) (29.4) (36.0)Proceeds from the sale of property, plant and equipment 2.2 0.4 0.1 Net proceeds from the sale of assets, and other 0.2 3.1 9.9 Purchase of intangible assets (0.7) (1.5) — Business acquisitions, net of cash acquired and other (1.7) 0.1 (88.0)
Net cash used in investing activities (35.9) (27.3) (114.0)FINANCING ACTIVITIES
Proceeds from long-term borrowings 50.0 20.0 688.8 Payments of long-term debt (194.5) (178.0) (614.4)Payment of capital leases and other (6.6) (4.9) (1.5)Proceeds from share transactions under employee stock plans 2.5 1.7 8.2 Payments to repurchase common stock (26.0) (18.2) (26.8)Debt issuance costs — — (2.1)Dividends (28.3) (25.9) (24.5)
Net cash (used in) provided by financing activities (202.9) (205.3) 27.7 Effect of exchange rate changes on cash and cash equivalents (6.7) 18.5 (9.6)(DECREASE) INCREASE IN CASH AND CASH EQUIVALENTS (76.1) (58.2) 42.2 Cash and cash equivalents at beginning of year 280.2 338.4 296.2 CASH AND CASH EQUIVALENTS AT END OF YEAR $ 204.1 $ 280.2 $ 338.4 NON CASH INVESTING AND FINANCING ACTIVITIES Acquisition of businesses: Fair value of assets acquired $ 4.1 $ — $ 112.6 Cash paid, net of cash acquired 1.7 — 88.0 Gain on acquisition — (0.1) 1.7 Liabilities assumed $ 2.4 $ — $ 22.9 Issuance of stock under management stock purchase plan $ 1.9 $ 0.9 $ 0.7 CASH PAID FOR:
Interest $ 19.1 $ 18.8 $ 20.2 Income taxes $ 55.3 $ 39.4 $ 33.5
The accompanying notes are an integral part of these consolidated financial statements.

53
Watts Water Technologies, Inc. and Subsidiaries
Notes to Consolidated Financial Statements (1) Description of Business Watts Water Technologies, Inc. (the Company) is a leading supplier of products and solutions that conserve water and manage the flow of fluids and energy into, through and out of buildings in the commercial and residential markets of the Americas, Europe, and Asia-Pacific, Middle East, and Africa (APMEA). For over 140 years, the Company has designed and produced valve systems that safeguard and regulate water systems, energy efficient heating and hydronic systems, drainage systems and water filtration technology that helps purify and conserve water.
(2) Accounting Policies Principles of Consolidation The consolidated financial statements include the accounts of the Company and its majority and wholly owned subsidiaries. Upon consolidation, all intercompany accounts and transactions are eliminated.
Cash Equivalents Cash equivalents consist of instruments with remaining maturities of three months or less at the date of purchase and consist primarily of money market funds, for which the carrying amount is a reasonable estimate of fair value.
Allowance for Doubtful Accounts The allowance for doubtful accounts is established to represent the Company’s best estimate of the net realizable value of the outstanding accounts receivable. The development of the Company’s allowance for doubtful accounts varies by region but in general is based on a review of past due amounts, historical write-off experience, as well as aging trends affecting specific accounts and general operational factors affecting all accounts. In addition, factors are developed in certain regions utilizing historical trends of sales and returns and allowances and cash discount activities to derive a reserve for returns and allowances and cash discounts.
The Company uniformly considers current economic trends and changes in customer payment terms when evaluating the adequacy of the allowance for doubtful accounts. The Company also aggressively monitors the creditworthiness of the Company’s largest customers and periodically reviews customer credit limits to reduce risk. If circumstances relating to specific customers change or unanticipated changes occur in the general business environment, the Company’s estimates of the recoverability of receivables could be further adjusted.
Concentration of Credit The Company sells products to a diversified customer base and, therefore, has no significant concentrations of credit risk. In 2018, 2017, and 2016, no customer accounted for 10% or more of the Company’s total sales or accounts receivable. Inventories Inventories are stated at the lower of cost or market, using the first-in, first-out method. Market value is determined by replacement cost or net realizable value. Historical usage is used as the basis for determining the reserve for excess or obsolete inventories.
Goodwill and Other Intangible Assets Goodwill is recorded when the consideration paid for acquisitions exceeds the fair value of net tangible and intangible assets acquired. Goodwill and other intangible assets with indefinite useful lives are not amortized, but rather are tested for impairment at least annually or more frequently if events or circumstances indicate that it is “more likely than not”

54
that they might be impaired, such as from a change in business conditions. The Company performs its annual goodwill and indefinite-lived intangible assets impairment assessment in the fourth quarter of each year. Long-Lived Assets Intangible assets with estimable lives and other long-lived assets are reviewed for indicators of impairment at least quarterly or more frequently if events or changes in circumstances indicate that the carrying amount of an asset or asset group may not be recoverable. Property, Plant and Equipment Property, plant and equipment are recorded at cost. Depreciation is provided on a straight-line basis over the estimated useful lives of the assets, which range from 10 to 40 years for buildings and improvements and 3 to 15 years for machinery and equipment. Leasehold improvements are depreciated over the lesser of the economic useful life of the asset or the remaining lease term.
Taxes, Other than Income Taxes Taxes assessed by governmental authorities on sale transactions are recorded on a net basis and excluded from sales in the Company’s consolidated statements of operations.
Income Taxes Income taxes are accounted for under the asset and liability method. Deferred tax assets and liabilities are recognized for the future tax consequences attributable to differences between the financial statement carrying amounts of existing assets and liabilities and their respective tax bases and operating loss and tax credit carry forwards. Deferred tax assets and liabilities are measured using enacted tax rates expected to apply to taxable income in the years in which those temporary differences are expected to be recovered or settled. The effect on deferred tax assets and liabilities of a change in tax rates is recognized in income in the period that includes the enactment date.
The Company recognizes tax benefits when the item in question meets the more–likely–than-not (greater than 50% likelihood of being sustained upon examination by the taxing authorities) threshold.
As of December 31, 2018, the Company had gross unrecognized tax benefits of approximately $10.2 million, approximately $4.5 million of which, if recognized, would affect the effective tax rate. The difference between the amount of unrecognized tax benefits and the amount that would affect the effective tax rate consists of the federal tax benefit of state income tax items and allowable correlative adjustments that are available for certain jurisdictions.
A reconciliation of the beginning and ending amount of unrecognized tax is as follows:
(in millions)
Balance at January 1, 2018 $ 7.7 Increases related to prior year tax positions 2.5 Increases related to current year tax provisions 2.5 Settlements (2.1)Currency movement (0.4)Balance at December 31, 2018 $ 10.2
The Company estimates that it is reasonably possible that the balance of unrecognized tax benefits as of December 31, 2018 may decrease by approximately $0.5 million in the next twelve months, as a result of lapses in statutes of limitations and settlements of open audits.
In February 2018, the United States Internal Revenue Service concluded an audit of the Company’s 2015 and 2016 tax years. There were no material adjustments as a result of the audit. The Company conducts business in a variety of locations throughout the world resulting in tax filings in numerous domestic and foreign jurisdictions. The Company is subject to tax examinations regularly as part of the normal course of business. The Company’s major jurisdictions are the U.S., France, Germany, Canada, and the Netherlands. The statute of limitations in the U.S. is subject to tax examination

55
for 2015 and later; France, Germany, Canada and the Netherlands are subject to tax examination for 2012-2014 and later. All other jurisdictions, with few exceptions, are no longer subject to tax examinations in state, local or international jurisdictions for tax years before 2013.
The Company accounts for interest and penalties related to uncertain tax positions as a component of income tax expense.
Foreign Currency Translation
The functional currency for most of the Company’s foreign subsidiaries is their local currency. For non-U.S. subsidiaries that transact in a functional currency other than the U.S. dollar, assets and liabilities are translated at current rates of exchange at the balance sheet date. Income and expense items are translated at the average foreign currency exchange rates for the period. Adjustments resulting from the translation of the financial statements of foreign operations into U.S. dollars are excluded from the determination of net income and are recorded in accumulated other comprehensive income, a separate component of equity. For subsidiaries where the functional currency of the assets and liabilities differs from the local currency, non-monetary assets and liabilities are translated at the rate of exchange in effect on the date assets were acquired while monetary assets and liabilities are translated at current rates of exchange as of the balance sheet date. Income and expense items are translated at the average foreign currency rates for the period. Translation adjustments of these subsidiaries are included in other (income) expense, net in the consolidated statements of operations.
Stock-Based Compensation The Company records compensation expense in the financial statements for share-based awards based on the grant date fair value of those awards for restricted stock awards and deferred stock awards. Stock-based compensation expense for restricted stock awards and deferred stock awards is recognized over the requisite service periods of the awards on a straight-line basis, which is generally commensurate with the vesting term. The performance stock units offered by the Company to employees are amortized to expense over the vesting period, and based on the Company’s performance relative to the performance goals, may be adjusted. Changes to the estimated shares expected to vest will result in adjustments to the related share-based compensation expense that will be recorded in the period of change. In March 2016, the FASB issued ASU 2016-09, “Improvements to Employee Share-Based Payment Accounting,” and the Company adopted this standard in the first quarter of 2017 with an immaterial change to retained earnings. As part of the adoption of this standard, the Company elected to account for forfeitures as they occur, rather than estimate expected forfeitures over the vesting period of the respective grant. The Company also no longer reclassifies the benefits associated with tax deductions in excess of recognized compensation cost from operating activities to financing activities in the Consolidated Statement of Cash Flows.
At December 31, 2018, the Company had one stock-based compensation plan with total unrecognized compensation costs related to unvested stock-based compensation arrangements of approximately $17.4 million and a total weighted average remaining term of 1.61 years. For 2018, 2017 and 2016, the Company recognized compensation costs related to stock-based programs of approximately $13.8 million, $13.9 million and $13.4 million, respectively. For 2018, 2017 and 2016 stock compensation expense, $0.9 million, $0.8 million and $0.9 million, respectively, was recorded in cost of goods sold and $12.9 million, $13.1 million and $12.5 million, respectively, was recorded in selling, general and administrative expenses. For 2017 and 2016, the Company recorded approximately $0.1 million and $0.8 million, respectively, of tax benefits for the compensation expense relating to its stock options. For 2018, 2017 and 2016, the Company recorded approximately $2.8 million, $3.9 million and $2.8 million, respectively, of tax benefit for its other stock-based plans. For 2018, 2017 and 2016, the recognition of total stock-based compensation expense impacted both basic and diluted net income per common share by $0.32, $0.28 and $0.29, respectively.
Net Income Per Common Share Basic net income per common share is calculated by dividing net income by the weighted average number of common shares outstanding. The calculation of diluted net income per share assumes the conversion of all dilutive securities.

56
Net income and the number of shares used to compute net income per share, basic and assuming full dilution, are reconciled below:
Year Ended December 31, 2018 2017 2016 Per Per Per Net Share Net Share Net Share Income Shares Amount Income Shares Amount Income Shares Amount (Amounts in millions, except per share information) Basic EPS $ 128.0 34.3 $ 3.73 $ 73.1 34.4 $ 2.12 $ 84.2 34.4 $ 2.45 Dilutive securities, principally common stock options — — — — — — — 0.1 (0.01)Diluted EPS $ 128.0 34.3 $ 3.73 $ 73.1 34.4 $ 2.12 $ 84.2 34.5 $ 2.44
The computation of diluted net income per share for the year ended December 31, 2016 excludes the effect of the potential exercise of options to purchase approximately 0.1 million shares because the exercise price of the option was greater than the average market price of the Class A common stock and the effect would have been anti-dilutive.
Financial Instruments In the normal course of business, the Company manages risks associated with commodity prices, foreign exchange rates and interest rates through a variety of strategies, including the use of hedging transactions, executed in accordance with the Company’s policies. The Company’s hedging transactions include, but are not limited to, the use of various derivative financial and commodity instruments. As a matter of policy, the Company does not use derivative instruments unless there is an underlying exposure. Any change in value of the derivative instruments would be substantially offset by an opposite change in the value of the underlying hedged items. The Company does not use derivative instruments for trading or speculative purposes.
Derivative instruments may be designated and accounted for as either a hedge of a recognized asset or liability (fair value hedge) or a hedge of a forecasted transaction (cash flow hedge). For a fair value hedge, both the effective and ineffective portions of the change in fair value of the derivative instrument, along with an adjustment to the carrying amount of the hedged item for fair value changes attributable to the hedged risk, are recognized in earnings. For a cash flow hedge, changes in the fair value of the derivative instrument that are highly effective are deferred in accumulated other comprehensive income or loss until the underlying hedged item is recognized in earnings. The Company has two interest rate swaps designated as cash flow hedges as of December 31, 2018 and 2017. The Company also has foreign exchange hedges designated as cash flow hedges as of December 31, 2018. Refer to Note 17 for further details.
If a fair value or cash flow hedge were to cease to qualify for hedge accounting or be terminated, it would continue to be carried on the balance sheet at fair value until settled, but hedge accounting would be discontinued prospectively. If a forecasted transaction were no longer probable of occurring, amounts previously deferred in accumulated other comprehensive income would be recognized immediately in earnings. On occasion, the Company may enter into a derivative instrument that does not qualify for hedge accounting because it is entered into to offset changes in the fair value of an underlying transaction which is required to be recognized in earnings (natural hedge). These instruments are reflected in the Consolidated Balance Sheets at fair value with changes in fair value recognized in earnings. Portions of the Company’s outstanding debt are exposed to interest rate risks. The Company monitors its interest rate exposures on an ongoing basis to maximize the overall effectiveness of its interest rates.
Fair Value Measurements Fair value is defined as the exchange price that would be received for an asset or paid to transfer a liability (an exit price) in the principal or most advantageous market for the asset or liability in an orderly transaction between market participants on the measurement date. An entity is required to maximize the use of observable inputs, where available, and minimize the use of unobservable inputs when measuring fair value.

57
The Company has certain financial assets and liabilities that are measured at fair value on a recurring basis and certain nonfinancial assets and liabilities that may be measured at fair value on a nonrecurring basis. The fair value disclosures of these assets and liabilities are based on a three-level hierarchy, which is defined as follows:
Level 1 Quoted prices in active markets for identical assets or liabilities that the entity has
the ability to access at the measurement date. Level 2 Observable inputs other than Level 1 prices, such as quoted prices for similar assets
or liabilities, quoted prices in markets that are not active or other inputs that are observable or can be corroborated by observable market data for substantially the full term of the assets or liabilities.
Level 3 Unobservable inputs that are supported by little or no market activity and that are
significant to the fair value of the assets or liabilities.
Assets and liabilities subject to this hierarchy are classified in their entirety based on the lowest level of input that is significant to the fair value measurement. The Company’s assessment of the significance of a particular input to the fair value measurement in its entirety requires judgment and considers factors specific to the asset or liability. Refer to Note 17 for further details.
Shipping and Handling Shipping and handling costs included in selling, general and administrative expense amounted to $56.3 million, $52.1 million and $47.9 million for the years ended December 31, 2018, 2017 and 2016, respectively.
Research and Development Research and development costs included in selling, general, and administrative expense amounted to $34.5 million, $29.0 million and $26.5 million for the years ended December 31, 2018, 2017 and 2016, respectively.
Revenue Recognition The Company recognizes revenue under the core principle to depict the transfer of control to the Company’s customers in an amount reflecting the consideration to which the Company expects to be entitled. In order to achieve that core principle, the Company applies the following five-step approach: (1) identify the contract with a customer, (2) identify the performance obligations in the contract, (3) determine the transaction price, (4) allocate the transaction price to the performance obligations in the contract, and (5) recognize revenue when a performance obligation is satisfied. The Company’s revenue for product sales is recognized on a point in time model, at the point control transfers to the customer, which is generally when products are shipped from the Company’s manufacturing or distribution facilities or when delivered to the customer’s named location. Sales tax, value-added tax, or other taxes collected concurrent with revenue producing activities are excluded from revenue. Freight costs billed to customers for shipping and handling activities are included in revenue with the related cost included in selling, general and administrative expenses. See Note 4 for further disclosures and detail regarding revenue recognition.
Basis of Presentation Certain amounts in the 2017 and 2016 consolidated financial statements have been reclassified to permit comparison with the 2018 presentation, including from adoption of recent accounting standards. These reclassifications had no effect on reported results of operations or stockholders' equity.
Estimates The preparation of financial statements in conformity with accounting principles generally accepted in the United States requires management to make estimates and assumptions that affect the reported amounts of assets and liabilities and disclosure of contingent assets and liabilities at the date of the financial statements and the reported amounts of revenues and expenses during the reporting period. Actual results could differ from those estimates.

58
Recently Adopted Accounting Standards In February 2018, the FASB issued ASU 2018-02 “Income Statement-Reporting Comprehensive Income.” ASU 2018-02 provides guidance on the reclassification of certain tax effects from the 2017 Tax Cuts and Jobs Act (“2017 Tax Act”) from accumulated other comprehensive income. Current generally accepted accounting principles requires deferred tax liabilities and deferred tax assets to be adjusted for the effect of a change in tax laws or tax rates, with that effect included in income from operations in the period of enactment. This included the income tax effects of items in accumulated other comprehensive income. This guidance allows a reclassification from accumulated other comprehensive income to retained earnings for the tax effects on items in accumulated other comprehensive income related to the change in tax rates from the 2017 Tax Act. This standard is effective for all entities for fiscal years beginning after December 15, 2018, including interim periods within that reporting period. Early adoption of this standard is permitted. The Company adopted this standard in the first quarter of 2018, and it did not have a material impact on the Company’s financial statements.
On January 1, 2018, the Company adopted the accounting standard ASC 606, Revenue from Contracts with Customers and all the related amendments (“new revenue standard” or “ASU 2014-09”) to all contracts using the modified retrospective method. The adoption of ASU 2014-09 was not material to the Company and as such, there was no cumulative effect upon the January 1, 2018 adoption date. As the impact of the new revenue standard is not material to the Company, there is no pro-forma disclosure presented for the year ended December 31, 2018. The Company expects the impact of the adoption of the new standard to be immaterial to the Company’s financial statements on an ongoing basis. See “Revenue Recognition” within this Note 2 and Note 4 of Notes to Consolidated Financial Statements in this Annual Report Form 10-K for further details. In October 2016, the FASB issued ASU 2016-16 “Intra-Entity Transfers of Assets Other than Inventory.” ASU 2016-16 provides guidance on the timing of recognition of tax consequences of an intra-entity transfer of an asset other than inventory. The Company adopted the provision of this ASU during the first quarter of 2018, using the modified retrospective approach through a cumulative-effect adjustment to retained earnings as of the beginning of the quarter. The adoption of this guidance did not have a material impact on the Company’s financial statements. Accounting Standards Updates In August 2018, the FASB issued ASU 2018-15 “Intangibles-Goodwill and Other-Internal-Use Software (Subtopic 350-40)-Customer’s Accounting for Implementation Costs Incurred in a Cloud Computing Arrangement that is a Service Contract.” ASU 2018-15 aligns the requirements for capitalizing implementation costs incurred in a hosting arrangement that is a service contract with the requirements for capitalizing implementation costs incurred to develop or obtain internal-use software. This guidance requires an entity in a hosting arrangement that is a service contract to follow the guidance in Subtopic 350-40 to determine which implementation costs to capitalize as an asset related to the service contract and which costs to expense. This standard is effective for fiscal years beginning after December 15, 2019, including interim periods within that reporting period. The Company is currently evaluating the impact of this guidance on the Company’s financial statements, and does not expect the adoption of this guidance to have a material impact on the Company’s financial statements.
In August 2018, the FASB issued ASU 2018-13 “Fair Value Measurement (Topic 820)-Disclosure Framework- Changes to the Disclosure Requirements for Fair Value Measurement.” ASU 2018-13 modifies the disclosure requirements on fair value measurements under Topic 820. This standard is effective for fiscal years beginning after December 15, 2019, including interim periods within that reporting period. The Company is currently evaluating the impact of this guidance on the Company’s disclosures; however, this guidance does not impact the Company’s financial statements.
In August 2017, the FASB issued ASU 2017-12 “Derivatives and Hedging (Topic 815)-Targeted Improvements to Accounting for Hedging Activities.” ASU 2017-12 amends the hedge accounting guidance to improve the financial reporting of hedging relationships to better portray the economic results of an entity’s risk management activities in the financial statements. This guidance permits hedge accounting for risk components in hedging relationships that involve nonfinancial risk, reduces complexity in hedging for fair value hedges of interest rate risk, eliminates the requirement to separately measure and report hedging ineffectiveness, and simplifies certain hedge effectiveness assessment requirements. This standard is effective for fiscal years beginning after December 15, 2018, including interim periods within that reporting period. The Company is currently evaluating the impact of this guidance, including transition

59
elections and required disclosures, on its financial statements, and does not expect the adoption of this guidance to have a material impact on the Company’s financial statements.
In February 2016, the FASB issued ASU 2016-02, “Leases (Topic 842).” ASU 2016-02 requires a lessee to recognize in the statement of financial position a liability to make lease payments and a right-of-use asset representing the right to use the underlying asset for the lease term for both finance and operating leases with a term longer than twelve months. Topic 842 was subsequently amended by ASU 2018-01, “Land Easement Practical Expedient for Transition to Topic 842,” ASU 2018-10, “Codification Improvements to Topic 842, Leases,” and ASU 2018-11 “Targeted Improvements.” ASU 2016-02 is effective for financial statements issued for annual periods beginning after December 15, 2018 and all interim periods thereafter. Early adoption is permitted for all entities. A modified retrospective transition approach is required, applying the new standard to all leases existing at the date of initial application. The Company may choose to use either 1) the effective date of the standard or 2) the beginning of the earliest comparable period presented in the financial statements as the date of initial application. The Company adopted the new standard on January 1, 2019 and used the effective date of the standard as the date of the Company’s initial application. By electing this approach, the financial information and the disclosures required under the new standard will not be provided for dates and periods before January 1, 2019. The new standard provides a number of optional practical expedients throughout the transition. The Company elected the “package of practical expedients,” which permits the Company to not reassess under the new standard the Company’s prior conclusions about lease identification, lease classification, and initial direct costs. The Company did not elect the use-of-hindsight or the practical expedient pertaining to land easements, the latter not being applicable to the Company. The new standard also provides practical expedients for an entity’s ongoing accounting. The Company elected the short-term lease recognition exemption for all leases that qualify. This means, for those leases that qualify, the Company will not recognize right-of-use assets or lease liabilities, and this includes not recognizing right-of-use assets or lease liabilities for existing short-term leases of those assets in transition. The Company also elected the practical expedient not to separate lease and non-lease components for all of the Company’s leases. The Company completed its analysis of the impacts of the new lease standard, and has designed the necessary changes to its existing processes and configured all system requirements that are required to implement this new standard. The Company has a variety of categories of lease arrangements, including real estate, automobiles, manufacturing equipment, facility equipment, office equipment and certain service arrangements. The Company has reviewed its leasing arrangements in order to evaluate the impact of this standard on the Company’s financial statements, and expects to record a right-of-use asset in the range of $25-40 million and a lease liability in the range of $25-40 million related to the recognition, on a discounted basis, of the Company’s minimum commitments under non-cancelable operating leases on its consolidated balance sheets in the first quarter of 2019. The Company currently does not expect ASC 842 to have a material effect on either its consolidated statement of operations or its consolidated statement of cash flow. (3) Restructuring and Other Charges, Net The Company’s Board of Directors approves all major restructuring programs that may involve the discontinuance of significant product lines or the shutdown of significant facilities. From time to time, the Company takes additional restructuring actions, including involuntary terminations that are not part of a major program. The Company accounts for these costs in the period that the liability is incurred. These costs are included in restructuring charges in the Company’s consolidated statements of operations. A summary of the pre-tax cost by restructuring program is as follows:
Year Ended December 31, 2018 2017 2016 (in millions)
Restructuring costs: 2015 Actions $ — $ 2.4 $ 2.1 Other Actions 3.4 4.4 2.6 Total restructuring charges $ 3.4 $ 6.8 $ 4.7

60
The Company recorded pre-tax restructuring in its business segments as follows:
Year Ended December 31, 2018 2017 2016 (in millions)
Americas $ — $ 3.1 $ 1.6 Europe 3.4 3.3 3.4 APMEA — 0.4 0.2 Corporate — — (0.5)Total $ 3.4 $ 6.8 $ 4.7
Other Actions The Company periodically initiates other actions which are not part of a major program. Total “Other Actions” pre-tax restructuring expense was $3.4 million for the year ended December 31, 2018. Included in “Other Actions” are European restructuring activities initiated in 2018 and 2017, as well as certain other minor initiatives, for which the Company incurred restructuring expenses or adjusted prior restructuring reserves in the year ended December 31, 2018.
In the third quarter of 2018, management initiated restructuring actions primarily associated with the European headquarters as well as cost savings initiatives at certain European manufacturing facilities. These actions included reductions in force and other related costs within the Company’s Europe segment. The pre-tax charges for the year ended December 31, 2018 were approximately $4.0 million and primarily included severance benefits. The total restructuring charges associated with the program are estimated to be approximately $5.0 million with costs expected to be fully incurred within the year ending December 31, 2019. The restructuring reserve associated with these actions is approximately $2.2 million as of December 31, 2018, and primarily relates to severance benefits.
In the fourth quarter of 2017, management initiated certain restructuring actions related to reductions in force within the Company’s Europe segment. The restructuring activities primarily included severance benefits. The total pre-tax charges associated with the Europe restructuring activities were initially expected to be approximately $4.1 million with costs being fully incurred in 2017. The company reduced its total pre-tax charges for the program to approximately $3.4 million as of September 30, 2018, primarily related to reduced severance costs. The restructuring reserve associated with these actions is approximately $0.2 million as of December 31, 2018, and relates to severance benefits.
In the fourth quarter of 2015, management initiated certain restructuring actions and strategic initiatives with respect to the Company’s Europe segment in response to the ongoing economic challenges in Europe and additional product rationalization. The restructuring actions included severance benefits and limited costs relating to asset write-offs, professional fees and relocation. The total pre-tax charge for the Europe 2015 restructuring initiatives was $7.7 million.
The following table summarizes total expected, incurred and remaining pre-tax restructuring costs for the Europe 2015 restructuring actions:
Facility Legal and Exit Severance consultancy and other Total (in millions)
Costs incurred—2015 $ 6.6 $ — $ 0.3 $ 6.9 Costs incurred—2016 1.3 0.5 — 1.8 Adjustments to restructuring costs—2017 (1.0) — — (1.0)Total restructuring costs $ 6.9 $ 0.5 $ 0.3 $ 7.7

61
Details of the Company’s Europe 2015 restructuring reserve activity for the year ended December 31, 2018 are as follows:
Legal and Facility exit Severance Consultancy and other Total (in millions)
Balance at December 31, 2015 $ 6.4 $ — $ — $ 6.4 Net pre-tax restructuring charges 1.3 0.5 — 1.8 Utilization and foreign currency impact (2.9) (0.5) — (3.4)Balance at December 31, 2016 $ 4.8 $ — $ — $ 4.8 Net pre-tax restructuring charges (1.0) — — (1.0)Utilization and foreign currency impact (2.8) — — (2.8)Balance at December 31, 2017 $ 1.0 $ — $ — $ 1.0 Net pre-tax restructuring adjustments — — — — Utilization and foreign currency impact (0.9) — — (0.9)Balance at December 31, 2018 $ 0.1 $ — $ — $ 0.1
2015 Actions in the Americas and APMEA In 2015, the Board of Directors of the Company approved a transformation program relating to the Company’s Americas and APMEA businesses, which primarily involved the exit of low-margin, non-core product lines, and enhancing global sourcing capabilities (“phase one”). The Company eliminated approximately $165 million of the combined Americas and APMEA net sales primarily within the Company’s do-it-yourself (DIY) distribution channel. As part of the exit of non-core product lines, the Company entered into an agreement to sell an operating subsidiary in China that was dedicated exclusively to the manufacturing of products being discontinued. The sale was finalized in the second quarter of 2016, and the Company recognized a pre-tax gain of $8.7 million and received proceeds from the sale of $8.4 million.
The second phase of the program involved the consolidation of manufacturing facilities and distribution center network optimization, including reducing the square footage of the Company’s Americas facilities, which together with phase one, reduced the Americas net operating footprint by approximately 30%. This phase of the program was designed to improve the utilization of the Company’s remaining facilities, better leverage its cost structure, reduce working capital, and improve execution of customer delivery requirements. As of December 31, 2017, the second phase was complete.
On a combined basis, the total pre-tax cost for the Company’s transformation program related to its Americas and APMEA businesses was $59.8 million, including restructuring costs of $18.1 million, goodwill and intangible asset impairments of $13.5 million and other transformation and deployment costs of approximately $28.2 million. The other transformation and deployment costs included consulting and project management fees, inventory write-offs, and other associated costs. All costs associated with the Americas and APMEA transformation program were incurred as of December 31, 2017.
The following table summarizes by type, the total incurred pre-tax restructuring costs for the Company’s transformation program related to its Americas and APMEA businesses (phase one and phase two combined):
Facility Legal and Asset exit Severance consultancy write-downs and other Total (in millions)
Costs incurred—2015 $ 8.5 $ 0.7 $ 1.6 $ 2.8 $ 13.6 Costs incurred—2016 (1.5) 0.2 2.9 0.5 2.1 Costs incurred—2017 — — 2.2 0.2 2.4 Total restructuring costs $ 7.0 $ 0.9 $ 6.7 $ 3.5 $ 18.1

62
Details of the restructuring reserve activity for the Company’s Americas and APMEA 2015 transformation program for the year ended December 31, 2018 are as follows:
Facility Legal and Asset exit Severance consultancy write-downs and other Total (in millions)
Balance at December 31, 2015 $ 5.0 $ 0.4 $ — $ 1.0 $ 6.4 Net pre-tax restructuring charges (1.5) 0.2 2.9 0.5 2.1 Utilization and foreign currency impact (2.3) (0.6) (2.9) (1.5) (7.3)Balance at December 31, 2016 $ 1.2 $ — $ — $ — $ 1.2 Net pre-tax restructuring charges — — 2.2 0.2 2.4 Utilization and foreign currency impact (1.0) — (2.2) (0.2) (3.4)Balance at December 31, 2017 $ 0.2 $ — $ — $ — $ 0.2 Net pre-tax restructuring charges — — — — — Utilization and foreign currency impact (0.2) — — — (0.2)Balance at December 31, 2018 $ — $ — $ — $ — $ —
(4) Revenue Recognition The Company is a leading supplier of products that manage and conserve the flow of fluids and energy into, through and out of buildings in the commercial and residential markets. The Company has designed and produced valve systems that safeguard and regulate water systems, energy efficient heating and hydronic systems, drainage systems and water filtration technology that helps purify and conserve water. The Company distributes products through four primary distribution channels: wholesale, original equipment manufacturers (OEMs), specialty, and do-it-yourself (DIY). The Company operates in three geographic segments: Americas, Europe, and APMEA. Each of these segments sells similar products, which are comprised of the following principal product lines:
• Residential & commercial flow control products—includes products typically sold into plumbing and hot water applications such as backflow preventers, water pressure regulators, temperature and pressure relief valves, and thermostatic mixing valves.
• HVAC & gas products—includes commercial high-efficiency boilers, water heaters and heating solutions, hydronic and electric heating systems for under-floor radiant applications, custom heat and hot water solutions, hydronic pump groups for boiler manufacturers and alternative energy control packages, and flexible stainless steel connectors for natural and liquid propane gas in commercial food service and residential applications. HVAC is an acronym for heating, ventilation and air conditioning.
• Drainage & water re-use products—includes drainage products and engineered rain water harvesting solutions for commercial, industrial, marine and residential applications.
• Water quality products—includes point-of-use and point-of-entry water filtration, conditioning and scale prevention systems for both commercial and residential applications.

63
The following table disaggregates revenue, which is presented as net sales in the financial statements, for each reportable segment, by distribution channel and principal product line:
Year ended December 31, 2018 (in millions)
Distribution Channel Americas Europe APMEA Consolidated
Wholesale $ 578.8 $ 314.2 $ 59.9 $ 952.9 OEM 79.0 150.0 1.4 230.4 Specialty 312.1 — 4.5 316.6 DIY 62.2 2.8 — 65.0
Total $ 1,032.1 $ 467.0 $ 65.8 $ 1,564.9
Year ended December 31, 2018
(in millions)
Principal Product Line Americas Europe APMEA Consolidated
Residential & Commercial Flow Control $ 582.0 $ 176.2 $ 46.2 $ 804.4 HVAC and Gas Products 289.2 201.6 16.2 507.0 Drainage and Water Re-use Products 73.1 87.8 2.2 163.1 Water Quality Products 87.8 1.4 1.2 90.4
Total $ 1,032.1 $ 467.0 $ 65.8 $ 1,564.9 The Company generally considers customer purchase orders, which in some cases are governed by master sales agreements, to represent the contract with a customer. The Company’s contracts with customers are generally for products only and typically do not include other performance obligations such as professional services, extended warranties, or other material rights. In situations where sales are to a distributor, the Company has concluded that its contracts are with the distributor as the Company holds a contract bearing enforceable rights and obligations only with the distributor. As part of its consideration of the contract, the Company evaluates certain factors including the customer’s ability to pay (or credit risk). For each contract, the Company considers the promise to transfer products, each of which is distinct, to be the identified performance obligation. In determining the transaction price, the Company evaluates whether the price is subject to refund or adjustment to determine the net consideration to which the Company expects to be entitled. As the Company’s standard payment terms are less than one year, the Company has elected the practical expedient under ASC 606-10-32-18 not to assess whether a contract has a significant financing component. The Company allocates the transaction price to each distinct product based on its relative standalone selling price. The product price as specified on the purchase order is considered the standalone selling price as it is an observable input which depicts the price as if sold to a similar customer in similar circumstances. Revenue is recognized when control of the product is transferred to the customer (i.e., when the Company’s performance obligation is satisfied), which typically occurs at shipment from the Company’s manufacturing site or distribution center, or delivery to the customer’s named location. In certain circumstances, revenue from shipments to retail customers is recognized only when the product is consumed by the customer, as based on the terms of the arrangement, transfer of control is not satisfied until that point in time. In determining whether control has transferred, the Company considers if there is a present right to payment, physical possession and legal title, along with risks and rewards of ownership having transferred to the customer. In certain circumstances, the Company manufactures customized product without alternative use for its customers. However, as these arrangements do not entitle the Company to a right to payment of cost plus a profit for work completed, the Company has concluded that control transfers at the point in time and not over time. Occasionally, the Company receives orders for products to be delivered over multiple dates that may extend across reporting periods. The Company invoices for each delivery upon shipment and recognizes revenues for each distinct product delivered, assuming transfer of control has occurred. As scheduled delivery dates are within one year, under the optional exemption provided by ASC 606-10-50-14, revenues allocated to future shipments of partially completed contracts are not disclosed. The Company generally provides an assurance warranty that its products will substantially conform to the published specification. The Company’s liability is limited to either a credit equal to the purchase price or replacement of the defective part. Returns under warranty have historically been immaterial. The Company does not consider activities related to such warranty, if any, to be a separate performance obligation. For certain of its products, the Company will separately sell extended warranty and service policies to its customers. The Company considers the sale of the extended warranty a separate performance obligation. These policies typically are for periods ranging from one to three years.
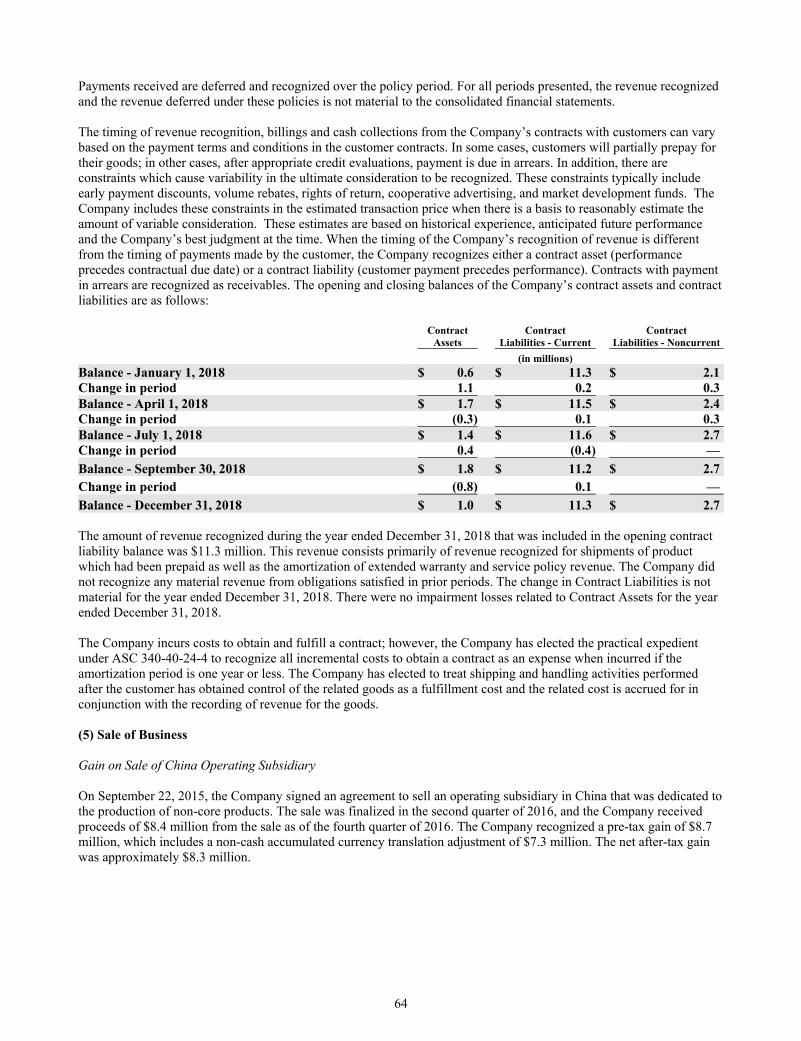
64
Payments received are deferred and recognized over the policy period. For all periods presented, the revenue recognized and the revenue deferred under these policies is not material to the consolidated financial statements. The timing of revenue recognition, billings and cash collections from the Company’s contracts with customers can vary based on the payment terms and conditions in the customer contracts. In some cases, customers will partially prepay for their goods; in other cases, after appropriate credit evaluations, payment is due in arrears. In addition, there are constraints which cause variability in the ultimate consideration to be recognized. These constraints typically include early payment discounts, volume rebates, rights of return, cooperative advertising, and market development funds. The Company includes these constraints in the estimated transaction price when there is a basis to reasonably estimate the amount of variable consideration. These estimates are based on historical experience, anticipated future performance and the Company’s best judgment at the time. When the timing of the Company’s recognition of revenue is different from the timing of payments made by the customer, the Company recognizes either a contract asset (performance precedes contractual due date) or a contract liability (customer payment precedes performance). Contracts with payment in arrears are recognized as receivables. The opening and closing balances of the Company’s contract assets and contract liabilities are as follows:
Contract Contract Contract Assets Liabilities - Current Liabilities - Noncurrent
(in millions)
Balance - January 1, 2018 $ 0.6 $ 11.3 $ 2.1 Change in period 1.1 0.2 0.3 Balance - April 1, 2018 $ 1.7 $ 11.5 $ 2.4 Change in period (0.3) 0.1 0.3 Balance - July 1, 2018 $ 1.4 $ 11.6 $ 2.7 Change in period 0.4 (0.4) —
Balance - September 30, 2018 $ 1.8 $ 11.2 $ 2.7 Change in period (0.8) 0.1 —
Balance - December 31, 2018 $ 1.0 $ 11.3 $ 2.7 The amount of revenue recognized during the year ended December 31, 2018 that was included in the opening contract liability balance was $11.3 million. This revenue consists primarily of revenue recognized for shipments of product which had been prepaid as well as the amortization of extended warranty and service policy revenue. The Company did not recognize any material revenue from obligations satisfied in prior periods. The change in Contract Liabilities is not material for the year ended December 31, 2018. There were no impairment losses related to Contract Assets for the year ended December 31, 2018. The Company incurs costs to obtain and fulfill a contract; however, the Company has elected the practical expedient under ASC 340-40-24-4 to recognize all incremental costs to obtain a contract as an expense when incurred if the amortization period is one year or less. The Company has elected to treat shipping and handling activities performed after the customer has obtained control of the related goods as a fulfillment cost and the related cost is accrued for in conjunction with the recording of revenue for the goods. (5) Sale of Business Gain on Sale of China Operating Subsidiary On September 22, 2015, the Company signed an agreement to sell an operating subsidiary in China that was dedicated to the production of non-core products. The sale was finalized in the second quarter of 2016, and the Company received proceeds of $8.4 million from the sale as of the fourth quarter of 2016. The Company recognized a pre-tax gain of $8.7 million, which includes a non-cash accumulated currency translation adjustment of $7.3 million. The net after-tax gain was approximately $8.3 million.
65
(6) Business Acquisitions PVI Industries, LLC On November 2, 2016, the Company acquired 100% of the shares of PVI Riverside Holdings, Inc., the parent company of PVI Industries, LLC (“PVI”). The aggregate purchase price, including the final working capital adjustment, was approximately $79.1 million. PVI is a leading manufacturer of commercial stainless steel water heating equipment, focused on the high capacity market in North America and is based in Fort Worth, Texas. PVI’s water heater product offering complements AERCO’s boiler products, allowing the Company to address customers’ heating and hot water requirements. The results for PVI are included in the Company’s Americas segment. The Company accounted for the transaction as a purchased business combination and the acquisition was funded partially with available cash and partially from borrowings under the Company’s Credit Agreement. During the second quarter of 2017, the Company finalized the purchase price allocation for the PVI purchase. The acquisition resulted in the recognition of $41.1 million in goodwill and $31.0 million in intangible assets. The intangible assets acquired consist of customer relationships valued at $17.6 million with estimated lives of 15 years, developed technology valued at $10.2 million with estimated lives of 10 years, and the trade name valued at $3.2 million with an estimated life of 20 years. The goodwill is attributable to the workforce of PVI and the strategic platform adjacency that will allow Watts to extend its product offerings as a result of the acquisition. Approximately $6.9 million of the goodwill is deductible for tax purposes.
(7) Goodwill & Intangibles Goodwill The Company performs its annual goodwill impairment testing for each reporting unit as of fiscal October month end or earlier if there is a triggering event or circumstance that indicates an impairment loss may have occurred. As of the October 28, 2018 testing date, the Company had $544.3 million of goodwill on its balance sheet. In 2018, the Company had eight reporting units. One of these reporting units, Water Quality, had no goodwill. The Company performed a qualitative analysis for each of the seven remaining reporting units, which include Blücher, Dormont, US Drains, Europe, Residential and Commercial, Heating and Hot Water Solutions (“HHWS”) and APMEA. As a result of the qualitative analyses, the Company determined that the fair values of the reporting units were more likely than not greater than the carrying amounts. In 2018, the Company did not need to proceed beyond the qualitative analysis, and no goodwill impairments were recorded. In the fourth quarter of 2017, the Company performed a quantitative impairment analysis for the HHWS reporting unit in connection with the annual strategic plan and due to underperformance to budget, primarily caused by continuing softness in the condensing boiler market, weakness in the Company’s tankless water heater products and competitive pricing pressure. The Company estimated the fair value of the reporting unit using a weighted calculation of the income approach and the market approach. The income approach calculated the present value of expected future cash flows. The guideline public company method (market approach) calculated the estimated fair values based on valuation multiples derived from stock prices and enterprise values of publicly traded companies that are comparable to the reporting unit. The estimated fair value of the reporting unit exceeded the carrying value in 2017 and therefore, no impairment was recorded.

66
The changes in the carrying amount of goodwill by geographic segment are as follows:
December 31, 2018 Gross Balance Accumulated Impairment Losses Net Goodwill Acquired Foreign Balance During Currency Balance Balance Impairment Balance January 1, the Translation December 31, January 1, Loss During December 31, December 31, 2018 Period (1) and Other 2018 2018 the Period 2018 2018 (in millions)
Americas $ 437.4 1.5 (0.8) 438.1 $ (24.5) — (24.5) 413.6 Europe 249.3 — (5.6) 243.7 (129.7) — (129.7) 114.0 APMEA 30.9 — (0.8) 30.1 (12.9) — (12.9) 17.2
Total $ 717.6 1.5 (7.2) 711.9 $ (167.1) — (167.1) 544.8
(1) Americas goodwill additions during 2018 relate to immaterial acquisitions.
December 31, 2017 Gross Balance Accumulated Impairment Losses Net Goodwill Acquired Foreign Balance During Currency Balance Balance Impairment Balance January 1, the Translation December 31, January 1, Loss During December 31, December 31, 2017 Period and Other 2017 2017 the Period 2017 2017 (in millions)
Americas $ 434.7 2.0 0.7 437.4 $ (24.5) — (24.5) 412.9 Europe 234.9 — 14.4 249.3 (129.7) — (129.7) 119.6 APMEA 30.2 — 0.7 30.9 (12.9) — (12.9) 18.0
Total $ 699.8 2.0 15.8 717.6 $ (167.1) — (167.1) 550.5 Long-Lived Assets Indefinite-lived intangibles are tested for impairment at least annually or more frequently if events or circumstances, such as a change in business conditions, indicate that it is “more likely than not” that an intangible asset might be impaired. The Company performs its annual indefinite-lived intangibles impairment assessment in the fourth quarter of each year. For the 2018, 2017 and 2016 impairment assessments, the Company performed quantitative assessments for all indefinite-lived intangible assets. The methodology employed was the relief from royalty method, a subset of the income approach. Based on the results of the assessment, the Company did not recognize an impairment on any indefinite-lived intangibles in 2018 or 2017. In 2016, Company recognized non-cash pre-tax impairment charges of approximately $0.4 million related to a trade name in the Europe segment.
Intangible assets with estimable lives and other long-lived assets are reviewed for impairment whenever events or changes in circumstances indicate that the carrying amount of an asset or asset group may not be recoverable. Recoverability of intangible assets with estimable lives and other long-lived assets is measured by a comparison of the carrying amount of an asset or asset group to future net undiscounted pre-tax cash flows expected to be generated by the asset or asset group. If these comparisons indicate that an asset is not recoverable, the impairment loss recognized is the amount by which the carrying amount of the asset or asset group exceeds the related estimated fair value. Estimated fair value is based on either discounted future pre-tax operating cash flows or appraised values, depending on the nature of the asset. The Company determines the discount rate for this analysis based on the weighted average cost of capital using the market and guideline public companies for the related businesses and does not allocate interest charges to the asset or asset group being measured. Judgment is required to estimate future operating cash flows. In the fourth quarter of 2017, the Company recognized a $1.0 million impairment charge in the Americas segment for a technology asset as a change in market expectations indicated the carrying amount of this asset was no longer recoverable. In 2016, the Company recognized a $0.1 million impairment charge on long-lived assets.

67
Intangible assets include the following:
December 31, 2018 December 31, 2017 Gross Net Gross Net Carrying Accumulated Carrying Carrying Accumulated Carrying Amount Amortization Amount Amount Amortization Amount (in millions)
Patents $ 16.1 $ (15.8) $ 0.3 $ 16.1 $ (15.4) $ 0.7 Customer relationships 232.9 (146.9) 86.0 233.2 (133.5) 99.7 Technology 54.6 (27.3) 27.3 53.9 (23.1) 30.8 Trade names 26.1 (11.5) 14.6 25.5 (9.7) 15.8 Other 4.3 (3.5) 0.8 6.9 (6.0) 0.9
Total amortizable intangibles 334.0 (205.0) 129.0 335.6 (187.7) 147.9
Indefinite-lived intangible assets 36.2 — 36.2 37.3 — 37.3 $ 370.2 $ (205.0) $ 165.2 $ 372.9 $ (187.7) $ 185.2
Aggregate amortization expense for amortized intangible assets for 2018, 2017 and 2016 was $19.6 million, $22.5 million and $20.8 million, respectively. Additionally, future amortization expense on amortizable intangible assets is expected to be $17.2 million for 2019, $16.2 million for 2020, $14.6 million for 2021, $13.5 million for 2022, and $11.6 million for 2023. Amortization expense is provided on a straight-line basis over the estimated useful lives of the intangible assets. The weighted-average remaining life of total amortizable intangible assets is 12.1 years. Patents, customer relationships, technology, trade names and other amortizable intangibles have weighted-average remaining lives of 3.3 years, 11.0 years, 7.2 years, 13.7 years and 19.1 years, respectively. Indefinite-lived intangible assets primarily include trade names and trademarks. (8) Inventories, net Inventories consist of the following:
December 31, 2018 2017 (in millions)
Raw materials $ 87.4 $ 81.8 Work-in-process 17.3 17.5 Finished goods 182.1 159.8 $ 286.8 $ 259.1
Raw materials, work-in-process and finished goods are net of valuation reserves of $27.4 million and $28.2 million as of December 31, 2018 and 2017, respectively. Finished goods of $17.4 million and $17.5 million as of December 31, 2018 and 2017, respectively, were consigned.

68
(9) Property, Plant and Equipment Property, plant and equipment consist of the following:
December 31, 2018 2017 (in millions)
Land $ 14.1 $ 14.5 Buildings and improvements 165.7 164.6 Machinery and equipment 342.2 336.9 Construction in progress 15.4 9.8 537.4 525.8 Accumulated depreciation (335.5) (327.3) $ 201.9 $ 198.5
(10) Income Taxes The significant components of the Company’s deferred income tax liabilities and assets are as follows:
December 31, 2018 2017 (in millions)
Deferred income tax liabilities: Excess tax over book depreciation $ 16.2 $ 13.5 Intangibles 33.8 37.1 Goodwill 17.4 16.3 Foreign earnings 5.1 14.6 Other 3.2 5.7
Total deferred tax liabilities 75.7 87.2 Deferred income tax assets:
Accrued expenses 16.0 17.8 Capital loss carry forward — 0.3 Foreign tax credits 33.5 22.0 Net operating loss carry forward 6.1 6.5 Inventory reserves 6.0 5.8 Other 7.1 9.9
Total deferred tax assets 68.7 62.3 Less: valuation allowance (29.9) (28.7)
Net deferred tax assets 38.8 33.6 Net deferred tax liabilities $ (36.9) $ (53.6)
The provision for income taxes is based on the following pre-tax income:
Year Ended December 31, 2018 2017 2016 (in millions)
Domestic $ 103.2 $ 80.3 $ 64.8 Foreign 71.4 62.8 63.0 $ 174.6 $ 143.1 $ 127.8

69
The provision for income taxes consists of the following:
Year Ended December 31, 2018 2017 2016 (in millions)
Current tax expense: Federal $ 24.7 $ 42.1 $ 18.3 Foreign 29.0 17.3 17.2 State 7.7 4.2 3.9
61.4 63.6 39.4 Deferred tax expense (benefit):
Federal (3.2) 4.0 3.6 Foreign (7.7) 8.5 0.6 State (1.9) 5.9 —
(12.8) 18.4 4.2 Deferred tax remeasurement of the 2017 Tax Act (2.0) (12.0) — $ 46.6 $ 70.0 $ 43.6
The 2017 Tax Cuts and Jobs Act (“2017 Tax Act”) was enacted on December 22, 2017 and has resulted in significant changes to the U.S. corporate income tax system. These changes included lowering the U.S. Corporate income tax rate from 35% to 21% and the elimination or reduction of certain domestic deductions and credits. The 2017 Tax Act also transitioned international taxation from a worldwide system to a modified territorial system creating new taxes on certain foreign-sourced earnings and certain related party payments, which are referred to as the Global Intangible Low-taxed Income Tax and the Annual Anti-Base Erosion Tax, respectively. The 2017 Tax Act also imposed a one-time mandatory deemed repatriation tax (“Toll Tax”) on foreign subsidiaries’ previously untaxed accumulated foreign earnings. Due to the timing of the enactment and the complexity involved applying the provisions of the 2017 Tax Act, the Company made reasonable estimates of the effects and recorded provisional amounts in its December 31, 2017 financial statements. In December 2017, the SEC staff issued Staff Accounting Bulletin No. 118, Income Tax Accounting Implications of the Tax Cuts and Jobs Act (SAB 118), which allows companies to record provisional amounts during a measurement period not to extend beyond one year of the enactment date. Adjustments made to the provisional amounts allowed under SAB 118 were identified and recorded as discrete adjustments as described in the following paragraphs. Changes in tax rates and tax laws are accounted for in the period of enactment. Therefore, the Company recorded a provisional tax expense of $25.1 million related to the 2017 Tax Act, as of December 31, 2017. This amount also included an immaterial benefit to the Company’s 2017 current year tax expense. During the year ended December 31, 2018, the Company finalized the impact of the 2017 Tax Act and recorded a benefit of $3.7 million, reducing the net impact to $21.4 million. Included in the 2018 adjustment was a $10.6 million benefit related to the determination of our foreign tax credits and partial release of a related valuation allowance, partially offset by additional Toll Tax of $10.2 million. Toll Tax The 2017 Tax Act imposed a one-time Toll Tax requiring the Company to pay U.S. income taxes on accumulated foreign subsidiary earnings not previously subject to U.S. income tax at a rate of 15.5% to the extent of foreign cash and cash equivalents and 8% on the remaining earnings. For the year ended December 31, 2017, the Company recorded a provisional amount of $23.3 million related to the Toll Tax. As of December 31, 2018, the Company recorded tax expense based on final guidance on the 2017 Tax Act of $10.2 million, resulting in a total Toll Tax charge of $33.5 million which is being paid over eight years starting in 2018 and will not accrue interest. Deferred Tax Remeasurement As the Company’s deferred tax liabilities exceeded the balance of the Company’s deferred tax assets, for the year ended December 31, 2017 the Company recorded a provisional amount of tax benefit of $12 million, and as of December 31, 2018 the Company recorded a final tax benefit of $2 million, for a net $14 million benefit, reflecting the decrease in the U.S. Corporate income tax rate.
70
Tax on Foreign Earnings As a result of the 2017 Tax Act, the Company can repatriate its cumulative undistributed foreign earning back to the U.S. with minimal U.S. income tax consequences other than the one-time Toll Tax. The Company recorded a provisional amount of deferred tax expense of $14.6 million, and as of December 31, 2018 the Company recorded a final tax benefit of $2 million, for a net deferred tax expense of $12.6 million for the future repatriation of foreign earnings. Actual income taxes reported are different than what would have been computed by applying the federal statutory tax rate to income before income taxes. The reasons for these differences are as follows:
Year Ended December 31, 2018 2017 2016 (in millions)
Computed expected federal income expense $ 36.6 $ 50.1 $ 44.7 State income taxes, net of federal tax benefit 5.3 2.7 2.2 Foreign tax rate differential 2.7 (6.7) (6.7)Impact of the 2017 Tax Act (3.7) 25.1 — Unrecognized tax benefits 3.2 — — Other, net 2.5 (1.2) 3.4 $ 46.6 $ 70.0 $ 43.6
At December 31, 2018, the Company had foreign net operating loss carry forwards of $24.6 million for income tax purposes before considering valuation allowances; $24.6 million of the losses can be carried forward indefinitely. The net operating losses consist of $24.6 million related to Austrian operations.
At December 31, 2018, all U.S. capital loss carry forwards were utilized or expired. At December 31, 2018 and December 31, 2017, the Company had foreign tax credit carry forwards of $33.5 million and $22.0 million, respectively, for income tax purposes before considering valuation allowances. The foreign tax credit carryforwards expire in 2027 and 2028.
At December 31, 2018 and December 31, 2017, the Company had valuation allowances of $29.9 million and $28.7 million, respectively. At December 31, 2018, $23.8 million related to foreign tax credits and $6.1 million related to Austrian net operating losses. At December 31, 2017, $0.3 million related to U.S. capital losses, $22.0 million related to foreign tax credits and $6.4 million related to Austrian net operating losses. Management believes that the ability of the Company to use such foreign tax credits and losses within the applicable carry forward period does not rise to the level of the more likely than not threshold. The Company does not have a valuation allowance on other deferred tax assets, as management believes that it is more likely than not that the Company will recover the net deferred tax assets. Management believes it is more likely than not that the future reversals of the deferred tax liabilities, together with forecasted income, will be sufficient to fully recover the deferred tax assets. After December 31, 2017 the Company considered all of its foreign earnings to be permanently reinvested outside of the U.S. and has no plans to repatriate these foreign earnings to the U.S.
(11) Accrued Expenses and Other Liabilities Accrued expenses and other liabilities consist of the following:
December 31, 2018 2017 (in millions)
Commissions and sales incentives payable $ 46.3 $ 40.1 Product liability and workers’ compensation 22.3 24.5 Other 54.6 57.6 Income taxes payable 7.4 3.6 $ 130.6 $ 125.8
71
(12) Financing Arrangements
The Company’s debt consists of the following:
December 31, 2018 2017 (in millions)
5.05% notes due June 2020 $ 75.0 75.0 Term Loan due February 2021 255.0 277.5 Line of Credit due February 2021 25.0 147.0 Total debt outstanding 355.0 499.5 Less debt issuance costs (deduction from debt liability) (1.6) (2.4)Less current maturities (30.0) (22.5)Total long-term debt $ 323.4 $ 474.6
Principal payments during each of the next five years and thereafter are due as follows (in millions): 2019—$30.0; 2020—$105.0; 2021—$220.0; and 2022 and thereafter - $0.
On February 12, 2016, the Company entered into a Credit Agreement (the “Credit Agreement”) among the Company, certain subsidiaries of the Company who become borrowers under the Credit Agreement, JPMorgan Chase Bank, N.A., as Administrative Agent, Swing Line Lender and Letter of Credit Issuer, and the other lenders referred to therein. The Credit Agreement provides for a $500 million, five-year, senior unsecured revolving credit facility (the “Revolving Credit Facility”) with a sublimit of up to $100 million in letters of credit. As of December 31, 2018, the Company had $25.0 million drawn on the line of credit. The Credit Agreement also provides for a $300 million, five-year, term loan facility (the “Term Loan Facility”) available to the Company in a single draw, of which the entire $300 million had been drawn in February 2016. The Company had $255.0 million of borrowings outstanding on the term loan as of December 31, 2018. Borrowings outstanding under the Revolving Credit Facility bear interest at a fluctuating rate per annum equal to an applicable percentage defined as (i) in the case of Eurocurrency rate loans, the ICE Benchmark Administration LIBOR rate plus an applicable percentage, ranging from 0.975% to 1.45%, determined by reference to the Company’s consolidated leverage ratio, or (ii) in the case of base rate loans and swing line loans, the highest of (a) the federal funds rate plus 0.5%, (b) the rate of interest in effect for such day as announced by JPMorgan Chase Bank, N.A. as its “prime rate,” and (c) the ICE Benchmark Administration LIBOR rate plus 1.0%, plus an applicable percentage, ranging from 0.00% to 0.45%, determined by reference to the Company’s consolidated leverage ratio. Borrowings outstanding under the Term Loan Facility will bear interest at a fluctuating rate per annum equal to an applicable percentage defined as the ICE Benchmark Administration LIBOR rate plus an applicable percentage, ranging from 1.125% to 1.75%, determined by reference to the Company’s consolidated leverage ratio. The interest rates as of December 31, 2018 on the Revolving Credit Facility and on the Term Loan Facility were 3.50% and 3.86%, respectively.
The loan under the Term Loan Facility amortizes as follows: 0% per annum during the first year, 7.5% in the second and third years, 10% in the fourth and fifth years, and the remaining unpaid balance paid in full on the maturity date. Payments when due are made ratably each year in quarterly installments. The Company paid quarterly installments of $22.5 million during 2018. In addition to paying interest under the Credit Agreement, the Company is also required to pay certain fees in connection with the credit facility, including, but not limited to, an unused facility fee and letter of credit fees. The Credit Agreement matures on February 12, 2021, subject to extension under certain circumstances and subject to the terms of the Credit Agreement. The Company may repay loans outstanding under the Credit Agreement from time to time without premium or penalty, other than customary breakage costs, if any, and subject to the terms of the Credit Agreement. Once repaid, amounts borrowed under the Term Loan Facility may not be borrowed again.
The Company maintains letters of credit that guarantee its performance or payment to third parties in accordance with specified terms and conditions. Amounts outstanding were $25.8 million as of December 31, 2018 and $25.7 million as of December 31, 2017. The Company’s letters of credit are primarily associated with insurance coverage. The Company’s letters of credit generally expire within one year of issuance and are drawn down against the Revolving Credit Facility. These instruments may exist or expire without being drawn down. Therefore, they do not necessarily represent future cash flow obligations.
As of December 31, 2018, the Company had $449.2 million of unused and available credit under the Credit Agreement and $25.8 million of stand-by letters of credit outstanding on the Credit Agreement. As of December 31, 2018, the Company was in compliance with all covenants related to the Credit Agreement.
72
On June 18, 2010, the Company entered into a note purchase agreement with certain institutional investors (the 2010 Note Purchase Agreement). Pursuant to the 2010 Note Purchase Agreement, the Company issued senior notes of $75.0 million in principal, due June 18, 2020. The Company pays interest on the outstanding balance of the Notes at the rate of 5.05% per annum, payable semi-annually on June 18th and December 18th until the principal on the Notes shall become due and payable. The Company may, at its option, upon notice, and subject to the terms of the 2010 Note Purchase Agreement, prepay at any time all or part of the Notes in an amount not less than $1.0 million by paying the principal amount plus a make-whole amount, which is dependent upon the yield of respective U.S. Treasury securities. The 2010 Note Purchase Agreement includes operational and financial covenants, with which the Company is required to comply, including, among others, maintenance of certain financial ratios and restrictions on additional indebtedness, liens and dispositions. As of December 31, 2018, the Company was in compliance with all covenants related to the 2010 Note Purchase Agreement. (13) Common Stock The Class A common stock and Class B common stock have equal dividend and liquidation rights. Each share of the Company’s Class A common stock is entitled to one vote on all matters submitted to stockholders and each share of Class B common stock is entitled to ten votes on all such matters. Shares of Class B common stock are convertible into shares of Class A common stock on a one-to-one basis at the option of the holder. As of December 31, 2018, the Company had reserved a total of 2,581,389 shares of Class A common stock for issuance under its stock-based compensation plans and 6,329,290 shares for conversion of Class B common stock to Class A common stock.
On July 27, 2015, the Company’s Board of Directors authorized the repurchase of up to $100 million of the Company’s Class A common stock from time to time on the open market or in privately negotiated transactions. In connection with this stock repurchase program, the Company entered into a Rule 10b5-1 plan, which permits shares to be repurchased when the Company might otherwise be precluded from doing so under insider trading laws. The repurchase program may be suspended or discontinued at any time, subject to the terms of the Rule 10b5-1 plan the Company entered into with respect to the repurchase program. As of December 31, 2018, there was approximately $11.8 million remaining authorized for share repurchases under this program. The following table summarizes the cost and the number of shares of Class A common stock repurchased under the July 27, 2015 programs for the years ended December 31, 2018 and 2017:
Year Ended December 31, 2018 2017 Number of shares Cost of shares Number of shares Cost of shares repurchased repurchased repurchased repurchased (amounts in millions, except share amount)
Stock repurchase programs: July 27, 2015 340,106 26.0 277,886 18.2
Total 340,106 $ 26.0 277,886 $ 18.2
(14) Stock-Based Compensation As of December 31, 2018, the Company maintains one stock incentive plan, the Second Amended and Restated 2004 Stock Incentive Plan (the “2004 Stock Incentive Plan”). At December 31, 2018, 1,232,137 shares of Class A common stock were authorized for future grants of new equity awards under this plan. The Company grants shares of restricted stock and deferred stock awards to key employees and stock awards to non-employee members of the Company’s Board of Directors under the 2004 Stock Incentive Plan. Stock awards to non-employee members of the Company’s Board of Directors vest immediately. Employees’ restricted stock awards and deferred stock awards typically vest over a three-year period at the rate of one-third per year. The restricted stock awards and deferred stock awards are amortized to expense on a straight-line basis over the vesting period.
The Company also grants performance stock units to key employees under the 2004 Stock Incentive Plan. Performance stock units cliff vest at the end of a performance period set by the Compensation Committee of the Board of Directors at the time of grant. Upon vesting, the number of shares of the Company’s Class A common stock awarded to each performance stock unit recipient will be determined based on the Company’s performance relative to certain performance goals set at the time the performance stock units were granted. The recipient of a performance stock unit

73
award may earn from zero shares to twice the number of target shares awarded to such recipient. The performance stock units are amortized to expense over the vesting period, and based on the Company’s performance relative to the performance goals, may be adjusted. Changes to the estimated shares expected to vest will result in adjustments to the related share-based compensation expense that will be recorded in the period of change. If the performance goals are not met, no awards are earned and previously recognized compensation expense is reversed. The Company granted performance stock units in 2018, 2017 and 2016. The performance goals for the performance stock units are based on the compound annual growth rate of the Company’s revenue over the three-year performance period and the Company’s return on invested capital (“ROIC”) for the third year of the performance period.
Beginning in 2015, the Company stopped granting stock options as part of its annual equity awards to employees. Previously under the 2004 Stock Incentive Plan, key employees were granted nonqualified stock options to purchase the Company’s Class A common stock. Options typically became exercisable over a four-year period at the rate of 25% per year and expire ten years after the grant date. However, most options granted in 2014 become exercisable over a three-year period at a rate of one-third per year. Options granted under the plan may have exercise prices of not less than 100% of the fair market value of the Class A common stock on the date of grant. The Company’s practice was to grant all options at fair market value on the grant date. Upon exercise of options, the Company issues shares of Class A common stock.
The Company also has a Management Stock Purchase Plan that allows for the granting of restricted stock units (RSUs) to key employees. On an annual basis, key employees may elect to receive a portion of their annual incentive compensation in RSUs instead of cash. Participating employees may use up to 50% of their annual incentive bonus to purchase RSUs for a purchase price equal to 80% of the fair market value of the Company’s Class A common stock as of the date of grant. RSUs vest either annually over a three-year period from the grant date or upon the third anniversary of the grant date. Receipt of the shares underlying RSUs is deferred for a minimum of three years, or such greater number of years as is chosen by the employee, from the date of grant. An aggregate of 2,000,000 shares of Class A common stock may be issued under the Management Stock Purchase Plan. At December 31, 2018, 750,421 shares of Class A common stock were authorized for future grants under the Company’s Management Stock Purchase Plan.
2004 Stock Incentive Plan The following is a summary of unvested restricted stock and deferred stock awards activity and related information:
Year Ended December 31, 2018 2017 2016 Weighted Weighted Weighted Average Average Average Grant Date Grant Date Grant Date Shares Fair Value Shares Fair Value Shares Fair Value (Shares in thousands)
Unvested at beginning of year 217 $ 57.31 210 $ 53.79 244 $ 52.61 Granted 153 80.52 139 60.88 140 56.33 Cancelled/Forfeitures (126) 59.52 (9) 55.55 (42) 54.43 Vested (28) 66.24 (123) 55.35 (132) 53.10 Unvested at end of year 216 $ 71.28 217 $ 57.31 210 $ 53.79
The total fair value of shares vested during 2018, 2017 and 2016 was $10.2 million, $7.7 million and $7.9 million, respectively. At December 31, 2018, total unrecognized compensation cost related to unvested restricted stock and deferred stock awards was approximately $10.0 million with a total weighted average remaining term of 1.70 years. For 2018, 2017 and 2016, the Company recognized compensation costs of $7.6 million, $6.9 million and $7.6 million, respectively.
The aggregate intrinsic value of restricted stock and deferred shares granted and outstanding approximated $13.9 million representing the total pre-tax intrinsic value based on the Company’s closing Class A common stock price of $64.53 as of December 31, 2018.

74
The following is a summary of unvested performance stock award activity and related information:
Year Ended December 31, 2018 2017 2016 Weighted Weighted Weighted Average Average Average Grant Date Grant Date Grant Date Shares Fair Value Shares Fair Value Shares Fair Value (Shares in thousands)
Unvested at beginning of year 273 $ 58.23 267 $ 56.96 201 $ 57.98 Granted 96 81.51 98 60.45 107 55.27 Cancelled/Forfeitures (80) 58.96 (38) 57.12 (41) 57.56 Vested (40) 63.43 (54) 56.81 — — Unvested at end of year 249 $ 66.15 273 $ 58.23 267 $ 56.96
The total fair value of shares vested during 2018 and 2017 was $5.8 million and $3.5 million, respectively. For 2016, no performance stock awards vested. At December 31, 2018, total unrecognized compensation cost related to unvested performance stock awards was approximately $6.6 million with a total weighted average remaining term of 1.51 years. For 2018, 2017 and 2016, the Company recognized compensation costs of $5.2 million, $4.8 million and $4.0 million, respectively.
The aggregate intrinsic value of performance shares granted and outstanding approximated $16.1 million representing the total pre-tax intrinsic value based on the Company’s closing Class A common stock price of $64.53 as of December 31, 2018.
The following is a summary of stock option activity and related information:
Year Ended December 31, 2018 2017 2016 Weighted Weighted Weighted Weighted Average Average Average Average Exercise Intrinsic Exercise Exercise Options Price Value Options Price Options Price (Options in thousands)
Outstanding at beginning of year 95 $ 54.91 130 $ 54.46 362 $ 48.46 Granted — — — — — — Cancelled/Forfeitures — — (3) 55.81 (43) 52.93 Exercised (46) 54.55 (32) 53.19 (189) 43.31 Outstanding at end of year 49 $ 55.25 $ 9.28 95 $ 54.91 130 $ 54.46 Exercisable at end of year 49 $ 55.25 $ 9.28 93 $ 54.85 82 $ 53.38
As of December 31, 2018, all stock options that had been granted under the 2004 Stock Incentive plan had vested. For 2018 the Company did not recognize any compensation costs for options. For 2017 and 2016, the Company recognized compensation cost for options of $0.5 million and $1.1 million, respectively. As of December 31, 2018, there was no unrecognized compensation cost related to unvested options. As of December 31, 2018, the aggregate intrinsic value of exercisable options was approximately $0.5 million, representing the total pre-tax intrinsic value, based on the Company’s closing Class A common stock price of $64.53 as of December 31, 2018, which would have been received by the option holders had all option holders exercised their options as of that date. The total intrinsic value of options exercised for 2018, 2017 and 2016 was approximately $1.2 million, $0.5 million and $3.5 million, respectively.

75
The following table summarizes information about options outstanding at December 31, 2018:
Options Outstanding Options Exercisable Weighted Average Weighted Average Weighted Average Number Remaining Contractual Exercise Number Exercise Range of Exercise Prices Outstanding Life (years) Price Exercisable Price (Options in thousands)
$29.05-$54.76 17,933 3.47 $ 50.64 17,933 $ 50.64 $57.47–$57.47 22,372 4.81 57.47 22,372 57.47 $57.95–$60.10 8,446 5.01 59.17 8,446 59.17 48,751 4.35 $ 55.25 48,751 $ 55.25
Management Stock Purchase Plan Total unrecognized compensation cost related to unvested RSUs was approximately $0.8 million at December 31, 2018 with a total weighted average remaining term of 1.21 years. For 2018, 2017 and 2016, the Company recognized compensation cost of $1.0 million, $1.0 million and $0.7 million, respectively. Dividends declared for RSUs, that are paid to individuals, that remain unpaid at December 31, 2018 total approximately $0.1 million.
A summary of the Company’s RSU activity and related information is shown in the following table:
Year Ended December 31, 2018 2017 2016 Weighted Weighted Weighted Weighted Average Average Average Average Purchase Intrinsic Purchase Purchase RSUs Price Value RSUs Price RSUs Price (RSU’s in thousands)
Outstanding at beginning of year 174 $ 39.68 148 $ 36.37 101 $ 36.14 Granted 36 61.84 47 49.92 89 35.41 Cancelled/Forfeitures (10) 48.82 (3) 41.55 (28) 32.25 Settled (46) 37.34 (18) 39.09 (14) 36.91 Outstanding at end of year 154 $ 45.02 19.51 $ 174 $ 39.68 148 $ 36.37 Vested at end of year 66 $ 38.17 26.36 $ 57 $ 36.26 28 $ 37.78
As of December 31, 2018, the aggregate intrinsic values of outstanding and vested RSUs were approximately $3.0 million and $1.7 million, respectively, representing the total pre-tax intrinsic value, based on the Company’s closing Class A common stock price of $64.53 as of December 31, 2018, which would have been received by the RSUs holders had all RSUs settled as of that date. The total intrinsic value of RSUs settled for 2018, 2017 and 2016 was approximately $1.8 million, $0.4 million and $1.5 million, respectively. Upon settlement of RSUs, the Company issues shares of Class A common stock.
The following table summarizes information about RSUs outstanding at December 31, 2018:
RSUs Outstanding RSUs Vested Weighted Average Weighted Average Number Purchase Number Purchase Range of Purchase Prices Outstanding Price Vested Price (RSUs in thousands)
$35.41-$40.27 80 $ 35.47 54 $ 35.50 $49.92-$61.84 74 55.37 12 49.92 154 $ 45.02 66 $ 38.17

76
The fair value of each share issued under the Management Stock Purchase Plan is estimated on the date of grant, using the Black-Scholes-Merton Model, based on the following weighted average assumptions:
Year Ended December 31, 2018 2017 2016
Expected life (years) 3.0 3.0 3.0 Expected stock price volatility 24.1 % 25.0 % 24.8 %Expected dividend yield 1.0 % 1.2 % 1.3 %Risk-free interest rate 2.4 % 1.5 % 0.9 %
The risk-free interest rate is based upon the U.S. Treasury yield curve at the time of grant for the respective expected life of the RSUs. The expected life (estimated period of time outstanding) of RSUs and volatility were calculated using historical data. The expected dividend yield of stock is the Company’s best estimate of the expected future dividend yield.
The above assumptions were used to determine the weighted average grant-date fair value of RSUs granted of $21.80, $16.84 and $18.15 during 2018, 2017 and 2016, respectively.
The Company distributed dividends of $0.82 per share for 2018, $0.75 per share for 2017 and $0.71 per share for 2016 on the Company’s Class A common stock and Class B common stock.
(15) Employee Benefit Plans The Company’s domestic employees are eligible to participate in the Company’s 401(k) savings plan. Since January 1, 2012, the Company has provided a base contribution of 2% of an employee’s salary, regardless of whether the employee participates in the plan. Further, the Company matches the contribution of up to 100% of the first 4% of an employee’s contribution. The Company’s match contributions for the years ended December 31, 2018, 2017 and 2016, were $6.1 million, $5.0 million and $5.4 million, respectively. Charges for Europe pension plans approximated $3.9 million, $4.1 million and $4.5 million for the years ended December 31, 2018, 2017 and 2016, respectively. These costs relate to plans administered by certain European subsidiaries, with benefits calculated according to government requirements and paid out to employees upon retirement or change of employment. (16) Contingencies and Environmental Remediation Accrual and Disclosure Policy The Company is a defendant in numerous legal matters arising from its ordinary course of operations, including those involving product liability, environmental matters, and commercial disputes. The Company reviews its lawsuits and other legal proceedings on an ongoing basis and follows appropriate accounting guidance when making accrual and disclosure decisions. The Company establishes accruals for matters when the Company assesses that it is probable that a loss has been incurred and the amount of the loss can be reasonably estimated. The Company does not establish accruals for such matters when the Company does not believe both that it is probable that a loss has been incurred and that the amount of the loss can be reasonably estimated. The Company’s assessment of whether a loss is probable is based on its assessment of the ultimate outcome of the matter following all appeals.
Under the FASB issued ASC 450 “Contingencies”, an event is “reasonably possible” if “the chance of the future event or events occurring is more than remote but less than likely” and an event is “remote” if “the chance of the future event or events occurring is slight”. Thus, references to the upper end of the range of reasonably possible loss for cases in which the Company is able to estimate a range of reasonably possible loss mean the upper end of the range of loss for cases for which the Company believes the risk of loss is more than slight.
There may continue to be exposure to loss in excess of any amount accrued. When it is possible to estimate the reasonably possible loss or range of loss above the amount accrued for the matters disclosed, that estimate is aggregated and disclosed. The Company records legal costs associated with its legal contingencies as incurred, except for legal costs

77
associated with product liability claims which are included in the actuarial estimates used in determining the product liability accrual.
As of December 31, 2018, the Company estimates that the aggregate amount of reasonably possible loss in excess of the amount accrued for its legal contingencies is approximately $5.3 million pre-tax. With respect to the estimate of reasonably possible loss, management has estimated the reasonably possible loss based on (i) the amount of money damages claimed, where applicable, (ii) the allegations and factual development to date, (iii) available defenses based on the allegations, and/or (iv) other potentially liable parties. This estimate is based upon currently available information and is subject to significant judgment and a variety of assumptions, and known and unknown uncertainties. The matters underlying the estimate will change from time to time, and actual results may vary significantly from the current estimate. In the event of an unfavorable outcome in one or more of the matters, the ultimate liability may be in excess of amounts currently accrued, if any, and may be material to the Company’s operating results or cash flows for a particular quarterly or annual period. However, based on information currently known to it, management believes that the ultimate outcome of all matters, as they are resolved over time, is not likely to have a material adverse effect on the financial condition of the Company, though the outcome could be material to the Company’s operating results for any particular period depending, in part, upon the operating results for such period. Product Liability The Company is subject to a variety of potential liabilities in connection with product liability cases. The Company maintains a high self-insured retention limit within its product liability and general liability coverage, which the Company believes to be generally in accordance with industry practices. For product liability cases in the U.S., management establishes its product liability accrual, which includes legal costs associated with accrued claims. For its most significant volume of liability matters, the Company utilizes third-party actuarial valuations which incorporate historical trend factors and the Company’s specific claims experience derived from loss reports provided by third-party claims administrators. The product liability accrual is established after considering any applicable insurance coverage. Changes in the nature of product liability claims or the actual settlement amounts could affect the adequacy of the estimates and require changes to the provisions. Because the liability is an estimate, the ultimate liability may be more or less than reported.
Environmental Remediation The Company has been named as a potentially responsible party with respect to a limited number of identified contaminated sites. The levels of contamination vary significantly from site to site as do the related levels of remediation efforts. Environmental liabilities are recorded based on the most probable cost, if known, or on the estimated minimum cost of remediation. Accruals are not discounted to their present value, unless the amount and timing of expenditures are fixed and reliably determinable. The Company accrues estimated environmental liabilities based on assumptions, which are subject to a number of factors and uncertainties. Circumstances that can affect the reliability and precision of these estimates include identification of additional sites, environmental regulations, level of clean-up required, technologies available, number and financial condition of other contributors to remediation and the time period over which remediation may occur. The Company recognizes changes in estimates as new remediation requirements are defined or as new information becomes available.
Chemetco, Inc. Superfund Site, Hartford, Illinois In August 2017, Watts Regulator Co. (a wholly-owned subsidiary of the Company) received a “Notice of Environmental Liability” from the Chemetco Site Group (“Group”) alleging that it is a potentially responsible party for the Chemetco, Inc. Superfund Site in Hartford, Illinois (the Site) because it arranged for the disposal or treatment of hazardous substances that were contained in materials sent to the Site and that resulted in the release or threat of release of hazardous substances at the Site. As of August 2017, 162 companies were members of the Group. The letter offered Watts Regulator Co. the opportunity to join the Group and participate in the Remedial Investigation and Feasibility Study (“RI/FS”) at the Site. Watts Regulator Co. joined the Group in September 2017 and was added in March 2018 as a signatory, together with 43 other new Group members, to the Administrative Settlement Agreement and Order on Consent with the United States Environmental Protection Agency (“USEPA”) governing completion of the RI/FS. Based on information currently known to it, management believes that Watts Regulator Co.’s share of the costs of the RI/FS is not likely to have a material adverse effect on the financial condition of the Company, or have a material adverse effect on the Company’s operating results for any particular period. In February 2018, the Group commenced
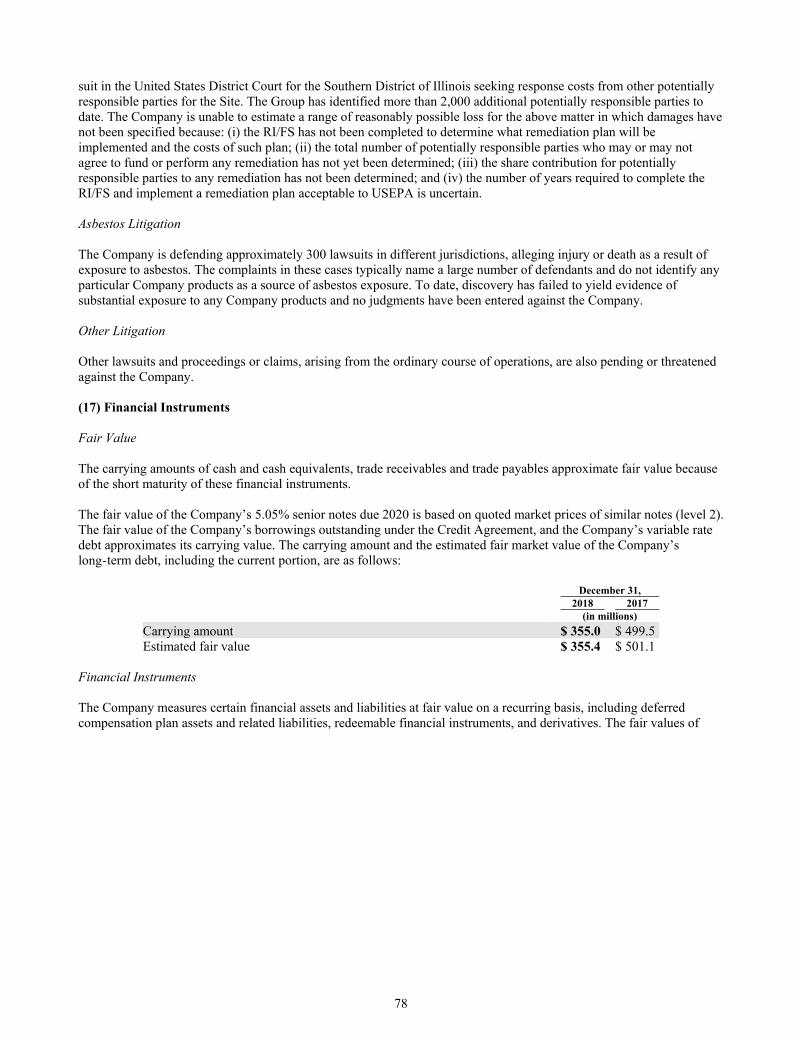
78
suit in the United States District Court for the Southern District of Illinois seeking response costs from other potentially responsible parties for the Site. The Group has identified more than 2,000 additional potentially responsible parties to date. The Company is unable to estimate a range of reasonably possible loss for the above matter in which damages have not been specified because: (i) the RI/FS has not been completed to determine what remediation plan will be implemented and the costs of such plan; (ii) the total number of potentially responsible parties who may or may not agree to fund or perform any remediation has not yet been determined; (iii) the share contribution for potentially responsible parties to any remediation has not been determined; and (iv) the number of years required to complete the RI/FS and implement a remediation plan acceptable to USEPA is uncertain. Asbestos Litigation The Company is defending approximately 300 lawsuits in different jurisdictions, alleging injury or death as a result of exposure to asbestos. The complaints in these cases typically name a large number of defendants and do not identify any particular Company products as a source of asbestos exposure. To date, discovery has failed to yield evidence of substantial exposure to any Company products and no judgments have been entered against the Company.
Other Litigation Other lawsuits and proceedings or claims, arising from the ordinary course of operations, are also pending or threatened against the Company.
(17) Financial Instruments Fair Value The carrying amounts of cash and cash equivalents, trade receivables and trade payables approximate fair value because of the short maturity of these financial instruments.
The fair value of the Company’s 5.05% senior notes due 2020 is based on quoted market prices of similar notes (level 2). The fair value of the Company’s borrowings outstanding under the Credit Agreement, and the Company’s variable rate debt approximates its carrying value. The carrying amount and the estimated fair market value of the Company’s long - term debt, including the current portion, are as follows:
December 31, 2018 2017 (in millions)
Carrying amount $ 355.0 $ 499.5 Estimated fair value $ 355.4 $ 501.1
Financial Instruments The Company measures certain financial assets and liabilities at fair value on a recurring basis, including deferred compensation plan assets and related liabilities, redeemable financial instruments, and derivatives. The fair values of
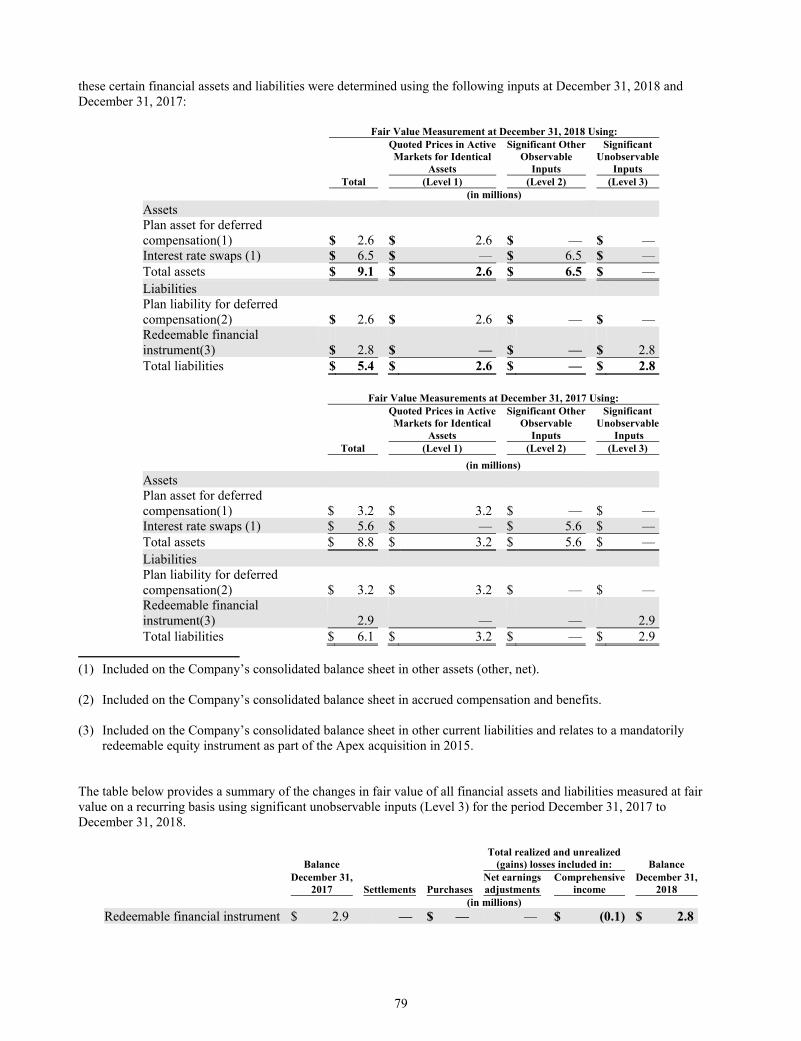
79
these certain financial assets and liabilities were determined using the following inputs at December 31, 2018 and December 31, 2017:
Fair Value Measurement at December 31, 2018 Using: Quoted Prices in Active Significant Other Significant Markets for Identical Observable Unobservable Assets Inputs Inputs Total (Level 1) (Level 2) (Level 3) (in millions)
Assets Plan asset for deferred compensation(1) $ 2.6 $ 2.6 $ — $ — Interest rate swaps (1) $ 6.5 $ — $ 6.5 $ — Total assets $ 9.1 $ 2.6 $ 6.5 $ — Liabilities Plan liability for deferred compensation(2) $ 2.6 $ 2.6 $ — $ — Redeemable financial instrument(3) $ 2.8 $ — $ — $ 2.8 Total liabilities $ 5.4 $ 2.6 $ — $ 2.8
Fair Value Measurements at December 31, 2017 Using: Quoted Prices in Active Significant Other Significant Markets for Identical Observable Unobservable Assets Inputs Inputs Total (Level 1) (Level 2) (Level 3)
(in millions)
Assets Plan asset for deferred compensation(1) $ 3.2 $ 3.2 $ — $ — Interest rate swaps (1) $ 5.6 $ — $ 5.6 $ — Total assets $ 8.8 $ 3.2 $ 5.6 $ — Liabilities Plan liability for deferred compensation(2) $ 3.2 $ 3.2 $ — $ — Redeemable financial instrument(3) 2.9 — — 2.9 Total liabilities $ 6.1 $ 3.2 $ — $ 2.9
(1) Included on the Company’s consolidated balance sheet in other assets (other, net). (2) Included on the Company’s consolidated balance sheet in accrued compensation and benefits. (3) Included on the Company’s consolidated balance sheet in other current liabilities and relates to a mandatorily
redeemable equity instrument as part of the Apex acquisition in 2015. The table below provides a summary of the changes in fair value of all financial assets and liabilities measured at fair value on a recurring basis using significant unobservable inputs (Level 3) for the period December 31, 2017 to December 31, 2018.
Total realized and unrealized Balance (gains) losses included in: Balance December 31, Net earnings Comprehensive December 31, 2017 Settlements Purchases adjustments income 2018 (in millions)
Redeemable financial instrument $ 2.9 — $ — — $ (0.1) $ 2.8

80
On November 30, 2015, the Company acquired 80% of the outstanding shares of Apex Valves Limited (“Apex”). The aggregate purchase price was approximately $20.4 million and the Company recorded a long-term liability of $5.5 million as the estimate of the acquisition date fair value on the contractual call option to purchase the remaining 20% within three years of closing. The Company acquired an additional 10% ownership in the first quarter of 2017 for approximately $2.9 million and now owns 90% of Apex outstanding shares. The remaining liability is classified as Level 3 under the fair value hierarchy as it is based on the commitment to purchase the remaining 10% of Apex shares within the next year, which is not observable in the market. On November 30, 2018, the Company executed an agreement to extend the exercise of the contractual call option into the first quarter of 2019. Cash equivalents consist of instruments with remaining maturities of three months or less at the date of purchase and consist primarily of money market funds, for which the carrying amount is a reasonable estimate of fair value.
The Company uses financial instruments from time to time to enhance its ability to manage risk, including foreign currency and commodity pricing exposures, which exist as part of its ongoing business operations. The use of derivatives exposes the Company to counterparty credit risk for nonperformance and to market risk related to changes in currency exchange rates and commodity prices. The Company manages its exposure to counterparty credit risk through diversification of counterparties. The Company’s counterparties in derivative transactions are substantial commercial banks with significant experience using such derivative instruments. The impact of market risk on the fair value and cash flows of the Company’s derivative instruments is monitored and the Company restricts the use of derivative financial instruments to hedging activities. The Company does not enter into contracts for trading purposes nor does the Company enter into any contracts for speculative purposes. The use of derivative instruments is approved by senior management under written guidelines.
Interest Rate Swaps
For each facility under the Credit Agreement, the Company can choose either an Adjusted LIBOR or Alternative Base Rate (“ABR”). Upon intended election of Adjusted LIBOR as the interest rate, the Term Loan has quarterly interest payments that began in May 2016, quarterly principal repayments that commenced on March 31, 2017, with a balloon payment of principal on maturity date. The Revolving Credit Facility has quarterly interest payments. Accordingly, the Company’s earnings and cash flows are exposed to interest rate risk from changes in Adjusted LIBOR. In order to manage the Company’s exposure to changes in cash flows attributable to fluctuations in LIBOR-indexed interest payments related to the Company’s floating rate debt, the Company entered into two interest rate swaps. For each interest rate swap, the Company receives the three-month USD-LIBOR subject to a 0% floor, and pays a fixed rate of 1.31375% on a notional amount of $225.0 million. The swaps mature on February 12, 2021. The Company formally documents the hedge relationships at hedge inception to ensure that its interest rate swaps qualify for hedge accounting. On a quarterly basis, the Company assesses whether the interest rate swaps are highly effective in offsetting changes in the cash flow of the hedged item. The Company does not hold or issue interest rate swaps for trading purposes. The swaps are designated as cash flow hedges. For the years ended December 31, 2018 and 2017, a net of tax gain of $0.7 million and $0.6 million, respectively, was recorded in Accumulated Other Comprehensive Income to recognize the effective portion of the fair value of interest rate swaps that qualify as a cash flow hedge. Designated Foreign Currency Hedges The Company’s foreign subsidiaries transact most business, including certain intercompany transactions, in foreign currencies. Such transactions are principally purchases or sales of materials. The Company has exposure to a number of foreign currencies, including the Canadian Dollar, the euro, and the Chinese Yuan. Beginning in the first quarter of 2018, the Company has used a layering methodology, whereby at the end of each quarter, the Company enters into forward exchange contracts which hedge approximately 70% of the forecasted intercompany purchase transactions between one of the Company’s Canadian and U.S. operating subsidiaries for the next twelve months. As of December 31, 2018, all designated foreign exchange hedge contracts were cash flow hedges under ASC 815, Derivatives and Hedging ("ASC 815"). The Company records the effective portion of the designated foreign currency hedge contracts in other comprehensive income until inventory turns and is sold to a third-party. Once the third-party transaction associated with the hedged forecasted transaction occurs, the effective portion of any related gain or loss on the designated foreign currency hedge will be reclassified into earnings. In the event the notional amount of the derivatives exceeds the forecasted intercompany purchases for a given month, the excess hedge position will be attributed to the following month’s forecasted purchases. However, if the following month’s forecasted purchases cannot absorb the excess hedge

81
position from the current month, the effective portion of the hedge recorded in other comprehensive income will be reclassified to earnings. The fair value of the Company’s designated foreign hedge contracts outstanding as of December 31, 2018 was $0.3 million. For the year ended December 31, 2018, the amount expected to be reclassified into earnings from other comprehensive income in the next twelve months is not material to the financial statements. Non-Designated Cash Flow Hedge The Company’s foreign subsidiaries transact most business, including certain intercompany transactions, in foreign currencies. Such transactions are principally purchases or sales of materials and are denominated in European currencies or the U.S. or Canadian dollar. The Company uses foreign currency forward exchange contracts from time to time to manage the risk related to intercompany loans, intercompany purchases that occur during the course of a year, and certain open foreign currency denominated commitments to sell products to third parties. The Company entered into one forward contract in the fourth quarter of 2016 and one forward contract in the first quarter of 2017 to manage the foreign currency rate exposure in 2016 and 2017. These forward contracts were entered into to manage the foreign currency rate exposure between the Hong Kong Dollar and the euro regarding two intercompany loans. These forward contracts were marked-to-market with changes in the fair value recorded to earnings. The Company recognized a loss of $2.9 million related to forward exchange contracts in 2017. These forward contracts were not renewed in September 2017 as the intercompany loans for which the Company was hedging the foreign currency rate exposure were settled. Leases The Company leases certain manufacturing facilities, sales offices, warehouses, automobiles, and equipment. Generally, the leases carry renewal provisions and require the Company to pay maintenance costs. Future minimum lease payments under capital leases and non-cancelable operating leases as of December 31, 2018 are as follows:
Capital Leases Operating Leases (in millions)
2019 $ 1.8 $ 10.7 2020 1.6 8.7 2021 0.7 5.6 2022 0.3 3.4 2023 0.1 2.4 Thereafter — 4.9
Total $ 4.5 $ 35.7 Less amount representing interest (at rates ranging from 1.8% to 5.9%) 0.2 Present value of net minimum capital lease payments 4.3 Less current installments of obligations under capital leases 1.6
Obligations under capital leases, excluding current installments $ 2.7
Carrying amounts of assets under capital lease include:
December 31, 2018 2017 (in millions)
Buildings $ 14.6 $ 15.3 Machinery and equipment 3.6 1.7 18.2 17.0 Less accumulated depreciation (7.8) (6.8) $ 10.4 $ 10.2
(18) Segment Information The Company operates in three geographic segments: Americas, Europe, and APMEA. Each of these segments sells similar products and has separate financial results that are reviewed by the Company’s chief operating decision-maker. Each segment earns revenue and income almost exclusively from the sale of the Company’s products. The Company

82
sells its products into various end markets around the world with sales by region based upon location of the entity recording the sale. See Note 4 for further detail on the product lines sold into by region. All intercompany sales transactions have been eliminated. The accounting policies for each segment are the same as those described in Note 2 of the Notes to Consolidated Financial Statements in the Company’s Annual Report on Form 10-K for the year ended December 31, 2018. The following is a summary of the Company’s significant accounts and balances by segment, reconciled to its consolidated totals:
Year Ended December 31, 2018 2017 2016 (in millions)
Net Sales Americas $ 1,032.1 $ 951.9 $ 900.9 Europe 467.0 440.3 431.3 APMEA 65.8 64.5 66.2
Consolidated net sales $ 1,564.9 $ 1,456.7 $ 1,398.4 Operating income
Americas $ 171.1 $ 146.8 $ 127.1 Europe 49.8 47.6 40.0 APMEA 7.2 4.7 15.1
Subtotal reportable segments 228.1 199.1 182.2 Corporate(*) (39.7) (36.8) (37.2)
Consolidated operating income 188.4 162.3 145.0 Interest income (0.8) (1.0) (1.0)Interest expense 16.3 19.1 22.6 Other (income) expense, net (1.7) 1.1 (4.4)
Income before income taxes $ 174.6 $ 143.1 $ 127.8 Capital Expenditures
Americas $ 21.5 $ 20.7 $ 25.7 Europe 12.7 8.0 8.9 APMEA 1.7 0.7 1.4
Consolidated capital expenditures $ 35.9 $ 29.4 $ 36.0 Depreciation and Amortization
Americas $ 29.1 $ 30.8 $ 28.8 Europe 16.7 18.6 19.3 APMEA 2.7 2.8 3.1
Consolidated depreciation and amortization $ 48.5 $ 52.2 $ 51.2 Identifiable assets (at end of period)
Americas $ 1,028.1 $ 1,069.2 $ 1,054.7 Europe 510.2 524.0 577.3 APMEA 115.4 143.3 131.2
Consolidated identifiable assets $ 1,653.7 $ 1,736.5 $ 1,763.2 Property, plant and equipment, net (at end of year)
Americas $ 115.0 $ 109.3 $ 106.2 Europe 80.0 82.1 75.6 APMEA 6.9 7.1 7.9
Consolidated property, plant and equipment, net $ 201.9 $ 198.5 $ 189.7
* Corporate expenses are primarily for administrative compensation expense, compliance costs, professional fees,
including corporate-related legal and audit expenses, shareholder services and benefit administration costs. ** Included in APMEA’s operating income for 2016 is $8.7 million gain related to the sale of an operating subsidiary
in China. Refer to Note 5 “Sale of Business” for further discussion.

83
The following includes U.S. net sales and U.S. property, plant and equipment of the Company’s Americas segment:
December 31, 2018 2017 2016 (in millions)
U.S. net sales $ 964.2 $ 886.2 $ 839.2 U.S. property, plant and equipment, net (at end of year) $ 111.0 $ 105.1 $ 102.5
The following includes intersegment sales for Americas, Europe and APMEA:
December 31, 2018 2017 2016 (in millions)
Intersegment Sales Americas $ 12.7 $ 12.1 $ 12.0 Europe 14.2 14.6 12.3 APMEA 88.4 69.7 76.7
Intersegment sales $ 115.3 $ 96.4 $ 101.0
(19) Accumulated Other Comprehensive Loss Accumulated other comprehensive loss consists of the following:
Accumulated Foreign Other Currency Cash Flow Comprehensive Translation Hedges (1) Loss (in millions)
Balance December 31, 2017 $ (102.6) $ 3.5 $ (99.1)Change in period 9.7 2.8 12.5 Balance April 1, 2018 $ (92.9) $ 6.3 $ (86.6)Change in period (26.6) 1.0 (25.6)Balance July 1, 2018 $ (119.5) $ 7.3 $ (112.2)Change in period 2.5 (0.1) 2.4 Balance September 30, 2018 $ (117.0) $ 7.2 $ (109.8)Change in period (9.3) (2.0) (11.3)Balance December 31, 2018 $ (126.3) $ 5.2 $ (121.1) Balance December 31, 2016 $ (153.7) $ 2.9 $ (150.8)Change in period 7.9 0.1 8.0 Balance April 02, 2017 $ (145.8) $ 3.0 $ (142.8)Change in period 21.5 (0.7) 20.8 Balance July 02, 2017 $ (124.3) $ 2.3 $ (122.0)Change in period 15.4 0.1 15.5 Balance October 01, 2017 $ (108.9) $ 2.4 $ (106.5)Change in period 6.3 1.1 7.4 Balance December 31, 2017 $ (102.6) $ 3.5 $ (99.1)
(1) Cash flow hedges include interest rate swaps and designated foreign currency hedges. See Note 17 for further
details.

84
(20) Quarterly Financial Information (unaudited)
First Second Third Fourth Quarter Quarter Quarter Quarter (in millions, except per share information)
Year ended December 31, 2018 Net sales $ 378.5 $ 407.9 $ 390.9 $ 387.6 Gross profit 156.7 169.4 164.5 165.9 Net income 28.2 36.0 31.5 32.3 Per common share: Basic
Net income 0.82 1.05 0.92 0.94 Diluted
Net income 0.82 1.05 0.92 0.94 Dividends declared per common share 0.19 0.21 0.21 0.21 Year ended December 31, 2017 Net sales $ 347.2 $ 378.5 $ 364.7 $ 366.3 Gross profit 143.8 156.7 152.7 149.2 Net income (loss) 21.7 27.2 26.5 (2.3)Per common share: Basic
Net income (loss) 0.63 0.79 0.77 (0.07)Diluted
Net income (loss) 0.63 0.79 0.77 (0.07)Dividends declared per common share 0.18 0.19 0.19 0.19
Note: Four quarters may not sum to full year due to rounding.
(21) Subsequent Events On February 6, 2019, the Company declared a quarterly dividend of twenty-one cents ($0.21) per share on each outstanding share of Class A common stock and Class B common stock payable on March 15, 2019 to stockholders of record on March 1, 2019. On February 6, 2019, the Board of Directors authorized a stock repurchase program of up to $150 million of the Company’s Class A common stock to be purchased from time to time on the open market or in privately negotiated transactions. The timing and number of shares repurchased will be determined by the Company’s management based on its evaluation of market conditions and other factors.

85
Watts Water Technologies, Inc. and Subsidiaries Schedule II—Valuation and Qualifying Accounts
(Amounts in millions)
Balance At Additions Foreign Balance At Beginning of Charged To Exchange End of Period Expense Impact Deductions Period
Year Ended December 31, 2016 Allowance for doubtful accounts $ 10.1 $ 5.5 0.5 (1.9) $ 14.2 Reserve for excess and obsolete inventories $ 29.1 $ 7.0 0.6 (10.6) $ 26.1 Year Ended December 31, 2017 Allowance for doubtful accounts $ 14.2 $ 3.7 0.4 (4.0) $ 14.3 Reserve for excess and obsolete inventories $ 26.1 $ 7.3 1.5 (9.5) $ 25.4 Year Ended December 31, 2018 Allowance for doubtful accounts $ 14.3 $ 3.3 (0.2) (2.4) $ 15.0 Reserve for excess and obsolete inventories $ 25.4 $ 7.7 (0.7) (8.0) $ 24.4
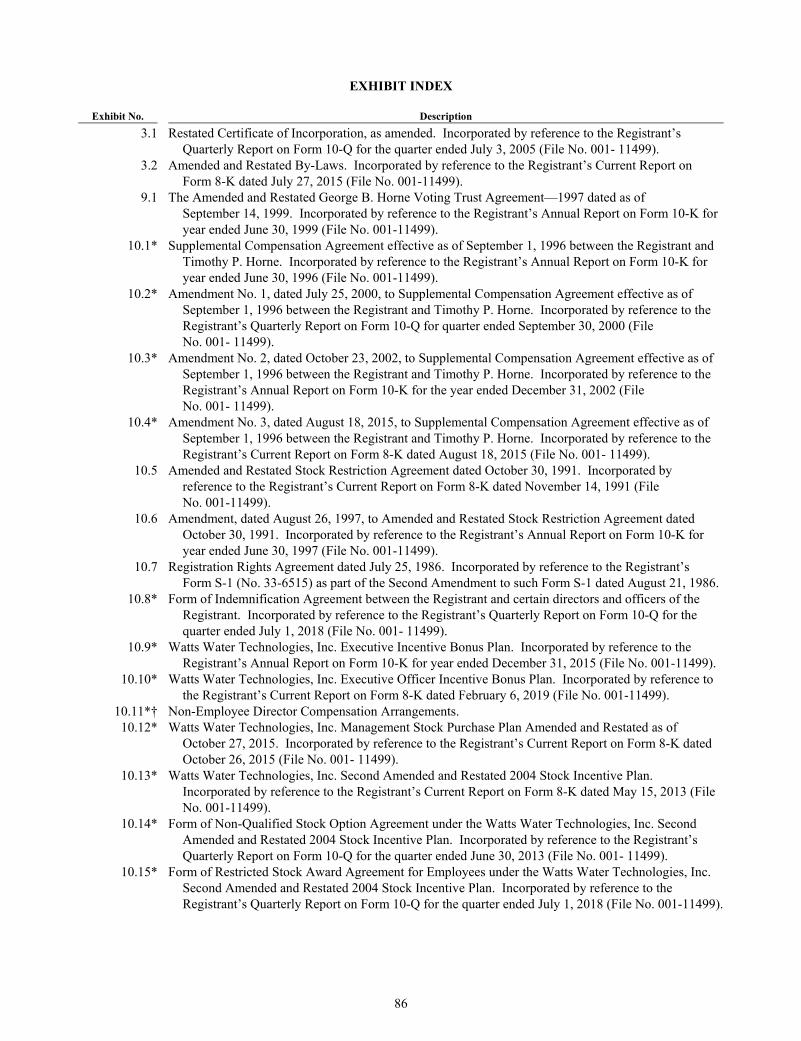
86
EXHIBIT INDEX
Exhibit No. Description
3.1 Restated Certificate of Incorporation, as amended. Incorporated by reference to the Registrant’s Quarterly Report on Form 10-Q for the quarter ended July 3, 2005 (File No. 001- 11499).
3.2 Amended and Restated By-Laws. Incorporated by reference to the Registrant’s Current Report on Form 8-K dated July 27, 2015 (File No. 001-11499).
9.1 The Amended and Restated George B. Horne Voting Trust Agreement—1997 dated as of September 14, 1999. Incorporated by reference to the Registrant’s Annual Report on Form 10-K for year ended June 30, 1999 (File No. 001-11499).
10.1* Supplemental Compensation Agreement effective as of September 1, 1996 between the Registrant and Timothy P. Horne. Incorporated by reference to the Registrant’s Annual Report on Form 10-K for year ended June 30, 1996 (File No. 001-11499).
10.2* Amendment No. 1, dated July 25, 2000, to Supplemental Compensation Agreement effective as of September 1, 1996 between the Registrant and Timothy P. Horne. Incorporated by reference to the Registrant’s Quarterly Report on Form 10-Q for quarter ended September 30, 2000 (File No. 001- 11499).
10.3* Amendment No. 2, dated October 23, 2002, to Supplemental Compensation Agreement effective as of September 1, 1996 between the Registrant and Timothy P. Horne. Incorporated by reference to the Registrant’s Annual Report on Form 10-K for the year ended December 31, 2002 (File No. 001- 11499).
10.4* Amendment No. 3, dated August 18, 2015, to Supplemental Compensation Agreement effective as of September 1, 1996 between the Registrant and Timothy P. Horne. Incorporated by reference to the Registrant’s Current Report on Form 8-K dated August 18, 2015 (File No. 001- 11499).
10.5 Amended and Restated Stock Restriction Agreement dated October 30, 1991. Incorporated by reference to the Registrant’s Current Report on Form 8-K dated November 14, 1991 (File No. 001-11499).
10.6 Amendment, dated August 26, 1997, to Amended and Restated Stock Restriction Agreement dated October 30, 1991. Incorporated by reference to the Registrant’s Annual Report on Form 10-K for year ended June 30, 1997 (File No. 001-11499).
10.7 Registration Rights Agreement dated July 25, 1986. Incorporated by reference to the Registrant’s Form S-1 (No. 33-6515) as part of the Second Amendment to such Form S-1 dated August 21, 1986.
10.8* Form of Indemnification Agreement between the Registrant and certain directors and officers of the Registrant. Incorporated by reference to the Registrant’s Quarterly Report on Form 10-Q for the quarter ended July 1, 2018 (File No. 001- 11499).
10.9* Watts Water Technologies, Inc. Executive Incentive Bonus Plan. Incorporated by reference to the Registrant’s Annual Report on Form 10-K for year ended December 31, 2015 (File No. 001-11499).
10.10* Watts Water Technologies, Inc. Executive Officer Incentive Bonus Plan. Incorporated by reference to the Registrant’s Current Report on Form 8-K dated February 6, 2019 (File No. 001-11499).
10.11*† Non-Employee Director Compensation Arrangements. 10.12* Watts Water Technologies, Inc. Management Stock Purchase Plan Amended and Restated as of
October 27, 2015. Incorporated by reference to the Registrant’s Current Report on Form 8-K dated October 26, 2015 (File No. 001- 11499).
10.13* Watts Water Technologies, Inc. Second Amended and Restated 2004 Stock Incentive Plan. Incorporated by reference to the Registrant’s Current Report on Form 8-K dated May 15, 2013 (File No. 001-11499).
10.14* Form of Non-Qualified Stock Option Agreement under the Watts Water Technologies, Inc. Second Amended and Restated 2004 Stock Incentive Plan. Incorporated by reference to the Registrant’s Quarterly Report on Form 10-Q for the quarter ended June 30, 2013 (File No. 001- 11499).
10.15* Form of Restricted Stock Award Agreement for Employees under the Watts Water Technologies, Inc. Second Amended and Restated 2004 Stock Incentive Plan. Incorporated by reference to the Registrant’s Quarterly Report on Form 10-Q for the quarter ended July 1, 2018 (File No. 001-11499).
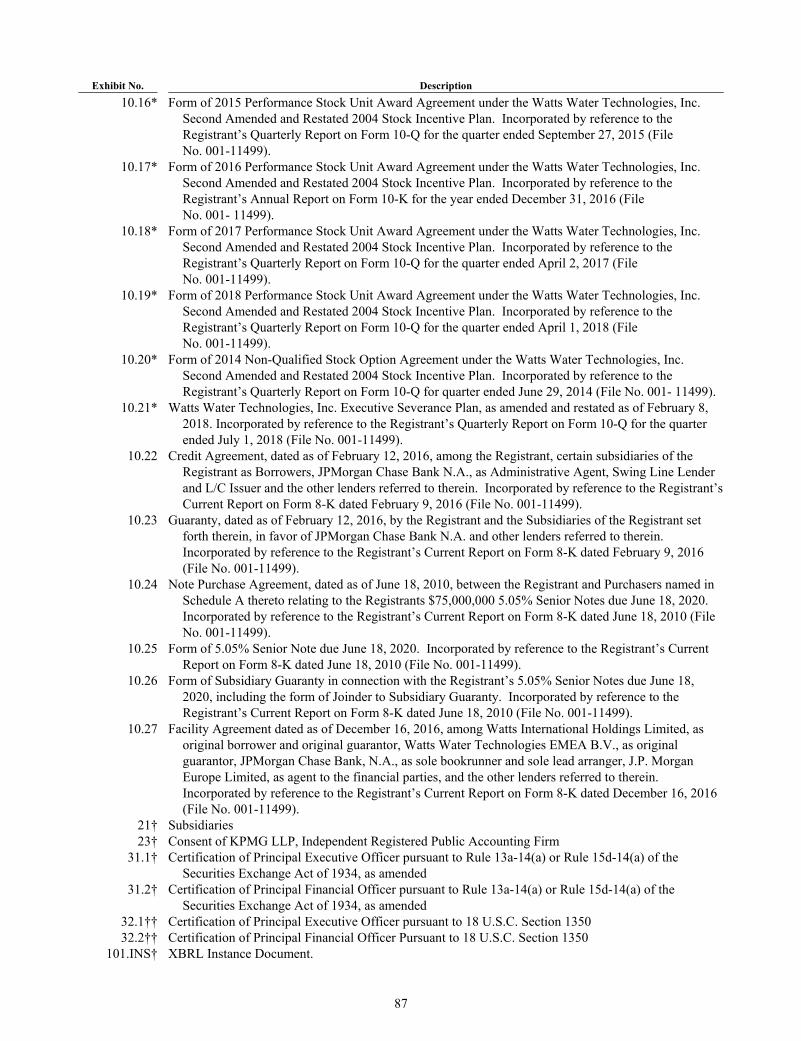
87
Exhibit No. Description
10.16* Form of 2015 Performance Stock Unit Award Agreement under the Watts Water Technologies, Inc. Second Amended and Restated 2004 Stock Incentive Plan. Incorporated by reference to the Registrant’s Quarterly Report on Form 10-Q for the quarter ended September 27, 2015 (File No. 001-11499).
10.17* Form of 2016 Performance Stock Unit Award Agreement under the Watts Water Technologies, Inc. Second Amended and Restated 2004 Stock Incentive Plan. Incorporated by reference to the Registrant’s Annual Report on Form 10-K for the year ended December 31, 2016 (File No. 001- 11499).
10.18* Form of 2017 Performance Stock Unit Award Agreement under the Watts Water Technologies, Inc. Second Amended and Restated 2004 Stock Incentive Plan. Incorporated by reference to the Registrant’s Quarterly Report on Form 10-Q for the quarter ended April 2, 2017 (File No. 001-11499).
10.19* Form of 2018 Performance Stock Unit Award Agreement under the Watts Water Technologies, Inc. Second Amended and Restated 2004 Stock Incentive Plan. Incorporated by reference to the Registrant’s Quarterly Report on Form 10-Q for the quarter ended April 1, 2018 (File No. 001-11499).
10.20* Form of 2014 Non-Qualified Stock Option Agreement under the Watts Water Technologies, Inc. Second Amended and Restated 2004 Stock Incentive Plan. Incorporated by reference to the Registrant’s Quarterly Report on Form 10-Q for quarter ended June 29, 2014 (File No. 001- 11499).
10.21* Watts Water Technologies, Inc. Executive Severance Plan, as amended and restated as of February 8, 2018. Incorporated by reference to the Registrant’s Quarterly Report on Form 10-Q for the quarter ended July 1, 2018 (File No. 001-11499).
10.22 Credit Agreement, dated as of February 12, 2016, among the Registrant, certain subsidiaries of the Registrant as Borrowers, JPMorgan Chase Bank N.A., as Administrative Agent, Swing Line Lender and L/C Issuer and the other lenders referred to therein. Incorporated by reference to the Registrant’s Current Report on Form 8-K dated February 9, 2016 (File No. 001-11499).
10.23 Guaranty, dated as of February 12, 2016, by the Registrant and the Subsidiaries of the Registrant set forth therein, in favor of JPMorgan Chase Bank N.A. and other lenders referred to therein. Incorporated by reference to the Registrant’s Current Report on Form 8-K dated February 9, 2016 (File No. 001-11499).
10.24 Note Purchase Agreement, dated as of June 18, 2010, between the Registrant and Purchasers named in Schedule A thereto relating to the Registrants $75,000,000 5.05% Senior Notes due June 18, 2020. Incorporated by reference to the Registrant’s Current Report on Form 8-K dated June 18, 2010 (File No. 001-11499).
10.25 Form of 5.05% Senior Note due June 18, 2020. Incorporated by reference to the Registrant’s Current Report on Form 8-K dated June 18, 2010 (File No. 001-11499).
10.26 Form of Subsidiary Guaranty in connection with the Registrant’s 5.05% Senior Notes due June 18, 2020, including the form of Joinder to Subsidiary Guaranty. Incorporated by reference to the Registrant’s Current Report on Form 8-K dated June 18, 2010 (File No. 001-11499).
10.27 Facility Agreement dated as of December 16, 2016, among Watts International Holdings Limited, as original borrower and original guarantor, Watts Water Technologies EMEA B.V., as original guarantor, JPMorgan Chase Bank, N.A., as sole bookrunner and sole lead arranger, J.P. Morgan Europe Limited, as agent to the financial parties, and the other lenders referred to therein. Incorporated by reference to the Registrant’s Current Report on Form 8-K dated December 16, 2016 (File No. 001-11499).
21† Subsidiaries
23† Consent of KPMG LLP, Independent Registered Public Accounting Firm
31.1† Certification of Principal Executive Officer pursuant to Rule 13a-14(a) or Rule 15d-14(a) of the Securities Exchange Act of 1934, as amended
31.2† Certification of Principal Financial Officer pursuant to Rule 13a-14(a) or Rule 15d-14(a) of the Securities Exchange Act of 1934, as amended
32.1†† Certification of Principal Executive Officer pursuant to 18 U.S.C. Section 1350
32.2†† Certification of Principal Financial Officer Pursuant to 18 U.S.C. Section 1350
101.INS† XBRL Instance Document.

88
Exhibit No. Description
101.SCH† XBRL Taxonomy Extension Schema Document. 101.CAL† XBRL Taxonomy Extension Calculation Linkbase Document. 101.DEF† XBRL Taxonomy Extension Definition Linkbase Document 101.LAB† XBRL Taxonomy Extension Label Linkbase Document. 101.PRE† XBRL Taxonomy Extension Presentation Linkbase Document.
* Management contract or compensatory plan or arrangement. † Filed herewith. †† Furnished herewith. Attached as Exhibit 101 to this report are the following formatted in XBRL (Extensible Business Reporting Language): (i) Consolidated Statements of Operations for the Years Ended December 31, 2018, 2017 and 2016, (ii) Consolidated Statements of Comprehensive (Loss) Income for the Years Ended December 31, 2018, 2017 and 2016, (iii) Consolidated Balance Sheets at December 31, 2018 and December 31, 2017, (iv) Consolidated Statements of Stockholders’ Equity for the Years Ended December 31, 2018, 2017 and 2016, (v) Consolidated Statements of Cash Flows for the Years Ended December 31, 2018, 2017 and 2016, and (vi) Notes to Consolidated Financial Statements.
89
SIGNATURES
Pursuant to the requirements of Section 13 or 15(d) of the Securities Exchange Act of 1934, the registrant has duly caused this report to be signed on its behalf by the undersigned, thereunto duly authorized.
WATTS WATER TECHNOLOGIES, INC. By: /s/ ROBERT J. PAGANO, JR. Robert J. Pagano, Jr. Chief Executive Officer and President DATED: February 22, 2019
Pursuant to the requirements of the Securities Exchange Act of 1934, this report has been signed below by the following persons on behalf of the registrant and in the capacities and on the dates indicated.
Signature Title Date
/s/ ROBERT J. PAGANO, JR. Chief Executive Officer, President and Director February 22, 2019
Robert J. Pagano, Jr. (Principal Executive Officer)
/s/ SHASHANK PATEL Chief Financial Officer February 22, 2019
Shashank Patel (Principal Financial Officer)
/s/ VIRGINIA A. HALLORAN Chief Accounting Officer February 22, 2019
Virginia A. Halloran (Principal Accounting Officer)
/s/ CHRISTOPHER L. CONWAY Director
February 21, 2019
Christopher L. Conway
/s/ DAVID A. DUNBAR
Director
February 18, 2019 David A. Dunbar
/s/ LOUISE K. GOESER
Director
February 15, 2019 Louise K. Goeser
/s/ JES MUNK HANSEN
Director
February 19, 2019 Jes Munk Hansen
/s/ W. CRAIG KISSEL
Chairman of the Board
February 16, 2019 W. Craig Kissel
/s/ JOSEPH T. NOONAN
Director
February 15, 2019 Joseph T. Noonan
/s/ MERILEE RAINES
Director
February 20, 2019 Merilee Raines
/s/ JOSEPH W. REITMEIER
Director
February 15, 2019
Joseph W. Reitmeier

This Annual Report contains “forward-looking” statements within the meaning of the Private Securities Litigation Reform Act of 1995. All statements that relate to prospective events or developments are forward-looking statements. Also, words such as “intend,” “believe,” “anticipate,” “plan," “expect,” and similar expressions identify forward-looking state-ments. We cannot assure investors that our assumptions and expectations will prove to have been correct. There are a number of important factors that could cause our actual results to differ materially from those indicated or implied by forward-looking statements. These factors include, but are not limited to, those set forth in the section titled “Risk Factors” in our Annual Report on Form 10-K for the year ended December 31, 2018, included in this Annual Report. Except as required by law, we undertake no intention or obligation to update or revise any forward-looking state-ments, whether as a result of new information, future events, or otherwise.
For more information on Watts Water Technologies, visit our investor website by scanning the QR code or visiting WattsWater.com/Investors.
Global Management Team
Robert J. Pagano, Jr.Chief Executive Officer and President
Jennifer L. CongdonChief Human Resources Officer
James F. DagleyPresident,Heating & Hot Water Solutions
Dan DavisVice President,Continuous Improvement
Kenneth R. LepageGeneral Counsel,Executive Vice President and Secretary
Elie A. MelhemPresident,Asia-Pacific, the Middle East, and Africa
Munish NandaPresident,Americas and Europe
Shashank PatelChief Financial Officer
Ram RamakrishnanExecutive Vice President,Strategy and Business Development
Directors
Christopher L. ConwayDirector
David A. DunbarDirector
Louise K. GoeserDirector
Jes Munk HansenDirector
W. Craig KisselChairperson of the Board and Director
Joseph T. NoonanDirector
Robert J. Pagano, Jr.Director
Merilee RainesDirector
Joseph W. ReitmeierDirector
Corporate Information
Executive Offices815 Chestnut Street North Andover, MA 01845-6098 Tel: (978) 688-1811
Registrar and Transfer Agent Broadridge Corporate Issuer Solutions, Inc. P.O. Box 1342 Brentwood, NY 11717 Tel: (877) 830-4936
AuditorsKPMG LLP Two Financial Center 60 South Street Boston, MA 02111
Stock ListingNew York Stock Exchange Ticker Symbol: WTS
The Board of DirectorsBack Row: Joseph W. Reitmeier, Jes Munk Hansen, Joseph T. Noonan, David A. Dunbar, Christopher L. Conway. Front Row: Merilee Raines, W. Craig Kissel, Robert J. Pagano, Jr., Louise K. GoeserPhotographed in the Watts Works Learning Center in North Andover, Massachusetts.

2016
R
Watts W
ater Technolo
gies, Inc. 2
018 A
nnual Rep
ort
Annual Report 1916© Watts Water Technologies, Inc. 2019WattsWater.com
Printed on Recycled Paper

![TM 2018 - s21.q4cdn.com · tm 2018 proxy statement noticeofannualstockholders’meeting [this page intentionally left blank] letterfromyourchairman ... 31 director compensation](https://static.fdocuments.us/doc/165x107/5b61babe7f8b9a3b488cc156/tm-2018-s21q4cdncom-tm-2018-proxy-statement-noticeofannualstockholdersmeeting.jpg)