2018-2026 CAPITAL BUDGET FORECAST - milton.ca · TOWN OF MILTON 2017 APPROVED BUDGET 2018-2026...
16
13 2017 Town of Milton Approved Capital and Operating Budget 2018-2026 CAPITAL BUDGET FORECAST
Transcript of 2018-2026 CAPITAL BUDGET FORECAST - milton.ca · TOWN OF MILTON 2017 APPROVED BUDGET 2018-2026...
132017 Town of Milton Approved Capital and Operating Budget
2018-2026 CAPITAL BUDGET FORECAST

TOWN OF MILTON 2017 APPROVED BUDGET 2018-2026 CAPITAL BUDGET FORECAST 299
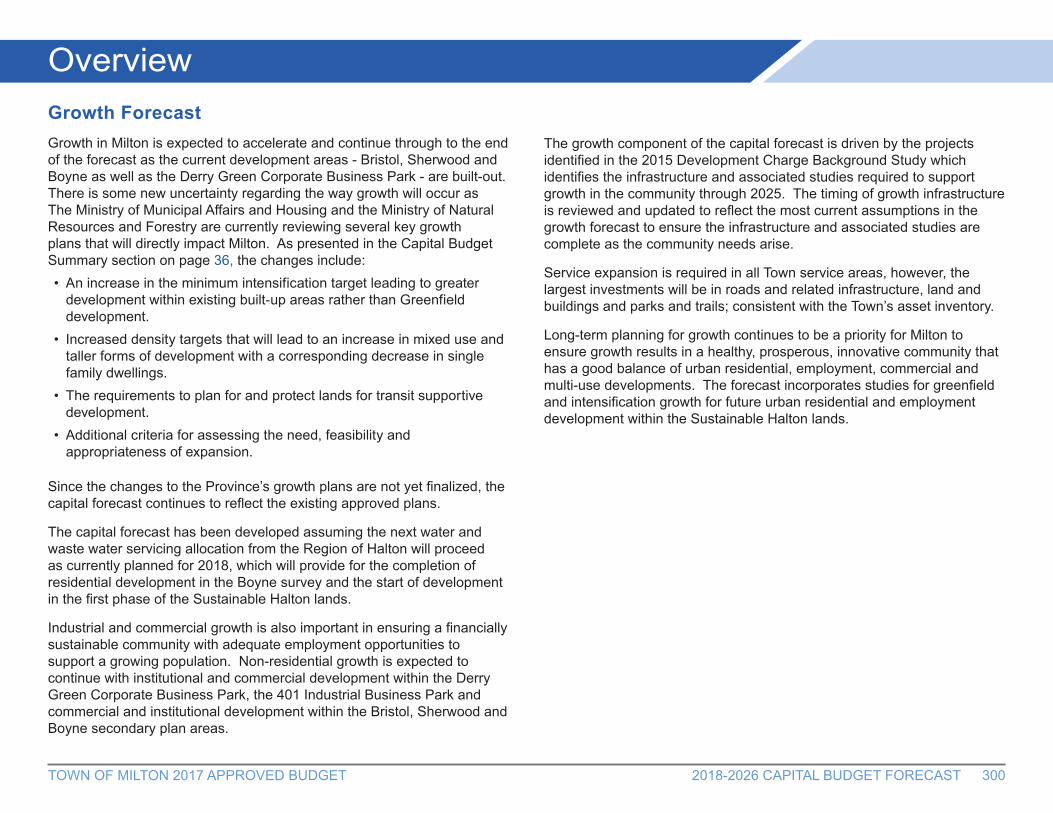
OverviewTown of MiltonIntroductionMilton is a vibrant, growing municipality that strives to be inclusive, safe, connected and engaged. The public infrastructure spending in the Town’s capital forecast defines how we move through our Town, as well as our recreational, cultural and physical activity choices. Milton is growing and aging at the same time. To meet the diverse requirements this demands, the Town must balance the need for infrastructure growth with infrastructure renewal.
The 2018-2026 Capital Forecast has been prepared following the guidelines approved in the 2017 Budget Call Report, CORS-042-16. The report directed that a nine-year capital forecast be prepared and fully funded. During the preparation of the capital forecast, consideration was given to the responses received through the public consultation process, project design changes, current pricing information, as well as priority and timing changes in infrastructure needs to correspond to updated growth forecasts and asset rehabilitation requirements.
The forecast continues to include the infrastructure to service growth in the Derry Green Corporate Business Park, Boyne and Sherwood Secondary Survey areas as well as the Town’s infrastructure renewal and replacement requirements.
The capital forecast has a gross value of $603 million and has been fully funded through a variety of funding sources. All available external sources of financing have been used to the greatest extent possible to minimize the long-term impact on taxpayers.
TOWN OF MILTON 2017 APPROVED BUDGET 2018-2026 CAPITAL BUDGET FORECAST 300
OverviewGrowth ForecastGrowth in Milton is expected to accelerate and continue through to the end of the forecast as the current development areas - Bristol, Sherwood and Boyne as well as the Derry Green Corporate Business Park - are built-out. There is some new uncertainty regarding the way growth will occur as The Ministry of Municipal Affairs and Housing and the Ministry of Natural Resources and Forestry are currently reviewing several key growth plans that will directly impact Milton. As presented in the Capital Budget Summary section on page 36, the changes include:• An increase in the minimum intensification target leading to greater
development within existing built-up areas rather than Greenfield development.
• Increased density targets that will lead to an increase in mixed use and taller forms of development with a corresponding decrease in single family dwellings.
• The requirements to plan for and protect lands for transit supportive development.
• Additional criteria for assessing the need, feasibility and appropriateness of expansion.
Since the changes to the Province’s growth plans are not yet finalized, the capital forecast continues to reflect the existing approved plans.
The capital forecast has been developed assuming the next water and waste water servicing allocation from the Region of Halton will proceed as currently planned for 2018, which will provide for the completion of residential development in the Boyne survey and the start of development in the first phase of the Sustainable Halton lands.
Industrial and commercial growth is also important in ensuring a financially sustainable community with adequate employment opportunities to support a growing population. Non-residential growth is expected to continue with institutional and commercial development within the Derry Green Corporate Business Park, the 401 Industrial Business Park and commercial and institutional development within the Bristol, Sherwood and Boyne secondary plan areas.
The growth component of the capital forecast is driven by the projects identified in the 2015 Development Charge Background Study which identifies the infrastructure and associated studies required to support growth in the community through 2025. The timing of growth infrastructure is reviewed and updated to reflect the most current assumptions in the growth forecast to ensure the infrastructure and associated studies are complete as the community needs arise.
Service expansion is required in all Town service areas, however, the largest investments will be in roads and related infrastructure, land and buildings and parks and trails; consistent with the Town’s asset inventory.
Long-term planning for growth continues to be a priority for Milton to ensure growth results in a healthy, prosperous, innovative community that has a good balance of urban residential, employment, commercial and multi-use developments. The forecast incorporates studies for greenfield and intensification growth for future urban residential and employment development within the Sustainable Halton lands.

TOWN OF MILTON 2017 APPROVED BUDGET 2018-2026 CAPITAL BUDGET FORECAST 301
OverviewTown of MiltonCapital Forecast Expenditures The expected capital investment over the nine year forecast is $603 million and includes investments in facilities, roads, parks, transit, equipment and various other assets required to meet the service needs of the growing community. As depicted in the following chart, 42.8% of the total forecast is directly related to roads, 24.2% to land and buildings and 14.1% to parks.
Top Ten Projects in the ForecastThe top ten significant investments included in the nine year forecast amount to $232.6 million and are identified below:
The top ten projects demonstrate Milton’s commitment to balance investment between growth and infrastructure renewal. New facilities, parks and roads construction represent 72% of the top ten investments, while the renewal projects of asphalt overlay and expanded asphalt programs comprise 28%.
42.8%
24.2%
14.1%
9.1%
4.8%
2.3%
1.5%
1.2%
Capital Forecast by Functional Area
2018 - 2026
$603 million
Roads and Related Infrastructure
Library
Fire
Transit
Technology, Administration and Planning
Parks and Trails
Land and Buildings
Storm Water Management
Forecast(in millions)
Boyne Community Centre 49.5$ Asphalt Overlay Program 41.5 Escarpment View Lands 26.9 Town Hall Construction/Expansion 25.7 Expanded Asphalt Program 23.2 6th Line (Hwy 401 to Derry Road) 15.6 Sherwood Community Centre 14.2 Parking Structure 12.8 Main Street (258m E of 5th Line to 6th Line) 11.8 Transit Facility 11.4
Total $ 232.6
Project Description
TOWN OF MILTON 2017 APPROVED BUDGET 2018-2026 CAPITAL BUDGET FORECAST 302
71.4%
28.6%
Cap
ital F
orec
ast b
y
Growth
and N
on-G
rowth
2018
- 20
26
Non-G
rowth
Growth
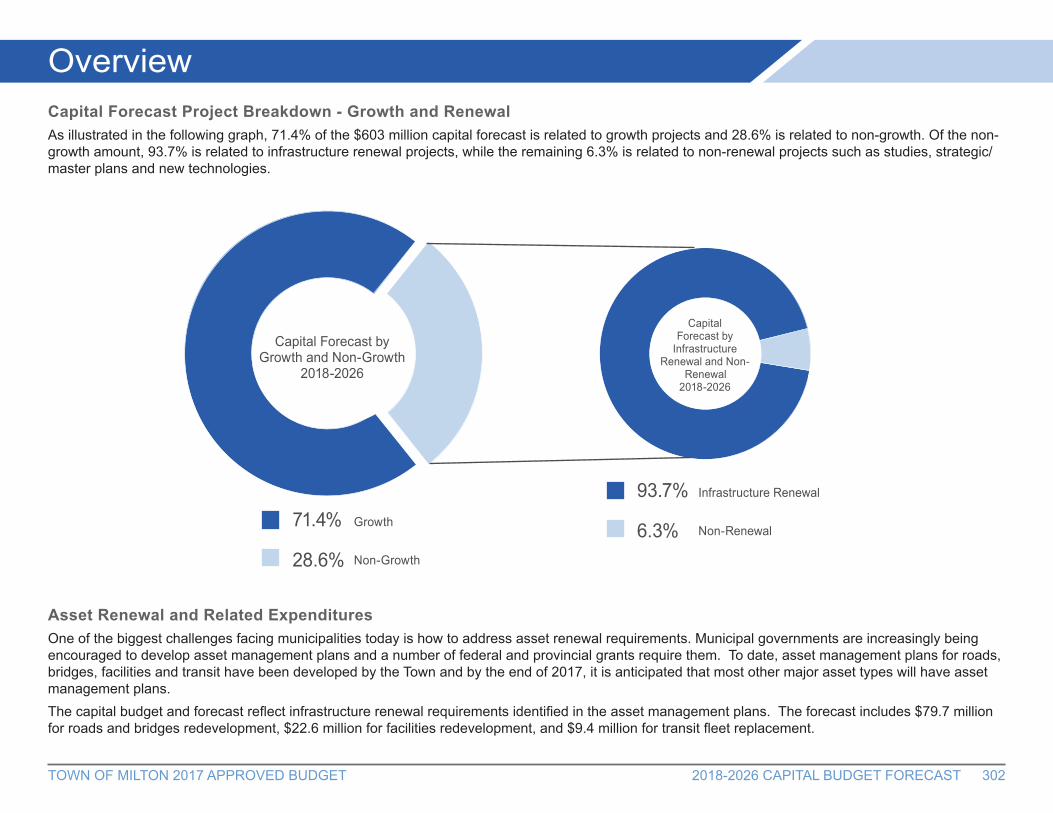
OverviewTown of MiltonCapital Forecast Project Breakdown - Growth and RenewalAs illustrated in the following graph, 71.4% of the $603 million capital forecast is related to growth projects and 28.6% is related to non-growth. Of the non-growth amount, 93.7% is related to infrastructure renewal projects, while the remaining 6.3% is related to non-renewal projects such as studies, strategic/master plans and new technologies.
Asset Renewal and Related ExpendituresOne of the biggest challenges facing municipalities today is how to address asset renewal requirements. Municipal governments are increasingly being encouraged to develop asset management plans and a number of federal and provincial grants require them. To date, asset management plans for roads, bridges, facilities and transit have been developed by the Town and by the end of 2017, it is anticipated that most other major asset types will have asset management plans. The capital budget and forecast reflect infrastructure renewal requirements identified in the asset management plans. The forecast includes $79.7 million for roads and bridges redevelopment, $22.6 million for facilities redevelopment, and $9.4 million for transit fleet replacement.
93.7%
6.3%
Capital Forecast by Infrastructure Renewal and Non-Renewal 2018 - 2026
Non-Renewal
Infrastructure Renewal Capital Forecast by Growth and Non-Growth
2018-2026
Capital Forecast by
Infrastructure Renewal and Non-
Renewal2018-2026
Growth
Non-Growth
71.4%
28.6%
Infrastructure Renewal
Non-Renewal
93.7%
6.3%
TOWN OF MILTON 2017 APPROVED BUDGET 2018-2026 CAPITAL BUDGET FORECAST 303
49.5%
6.3%
5.7%
5.5%
0.5%
24.5%
4.7%
2.1%
1.2%
Capital Forecast
Funding Sources
2018 - 2026
$603 million
Development
Charges
Grants
Contribution fro
m
Operating
Debentures Reserves and
Reserve Funds Recoveries and
Donations
Capital Provision Post Period
Development
Charges
Hydro Dividend
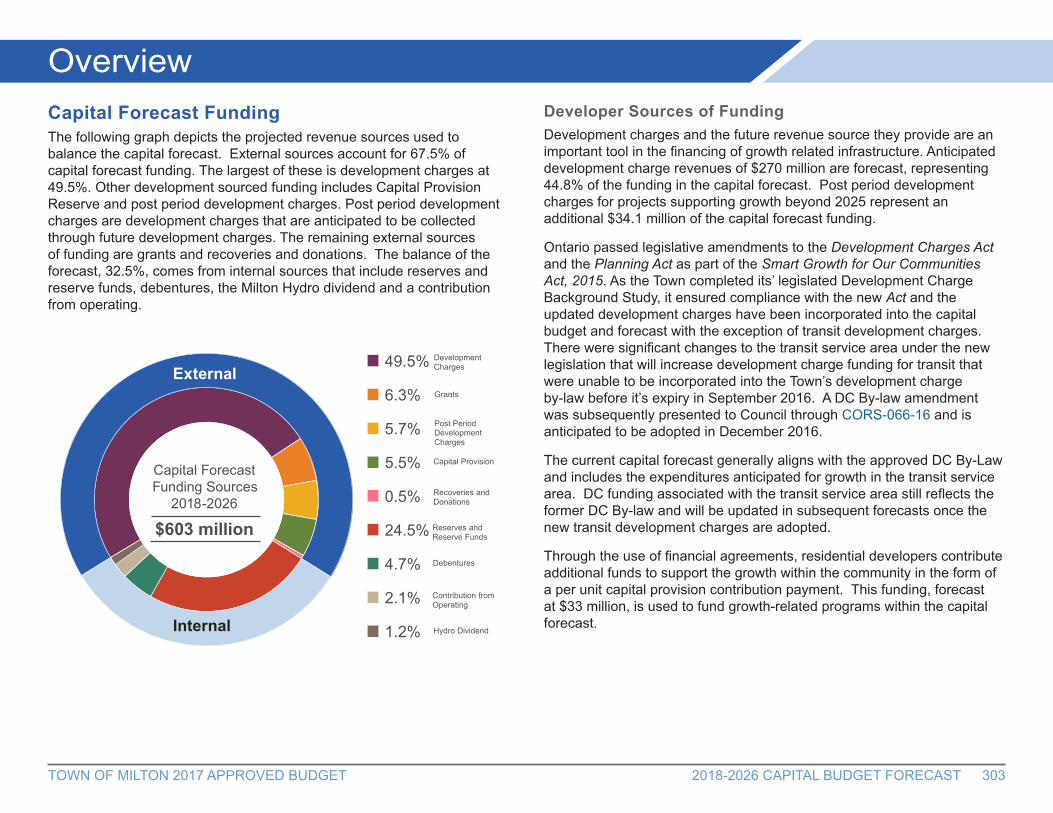
OverviewCapital Forecast FundingThe following graph depicts the projected revenue sources used to balance the capital forecast. External sources account for 67.5% of capital forecast funding. The largest of these is development charges at 49.5%. Other development sourced funding includes Capital Provision Reserve and post period development charges. Post period development charges are development charges that are anticipated to be collected through future development charges. The remaining external sources of funding are grants and recoveries and donations. The balance of the forecast, 32.5%, comes from internal sources that include reserves and reserve funds, debentures, the Milton Hydro dividend and a contribution from operating.
Developer Sources of FundingDevelopment charges and the future revenue source they provide are an important tool in the financing of growth related infrastructure. Anticipated development charge revenues of $270 million are forecast, representing 44.8% of the funding in the capital forecast. Post period development charges for projects supporting growth beyond 2025 represent an additional $34.1 million of the capital forecast funding.
Ontario passed legislative amendments to the Development Charges Act and the Planning Act as part of the Smart Growth for Our Communities Act, 2015. As the Town completed its’ legislated Development Charge Background Study, it ensured compliance with the new Act and the updated development charges have been incorporated into the capital budget and forecast with the exception of transit development charges. There were significant changes to the transit service area under the new legislation that will increase development charge funding for transit that were unable to be incorporated into the Town’s development charge by-law before it’s expiry in September 2016. A DC By-law amendment was subsequently presented to Council through CORS-066-16 and is anticipated to be adopted in December 2016.
The current capital forecast generally aligns with the approved DC By-Law and includes the expenditures anticipated for growth in the transit service area. DC funding associated with the transit service area still reflects the former DC By-law and will be updated in subsequent forecasts once the new transit development charges are adopted.
Through the use of financial agreements, residential developers contribute additional funds to support the growth within the community in the form of a per unit capital provision contribution payment. This funding, forecast at $33 million, is used to fund growth-related programs within the capital forecast.
49.5%
6.3%
5.7%
5.5%
0.5%
24.5%
4.7%
2.1%
1.2%
Capital Forecast Funding Sources
2018 - 2026
$603 million
Development Charges
Grants
Contribution from Operating
Debentures
Reserves and Reserve Funds
Recoveries and Donations
Capital Provision
Post Period Development Charges
Hydro Dividend
External
Internal
Capital Forecast Funding Sources
2018-2026
$603 million
TOWN OF MILTON 2017 APPROVED BUDGET 2018-2026 CAPITAL BUDGET FORECAST 304
OverviewReserves and Reserve FundsReserves and reserve funds are a critical component of the long term funding of the capital forecast representing 24.5% of the total. Over half of this funding comes from the Ontario Lottery Corporation Proceeds and the Equipment Replacement Reserve. The Slot Reserve Fund is used to finance a variety of projects like the Emerald Ash Borer Implementation Strategy, road rehabilitation projects and computer equipment replacement. The Equipment Replacement Reserve provides for the replacement of Town owned vehicles and equipment including fire trucks, transit buses, and snow plows and other operations vehicles.
GrantsThe Town has relied heavily on the monies received from the Federal Gas Tax Fund (GTF) to finance road and transit infrastructure projects in the capital budget. The nine year capital forecast is projected to use more than $27.2 million to help build and revitalize roads and bridges.
The Ontario Community Infrastructure Fund (OCIF) provides funding to help communities address critical core infrastructure needs in relation to roads, bridges, water and waste water. The Town’s allocation of nearly $5.0 million is incorporated into the forecast to support road rehabilitation projects.
Debenture FundingDebt is a key component of the Town’s overall financial plan and is used to enable timely construction of capital projects and minimize impacts on the tax rate. Reserve debentures are funds borrowed against the Cash - In - Lieu of Parkland and the Property Transactions Reserve Funds. Development charge debentures are used to fund growth related projects as identified in the DC study and will be repaid using development charge revenues as growth occurs. The following table provides a summary of debt by funding source.
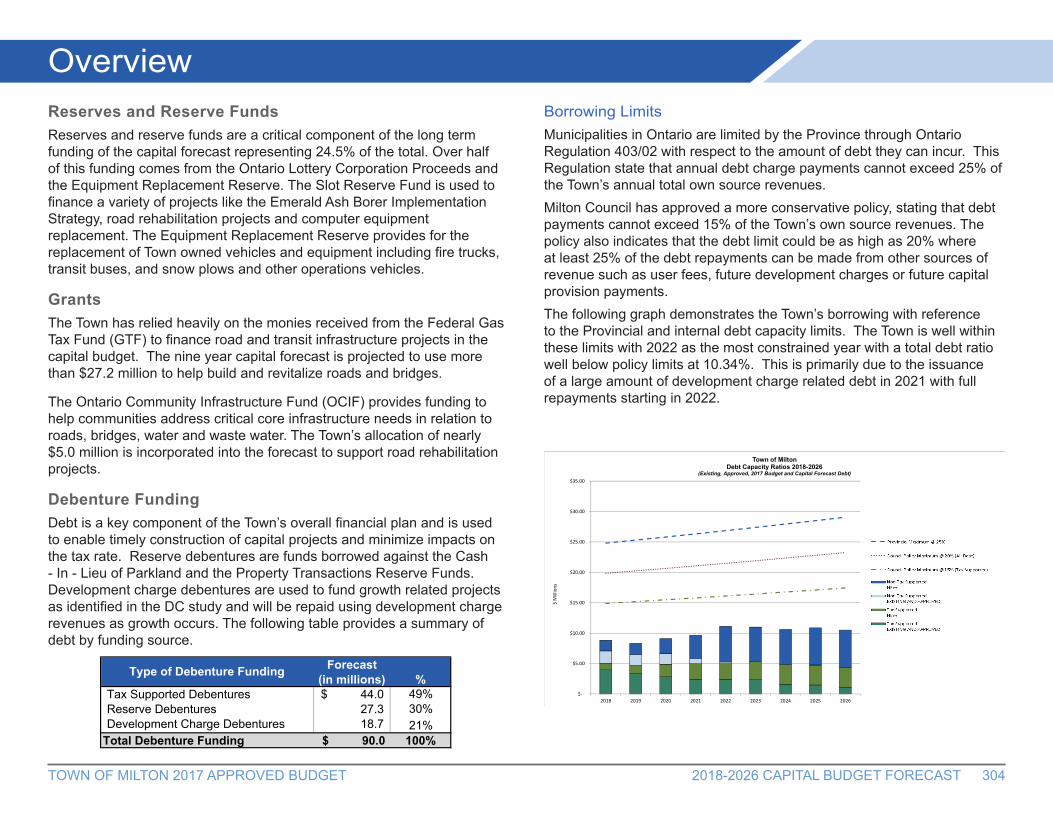
Borrowing LimitsMunicipalities in Ontario are limited by the Province through Ontario Regulation 403/02 with respect to the amount of debt they can incur. This Regulation state that annual debt charge payments cannot exceed 25% of the Town’s annual total own source revenues. Milton Council has approved a more conservative policy, stating that debt payments cannot exceed 15% of the Town’s own source revenues. The policy also indicates that the debt limit could be as high as 20% where at least 25% of the debt repayments can be made from other sources of revenue such as user fees, future development charges or future capital provision payments.The following graph demonstrates the Town’s borrowing with reference to the Provincial and internal debt capacity limits. The Town is well within these limits with 2022 as the most constrained year with a total debt ratio well below policy limits at 10.34%. This is primarily due to the issuance of a large amount of development charge related debt in 2021 with full repayments starting in 2022.
Forecast(in millions) %
Tax Supported Debentures 44.0$ 49%Reserve Debentures 27.3 30%Development Charge Debentures 18.7 21%
Total Debenture Funding $ 90.0 100%
Type of Debenture Funding $‐
$5.00
$10.00
$15.00
$20.00
$25.00
$30.00
$35.00
2018 2019 2020 2021 2022 2023 2024 2025 2026
$ Millions
Town of MiltonDebt Capacity Ratios 2018-2026
(Existing, Approved, 2017 Budget and Capital Forecast Debt)
Non Tax SupportedNEW
Non Tax SupportedEXISTING AND APPROVED
Tax SupportedNEW
Tax SupportedEXISTING AND APPROVED
Provincial Maximum @ 25%
Council Policy Maximum @ 20% (All Debt)
Council Policy Maximum @ 15% (Tax Supported)
TOWN OF MILTON 2017 APPROVED BUDGET 2018-2026 CAPITAL BUDGET FORECAST 305
Forecast Summary by DepartmentDescription 2018
Forecast2019
Forecast2020
Forecast2021
Forecast2022
Forecast2023
Forecast2024
Forecast2025
Forecast2026
Forecast
Executive ServicesOffice of the CAO
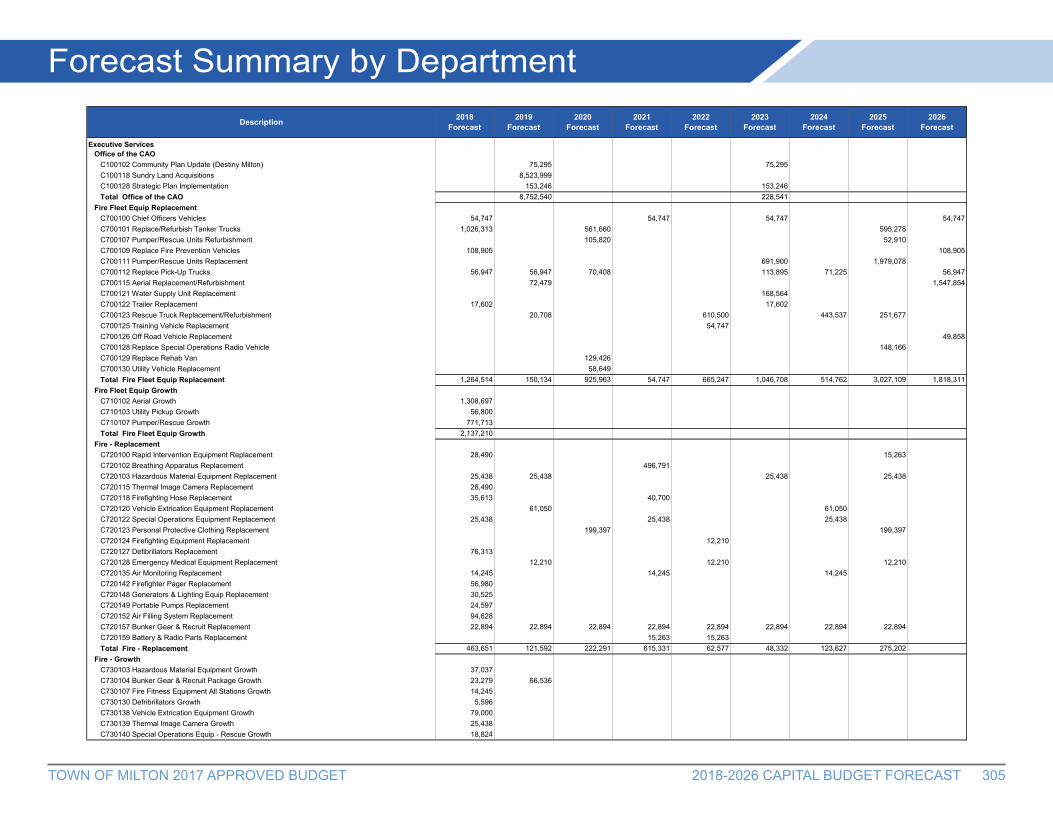
C100102 Community Plan Update (Destiny Milton) 75,295 75,295C100118 Sundry Land Acquisitions 8,523,999C100128 Strategic Plan Implementation 153,246 153,246Total Office of the CAO 8,752,540 228,541
Fire Fleet Equip ReplacementC700100 Chief Officers Vehicles 54,747 54,747 54,747 54,747C700101 Replace/Refurbish Tanker Trucks 1,026,313 561,660 595,278C700107 Pumper/Rescue Units Refurbishment 105,820 52,910C700109 Replace Fire Prevention Vehicles 108,905 108,905C700111 Pumper/Rescue Units Replacement 691,900 1,979,078C700112 Replace Pick-Up Trucks 56,947 56,947 70,408 113,895 71,225 56,947C700115 Aerial Replacement/Refurbishment 72,479 1,547,854C700121 Water Supply Unit Replacement 168,564C700122 Trailer Replacement 17,602 17,602C700123 Rescue Truck Replacement/Refurbishment 20,708 610,500 443,537 251,677C700125 Training Vehicle Replacement 54,747C700126 Off Road Vehicle Replacement 49,858C700128 Replace Special Operations Radio Vehicle 148,166C700129 Replace Rehab Van 129,426C700130 Utility Vehicle Replacement 58,649Total Fire Fleet Equip Replacement 1,264,514 150,134 925,963 54,747 665,247 1,046,708 514,762 3,027,109 1,818,311
Fire Fleet Equip GrowthC710102 Aerial Growth 1,308,697C710103 Utility Pickup Growth 56,800C710107 Pumper/Rescue Growth 771,713Total Fire Fleet Equip Growth 2,137,210
Fire - ReplacementC720100 Rapid Intervention Equipment Replacement 28,490 15,263C720102 Breathing Apparatus Replacement 496,791C720103 Hazardous Material Equipment Replacement 25,438 25,438 25,438 25,438C720115 Thermal Image Camera Replacement 28,490C720118 Firefighting Hose Replacement 35,613 40,700C720120 Vehicle Extrication Equipment Replacement 61,050 61,050C720122 Special Operations Equipment Replacement 25,438 25,438 25,438C720123 Personal Protective Clothing Replacement 199,397 199,397C720124 Firefighting Equipment Replacement 12,210C720127 Defibrillators Replacement 76,313C720128 Emergency Medical Equipment Replacement 12,210 12,210 12,210C720135 Air Monitoring Replacement 14,245 14,245 14,245C720142 Firefighter Pager Replacement 56,980C720148 Generators & Lighting Equip Replacement 30,525C720149 Portable Pumps Replacement 24,597C720152 Air Filling System Replacement 94,628C720157 Bunker Gear & Recruit Replacement 22,894 22,894 22,894 22,894 22,894 22,894 22,894 22,894C720159 Battery & Radio Parts Replacement 15,263 15,263Total Fire - Replacement 463,651 121,592 222,291 615,331 62,577 48,332 123,627 275,202
Fire - GrowthC730103 Hazardous Material Equipment Growth 37,037C730104 Bunker Gear & Recruit Package Growth 23,279 66,536C730107 Fire Fitness Equipment All Stations Growth 14,245C730130 Defribrillators Growth 5,596C730138 Vehicle Extrication Equipment Growth 79,000C730139 Thermal Image Camera Growth 25,438C730140 Special Operations Equip - Rescue Growth 18,824

TOWN OF MILTON 2017 APPROVED BUDGET 2018-2026 CAPITAL BUDGET FORECAST 306
Forecast Summary by Department
Description 2018 Forecast
2019 Forecast
2020 Forecast
2021 Forecast
2022 Forecast
2023 Forecast
2024 Forecast
2025 Forecast
2026 Forecast
C730141 Emergency Medical Equipment Growth 20,757Total Fire - Growth 224,176 66,536
FireC740101 Electronic Accountability System 61,793C740102 Dry Hydrant Systems 20,350Total Fire 82,143
Total Executive Services 4,171,694 9,090,802 1,148,254 670,078 727,824 1,323,581 638,389 3,302,311 1,818,311
Corporate ServicesFinance
C200100 Development Charges Study 320,513 250,000 122,100 320,513 250,000 320,513C200101 Asset Management Plan 76,313 76,313 76,313C200103 Benchmarking & Performance Measures 75,938C200110 Facility Audit Update 219,675 219,675C200111 User Fee Update 66,138 81,400 66,138 81,400 66,138 81,400C200123 Special Financial Studies 30,525 152,625C200124 Legislated DC Exemptions 730,800 1,473,910 700,000 867,000 851,500 700,000 700,000 700,000 700,000Total Finance 1,203,564 1,759,723 1,061,925 989,100 1,314,464 1,001,075 852,625 1,016,138 1,178,226
Human ResourcesC220104 Employee Strategic Development 40,700 40,700 40,700C220106 Compensation Plan 86,488 86,488Total Human Resources 40,700 86,488 40,700 86,488 40,700
Information TechnologyC240003 Technology Strategic Plan 77,656 77,656C240004 Technology Replacement/Upgrade 152,625 152,625 152,625 152,625 152,625 152,625 152,625 152,625 152,625C240005 Phone System Changes/Upgrade 71,225 71,225 172,975 71,225 71,225 71,225 71,225 172,975 172,975C240006 PC Workstation Complement Changes 26,455 26,455 26,455 26,455 26,455 26,455 26,455 26,455 26,455C240009 E-Services Strategy/Implementation 101,750 101,750 101,750 122,100 122,100 122,100 122,100 122,100 122,100C240011 GIS Implementation 50,875 50,875 50,875 15,263 15,263 15,263 15,263 15,263 15,263C240014 Application Software Update 50,875 101,750 50,875 101,750 50,875 101,750 50,875 50,875 50,875C240015 Legacy Systems 1,017,500 76,313 3,561,250C240016 Pavement Management System 15,263 15,263 15,263 15,263 15,263 15,263 15,263 15,263 15,263C240025 Photocopiers 152,625 132,275C240027 Radio Communications Backup Upgrades 51,770C240028 Milton Air Photo Mapping 35,613 35,613 35,613 35,613C240119 Enterprise Content Management 25,438 25,438 15,263 15,263 15,263 15,263 15,263 15,263 15,263C240121 Emergency Operations Centre 12,926 12,926 12,926 12,926 12,926C240123 Mobile Parking Enforcement 20,350 20,350 20,350 20,350 20,350 20,350 20,350 20,350 20,350C241014 Dept Specific - Infrastructure/Asset Management SystemC241100 Department Specific Initiatives 493,489 513,838 386,651 508,751 386,651 508,751 386,651 508,751 386,651C242001 Tech Infrastructure - Network Hardware 1,017,500 712,250 508,750 508,750 508,750 1,017,500 712,250 508,750 508,750C242002 Tech Infrastructure - Server Hardware 325,600 325,600 834,350 610,500 325,600 325,600 325,600 325,600 325,600C242003 Tech Infrastructure - Network Licencing 101,750 71,225 71,225 71,225 71,225 71,225 71,225 71,225 71,225Total Information Technology 3,535,391 2,376,882 2,420,333 2,429,102 1,794,571 6,192,508 1,998,071 2,118,764 1,896,321
ClerksC120102 Ward Boundary Review 66,138C260002 Impact on Regulatory Framework Study 30,525C260004 Records Management/MFIPPA Compliance 56,980C260005 Compliance/Enforcement Lean Six Sigma 22,385C260006 Town Clerk's Policy/Procedure Manual 23,403Total Clerks 87,505 45,788 66,138
Total Corporate Services 4,867,160 4,136,605 3,614,534 3,418,202 3,149,735 7,193,583 2,937,184 3,201,040 3,115,247
Engineering ServicesEng Serv Administration
C300110 Development Eng & Parks Standards Manual 61,050 61,050 61,050C300112 Intensification Study-Roads 44,500
TOWN OF MILTON 2017 APPROVED BUDGET 2018-2026 CAPITAL BUDGET FORECAST 307
Forecast Summary by DepartmentDescription 2018
Forecast2019
Forecast2020
Forecast2021
Forecast2022
Forecast2023
Forecast2024
Forecast2025
Forecast2026
Forecast
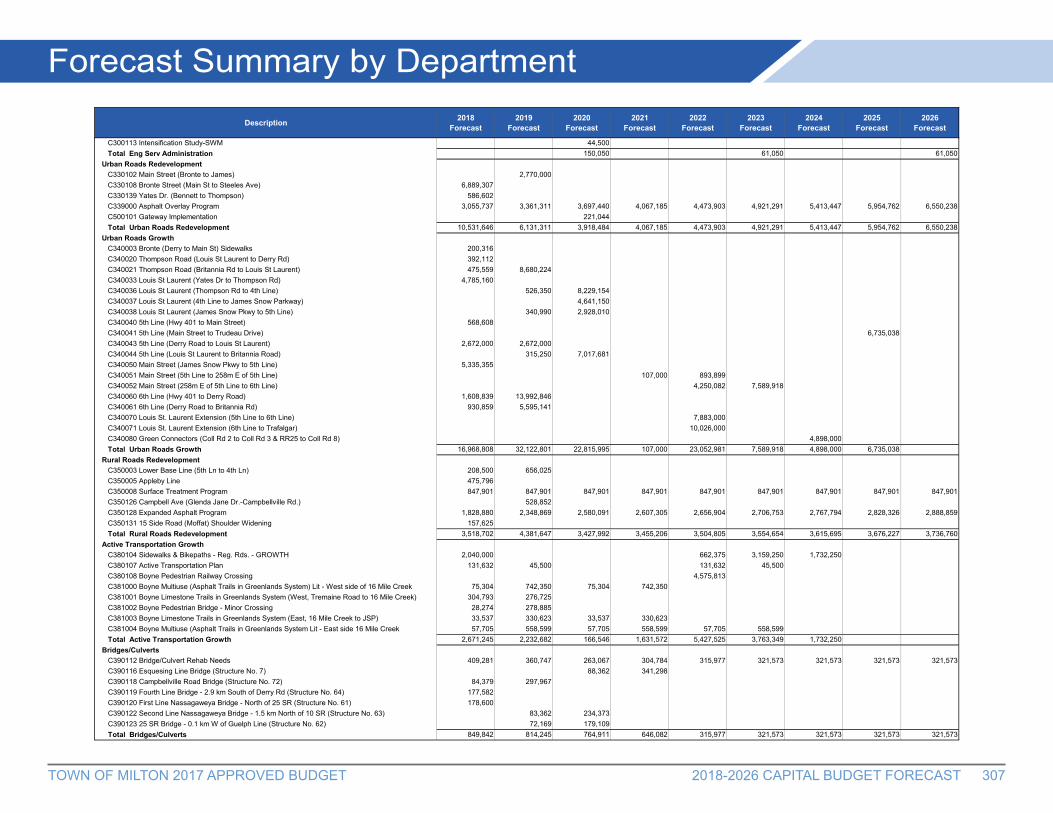
C300113 Intensification Study-SWM 44,500Total Eng Serv Administration 150,050 61,050 61,050
Urban Roads RedevelopmentC330102 Main Street (Bronte to James) 2,770,000C330108 Bronte Street (Main St to Steeles Ave) 6,889,307C330139 Yates Dr. (Bennett to Thompson) 586,602C339000 Asphalt Overlay Program 3,055,737 3,361,311 3,697,440 4,067,185 4,473,903 4,921,291 5,413,447 5,954,762 6,550,238C500101 Gateway Implementation 221,044Total Urban Roads Redevelopment 10,531,646 6,131,311 3,918,484 4,067,185 4,473,903 4,921,291 5,413,447 5,954,762 6,550,238
Urban Roads GrowthC340003 Bronte (Derry to Main St) Sidewalks 200,316C340020 Thompson Road (Louis St Laurent to Derry Rd) 392,112C340021 Thompson Road (Britannia Rd to Louis St Laurent) 475,559 8,680,224C340033 Louis St Laurent (Yates Dr to Thompson Rd) 4,785,160C340036 Louis St Laurent (Thompson Rd to 4th Line) 526,350 8,229,154C340037 Louis St Laurent (4th Line to James Snow Parkway) 4,641,150C340038 Louis St Laurent (James Snow Pkwy to 5th Line) 340,990 2,928,010C340040 5th Line (Hwy 401 to Main Street) 568,608C340041 5th Line (Main Street to Trudeau Drive) 6,735,038C340043 5th Line (Derry Road to Louis St Laurent) 2,672,000 2,672,000C340044 5th Line (Louis St Laurent to Britannia Road) 315,250 7,017,681C340050 Main Street (James Snow Pkwy to 5th Line) 5,335,355C340051 Main Street (5th Line to 258m E of 5th Line) 107,000 893,899C340052 Main Street (258m E of 5th Line to 6th Line) 4,250,082 7,589,918C340060 6th Line (Hwy 401 to Derry Road) 1,608,839 13,992,846C340061 6th Line (Derry Road to Britannia Rd) 930,859 5,595,141C340070 Louis St. Laurent Extension (5th Line to 6th Line) 7,883,000C340071 Louis St. Laurent Extension (6th Line to Trafalgar) 10,026,000C340080 Green Connectors (Coll Rd 2 to Coll Rd 3 & RR25 to Coll Rd 8) 4,898,000Total Urban Roads Growth 16,968,808 32,122,801 22,815,995 107,000 23,052,981 7,589,918 4,898,000 6,735,038
Rural Roads RedevelopmentC350003 Lower Base Line (5th Ln to 4th Ln) 208,500 656,025C350005 Appleby Line 475,796C350008 Surface Treatment Program 847,901 847,901 847,901 847,901 847,901 847,901 847,901 847,901 847,901C350126 Campbell Ave (Glenda Jane Dr.-Campbellville Rd.) 528,852C350128 Expanded Asphalt Program 1,828,880 2,348,869 2,580,091 2,607,305 2,656,904 2,706,753 2,767,794 2,828,326 2,888,859C350131 15 Side Road (Moffat) Shoulder Widening 157,625Total Rural Roads Redevelopment 3,518,702 4,381,647 3,427,992 3,455,206 3,504,805 3,554,654 3,615,695 3,676,227 3,736,760
Active Transportation GrowthC380104 Sidewalks & Bikepaths - Reg. Rds. - GROWTH 2,040,000 662,375 3,159,250 1,732,250C380107 Active Transportation Plan 131,632 45,500 131,632 45,500C380108 Boyne Pedestrian Railway Crossing 4,575,813C381000 Boyne Multiuse (Asphalt Trails in Greenlands System) Lit - West side of 16 Mile Creek 75,304 742,350 75,304 742,350C381001 Boyne Limestone Trails in Greenlands System (West, Tremaine Road to 16 Mile Creek) 304,793 276,725C381002 Boyne Pedestrian Bridge - Minor Crossing 28,274 278,885C381003 Boyne Limestone Trails in Greenlands System (East, 16 Mile Creek to JSP) 33,537 330,623 33,537 330,623C381004 Boyne Multiuse (Asphalt Trails in Greenlands System Lit - East side 16 Mile Creek 57,705 558,599 57,705 558,599 57,705 558,599Total Active Transportation Growth 2,671,245 2,232,682 166,546 1,631,572 5,427,525 3,763,349 1,732,250
Bridges/CulvertsC390112 Bridge/Culvert Rehab Needs 409,281 360,747 263,067 304,784 315,977 321,573 321,573 321,573 321,573C390116 Esquesing Line Bridge (Structure No. 7) 88,362 341,298C390118 Campbellville Road Bridge (Structure No. 72) 84,379 297,967C390119 Fourth Line Bridge - 2.9 km South of Derry Rd (Structure No. 64) 177,582C390120 First Line Nassagaweya Bridge - North of 25 SR (Structure No. 61) 178,600C390122 Second Line Nassagaweya Bridge - 1.5 km North of 10 SR (Structure No. 63) 83,362 234,373C390123 25 SR Bridge - 0.1 km W of Guelph Line (Structure No. 62) 72,169 179,109Total Bridges/Culverts 849,842 814,245 764,911 646,082 315,977 321,573 321,573 321,573 321,573
TOWN OF MILTON 2017 APPROVED BUDGET 2018-2026 CAPITAL BUDGET FORECAST 308
Forecast Summary by DepartmentDescription 2018
Forecast2019
Forecast2020
Forecast2021
Forecast2022
Forecast2023
Forecast2024
Forecast2025
Forecast2026
Forecast
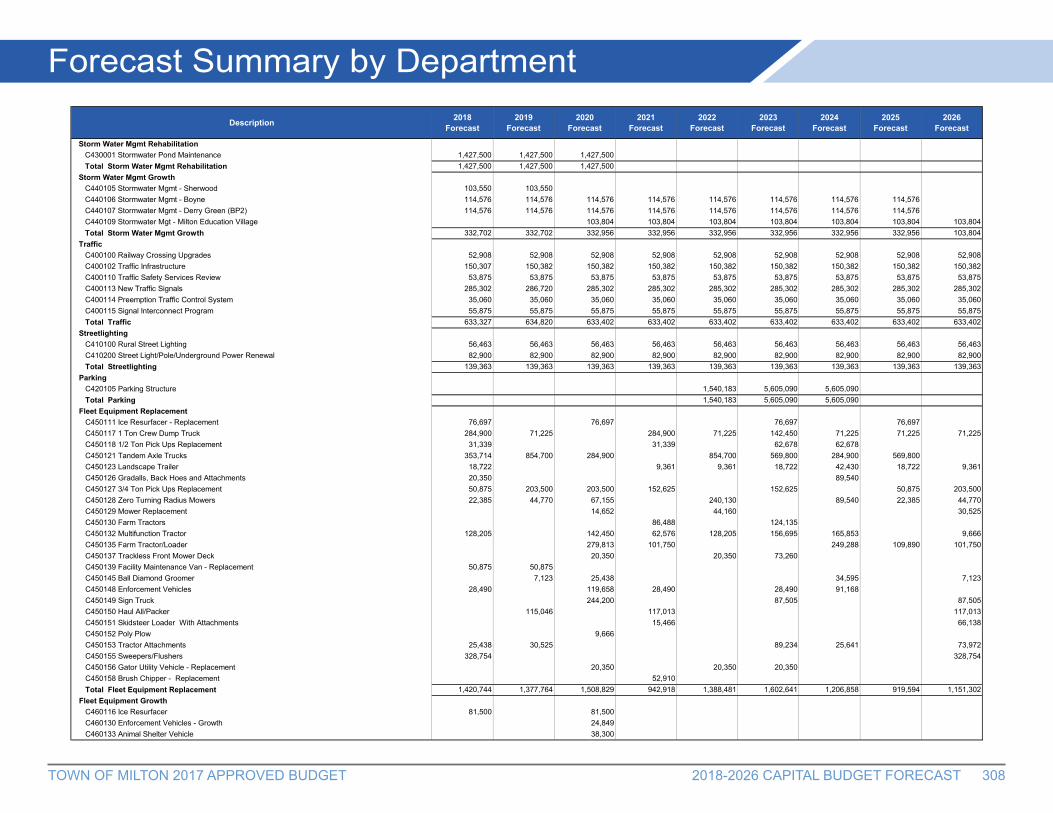
Storm Water Mgmt RehabilitationC430001 Stormwater Pond Maintenance 1,427,500 1,427,500 1,427,500Total Storm Water Mgmt Rehabilitation 1,427,500 1,427,500 1,427,500
Storm Water Mgmt GrowthC440105 Stormwater Mgmt - Sherwood 103,550 103,550C440106 Stormwater Mgmt - Boyne 114,576 114,576 114,576 114,576 114,576 114,576 114,576 114,576C440107 Stormwater Mgmt - Derry Green (BP2) 114,576 114,576 114,576 114,576 114,576 114,576 114,576 114,576C440109 Stormwater Mgt - Milton Education Village 103,804 103,804 103,804 103,804 103,804 103,804 103,804Total Storm Water Mgmt Growth 332,702 332,702 332,956 332,956 332,956 332,956 332,956 332,956 103,804
TrafficC400100 Railway Crossing Upgrades 52,908 52,908 52,908 52,908 52,908 52,908 52,908 52,908 52,908C400102 Traffic Infrastructure 150,307 150,382 150,382 150,382 150,382 150,382 150,382 150,382 150,382C400110 Traffic Safety Services Review 53,875 53,875 53,875 53,875 53,875 53,875 53,875 53,875 53,875C400113 New Traffic Signals 285,302 286,720 285,302 285,302 285,302 285,302 285,302 285,302 285,302C400114 Preemption Traffic Control System 35,060 35,060 35,060 35,060 35,060 35,060 35,060 35,060 35,060C400115 Signal Interconnect Program 55,875 55,875 55,875 55,875 55,875 55,875 55,875 55,875 55,875Total Traffic 633,327 634,820 633,402 633,402 633,402 633,402 633,402 633,402 633,402
StreetlightingC410100 Rural Street Lighting 56,463 56,463 56,463 56,463 56,463 56,463 56,463 56,463 56,463C410200 Street Light/Pole/Underground Power Renewal 82,900 82,900 82,900 82,900 82,900 82,900 82,900 82,900 82,900Total Streetlighting 139,363 139,363 139,363 139,363 139,363 139,363 139,363 139,363 139,363
ParkingC420105 Parking Structure 1,540,183 5,605,090 5,605,090Total Parking 1,540,183 5,605,090 5,605,090
Fleet Equipment ReplacementC450111 Ice Resurfacer - Replacement 76,697 76,697 76,697 76,697C450117 1 Ton Crew Dump Truck 284,900 71,225 284,900 71,225 142,450 71,225 71,225 71,225C450118 1/2 Ton Pick Ups Replacement 31,339 31,339 62,678 62,678C450121 Tandem Axle Trucks 353,714 854,700 284,900 854,700 569,800 284,900 569,800C450123 Landscape Trailer 18,722 9,361 9,361 18,722 42,430 18,722 9,361C450126 Gradalls, Back Hoes and Attachments 20,350 89,540C450127 3/4 Ton Pick Ups Replacement 50,875 203,500 203,500 152,625 152,625 50,875 203,500C450128 Zero Turning Radius Mowers 22,385 44,770 67,155 240,130 89,540 22,385 44,770C450129 Mower Replacement 14,652 44,160 30,525C450130 Farm Tractors 86,488 124,135C450132 Multifunction Tractor 128,205 142,450 62,576 128,205 156,695 165,853 9,666C450135 Farm Tractor/Loader 279,813 101,750 249,288 109,890 101,750C450137 Trackless Front Mower Deck 20,350 20,350 73,260C450139 Facility Maintenance Van - Replacement 50,875 50,875C450145 Ball Diamond Groomer 7,123 25,438 34,595 7,123C450148 Enforcement Vehicles 28,490 119,658 28,490 28,490 91,168C450149 Sign Truck 244,200 87,505 87,505C450150 Haul All/Packer 115,046 117,013 117,013C450151 Skidsteer Loader With Attachments 15,466 66,138C450152 Poly Plow 9,666C450153 Tractor Attachments 25,438 30,525 89,234 25,641 73,972C450155 Sweepers/Flushers 328,754 328,754C450156 Gator Utility Vehicle - Replacement 20,350 20,350 20,350C450158 Brush Chipper - Replacement 52,910Total Fleet Equipment Replacement 1,420,744 1,377,764 1,508,829 942,918 1,388,481 1,602,641 1,206,858 919,594 1,151,302
Fleet Equipment GrowthC460116 Ice Resurfacer 81,500 81,500C460130 Enforcement Vehicles - Growth 24,849C460133 Animal Shelter Vehicle 38,300

TOWN OF MILTON 2017 APPROVED BUDGET 2018-2026 CAPITAL BUDGET FORECAST 309
Forecast Summary by Department
Description 2018 Forecast
2019 Forecast
2020 Forecast
2021 Forecast
2022 Forecast
2023 Forecast
2024 Forecast
2025 Forecast
2026 Forecast
C460200 Provision for Parks Growth Fleet 339,200 296,800 289,200 366,668 310,000 250,000 100,000C460201 Provision for Operations Growth Fleet 953,496 700,000 700,000 750,000 750,000 400,000 400,000Total Fleet Equipment Growth 1,374,196 996,800 1,133,849 1,116,668 1,060,000 650,000 500,000
Park PreservationC470001 Park Improvements 53,928 61,050 74,278 47,823 80,892 80,892 80,892 80,892C470002 Tennis Court Upgrades 71,225 71,225 71,225C470003 Sports Field and Park Lighting 20,350C470004 Pioneer Cemetery 19,536 21,062Total Park Preservation 165,039 153,337 145,503 47,823 80,892 80,892 80,892 80,892
ForestryC330134 EAB Implementation Strategy 41,416C510139 Urban Forestry Management 62,875 62,875Total Forestry 41,416 62,875 62,875
TransitC550100 Transit Study 178,063 178,063C550103 Transit Facility 718,481 3,546,037 7,166,122C550104 Transit Bus Pads 24,800 24,800 24,800 24,800 24,800 24,800 24,800 24,800 24,800C550108 Transit Bus Stop-Retrofit 99,011Total Transit 1,020,355 3,570,837 7,190,922 24,800 24,800 202,863 24,800 24,800 24,800
Transit Fleet ReplacementC560110 Transit Bus Non Growth: Refurbishment 228,938 152,625 152,625 76,313 381,563 305,250C560120 Transit Bus Non Growth: Replacement 1,566,424 1,772,466 3,074,768 1,566,424C560121 Transit Support Vehicles - Replacement 120,716Total Transit Fleet Replacement 228,938 1,566,424 1,772,466 3,227,393 152,625 1,763,453 381,563 305,250
Transit Fleet GrowthC570101 Transit Bus 560,296 1,120,591 1,120,591 1,120,591 1,120,591 560,296 560,296 560,296 560,296C570108 Transit Support VehiclesTotal Transit Fleet Growth 560,296 1,120,591 1,120,591 1,120,591 1,120,591 560,296 560,296 560,296 560,296
Total Engineering Services 41,884,119 57,065,699 46,649,359 14,265,566 46,323,252 30,171,963 26,890,950 19,760,466 13,587,838
Community ServicesComm Serv Administration
C500105 Parks Master Plan Update 76,313 25,438 25,438C500106 Recreation Master Plan (DC) 76,313 76,313C500117 Intensification Study - Parks 68,101C500119 Intensification Study - Recreation 55,700C500121 Service Strategy 56,546 56,546 56,546Total Comm Serv Administration 132,859 200,114 81,984 76,313 81,984
Parks RedevelopmentC510102 Playground Upgrades 70,811 70,811C510112 Sports Field And Park Lighting 247,575C510128 Moffat Park Redevelopment 66,824 480,743C510131 New Campbellville Park Redevelopment 701,272C510134 Omagh Park Redevelopment 101,337 868,121C510135 Kingsleigh Park Redevelopment 66,085 442,456C510145 Centre Park Redevelopment 59,064 361,225C510146 Court Park Redevelopment 59,064 361,225C510148 Coulson Park Redevelopment 61,650 389,681C510149 Coxe Park Redevelopment 66,305 472,465C510150 Moorelands Park Redevelopment 53,149 249,983C510151 Sam Sherratt Park Redevelopment 77,172 589,397C510152 Baldwin Park Redevelopment 51,302 351,394C510153 Chris Hadfield Park Redevelopment 61,650 573,875C510165 Trudeau Park Redevelopment 51,302 353,463C510166 Beaty Trail Park Redevelopment 51,302 353,463

TOWN OF MILTON 2017 APPROVED BUDGET 2018-2026 CAPITAL BUDGET FORECAST 310
Forecast Summary by DepartmentDescription 2018
Forecast2019
Forecast2020
Forecast2021
Forecast2022
Forecast2023
Forecast2024
Forecast2025
Forecast2026
Forecast
C510169 Watson Park Redevelopment 42,385C510170 McDuffe Park Redevelopment 42,385Total Parks Redevelopment 778,444 845,160 1,423,764 2,006,901 862,146 61,650 625,177 453,998 791,696
Parks GrowthC520102 Parkland Dedication Bench Mark Update 39,120 39,120 39,120C520103 Playground Growth 73,557 73,557 147,114 147,114 147,114 73,557 147,114C520123 Escarpment View Lands (Formerly Jannock Property) 165,799 1,953,200 1,668,700C520202 Cemetery 301,355C521136 Community Park Derry Green 569,163 5,278,109C521139 Escarpment View Lands 1,718,502 8,694,194 5,179,068 6,512,664 4,815,967C522132 Sherwood District Park 82,157 823,387C522133 District Park West - Boyne 785,312 8,644,384C522134 District Park East - Boyne 523,719 5,938,759C524001 Walker Neighbourhood Park - Boyne 136,943 1,633,904C524002 Ford Neighbourhood Park - Boyne 169,495 1,744,262C524003 Cobban Neighbourhood Park - Boyne 160,011 1,678,112C524004 Bowes Neighbourhood Park - Boyne 161,238 1,688,454C525046 Clarke - VS#6 (13)(Derry Road/Fourth Line Landowners) 45,264 459,149C525073 Milton Heights 2C - North 45,264 459,149C525074 Milton Heights 2C - South 45,264 459,149C525080 Park Development Village Squares-Boyne 32,516 369,811 369,811 402,883 706,549 369,811 369,811 369,811 336,738C525085 Ford Village Square #1 336,833C525090 Community Park - Milton Heights 174,119 1,787,968Total Parks Growth 3,364,171 23,400,784 15,613,518 11,672,847 13,296,843 482,488 516,925 369,811 375,858
Trails RedevelopmentC530101 Implementation Trails Master Plan 103,217 103,217Total Trails Redevelopment 103,217 103,217
Trails GrowthC540002 New Trail Development 318,919 655,208C540102 Linear Park Multi Use Trail - Coates South (4b) 214,686 332,713C540109 Willmott Pipeline Easement 545,098C540110 Milton Heights Tributary Trails 110,150 917,705C540111 Derry Green Union Gas Pipeline Easement 130,052 1,135,489 990,886Total Trails Growth 1,208,755 2,233,560 1,908,591
Facilities Redevelopment CivicC581100 Corporate Office Furniture & Equipment 55,875 55,875 67,050 67,050 67,050 67,050 67,050 78,225 78,225C581127 Civic Facilities Improvements 2,315,109 637,609 426,167 574,275 427,259 319,944 171,717 552,296 358,096C581130 Heritage Property RestorationC581149 Accessibility Improvements 96,220 96,220 96,220 96,220 96,220 96,220 96,220 114,477 114,477Total Facilities Redevelopment Civic 2,467,204 789,704 589,437 737,545 590,529 483,214 334,987 744,998 550,798
Facilities Redevelop RecreationC582100 Seniors Centre Asset Restorations 37,873 50,498 63,123 16,557 63,123 63,123 75,747 75,747 75,747C582103 Leisure Centre Cardio/Weight 20,696 20,696 20,696 20,696 20,696 20,696 20,696 25,870 25,870C582105 Leisure Centre Upgrades 490,525 207,961 212,260 65,973 124,734 467,548 203,328C582124 Rotary Park Community Centre 36,293 71,887 131,369 34,561 29,135 8,837C582134 Memorial Arena Facility Improvements 178,754 44,460 2,049,461 187,278 172,102 67,408 170,669C582139 Nassagaweya Tennis Club and Community Hall 42,367 42,367 42,367C582145 Community Halls Facility Improvements 143,064 18,900 114,237 35,944 44,460C582147 John Tonelli Sports Centre Facility Improvements 133,115 129,637 49,578 28,701 36,394 19,133 90,774 99,775C582148 Milton Sports Centre Facility Improvements 118,361 18,685 140,291 73,173 1,162,062 1,222,532 664,185 346,389C582154 Milton Tennis Club 36,389 19,068 138,340C582160 Mattamy National Cycling Centre Improvements 1,290,125C582162 Sherwood Community Centre Facility Improvements 203,500 50,875 50,875Total Facilities Redevelop Recreation 1,122,388 563,519 2,740,601 566,114 1,734,355 1,628,129 998,111 2,165,193 759,946
Facilities Redevelop Arts/CulturalC583101 Milton Centre for the Arts Facility Improvements 72,409 204,256Total Facilities Redevelop Arts/Cultural 72,409 204,256

TOWN OF MILTON 2017 APPROVED BUDGET 2018-2026 CAPITAL BUDGET FORECAST 311
Forecast Summary by DepartmentDescription 2018
Forecast2019
Forecast2020
Forecast2021
Forecast2022
Forecast2023
Forecast2024
Forecast2025
Forecast2026
Forecast
Facilities Redevelop EngineeringC581150 Brookville Works Yard Depot Building 98,506C584105 Civic Operations Centre Facility Improvements 291,687 74,089 74,089 74,089 74,089 74,089 73,906 26,810Total Facilities Redevelop Engineering 98,506 291,687 74,089 74,089 74,089 74,089 74,089 73,906 26,810
Facilities Redevelopment FireC587111 Fire Station #1 Redevelopment 1,884,339 29,971 50,344 29,855 23,884 35,826 35,826 35,826 35,826C587114 Fire Halls Facility Improvements 15,671 29,954 299,813 15,206 37,325Total Facilities Redevelopment Fire 1,900,010 29,971 50,344 29,855 53,838 335,639 51,032 73,151 35,826
Facilities Redevelopment LibraryC588201 Beaty Branch Improvements 14,246 26,782 103,309Total Facilities Redevelopment Library 14,246 26,782 103,309
Facilities Growth CivicC591100 Town Hall Construction/Expansion 1,159,374 9,127,632 7,708,455 7,733,533C591106 Animal Shelter 2,038,580Total Facilities Growth Civic 2,038,580 1,159,374 9,127,632 7,708,455 7,733,533
Facilities Growth RecreationC592202 Community Centre Implementation Strategy 112,844C592208 Sherwood Community Centre 14,154,193C592211 Boyne Community Centre 4,935,420 22,253,822 22,349,742C592212 Indoor Soccer - Air Supported 4,108,194C592215 Seniors Centre Expansion 2,055,053Total Facilities Growth Recreation 20,430,284 4,935,420 22,253,822 22,349,742
Facilities Growth EngineeringC594105 Civic Operations Centre 868,945 3,790,880 3,721,280Total Facilities Growth Engineering 868,945 3,790,880 3,721,280
Facilities Growth FireC597401 New Fire Station - Boyne(#5) 2,647,040 295,335Total Facilities Growth Fire 2,647,040 295,335
Facilities Growth LibraryC598000 Library - New Branch Buildings 1,810,549 1,978,707 3,559,234 1,779,544C598001 Main Library Expansion 4,067,947Total Facilities Growth Library 1,810,549 1,978,707 3,559,234 1,779,544 4,067,947
Total Community Services 36,046,865 38,271,372 49,702,887 43,007,517 29,542,696 10,773,664 14,684,640 3,881,057 2,827,174
Planning & DevelopmentPlanning
C900103 Res/Non-Res Take Up/Land Needs Study 274,917C900105 Whitebelt Land Base Analysis 244,273C900110 Official Plan Review 344,709C900115 Residential Infill/Intensification Study 180,851C900119 Comprehensive ICI Study 279,886C900128 Community Improvement Area Study 180,750C900132 Zoning By-Law Review 263,606 263,606C900143 Urban Growth Centre Area Specific Plan 379,092C900148 CIP Campbellville Plan 305,250C900150 UR SP PH4 - Water & Wastewater Servicing 114,613C900151 UR SP PH4 - Functional Servicing Plan 160,909C900152 UR SP PH4 - Transportation Plan 348,638C900153 UR SP PH4 - Fisheries Compensation Plan 89,175C900154 UR SP PH4 - Secondary Plan 412,918C900156 UR SP PH4 - Parks/Recreation/Trails Master Plan 145,138C900157 UR SP PH4 - Urban Design Guidelines 104,438C900160 BP3 SP - Water & Wastewater Servicing 114,613C900161 BP3 SP - Functional Servicing Plan 160,909C900162 BP3 SP - Transportation Plan 348,638C900163 BP3 SP - Fisheries Compensation Plan 89,175C900165 BP3 SP - Secondary Plan 412,918

TOWN OF MILTON 2017 APPROVED BUDGET 2018-2026 CAPITAL BUDGET FORECAST 312
Forecast Summary by DepartmentDescription 2018
Forecast2019
Forecast2020
Forecast2021
Forecast2022
Forecast2023
Forecast2024
Forecast2025
Forecast2026
Forecast
C900167 BP3 SP - Parks/Recreation/Trails Master Plan 145,138C900168 BP3 SP - Urban Design Guidelines 104,438C900176 WhiteBelt Subwatershed Study 2,139,615C900180 BP4 SP - Water & Wastewater Servicing 114,613C900181 BP4 SP - Functional Servicing Plan 145,138C900182 BP4 SP - Transportation Plan 343,550C900183 BP4 SP - Fisheries Compensation Plan 89,175C900184 BP4 SP - Secondary Plan 423,093C900185 BP4 SP - Parks & Open Space Study 145,138C900186 BP4 SP - Urban Design Guidelines 104,438C900190 UR SP PH5 - Water & Wastewater Servicing 104,438C900191 UR SP PH5 - Functional Servicing Plan 160,909C900192 UR SP PH5 - Transportation Plan 348,638C900193 UR SP PH5 - Fisheries Compensation Plan 89,175C900194 UR SP PH5 - Secondary Plan 423,093C900195 UR SP PH5 - Parks & Open Space Study 145,138C900196 UR SP PH5 - Urban Design Guidelines 104,438Total Planning 1,556,579 263,606 684,342 1,330,447 1,125,745 2,881,807 1,380,916 1,125,745
Total Planning & Development 1,556,579 263,606 684,342 1,330,447 1,125,745 2,881,807 1,380,916 1,125,745
LibraryLibrary
C800100 Automation Replacement 41,451 80,577 75,522 108,177 69,355 75,522 92,001 70,669 76,836C800103 Collection - New 931,586 931,586 931,586 465,792 465,792C800104 Shelving - New 114,647 114,647 57,324C800111 Library Services Master Plan 45,495 45,495C800121 Collection - Replacement 348,795 355,872 378,114 401,367 416,532 449,895 484,269 506,511 516,621C800122 Expansion - Computer Equipment 30,305C800123 New Branch Computer Equipment 60,660Total Library 1,497,139 436,449 1,430,717 1,555,777 485,887 1,021,514 1,144,881 577,180 593,457
Total Library 1,497,139 436,449 1,430,717 1,555,777 485,887 1,021,514 1,144,881 577,180 593,457Total Capital Budget and Forecast 90,023,556 109,264,533 103,230,093 64,247,587 81,355,139 50,484,305 49,177,851 32,102,970 23,067,772