2017 TIP Financial Capacity Assessment Regional Summary · PDF file2017 TIP S2 - 1 June 17,...
28
2017 TIP S2 - 1 June 17, 2016 2017 TIP Financial Capacity Assessment Regional Summary Background In the San Francisco Bay Area, there are over 20 public transit agencies consisting of bus, ferry boat, light rail, heavy rail, and paratransit service providers. The seven largest transit agencies represent 92 percent of the total transit operating costs in the Bay Area and carry 95 percent of the passenger trips. The table below provides a snapshot of operating and service statistics for Bay Area transit operators Table 1. San Francisco Bay Area Transit Provider Statistics* (1,000s) Operator Service Characteristics Annual Operating Budget Annual Revenue Hours Annual Passengers AC Transit Motor Bus $335,448 1,970 55,986 BART Heavy Rail $578,422 1,932 131,957 Caltrain Heavy Rail $119,403 190 17,029 GGBHTD Bus and Ferry $109,356 650 9,689 SamTrans Motor Bus $117,001 465 13,098 SFMTA Bus, Cable Car, Light Rail $715,303 3,470 230,027 VTA Motor Bus and Light Rail $340,597 1,808 44,540 Small Operators Motor Bus, Ferry, Heavy Rail $209,542 2,030 24,835 Total $2,525,072 12,515 527,161 *FY 2013-14 data taken from the 2015 Statistical Summary of Bay Area Transit Operators The Bay Area economy has recovered from the downturn that began in Fiscal Year 2007-08 and the region’s transit systems have been adding service in order to meet public demand. The region exceeded pre-recession service levels in FY 2014-15 and while transit operators continue to add passengers and service hours, they are cautious about expanding operations too quickly given limited revenue from state and Federal sources, the susceptibility of sales tax revenues to economic swings, and an increasing needs for capital maintenance investments. During the constrained financial environment from FY 2009 to FY 2011, transit agencies carefully examined their service and opportunities to reduce costs and improve productivity, where possible. In 2010, MTC launched its Transit Sustainability Project (TSP), a two year, comprehensive effort to address long term sustainability of the region’s transit system. The TSP goals are to improve the transit operators’ financial condition, improve service to the customers and attract new riders to the transit system. In May 2012, MTC approved the TSP recommendations, including performance measures and targets, an initiative program that includes investment and incentive
Transcript of 2017 TIP Financial Capacity Assessment Regional Summary · PDF file2017 TIP S2 - 1 June 17,...

2017 TIP S2 - 1 June 17, 2016
2017 TIP Financial Capacity Assessment
Regional Summary Background In the San Francisco Bay Area, there are over 20 public transit agencies consisting of bus, ferry boat, light rail, heavy rail, and paratransit service providers. The seven largest transit agencies represent 92 percent of the total transit operating costs in the Bay Area and carry 95 percent of the passenger trips. The table below provides a snapshot of operating and service statistics for Bay Area transit operators
Table 1. San Francisco Bay Area Transit Provider Statistics* (1,000s)
Operator Service Characteristics Annual Operating
Budget
Annual Revenue
Hours Annual
Passengers AC Transit Motor Bus $335,448 1,970 55,986 BART Heavy Rail $578,422 1,932 131,957 Caltrain Heavy Rail $119,403 190 17,029 GGBHTD Bus and Ferry $109,356 650 9,689 SamTrans Motor Bus $117,001 465 13,098 SFMTA Bus, Cable Car, Light Rail $715,303 3,470 230,027 VTA Motor Bus and Light Rail $340,597 1,808 44,540 Small Operators Motor Bus, Ferry, Heavy Rail $209,542 2,030 24,835 Total $2,525,072 12,515 527,161 *FY 2013-14 data taken from the 2015 Statistical Summary of Bay Area Transit Operators
The Bay Area economy has recovered from the downturn that began in Fiscal Year 2007-08 and the region’s transit systems have been adding service in order to meet public demand. The region exceeded pre-recession service levels in FY 2014-15 and while transit operators continue to add passengers and service hours, they are cautious about expanding operations too quickly given limited revenue from state and Federal sources, the susceptibility of sales tax revenues to economic swings, and an increasing needs for capital maintenance investments. During the constrained financial environment from FY 2009 to FY 2011, transit agencies carefully examined their service and opportunities to reduce costs and improve productivity, where possible. In 2010, MTC launched its Transit Sustainability Project (TSP), a two year, comprehensive effort to address long term sustainability of the region’s transit system. The TSP goals are to improve the transit operators’ financial condition, improve service to the customers and attract new riders to the transit system. In May 2012, MTC approved the TSP recommendations, including performance measures and targets, an initiative program that includes investment and incentive

2017 TIP Financial Capacity Assessment (cont.)
2017 TIP S2 - 2 June 17, 2016
strategies for improving transit service, and additional customer-focused service, institutional, and paratransit recommendations. The seven largest operators in the region will be required to meet TSP performance goals related to cost control by FY 2018, and maintain performance standards on an annual basis. Projections – Transit Operating and Capital As part of the San Francisco Bay Area’s long range transportation plan—Plan Bay Area 2040—development effort, MTC estimated the total cost to operate and maintain existing transit services over the 24-year plan period (FY 2016-17 through FY 2039-40). While Plan Bay Area 2040 is still in development and is not expected to be adopted until 2017, much of the work associated with projecting the costs and available revenues for transit operations and capital maintenance has been completed and vetted through stakeholders and appropriate Committees. The costs and revenues provided in this Financial Capacity Assessment are the most up to date and appropriate for use. Over the next 24 years, operating and capital replacement costs for Bay Area transit providers are projected to total $169 billion. This includes $122 billion in operating costs plus $47 billion for capital replacement. With existing dedicated revenues plus discretionary revenues that will likely be directed towards transit by Plan Bay Area 2040, MTC estimates that the region will be able to fully address the operating needs for transit at current service levels as well as fund 100 percent of vehicle replacements and most other essential transit capital rehabilitation and maintenance needs over the Plan period. The projections developed for Plan Bay Area 2040 are appropriate for a long-range planning effort; however, they rely on fixed assumptions about economic factors and funding streams and do not take into account recent variations in revenue, and strategies undertaken to balance budgets in the short term. For the years covered by the 2017 TIP, MTC updated revenue projections to account for recent growth to ensure that estimates of costs and revenues reflected existing short-range budgets and strategies for ensuring the transit operators’ ability to operate and maintain their systems over the period covered by the TIP. To demonstrate the financial capacity of the Bay Area transit operators to provide on-going service at existing levels, MTC has provided annual information on operating costs and estimated revenues for each of the region’s seven largest operators, and consolidated information for the region’s small operators, who combined, make up approximately seven percent of total operating costs in the region. Based on the Plan Bay Area projections, the table below shows the consolidated rehabilitation and maintenance needs of the region’s transit operators in the table below for key project categories (vehicle replacement and fixed guideway rehabilitation/replacement).

2017 TIP Financial Capacity Assessment (cont.)
2017 TIP S2 - 3 June 17, 2016
Table 2. S.F. Bay Area Transit Capital Core Rehab/Replacement Needs (1,000 YOE$)
Category FY 2016-17 FY 2017-18 FY 2018-19 FY 2019-20 4-Year Total
Vehicles $ 637,152 $ 1,121,555 $ 968,943 $ 789,500 $ 3,517,150 Guideway Elements $ 405,184 $ 107,988 $ 98,570 $ 62,850 $ 674,591
Total $ 1,042,336 $ 1,229,543 $ 1,067,513 $ 852,350 $ 4,191,741
MTC estimates that approximately $4.2 billion in transit capital maintenance needs exist within the 2017 TIP period. This figure includes the replacement and modernization of train control systems for several of the Bay Area’s rail operators. A projection of capital revenue summarized in the Table 3 below, shows that there is approximately $4.1 billion available over the same time period. This summary does not include un-programmed regional discretionary funds that will be committed through Plan Bay Area 2040 to capital rehabilitation and or expansion projects, federal grant (non-formula), or funds from local revenue measures slated for the 2016 ballot. Of the total available, nearly half comes from non-Federal sources. The amounts included in the “Other” category consist primarily of surplus operating funding made available for capital purposes. It should be noted that a significant portion of the capital investment need identified in the previous 2015 TIP has been satisfied by a large regional investment in the Bay Area Rapid Transit (BART) car replacements; for which the region has been setting aside funds for the past several years in order to prepare for this major investment. Also provided within the individual operator assessments is a summary of each of the seven large operators’ individual capital maintenance needs for core assets, and a consolidated summary of the capital maintenance needs for the region’s smaller operators.
Table 3. TIP Financial Capacity
Assessment Transit Capital Maintenance Revenues (1,000s YOE$)
Fund Source 2017 2018 2019 2020 4-Year Total
Federal (FTA) $ 526,365 $ 504,920 $ 582,006 $ 752,292 $2,365,582 Bridge Toll $ 45,054 $ 191,869 $ 30,222 $ 32,843 $ 299,989
Local Sources $ 117,518 $ 145,485 $ 140,706 $ 143,331 $ 547,041
Other $ 81,133 $ 233,061 $ 295,723 $ 304,806 $ 914,723 Total Revenue $ 770,071 $ 1,075,335 $ 1,048,657 $ 1,233,272 $4,127,335

2017 TIP Financial Capacity Assessment (cont.)
2017 TIP S2 - 4 June 17, 2016
Conclusion Attachment A lists the major transit capital projects included in the 2017 TIP. There are approximately $1.7 billion in planned transit capital projects over the four year period. Of the total, about 36 percent of the funding is assumed to come from Federal sources. Many operators have already assumed local match requirements within their projected operating expenses. Based on the information summarized above and detailed in the following assessments, the San Francisco Bay Area transit agencies have the financial capacity to operate transit service and meet capital match requirements over the period covered by the 2017 TIP.

2017 TIP Financial Capacity Assessment (cont.)
2017 TIP S2 - 5 June 17, 2016
Regional Summary Attachment A
2017 TIP Transit Capital Projects (Note that most FTA formula funds have not yet been programmed for FY 2017 – FY 2020)
Sponsor Project Name Total Project
Cost Total TIP Cost AC Transit AC Transit: East Bay Bus Rapid Transit $181,251,242 $2,000,000 BART BART Metro Priority Track Elements $8,500,057 $5,041,000
BART: Railcar Procurement Program $2,028,072,421 $508,371,000 BART/MUNI Direct Connection Platform $3,000,000 $3,000,000 Concord Yard Wheel Truing Facility $14,000,000 $13,071,640 Daly City BART Station Intermodal Improvements $1,100,000 $550,000 Downtown Berkeley BART Plaza/Transit Area Improvements $12,963,039 $8,016,000 eBART Railroad Avenue Station $13,400,000 $11,900,000 Walnut Creek BART TOD Access Improvements $9,150,000 $9,150,000
Caltrain Caltrain Electrification $1,612,000,000 $425,727,108 Caltrain South Terminal Phase II and III $15,500,000 $14,000,000
GGBHTD ACIS Radio Communications System $21,600,048 $935,885 GGBHTD Ferry Major Components Rehab $3,375,000 $3,375,000 Larkspur Ferry Terminal Parking Garage $4,000,000 $500,000 MS Sonoma Ferry Boat Refurbishment $20,665,042 $12,333,739
SFMTA 19th Ave. & Parkmerced M-Line Realignment $80,940,000 $2,000,000 Additional Light Rail Vehicles to Expand Muni Rail $136,470,000 $2,000,000 Geneva Harney BRT Infrastructure: Eastern Segment $98,115,000 $3,000,000 Geneva Harney BRT Infrastructure: Central Segment $43,000,000 $8,785,000 Historic Streetcar Extension to Fort Mason $68,530,000 $342,912 Light Rail Vehicle Overhaul Program $67,531,300 $6,037,401 SF Muni Third St LRT Phase 2 - New Central Subway $1,578,000,000 $185,669,294 SFMTA - Replacement of 40' Motor Coaches $87,340,719 $29,788,693 SFMTA Replacement of 60' Motor Coaches $122,017,424 $29,788,693 SFMTA: Muni Forward Capital Implementation Program $172,360,000 $5,754,000 Transit Center in Hunters Point $22,000,000 $2,000,000 Van Ness Avenue Bus Rapid Transit $195,000,000 $39,790,213
VTA BART - Berryessa to San Jose Extension $3,962,300,000 $18,672,000 BART - Warm Springs to Berryessa Extension $2,521,899,512 $373,776,177 LRT Extension to Vasona Junction $176,000,000 $1,000,000 Montague Expy Ped Bridge at Milpitas BART $12,747,143 $3,127,251 VTA: Stevens Creek Bus Rapid Transit $161,506,653 $7,200,000
Total $13,454,334,600 $1,736,703,006
Note: Includes rehabilitation/maintenance and expansion projects

2017 TIP Financial Capacity Assessment (cont.)
2017 TIP S2 - 6 June 17, 2016
Alameda Contra Costa Transit District (AC Transit)
Operator Background & Budget The Alameda-Contra Costa Transit District, the third-largest public bus system in California, operates a fleet of 639 vehicles on 122 local and 34 transbay routes that serve 13 East Bay cities and adjacent unincorporated areas in Alameda and Contra Costa counties. The routes connect with nine other public and private bus systems, 21 Bay Area Rapid Transit stations, six Amtrak stations, three ferry terminals, and Oakland International Airport. East Bay Paratransit Consortium provides ADA paratransit service in the East Bay. The consortium has entered into a contract with a broker to provide the necessary paratransit services. Operating costs are split between AC Transit and BART. AC Transit’s multi-year budget projections show that operating costs generally increase at the level of inflation. Negotiated labor agreements and compensation changes implemented for non-union and contracted employees several years ago have helped to control operating costs. In 2016, AC Transit completed a Comprehensive Operations Analysis (COA) intended to maximize the efficiency and effectiveness of their transit system. The COA included a review of all transit services within a given area, assessment of route performance and current and future demand, and recommendations on how to better link trips. AC Transit’s budget projections also show that revenues are keeping pace with expenses. Farebox revenue and sales tax-based receipts show continued growth since their recovery in 2011 and are projected to grow at a modest but steady rate. Ridership numbers have reached the levels that existed prior to cuts in service in March 2010. In 2014, Alameda County voters passed Measure BB, which renewed and augmented the existing county-wide sales tax. The measure is expected to provide over $1 billion in revenue for transit operations over the duration of the measure. While most of the revenue is intended for service expansion, 15% of the total annual revenue for mass transit purposes is intended to assist with balancing the budget for existing operations. Assessment Operating AC Transit anticipates a cumulative balanced budget over the period of the 2017 TIP. A summary of the operating financial capacity assessment is provided in the table below. The local matching

2017 TIP Financial Capacity Assessment (cont.)
2017 TIP S2 - 7 June 17, 2016
funds from non-federal or state sources that are required for projects listed in the 2017 TIP have been accounted for within AC Transit’s operating costs. TIP Financial Capacity Assessment –Transit Operations & Maintenance AC Transit (1,000s, YOE$)
CATEGORIES Year 1 Year 2 Year 3 Year 4 4‐YEAR
FY 16‐17 FY 17‐18 FY 18‐19 FY 19‐20 TOTAL
Costs
Existing System 366,557 377,486 386,454 397,524 1,528,022
Planned Committed Projects
24,294 25,059 28,136 29,473 106,962
Total Operational Needs
$390,851 $402,545 $414,590 $426,997 $1,634,984
Revenue
Fares 59,139 61,209 63,351 65,568 249,267
Non‐Fare Revenue 132,856 136,773 140,815 144,985 555,429
County Sales Tax 64,070 66,312 68,633 71,035 270,050
Bridge Tolls 12,541 12,862 13,191 13,529 52,124
TDA 59,855 61,328 62,837 64,383 248,403
AB 1107 39,773 40,791 41,836 42,907 165,307
STA 28,648 31,022 33,429 35,869 128,968
Cap and Trade (LCTOP)
3,157 3,157 3,157 3,157 12,627
Federal Transit Grants 4,092 4,187 11,262 4,357 23,898
Total Revenue $404,130 $417,640 $438,510 $445,790 $1,706,070
Balance available for Carryover, Transit Capital Investment, Additional Service, or Local Match Needs
$13,279 $15,095 $23,920 $18,793 $71,087

2017 TIP Financial Capacity Assessment (cont.)
2017 TIP S2 - 8 June 17, 2016
Capital AC Transit’s projected core capital maintenance needs for the period covered by the TIP is provided in the table below. It is projected that there is sufficient funding available through the Federal program, in combination with local and state sources, to maintain the system in the existing state of repair over the TIP period. TIP Financial Capacity Assessment -- Transit Capital Needs AC Transit (1,000s, YOE$)
Operator Category FY 2016-17 FY 2017-18 FY 2018-19 FY 2019-20
AC Transit Vehicles $ 71,947 $ 36,477 $ 2,861 $ 4,542 AC Transit Total $ 71,947 $ 36,477 $ 2,861 $ 4,542

2017 TIP Financial Capacity Assessment (cont.)
2017 TIP S2 - 9 June 17, 2016
Bay Area Rapid Transit District (BART)
Operator Background & Budget BART operates rail service on four Transbay routes and one route in the East Bay. The system operates 681 rail cars on 108 miles of track and 45 stations. The West Dublin/Pleasanton infill station opened in February 2011, and the Oakland Airport Connector—an automated guideway system that links the Oakland Coliseum BART station with one of the region’s international airports—opened in 2014. Ridership is one of the key measures of BART’s success. Between FY2004 and FY2015, BART’s ridership has grown by approximately 30%, and passenger counts have gone from 307,000 to over 400,000 on an average weekday. BART’s latest SRTP was adopted in September 2014. BART estimates that operating costs will grow at an average rate of about 3% per year over the TIP period. Fare revenue is expected to grow at an average rate of approximately 3% over the TIP period due to a combination of growth in passengers and planned biennial fare increases to keep pace with inflation. BART has implemented a number of strategies to meet the goals of its 2003 Financial Stability Policy, including implementing small regular fare increases tied to CPI and surcharges tied to capital needs, increasing revenue from other sources such as parking and advertising, and maintaining a reserve of at least 5% of total annual operating expenses. BART also shifts a significant portion of its annual operating revenue to its capital budget, in anticipation of upcoming large maintenance and replacement needs. Assessment Operating BART projects sufficient revenues to cover operating expenses over each year of the 2017 TIP period. According to BART’s operating budget projections and their most recent Short Range Transit Plan, approximately $500 million in revenues is projected to be made available for capital replacement and debt service. A summary of the operating financial capacity assessment is provided in the table on the next page.

2017 TIP Financial Capacity Assessment (cont.)
2017 TIP S2 - 10 June 17, 2016
TIP Fiscal Capacity Analysis –Transit Operations & Maintenance BART (1,000s, YOE$)
CATEGORIES Year 1 Year 2 Year 3 Year 4 4‐YEAR
FY 16‐17 FY 17‐18 FY 18‐19 FY 19‐20 TOTAL
Costs
Existing System 890,495 910,977 950,867 981,238 3,733,577
Planned Committed Projects
0 13,817 14,434 14,718 42,969
Total Operational Needs $890,495 $924,794 $965,301 $995,956 $3,776,546
Revenue
Fares 505,119 525,821 547,032 569,984 2,147,956
Non‐Fare Revenue 100,015 103,157 104,746 108,461 416,379
County Sales Tax 0 0 0 0 0
Bridge Tolls 0 0 0 0 0
TDA 0 0 0 0 0
AB 1107 251,964 259,523 267,309 275,328 1,054,124
STA 24,207 27,058 29,944 32,868 114,077
Cap and Trade (LCTOP) 7,252 7,252 7,252 7,252 29,008
Federal Transit Grants 1,938 1,983 9,018 2,063 15,002
Total Revenue $890,495 $924,794 $965,301 $995,956 $3,776,546
Balance available for Carryover, Transit Capital Investment, Additional Service, or Local Match Needs
$0 $0 $0 $0 $0
Capital BART’s capital program in the 2017 TIP consists primarily of contribution towards the rail-car replacement program and the eBART, and Warm Spring extension projects. BART’s projected core capital maintenance needs for the period covered by the TIP are provided in the table below. It is projected that there is sufficient funding available through the Federal program, in combination with local and state sources, to maintain the system in its current state of repair.

2017 TIP Financial Capacity Assessment (cont.)
2017 TIP S2 - 11 June 17, 2016
TIP Financial Capacity Assessment -- Transit Capital Needs BART (1,000s, YOE$)
Operator Category FY 2016-17 FY 2017-18 FY 2018-19 FY 2019-20
BART Guideway Elements $ 234,693 $ 43,241 $ 35,942 $ 2,918
Vehicles $ 171,083 $ 482,918 $ 429,630 $ 458,896 BART Total $ 405,775 $ 526,159 $ 465,573 $ 461,814

2017 TIP Financial Capacity Assessment (cont.)
2017 TIP S2 - 12 June 17, 2016
Peninsula Corridor Joint Powers Board (Caltrain)
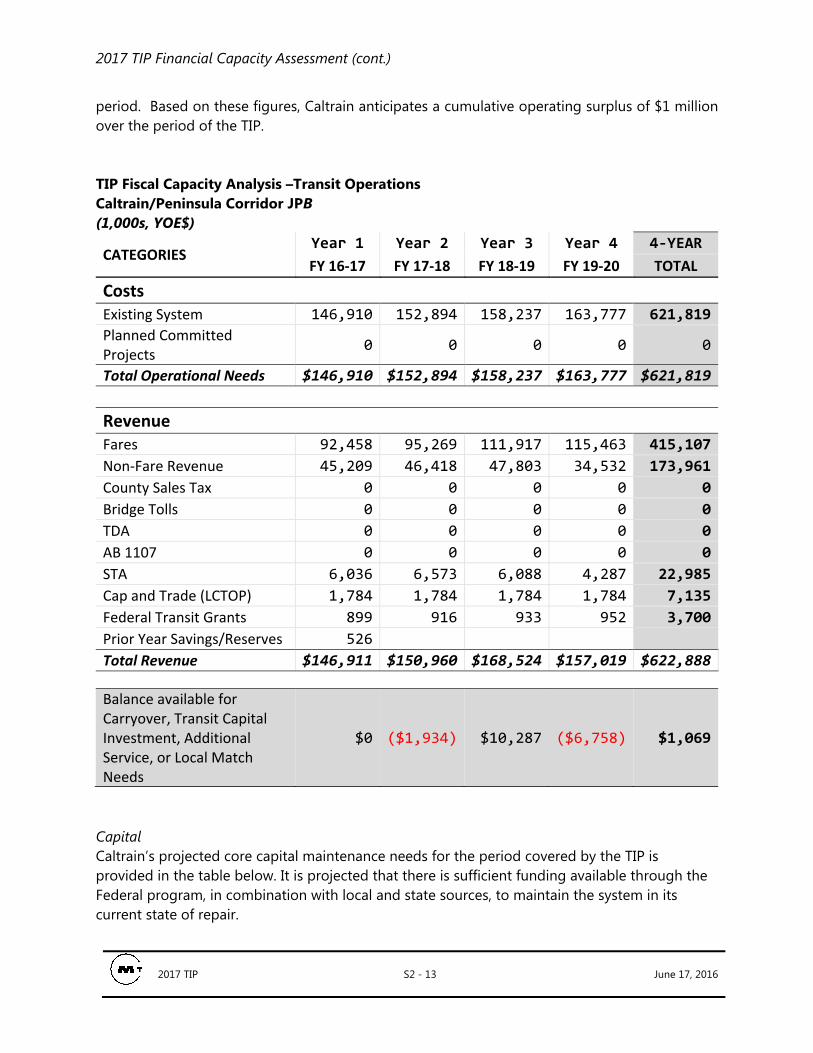
Operator Background & Budget The Peninsula Corridor Joint Powers Board (JPB) — consisting of representatives from San Francisco, San Mateo, and Santa Clara counties — operates Caltrain, which provides commuter rail service between San Francisco and San Jose with additional service to Gilroy in southern Santa Clara County. Under contract with TransitAmerica Services Inc., the system currently operates 123 heavy rail vehicles and 29 locomotives. Caltrain also provides 28 feeder shuttles to transport passengers to and from its stations. Ridership on Caltrain is at a historic level and fare revenues account for over 50% of Caltrain’s operating revenue. Existing revenues are sufficient to meet projected operating expenses over the four year period of the TIP, however, some balancing of costs and revenues will be required to avoid single-year deficits. Caltrain does not have a dedicated source of operating revenue similar to most operators that receive sales-tax based revenue and subsidies. The agency relies on JPB member contributions to fund a significant portion of their operating costs. A possible long term revenue solution for Caltrain is a future sales tax measure in Santa Clara County that would provide a new source of funding. An initiative is expected to be on the ballot in November, 2016. In addition to finding new revenue solutions, a key strategy for improving Caltrain’s efficiency and gaining additional passengers is to modernize the system. Electrification of the system between San Francisco and San Jose will improve Caltrain’s limited capacity to run additional trains and carry more passengers, thereby improving fare revenue. On March 28, 2012, MTC approved an agreement and established a funding framework among MTC, the California High Speed Rail Authority, the JPB, the SFCTA, the SMCTA, VTA, the City of San Jose, the City and County of San Francisco, and the TJPA, for a High Speed Rail Early Investment Strategy that includes electrification. Electrification is expected to be completed by 2020. Assessment Operating A summary of the operating financial capacity assessment is provided in the table below. Operational needs are growing at an average rate of 2.8% over the years contained in the TIP. Projected revenues are expected to increase by approximately 1.7% annually over the same time
2017 TIP Financial Capacity Assessment (cont.)
2017 TIP S2 - 13 June 17, 2016
period. Based on these figures, Caltrain anticipates a cumulative operating surplus of $1 million over the period of the TIP. TIP Fiscal Capacity Analysis –Transit Operations Caltrain/Peninsula Corridor JPB (1,000s, YOE$)
CATEGORIES Year 1 Year 2 Year 3 Year 4 4‐YEAR
FY 16‐17 FY 17‐18 FY 18‐19 FY 19‐20 TOTAL
Costs
Existing System 146,910 152,894 158,237 163,777 621,819
Planned Committed Projects
0 0 0 0 0
Total Operational Needs $146,910 $152,894 $158,237 $163,777 $621,819
Revenue
Fares 92,458 95,269 111,917 115,463 415,107
Non‐Fare Revenue 45,209 46,418 47,803 34,532 173,961
County Sales Tax 0 0 0 0 0
Bridge Tolls 0 0 0 0 0
TDA 0 0 0 0 0
AB 1107 0 0 0 0 0
STA 6,036 6,573 6,088 4,287 22,985
Cap and Trade (LCTOP) 1,784 1,784 1,784 1,784 7,135
Federal Transit Grants 899 916 933 952 3,700
Prior Year Savings/Reserves 526
Total Revenue $146,911 $150,960 $168,524 $157,019 $622,888
Balance available for Carryover, Transit Capital Investment, Additional Service, or Local Match Needs
$0 ($1,934) $10,287 ($6,758) $1,069
Capital Caltrain’s projected core capital maintenance needs for the period covered by the TIP is provided in the table below. It is projected that there is sufficient funding available through the Federal program, in combination with local and state sources, to maintain the system in its current state of repair.

2017 TIP Financial Capacity Assessment (cont.)
2017 TIP S2 - 14 June 17, 2016
TIP Financial Capacity Assessment -- Transit Capital Needs Caltrain/Peninsula Corridor JPB (1,000s, YOE$)
Operator Category FY 2016-17 FY 2017-18 FY 2018-19 FY 2019-20
Caltrain Guideway Elements $ 117,341 $ 19,887 $ 19,768 $ 17,073
Vehicles $ 84,467 $ 53,755 $ 47,632 $ 208,652 Caltrain Total $ 201,809 $ 73,642 $ 67,400 $ 225,725

2017 TIP Financial Capacity Assessment (cont.)
2017 TIP S2 - 15 June 17, 2016
Golden Gate Bridge Highway and Transit District (GGBHTD)
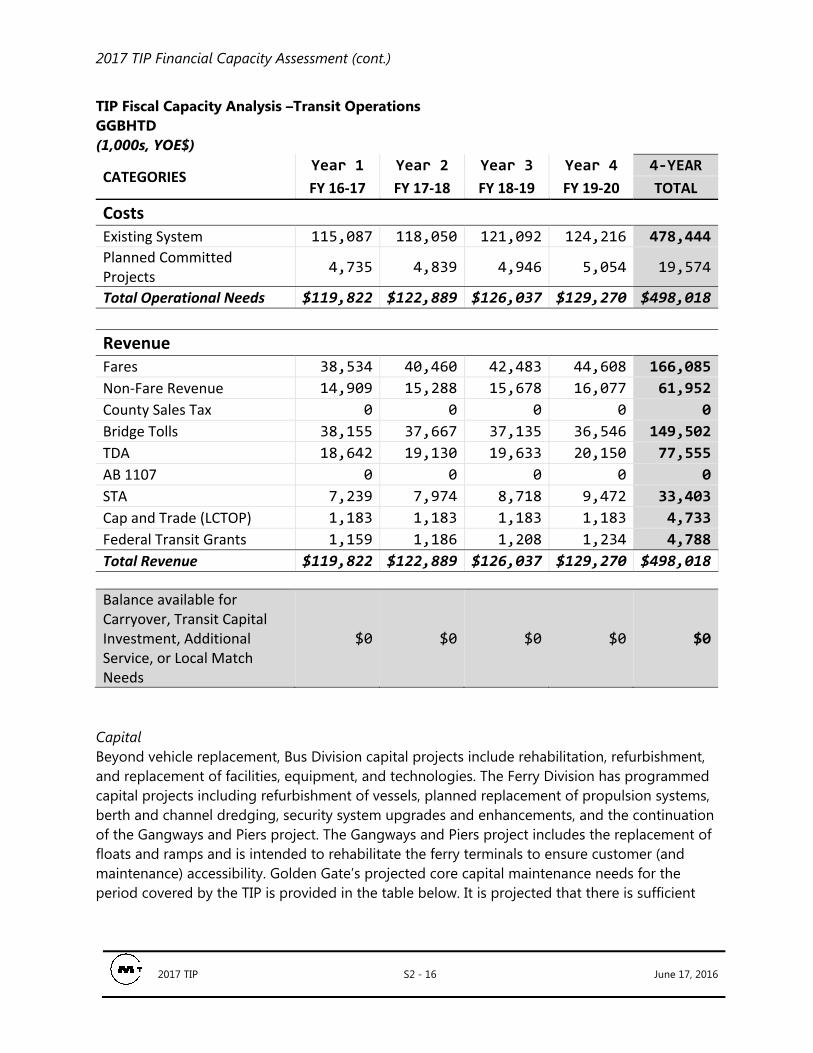
Operator Background & Budget The Golden Gate Bridge, Highway and Transportation District (GGBHTD) is a special district of the State of California that operates and maintains the Golden Gate Bridge and provides transit service between and within Marin, Sonoma and San Francisco Counties. GGBHTD operates two primary transit services: Golden Gate Transit and Golden Gate Ferry. Currently, their fleet of transit vehicles consists of seven ferry boats and 176 buses. Golden Gate Transit bus services include regional and local routes; regional routes are controlled and operated by GGBHTD, and local routes are operated by GGBHTD under contract with Marin Transit. GGBHTD sets fare policy and service levels for regional service, and Marin Transit sets fare policy and determines service levels for all service that begins and ends within Marin County. Golden Gate Transit has sufficient revenues to meet operating needs within the four years included in the 2017 TIP. Operating costs are projected to grow at approximately 2% annually, and fares are projected to increase by 4% annually over the same time period. Golden Gate Transit continues to receive toll-revenue subsidies in order to meet operating expenses. Historically, approximately 40% of the annual cost of operating Golden Gate Transit was subsidized by tolls collected on the Golden Gate Bridge. GGBHTD has developed three strategic plans aimed at ensuring the near- and long-term sustainability of each operating division. The Strategic Vision for Golden Gate Transit Regional Bus Service was developed in late 2013 and includes a plan for more effectively using available resources, expanding service where warranted, restructuring or eliminating inefficient service, and retaining and attracting new riders in both existing and emerging travel markets. Assessment Operating A summary of the operating financial capacity assessment for Golden Gate is provided in the table below. Golden Gate anticipates balanced budget for each year included in the 2017 TIP.
2017 TIP Financial Capacity Assessment (cont.)
2017 TIP S2 - 16 June 17, 2016
TIP Fiscal Capacity Analysis –Transit Operations GGBHTD (1,000s, YOE$)
CATEGORIES Year 1 Year 2 Year 3 Year 4 4‐YEAR
FY 16‐17 FY 17‐18 FY 18‐19 FY 19‐20 TOTAL
Costs
Existing System 115,087 118,050 121,092 124,216 478,444
Planned Committed Projects
4,735 4,839 4,946 5,054 19,574
Total Operational Needs $119,822 $122,889 $126,037 $129,270 $498,018
Revenue
Fares 38,534 40,460 42,483 44,608 166,085
Non‐Fare Revenue 14,909 15,288 15,678 16,077 61,952
County Sales Tax 0 0 0 0 0
Bridge Tolls 38,155 37,667 37,135 36,546 149,502
TDA 18,642 19,130 19,633 20,150 77,555
AB 1107 0 0 0 0 0
STA 7,239 7,974 8,718 9,472 33,403
Cap and Trade (LCTOP) 1,183 1,183 1,183 1,183 4,733
Federal Transit Grants 1,159 1,186 1,208 1,234 4,788
Total Revenue $119,822 $122,889 $126,037 $129,270 $498,018
Balance available for Carryover, Transit Capital Investment, Additional Service, or Local Match Needs
$0 $0 $0 $0 $0
Capital Beyond vehicle replacement, Bus Division capital projects include rehabilitation, refurbishment, and replacement of facilities, equipment, and technologies. The Ferry Division has programmed capital projects including refurbishment of vessels, planned replacement of propulsion systems, berth and channel dredging, security system upgrades and enhancements, and the continuation of the Gangways and Piers project. The Gangways and Piers project includes the replacement of floats and ramps and is intended to rehabilitate the ferry terminals to ensure customer (and maintenance) accessibility. Golden Gate’s projected core capital maintenance needs for the period covered by the TIP is provided in the table below. It is projected that there is sufficient

2017 TIP Financial Capacity Assessment (cont.)
2017 TIP S2 - 17 June 17, 2016
funding available through the Federal program, in combination with local and state sources, to maintain the system in its current state of repair. TIP Financial Capacity Assessment -- Transit Capital Needs GGBHTD (1,000s, YOE$)
Operator Category FY 2016-17 FY 2017-18 FY 2018-19 FY 2019-20
GGBHTD Guideway Elements $ 8,185 $ 304 $ 304 $ 304
Vehicles $ 21,073 $ 50,565 $ 1,702 $ 2,272
GGBHTD Total $ 21,073 $ 50,565 $ 1,702 $ 2,272

2017 TIP Financial Capacity Assessment (cont.)
2017 TIP S2 - 18 June 17, 2016
San Francisco Municipal Transit Agency (SFMTA)
Operator Background & Budget San Francisco Municipal Transportation Agency (SFMTA) operates 77 transit lines over an approximately 47-square-mile service area. The SFMTA currently runs transit service 24 hours a day, seven days a week, providing over 700,000 transit trips each weekday on its fleet of cable cars, streetcars, motor coaches, trolley coaches, and light rail vehicles, and carried an estimated 234 million passengers in FY 2015. SFMTA carries approximately 44% of the total passenger transit trips within the region.
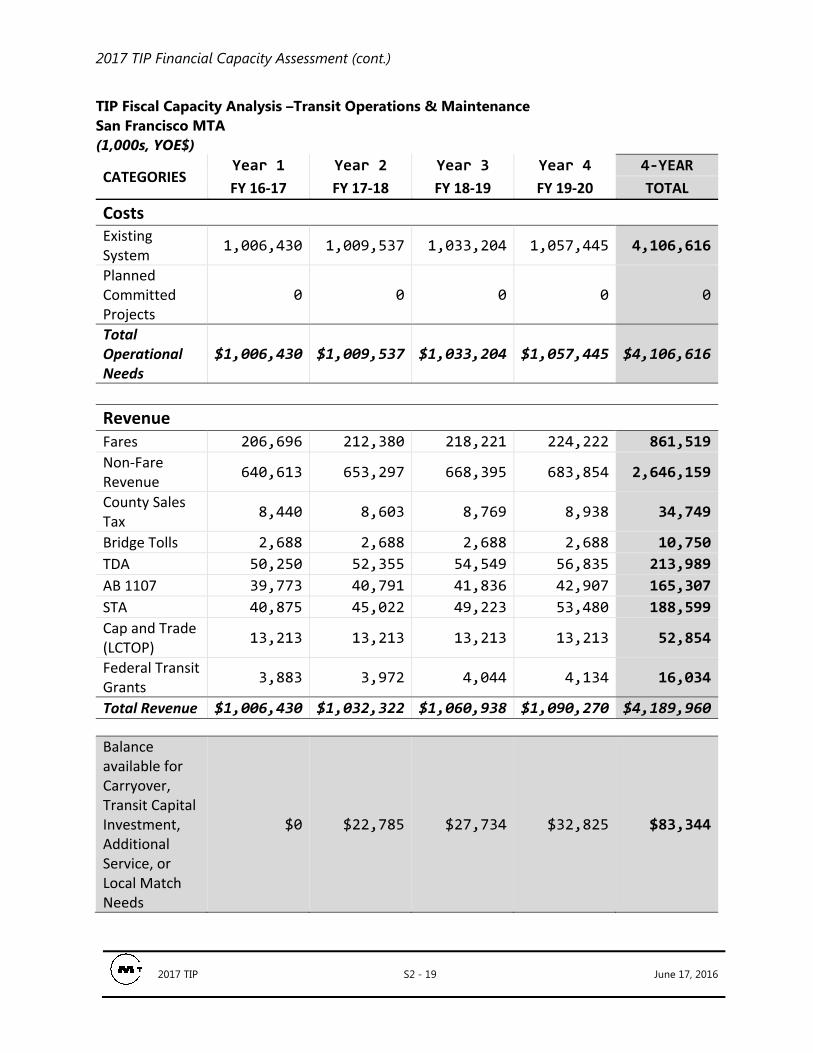
SFMTA’s Muni Forward operations plan has as its objectives to improve customer service, communications, and transit performance on its fixed route service. In January 2015, SFMTA’s Board of Directors approved a three percent increase in transit service in FY 2015 and a seven percent increase in FY 2016. An additional two percent service increase is proposed for FY 2017 or FY 2018. This significant increase in service results in an operations budget that is expected to top $1 billion annually, over the 2017 TIP period. To support operations the City of San Francisco contributes close to $500 million of general fund, parking, and development fee revenues. Farebox revenues provide for approximately 20% of SFMTA’s annual operating budget. San Francisco is also contemplating an initiative for the November 2016 ballot that could raise over $7 billion over the course of the measure. A significant portion of the revenue generated from the measure would be used for transit operating and capital needs. Assessment Operating SFMTA projects sufficient revenues to cover operating expenses over each year of the 2017 TIP period. Approximately $82 million in revenue is projected to be made available for capital expenditures. A summary of the operating financial capacity assessment is provided in the table below.
2017 TIP Financial Capacity Assessment (cont.)
2017 TIP S2 - 19 June 17, 2016
TIP Fiscal Capacity Analysis –Transit Operations & Maintenance San Francisco MTA (1,000s, YOE$)
CATEGORIES Year 1 Year 2 Year 3 Year 4 4‐YEAR
FY 16‐17 FY 17‐18 FY 18‐19 FY 19‐20 TOTAL
Costs
Existing System
1,006,430 1,009,537 1,033,204 1,057,445 4,106,616
Planned Committed Projects
0 0 0 0 0
Total Operational Needs
$1,006,430 $1,009,537 $1,033,204 $1,057,445 $4,106,616
Revenue
Fares 206,696 212,380 218,221 224,222 861,519
Non‐Fare Revenue
640,613 653,297 668,395 683,854 2,646,159
County Sales Tax
8,440 8,603 8,769 8,938 34,749
Bridge Tolls 2,688 2,688 2,688 2,688 10,750
TDA 50,250 52,355 54,549 56,835 213,989
AB 1107 39,773 40,791 41,836 42,907 165,307
STA 40,875 45,022 49,223 53,480 188,599
Cap and Trade (LCTOP)
13,213 13,213 13,213 13,213 52,854
Federal Transit Grants
3,883 3,972 4,044 4,134 16,034
Total Revenue $1,006,430 $1,032,322 $1,060,938 $1,090,270 $4,189,960
Balance available for Carryover, Transit Capital Investment, Additional Service, or Local Match Needs
$0 $22,785 $27,734 $32,825 $83,344

2017 TIP Financial Capacity Assessment (cont.)
2017 TIP S2 - 20 June 17, 2016
Capital SFMTA’s capital program in the 2017 TIP is focused on strategic expansions of its light rail service and bus rapid transit routes as well as capital asset rehabilitation and replacement project. SFMTA’s projected core capital maintenance needs for the period covered by the TIP is provided in the table below. It is projected that there is sufficient funding available through the Federal program, in combination with local and state sources, to maintain the system in its current state of repair. TIP Financial Capacity Assessment -- Transit Capital Needs San Francisco MTA (1,000s, YOE$)
Operator Category FY 2016-17 FY 2017-18 FY 2018-19 FY 2019-20
SFMTA Guideway Elements $ 34,026 $ 34,026 $ 34,026 $ 34,026
Vehicles $ 133,266 $ 152,036 $ 387,107 $ 32,935 SFMTA Total $ 167,292 $ 186,062 $ 421,133 $ 66,961

2017 TIP Financial Capacity Assessment (cont.)
2017 TIP S2 - 21 June 17, 2016
San Mateo County Transit District (SamTrans)
Operator Background & Budget SamTrans operates fixed-route bus service and contracts with MV Transit for operation of some routes. SamTrans has a total fleet of 305 buses, providing more than 13.5 million annual trips in San Mateo County in FY2015. SamTrans also owns a fleet of 90 demand-response vehicles that provide SamTrans’ ADA-compliant paratransit service. SamTrans is one of the three members of the JPB and additionally is the managing agency for Caltrain. The other two member agencies are the City and County of San Francisco and the Santa Clara Valley Transportation Authority. SamTrans is also responsible for the operation of Caltrain and the three agencies together are responsible for funding its operations. Since 2003, SamTrans has committed to fund a portion of the capital and operating costs associated with the extension of BART service into San Mateo County. As seen in the table below, SamTrans’ budget is balanced in the four years covered by the TIP; however, the agency has acknowledged a structural deficit that could impact service in the future should revenue sources dip as a result of an economy, or should costs grow in excess of the 2% assumed in their financial forecast. Samtrans’ 2015-19 Strategic Plan – provides a blueprint for the District that shapes the agency’s direction for the next five years. The Strategic Plan includes initiatives to implement cost saving and service improvements.. Stated goals of the Plan include the investment of resources where they will have the maximum benefit to customers and to increase efficiency and effectiveness of SamTrans service. Assessment Operating SamTrans projects a balanced budget over each year of the 2017 TIP period. A summary of the operating financial capacity assessment is provided in the table below. The local matching funds from non-federal or state sources that are required for projects listed in the 2017 TIP have been accounted for within SamTrans’ operating costs.

2017 TIP Financial Capacity Assessment (cont.)
2017 TIP S2 - 22 June 17, 2016
TIP Fiscal Capacity Analysis –Transit Operations SamTrans (1,000s, YOE$)
CATEGORIES Year 1 Year 2 Year 3 Year 4 4‐YEAR
FY 16‐17 FY 17‐18 FY 18‐19 FY 19‐20 TOTAL
Costs
Existing System 156,294 161,195 166,278 169,301 653,068
Planned Committed Projects
0 0 0 0 0
Total Operational Needs $156,294 $161,195 $166,278 $169,301 $653,068
Revenue
Fares 20,988 21,596 23,445 24,914 90,943
Non‐Fare Revenue 7,526 7,601 7,677 7,754 30,558
County Sales Tax 83,000 85,075 87,202 89,382 344,659
Bridge Tolls 306 306 306 306 1,224
TDA 39,411 40,526 41,673 42,852 164,462
AB 1107 0 0 0 0 0
STA 4,066 4,560 5,060 5,567 19,253
Cap & Trade (LCTOP) 1,300 1,300 1,300 1,300 5,200
Federal Transit Grants 1,032 1,056 1,075 1,099 4,263
Total Revenue $157,629 $162,020 $167,738 $173,174 $660,561
Balance available for Carryover, Transit Capital Investment, Additional Service, or Local Match Needs
$1,334 $825 $1,461 $3,873 $7,493
Capital Funding for SamTrans’ bus and ADA-related capital replacement projects is from federal sources included in the TIP. The balance of SamTrans’ capital program (for matching funds and for locally funded projects) is available from county sales-tax generations and reserves. SamTrans’ projected core capital maintenance needs for the period covered by the TIP is provided in the table below. It is projected that there is sufficient funding available through the Federal program, in combination with local and state sources, to maintain the system in its current state of repair.

2017 TIP Financial Capacity Assessment (cont.)
2017 TIP S2 - 23 June 17, 2016
TIP Financial Capacity Assessment -- Transit Capital Needs SamTrans (1,000s, YOE$)
Operator Category FY 2016-17 FY 2017-18 FY 2018-19 FY 2019-20
Sam Trans Vehicles $ 43,445 $ 10,069 $ 8,676 $ 8,676 Sam Trans Total $ 43,445 $ 10,069 $ 8,676 $ 8,676

2017 TIP Financial Capacity Assessment (cont.)
2017 TIP S2 - 24 June 17, 2016
Santa Clara Valley Transportation Authority (VTA)
Operator Background & Budget VTA operates 495 motor bus coaches and 99 light rail vehicles on 80 routes throughout an urbanized area of 326 square miles. 18 core bus routes, including two Bus Rapid Transit routes, form the backbone of the system. 19 local bus routes and 18 Community Bus feed into the rest of the transit system; VTA’s shuttle routes connect light rail and Caltrain stations with industrial areas and San José State University. 18 Express bus routes offer weekday commuter service. VTA operates three light-rail transit lines that total 42 miles in length, serving 62 stations. Together, these services served about 44 million passengers in FY2015. Although VTA bus and light-rail services are accessible to individuals with disabilities, a separate ADA paratransit service provides over 720,000 trips each year for people in the county who cannot use conventional transit. VTA is a member of the Peninsula Corridor Joint Powers Board. VTA also contracts with the Altamont Commuter Express (ACE) for service. Each provides commuter rail service to Santa Clara County from adjacent counties, and shuttle vans from their stations to destinations within Santa Clara County. VTA belongs to the Highway 17 Express and Dumbarton Express consortium that provide express bus service into Santa Clara County from other adjacent counties. In 2000, Santa Clara County voters approved Measure A, a thirty-year sales tax to fund transit operations and capital expansion. In 2008 Santa Clara County voters also approved an additional 1/8th cent sales tax to support operation of the BART extension. Another ½ cent county-wide measure is planned for the 2016 ballot. If successful, the initiative could raise over $11 billion over the course of the measure. A significant portion of the revenue would be devoted to VTA’s transit operations and capital needs. VTA has sufficient revenues to meet operating needs within the four years included in the 2015 TIP. Operating costs are projected to grow at an average of about three percent per year over the four year period. Fare revenues are also projected to grow at about seven percent per year on average. Assessment Operating VTA projects sufficient revenues to cover operating expenses over each year of the 2017 TIP period. Approximately $141 million in revenues is projected to be made available for capital

2017 TIP Financial Capacity Assessment (cont.)
2017 TIP S2 - 25 June 17, 2016
expenditures. A summary of the operating financial capacity assessment is provided in the table below. TIP Fiscal Capacity Analysis –Transit Operations & Maintenance Santa Clara VTA (1,000s, YOE$)
CATEGORIES Year 1 Year 2 Year 3 Year 4 4‐YEAR
FY 16‐17 FY 17‐18 FY 18‐19 FY 19‐20 TOTAL
Costs
Existing System 423,647 440,027 458,295 479,012 1,800,980
Planned Committed Projects
0 0 0 0 0
Total Operational Needs $423,647 $440,027 $458,295 $479,012 $1,800,980
Revenue
Fares 41,599 50,344 52,139 56,476 200,558
Non‐Fare Revenue 19,352 10,428 10,241 10,241 50,262
County Sales Tax 272,103 283,063 291,527 299,711 1,146,404
Bridge Tolls 0 0 0 0 0
TDA 105,846 109,519 113,320 117,252 445,937
AB 1107 0 0 0 0 0
STA 14,854 16,361 17,887 19,434 68,536
Transfers 0 0 0 0 0
Cap and Trade (LCTOP) 3,983 3,983 3,983 3,983 15,931
Federal Transit Grants 3,448 3,528 3,592 3,671 14,239
Total Revenue $461,185 $477,226 $492,688 $510,769 $1,941,868
Balance available for Carryover, Transit Capital Investment, Additional Service, or Local Match Needs
$37,539 $37,199 $34,393 $31,757 $140,887
Capital VTA’s projected core capital maintenance needs for the period covered by the TIP is provided in the table below. It is projected that there is sufficient funding available through the Federal program, in combination with local and state sources, to maintain the system in the existing state of repair over the TIP period.

2017 TIP Financial Capacity Assessment (cont.)
2017 TIP S2 - 26 June 17, 2016
TIP Financial Capacity Assessment -- Transit Capital Needs Santa Clara VTA (1,000s, YOE$)
Operator Category FY 2016-17 FY 2017-18 FY 2018-19 FY 2019-20
VTA Guideway Elements $ 8,529 $ 8,529 $ 8,529 $ 8,529
Vehicles $ 35,618 $ 198,893 $ 48,360 $ 35,618
VTA Total $ 44,147 $ 207,422 $ 56,889 $ 44,147

2017 TIP Financial Capacity Assessment (cont.)
2017 TIP S2 - 27 June 17, 2016
San Francisco Bay Area Small Operators Collectively, the San Francisco Bay Area’s 17 smaller transit operators account for only eight percent of the total transit operating costs in the region and only about four percent of fixed route transit passengers in the region. Assessment Operating The financial capacity assessment for the seventeen San Francisco Bay Area small operators, combined, is shown in the table below. In total, the small operators have sufficient funds to operate at existing service levels over the period of the 2017 TIP. 2015 TIP Fiscal Capacity Analysis –Transit Operations & Maintenance San Francisco Bay Area Small Operators (1,000s, YOE$)
CATEGORIES Year 1 Year 2 Year 3 Year 4 4‐YEAR
FY 16‐17 FY 17‐18 FY 18‐19 FY 19‐20 TOTAL
Costs
Existing System 253,298 260,407 265,936 271,620 1,051,262
Planned Committed Projects
22,878 30,750 34,147 35,461 123,237
Total Operational Needs $276,177 $291,157 $300,083 $307,081 $1,174,499
Revenue
Fares 54,464 57,000 59,607 61,210 232,282
Non‐Fare Revenue 31,928 33,806 35,381 35,998 137,113
County Sales Tax 66,966 69,246 70,173 71,804 278,190
Bridge Tolls 6,883 7,546 7,903 7,903 30,234
TDA 100,547 102,464 104,419 106,414 413,844
AB 1107 0 0 0 0 0
STA 13,519 14,464 16,455 19,779 64,217
Transfers 7,014 7,168 7,326 7,487 28,995
Cap and Trade (LCTOP) 1,461 1,461 1,461 1,461 5,844
Federal Transit Grants 5,149 5,272 5,388 5,488 21,297
Total Revenue $280,917 $291,259 $300,787 $310,057 $1,183,020

2017 TIP Financial Capacity Assessment (cont.)
2017 TIP S2 - 28 June 17, 2016
Balance available for Carryover, Transit Capital Investment, Additional Service, or Local Match Needs
$4,741 $102 $703 $2,976 $8,521
Capital The capital maintenance needs for the combined San Francisco Bay Area small operators is shown in the table below. It is projected that there is sufficient funding available through the Federal program, in combination with local and state sources, to maintain the system in the existing state of repair over the TIP period. TIP Financial Capacity Assessment -- Transit Capital Needs San Francisco Bay Area Small Operators (1,000s, YOE$)
Operator Category FY 2016-17 FY 2017-18 FY 2018-19 FY 2019-20
Small Operators Guideway Elements* $ 2,409 $ 2,000 $ 0 $ 0
Vehicles $ 247,336 $ 136,842 $ 42,974 $ 37,909 Small Operators Total $ 249,745 $ 138,843 $ 42,975 $ 270,327
*Guideway element needs are attributable to the Water Emergency Transportation Authority (WETA)