2017 Tabreed presentation v2 - Brand...
37
NATIONAL CENTRAL COOLING COMPANY (PJSC) Investor Presentation National Central Cooling Company PJSC (DFM:TABR)
-
Upload
truongquynh -
Category
Documents
-
view
214 -
download
0
Transcript of 2017 Tabreed presentation v2 - Brand...

NATIONAL CENTRAL COOLING COMPANY (PJSC)
Investor PresentationNational Central Cooling Company PJSC (DFM:TABR)
Tabreed – 2017 Investor Presentation2
• These materials have been prepared by and are the sole responsibility of theNational Central Cooling Company PJSC, ‘Tabreed’ (the “Company”). Thesematerials have been prepared solely for your information and for use at thecall/presentation. By attending the meeting/call where this presentation ismade, or by reading the presentation slides, you agree to be bound by thefollowing limitations
• These materials are confidential and may not be further distributed orpassed on to any other person or published or reproduced, in whole or inpart, by any medium or in any form for any purpose. The distribution ofthese materials in other jurisdictions may be restricted by law, and personsinto whose possession this presentation comes should inform themselvesabout, and observe, any such restrictions
• These materials are for information purposes only and do not constitute aprospectus, offering memorandum or offering circularor an offer to sell any securities and are not intended to providethe basis for any credit or any third party evaluation of any securities or anyoffering of them and should not be consideredas a recommendation that any investor should subscribe for or purchase anysecurities. The information contained herein has not been verified by theCompany, its advisers or any other personand is subject to change without notice and past performance isnot indicative of future results. The Company is under no obligation toupdate or keep current the information contained herein
• No person shall have any right of action (except in case of fraud) against theCompany or any other person in relation to the accuracy or completeness ofthe information contained herein. Whilst the Company has taken allreasonable steps to ensure the accuracy of all information, the Companycannot accept liability for any inaccuracies or omissions. All the informationis provided on an “as is” basis and without warranties, representations orconditions of any kind, either express or implied, and as such warranties,representation and conditions are hereby excluded to the maximum extentpermitted by law
• The merits or suitability of any securities to any investor's particular situation should
be independently determined by such investor. Any such determination should
involve inter alia, an assessment of the legal, tax, accounting, regulatory, financial,
credit and other related aspects of any securities
• No person is authorized to give any information or to make any representation not
contained in and not consistent with these materials and, if given or made, such
information or representation must not be relied upon as having been authorized by
or on behalf of the Company
• These materials are not intended for publication or distribution to, or use by any
person or entity in any jurisdiction or country where such distribution or use would be
contrary to local law or regulation. The securities discussed in this presentation have
not been and will not be registered under the U.S. Securities Act of 1933, as amended
(the Securities Act) and may not be offered or sold except under
an exemption from, or transaction not subject to, the registration requirements of the
Securities Act. In particular, these materials are not intended for publication or
distribution, except to certain persons in offshore transactions outside the United
States in reliance on Regulation S under the Securities Act
• These materials contain information regarding the past performance of the Company
and its subsidiaries. Such performance may not be representative of the entire
performance of the Company and its subsidiaries. Past performance is neither a guide
to future returns nor to the future performance of the Company and its subsidiaries
• These materials contain, or may be deemed to contain, forward-looking statements.
By their nature, forward- looking statements involve risks and uncertainties because
they relate to events and depend on circumstances that may or may not occur in the
future. The future results of the Company may vary from the results expressed in, or
implied by, the following forward looking statements, possibly to a material degree.
Any investment in securities is subject to various risks, such risks should be carefully
considered by prospective investors before they make any investment decisions. The
directors disclaim any obligation to update their view of such risks and uncertainties
or to publicly announce the result of any revision to the forward-looking statements
made herein, except where it would be required to do so under applicable law
Disclaimer

Index
A | Overview of Tabreed
B | Business overview
D | Board of Directors and Management Team
C | Financial Performance
E | Capital Structure
F | Conclusion

Tabreed – 2017 Investor Presentation4
A GCC wide environment-friendly company delivering shareholder returnsTabreed is ..
• A provider of a part of GCC’s critical infrastructure
• Delivering and operating district cooling solutions with high reliability
• Creating sustainable value for our shareholders
• Providing uninterrupted service to our customers and maintaining the comfort of the communities we serve
We aim to be the partner of choice for Governments and Corporations across GCC in providing environmentally friendly
cooling solutions
EFFICIENT AND ENVIRONMENT FRIENDLY EFFICIENT AND ENVIRONMENT FRIENDLY EFFICIENT AND ENVIRONMENT FRIENDLY EFFICIENT AND ENVIRONMENT FRIENDLY
OPERATIONSOPERATIONSOPERATIONSOPERATIONS
We harness the most efficient technology and utilize
our extensive experience to deliver reliable and energy
efficient cooling solutions that are environmentally
friendly
SUSTAINABLE LONGSUSTAINABLE LONGSUSTAINABLE LONGSUSTAINABLE LONG----TERM SHAREHOLDER TERM SHAREHOLDER TERM SHAREHOLDER TERM SHAREHOLDER
RETURNSRETURNSRETURNSRETURNS
We generate sustainable long-term returns for our
stakeholders on the back of the utility infrastructure
business model
REGIONAL LEADERREGIONAL LEADERREGIONAL LEADERREGIONAL LEADER
As the region's preferred provider of cooling solutions,
we focus on our customers' needs and deliver
comfort, value and service to all the communities we
serve

Tabreed – 2017 Investor Presentation5
District Cooling Benefits
Overall cooling represents 70% of peak
energy consumption…
District Cooling (DC) is 50% more energy
efficient than Conventional Cooling (CC)…
DC has ~16% lower life cycle cost
than CC
KW
h/R
Th
Other
District Cooling
Conventional Cooling
Industry
Variable
Capex
Charged
Monthly
Paid
Upfront
13%
63%
7%
17%
70%
District Cooling leads to substantial energy, economic and environmental benefits
-50%
District coolingConventional
cooling
49 45
51
39
Conventional
cooling
District
cooling
-16%
A cooling plant supplies chilled water via an
underground piping network to more than one
building in a service area (or district)
What is District Cooling

Tabreed – 2017 Investor Presentation6
Tabreed at a glance
Environmentally responsible operations reducing green house gas emissions
annual reduction in energy consumption in
the GCC through Tabreed’s DC services in
2016
Enough energy to power
Serving iconic projects across the region
48,000homes in the UAE every year
=
1.4billion kWh 713,000 tons
annual elimination of CO2
emissions
=The equivalent of removing
143,000cars from our streets every year
Dubai
MetroClevelandClinic
Abu Dhabi
The Pearl
QatarJabal Omar
Project
Sheikh Zayed
Grand Mosque
Over
1m RT delivered to clients
One of the world’s largest district cooling companies
71plants in
5 countries
Equivalent to cooling
towers the size of
Burj Khalifa100
Dubai Parks
and Resorts
Tabreed – 2017 Investor Presentation7
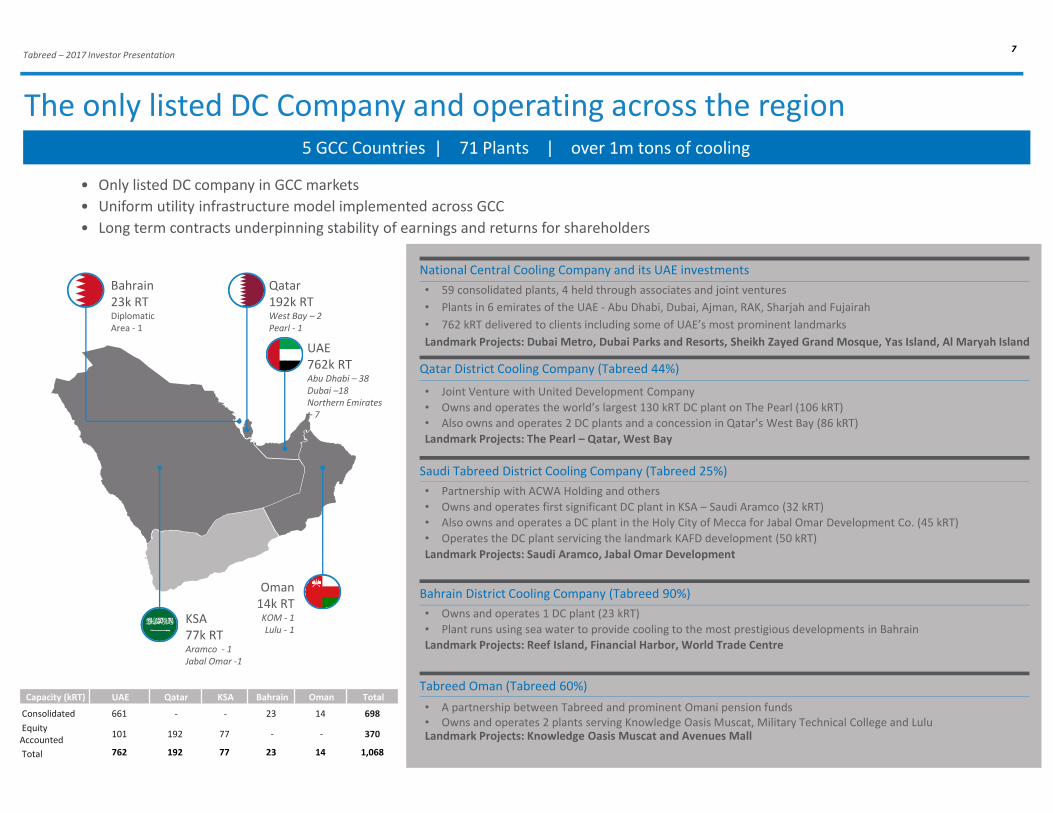
The only listed DC Company and operating across the region5 GCC Countries | 71 Plants | over 1m tons of cooling
Bahrain
23k RTDiplomatic
Area - 1
Qatar
192k RTWest Bay – 2
Pearl - 1
KSA
77k RTAramco - 1
Jabal Omar -1
Oman
14k RTKOM - 1
Lulu - 1
UAE
762k RTAbu Dhabi – 38
Dubai –18
Northern Emirates
– 7
• Partnership with ACWA Holding and others
• Owns and operates first significant DC plant in KSA – Saudi Aramco (32 kRT)
• Also owns and operates a DC plant in the Holy City of Mecca for Jabal Omar Development Co. (45 kRT)
• Operates the DC plant servicing the landmark KAFD development (50 kRT)
Landmark Projects: Saudi Aramco, Jabal Omar Development
Saudi Tabreed District Cooling Company (Tabreed 25%)
• A partnership between Tabreed and prominent Omani pension funds
• Owns and operates 2 plants serving Knowledge Oasis Muscat, Military Technical College and LuluLandmark Projects: Knowledge Oasis Muscat and Avenues Mall
Tabreed Oman (Tabreed 60%)
• Owns and operates 1 DC plant (23 kRT)
• Plant runs using sea water to provide cooling to the most prestigious developments in Bahrain
Landmark Projects: Reef Island, Financial Harbor, World Trade Centre
Bahrain District Cooling Company (Tabreed 90%)
• Joint Venture with United Development Company
• Owns and operates the world’s largest 130 kRT DC plant on The Pearl (106 kRT)
• Also owns and operates 2 DC plants and a concession in Qatar’s West Bay (86 kRT)
Landmark Projects: The Pearl – Qatar, West Bay
Qatar District Cooling Company (Tabreed 44%)
• 59 consolidated plants, 4 held through associates and joint ventures
• Plants in 6 emirates of the UAE - Abu Dhabi, Dubai, Ajman, RAK, Sharjah and Fujairah
• 762 kRT delivered to clients including some of UAE’s most prominent landmarks
Landmark Projects: Dubai Metro, Dubai Parks and Resorts, Sheikh Zayed Grand Mosque, Yas Island, Al Maryah Island
National Central Cooling Company and its UAE investments
• Only listed DC company in GCC markets
• Uniform utility infrastructure model implemented across GCC
• Long term contracts underpinning stability of earnings and returns for shareholders
Capacity (kRT) UAE Qatar KSA Bahrain Oman Total
Consolidated 661 - - 23 14 698
Equity
Accounted 101 192 77 - - 370
Total 762 192 77 23 14 1,068

Tabreed – 2017 Investor Presentation8
Utility business model with fixed revenue providing ~92% of returns
• Capacity charges reflect the
cooling capacity reserved for the
customer
• Consumption charges recover the
cost of cooling consumed and is
billed based on metering
• Consumption billing follows a bell
curve in line with average temperatures
in the region
• Capacity bills are a fixed amount every
month
• Blended EBITDA margin is the highest
in the winter months, average 49% for
the year
• Consumption revenue covers all
variable costs of operation
• Capacity revenue covers fixed
O&M, finance and corporate costs
and provides return on capital
64%
36%
Capacity Consumption
59%
45% 43%
55%
Jan Feb Mar Apr May Jun Jul Aug Sep Oct Nov Dec
Capacity Consumption EBITDA Margin
64%
37%
92%
36%
63%
8%
Revenue Costs and
Overheads
Total EBITDA
Capacity Consumption
Capacity ChargesCapacity ChargesCapacity ChargesCapacity Charges
Consumption ChargesConsumption ChargesConsumption ChargesConsumption Charges
Contracted cooling load (RT)
FIXEDFIXEDFIXEDFIXED
Cooling consumed (RTh)
VARIABLE (METERED)VARIABLE (METERED)VARIABLE (METERED)VARIABLE (METERED)
Majority of revenue comes
from capacity charges
Capacity revenue is fixed for the
year while consumption revenue
varies
Consumption is a pass through
and capacity provides returns
25 year contract25 year contract25 year contract25 year contract
Tabreed – 2017 Investor Presentation9
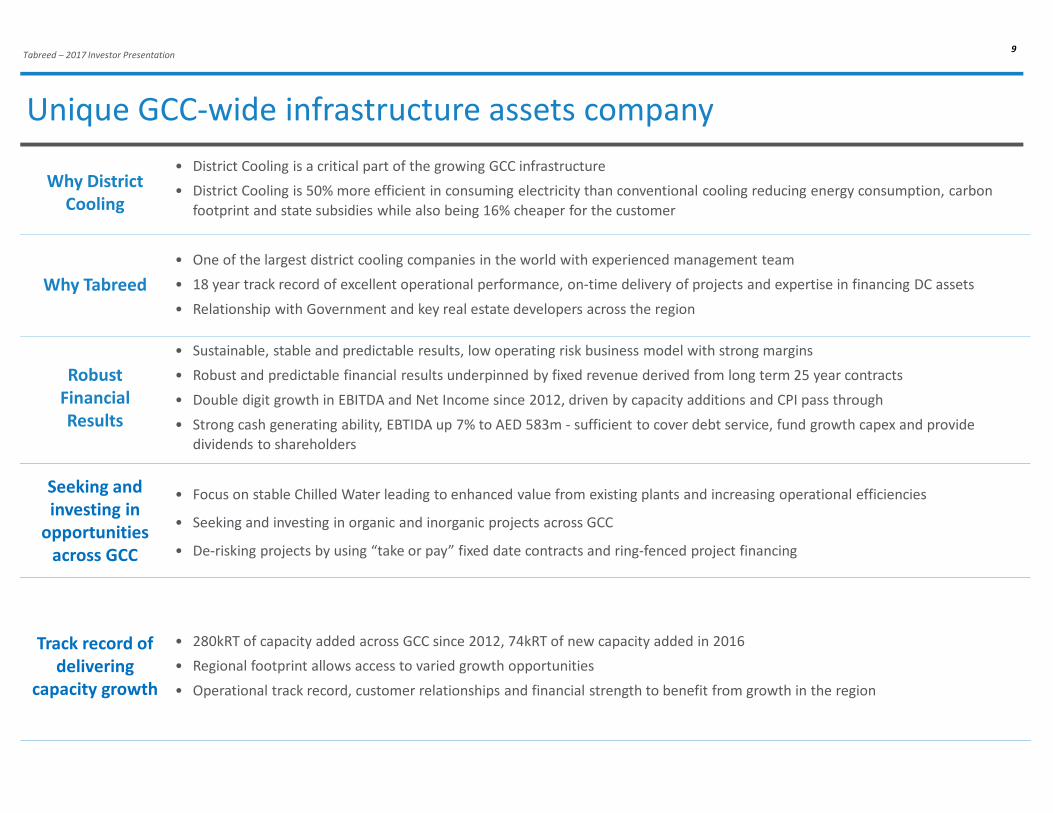
Unique GCC-wide infrastructure assets company
Why Tabreed
• One of the largest district cooling companies in the world with experienced management team
• 18 year track record of excellent operational performance, on-time delivery of projects and expertise in financing DC assets
• Relationship with Government and key real estate developers across the region
Seeking and
investing in
opportunities
across GCC
• Focus on stable Chilled Water leading to enhanced value from existing plants and increasing operational efficiencies
• Seeking and investing in organic and inorganic projects across GCC
• De-risking projects by using “take or pay” fixed date contracts and ring-fenced project financing
Robust
Financial
Results
• Sustainable, stable and predictable results, low operating risk business model with strong margins
• Robust and predictable financial results underpinned by fixed revenue derived from long term 25 year contracts
• Double digit growth in EBITDA and Net Income since 2012, driven by capacity additions and CPI pass through
• Strong cash generating ability, EBTIDA up 7% to AED 583m - sufficient to cover debt service, fund growth capex and provide
dividends to shareholders
Why District
Cooling
Track record of
delivering
capacity growth
• 280kRT of capacity added across GCC since 2012, 74kRT of new capacity added in 2016
• Regional footprint allows access to varied growth opportunities
• Operational track record, customer relationships and financial strength to benefit from growth in the region
• District Cooling is a critical part of the growing GCC infrastructure
• District Cooling is 50% more efficient in consuming electricity than conventional cooling reducing energy consumption, carbon
footprint and state subsidies while also being 16% cheaper for the customer

Index
A | Overview of Tabreed
B | Business overview
C | Board of Directors and Management Team
D | Financial Performance
E | Capital Structure
F | Conclusion
Tabreed – 2017 Investor Presentation11
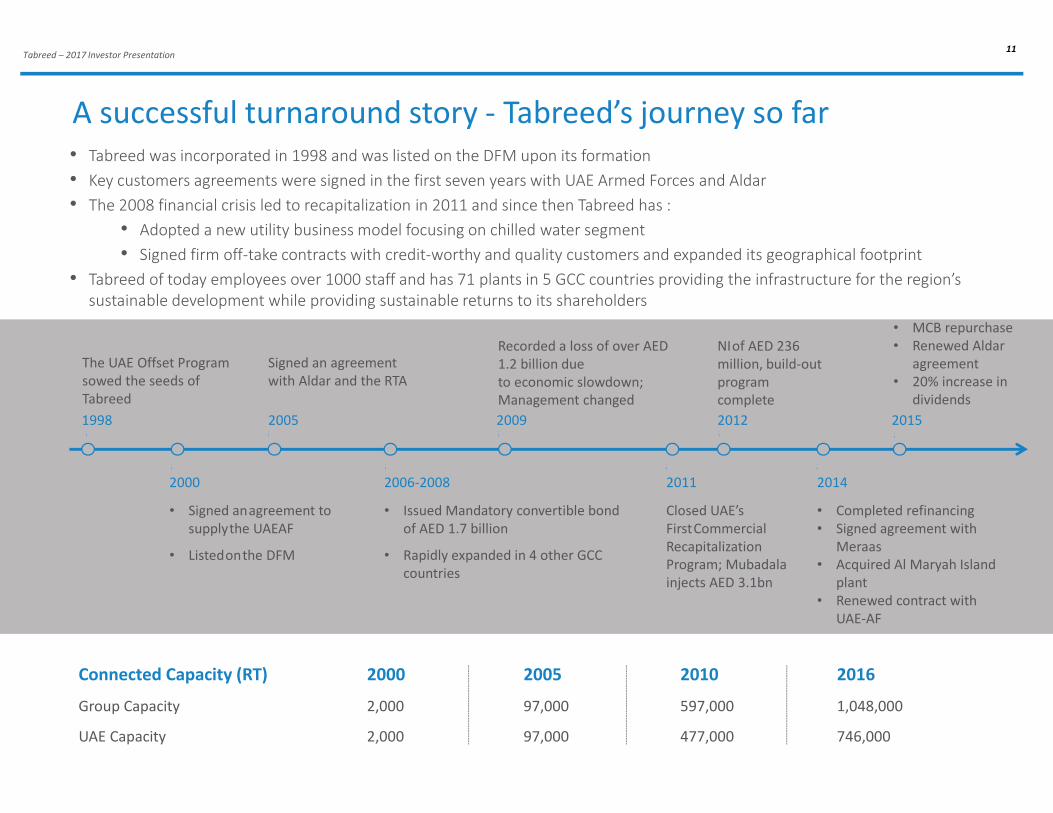
A successful turnaround story - Tabreed’s journey so far
• Tabreed was incorporated in 1998 and was listed on the DFM upon its formation
• Key customers agreements were signed in the first seven years with UAE Armed Forces and Aldar
• The 2008 financial crisis led to recapitalization in 2011 and since then Tabreed has :
• Adopted a new utility business model focusing on chilled water segment
• Signed firm off-take contracts with credit-worthy and quality customers and expanded its geographical footprint
• Tabreed of today employees over 1000 staff and has 71 plants in 5 GCC countries providing the infrastructure for the region’s
sustainable development while providing sustainable returns to its shareholders
1998
The UAE Offset Program
sowed the seeds of
Tabreed
• Signed anagreement to
supplythe UAEAF
• Listedonthe DFM
2000
2005
2006-2008 2011
2012
2014
Signed an agreement
with Aldar and the RTA
• Issued Mandatory convertible bond
of AED 1.7 billion
• Rapidly expanded in 4 other GCC
countries
2009
Recorded a loss of over AED
1.2 billion due
to economic slowdown;
Management changed
Closed UAE’s
FirstCommercial
Recapitalization
Program; Mubadala
injects AED 3.1bn
NIof AED 236
million, build-out
program
complete
• Completed refinancing
• Signed agreement with
Meraas
• Acquired Al Maryah Island
plant
• Renewed contract with
UAE-AF
Connected Capacity (RT) 2000 2005 2010 2016
Group Capacity 2,000 97,000 597,000 1,048,000
UAE Capacity 2,000 97,000 477,000 746,000
2015
• MCB repurchase
• Renewed Aldar
agreement
• 20% increase in
dividends

Tabreed – 2017 Investor Presentation12
Long term contracts with credit-worthy customers
• UAE Armed Forces was the first customer of the Company and continues to be an important partner
• Tabreed cools multiple military and training facilities
• Cooling agreement was renewed in 2014 for another 20 years
• Roads and Transport Authority of Dubai (RTA) is responsible for transport, roads & traffic in the Emirate of Dubai
• Tabreed has been providing cooling to all metro stations of the iconic Dubai Metro project since 2009
• Long term 27 year contract
• Aldar Properties PJSC is the leading real estate developer in Abu Dhabi and listed on ADX
• Tabreed and Aldar have been in partnership since Aldar’s incorporation in 2005
• Providing cooling to Aldar’s developments on Yas Island, Al Raha Beach, Reem Island and Abu Dhabi Island
• Cooling agreement was renewed in 2015 for another 30 years
Owned and Consolidated Plants
Joint Ventures and Associates
Tabreed’s UAE joint ventures and associates have long term contracts with key Government clients such as Mubadala,
Cleveland Clinic Abu Dhabi, Abu Dhabi Global Market Square, ZonesCorp et al while also serving reputable private
customers such as Aldar and Al Hilal Bank
Our joint ventures and associates also provide cooling to key Government clients such as Saudi Aramco, King Abdullah
Financial District and King Khalid International Airport also serve reputable private customers such as United
Development Company in Qatar and Lulu in Oman
The top 3 customers accounted for ~60% of chilled water revenues in 2016
Tabreed – 2017 Investor Presentation13
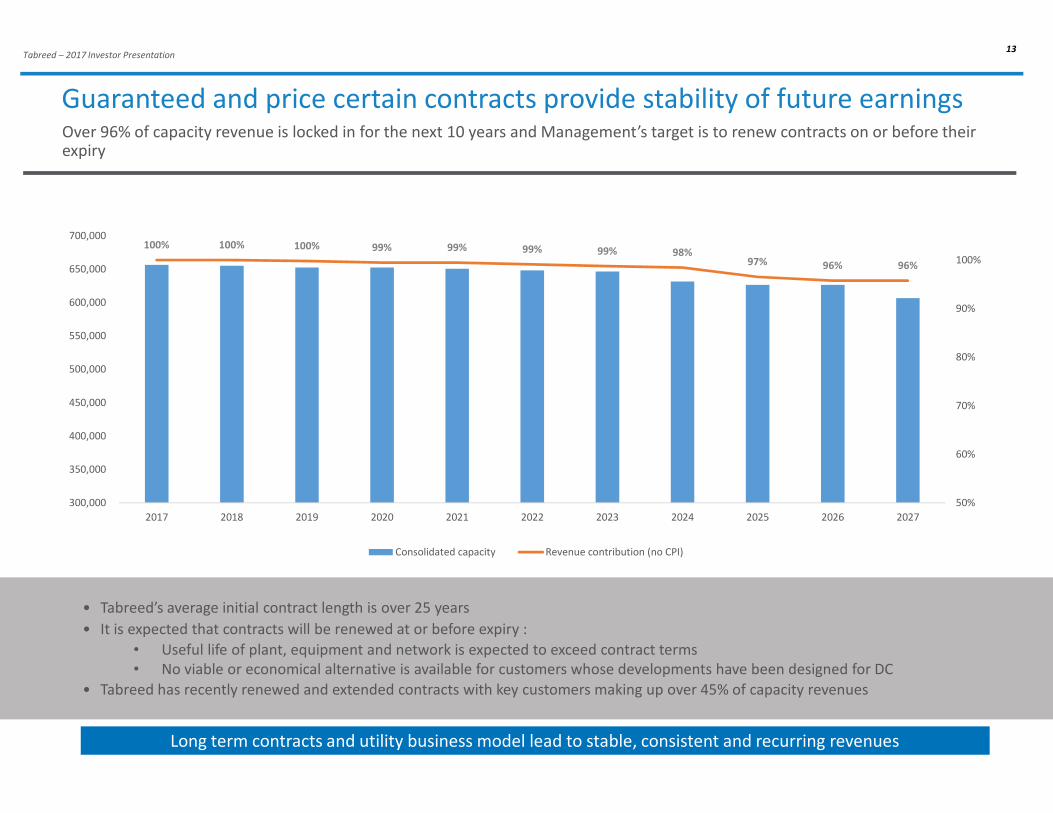
Guaranteed and price certain contracts provide stability of future earnings
• Tabreed’s average initial contract length is over 25 years
• It is expected that contracts will be renewed at or before expiry :
• Useful life of plant, equipment and network is expected to exceed contract terms
• No viable or economical alternative is available for customers whose developments have been designed for DC
• Tabreed has recently renewed and extended contracts with key customers making up over 45% of capacity revenues
Long term contracts and utility business model lead to stable, consistent and recurring revenues
Over 96% of capacity revenue is locked in for the next 10 years and Management’s target is to renew contracts on or before their expiry
100% 100% 100% 99% 99% 99% 99% 98%97% 96% 96%
50%
60%
70%
80%
90%
100%
300,000
350,000
400,000
450,000
500,000
550,000
600,000
650,000
700,000
2017 2018 2019 2020 2021 2022 2023 2024 2025 2026 2027
Consolidated capacity Revenue contribution (no CPI)

Tabreed – 2017 Investor Presentation14
Pursuing growth opportunities across GCC
Well placed to benefit from growth opportunities in the region through a mix of existing concessions and assets and new plants
• Over 60kRT of fully contracted capacity to be connected by end of 2018 in UAE, Qatar, Saudi, Bahrain and Oman and 20kRT
added by the end of Q1
• Tabreed is also positioned to benefit from several captive concession-like arrangements with customers across the region
Concessions
Concession-like
arrangements
leading to captive
growth
New plants
New plants and
developments with
take-or-pay contracts
Existing plants
71 plants across the
region provide
opportunity for new
connections
Connections to existing plants, high margin and increasing utilization
• Tabreed has added over 50kRTto existing plants since 2011
• Usually requires no additional fixed cost and provides higher margins
• Possible additions in the future could be up to 5% of total capacity
New plants, driven by the real estate market
• 4 plants under construction in the GCC
• Major projects include King Khaled International Airport (15kRT), West Bay 3 in
Qatar (15kRT) and other projects in Oman
Concession-like arrangements, providing captive growth from key customers
• Various arrangements across the GCC providing captive growth
• UAE – Yas Island, Maryah Island, Raha Beach, Dubai Parks
• Qatar – Pearl Qatar
• KSA – Jabal Omar development
• Bahrain – Reef Island and Bahrain Financial Harbor
Tabreed – 2017 Investor Presentation15
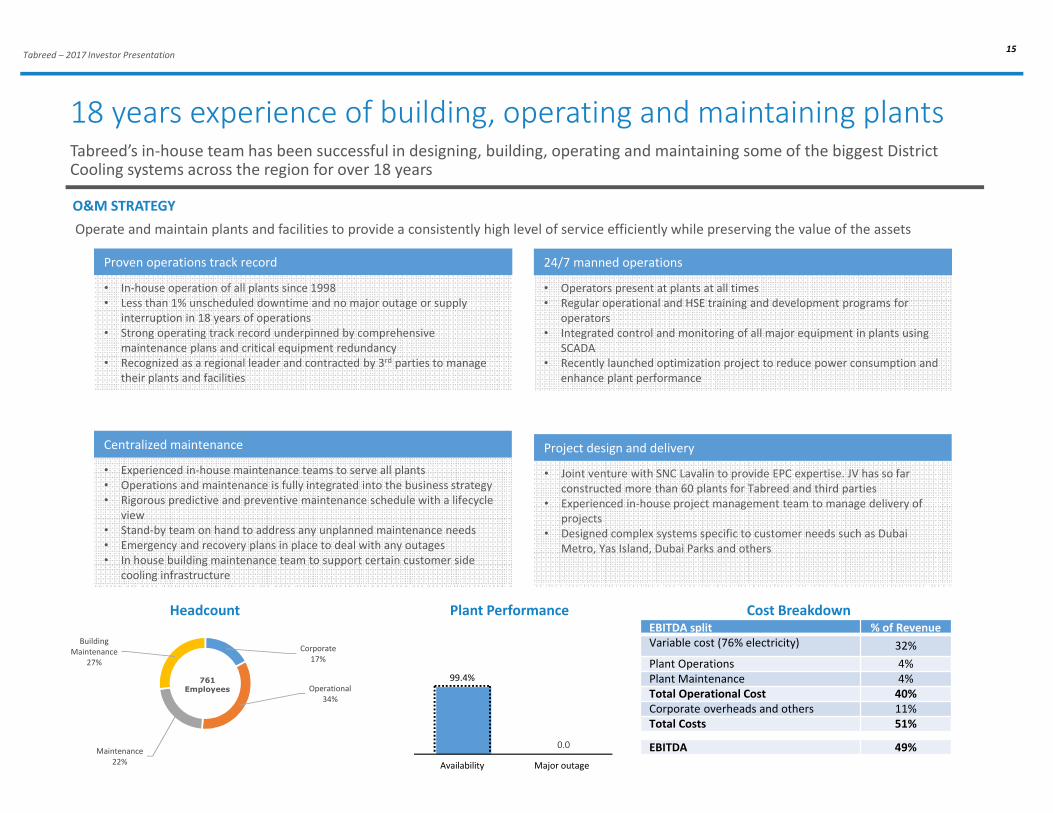
18 years experience of building, operating and maintaining plantsTabreed’s in-house team has been successful in designing, building, operating and maintaining some of the biggest District Cooling systems across the region for over 18 years
Corporate
17%
Operational
34%
Maintenance
22%
Building
Maintenance
27%
O&M STRATEGY
Operate and maintain plants and facilities to provide a consistently high level of service efficiently while preserving the value of the assets
Proven operations track record
• In-house operation of all plants since 1998
• Less than 1% unscheduled downtime and no major outage or supply
interruption in 18 years of operations
• Strong operating track record underpinned by comprehensive
maintenance plans and critical equipment redundancy
• Recognized as a regional leader and contracted by 3rd parties to manage
their plants and facilities
24/7 manned operations
• Operators present at plants at all times
• Regular operational and HSE training and development programs for
operators
• Integrated control and monitoring of all major equipment in plants using
SCADA
• Recently launched optimization project to reduce power consumption and
enhance plant performance
Centralized maintenance
• Experienced in-house maintenance teams to serve all plants
• Operations and maintenance is fully integrated into the business strategy
• Rigorous predictive and preventive maintenance schedule with a lifecycle
view
• Stand-by team on hand to address any unplanned maintenance needs
• Emergency and recovery plans in place to deal with any outages
• In house building maintenance team to support certain customer side
cooling infrastructure
Project design and delivery
• Joint venture with SNC Lavalin to provide EPC expertise. JV has so far
constructed more than 60 plants for Tabreed and third parties
• Experienced in-house project management team to manage delivery of
projects
• Designed complex systems specific to customer needs such as Dubai
Metro, Yas Island, Dubai Parks and others
Headcount Plant Performance
0.0
Availability
99.4%
Major outage
Cost Breakdown
761Employees
EBITDA split % of Revenue
Variable cost (76% electricity) 32%
Plant Operations 4%
Plant Maintenance 4%
Total Operational Cost 40%
Corporate overheads and others 11%
Total Costs 51%
EBITDA 49%

Tabreed – 2017 Investor Presentation16
Focus on Health, Safety and EnvironmentHealth, safety and environment is a cornerstone of our operations and an integral part of business planning and strategic goal setting.
• Integrating HSE into plant operations and processes
• Development of Tabreed’s HSE manual
• Regular HSE training and awareness programs to enhance HSE readiness
• All Tabreed and most contractor employees have been trained over the past 2 years
• Regular internal and external HSE audits to ensure compliance with UAE regulations and international standards
• HSE tracking system for effective monitoring of HSE performance and objectives
Implementation
• Recipient of International Organization for Standardization and British Standard Institute certifications
•ISO 9001 for quality management systems
•ISO 14001 for environment management systems
•OHSAS 18001 for occupational health and safety management systems
Certifications
• Top management is fully committed to HSE with direct reporting line to the CEO
• Reporting HSE performance to the Board of Directors on monthly basis
• HSE steering committee comprises HSE, Operations and Internal Audit heads
• Multiple plant and site visits performed each year by CEO and senior management
Leadership & Commitment
• Conduct business in socially responsible manner
• HSE is a key consideration in business planning and decisions
• Comply with all regulations and industry best practices
• Ensure all employees are trained and motivated to adopt and develop HSE culture
• Seek continuous improvement in HSEperformance
HSE Policy
Index
A | Overview of Tabreed
B | Business overview
C | Board of Directors and Management Team
D | Financial Performance
E | Capital Structure
F | Conclusion

Tabreed – 2017 Investor Presentation18
Khaled Abdulla Al Qubaisi
Chairman
Ahmed Saeed Al Calily
Vice Chairman, Projects Committee
Chair
Ahmed Yahia Al Idrissi
Finance Committee Chair
H.E. Dr Ahmad Abdulla Belhoul
Current Role• Chief Executive Officer, Aerospace, ICT
and Renewables• Chief Strategy & Risk Officer, Mubadala
• Chief Executive Officer, Technology,
Manufacturing and Mining
• Minister of State – Higher Education
Affairs, Abu Dhabi
Other Board Positions
• Managing Director of Abu Dhabi Racing
• Board member of Masdar, Emirates
Global Aluminum, Abu Dhabi
Motorsports Management, Mubadala
Petroleum, GLOBALFOUNDRIES, Finance
House and Cleveland Clinic Abu Dhabi
LLC
• Board member of Saudi Tabreed and
Qatar Cool
• Board Member of Mubadala Petroleum
and Masdar
• Member of Mubadala’s Investment
Committee
• Chairman of GLOBALFOUNDRIES and TM
Mining Ventures, S.L.
• Board member of Masdar, Emirates Global
Aluminium, Mubadala Petroleum and
Advanced Micro Devices, INC.
• Member of Mubadala’s Investment
Committee
• Ex-Board Member of Emirates
Development Bank
• Board member of Masdar
Board of DirectorsExperienced Board with a wide range of industry experience
Mohamed Jameel Al
Ramahi
Audit Committee Chair
Abdul Raouf Al Bitar Khaled Saleh Al Rashedi Mohammed Al Huraimel Al
Shamsi
Noms & Rems Committee
chair
Saeed Ali Khalfan Al Dhaheri
Current Role • CEO, Masdar• CEO of Al Manhal Water Factory
Co. Ltd
• Head of Government Affairs in
Mubadala
• Senior Vice President in the
Industry Unit, Mubadala
• Investments Director at Ali &
Sons, UAE
Other Board Positions
• Board Member of Shuaa Energy 2
PJSC and Abu Dhabi Carbon
Capture Company LLC
• Board member of Middle East
Specialized Cables Factory, Gulf
Insurance Group (15 Board
membership)
• Chairman of Safwa Marina
• Board member of Guinea Alumina
Corporation, AAV Limited and Abu
Dhabi Ship Building

Tabreed – 2017 Investor Presentation19
Jasim Husain Thabet
Chief Executive Officer
Management Team
Stephen Ridlington
Chief Financial Officer
Dr. Yousif Al Hammadi
Executive Vice President
of Projects and Strategic
Customer Relationship
• Joined Tabreed in August 2012
• Over 15 years of experience in the
regional energy, infrastructure and
utilities industries, including the
district cooling sector
• Prior to joining Tabreed, Jasim was
Vice-President in Mubadala
Development Company’s Industry
Unit, with responsibility for
managing several of the Unit’s key
assets
• Also held senior positions with
General Electric Power Systems,
and ZADCO, one of the region’s
leading oil producers
• Appointed Chief Financial Officer in
February 2015, a position he
previously held between 2009 –
2011
• In his first tenure, led the company
through its AED 3 billion
recapitalization
• Prior to joining Tabreed, Steve
spent over 20 years with BP in
several senior finance roles
including Deputy CFO and Group
Treasurer of TNK-BP
• Joined Tabreed’s Projects
Department in 2014
• Oversees the development of all of
the company’s projects
• Joined Tabreed from Mubadala
Development Company, where he
was instrumental in delivering a
number of key projects including
Rosewood Hotel on al Maryah
Island
• Joined Tabreed in 2011
• Over 17 years of experience in
corporate law, mergers and
acquisitions, private equity and
project finance. He has practiced
law in four countries across four
continents.
• Previously, worked for Herbert
Smith LLP where he worked on
many landmark deals in the region
Hamish Jooste
Chief Legal Counsel

Index
A | Overview of Tabreed
B | Business overview
C | Board of Directors and Management Team
D | Financial Performance
E | Capital Structure
F | Conclusion
Tabreed – 2017 Investor Presentation21
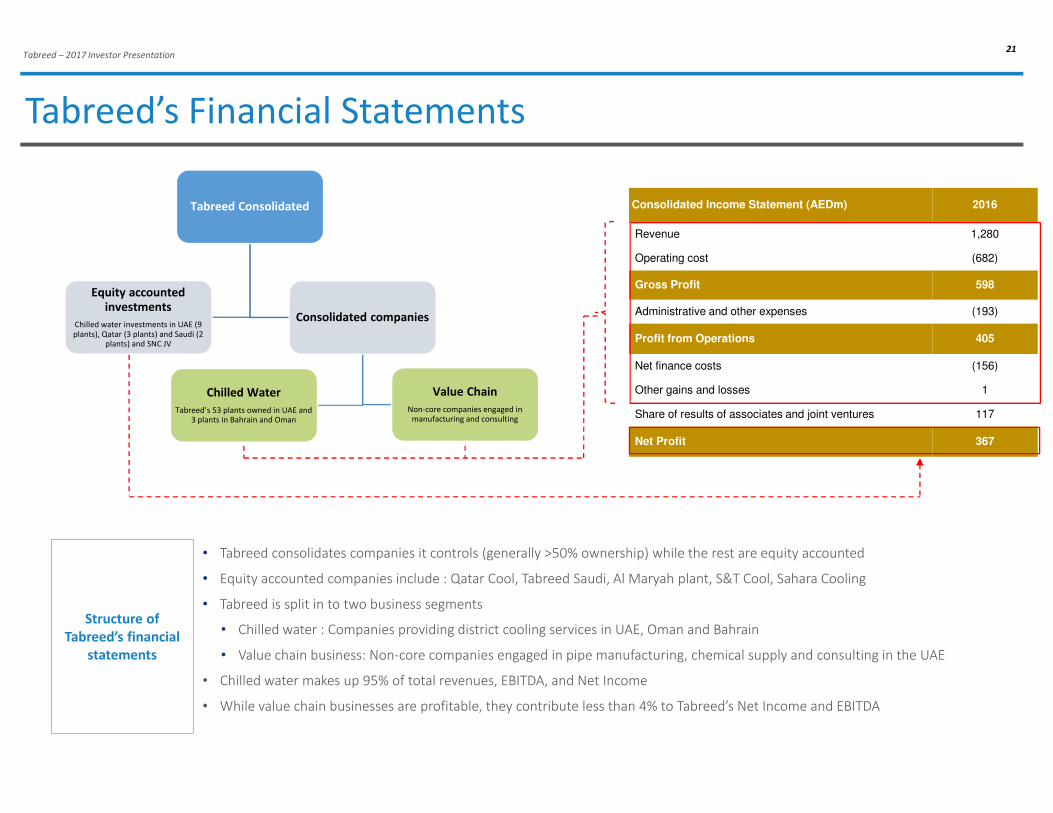
Consolidated Income Statement (AEDm) 2016
Revenue 1,280
Operating cost (682)
Gross Profit 598
Administrative and other expenses (193)
Profit from Operations 405
Net finance costs (156)
Other gains and losses 1
Share of results of associates and joint ventures 117
Net Profit 367
• Tabreed consolidates companies it controls (generally >50% ownership) while the rest are equity accounted
• Equity accounted companies include : Qatar Cool, Tabreed Saudi, Al Maryah plant, S&T Cool, Sahara Cooling
• Tabreed is split in to two business segments
• Chilled water : Companies providing district cooling services in UAE, Oman and Bahrain
• Value chain business: Non-core companies engaged in pipe manufacturing, chemical supply and consulting in the UAE
• Chilled water makes up 95% of total revenues, EBITDA, and Net Income
• While value chain businesses are profitable, they contribute less than 4% to Tabreed’s Net Income and EBITDA
Tabreed Consolidated
Consolidated companies
Chilled Water
Tabreed’s 53 plants owned in UAE and 3 plants in Bahrain and Oman
Value Chain
Non-core companies engaged in manufacturing and consulting
Equity accounted
investments
Chilled water investments in UAE (9 plants), Qatar (3 plants) and Saudi (2
plants) and SNC JV
Structure of
Tabreed’s financial
statements
Tabreed’s Financial Statements
Tabreed – 2017 Investor Presentation22
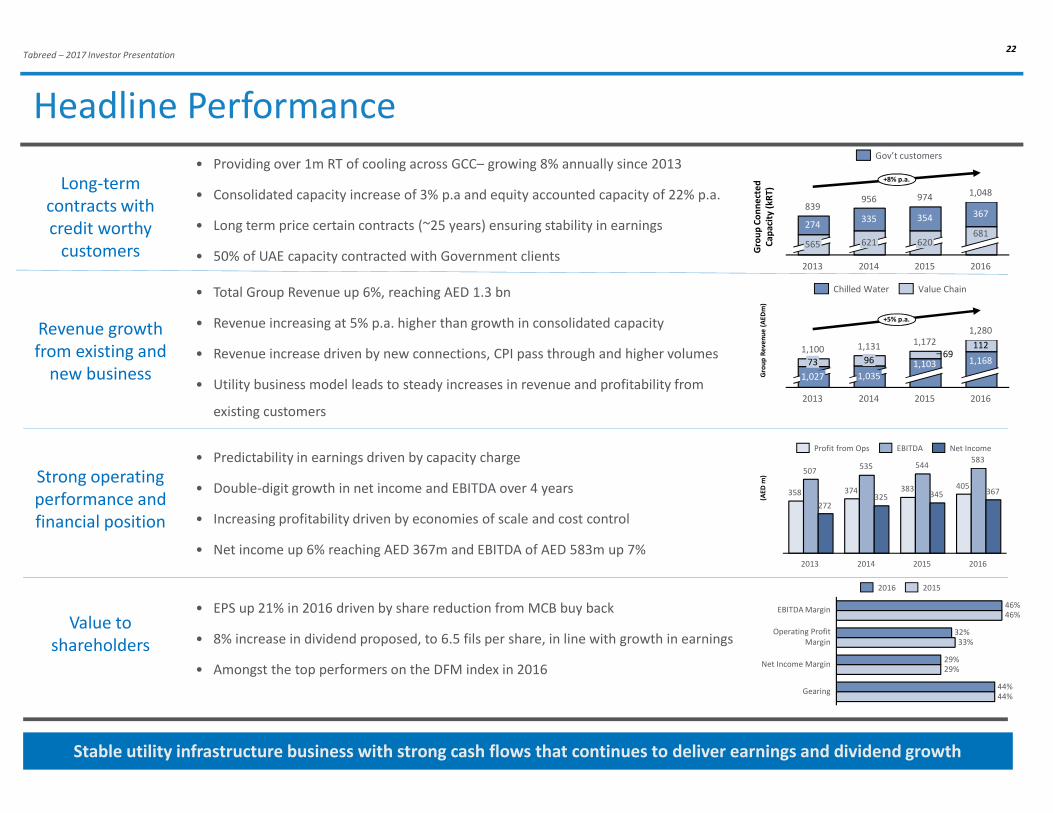
1,131
2013
1,035
96 1,168
2015
+5% p.a.
1,280
1,172
2016
691,103
2014
112
73
1,027
1,100
367
681
2015
974
620
2014
1,048
354
956
621
2013
335
839
2016
274
565
+8% p.a.
Gov’t customers
Headline Performance
Revenue growth
from existing and
new business
• Total Group Revenue up 6%, reaching AED 1.3 bn
• Revenue increasing at 5% p.a. higher than growth in consolidated capacity
• Revenue increase driven by new connections, CPI pass through and higher volumes
• Utility business model leads to steady increases in revenue and profitability from
existing customers
Value to
shareholders
• EPS up 21% in 2016 driven by share reduction from MCB buy back
• 8% increase in dividend proposed, to 6.5 fils per share, in line with growth in earnings
• Amongst the top performers on the DFM index in 2016
Strong operating
performance and
financial position
• Predictability in earnings driven by capacity charge
• Double-digit growth in net income and EBITDA over 4 years
• Increasing profitability driven by economies of scale and cost control
• Net income up 6% reaching AED 367m and EBITDA of AED 583m up 7%
Long-term
contracts with
credit worthy
customers
• Providing over 1m RT of cooling across GCC– growing 8% annually since 2013
• Consolidated capacity increase of 3% p.a and equity accounted capacity of 22% p.a.
• Long term price certain contracts (~25 years) ensuring stability in earnings
• 50% of UAE capacity contracted with Government clients
(AE
D m
)G
rou
p R
ev
en
ue
(A
ED
m)
Gro
up
Co
nn
ect
ed
Ca
pa
city
(k
RT
)
Stable utility infrastructure business with strong cash flows that continues to deliver earnings and dividend growth
Chilled Water Value Chain
583
2016
383
2013
544507
345358
2014
374
535
325
2015
367405
272
Net IncomeEBITDAProfit from Ops
Gearing44%
Operating Profit
Margin 33%
32%
29%
44%
EBITDA Margin
Net Income Margin
46%46%
29%
20152016

Tabreed – 2017 Investor Presentation23
Core Chilled Water business drives performance growth
Capacity (kRT) Chilled Water Revenue and Share of results (AED m)
Chilled Water Profit From Operations (AED m)
UAE Qatar KSA Other
GCC
Total
Revenue 1,119 - - 49 1,168
Operating Costs (580) - - (37) (617)
Gross Profit 540 - - 11 551
Gross Profit Margin 48% - - 22% 47%
Profit from
Operations 382 - - 5 387
OP Margin 34% - - 10% 33%
Share of Results of
Associates 37 45 35 - 116
1,103
2014
1,035
2013
1,027
2016
1,168
+4% p.a.
2015
Equity accountedConsolidated
348 359 370387
+4% p.a.
2015
34%
2014
35%
2013
32% 33%
2016
Profit from OperationsMargin
UAE is the foundation for consistent performance with exciting opportunities in GCC beginning to materialize
Chilled Water Geographical Breakdown (AED m)
638
2014
638
2013
616
+4% p.a.
2016
683
2015
+22% p.a.
2015
336
2014
319
2013
201
2016
365
+21% p.a.
2016
117
20152014
85
2013
66
99
Share of ResultsCW Revenue
Tabreed – 2017 Investor Presentation24
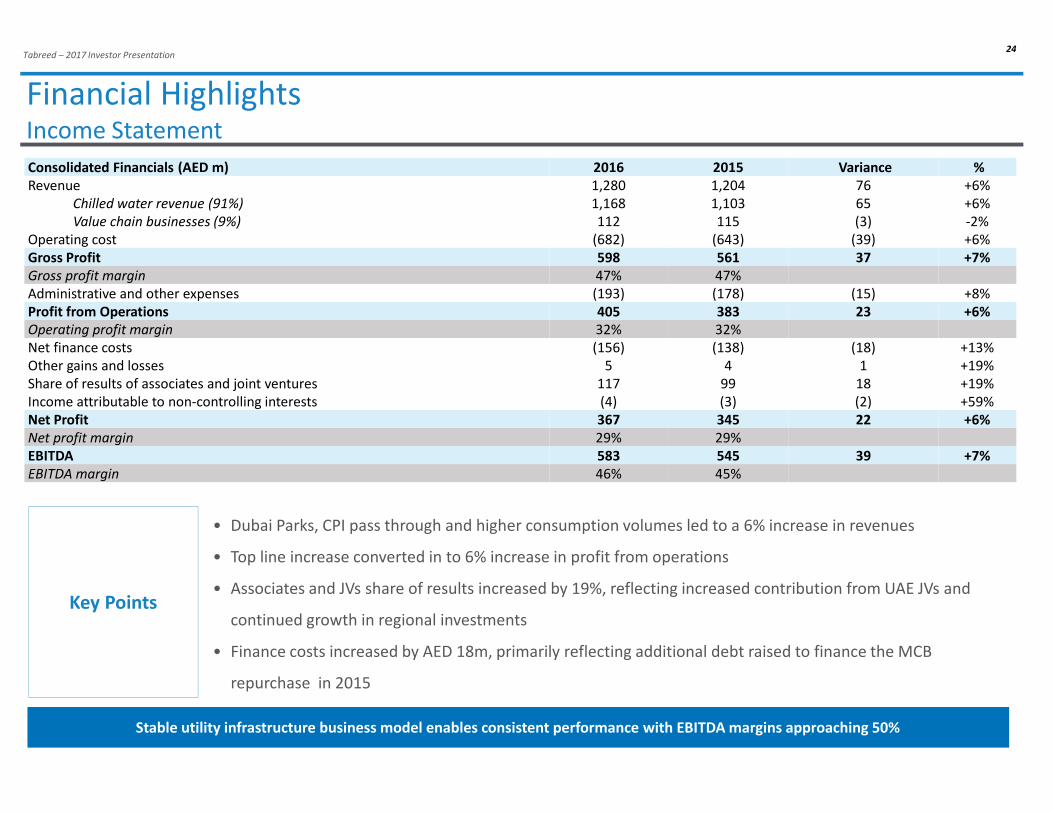
Financial HighlightsIncome Statement
Key Points
• Dubai Parks, CPI pass through and higher consumption volumes led to a 6% increase in revenues
• Top line increase converted in to 6% increase in profit from operations
• Associates and JVs share of results increased by 19%, reflecting increased contribution from UAE JVs and
continued growth in regional investments
• Finance costs increased by AED 18m, primarily reflecting additional debt raised to finance the MCB
repurchase in 2015
Stable utility infrastructure business model enables consistent performance with EBITDA margins approaching 50%
Consolidated Financials (AED m) 2016 2015 Variance %
Revenue 1,280 1,204 76 +6%
Chilled water revenue (91%) 1,168 1,103 65 +6%
Value chain businesses (9%) 112 115 (3) -2%
Operating cost (682) (643) (39) +6%
Gross Profit 598 561 37 +7%
Gross profit margin 47% 47%
Administrative and other expenses (193) (178) (15) +8%
Profit from Operations 405 383 23 +6%
Operating profit margin 32% 32%
Net finance costs (156) (138) (18) +13%
Other gains and losses 5 4 1 +19%
Share of results of associates and joint ventures 117 99 18 +19%
Income attributable to non-controlling interests (4) (3) (2) +59%
Net Profit 367 345 22 +6%
Net profit margin 29% 29%
EBITDA 583 545 39 +7%
EBITDA margin 46% 45%
Tabreed – 2017 Investor Presentation25
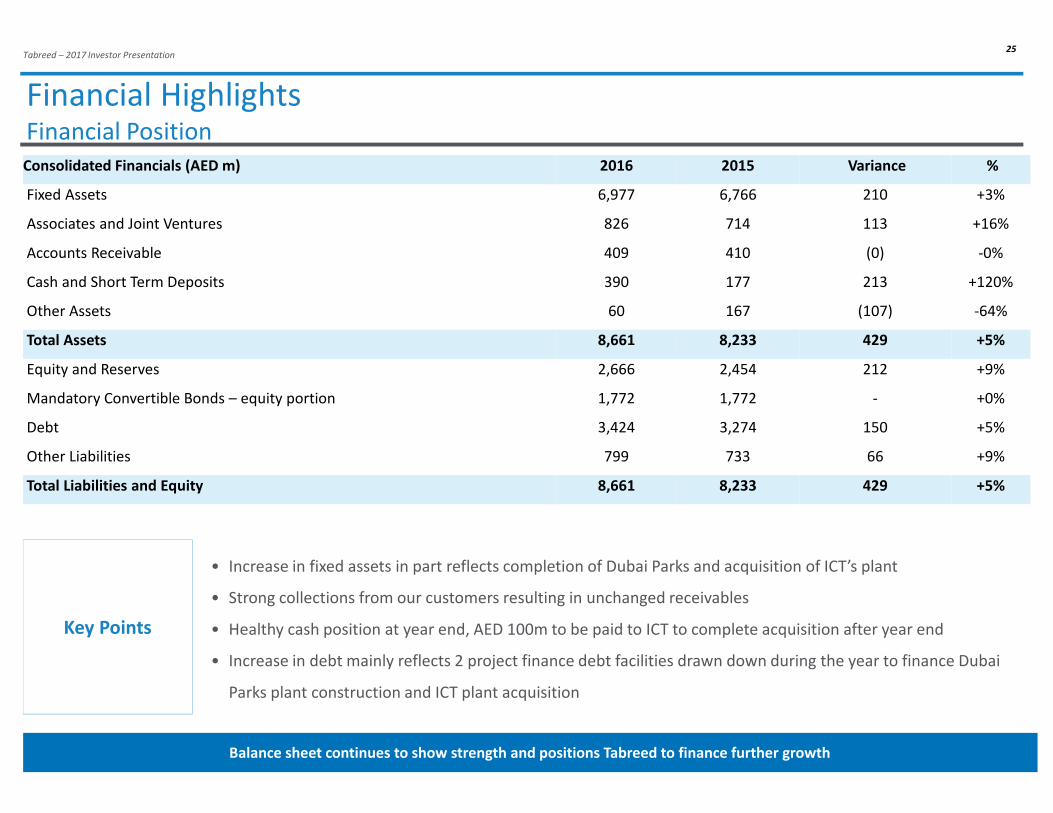
Financial HighlightsFinancial Position
Key Points
• Increase in fixed assets in part reflects completion of Dubai Parks and acquisition of ICT’s plant
• Strong collections from our customers resulting in unchanged receivables
• Healthy cash position at year end, AED 100m to be paid to ICT to complete acquisition after year end
• Increase in debt mainly reflects 2 project finance debt facilities drawn down during the year to finance Dubai
Parks plant construction and ICT plant acquisition
Balance sheet continues to show strength and positions Tabreed to finance further growth
Consolidated Financials (AED m) 2016 2015 Variance %
Fixed Assets 6,977 6,766 210 +3%
Associates and Joint Ventures 826 714 113 +16%
Accounts Receivable 409 410 (0) -0%
Cash and Short Term Deposits 390 177 213 +120%
Other Assets 60 167 (107) -64%
Total Assets 8,661 8,233 429 +5%
Equity and Reserves 2,666 2,454 212 +9%
Mandatory Convertible Bonds – equity portion 1,772 1,772 - +0%
Debt 3,424 3,274 150 +5%
Other Liabilities 799 733 66 +9%
Total Liabilities and Equity 8,661 8,233 429 +5%
Tabreed – 2017 Investor Presentation26
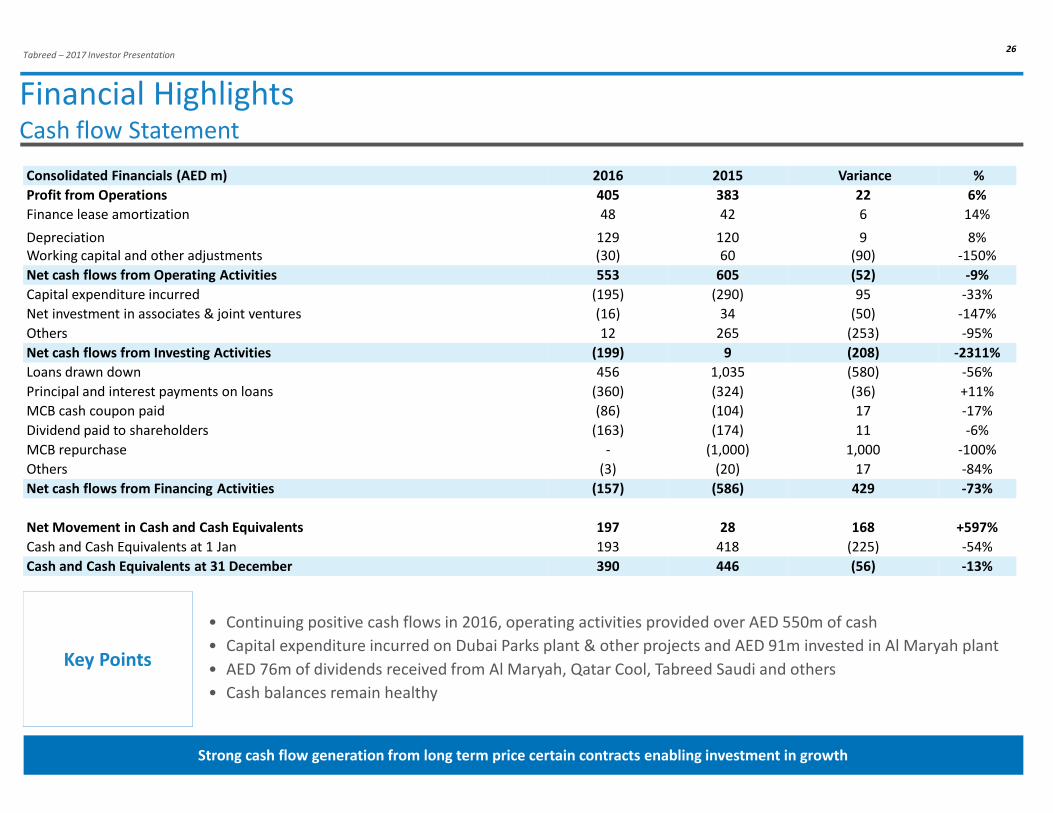
Financial HighlightsCash flow Statement
Key Points
• Continuing positive cash flows in 2016, operating activities provided over AED 550m of cash
• Capital expenditure incurred on Dubai Parks plant & other projects and AED 91m invested in Al Maryah plant
• AED 76m of dividends received from Al Maryah, Qatar Cool, Tabreed Saudi and others
• Cash balances remain healthy
Strong cash flow generation from long term price certain contracts enabling investment in growth
Consolidated Financials (AED m) 2016 2015 Variance %
Profit from Operations 405 383 22 6%
Finance lease amortization 48 42 6 14%
Depreciation 129 120 9 8%
Working capital and other adjustments (30) 60 (90) -150%
Net cash flows from Operating Activities 553 605 (52) -9%
Capital expenditure incurred (195) (290) 95 -33%
Net investment in associates & joint ventures (16) 34 (50) -147%
Others 12 265 (253) -95%
Net cash flows from Investing Activities (199) 9 (208) -2311%
Loans drawn down 456 1,035 (580) -56%
Principal and interest payments on loans (360) (324) (36) +11%
MCB cash coupon paid (86) (104) 17 -17%
Dividend paid to shareholders (163) (174) 11 -6%
MCB repurchase - (1,000) 1,000 -100%
Others (3) (20) 17 -84%
Net cash flows from Financing Activities (157) (586) 429 -73%
Net Movement in Cash and Cash Equivalents 197 28 168 +597%
Cash and Cash Equivalents at 1 Jan 193 418 (225) -54%
Cash and Cash Equivalents at 31 December 390 446 (56) -13%
Tabreed – 2017 Investor Presentation27
Index
A | Overview of Tabreed
B | Business overview
C | Board of Directors and Management Team
D | Financial Performance
E | Capital Structure
F | Conclusion
Tabreed – 2017 Investor Presentation28
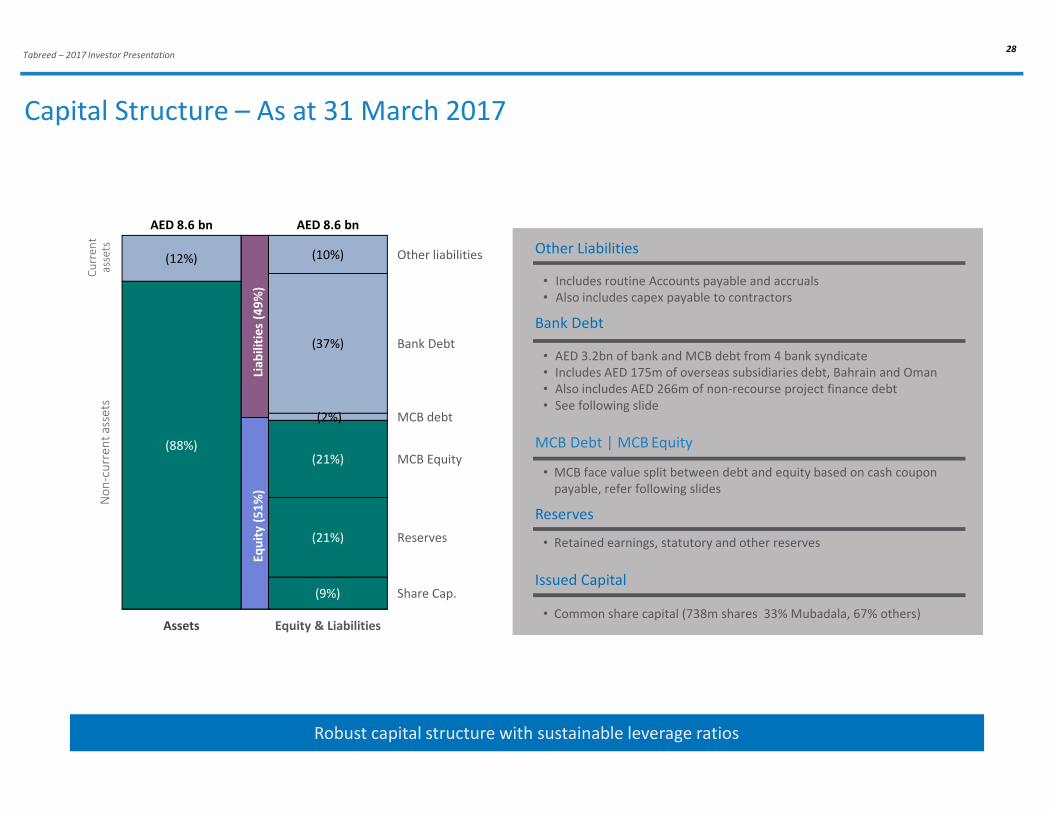
Capital Structure – As at 31 March 2017
(88%)
(9%)
(21%)
(21%)
(10%)
Share Cap.
Reserves
MCB Equity
MCB debt(2%)
(37%)
Assets
AED 8.6 bn
Bank Debt
Other liabilities
Equity & Liabilities
AED 8.6 bn
(12%)
• AED 3.2bn of bank and MCB debt from 4 bank syndicate
• Includes AED 175m of overseas subsidiaries debt, Bahrain and Oman
• Also includes AED 266m of non-recourse project finance debt
• See following slide
• MCB face value split between debt and equity based on cash coupon
payable, refer following slides
• Retained earnings, statutory and other reserves
• Common share capital (738m shares 33% Mubadala, 67% others)
• Includes routine Accounts payable and accruals
• Also includes capex payable to contractors
Eq
uit
y (
51
%)
Lia
bil
itie
s (4
9%
)
Robust capital structure with sustainable leverage ratios
Other Liabilities
Bank Debt
MCB Debt | MCB Equity
Reserves
Issued Capital
Cu
rre
nt
ass
ets
No
n-c
urr
en
t a
sse
ts
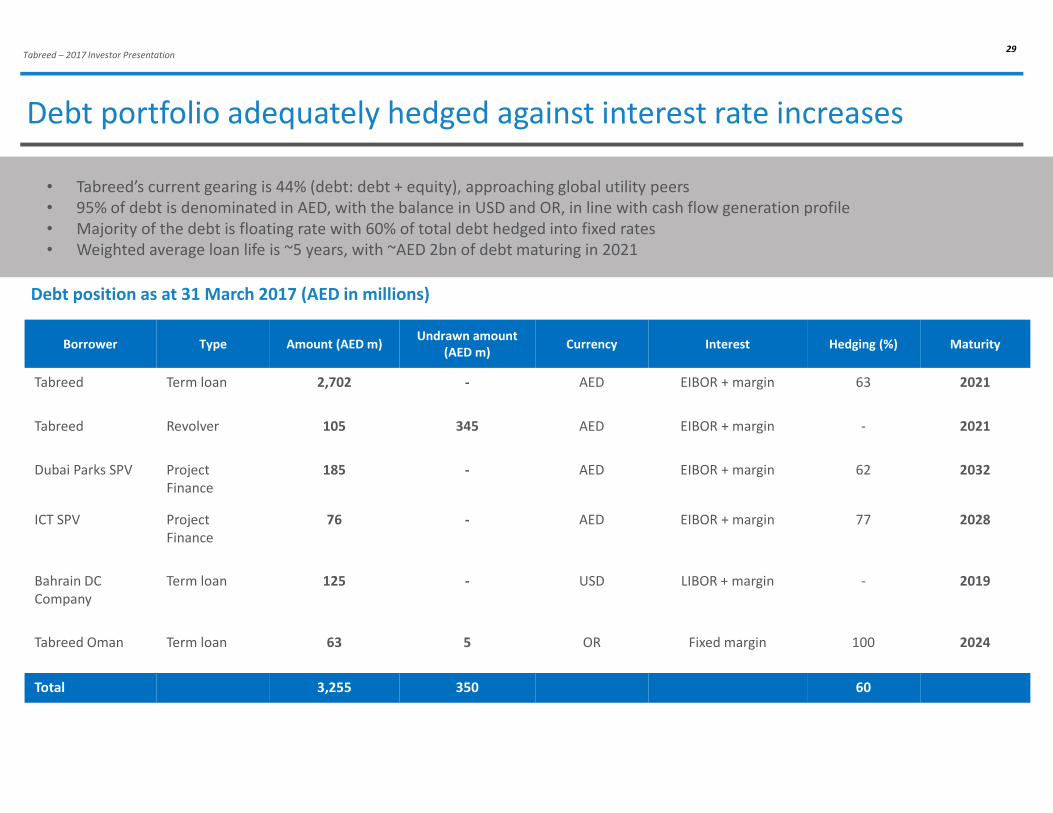
Tabreed – 2017 Investor Presentation29
• Tabreed’s current gearing is 44% (debt: debt + equity), approaching global utility peers
• 95% of debt is denominated in AED, with the balance in USD and OR, in line with cash flow generation profile
• Majority of the debt is floating rate with 60% of total debt hedged into fixed rates
• Weighted average loan life is ~5 years, with ~AED 2bn of debt maturing in 2021
Debt position as at 31 March 2017 (AED in millions)
Debt portfolio adequately hedged against interest rate increases
Borrower Type Amount (AED m)Undrawn amount
(AED m)Currency Interest Hedging (%) Maturity
Tabreed Term loan 2,702 - AED EIBOR + margin 63 2021
Tabreed Revolver 105 345 AED EIBOR + margin - 2021
Dubai Parks SPV Project
Finance
185 - AED EIBOR + margin 62 2032
ICT SPV Project
Finance
76 - AED EIBOR + margin 77 2028
Bahrain DC
Company
Term loan 125 - USD LIBOR + margin - 2019
Tabreed Oman Term loan 63 5 OR Fixed margin 100 2024
Total 3,255 350 60
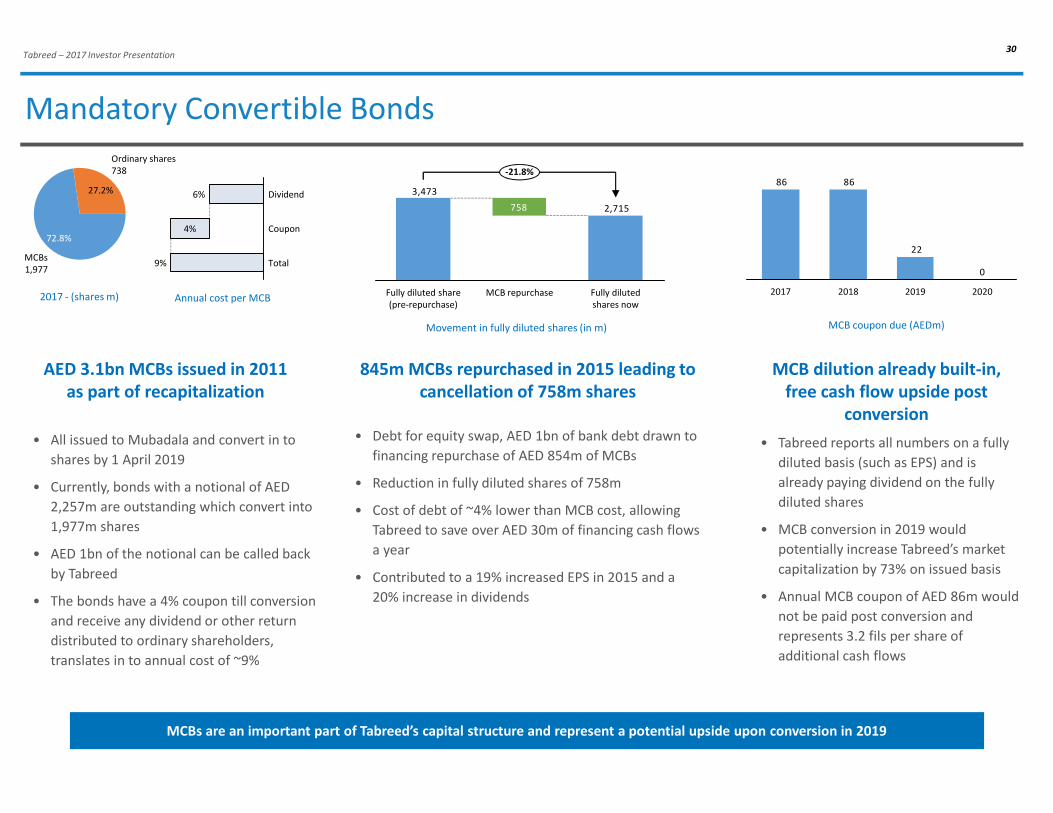
Tabreed – 2017 Investor Presentation30
Mandatory Convertible Bonds
AED 3.1bn MCBs issued in 2011
as part of recapitalization
845m MCBs repurchased in 2015 leading to
cancellation of 758m shares
MCB dilution already built-in,
free cash flow upside post
conversion
MCBs
1,977
72.8%
Ordinary shares
738
27.2%
9%
Coupon
Total
6%
4%
Dividend
2,715
3,473
758
MCB repurchase Fully diluted
shares now
Fully diluted share
(pre-repurchase)
-21.8%
2017 - (shares m) Annual cost per MCB
Movement in fully diluted shares (in m)
• All issued to Mubadala and convert in to
shares by 1 April 2019
• Currently, bonds with a notional of AED
2,257m are outstanding which convert into
1,977m shares
• AED 1bn of the notional can be called back
by Tabreed
• The bonds have a 4% coupon till conversion
and receive any dividend or other return
distributed to ordinary shareholders,
translates in to annual cost of ~9%
• Debt for equity swap, AED 1bn of bank debt drawn to
financing repurchase of AED 854m of MCBs
• Reduction in fully diluted shares of 758m
• Cost of debt of ~4% lower than MCB cost, allowing
Tabreed to save over AED 30m of financing cash flows
a year
• Contributed to a 19% increased EPS in 2015 and a
20% increase in dividends
• Tabreed reports all numbers on a fully
diluted basis (such as EPS) and is
already paying dividend on the fully
diluted shares
• MCB conversion in 2019 would
potentially increase Tabreed’s market
capitalization by 73% on issued basis
• Annual MCB coupon of AED 86m would
not be paid post conversion and
represents 3.2 fils per share of
additional cash flows
0
22
8686
2017 20202018 2019
MCB coupon due (AEDm)
MCBs are an important part of Tabreed’s capital structure and represent a potential upside upon conversion in 2019
Tabreed – 2017 Investor Presentation31
Index
A | Overview of Tabreed
B | Business overview
C | Board of Directors and Management Team
D | Financial Performance
E | Capital Structure
F | Conclusion
Tabreed – 2017 Investor Presentation32
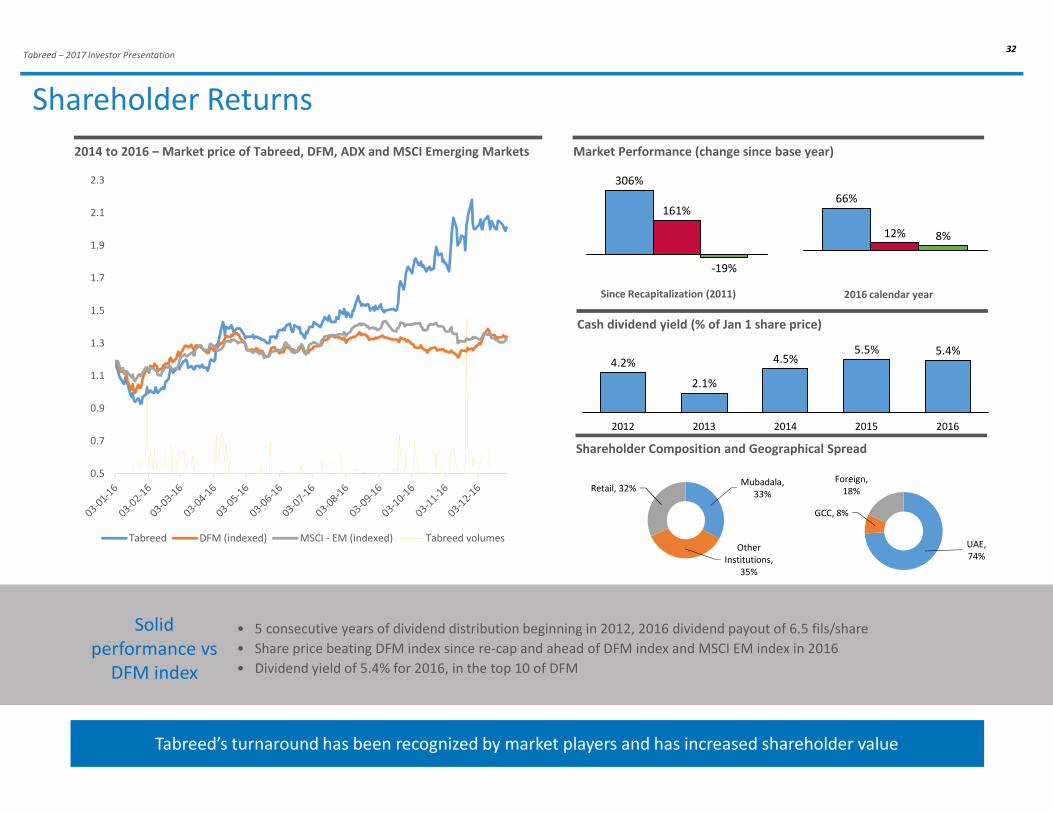
-19%
161%
306%
Tabreed’s turnaround has been recognized by market players and has increased shareholder value
Shareholder Returns
• 5 consecutive years of dividend distribution beginning in 2012, 2016 dividend payout of 6.5 fils/share
• Share price beating DFM index since re-cap and ahead of DFM index and MSCI EM index in 2016
• Dividend yield of 5.4% for 2016, in the top 10 of DFM
Solid
performance vs
DFM index
4.5%
20162015
5.5%
2013 2014
2.1%
5.4%
2012
4.2%
Market Performance (change since base year)
Cash dividend yield (% of Jan 1 share price)
2014 to 2016 – Market price of Tabreed, DFM, ADX and MSCI Emerging Markets
Mubadala,
33%
Other
Institutions,
35%
Retail, 32%
UAE,
74%
GCC, 8%
Foreign,
18%
Shareholder Composition and Geographical Spread
8%12%
66%
Since Recapitalization (2011) 2016 calendar year
-
80,000,000
160,000,000
0.5
0.7
0.9
1.1
1.3
1.5
1.7
1.9
2.1
2.3
Tabreed DFM (indexed) MSCI - EM (indexed) Tabreed volumes
NATIONAL CENTRAL COOLING COMPANY (PJSC)
Contact usFaisal Tahir BhattiInvestor Relations
Ahmed Al NowaisCommunications
Tel: +971 2 2020336
Email: [email protected]
Tel: +971 2 2020333
Email: [email protected]
Management looks forward to engaging with shareholders and investors at the following 2017 events
SecondSecondSecondSecond quarter earnings callquarter earnings callquarter earnings callquarter earnings call End of July 2017
EFG MENA & Frontier conference, London Early September
Arqaam Investors conference,Arqaam Investors conference,Arqaam Investors conference,Arqaam Investors conference, Abu Dhabi 18 – 19 September 2017
Third quarter earnings callThird quarter earnings callThird quarter earnings callThird quarter earnings call End of October 2017
BAMLBAMLBAMLBAML MENA conference, MENA conference, MENA conference, MENA conference, Dubai 15 – 16 November 2017
YearYearYearYear end earnings callend earnings callend earnings callend earnings call End of January 2018

Tabreed – 2017 Investor Presentation34
APPENDICES
34

Tabreed – 2017 Investor Presentation35
Stable core business model delivering consistent performance
Capacity (fixed) Consumption
(variable)
Total
Revenue, net of amortization 64 36 100
Utility Costs - (32) (32)
Plant operation & maintenance (9) - (9)
Depreciation (11) - (11)
Gross Profit 44 4 48
Corporate overheads (16) - (16)
Profit from Operations 28 4 32
Add back: depreciation & amortisation 16 - 16
EBITDA 44 4 48
68% 12% 48%
Profit Statement (% of revenue) – based on 2016 results
64% of the revenue is
fixed
Stable and predictable earnings - 91% of EBITDA arises from capacity charges
• Tabreed bills customers for capacity (fixed) charges and consumption (variable) charges
• Capacity charges reflect the cooling capacity (in RT) reserved for the customer and are
generally fixed, subject to escalation based on country CPI every year
• Consumption charges recover the cost of cooling consumed. Contractually, any change in
variable cost is generally passed through to the customers
• Tabreed’s EBITDA is driven by capacity charges allowing recovery of plant operation cost,
corporate overheads and providing a strong return on capital invested
Billing structure and profitability
36%64%
ConsumptionCapacity
61%39%
9%91%
Only 39% of the cost is
against fixed revenue,
rest is passed through
Hence, 91% of the
EBITDA is from capacity
revenue
Tabreed – 2017 Investor Presentation36
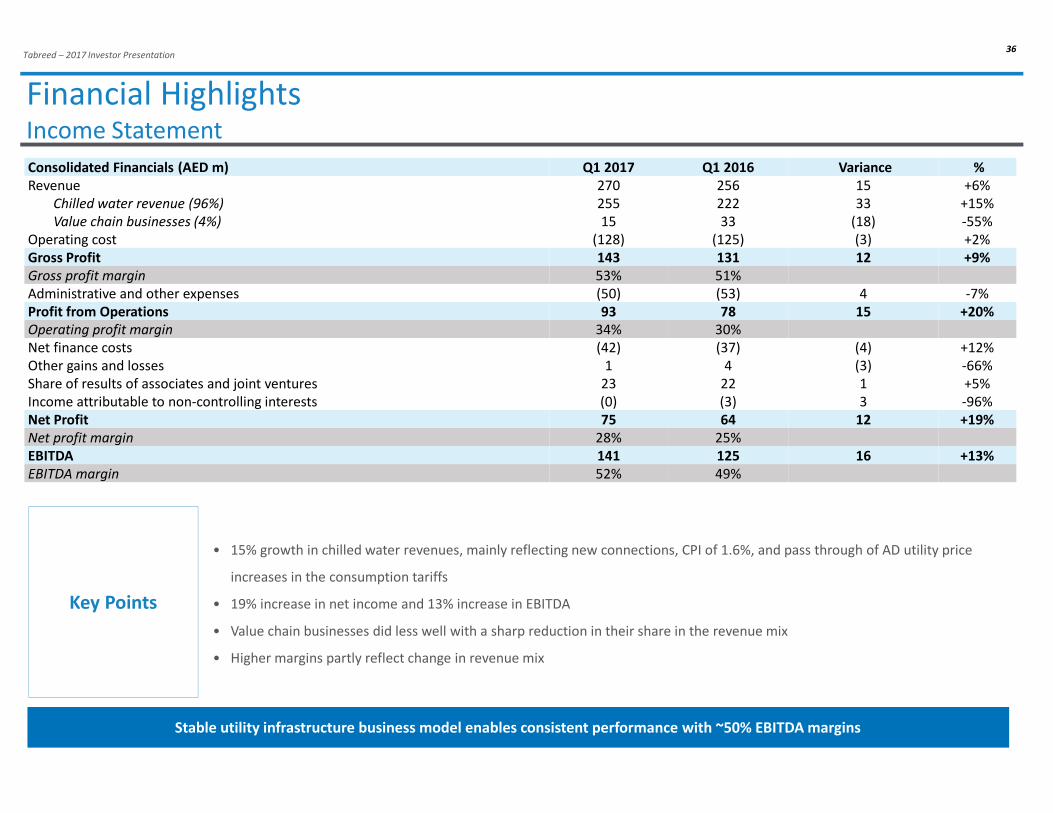
Financial HighlightsIncome Statement
Key Points
• 15% growth in chilled water revenues, mainly reflecting new connections, CPI of 1.6%, and pass through of AD utility price
increases in the consumption tariffs
• 19% increase in net income and 13% increase in EBITDA
• Value chain businesses did less well with a sharp reduction in their share in the revenue mix
• Higher margins partly reflect change in revenue mix
Stable utility infrastructure business model enables consistent performance with ~50% EBITDA margins
Consolidated Financials (AED m) Q1 2017 Q1 2016 Variance %
Revenue 270 256 15 +6%
Chilled water revenue (96%) 255 222 33 +15%
Value chain businesses (4%) 15 33 (18) -55%
Operating cost (128) (125) (3) +2%
Gross Profit 143 131 12 +9%
Gross profit margin 53% 51%
Administrative and other expenses (50) (53) 4 -7%
Profit from Operations 93 78 15 +20%
Operating profit margin 34% 30%
Net finance costs (42) (37) (4) +12%
Other gains and losses 1 4 (3) -66%
Share of results of associates and joint ventures 23 22 1 +5%
Income attributable to non-controlling interests (0) (3) 3 -96%
Net Profit 75 64 12 +19%
Net profit margin 28% 25%
EBITDA 141 125 16 +13%
EBITDA margin 52% 49%

Tabreed – 2017 Investor Presentation37
Financial HighlightsFinancial Position
Key Points
• Accounts receivables have increased due to short-term timing delays in customer collections
• Reduction in cash primarily reflects payment made to ICT to complete acquisition of Nation Towers plant
• Increase in liability balances reflect recording of 2017 dividend of 6.5 fils
Balance sheet continues to show strength and positions Tabreed to finance further growth
Consolidated Financials (AED m) 2017 2016 Variance %
Fixed Assets 6,954 6,977 (22) -0%
Associates and Joint Ventures 836 826 10 +1%
Accounts Receivable 478 409 69 +17%
Cash and Short Term Deposits 258 390 (132) -34%
Other Assets 62 60 2 +4%
Total Assets 8,588 8,661 (73) -1%
Equity and Reserves 2,566 2,666 (100) -4%
Mandatory Convertible Bonds – equity portion 1,773 1,773 - +0%
Debt 3,383 3,424 (41) -1%
Other Liabilities 867 799 68 +9%
Total Liabilities and Equity 8,588 8,661 (73) -1%