3155 Windsor Park Road - Regina, SK S4V 3B1 Phone: 306-352 ...

2017 Road Safety Report
May 22, 2018
Office of the City Engineer
Operations Department
Transportation Planning Division

2017 Road Safety Report – City of Windsor
Page | ii
Table of Contents
1 Introduction .............................................................................................................. 1
1.1 Background ........................................................................................................ 1
1.2 Limitations and Disclaimer ................................................................................. 1
1.3 Population Projections ....................................................................................... 1
1.4 Road Network Changes ..................................................................................... 2
2 Trends in City of Windsor Collision Data .................................................................. 3
2.1 Injuries and Fatalities per Capita ........................................................................ 4
2.2 Annual and Daily Variation ................................................................................. 6
2.2.1 Annual Variation by Month ........................................................................... 6
2.2.2 Daily Variation by Hour ................................................................................ 7
2.3 Characteristics of Collisions ............................................................................... 8
2.3.1 Impact Type ................................................................................................. 8
3 Areas of Special Focus .......................................................................................... 10
3.1 Alcohol Involvement ......................................................................................... 10
3.2 Inattentive Drivers ............................................................................................ 11
4 Fatal and Major Injury Collisions ............................................................................ 13
4.1 Involved Persons .............................................................................................. 13
4.2 Locations .......................................................................................................... 15
5 Drivers .................................................................................................................... 15
5.1 Driver Actions ................................................................................................... 15
5.2 Condition of Drivers .......................................................................................... 17
6 Cyclists ................................................................................................................... 18
6.1 Note – Data Limitations .................................................................................... 18
6.2 General ............................................................................................................ 19
6.3 Cyclist Actions .................................................................................................. 19
6.4 Drivers’ Actions in Cyclist Collisions ................................................................. 20
6.5 Locations of Cyclist Collisions .......................................................................... 22
6.6 Helmet Use ...................................................................................................... 24

2017 Road Safety Report – City of Windsor
Page | iii
7 Pedestrians ............................................................................................................ 25
7.1 Note – Data Limitations .................................................................................... 25
7.2 General ............................................................................................................ 25
7.3 Pedestrian Actions ........................................................................................... 26
7.4 Drivers’ Actions in Pedestrian Collisions .......................................................... 27
7.5 Location of Pedestrian Collisions ..................................................................... 29
7.6 Pedestrian Condition ........................................................................................ 31
7.7 Lighting Condition ............................................................................................ 32
7.8 Type of Traffic Control ...................................................................................... 33
8 Environment ........................................................................................................... 34
8.1 Weather and Light Conditions .......................................................................... 34
8.2 Road Surface ................................................................................................... 36
8.3 Winter Weather Collisions ................................................................................ 37
8.4 Pavement Markings ......................................................................................... 38
8.5 Road Characteristics ........................................................................................ 38
8.6 Traffic Control Condition .................................................................................. 40
9 Location ................................................................................................................. 42
9.1 General ............................................................................................................ 42
9.2 Intersection....................................................................................................... 43
9.2.1 Signalized .................................................................................................. 43
9.2.2 Unsignalized .............................................................................................. 44
9.3 Mid-Block ......................................................................................................... 45
10 Conclusions ......................................................................................................... 47
11 Consultations ....................................................................................................... 51
12 Works Cited ......................................................................................................... 51

2017 Road Safety Report – City of Windsor
Page | iv
List of Tables
Table 1: City of Windsor Population Estimates ............................................................... 2
Table 2: Number of Collisions by Year – City-wide ......................................................... 4
Table 3: Injury and Fatality Rates Relative to Population ................................................ 5
Table 4: 2017 Collisions by Month .................................................................................. 6
Table 5: 2017 Collisions by Hour of Day ......................................................................... 7
Table 6: 2017 Collisions by Impact Type ......................................................................... 9
Table 7: Alcohol-Related Collisions by Year ................................................................. 10
Table 8: Inattentive-Related Collisions by Year ............................................................. 12
Table 9: Fatalities and Major Injuries by Year and Victim Type ..................................... 13
Table 10: Locations with 2 or More Major Injury or Fatality Collisions (2013-2017) –
Intersections .................................................................................................................. 15
Table 11: Locations with 2 or More Major Injury or Fatality Collisions (2013-2017) –
Midblocks ...................................................................................................................... 15
Table 12: 2017 Drivers in Collisions by Driver Action .................................................... 16
Table 13: 2017 Drivers in Collisions by Condition ......................................................... 18
Table 14: 2017 Cyclist Collisions .................................................................................. 19
Table 15: 2017 Cyclist Collisions by Cyclist Action ....................................................... 20
Table 16: 2017 Cyclist Collisions by Driver Action ........................................................ 21
Table 17: 2017 Cyclist Collisions by Location Type ...................................................... 22
Table 18: 2013-2017 Cycling Collision Locations - Intersections .................................. 23
Table 19: 2013-2017 Cycling Collision Locations - Intersections .................................. 23
Table 20: 2017 Cyclist Safety Equipment Usage .......................................................... 24
Table 21: 2017 Pedestrian Collisions ............................................................................ 25
Table 22: 2017 Pedestrian Collisions by Pedestrian Action .......................................... 26
Table 23: 2017 Pedestrian Collisions by Driver Action .................................................. 28
Table 24: 2017 Pedestrian Collisions by Location Type ................................................ 29
Table 25: 2013-2017 Pedestrian Collision Locations - Intersections ............................. 30
Table 26: 2013-2017 Pedestrian Collision Locations - Midblocks ................................. 30
Table 27: 2017 Pedestrian Collisions by Pedestrian Condition ..................................... 31
Table 28: 2017 Pedestrian Collisions by Lighting Condition .......................................... 32
Table 29: 2017 Pedestrian Collisions by Traffic Control Type ....................................... 33
Table 30: 2017 Collisions by Environmental Condition ................................................. 34
Table 31: 2017 Collisons by Lighting Condition ............................................................ 35
Table 32: 2017 Collisions by Road Surface Condition .................................................. 36
Table 33: Winter Weather Collisions by Year ................................................................ 37
Table 34: 2017 Collisons by Pavement Marking Condition ........................................... 38
Table 35: 2017 Collisions by Road Character ............................................................... 39
Table 36: 2017 Collisions by Traffic Control Condition .................................................. 40
Table 37: 2017 Collisions by Location Type .................................................................. 42

2017 Road Safety Report – City of Windsor
Page | v
Table 38: 2013-2017 Collision Locations - Signalized Intersections ............................. 43
Table 39: 2013-2017 Collision Locations - Unsignalized Intersections ......................... 44
Table 40: 2013-2017 Collision Locations - Midblocks ................................................... 45
Table 41: Key Statistics with Comparisons to 5-Year Averages .................................... 47
Table 42: Summary - City of Windsor vs. Province of Ontario ...................................... 49
Table 43: High Collision Locations ................................................................................ 50
List of Figures
Figure 1: Number of Collisions by Year – City-wide ........................................................ 3
Figure 2: Injury and Fatality Rates Relative to Population ............................................... 5
Figure 3: 2017 Collisions by Month ................................................................................. 6
Figure 4: 2017 Collisions by Hour of Day ........................................................................ 8
Figure 5: 2017 Collisions by Impact Type ....................................................................... 9
Figure 6: Alcohol-Related Collisions by Year ................................................................ 11
Figure 7: Inattentive-Related Collisions by Year ........................................................... 12
Figure 8: Fatalities and Major Injuries by Year and Victim Type ................................... 14
Figure 9: 2017 Fatalities and Serious Injuries ............................................................... 14
Figure 10: 2017 Drivers in Collisions by Action Type .................................................... 17
Figure 11: 2017 Drivers in Collisions by Condition ........................................................ 18
Figure 12: 2017 Cyclist Collisions by Cyclist Action ...................................................... 20
Figure 13: 2017 Cyclist Collisions by Driver Action ....................................................... 21
Figure 14: 2017 Cyclist Collisions by Location Type ..................................................... 22
Figure 15: 2017 Cyclist Safety Equipment Usage ......................................................... 24
Figure 16: Reported Helmet Usage by Year ................................................................. 25
Figure 17: 2017 Pedestrian Collisions by Pedestrian Action ......................................... 27
Figure 18: 2017 Pedestrian Collisions by Driver Action................................................. 28
Figure 19: 2017 Pedestrian Collisions by Location Type............................................... 29
Figure 20: 2017 Pedestrian Collisions by Pedestrian Condition .................................... 31
Figure 21: 2017 Pedestrian Collisions by Lighting Condition ........................................ 32
Figure 22: 2017 Pedestrian Collisions by Traffic Control Type ...................................... 33
Figure 23: 2017 Collisions by Environmental Condition ................................................ 34
Figure 24: 2017 Collisons by Lighting Condition ........................................................... 35
Figure 25: 2017 Collisions by Road Surface Condition ................................................. 36
Figure 26: 2017 Collisions by Pavement Marking Condition ......................................... 38
Figure 27: 2017 Collisions by Road Character .............................................................. 39
Figure 28: 2017 Collisions by Traffic Control Condition................................................. 41
Figure 29: 2017 Collisions by Location Type ................................................................. 42

2017 Road Safety Report – City of Windsor
Page | vi
Executive Summary
This report provides statistical data on all reported collisions on roads under the
jurisdiction of the City of Windsor for the 2017 calendar year. The intent of this report is
to provide factual information to agencies and individuals involved in road safety in the
City in order to provide a sound basis for road-safety related decisions, as well as to
provide a source of data to allow the evaluation of the performance of ongoing safety-
related programs, policies, and strategies.
Comparisons with provincial averages are given in cases where provincial statistics are
available.
This report reflects only reported collisions on City of Windsor roads. Unreported
collisions, collisions on roads under the jurisdiction of other agencies (e.g. provincial
highways) and collisions on private property are not included.
Overall Trends
In 2017, there were a total of 4,464 reported collisions on roads under the jurisdiction of
the City of Windsor, consisting of 5 fatal collisions, 1,412 injury collisions, and 3,047
property damage only collisions. The overall number of collisions on City of Windsor roads
for 2017 compared with recent years is shown in Table E-1 and Figure E-1.
Collision record-keeping procedures changed beginning with the 2006 calendar year. As
a result of these changes, collision database records from 2005 and earlier are not directly
comparable with records from 2006 and later. Because of this, yearly totals are given
beginning with 2006.
Table E-1: Number of Collisions by Year – City-wide
Year
Collisions
Fatality Injury Property
Damage Only Total
2006 6 1,015 3,339 4,360
2007 4 860 3,598 4,462
2008 7 846 3,344 4,197
2009 3 809 2,760 3,572
2010 2 963 2,922 3,887
2011 3 825 2,802 3,630
2012 7 889 2,738 3,634
2013 4 928 2,860 3,792
2014 2 904 2,996 3,902
2015 6 1,162 3,105 4,273
2016 3 1,272 2,939 4,214
2017 5 1,412 3,047 4,464

2017 Road Safety Report – City of Windsor
Page | vii
Figure E-1: Number of Collisions by Year – City-wide
Year-over-year, the total number of collisions increased by 5.9% from 2016 to 2017. The
number of injury and fatality collisions increased by 11.1% over the same period.
Areas of Special Focus
Alcohol Involvement
For 2017, alcohol was found to be involved in 2.17% of collisions, as shown in Figure E-
2. This percentage is slightly below the 5-year City of Windsor average of 2.28% and
significantly below historical percentages.
In 2017, 40% of fatal collisions in the City of Windsor (2 collisions) involved drivers with
alcohol-related driver conditions. On average, alcohol was involved in 40% percent of
fatal collisions in the five-year period of 2013 through 2017.
These results suggest that the overall number of drivers with alcohol-related conditions is
relatively small and continues to decline, but these drivers are significantly over-
represented in fatal collisions.
0
500
1000
1500
2000
2500
3000
3500
4000
4500
5000
2006 2007 2008 2009 2010 2011 2012 2013 2014 2015 2016 2017
Co
llisi
on
s p
er
Ye
ar
YearInjury & Fatality Property Damage Only Total - All Severities

2017 Road Safety Report – City of Windsor
Page | viii
Figure E-2: Alcohol-Related Collisions by Year
Inattentive Driving
In 2017, 15.3% of all City of Windsor collisions involved drivers reported as “inattentive”,
as shown in Figure E-3. This represents a major decrease from historical levels but an
increase over 2015-2016 levels. Readers are cautioned that the following factors affect
the data for inattentive driving:
In early 2013, the criteria for determining when to classify a driver as inattentive
were made stricter.
Driver inattention in collisions is likely under-reported, since drivers are unlikely to
self-report that they were engaged in illegal cell phone use, texting, or other
distracting activities at the time of the crash.
0.00%
0.50%
1.00%
1.50%
2.00%
2.50%
3.00%
3.50%
4.00%
2006 2007 2008 2009 2010 2011 2012 2013 2014 2015 2016 2017
Pe
rce
nt
of
Co
llisi
on
s In
volv
ing
Alc
oh
ol
Year

2017 Road Safety Report – City of Windsor
Page | ix
Figure E-2: Inattentive-Related Collisions by Year
Severe Collisions
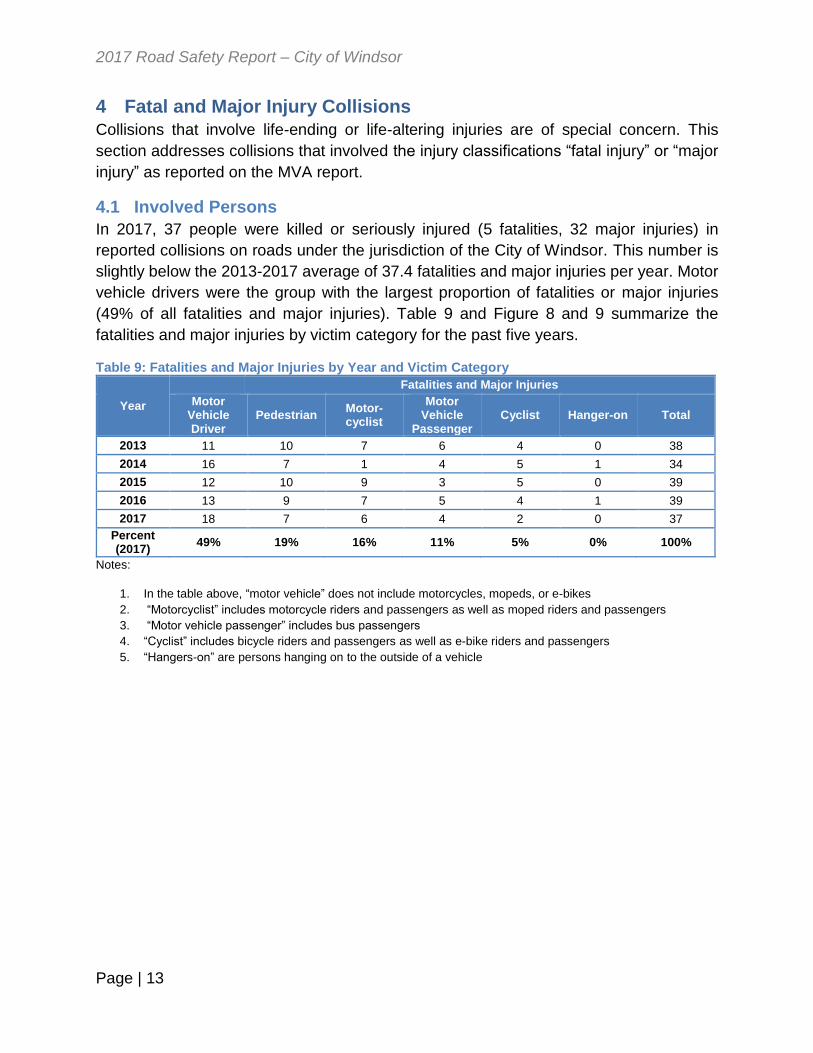
In 2017, 37 people were killed or seriously injured (5 fatalities, 32 major injuries) in
reported collisions on roads under the jurisdiction of the City of Windsor. This number is
slightly below the 2013-2017 average of 37.4 fatalities and serious injuries per year. Motor
vehicle drivers were the group with the largest proportion of fatalities or serious injuries
(49% of all fatalities and serious injuries), as shown in Figure E-2 (note: in the figure,
“motor vehicle” does not include motorcycles, mopeds, or e-bikes).
Figure E-2: 2017 Fatalities and Major Injuries by Victim Category
0.0%
5.0%
10.0%
15.0%
20.0%
25.0%
30.0%
35.0%
40.0%
45.0%
2006 2007 2008 2009 2010 2010 2012 2013 2014 2015 2016 2017
Pe
rce
nt
of
Co
llisi
on
s In
volv
ing
Inat
ten
tive
Dri
vers
Year
Motor Vehicle Driver49%
Pedestrian 19%
Motorcyclist 16%
Motor Vehicle Passenger 11% Cyclist
5%
Hanger-on 0%

2017 Road Safety Report – City of Windsor
Page | x
High Collision Locations
Based on a five-year collision history (2013 through 2017), mid-block sections and
signalized intersections were ranked based on collision rate and unsignalized
intersections were ranked based on total number of collisions. The 25 locations with the
highest ranking for each category are listed in Table E-2 for signalized intersections,
Table E-3 for unsignalized intersections, and Table E-4 for mid-block locations.
Table E-2: 2013-2017 Collision Locations - Signalized Intersections
CompKey Intersection Collisions
2013-2017
Annual Average
Daily Traffic - All Legs [vehicles per day]
Collisions per Million Vehicles Entering
Intersection
Rank
289476 County Road 42 @ Lauzon Pky 87 47,500 2.01 1
286972 Wyandotte St W @ Pelissier St 58 43,100 1.47 2
289240 Lauzon Pky @ Tecumseh Rd E 147 119,700 1.35 3
289253 Tecumseh Rd E @ Forest Glade Dr 72 59,700 1.32 4
297610 E C Row Expy W/B @ Banwell Rd 131 111,800 1.28 5
289026 Lauzon Rd @ Lauzon Line (W) & McHugh St (E)
34 29,200 1.28 6
288383 Grand Marais Rd E @ Central Ave & Plymouth Dr
93 80,600 1.26 7
286694 Tecumseh Rd E @ Howard Ave 113 98,000 1.26 8
284919 Huron Church Rd @ University Ave W 25 22,100 1.24 9
285400 Northwood St @ Dominion Blvd 55 49,000 1.23 10
285994 Provincial Rd @ Walker Rd 96 85,900 1.22 11
288691 Central Ave @ E C Row Collector South & E C Row E/B On Ramp
71 64,300 1.21 12
289247 Lauzon Pky @ South Service Rd E (W) & Twin Oaks Dr (E)
48 46,100 1.14 13
286931 Park St W @ Pelissier St 11 10,600 1.14 14
287465 Tecumseh Rd E @ Walker Rd 114 112,700 1.11 15
289145 McHugh St @ Banwell Rd & McNorton St 37 36,600 1.11 16
288803 Wyandotte St E @ Lauzon Rd 56 55,700 1.10 17
289245 Lauzon Pky @ Forest Glade Dr 88 88,100 1.09 18
286691 Tecumseh Rd E @ McDougall St 67 67,200 1.09 19
288674 Temple Dr @ Central Ave & North Service Rd E
81 82,900 1.07 20
284934 Huron Church Rd @ College Ave 98 101,300 1.06 21
286980 Wyandotte St E @ McDougall St 54 56,400 1.05 22
285166 College Ave @ Campbell Ave 31 32,500 1.05 23
287843 Seminole St @ Walker Rd 58 61,200 1.04 24
285490 Labelle St @ Dominion Blvd 47 49,600 1.04 25 Average – all signalized intersections
0.56

2017 Road Safety Report – City of Windsor
Page | xi
Table E-3: 2013-2017 Collision Locations - Unsignalized Intersections
CompKey Intersection Collisions 2013-2017
Rank
286606 Ouellette Pl @ Dougall Ave 71 1
287346 Riverside Dr E @ Devonshire Rd 28 2
285645 Norfolk St @ Dominion Blvd 27 3
286985 Wyandotte St E @ Marentette Ave 26 4
286261 Dougall Ave @ E C Row E/B Off Ramp 25 5
286987 Wyandotte St E @ Langlois Ave 23 6
287104 Erie St E @ Parent Ave 23 6
286274 Beals St W @ Dougall Ave 22 8
288404 South National St @ Jefferson St 22 8
287324 Hanna St W @ Ouellette Ave & Hanna St E 21 10
286513 Lappan Ave @ Walker Rd 20 11
289474 County Road 42 @ 9th Con Rd 20 11
284762 Sandwich @ Riverside Dr & University Ave W & Rosedale Ave 19 13
286316 Howard Ave @ South Cameron Blvd 19 13
287328 Hanna St E @ McDougall St 19 13
285412 Dougall Ave @ South Cameron Blvd 18 16
286984 Wyandotte St E @ Louis Ave 18 16
287464 Tecumseh Rd E @ Turner Rd 18 16
285262 Tecumseh Rd W @ McKay Ave 17 19
287306 Shepherd St E @ Parent Ave 17 19
289241 Lauzon Pky @ Enterprise Way 17 19
285627 West Grand Blvd @ Bruce Ave 16 22
286343 E C Row Ave E @ Conservation Dr 16 22
286588 Ouellette Ave @ Hildegarde St - West 16 22
284905 Detroit St @ Peter St 15 25
285073 Riverside Dr W @ Campbell Ave 15 25
285923 Division Rd @ Riberdy Rd 15 25
286693 Tecumseh Rd E @ Highland Ave 15 25
286981 Wyandotte St E @ Mercer St 15 25
287259 Ellis St E @ McDougall St 15 25
288086 Tecumseh Rd E @ Chandler Rd 15 25
288672 Essex Way @ Quality Way 15 25
289259 Lauzon Rd @ Hawthorne Dr 15 25

2017 Road Safety Report – City of Windsor
Page | xii
Table E-4: 2013-2017 Collision Locations - Midblocks
CompKey Street Name From To
Co
llis
ion
s 2
01
3-2
017
An
nu
al
Ave
rag
e D
ail
y T
raff
ic
[veh
icle
s p
er
day]
Len
gth
[m
]
Co
llis
ion
s p
er
mil
lio
n v
eh
icle
-
km
Ran
k
166826 Pitt St W Bruce Ave Janette Ave 1 350 103 15.21 1
165251 Pelissier St Maiden Lane W Wyandotte St W 7 2,400 126 12.65 2
163876 Chatham St E Ouellette Ave Goyeau St 7 2,100 175 10.44 3
127450 Pelissier St Wyandotte St W Elliott St W 13 2,400 286 10.39 4
128050 Victoria Ave Park St W Wyandotte St W 14 2,500 307 9.98 5
165249 Pelissier St University Ave W Park St W 5 2,100 143 9.14 6
167723 Chatham St W Bruce Ave Janette Ave 1 600 100 9.10 7
165224 Janette Ave University Ave W Park St W 4 1,700 145 8.92 8
127447 Pelissier St Elliott St W Erie St W 7 1,900 236 8.55 9
127007 Lincoln Rd Riverside Dr E Assumption St 4 1,100 247 8.06 10
166921 Parent Ave Brant St Wyandotte St E 4 2,550 111 7.74 11
166919 Parent Ave Assumption St Brant St 4 2,550 112 7.67 12
127496 Pitt St W Ouellette Ave Ferry St 4 2,100 136 7.66 13
126588 Glengarry Ave Wyandotte St E Tuscarora St 6 4,400 112 6.69 14
126576 Gladstone Ave Riverside Dr E Assumption St 2 700 242 6.46 15
127494 Pitt St E Ouellette Ave Goyeau St 5 2,600 169 6.25 16
165250 Pelissier St Park St W Maiden Lane W 4 2,250 168 5.79 17
164144 George Ave Reginald St Alice St 11 4,300 245 5.73 18
163869 Bruce Ave University Ave W Park St W 4 2,700 143 5.68 19
126581 Gladstone Ave Ottawa St Ellis St E 3 1,400 208 5.64 20
127408 Parent Ave Niagara St Erie St E 10 4,500 220 5.53 21
126506 Florence Ave Menard St Paulina Crt 2 980 206 5.43 22
166649 Erie St E Pierre Ave Hall Ave 5 4,950 103 5.38 23
127407 Parent Ave Wyandotte St E Tuscarora St 4 3,600 113 5.37 24
165241 Victoria Ave University Ave W Park St W 4 2,900 143 5.28 25
Average Mid-block Collision Rates by Road Classification
Scenic Parkway 0.43
Collector 1.06
Arterial 0.85
Expressway 0.49
Notes: 1. Local streets, streets without volume information, and very short (<100 m) road sections are not included in this table.

2017 Road Safety Report – City of Windsor
Page | xiii
Summary of Key Statistics
The key findings of the report are summarized in Table E-5 below. Up and down arrows
indicate an increase or decrease, respectively, from the 2013 through 2017 five-year
average. The colour of the arrow is green if the 2017 value is better than the five-year
average, red if worse, and black if close in value (less than 5% difference) or is not clearly
favourable or unfavourable.
Table E-5: Key Statistics with Comparisons to 5-Year Averages
Category Measure
City of Windsor
5-Year Average
Percentage Difference
2017
Overall Collisions
Total Collisions – All Severities 4,129 +8%
4,464
Injury Collisions [Note 2]
Total Injury Collisions 1,136 +24%
1,412
Total Persons Injured 1,514 +25%
1,890
Persons Injured per 1,000 population [Note 1] 6.98
+24% 8.64
Fatal Collisions
Total Fatal Collisions 4.0 +25%
5
Total Fatalities 4.0 +25%
5
Fatalities per 100,000 population [Note 1] 1.84 +24%
2.29
Alcohol
Total Alcohol-Related Collisions 94 +3%
97
% of Collisions Involving Alcohol 2.28% -5%
2.17%
% of Drivers with Alcohol-Related Driver Conditions [Note 1] 0.96%
-29% 0.68%
Fatal Collisions with Alcohol-Related Driver Conditions 1.6
+25% 2

2017 Road Safety Report – City of Windsor
Page | xiv
Category Measure
City of Windsor
5-Year Average
Percentage Difference
2017
% of Fatal Collisions Involving Alcohol 40% +0%
40%
Driver Inattention
Total Inattentive Drivers in Collisions 552 +25%
689
% of Collisions Involving Inattention 13.1% +17%
15.3%
% of Drivers Reported as Inattentive [Note 1] 6.1% +16%
7.1%
Driver Actions
% of Drivers Reported as Driving Properly [Note 1] 43%
+0% 43%
Most Common Improper Action (where known) [Note 1]
Following Too Close
Following Too Close
Driver Condition
% of Drivers Reported as Normal Condition [Note 1] 72%
-2% 71%
Cyclist Collisions
Total Cyclist Collisions (All Severities) 85.4
-23% 66
Total Cyclist Injury Collisions 70.4 -25%
53
Total Cyclist Fatal Collisions 0.2 -100%
0
% of Cyclists Reported as Riding Properly 43% +9%
47%
% of Cyclists Wearing Helmets (where known) 18%
+11% 20%
Most Common Improper Action – Cyclist (where known)
Failed to Yield Right-
of-Way
Failed to Yield
Right-of-Way

2017 Road Safety Report – City of Windsor
Page | xv
Category Measure
City of Windsor
5-Year Average
Percentage Difference
2017
Most Common Improper Action – Driver (where known)
Failed to Yield Right-
of-Way
Failed to Yield
Right-of-Way
Pedestrian Collisions
Total Pedestrian Collisions (All Severities) 85
+5% 89
Total Pedestrian Injury Collisions 80 +3%
82
Total Pedestrian Fatal Collisions 1.2 -20%
1
Most Common Improper Action – Driver Failed to
Yield Right-of-Way
Failed to Yield
Right-of-Way
Notes: 1. Comparison with Provincial statistics available – see Table E-6. 2. Police reporting practices for motor vehicle collision injuries changed in 2014.
Readers should exercise caution in comparing injury statistics from before this date to statistics after this date.
Comparison – City of Windsor vs. Other Jurisdictions
Table E-6 gives a summary of the performance of the City of Windsor compared to the
Province of Ontario for measures where provincial statistics were available. Up, down,
and horizontal arrows indicate that the City of Windsor value is higher than, lower than,
or within 5% of the overall value for the Province of Ontario, and the arrow is coloured
green or red, respectively, if Windsor compares favourably or unfavourably with the
Province overall; a black arrow indicates that the measure is either close in value or is not
clearly favourable or unfavourable. The most recent year of statistics available for Ontario
is 2014; five-year provincial averages were based on 2009 through 2014.
Table E-6: Summary – City of Windsor vs. Province of Ontario

2017 Road Safety Report – City of Windsor
Page | xvi
Category Measure
Province of Ontario 5-year
Average
Windsor vs. Ontario
City of Windsor 5-
year Average
Injury Collisions
Persons injured per 1,000 population 3.99
+75% 6.98
Fatal Collisions
Fatalities per 100,000 population 4.49
-59% 1.84
Inattentive Drivers
% of drivers reported as inattentive 13.1%
-47% 6.1%
Alcohol % of drivers with alcohol-related driver conditions
1.50% -36%
0.96%
Driver Actions % of drivers reported as driving properly 49%
-12% 43%
Most common improper action (where known)
Following Too Close
Following Too
Close
Driver Condition
% of drivers reported as normal condition 75%
-4% 72%

2017 Road Safety Report – City of Windsor
Page | 1
1 Introduction
1.1 Background
This annual report provides statistical data on all reported collisions on roads under the
jurisdiction of the City of Windsor. The intent of this report is to provide factual information
to agencies and individuals involved in road safety in the City in order to provide a sound
basis for road-safety related decisions, as well as to provide a source of data to allow the
evaluation of the performance of ongoing safety-related programs, policies, and
strategies.
1.2 Limitations and Disclaimer
This report is based on collision data provided by the Windsor Police Service from MVA
(motor vehicle accident) reports. For this reason, the analysis and conclusions in this
report are based on reported collisions only, including both self-reported collisions and
collisions investigated by police at the scene. Unreported collisions are not reflected
in the analysis.
This report examines only collisions on roads under the jurisdiction of the City of Windsor.
Collisions on roads under provincial jurisdiction (e.g. King’s Highways) or privately-owned
roads (e.g. the Ambassador Bridge) have not been examined for this report.
As this report reflects only collision data provided by the Windsor Police Service, it does
not include collisions that were investigated by or reported to other police services (e.g.
collisions on boundary roads where LaSalle Police or the Ontario Provincial Police
responded).
“Traffic collisions frequently involve complex interactions between human
behaviour, vehicle characteristics, and environmental conditions. The factor or
factors responsible for causing a collision are not always the most obvious nor
are they always readily apparent. Caution should be exercised in drawing
conclusions from the statistics presented in this report and conclusions should
be drawn only with appropriate qualifications and supportive information.”
(Regional Municipality of Waterloo, 2012)
1.3 Population Projections
A number of statistics in this report are given on a per capita (or per 1,000 or 100,000
population) basis. To translate numbers of collisions, injuries, fatalities, etc. to per capita
values, an estimate of the City of Windsor population is required.

2017 Road Safety Report – City of Windsor
Page | 2
Population estimates were provided by the City of Windsor Planning Department. The
population values used for the remainder of this report are given in Table 1.
Table 1: City of Windsor Population Estimates
Year Population Source
2006 216,473 Census
2007 215,357 Estimate
2008 214,240 Estimate
2009 213,124 Estimate
2010 212,007 Estimate
2011 210,891 Census
2012 214,024 Estimate
2013 214,895 Estimate
2014 215,819 Estimate
2015 216,768 Estimate
2016 217,716 Estimate
2017 218,645 Estimate
1.4 Road Network Changes
In December 2010, a number of road sections (primarily along Huron Church Road and
the E. C. Row Expressway) were transferred from the City of Windsor to the Province of
Ontario.
As noted in Section 1.2, this report considers only collisions on roads under the jurisdiction
of the City of Windsor. With the transfer of these road sections to the Province, these road
sections are reflected in statistics for years through 2010, but not in statistics given in this
report for 2011 and beyond.
The effect of this change on overall statistics given is considered minor; there were 42
collisions on these transferred sections in 2013, which represent 1.1% of the total number
of collisions in that year.

2017 Road Safety Report – City of Windsor
Page | 3
2 Trends in City of Windsor Collision Data
From 2016 to 2017, the total number of collisions increased by 5.9%, which is greater
than the 5-year trend from 2013 through 2017 of a 3.5% increase per year, on average.
The total number of injury and fatality collisions increased by 11.1% from 2016 to 2017,
which was greater than the 5-year trend of a 10.4% increase per year, on average. As
can be seen in Figure 1, both the number of injury collisions and the number of total
collisions have been increasing steadily since approximately 2014.
Figure 1: Number of Collisions by Year – City-wide
0
500
1000
1500
2000
2500
3000
3500
4000
4500
5000
2006 2007 2008 2009 2010 2011 2012 2013 2014 2015 2016 2017
Co
llisi
on
s p
er
Ye
ar
YearInjury & Fatality Property Damage Only Total - All Severities

2017 Road Safety Report – City of Windsor
Page | 4
Table 2: Number of Collisions by Year – City-wide
Year
Collisions
Fatality Injury Property
Damage Only Total
2006 6 1,015 3,339 4,360
2007 4 860 3,598 4,462
2008 7 846 3,344 4,197
2009 3 809 2,760 3,572
2010 2 963 2,922 3,887
2011 3 825 2,802 3,630
2012 7 889 2,738 3,634
2013 4 928 2,860 3,792
2014 2 904 2,996 3,902
2015 6 1,162 3,105 4,273
2016 3 1,272 2,939 4,214
2017 5 1,412 3,047 4,464
Overall, the number of collisions in 2017 was significantly below the peak occurring in
1994, the worst year recorded in City of Windsor annual collision reports (22 fatal, 1,303
injury, 4,090 PDO, 8,578 total). (City of Windsor, 2005)
Starting in late 2014, a provincially-mandated change in Windsor Police Service collision
reporting practices meant that some collisions that would have previously been classified
as “property damage only” were classified as injury collisions (with the injury or injuries
classified as “minimal”). This change is likely responsible for some of the increase in injury
collisions between 2014 and 2015. Because of this change in practices, caution should
be exercised when comparing collision statistics from 2014 and earlier with statistics from
2015 and later. The change did not affect the total number of reported collisions.
2.1 Injuries and Fatalities per Capita
Rates for collision injuries and fatalities relative to the City of Windsor population are given
in Table 13 and shown graphically in Figure 2.

2017 Road Safety Report – City of Windsor
Page | 5
Table 3: Injury and Fatality Rates Relative to Population
Year Population Total
Collisions Persons Injured
Persons Injured per
1000 population
Fatalities Fatalities
per 100,000 population
2006 216,473 4,360 1,382 6.38 6 2.77
2007 216,473 4,462 1,128 5.21 6 2.77
2008 216,473 4,197 1,123 5.19 6 2.77
2009 216,473 3,572 1,066 4.92 3 1.39
2010 216,473 3,887 1,209 5.58 2 0.92
2011 216,473 3,630 1,022 4.72 3 1.39
2012 214,024 3,634 1,149 5.37 7 3.27
2013 214,895 3,792 1,207 5.62 4 1.86
2014 215,819 3,902 1,190 5.51 2 0.93
2015 216,768 4,273 1,590 7.34 6 2.77
2016 217,716 4,214 1,695 7.79 3 1.38
2017 218,645 4,464 1,890 8.64 5 2.29
5-year average – 2013 to 2017 6.98 1.84
Figure 2: Injury and Fatality Rates Relative to Population
-
1.00
2.00
3.00
4.00
5.00
6.00
7.00
8.00
9.00
10.00
2006 2007 2008 2009 2010 2011 2012 2013 2014 2015 2016 2017
Inju
ry o
r Fa
talit
y R
ate
Year
Injuries per 1,000 Fatalities per 100,000

2017 Road Safety Report – City of Windsor
Page | 6
2.2 Annual and Daily Variation
2.2.1 Annual Variation by Month
The variation in collisions over the year is summarized in Table 4 and illustrated in Figure
3. In general, the collision rate was higher than average in May and September through
December, and lower than average in February through August with the exception of May.
Table 4: 2017 Collisions by Month
Month Collisions % of Year % of average month
January 371 8.3% 100%
February 306 6.9% 82%
March 354 7.9% 95%
April 326 7.3% 88%
May 378 8.5% 102%
June 356 8.0% 96%
July 343 7.7% 92%
August 345 7.7% 93%
September 395 8.8% 106%
October 388 8.7% 104%
November 434 9.7% 117%
December 468 10.5% 126%
Total 4,464
Figure 3: 2017 Collisions by Month
0.0%
2.0%
4.0%
6.0%
8.0%
10.0%
12.0%
Pe
rce
nt
of
Tota
l Co
llisi
on
s
Month

2017 Road Safety Report – City of Windsor
Page | 7
2.2.2 Daily Variation by Hour
A breakdown of collisions by hour of day is given in Table 5. This data is shown graphically in
Figure 4, along with traffic volume variation (based on the average of the traffic patterns
recorded at the detector stations along the E. C. Row Expressway) as a comparator.
Table 5: 2017 Collisions by Hour of Day
Hour Collisions % of Day
0:00 - 1:00 127 2.8%
1:00 - 2:00 44 1.0%
2:00 - 3:00 39 0.9%
3:00 - 4:00 33 0.7%
4:00 - 5:00 22 0.5%
5:00 - 6:00 23 0.5%
6:00 - 7:00 80 1.8%
7:00 - 8:00 110 2.5%
8:00 - 9:00 214 4.8%
9:00 - 10:00 194 4.3%
10:00 - 11:00 190 4.3%
11:00 - 12:00 268 6.0%
12:00 - 13:00 289 6.5%
13:00 - 14:00 300 6.7%
14:00 - 15:00 353 7.9%
15:00 - 16:00 448 10.0%
16:00 - 17:00 381 8.5%
17:00 - 18:00 389 8.7%
18:00 - 19:00 258 5.8%
19:00 - 20:00 190 4.3%
20:00 - 21:00 133 3.0%
21:00 - 22:00 142 3.2%
22:00 - 23:00 138 3.1%
23:00 - 0:00 99 2.2%
Total 4,464

2017 Road Safety Report – City of Windsor
Page | 8
Figure 4: 2017 Collisions by Hour of Day
2.3 Characteristics of Collisions
2.3.1 Impact Type
The impact types for 2017 City of Windsor collisions are summarized in Table 6 and illustrated
graphically in Figure 5. Rear-end collisions were the most frequent collision type (32%).
0.0%
2.0%
4.0%
6.0%
8.0%
10.0%
12.0%
0:0
0 -
1:0
0
1:0
0 -
2:0
0
2:0
0 -
3:0
0
3:0
0 -
4:0
0
4:0
0 -
5:0
0
5:0
0 -
6:0
0
6:0
0 -
7:0
0
7:0
0 -
8:0
0
8:0
0 -
9:0
0
9:0
0 -
10
:00
10
:00
- 1
1:0
0
11
:00
- 1
2:0
0
12
:00
- 1
3:0
0
13
:00
- 1
4:0
0
14
:00
- 1
5:0
0
15
:00
- 1
6:0
0
16
:00
- 1
7:0
0
17
:00
- 1
8:0
0
18
:00
- 1
9:0
0
19
:00
- 2
0:0
0
20
:00
- 2
1:0
0
21
:00
- 2
2:0
0
22
:00
- 2
3:0
0
23
:00
- 0
:00
Pe
rce
nt
of
Dai
ly T
ota
l
Hour of Day
Traffic Volumes Collisions

2017 Road Safety Report – City of Windsor
Page | 9
Table 6: 2017 Collisions by Impact Type
Type Collisions % of Total
Rear End 1,415 32%
Turning 937 21%
Angle 548 12%
Sideswipe 466 10%
SMV Other 423 9%
SMV Unattended 420 9%
Other 191 4%
Approaching 64 1%
Unknown - 0%
Total 4,464 100%
Figure 5: 2017 Collisions by Impact Type
Rear End 32%
Turning 21%Angle 12%
Sideswipe 10%
SMV Other 9%
SMV Unattended9%
Other4%
Approaching 1%Unknown 0%

2017 Road Safety Report – City of Windsor
Page | 10
3 Areas of Special Focus
3.1 Alcohol Involvement
For 2017, alcohol was found to be involved in 2.17% of collisions. This percentage is
slightly below the 5-year City of Windsor average of 2.28% and significantly below
historical percentages. (City of Windsor, 2005)
In 2017, 40% of fatal collisions in the City of Windsor (2 collisions) involved drivers with
alcohol-related driver conditions. On average, alcohol was involved in 40% percent of
fatal collisions in the five-year period of 2013 through 2017.
A comparison of 2017 with previous years is given in Table 7 and Figure 6. “Alcohol-
related collisions” include collisions with driver conditions “had been drinking”, “ability
impaired – alcohol”, and “ability impaired – alcohol over 0.08”.
Table 7: Alcohol-Related Collisions by Year
Year Total
Collisions
Total Alcohol-Related
Collisions
% of Total Collisions Involving Alcohol
Fatal Collisions
Fatal Alcohol-Related
Collisions
% of Fatal Collisions Involving Alcohol
2006 4,360 159 3.65% 6 1 17%
2007 4,462 163 3.65% 4 - 0%
2008 4,197 123 2.93% 7 2 29%
2009 3,572 78 2.18% 3 - 0%
2010 3,887 118 3.04% 2 - 0%
2011 3,630 111 3.06% 3 - 0%
2012 3,634 94 2.59% 7 3 43%
2013 3,792 102 2.69% 4 1 25%
2014 3,902 78 2.00% 2 1 50%
2015 4,273 97 2.27% 6 2 33%
2016 4,214 97 2.30% 3 2 67%
2017 4,464 97 2.17% 5 2 40%
2013 through 2017 20,645 471 2.28% 20 8 40%

2017 Road Safety Report – City of Windsor
Page | 11
Figure 6: Alcohol-Related Collisions by Year
3.2 Inattentive Drivers
Note: for “inattentive” collisions, results from 2013 are not directly comparable to previous
years – details are provided below.
In 2017, 15.3% of all City of Windsor collisions involved drivers reported as “inattentive”.
This represents a major decrease from historical levels but an increase over 2015-2016
levels, as shown in Table 8 and Figure 7.
This major change from 2012 to 2013 appears to be the result of changes in police
collision reporting practices. The Windsor Police Service confirmed that, beginning in
2013, they now use stricter criteria for determining when to classify a driver as
“inattentive”. This change in police practice appears to be the most significant reason for
the marked difference between 2013 statistics and previous years.
0.00%
0.50%
1.00%
1.50%
2.00%
2.50%
3.00%
3.50%
4.00%
2006 2007 2008 2009 2010 2011 2012 2013 2014 2015 2016 2017
Pe
rce
nt
of
Co
llisi
on
s In
volv
ing
Alc
oh
ol
Year

2017 Road Safety Report – City of Windsor
Page | 12
The “inattentive” driver condition includes conditions that would be considered “distracted
driving” under the Highway Traffic Act as well as conditions that would not be considered
distracted driving.
It should be noted that driver inattention in collisions is likely underreported, since drivers
are unlikely to self-report that they were engaged in illegal cell phone use, texting, or other
distracting activities at the time of the crash. Therefore, the actual rate of inattentive
driving in collisions may be higher than the statistics below indicate.
Table 8: Inattentive-Related Collisions by Year
Year Total
Collisions
Total Inattention-
Related Collisions
% of Total Collisions Involving
Inattentive Drivers
Fatal Collisions
Fatal Inattention-
Related Collisions
% of Fatal Collisions Involving
Inattentive Drivers
2006 4,360 971 22.3% 6 - 0.00%
2007 4,462 1,157 25.9% 4 - 0.00%
2008 4,197 1,165 27.8% 7 - 0.00%
2009 3,572 1,190 33.3% 3 - 0.00%
2010 3,887 1,422 36.6% 2 - 0.00%
2010 3,630 1,518 41.8% 3 - 0.00%
2012 3,634 1,238 34.1% 7 - 0.00%
2013 3,792 692 18.2% 4 - 0.00%
2014 3,902 464 11.9% 2 - 0.00%
2015 4,273 340 8.0% 6 - 0.00%
2016 4,214 534 12.7% 3 1 33.33%
2017 4,464 681 15.3% 5 - 0.00%
2013 through 2017 20,645 2,711 13.1% 20 1 5.00%
Figure 7: Inattentive-Related Collisions by Year
0.0%
5.0%
10.0%
15.0%
20.0%
25.0%
30.0%
35.0%
40.0%
45.0%
2006 2007 2008 2009 2010 2010 2012 2013 2014 2015 2016 2017
Pe
rce
nt
of
Co
llisi
on
s In
volv
ing
Inat
ten
tive
Dri
vers
Year
2017 Road Safety Report – City of Windsor
Page | 13
4 Fatal and Major Injury Collisions
Collisions that involve life-ending or life-altering injuries are of special concern. This
section addresses collisions that involved the injury classifications “fatal injury” or “major
injury” as reported on the MVA report.
4.1 Involved Persons
In 2017, 37 people were killed or seriously injured (5 fatalities, 32 major injuries) in
reported collisions on roads under the jurisdiction of the City of Windsor. This number is
slightly below the 2013-2017 average of 37.4 fatalities and major injuries per year. Motor
vehicle drivers were the group with the largest proportion of fatalities or major injuries
(49% of all fatalities and major injuries). Table 9 and Figure 8 and 9 summarize the
fatalities and major injuries by victim category for the past five years.
Table 9: Fatalities and Major Injuries by Year and Victim Category
Year
Fatalities and Major Injuries
Motor Vehicle Driver
Pedestrian Motor-cyclist
Motor Vehicle
Passenger Cyclist Hanger-on Total
2013 11 10 7 6 4 0 38
2014 16 7 1 4 5 1 34
2015 12 10 9 3 5 0 39
2016 13 9 7 5 4 1 39
2017 18 7 6 4 2 0 37
Percent (2017)
49% 19% 16% 11% 5% 0% 100%
Notes:
1. In the table above, “motor vehicle” does not include motorcycles, mopeds, or e-bikes
2. “Motorcyclist” includes motorcycle riders and passengers as well as moped riders and passengers
3. “Motor vehicle passenger” includes bus passengers
4. “Cyclist” includes bicycle riders and passengers as well as e-bike riders and passengers
5. “Hangers-on” are persons hanging on to the outside of a vehicle

2017 Road Safety Report – City of Windsor
Page | 14
Figure 8: Fatalities and Major Injuries by Year and Victim Type
Figure 9: 2017 Fatalities and Serious Injuries
0
5
10
15
20
25
30
35
40
45
2013 2014 2015 2016 2017
Pe
rso
ns
Kill
ed
or
Seri
ou
sly
Inju
red
Year
Hanger-on
Cyclist
Motor Vehicle Passenger
Motorcyclist
Pedestrian
Motor Vehicle Driver
Motor Vehicle Driver49%
Pedestrian 19%
Motorcyclist 16%
Motor Vehicle
Passenger11%
Cyclist5%
Hanger-on 0%

2017 Road Safety Report – City of Windsor
Page | 15
4.2 Locations
Locations that experienced two or more collisions with major injuries or fatalities are
summarized in Table 10 for intersections and Table 11 for midblock locations.
Table 10: Locations with 2 or More Major Injury or Fatality Collisions (2013-2017) – Intersections
CompKey Intersection Control
2013-2017 Fatalities and Major Injuries
Major Injuries
or Fatalities
Involved Collisions
288678 Central Ave @ E C Row W/B On Ramp & E C Row W/B Off Ramp Signalized 5 4
289593 Walker Rd @ E C Row W/B On Ramp & E C Row Collector North Signalized 4 3
284937 Huron Church Rd @ Tecumseh Rd W Signalized 2 2
286691 Tecumseh Rd E @ McDougall St Signalized 2 2
286985 Wyandotte St E @ Marentette Ave Unsignalized 2 2
287756 Ontario St @ Pillette Rd Unsignalized 2 2
288473 Tecumseh Rd E @ Roseville Garden Dr Signalized 2 2
Table 11: Locations with 2 or More Major Injury or Fatality Collisions (2013-2017) – Midblocks
Geo_ID Street From To
2013-2017 Fatalities and Major Injuries
Major Injuries
or Fatalities
Collisions
127741 Sandwich St Brock St Chippawa St 2 2
161398 E C Row E/B Off Ramp E C Row Expy E/B E C Row E/B Off Ramp 2 2
204314 E C Row Expy E/B Dougall Ave Howard Ave 2 2
5 Drivers
5.1 Driver Actions
The apparent driver actions for all drivers involved in 2017 City of Windsor collisions are
summarized in Table 12. In cases where drivers were not driving properly and a specific
driver action could be determined, the category with the highest percentage of collisions
was “following too close”.

2017 Road Safety Report – City of Windsor
Page | 16
Table 12: 2017 Drivers in Collisions by Driver Action
Driver Action Drivers % of Total
Driving Properly 4,226 43%
Unknown or No Info 1,410 14%
Other 993 10%
Following Too Close 943 10%
Failed to Yield Right-of-Way 792 8%
Lost Control 523 5%
Disobeyed Traffic Control 275 3%
Improper Lane Change 215 2%
Improper Turn 162 2%
Speed Too Fast for Condition 101 1%
Improper Passing 55 1%
Exceeding Speed Limit 24 0%
Wrong Way on One-Way Road 10 0%
Speed Too Slow 1 0%
Total 9,730 100%
The information in Table 12 is displayed graphically in Figure 10 along with Ontario-wide
statistics for comparison. (Ontario Ministry of Transportation, 2017) While the categories
“driving properly,” “unknown or no info,” and “other” are quite different between the City
of Windsor and the province overall, it is unclear whether this is caused by a meaningful
difference in actual collision experience in the two regions or whether it is merely the
result of different practices when preparing MVA reports in the City of Windsor versus
other parts of Ontario.

2017 Road Safety Report – City of Windsor
Page | 17
Figure 10: 2017 Drivers in Collisions by Action Type
5.2 Condition of Drivers
The reported condition of drivers in 2017 City of Windsor collisions is summarized in Table
13. The majority of drivers were classified as “normal” (70%); this is lower than the
percentage Ontario-wide (75%). It is unclear how much of this difference between City of
Windsor experience and the experience in Ontario overall can be attributed to the
difference in the percentage of drivers with unknown conditions (Windsor: 21%, Ontario:
10%). (Ontario Ministry of Transportation, 2017)
0% 10% 20% 30% 40% 50% 60%
Speed Too Slow
Wrong Way on One-Way Road
Exceeding Speed Limit
Improper Passing
Speed Too Fast for Condition
Improper Turn
Improper Lane Change
Disobeyed Traffic Control
Lost Control
Failed to Yield Right-of-Way
Following Too Close
Other
Unknown or No Info
Driving Properly
Percent of Drivers Involved in Collisions
Dri
ver
Act
ion
Ontario
Windsor

2017 Road Safety Report – City of Windsor
Page | 18
Table 13: 2017 Drivers in Collisions by Condition
Driver Condition Drivers Percent
Normal 6,851 70.4%
Unknown or No Info 2,062 21.2%
Inattentive 689 7.1%
Subtotal: Alcohol-Related Conditions 66 0.7%
Ability Impaired, alcohol (over 0.08) 29 0.3%
Had Been Drinking 22 0.2%
Ability Impaired, alcohol 15 0.2%
Fatigue 25 0.3%
Medical or Physical Disability 25 0.3%
Ability Impaired, drugs 8 0.1%
Other 4 0.0%
Total 9,730 100.0%
The information in Table 13 is displayed graphically in Figure 11 along with Ontario-wide
statistics for comparison. (Ontario Ministry of Transportation, 2017)
Figure 11: 2017 Drivers in Collisions by Condition
6 Cyclists
6.1 Note – Data Limitations
As stated in Section 1.2, this report deals only with collisions reported via Windsor Police
Service MVA report forms. Because of this, the information in this section addresses only
cyclist collisions that also involved at least one motor vehicle. Single rider collisions or
0.0% 10.0% 20.0% 30.0% 40.0% 50.0% 60.0% 70.0% 80.0%
Other
Ability Impaired, drugs
Ability Impaired, alcohol
Had Been Drinking
Fatigue
Medical or Physical Disability
Ability Impaired, alcohol (over 0.08)
Inattentive
Unknown or No Info
Normal
Ontario
Windsor

2017 Road Safety Report – City of Windsor
Page | 19
collisions between cyclists and/or electric power assisted bicycles (“e-bikes”) and
pedestrians would not be reported via MVA report forms and are not reflected in this
report.
E-bikes are not considered motor vehicles for collision reporting purposes. Therefore, as
for conventional bicycles, this section does not reflect e-bike collisions except for cases
where a motor vehicle was involved.
Standard MVA report forms do not currently differentiate between e-bikes and
conventional bicycles. Therefore, the information in this section reflects both e-bikes and
conventional bicycles.
6.2 General
In 2017, there were 66 collisions involving cyclists on City of Windsor roads. These
collisions are broken down by severity in Table 14.
Table 14: 2017 Cyclist Collisions
Severity Collisions Percent
Property Damage Only 13 20%
Injury 53 80%
Fatality 0 0%
Total 66 100%
6.3 Cyclist Actions
Cyclist actions in 2017 City of Windsor collisions are summarized in Table 15 and Figure
12. Overall, cyclists were found to be riding properly in 47% of collisions. In cases where
the cyclist was not riding properly and a specific cyclist action was identified, the most
common cyclist action was “failed to yield right of way.”

2017 Road Safety Report – City of Windsor
Page | 20
Table 15: 2017 Cyclist Collisions by Cyclist Action
Cyclist Action Collisions Percent
Driving properly 31 47%
Other 17 26%
Failed to yield right-of-way 11 17%
Improper turn 3 5%
Disobeyed traffic control 2 3%
Following too close 1 2%
Lost control 1 2%
Unknown 0 0%
Exceeding speed limit 0 0%
Speed too fast for condition 0 0%
Speed too slow 0 0%
Improper passing 0 0%
Wrong way on one-way road 0 0%
Improper lane change 0 0%
Total 66 100%
Figure 12: 2017 Cyclist Collisions by Cyclist Action
6.4 Drivers’ Actions in Cyclist Collisions
Driver actions in 2017 City of Windsor cyclist collisions are summarized in Table 16 and
Figure 13. Overall, drivers were found to be driving properly in 59% of collisions. In cases
Driving properly 47%
Other 26%
Failed to yield right-of-way 17%
Improper turn 5%
Disobeyed traffic control 3%
Following too close2%
Lost control 2%

2017 Road Safety Report – City of Windsor
Page | 21
where the driver was not driving properly, the most common driver action was “failed to
yield right of way.”
Table 16: 2017 Cyclist Collisions by Driver Action
Driver Action Collisions Percent
Driving properly 39 59%
Failed to yield right-of-way 18 27%
Other 4 6%
Improper turn 3 5%
Unknown 1 2%
Improper lane change 1 2%
Following too close 0 0%
Exceeding speed limit 0 0%
Speed too fast for condition 0 0%
Speed too slow 0 0%
Disobeyed traffic control 0 0%
Improper passing 0 0%
Lost control 0 0%
Wrong way on one-way road 0 0%
Total 66 100%
Figure 13: 2017 Cyclist Collisions by Driver Action
Driving properly 59%Failed to yield right-
of-way 27%
Other 6%
Improper turn 5%
Unknown 2% Improper lane change 2%

2017 Road Safety Report – City of Windsor
Page | 22
6.5 Locations of Cyclist Collisions
The locations of collisions involving cyclists are summarized in Table 17 and Figure 14.
In 2017, 71% of cyclist collisions either occurred at intersections or were intersection
related. When this value is considered along with the 15% of collisions that occurred at
private driveways, 86% of collisions occurred at points of conflict between bicycle and
motor vehicle traffic.
Table 17: 2017 Cyclist Collisions by Location Type
Location Collisions Percent
At Intersection 36 55%
Intersection Related 11 17%
At/Near Private Drive 10 15%
Non-intersection 9 14%
Unknown or No Info 0 0%
At Railway Crossing 0 0%
Underpass or Tunnel 0 0%
Overpass or Bridge 0 0%
Other 0 0%
Total 66 100%
Figure 14: 2017 Cyclist Collisions by Location Type
Location rankings based on number of cyclist collisions in 5 years (2013 through 2017)
are provided in Table 18 and Table 19.
At Intersection 55%
Intersection Related 17%
At/Near Private Drive 15%
Non-intersection
14%

2017 Road Safety Report – City of Windsor
Page | 23
Table 18: 2013-2017 Cycling Collision Locations - Intersections
CompKey Intersection Control Cyclist Collisions
2013-2017
Rank
289240 Lauzon Pky @ Tecumseh Rd E Signalized 5 1
286690 Tecumseh Rd E @ Windsor Ave Unsignalized 4 2
287328 Hanna St E @ Mcdougall St Unsignalized 4 2
285123 Wyandotte St W @ Campbell Ave Signalized 3 4
285262 Tecumseh Rd W @ Mckay Ave Unsignalized 3 4
285263 Tecumseh Rd W @ Crawford Ave Signalized 3 4
286705 Tecumseh Rd E @ Hall Ave Signalized 3 4
286706 Tecumseh Rd E @ Moy Ave Unsignalized 3 4
286972 Wyandotte St W @ Pelissier St Signalized 3 4
286973 Wyandotte St W @ Ouellette Ave & Wyandotte St E Signalized 3 4
286976 Wyandotte St E @ Goyeau St Signalized 3 4
287497 Ypres Ave @ Walker Rd Signalized 3 4
288134 Tecumseh Rd E @ Arthur Rd Unsignalized 3 4
289016 Tranby Ave @ Lauzon Rd & Lauzon Pky Signalized 3 4 Tie (31 locations)
2 15
Tie (179 locations)
1 46
Table 19: 2013-2017 Cycling Collision Locations - Intersections CompKey Street From To Cyclist
Collisions 2013-2017
Rank On-Road Cycling Facility
167107 Tecumseh Rd W South Pacific Ave Municipal Lane 4 1 None
(Future Bike Lane)
164299 Wyandotte St E Aylmer Ave Louis Ave 3 2 Bike Lane
292626 Tecumseh Rd E Serbian Centre Access Road
East Park Dr 3 2 None
127943 Tecumseh Rd W Ouellette Ave Pelissier St 2 4 None
168115 Campbell Ave Leduc St Tecumseh Rd
W 2 4
None (Future
Signed Route)
169469 Drouillard Rd Seminole St Reginald St 2 4 None
(Future Bike Lane)
169471 Drouillard Rd Alice St Milloy St 2 4 None
(Future Bike Lane)
169884 Tecumseh Rd E Howard Ave Marentette Ave 2 4 None
169898 Wyandotte St E Sterling Cres George Ave 2 4 Bike Lane
169921 Tecumseh Rd E Larkin Rd Central Ave 2 4 None
171317 Rhodes Dr Electricity Dr Pillette Rd 2 4 None
(Future Bike Lane)
Tie (122 locations) 1 12 Varies
Note: future facility types are as per the Bicycle Use Master Plan

2017 Road Safety Report – City of Windsor
Page | 24
6.6 Helmet Use
Safety equipment usage was reported for 51 cyclists in collisions in 2017. A summary of
the equipment used by the cyclist is given in Table 20 and Figure 15. 20% of cyclists in
collisions were reported as wearing a helmet. As can be seen in Figure 16, this rate of
helmet use is lower than 2016, but higher than historical usage rates.
Table 20: 2017 Cyclist Safety Equipment Usage
Safety Equipment - Cyclists Persons Percent
No equipment available 20 39%
Unknown or no info 15 29%
Helmet 10 20%
Equipment not used but available 6 12%
Other safety equipment used 0 0%
Total 51 100%
Note: this table only includes cases where cyclist safety equipment usage was reported.
Figure 15: 2017 Cyclist Safety Equipment Usage
No equipment available 39%
Unknown or no info29%
Helmet 20%
Equipment not used but available 12%

2017 Road Safety Report – City of Windsor
Page | 25
Figure 16: Reported Helmet Usage by Year
7 Pedestrians
7.1 Note – Data Limitations
As stated in Section 1.2, this report deals only with collisions reported via Windsor Police
Service MVA report forms. Because of this, the information in this section addresses only
pedestrian collisions that also involved at least one motor vehicle. Collisions between
cyclists and pedestrians would not be reported via MVA report forms and are not reflected
in this report.
E-bikes are not currently considered motor vehicles for collision reporting purposes.
Therefore, as for conventional bicycles, this section does not reflect collisions between e-
bikes and pedestrians except for cases where a motor vehicle was involved.
7.2 General
Overall, there were 89 reported collisions involving pedestrians on City of Windsor roads
in 2017. These collisions are broken down by severity in Table 21.
Table 21: 2017 Pedestrian Collisions
Severity Collisions Percent
Property Damage Only 6 7%
Injury 82 92%
Fatality 1 1%
Total 89 100%
0%
5%
10%
15%
20%
25%
30%
35%
2009 2010 2011 2012 2013 2014 2015 2016
Cyc
lists
we
arin
g h
elm
ets
Year

2017 Road Safety Report – City of Windsor
Page | 26
7.3 Pedestrian Actions
Pedestrian actions in 2017 City of Windsor collisions are summarized in Table 22 and
Figure 17. The most frequent action was “crossing with right-of-way”, which occurred in
47% of pedestrian collisions.
Table 22: 2017 Pedestrian Collisions by Pedestrian Action
Pedestrian Action Collisions Percent
Crossing with Right-Of-Way 42 47%
Crossing without Right-Of-Way 17 19%
Running onto Roadway 8 9%
Crossing - No Traffic Control 7 8%
On Sidewalk or Shoulder 4 4%
Walking on Roadway with Traffic 3 3%
Other 3 3%
Crossing Ped Crossover 1 1%
Crossing Marked Crosswalk Without Right-Of-Way 1 1%
Walking on Roadway Against Traffic 1 1%
Playing or Working on Highway 1 1%
Person Getting On/Off Vehicle 1 1%
Unknown or No Info 0 0%
Coming from Behind Parked Vehicle or Object 0 0%
Person Getting On/Off School Bus 0 0%
Pushing/Working on Vehicle 0 0%
Total 89 100%

2017 Road Safety Report – City of Windsor
Page | 27
Figure 17: 2017 Pedestrian Collisions by Pedestrian Action
7.4 Drivers’ Actions in Pedestrian Collisions
Driver actions in 2017 collisions involving pedestrians are summarized in Table 23 and
Figure 18. In cases where the driver was not driving properly, the most common driver
action was “failed to yield right-of-way” (40% of collisions).
Crossing with Right-Of-Way 47%
Crossing without Right-Of-Way 19%
Running onto Roadway 9%
Crossing - No Traffic Control 8%
On Sidewalk or Shoulder 4%
Walking on Roadway with Traffic 3% Other
3%
Crossing Ped Crossover 1%
Crossing Marked Crosswal
k Without Right-Of-Way 1%
Walking on Roadway Against Traffic 1%
Playing or Working on Highway 1%
Person Getting On/Off Vehicle
1%

2017 Road Safety Report – City of Windsor
Page | 28
Table 23: 2017 Pedestrian Collisions by Driver Action
Driver Action Collisions Percent
Driving Properly 41 46%
Failed to Yield Right-of-Way 36 40%
Improper Turn 5 6%
Other 3 3%
Disobeyed Traffic Control 2 2%
Exceeding Speed Limit 1 1%
Improper Passing 1 1%
Unknown or No Info 0 0%
Following Too Close 0 0%
Speed Too Fast for Condition 0 0%
Speed Too Slow 0 0%
Lost Control 0 0%
Wrong Way on One-Way Road 0 0%
Improper Lane Change 0 0%
Total 89 100%
Figure 18: 2017 Pedestrian Collisions by Driver Action
Driving Properly 46%
Failed to Yield Right-of-Way 40%
Improper Turn 6%
Other 3%
Disobeyed Traffic Control 2%
Exceeding Speed Limit 1%
Improper Passing 1%

2017 Road Safety Report – City of Windsor
Page | 29
7.5 Location of Pedestrian Collisions
The locations of collisions involving pedestrians are summarized in Table 24 and Figure
19. In 2017, 67% of pedestrian collisions either occurred at intersections or were
intersection related.
Table 24: 2017 Pedestrian Collisions by Location Type
Collision Location Collisions Percent
Intersection 48 54%
Midblock 24 27%
Intersection related 12 13%
Midblock - near private drive 5 6%
Unknown or No Info 0 0%
Railway 0 0%
Underpass/Tunnel 0 0%
Overpass/Bridge 0 0%
Other 0 0%
Total 89 100%
Figure 19: 2017 Pedestrian Collisions by Location Type
Location rankings based on number of pedestrian collisions in 5 years (2013 through
2017) are provided in Table 25 and Table 26.
Intersection 54%
Midblock 27%
Intersection related 13%
Midblock - near private drive 6%

2017 Road Safety Report – City of Windsor
Page | 30
Table 25: 2013-2017 Pedestrian Collision Locations - Intersections
CompKey Intersection Control Pedestrian Collisions 2013-2017
Rank
286973 Wyandotte St W @ Ouellette Ave & Wyandotte St E Signalized 11 1
287089 Erie St E @ Goyeau St Signalized 6 2
286985 Wyandotte St E @ Marentette Ave Unsignalized 5 3
286932 Park St W @ Ouellette Ave & Park St E Signalized 4 4
286980 Wyandotte St E @ McDougall St Signalized 4 4
289248 Tecumseh Rd E @ Annie St Signalized 4 4
285123 Wyandotte St W @ Campbell Ave Signalized 3 7
286691 Tecumseh Rd E @ McDougall St Signalized 3 7
286909 University Ave W @ Church St Signalized 3 7
286972 Wyandotte St W @ Pelissier St Signalized 3 7
286981 Wyandotte St E @ Mercer St Unsignalized 3 7
286982 Wyandotte St E @ Glengarry Ave Signalized 3 7
287683 Wyandotte St E @ Raymo Rd Signalized 3 7
287868 Seminole St @ Pillette Rd Signalized 3 7
288473 Tecumseh Rd E @ Roseville Garden Dr Signalized 3 7
289026 Lauzon Rd @ Lauzon Line (W) & Mchugh St (E) Signalized 3 7 Tie (39 locations)
2 17
Tie (137 locations)
1 56
Table 26: 2013-2017 Pedestrian Collision Locations - Midblocks
Geo_ID Street From To Pedestrian Collisions 2013-2017
Rank
126329 Dougall Ave Tecumseh Rd W Wear St 2 1
127398 Ouellette Ave Wyandotte St W Tuscarora St 2 1
127400 Ouellette Ave Tecumseh Rd E Eugenie St E 2 1
127450 Pelissier St Wyandotte St W Elliott St W 2 1
127945 Tecumseh Rd E Hickory Rd Drouillard Rd 2 1
165271 Ouellette Ave Hanna St E Tecumseh Rd E 2 1
165286 Goyeau St Elliott St E Erie St E 2 1
169592 Tecumseh Rd E Walker Rd Factoria Rd 2 1
169629 Tecumseh Rd E Forest Glade Dr Clover Ave 2 1
169881 Tecumseh Rd E McDougall St Mercer St 2 1
169884 Tecumseh Rd E Howard Ave Marentette Ave 2 1
292083 Walker Rd Plaza Access Rd-Home Depot/Walker
Plaza Access Rd-Canadian Tire/Walker
2 1
Tie (122 locations)
1 13

2017 Road Safety Report – City of Windsor
Page | 31
7.6 Pedestrian Condition
The condition of the pedestrians at the time of the collision is summarized in Table 277
and Figure 2020. The condition of the majority of the pedestrians was reported as
“normal” (80%).
Table 27: 2017 Pedestrian Collisions by Pedestrian Condition
Pedestrian Condition Collisions Percent
Normal 71 80%
Inattentive 12 13%
Had Been Drinking 3 3%
Other 2 2%
Medical or Physical Disability 1 1%
Unknown or No Info 0 0%
Ability Impaired, alcohol (over .08) 0 0%
Ability Impaired, alcohol 0 0%
Ability Impaired, drugs 0 0%
Fatigue 0 0%
Total 89 100%
Figure 20: 2017 Pedestrian Collisions by Pedestrian Condition
Normal 80%
Inattentive 13%
Had Been Drinking3%
Other 2% Medical or Physical Disability 1%

2017 Road Safety Report – City of Windsor
Page | 32
7.7 Lighting Condition
Lighting condition for pedestrian collisions is summarized in Table 288 and Figure 211.
In the majority of cases, the pedestrian collisions occurred during daylight conditions
(69%).
Table 28: 2017 Pedestrian Collisions by Lighting Condition
Lighting Condition Collisions Percent
Daylight 61 69%
Dark - Artificial 13 15%
Dark 7 8%
Dusk 3 3%
Daylight - Artificial 2 2%
Dusk - Artificial 2 2%
Dawn - Artificial 1 1%
Unknown 0 0%
Dawn 0 0%
Other 0 0%
Total 89 100%
Figure 21: 2017 Pedestrian Collisions by Lighting Condition
Daylight 69%
Dark - Artificial 15%
Dark 8%
Dusk 3%
Daylight - Artificial2%
Dusk - Artificial 2% Dawn - Artificial 1%
Unknown 0%

2017 Road Safety Report – City of Windsor
Page | 33
7.8 Type of Traffic Control
The type of traffic control that was present at pedestrian collision locations is summarized
in Table 299 and Figure 222. The majority of pedestrian collisions (53%) occurred at traffic
signals.
Table 29: 2017 Pedestrian Collisions by Traffic Control Type
Traffic Control Collisions Percent
Traffic Signal 47 53%
No Control 32 36%
Stop Sign 8 9%
Ped Crossover 1 1%
Other 1 1%
Unknown 0 0%
Yield Sign 0 0%
Police Control 0 0%
School Guard 0 0%
School Bus 0 0%
Traffic Gate 0 0%
Traffic Controller 0 0%
Total 89 100%
Figure 22: 2017 Pedestrian Collisions by Traffic Control Type
Traffic Signal 53%No Control 36%
Stop Sign 9%
Ped Crossover 1% Other 1%

2017 Road Safety Report – City of Windsor
Page | 34
8 Environment
8.1 Weather and Light Conditions
Environmental conditions for 2017 City of Windsor collisions are summarized in Table
3030 and Figure 233. Overall, the majority of collisions (82%) occurred in clear conditions.
Table 30: 2017 Collisions by Environmental Condition
Environmental Condition Collisions Percent
Clear 3,656 82%
Rain 555 12%
Snow 219 5%
Fog, mist, smoke, dust 21 0%
Freezing Rain 7 0%
Other 4 0%
Drifting Snow 1 0%
Strong Wind 1 0%
Unknown or No Info - 0%
Total 4,464 100%
Figure 23: 2017 Collisions by Environmental Condition
Clear 82%
Rain 12%
Snow5%
Fog, mist, smoke, dust
0%
Freezing Rain 0%Other 0% Drifting Snow 0%

2017 Road Safety Report – City of Windsor
Page | 35
Lighting conditions for 2017 City of Windsor collisions are summarized in Table 311 and
Figure 244. The majority of collisions (76%) occurred during daylight. In the table below,
“artificial” refers to artificial lighting (typically streetlights).
Table 31: 2017 Collisons by Lighting Condition
Lighting Condition Collisions Percent
Daylight 3,384 76%
Dark 707 16%
Dark - Artificial 224 5%
Dusk 52 1%
Dusk - Artificial 35 1%
Daylight - Artificial 33 1%
Dawn - Artificial 21 0%
Dawn 6 0%
Other 2 0%
Unknown - 0%
Total 4,464 100%
Figure 24: 2017 Collisions by Lighting Condition
Daylight 76%
Dark 16%
Dark - Artificial 5%
Dusk 1%Dusk - Artificial 1% Daylight -
Artificial 1%Dawn -
Artificial 0% Dawn 0%

2017 Road Safety Report – City of Windsor
Page | 36
8.2 Road Surface
Road surface conditions for 2017 City of Windsor collisions are given in Table 322 and
Figure 255. Overall, the majority of collisions (77%) occurred on a dry road surface.
Table 32: 2017 Collisions by Road Surface Condition
Surface Condition Collisions Percent
Dry 3,439 77%
Wet 712 16%
Loose Snow 242 5%
Ice 29 1%
Packed Snow 17 0%
Slush 11 0%
Unknown or No Info 7 0%
Other 4 0%
Spilled Liquid 2 0%
Loose Sand or Gravel 1 0%
Mud - 0%
Total 4,464 100%
Figure 25: 2017 Collisions by Road Surface Condition
Dry 77%
Wet 16%
Loose
Snow
5%
Ice 1%
Packed Snow 0% Slush 0% Unknown or No Info 0% Other 0%

2017 Road Safety Report – City of Windsor
Page | 37
8.3 Winter Weather Collisions
For reporting purposes, “winter weather collisions” are defined as collisions that occur
during winter months (defined for Windsor as November through March) during winter
weather conditions, defined as follows:
Environmental Condition at the time of the collision (as noted in the MVA report
for the collision) is not “clear”, or
Road Surface Condition at the time of collision (as noted in the MVA report) is
“wet”, “loose snow”, “slush”, “packed snow”, or “ice”
Based on these criteria, City of Windsor winter weather collisions by year are summarized
in Table 33.
Table 33: Winter Weather Collisions by Year
Year Total
Collisions
Total Winter
Weather Collisions
% of Total Collisions In Winter Weather
Conditions
Fatal Collisions
Fatal Collisions in Winter Weather
Conditions
% of Fatal Collisions In Winter Weather
Conditions
2006 4,360 580 13.3% 6 2 33%
2007 4,462 788 17.7% 4 2 50%
2008 4,197 872 20.8% 7 - 0%
2009 3,572 586 16.4% 3 1 33%
2010 3,887 617 15.9% 2 1 50%
2011 3,630 636 17.5% 3 - 0%
2012 3,634 490 13.5% 7 - 0%
2013 3,792 544 14.3% 4 1 25%
2014 3,902 638 16.4% 2 - 0%
2015 4,273 310 7.3% 6 1 17%
2016 4,214 273 6.5% 3 - 0%
2017 4,464 636 14.2% 5 - 0%
2013 through 2017 20,645 2,401 11.6% 20 2 10.00%

2017 Road Safety Report – City of Windsor
Page | 38
8.4 Pavement Markings
Pavement marking conditions for 2017 City of Windsor collisions are summarized in Table
344 and Figure 266. In the majority of cases, pavement markings were either present and
visible (80%) or were on roadways where pavement markings were not provided (19%).
Table 34: 2017 Collisions by Pavement Marking Condition
Marking Condition Collisions Percent
Exists 3,593 80%
Non-Existent 841 19%
Obscured 19 0%
Unknown or No Info 9 0%
Faded 2 0%
Total 4,464 100%
Figure 26: 2017 Collisions by Pavement Marking Condition
8.5 Road Characteristics
Roadway characteristics for 2017 City of Windsor collisions are summarized in Table 355
and Figure 277. The majority of collisions (67%) occurred on undivided two-way roads.
Exists 80%
Non-Existent 19%
Obscured 0%Unknown or No
Info 0% Faded 0%

2017 Road Safety Report – City of Windsor
Page | 39
Table 35: 2017 Collisions by Road Character
Road Character Collisions Percent
Undivided - Two Way 3,806 85%
Undivided - One Way 263 6%
Divided - No Barrier 187 4%
Divided with Restraining Barrier 187 4%
Unknown or No Info 10 0%
Ramp 9 0%
Express Lane 2 0%
Collector Lane - 0%
Transfer Lane - 0%
Total 4,464 100%
Figure 27: 2017 Collisions by Road Character
Undivided - Two Way85%
Undivided -One Way 6%
Divided - No Barrier4%
Divided with Restraining Barrier
4%
Unknown or No Info 0%
Ramp 0%Express
Lane0%
Collector Lane 0%

2017 Road Safety Report – City of Windsor
Page | 40
8.6 Traffic Control Condition
In 2017, 2,990 collisions on City of Windsor roads occurred where some form of traffic
control (e.g. signals, stop sign, or crossing guard) was present. The condition of the traffic
control for these collisions is summarized in Table 366 and Figure 288. In the majority of
cases (99%), the traffic control was reported as functioning.
Table 36: 2017 Collisions by Traffic Control Condition
Traffic Control Condition Collisions Percent
Functioning 2,959 99%
Not Functioning 26 1%
Unknown or No Info 3 0%
Obscured 1 0%
Missing/Damaged 1 0%
Total 2,990 100%
Note: only includes collisions where traffic control was present

2017 Road Safety Report – City of Windsor
Page | 41
Figure 28: 2017 Collisions by Traffic Control Condition
Functioning 99%
Not Functioning 1% Unknown or No Info0%

2017 Road Safety Report – City of Windsor
Page | 42
9 Location
9.1 General
A summary of the general classes of locations for 2017 City of Windsor collisions is given
in Table 377 and Figure 299. The majority of collisions (59%) were at intersections or
were intersection-related.
Table 37: 2017 Collisions by Location Type
Location Collisions Percent
Intersection 1,256 28%
Intersection Related 1,362 31%
Subtotal - Intersection & Intersection-Related 2,618 59%
Midblock 1,072 24%
Midblock - Private Driveway 763 17%
Subtotal - All Midblock 1,835 41%
Railway 8 0%
Other 2 0%
Overpass/Bridge 1 0%
Underpass/Tunnel - 0%
Total 4,464 100%
Figure 29: 2017 Collisions by Location Type
Intersection 28%
Intersection Related31%
Midblock 24%
Midblock - Private Driveway 17%
Railway 0% Other 0%

2017 Road Safety Report – City of Windsor
Page | 43
9.2 Intersection
9.2.1 Signalized
The 25 signalized intersections with the highest collision rates (based on collisions from
2013 through 2017) are listed in Table 388. For this period, the average collision rate for
signalized intersections was found to be 0.56 collisions per million vehicles entering.
Table 38: 2013-2017 Collision Locations - Signalized Intersections
CompKey Intersection Collisions
2013-2017
Annual Average
Daily Traffic - All Legs [vehicles per day]
Collisions per Million Vehicles Entering
Intersection
Rank
289476 County Road 42 @ Lauzon Pky 87 47,500 2.01 1
286972 Wyandotte St W @ Pelissier St 58 43,100 1.47 2
289240 Lauzon Pky @ Tecumseh Rd E 147 119,700 1.35 3
289253 Tecumseh Rd E @ Forest Glade Dr 72 59,700 1.32 4
297610 E C Row Expy W/B @ Banwell Rd 131 111,800 1.28 5
289026 Lauzon Rd @ Lauzon Line (W) & McHugh St (E)
34 29,200 1.28 6
288383 Grand Marais Rd E @ Central Ave & Plymouth Dr
93 80,600 1.26 7
286694 Tecumseh Rd E @ Howard Ave 113 98,000 1.26 8
284919 Huron Church Rd @ University Ave W 25 22,100 1.24 9
285400 Northwood St @ Dominion Blvd 55 49,000 1.23 10
285994 Provincial Rd @ Walker Rd 96 85,900 1.22 11
288691 Central Ave @ E C Row Collector South & E C Row E/B On Ramp
71 64,300 1.21 12
289247 Lauzon Pky @ South Service Rd E (W) & Twin Oaks Dr (E)
48 46,100 1.14 13
286931 Park St W @ Pelissier St 11 10,600 1.14 14
287465 Tecumseh Rd E @ Walker Rd 114 112,700 1.11 15
289145 McHugh St @ Banwell Rd & McNorton St 37 36,600 1.11 16
288803 Wyandotte St E @ Lauzon Rd 56 55,700 1.10 17
289245 Lauzon Pky @ Forest Glade Dr 88 88,100 1.09 18
286691 Tecumseh Rd E @ McDougall St 67 67,200 1.09 19
288674 Temple Dr @ Central Ave & North Service Rd E
81 82,900 1.07 20
284934 Huron Church Rd @ College Ave 98 101,300 1.06 21
286980 Wyandotte St E @ McDougall St 54 56,400 1.05 22
285166 College Ave @ Campbell Ave 31 32,500 1.05 23
287843 Seminole St @ Walker Rd 58 61,200 1.04 24
285490 Labelle St @ Dominion Blvd 47 49,600 1.04 25 Average – all signalized intersections
0.56

2017 Road Safety Report – City of Windsor
Page | 44
9.2.2 Unsignalized
The 25 unsignalized intersections with the highest number of collisions (based on
collisions from 2013 through 2017) are listed in Table 399. Due to an absence of traffic
volume data at unsignalized intersections, an average collision rate for unsignalized
intersections could not be calculated.
Table 39: 2013-2017 Collision Locations - Unsignalized Intersections
CompKey Intersection Collisions 2013-2017
Rank
286606 Ouellette Pl @ Dougall Ave 71 1
287346 Riverside Dr E @ Devonshire Rd 28 2
285645 Norfolk St @ Dominion Blvd 27 3
286985 Wyandotte St E @ Marentette Ave 26 4
286261 Dougall Ave @ E C Row E/B Off Ramp 25 5
286987 Wyandotte St E @ Langlois Ave 23 6
287104 Erie St E @ Parent Ave 23 6
286274 Beals St W @ Dougall Ave 22 8
288404 South National St @ Jefferson St 22 8
287324 Hanna St W @ Ouellette Ave & Hanna St E 21 10
286513 Lappan Ave @ Walker Rd 20 11
289474 County Road 42 @ 9th Con Rd 20 11
284762 Sandwich @ Riverside Dr & University Ave W & Rosedale Ave 19 13
286316 Howard Ave @ South Cameron Blvd 19 13
287328 Hanna St E @ McDougall St 19 13
285412 Dougall Ave @ South Cameron Blvd 18 16
286984 Wyandotte St E @ Louis Ave 18 16
287464 Tecumseh Rd E @ Turner Rd 18 16
285262 Tecumseh Rd W @ McKay Ave 17 19
287306 Shepherd St E @ Parent Ave 17 19
289241 Lauzon Pky @ Enterprise Way 17 19
285627 West Grand Blvd @ Bruce Ave 16 22
286343 E C Row Ave E @ Conservation Dr 16 22
286588 Ouellette Ave @ Hildegarde St - West 16 22
284905 Detroit St @ Peter St 15 25
285073 Riverside Dr W @ Campbell Ave 15 25
285923 Division Rd @ Riberdy Rd 15 25
286693 Tecumseh Rd E @ Highland Ave 15 25
286981 Wyandotte St E @ Mercer St 15 25
287259 Ellis St E @ McDougall St 15 25
288086 Tecumseh Rd E @ Chandler Rd 15 25
288672 Essex Way @ Quality Way 15 25
289259 Lauzon Rd @ Hawthorne Dr 15 25

2017 Road Safety Report – City of Windsor
Page | 45
9.3 Mid-Block
Five years of collision data (2013 through 2017) were reviewed for each road section City-
wide. Where traffic volumes were available, mid-block sections were ranked by collision
rate, expressed in units of collisions per million vehicle-kilometres travelled. Average
collision rates are given by road classification; an average rate could not be calculated
for local streets due to a lack of traffic volume data for these streets.
For very short road sections, a small number of collisions can artificially cause a very high
collision rate that is not representative of the roadway as a whole. To address this,
midblock sections less than 100 metres in length have not been included in Table 4040.
Table 40: 2013-2017 Collision Locations - Midblocks
CompKey Street Name From To
Co
llis
ion
s 2
01
3-2
017
An
nu
al A
ve
rag
e D
ail
y T
raff
ic
[veh
icle
s p
er
day]
Len
gth
[m
]
Co
llis
ion
s p
er
mil
lio
n v
eh
icle
-
km
Ran
k
166826 Pitt St W Bruce Ave Janette Ave 1 350 103 15.21 1
165251 Pelissier St Maiden Lane W Wyandotte St W 7 2,400 126 12.65 2
163876 Chatham St E Ouellette Ave Goyeau St 7 2,100 175 10.44 3
127450 Pelissier St Wyandotte St W Elliott St W 13 2,400 286 10.39 4
128050 Victoria Ave Park St W Wyandotte St W 14 2,500 307 9.98 5
165249 Pelissier St University Ave W Park St W 5 2,100 143 9.14 6
167723 Chatham St W Bruce Ave Janette Ave 1 600 100 9.10 7
165224 Janette Ave University Ave W Park St W 4 1,700 145 8.92 8
127447 Pelissier St Elliott St W Erie St W 7 1,900 236 8.55 9
127007 Lincoln Rd Riverside Dr E Assumption St 4 1,100 247 8.06 10
166921 Parent Ave Brant St Wyandotte St E 4 2,550 111 7.74 11
166919 Parent Ave Assumption St Brant St 4 2,550 112 7.67 12
127496 Pitt St W Ouellette Ave Ferry St 4 2,100 136 7.66 13
126588 Glengarry Ave Wyandotte St E Tuscarora St 6 4,400 112 6.69 14
126576 Gladstone Ave Riverside Dr E Assumption St 2 700 242 6.46 15
127494 Pitt St E Ouellette Ave Goyeau St 5 2,600 169 6.25 16
165250 Pelissier St Park St W Maiden Lane W 4 2,250 168 5.79 17
164144 George Ave Reginald St Alice St 11 4,300 245 5.73 18
163869 Bruce Ave University Ave W Park St W 4 2,700 143 5.68 19
126581 Gladstone Ave Ottawa St Ellis St E 3 1,400 208 5.64 20
127408 Parent Ave Niagara St Erie St E 10 4,500 220 5.53 21
126506 Florence Ave Menard St Paulina Crt 2 980 206 5.43 22

2017 Road Safety Report – City of Windsor
Page | 46
CompKey Street Name From To
Co
llis
ion
s 2
01
3-2
017
An
nu
al A
ve
rag
e D
ail
y T
raff
ic
[veh
icle
s p
er
day]
Len
gth
[m
]
Co
llis
ion
s p
er
mil
lio
n v
eh
icle
-
km
Ran
k
166649 Erie St E Pierre Ave Hall Ave 5 4,950 103 5.38 23
127407 Parent Ave Wyandotte St E Tuscarora St 4 3,600 113 5.37 24
165241 Victoria Ave University Ave W Park St W 4 2,900 143 5.28 25
Average Mid-block Collision Rates by Road Classification
Scenic Parkway 0.43
Collector 1.06
Arterial 0.85
Expressway 0.49
Notes: 1. Local streets, streets without volume information, and very short (<100 m) road sections are not included in this table.

2017 Road Safety Report – City of Windsor
Page | 47
10 Conclusions
The key findings of the report are summarized in Table 41 below. Up and down arrows
indicate an increase or decrease, respectively, from the 2013 through 2017 five-year
average. The colour of the arrow is green if the 2017 value is better than the five-year
average, red if worse, and black if close in value (less than 5% difference) or is not clearly
favourable or unfavourable.
Table 41: Key Statistics with Comparisons to 5-Year Averages
Category Measure
City of Windsor
5-Year Average
Percentage Difference
2017
Overall Collisions
Total Collisions – All Severities 4,129 +8%
4,464
Injury Collisions [Note 2]
Total Injury Collisions 1,136 +24%
1,412
Total Persons Injured 1,514 +25%
1,890
Persons Injured per 1,000 population [Note 1] 6.98
+24% 8.64
Fatal Collisions
Total Fatal Collisions 4.0 +25%
5
Total Fatalities 4.0 +25%
5
Fatalities per 100,000 population [Note 1] 1.84 +24%
2.29
Alcohol
Total Alcohol-Related Collisions 94 +3%
97
% of Collisions Involving Alcohol 2.28% -5%
2.17%
% of Drivers with Alcohol-Related Driver Conditions [Note 1] 0.96%
-29% 0.68%
Fatal Collisions with Alcohol-Related Driver Conditions 1.6
+25% 2
% of Fatal Collisions Involving Alcohol 40% +0%
40%

2017 Road Safety Report – City of Windsor
Page | 48
Category Measure
City of Windsor
5-Year Average
Percentage Difference
2017
Driver Inattention
Total Inattentive Drivers in Collisions 552 +25%
689
% of Collisions Involving Inattention 13.1% +17%
15.3%
% of Drivers Reported as Inattentive [Note 1] 6.1% +16%
7.1%
Driver Actions
% of Drivers Reported as Driving Properly [Note 1] 43%
+0% 43%
Most Common Improper Action (where known) [Note 1]
Following Too Close
Following Too Close
Driver Condition
% of Drivers Reported as Normal Condition [Note 1] 72%
-2% 71%
Cyclist Collisions
Total Cyclist Collisions (All Severities) 85.4
-23% 66
Total Cyclist Injury Collisions 70.4 -25%
53
Total Cyclist Fatal Collisions 0.2 -100%
0
% of Cyclists Reported as Riding Properly 43% +9%
47%
% of Cyclists Wearing Helmets (where known) 18%
+11% 20%
Most Common Improper Action – Cyclist (where known)
Failed to Yield Right-
of-Way
Failed to Yield
Right-of-Way
Most Common Improper Action – Driver (where known)
Failed to Yield Right-
of-Way
Failed to Yield
Right-of-Way

2017 Road Safety Report – City of Windsor
Page | 49
Category Measure
City of Windsor
5-Year Average
Percentage Difference
2017
Pedestrian Collisions
Total Pedestrian Collisions (All Severities) 85
+5% 89
Total Pedestrian Injury Collisions 80 +3%
82
Total Pedestrian Fatal Collisions 1.2 -20%
1
Most Common Improper Action – Driver Failed to
Yield Right-of-Way
Failed to Yield
Right-of-Way
Notes: 3. Comparison with Provincial statistics available – see Table 42. 4. Police reporting practices for motor vehicle collision injuries changed in 2014.
Readers should exercise caution in comparing injury statistics from before this date to statistics after this date.
Table 42 gives a summary of the performance of the City of Windsor compared to the
Province of Ontario for measures where provincial statistics were available. Up, down,
and horizontal arrows indicate that the City of Windsor value is higher than, lower than,
or within 5% of the overall value for the Province of Ontario, and the arrow is coloured
green or red, respectively, if Windsor compares favourably or unfavourably with the
Province overall; a black arrow indicates that the measure is either close in value or is not
clearly favourable or unfavourable. The most recent year of statistics available for Ontario
is 2014; five-year provincial averages were based on 2009 through 2014.
Table 42: Summary - City of Windsor vs. Province of Ontario
Category Measure
Province of Ontario 5-year
Average
Windsor vs. Ontario
City of Windsor 5-
year Average
Injury Collisions
Persons injured per 1,000 population 3.99
+75% 6.98
Fatal Collisions
Fatalities per 100,000 population 4.49
-59% 1.84
Inattentive Drivers
% of drivers reported as inattentive 13.1%
-47% 6.1%
Alcohol % of drivers with alcohol-related driver conditions
1.50% -36%
0.96%

2017 Road Safety Report – City of Windsor
Page | 50
Category Measure
Province of Ontario 5-year
Average
Windsor vs. Ontario
City of Windsor 5-
year Average
Driver Actions % of drivers reported as driving properly 49%
-12% 43%
Most common improper action (where known)
Following Too Close
Following Too
Close
Driver Condition
% of drivers reported as normal condition 75%
-4% 72%
The majority of 2017 City of Windsor collisions (59%) occurred at intersections or were
intersection related. The worst locations for each category are given in Table 43.
Table 43: High Collision Locations
Category Location Collisions
(2013 – 2017) Collision Rate
Signalized Intersections
County Road 42 & Lauzon Pky.
87 2.01 collisions per
million vehicles entering
Unsignalized Intersections
Dougall Ave. & Ouellette Pl.
71 N/A
Mid-Block Sections [Note 1]
Pelissier St. (Maiden Lane W to Wyandotte St. W)
7 12.65 collisions per
million vehicle-kilometres
Fatal and Major Injury Collisions
Central Avenue & E.C. Row Expy. Westbound Ramps
4 (fatal or major injury collisions
only)
N/A
Cyclist Collisions Lauzon Pky. & Tecumseh Rd E 5
(cyclist collisions only)
N/A
Pedestrian Collisions
Wyandotte St. & Ouellette Ave.
11 (pedestrian
collisions only) N/A
Notes:
1. Omits one location that experienced a single collision but a higher collision rate
(due to very low traffic volumes and short street length).

2017 Road Safety Report – City of Windsor
Page | 51
11 Consultations
The following agencies and City departments/divisions were consulted in the preparation
of this report or in development of its format and are thanked for their cooperation and
assistance:
Windsor Police Service
Office of the City Solicitor – Risk Management
Office of the City Engineer – Planning
Office of the City Engineer – Traffic Operations
Office of the City Engineer – Engineering
12 Works Cited
City of Windsor. (2005). 2004 Collision Report. Windsor.
Ontario Ministry of Transportation. (2017). 2014 Ontario Road Safety Annual Report.
Toronto: Queen's Printer for Ontario.
Regional Municipality of Waterloo. (2012). 2011 Collision Report. Waterloo.