2017 PEANUT UPDATE - Georgia Peanut · PDF file2 INTRODUCTION The members of the University of...
67
1 2017 PEANUT UPDATE Table of Contents Author (s) Title Page W. Scott Monfort Introduction 2 Pam Knox Climate Summary for 2016 and the Outlook for 2017 3 W. Scott Monfort Peanut Cultivar Options 4 Bill Branch Peanut Breeding Update 6 R. Scott Tubbs W. Scott Monfort Peanut Rotations Update 11 Eric P. Prostko Peanut Weed Control Update 14 Mark R. Abney Peanut Insect Management Update 17 Wesley M. Porter Peanut Irrigation Update 19 Bob Kemerait Tim Brenneman Albert Culbreath Peanut Disease Update 24 University of Georgia University of Florida Auburn University Mississippi State University Clemson University Peanut Rx 40 Adam N. Rabinowitz Peanut Outlook and Cost Analysis 55
Transcript of 2017 PEANUT UPDATE - Georgia Peanut · PDF file2 INTRODUCTION The members of the University of...
1
2017 PEANUT UPDATE
Table of Contents
Author (s) Title Page
W. Scott Monfort Introduction 2
Pam Knox Climate Summary for 2016 and the Outlook for 2017
3
W. Scott Monfort Peanut Cultivar Options 4
Bill Branch Peanut Breeding Update 6
R. Scott Tubbs W. Scott Monfort
Peanut Rotations Update 11
Eric P. Prostko Peanut Weed Control Update 14
Mark R. Abney Peanut Insect Management Update 17
Wesley M. Porter Peanut Irrigation Update 19
Bob Kemerait Tim Brenneman Albert Culbreath
Peanut Disease Update 24
University of Georgia University of Florida Auburn University Mississippi State University Clemson University
Peanut Rx 40
Adam N. Rabinowitz Peanut Outlook and Cost Analysis
55
2
INTRODUCTION
The members of the University of Georgia Extension Peanut Team are pleased to present the 2017 Peanut Update. The purpose of this publication is to provide peanut producers with new and timely information that can be used in the upcoming growing season to make cost-effective management decisions. Contact your local county extension agent for additional publications, information, or field problem assistance.
W. Scott Monfort, Editor
The University of Georgia Extension Peanut Team
Adam N Rabinowitz – Economics
Amanda Smith – Economics Albert Culbreath – Plant Pathology
Bob Kemerait - Plant Pathology Eric P. Prostko - Weed Science
Glen Harris - Soil Fertility Mark Abney - Entomology Nathan Smith - Economics Pam Knox – Climatology
R. Scott Tubbs - Agronomy Tim Brenneman - Plant Pathology
Wesley Porter - Irrigation W. Scott Monfort – Agronomy
*Printing of the 2017 Peanut Update was made possible through a grant provided by the Georgia Peanut Commission.
3
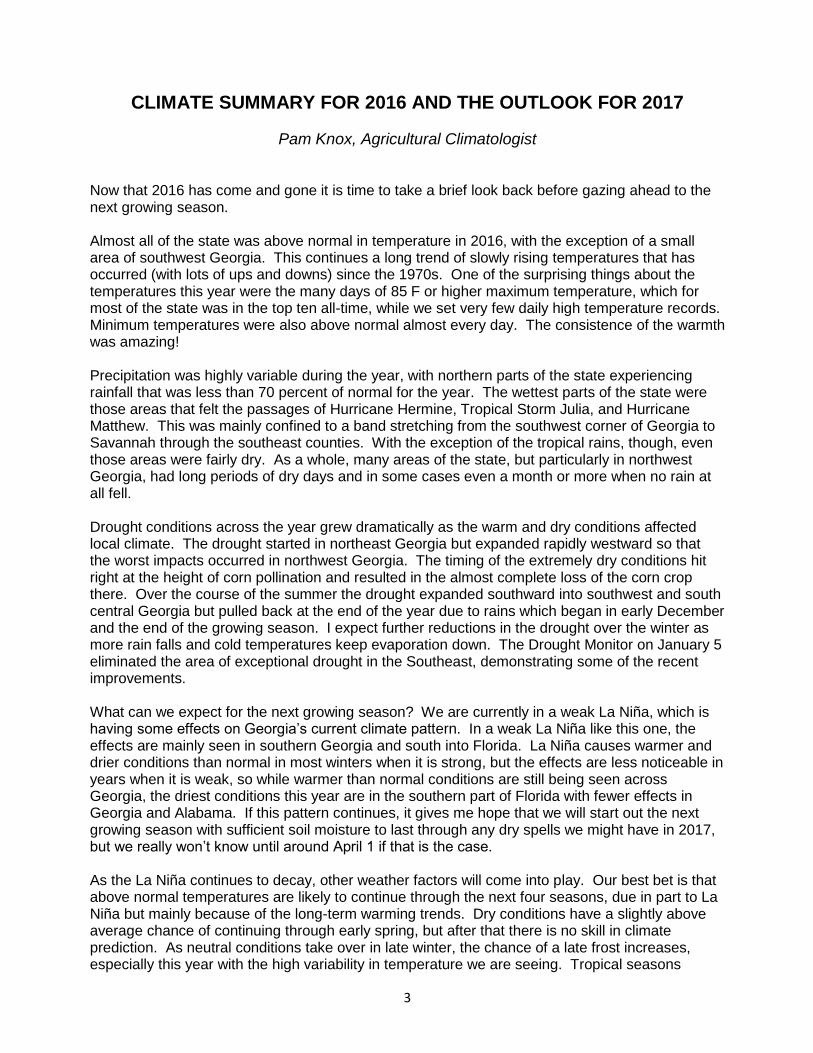
CLIMATE SUMMARY FOR 2016 AND THE OUTLOOK FOR 2017
Pam Knox, Agricultural Climatologist
Now that 2016 has come and gone it is time to take a brief look back before gazing ahead to the next growing season. Almost all of the state was above normal in temperature in 2016, with the exception of a small area of southwest Georgia. This continues a long trend of slowly rising temperatures that has occurred (with lots of ups and downs) since the 1970s. One of the surprising things about the temperatures this year were the many days of 85 F or higher maximum temperature, which for most of the state was in the top ten all-time, while we set very few daily high temperature records. Minimum temperatures were also above normal almost every day. The consistence of the warmth was amazing! Precipitation was highly variable during the year, with northern parts of the state experiencing rainfall that was less than 70 percent of normal for the year. The wettest parts of the state were those areas that felt the passages of Hurricane Hermine, Tropical Storm Julia, and Hurricane Matthew. This was mainly confined to a band stretching from the southwest corner of Georgia to Savannah through the southeast counties. With the exception of the tropical rains, though, even those areas were fairly dry. As a whole, many areas of the state, but particularly in northwest Georgia, had long periods of dry days and in some cases even a month or more when no rain at all fell. Drought conditions across the year grew dramatically as the warm and dry conditions affected local climate. The drought started in northeast Georgia but expanded rapidly westward so that the worst impacts occurred in northwest Georgia. The timing of the extremely dry conditions hit right at the height of corn pollination and resulted in the almost complete loss of the corn crop there. Over the course of the summer the drought expanded southward into southwest and south central Georgia but pulled back at the end of the year due to rains which began in early December and the end of the growing season. I expect further reductions in the drought over the winter as more rain falls and cold temperatures keep evaporation down. The Drought Monitor on January 5 eliminated the area of exceptional drought in the Southeast, demonstrating some of the recent improvements. What can we expect for the next growing season? We are currently in a weak La Niña, which is having some effects on Georgia’s current climate pattern. In a weak La Niña like this one, the effects are mainly seen in southern Georgia and south into Florida. La Niña causes warmer and drier conditions than normal in most winters when it is strong, but the effects are less noticeable in years when it is weak, so while warmer than normal conditions are still being seen across Georgia, the driest conditions this year are in the southern part of Florida with fewer effects in Georgia and Alabama. If this pattern continues, it gives me hope that we will start out the next growing season with sufficient soil moisture to last through any dry spells we might have in 2017, but we really won’t know until around April 1 if that is the case. As the La Niña continues to decay, other weather factors will come into play. Our best bet is that above normal temperatures are likely to continue through the next four seasons, due in part to La Niña but mainly because of the long-term warming trends. Dry conditions have a slightly above average chance of continuing through early spring, but after that there is no skill in climate prediction. As neutral conditions take over in late winter, the chance of a late frost increases, especially this year with the high variability in temperature we are seeing. Tropical seasons

4
during neutral conditions are also likely to be more active, which could bring more rain to us during the latter part of the growing season, but that depends critically on where the storms travel (as we saw this year). The next year—perhaps the tropics will swing back towards an El Niño. We won’t know this until mid-summer, but early signs look promising. Stay tuned! You can also contact me at 706-310-3467 or [email protected] for more information, or visit my web site at http://gaclimate.com or my blog at http://blog.extension.uga.edu/climate.
PEANUT CULTIVAR OPTIONS
W. Scott Monfort, Extension Peanut Agronomist
Peanut acres likely to remain elevated for the third year due to the reduced carryover as a result increased exports and reduced yields and quality in 2016. Low prices for other commodities are also going to entice growers to plant more peanuts. With this in mind, growers need to take several things into account before planting the first seed such as: rotation, field history for diseases and nematodes, irrigated/non- irrigated, and yield and grade potential. Unfortunately, growers have forgotten some of the aforementioned items and it has cost them some of their profits. I would encourage your growers to plan ahead and make sure they understand the risk associated with planting peanuts in short rotations or in fields with higher disease levels. Growers cannot continue to cut corners on inputs and expect to make high enough yields to remain economical under these highly risky situations.
Cultivar Selection and Planting Tips Each year we discuss the importance of selecting the right cultivar to plant in relation to yield, maturity, disease resistance etc. I know his has been somewhat of a moot point with most of the acres being planted to Georgia 06G but there are some growers planting other cultivars because of nematodes and disease pressure, and/or contract premiums for High Oleics. At this point, there is an estimated $50.00 premium for High Oleics. This puts contract prices between $475 and $550 for the upcoming season. Growers will need to contact the buying points for more information. There are always a few things to talk with your growers about as we move into the new growing season:
Due to last year’s growing conditions and some quality issues, seed quality (germ and vigor) may be an issue. We will not know until sheller’s start testing the seed lots they have.
Growers need to use the RX index to determine their risk before planting.
Growers need to be cautious of planting peanuts in April due to the increased potential of: o Unfavorable conditions (moisture, soil temperature below 68 degrees F,
unpredictable weather). o Increased thrips and TSWV Risk (remember Thimet is the only product that will
suppress TSWV).
Due to unpredictable rain events during April and May, I would encourage growers to plant non-irrigated first.
The cultivars commercially available this year are: Georgia-06G, Georgia-14N, Georgia-13M, Georgia-12Y, Georgia-09B, Tifguard, FloRunTM ‘107’, FloRunTM ‘157’, TUFRunnerTM ‘727’, TUFRunnerTM ‘297’and TUFRunnerTM ‘511’. Like the last few years, a majority of the peanut acreage produced for seed was planted in Georgia-06G. Seed supply for all other cultivars will be limited.
5
Things to remember about select cultivars:
Georgia-12Y is one of the first runner cultivars released with superior resistance to both white mold and TSWV.
Georgia-12Y is more susceptible to Rhizoctonia Limb Rot.
Georgia-13M and TUFRunnerTM ‘511’ were noted to be more susceptible to leafspot than Georgia 06G. Please refer to the Peanut Rx Section below for more information on disease risk for all of the available cultivars.
Based on the figures from the Georgia Crop Improvement Association, the largest percentage of acreage planted (91%) in 2016 for seed production was Georgia-06G (Table 1 below) followed by
Georgia-09B, Tifguard, Georgia-14N, and TUFRunnerTM ‘511’ at 4, 1, 1 and >1 %, respectively.
The table below provides the acreage planted in 2016 in Georgia for Foundation, Registered, and Certified seed supply in 2017.
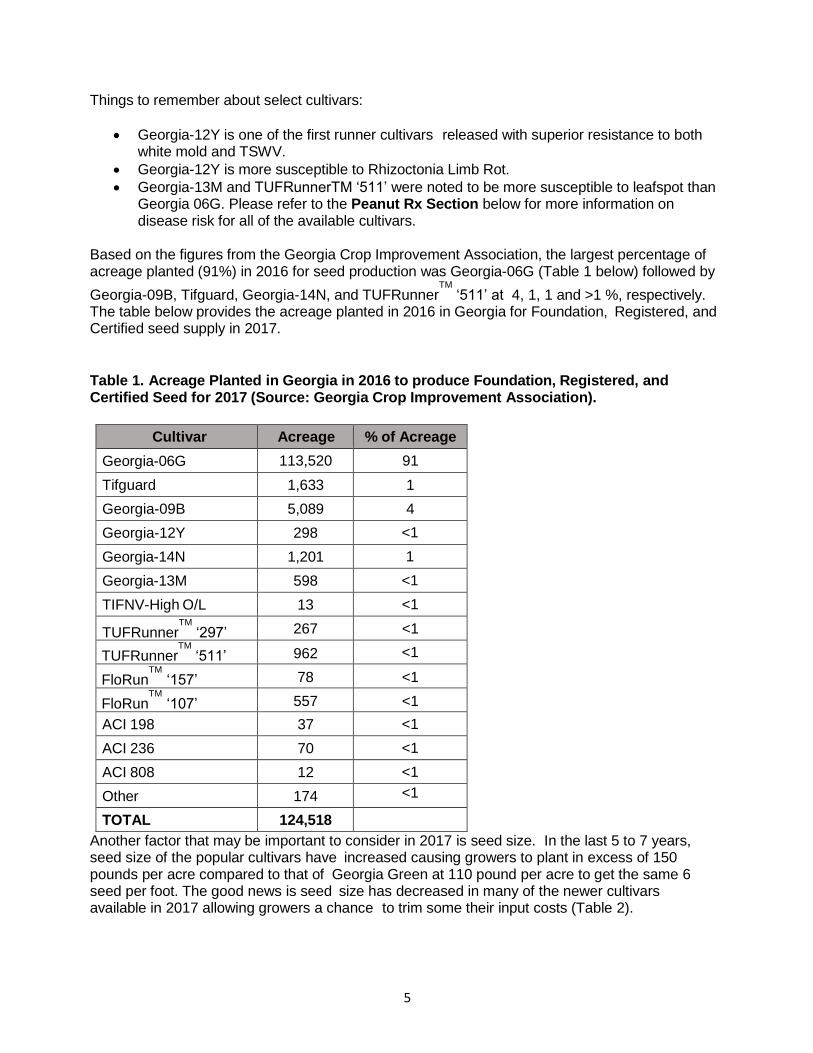
Table 1. Acreage Planted in Georgia in 2016 to produce Foundation, Registered, and Certified Seed for 2017 (Source: Georgia Crop Improvement Association).
Cultivar Acreage % of Acreage
Georgia-06G 113,520 91
Tifguard 1,633 1
Georgia-09B 5,089 4
Georgia-12Y 298 <1
Georgia-14N 1,201 1
Georgia-13M 598 <1
TIFNV-High O/L 13 <1
TUFRunnerTM ‘297’ 267 <1
TUFRunnerTM ‘511’ 962 <1
FloRunTM ‘157’ 78 <1
FloRunTM ‘107’ 557 <1
ACI 198 37 <1
ACI 236 70 <1
ACI 808 12 <1
Other 174 <1
TOTAL 124,518
Another factor that may be important to consider in 2017 is seed size. In the last 5 to 7 years, seed size of the popular cultivars have increased causing growers to plant in excess of 150 pounds per acre compared to that of Georgia Green at 110 pound per acre to get the same 6 seed per foot. The good news is seed size has decreased in many of the newer cultivars available in 2017 allowing growers a chance to trim some their input costs (Table 2).
6
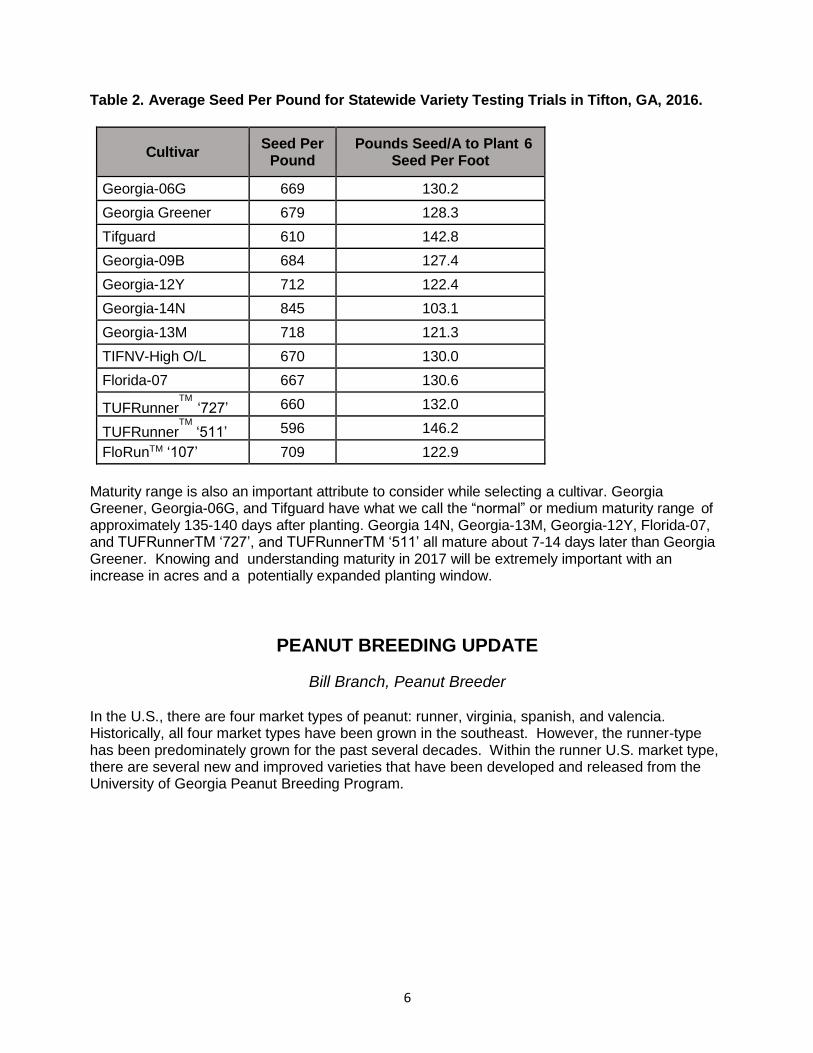
Table 2. Average Seed Per Pound for Statewide Variety Testing Trials in Tifton, GA, 2016.
Cultivar Seed Per
Pound Pounds Seed/A to Plant 6
Seed Per Foot
Georgia-06G 669 130.2
Georgia Greener 679 128.3
Tifguard 610 142.8
Georgia-09B 684 127.4
Georgia-12Y 712 122.4
Georgia-14N 845 103.1
Georgia-13M 718 121.3
TIFNV-High O/L 670 130.0
Florida-07 667 130.6
TUFRunnerTM ‘727’ 660 132.0
TUFRunnerTM ‘511’ 596 146.2
FloRunTM ‘107’ 709 122.9
Maturity range is also an important attribute to consider while selecting a cultivar. Georgia Greener, Georgia-06G, and Tifguard have what we call the “normal” or medium maturity range of approximately 135-140 days after planting. Georgia 14N, Georgia-13M, Georgia-12Y, Florida-07, and TUFRunnerTM ‘727’, and TUFRunnerTM ‘511’ all mature about 7-14 days later than Georgia Greener. Knowing and understanding maturity in 2017 will be extremely important with an increase in acres and a potentially expanded planting window.
PEANUT BREEDING UPDATE
Bill Branch, Peanut Breeder In the U.S., there are four market types of peanut: runner, virginia, spanish, and valencia. Historically, all four market types have been grown in the southeast. However, the runner-type has been predominately grown for the past several decades. Within the runner U.S. market type, there are several new and improved varieties that have been developed and released from the University of Georgia Peanut Breeding Program.
7
RUNNER-TYPE: “GEORGIA-06G” is a new high-yielding, TSWV-resistant, runner-type peanut variety that was released in 2006. It was developed at the University of Georgia, Coastal Plain Experiment Station in Tifton, GA. Georgia-06G has a high level of resistance to tomato spotted wilt virus (TSWV). In multilocation tests conducted in Georgia during the past several years, Georgia-06G was likewise found to be among the lowest in TSWV disease incidence and highest in yield, grade, and dollar value return per acre compared to all of the other runner-types. Georgia-06G is a large-seeded runner-type variety with growth habit and medium maturity similar to Georgia Green. It also has very good stability and a wide-range of adaptability. “GEORGIA GREENER” is a new high-yielding, TSWV-resistant, runner-type peanut variety that was released in 2006. It was developed at the University of Georgia, Coastal Plain Experiment Station in Tifton, GA. Georgia Greener has a high level of resistance to tomato spotted wilt virus (TSWV) and CBR resistance. In multilocation tests conducted in Georgia during the past several years, Georgia Greener was found to be among the lowest in TSWV disease incidence and highest in yield, grade, and dollar value return per acre compared to all of the other runner-types. Georgia Greener is more of a regular runner-type seed size variety with growth habit and medium maturity similar to Georgia Green. It also has very good stability and a wide-range of adaptability. “GEORGIA-07W” is a new high-yielding, TSWV-resistant, white mold-resistant, runner-type peanut variety that was released in 2007. It was developed at the University of Georgia, Coastal Plain Experiment Station in Tifton, GA. Georgia-07W has a high level of resistance to both diseases, tomato spotted wilt virus (TSWV) and white mold or stem rot. In multilocation tests conducted in Georgia during the past several years, Georgia-07W was found to be among the lowest in TSWV incidence and total disease incidence, highest in yield, grade, and dollar value return per acre. Georgia-07W is a large-seeded runner-type variety with a runner growth habit and medium maturity. It also has very good stability and a wide-range of adaptability. “GEORGIA-09B” is a new high-yielding, high-oleic, TSWV-resistant, medium-seeded, runner-type peanut variety that was released in 2009. It was developed at the University of Georgia, Coastal Plain Experiment Station, Tifton, GA. Georgia-09B originated from the first backcross made with ‘Georgia Green’, as the recurrent parent. During past years averaged over several multilocation tests in Georgia, Georgia-09B had significantly less TSWV disease incidence, higher yield and percent TSMK grade, larger seed size, and greater dollar value return per acre compared to Georgia Green. Georgia-09B has also showed significantly higher TSMK grade percentage than Florida-07 and higher dollar value. It was also found to have a medium runner seed size as compared to the larger high-oleic, runner-type variety, Florida-07. Georgia-09B combines the excellent roasted flavor of Georgia Green with the high-oleic trait for longer shelf-life and improved oil quality of peanut and peanut products. “GEORGIA-12Y” is a new high-yielding, TSWV-resistant and white mold-resistant, medium-seeded, runner-type variety that was released by the Georgia Agricultural Experiment Stations in 2012. It was developed at the University of Georgia, Coastal Plain Experiment Station, Tifton Campus. During three-years averaged over multilocation tests in Georgia, Georgia-12Y had significantly higher yield, dollar value return per acre, and number of seed per pound compared to Georgia-10T. However, Georgia-10T has a higher TSMK grade than Georgia-12Y. Georgia-12Y is most similar to Georgia-10T in later maturity. Both should be excellent varieties for an early-planting date option in the southeast U.S. peanut production area. “GEORGIA-13M” is a new high-yielding, high-oleic, TSWV-resistant, small-seeded, runner-type peanut variety that was released by the Georgia Agricultural Experiment Station in 2013. It was developed at the University of Georgia, Coastal Plain Experiment Station, Tifton, GA. During
8
three-years averaged over multiple location tests in Georgia, Georgia-13M had significantly less total disease incidence and greater dollar value return per acre compared to four other high-oleic, runner-type varieties. Georgia-13M was also found to have a smaller runner seed size as compared to these larger high-oleic, runner-type check varieties, Florida-07, FloRunTM ‘107’, Georgia-09B, and Georgia-02C. Georgia-13M combines high-yield, TSWV-resistance with the excellent roasted flavor of Georgia Green and the high-oleic trait for longer shelf-life and improved oil quality of peanut and peanut products. “GEORGIA-14N” is a new high-yielding, high-oleic, TSWV-resistant, RKN-resistant, small-seeded, runner-type peanut variety that was released by the Georgia Agricultural Experiment Station in 2014. It was developed at the University of Georgia, Coastal Plain Experiment Station, Tifton, GA. During three-years averaged over multiple location tests in Georgia, Georgia-14N had significantly less TSWV and total disease incidence, higher yield, grade, and dollar value return per acre compared to Tifguard. Georgia-14N was also found to have a smaller runner seed size as compared to the larger runner-type check variety, Tifguard. Georgia-14N combines high-yield, TSWV-resistance and RKN-resistance with smaller seed size and the high-oleic trait for longer shelf-life and improved oil quality of peanut and peanut products. “GEORGIA-16HO” is a new high-yielding, high-oleic, TSWV-resistant, large-seeded, runner-type peanut variety that was released by the Georgia Agricultural Experiment Station in 2016. It was developed at the University of Georgia, Coastal Plain Experiment Station, Tifton, GA. During three-years averaged over multiple location tests in Georgia, Georgia-16HO had significantly less TSWV and total disease incidence and higher pod yield, TSMK grade, and dollar value return per acre compared to the high-oleic, runner-type varieties, FloRun ‘107’, Florida-07, and TUFRunner ‘727’. Georgia-16HO was also found to have a large runner seed size similar to two other large-seeded, high-oleic, runner-type varieties, Florida-07 and TUFRunner ‘727’. Georgia-16HO combines high dollar value and TSWV-resistance with the high-oleic trait for longer shelf-lide and improved oil quality of peanut and peanut products. Multiple years and multiple locations are recommended for variety comparisons. The following tables present such combined variety test results in Georgia across years and locations.
9
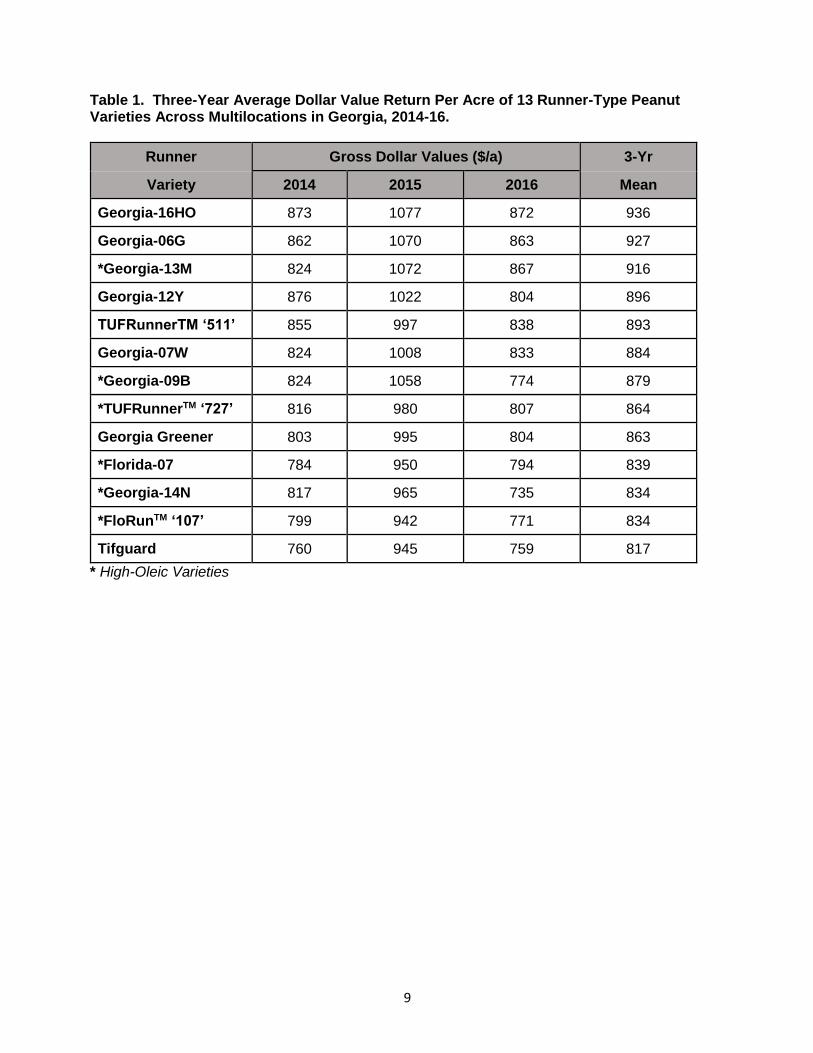
Table 1. Three-Year Average Dollar Value Return Per Acre of 13 Runner-Type Peanut Varieties Across Multilocations in Georgia, 2014-16.
Runner Gross Dollar Values ($/a) 3-Yr
Variety 2014 2015 2016 Mean
Georgia-16HO 873 1077 872 936
Georgia-06G 862 1070 863 927
*Georgia-13M 824 1072 867 916
Georgia-12Y 876 1022 804 896
TUFRunnerTM ‘511’ 855 997 838 893
Georgia-07W 824 1008 833 884
*Georgia-09B 824 1058 774 879
*TUFRunnerTM ‘727’ 816 980 807 864
Georgia Greener 803 995 804 863
*Florida-07 784 950 794 839
*Georgia-14N 817 965 735 834
*FloRunTM ‘107’ 799 942 771 834
Tifguard 760 945 759 817
* High-Oleic Varieties

10
Table 2. Three-Year Average Yield (Lb/A) of 13 Runner-Type Peanut Varieties Under Irrigation and Nonirrigation at Multilocations in Georgia, 2014-16.
Runner Tifton Plains Midville
Variety Irrig. Nonirrig. Irrig. Nonirrig. Irrig. Nonirrig.
Georgia-16HO 5783 5725 4613 4371 6228 4403
Georgia-06G 5416 5962 5708 4181 6391 4014
Georgia-13M 5417 5688 5543 4567 6385 4230
Georgia-12Y 5715 5612 5357 4123 6249 4649
TUFRunnerTM ‘511’ 5426 5613 5513 4472 6604 4234
Georgia-07W 5534 5541 4824 4474 6217 4289
Georgia-09B 5285 4855 5798 4393 6546 3915
TUFRunner TM ‘727’ 5261 5474 5101 4457 6232 4447
Georgia Greener 5175 5606 4956 4042 5723 3628
Florida-07 5285 5323 4964 4358 5986 4658
Georgia-14N 4707 5253 5130 4486 5991 3994
FloRunTM ‘107’ 5236 5038 5280 4219 6174 3912
Tifguard 5144 5250 4853 4251 6006 3930
11
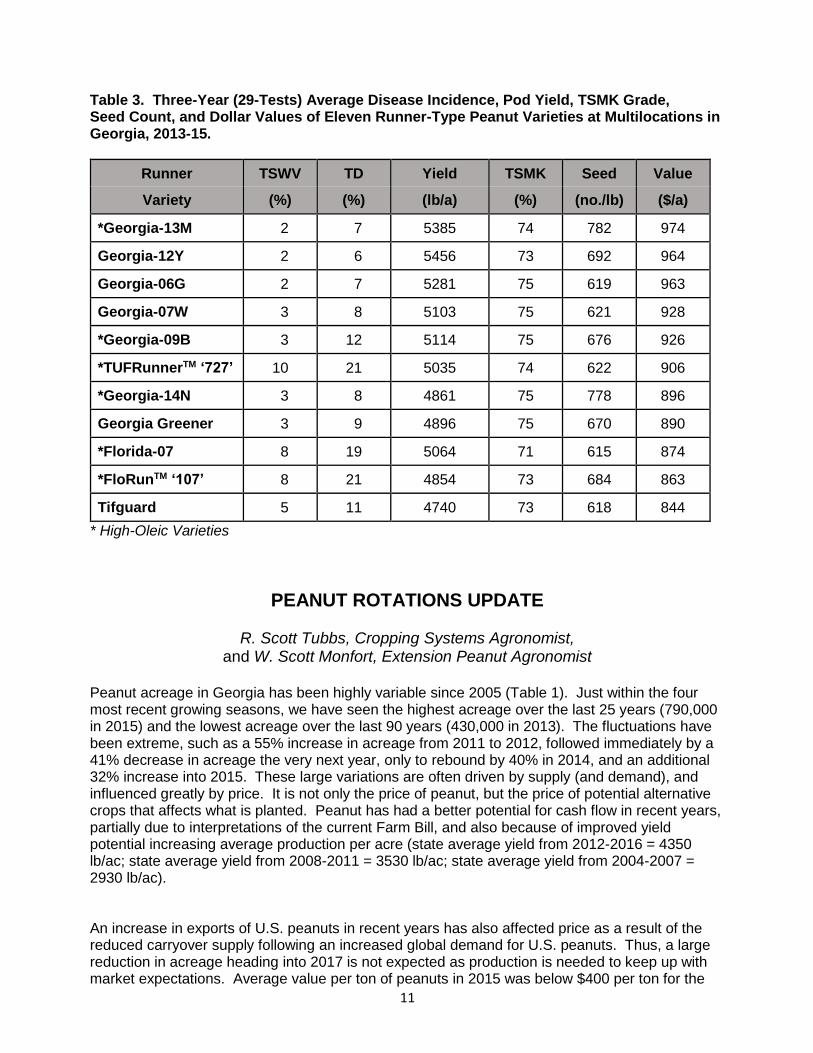
Table 3. Three-Year (29-Tests) Average Disease Incidence, Pod Yield, TSMK Grade, Seed Count, and Dollar Values of Eleven Runner-Type Peanut Varieties at Multilocations in Georgia, 2013-15.
Runner TSWV TD Yield TSMK Seed Value
Variety (%) (%) (lb/a) (%) (no./lb) ($/a)
*Georgia-13M 2 7 5385 74 782 974
Georgia-12Y 2 6 5456 73 692 964
Georgia-06G 2 7 5281 75 619 963
Georgia-07W 3 8 5103 75 621 928
*Georgia-09B 3 12 5114 75 676 926
*TUFRunnerTM ‘727’ 10 21 5035 74 622 906
*Georgia-14N 3 8 4861 75 778 896
Georgia Greener 3 9 4896 75 670 890
*Florida-07 8 19 5064 71 615 874
*FloRunTM ‘107’ 8 21 4854 73 684 863
Tifguard 5 11 4740 73 618 844
* High-Oleic Varieties
PEANUT ROTATIONS UPDATE
R. Scott Tubbs, Cropping Systems Agronomist, and W. Scott Monfort, Extension Peanut Agronomist
Peanut acreage in Georgia has been highly variable since 2005 (Table 1). Just within the four most recent growing seasons, we have seen the highest acreage over the last 25 years (790,000 in 2015) and the lowest acreage over the last 90 years (430,000 in 2013). The fluctuations have been extreme, such as a 55% increase in acreage from 2011 to 2012, followed immediately by a 41% decrease in acreage the very next year, only to rebound by 40% in 2014, and an additional 32% increase into 2015. These large variations are often driven by supply (and demand), and influenced greatly by price. It is not only the price of peanut, but the price of potential alternative crops that affects what is planted. Peanut has had a better potential for cash flow in recent years, partially due to interpretations of the current Farm Bill, and also because of improved yield potential increasing average production per acre (state average yield from 2012-2016 = 4350 lb/ac; state average yield from 2008-2011 = 3530 lb/ac; state average yield from 2004-2007 = 2930 lb/ac). An increase in exports of U.S. peanuts in recent years has also affected price as a result of the reduced carryover supply following an increased global demand for U.S. peanuts. Thus, a large reduction in acreage heading into 2017 is not expected as production is needed to keep up with market expectations. Average value per ton of peanuts in 2015 was below $400 per ton for the

12
first time since 2006, with 2016 value still pending at time of publication (according to USDA-NASS data). The ratio of legume row crops to non-legume row crops can sustain the recommended 3-year rotation between legume crops when the ratio remains around 0.50. However, when that ratio increases closer to 1.0, it is impossible to keep the recommended rotation length on a large proportion of the peanut crop. The ratio in 2016 was 0.62 which was well above the sustainable average for the second straight year (Table 2). When this ratio stays high for several consecutive years, it becomes even more difficult to find land suitable for good rotation practices, and peanut pest pressures increase substantially. It is predicted that the ratio in 2017 will remain higher than 0.50 for a fourth consecutive year and could cause an unbalance in future rotations for peanut. When an unbalance occurs and peanut is planted on shorter rotations, an increase in pest incidence can threaten yield potential and put pressure on methods of pest suppression, including genetic resistance and chemical modes of action. Loss of either genetic resistance or certain classes of fungicides, herbicides, or insecticides could be devastating to peanut production.
Table 1. Planted acreage in Georgia for major row crops, 2005-2016.
Year Peanut Cotton Corn Soybean
--------------- Planted Acres x 1,000 ---------------
2005 755 1,220 270 180
2006 580 1,400 280 155
2007 530 1,030 510 295
2008 690 940 370 430
2009 510 1,000 420 470
2010 565 1,330 295 270
2011 475 1,600 345 155
2012 735 1,290 345 220
2013 430 1,370 510 235
2014 600 1,380 350 300
2015 790 1,120 330 330
2016 720 1,190 410 265
Source: USDA – National Agricultural Statistics Service
13
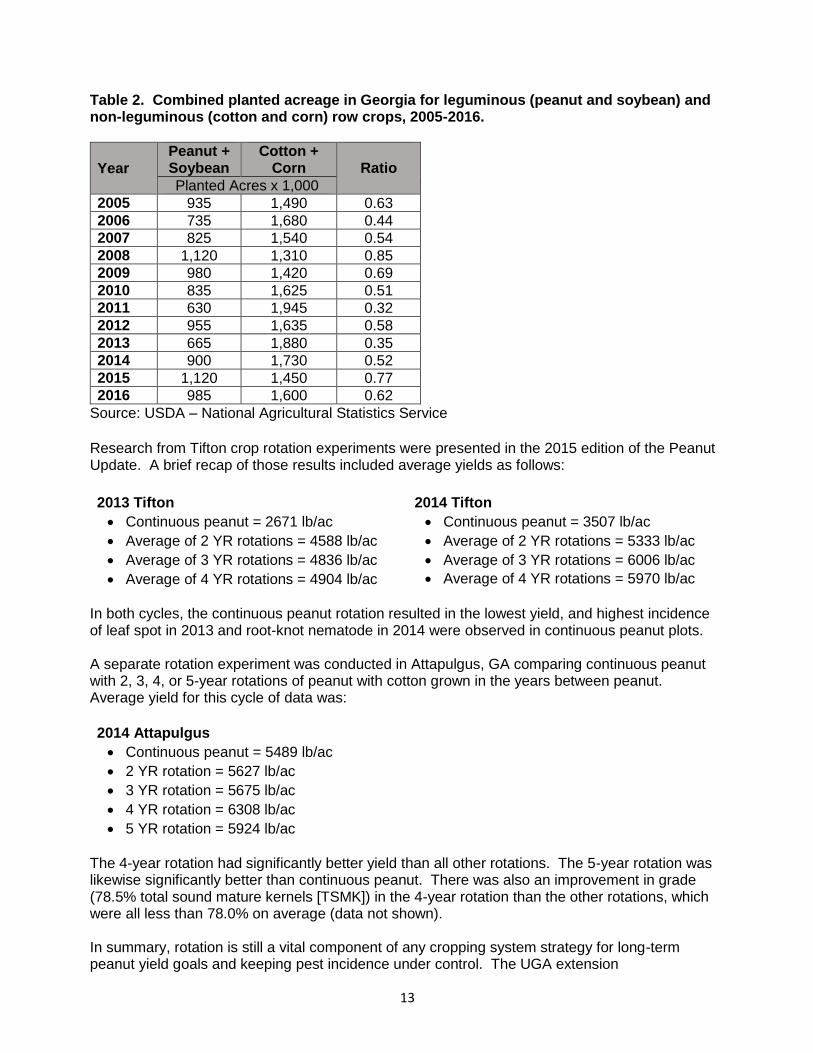
Table 2. Combined planted acreage in Georgia for leguminous (peanut and soybean) and non-leguminous (cotton and corn) row crops, 2005-2016.
Year
Peanut + Soybean
Cotton + Corn
Ratio
Planted Acres x 1,000
2005 935 1,490 0.63
2006 735 1,680 0.44
2007 825 1,540 0.54
2008 1,120 1,310 0.85
2009 980 1,420 0.69
2010 835 1,625 0.51
2011 630 1,945 0.32
2012 955 1,635 0.58
2013 665 1,880 0.35
2014 900 1,730 0.52
2015 1,120 1,450 0.77
2016 985 1,600 0.62
Source: USDA – National Agricultural Statistics Service
Research from Tifton crop rotation experiments were presented in the 2015 edition of the Peanut Update. A brief recap of those results included average yields as follows:
2013 Tifton 2014 Tifton
Continuous peanut = 2671 lb/ac Continuous peanut = 3507 lb/ac
Average of 2 YR rotations = 4588 lb/ac Average of 2 YR rotations = 5333 lb/ac
Average of 3 YR rotations = 4836 lb/ac Average of 3 YR rotations = 6006 lb/ac
Average of 4 YR rotations = 4904 lb/ac Average of 4 YR rotations = 5970 lb/ac
In both cycles, the continuous peanut rotation resulted in the lowest yield, and highest incidence of leaf spot in 2013 and root-knot nematode in 2014 were observed in continuous peanut plots. A separate rotation experiment was conducted in Attapulgus, GA comparing continuous peanut with 2, 3, 4, or 5-year rotations of peanut with cotton grown in the years between peanut. Average yield for this cycle of data was:
2014 Attapulgus
Continuous peanut = 5489 lb/ac
2 YR rotation = 5627 lb/ac
3 YR rotation = 5675 lb/ac
4 YR rotation = 6308 lb/ac
5 YR rotation = 5924 lb/ac
The 4-year rotation had significantly better yield than all other rotations. The 5-year rotation was likewise significantly better than continuous peanut. There was also an improvement in grade (78.5% total sound mature kernels [TSMK]) in the 4-year rotation than the other rotations, which were all less than 78.0% on average (data not shown). In summary, rotation is still a vital component of any cropping system strategy for long-term peanut yield goals and keeping pest incidence under control. The UGA extension
14
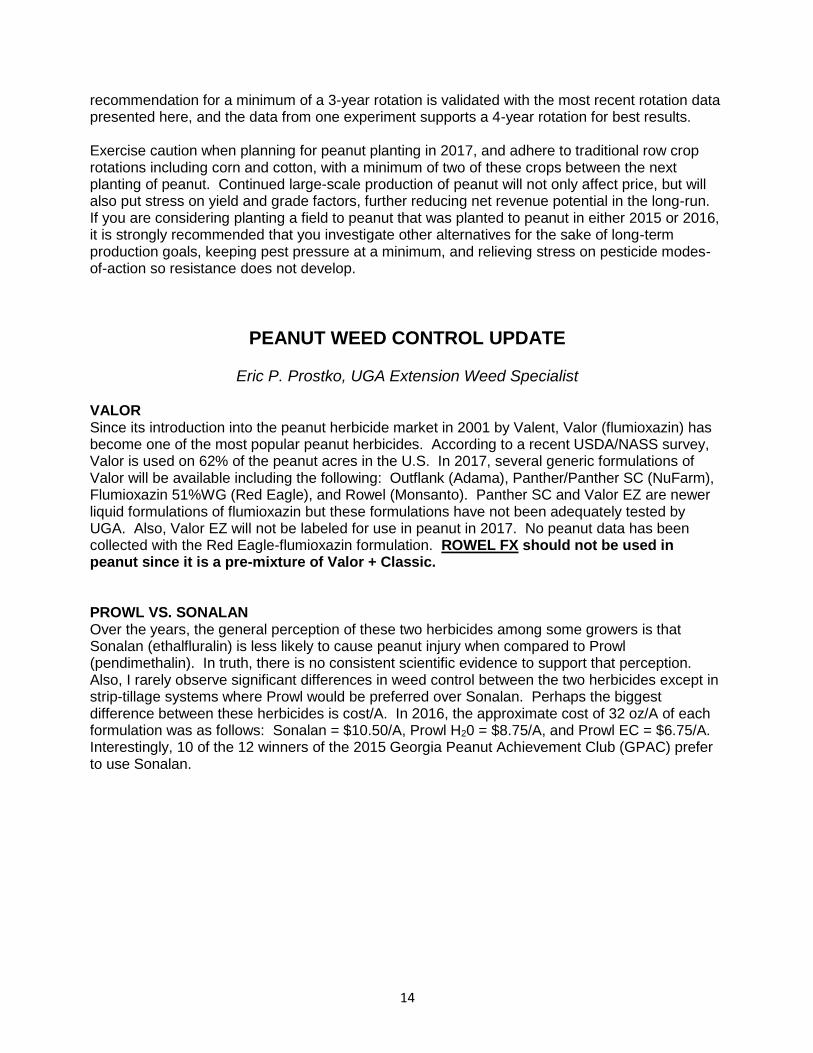
recommendation for a minimum of a 3-year rotation is validated with the most recent rotation data presented here, and the data from one experiment supports a 4-year rotation for best results. Exercise caution when planning for peanut planting in 2017, and adhere to traditional row crop rotations including corn and cotton, with a minimum of two of these crops between the next planting of peanut. Continued large-scale production of peanut will not only affect price, but will also put stress on yield and grade factors, further reducing net revenue potential in the long-run. If you are considering planting a field to peanut that was planted to peanut in either 2015 or 2016, it is strongly recommended that you investigate other alternatives for the sake of long-term production goals, keeping pest pressure at a minimum, and relieving stress on pesticide modes-of-action so resistance does not develop.
PEANUT WEED CONTROL UPDATE
Eric P. Prostko, UGA Extension Weed Specialist VALOR Since its introduction into the peanut herbicide market in 2001 by Valent, Valor (flumioxazin) has become one of the most popular peanut herbicides. According to a recent USDA/NASS survey, Valor is used on 62% of the peanut acres in the U.S. In 2017, several generic formulations of Valor will be available including the following: Outflank (Adama), Panther/Panther SC (NuFarm), Flumioxazin 51%WG (Red Eagle), and Rowel (Monsanto). Panther SC and Valor EZ are newer liquid formulations of flumioxazin but these formulations have not been adequately tested by UGA. Also, Valor EZ will not be labeled for use in peanut in 2017. No peanut data has been collected with the Red Eagle-flumioxazin formulation. ROWEL FX should not be used in peanut since it is a pre-mixture of Valor + Classic. PROWL VS. SONALAN Over the years, the general perception of these two herbicides among some growers is that Sonalan (ethalfluralin) is less likely to cause peanut injury when compared to Prowl (pendimethalin). In truth, there is no consistent scientific evidence to support that perception. Also, I rarely observe significant differences in weed control between the two herbicides except in strip-tillage systems where Prowl would be preferred over Sonalan. Perhaps the biggest difference between these herbicides is cost/A. In 2016, the approximate cost of 32 oz/A of each formulation was as follows: Sonalan = $10.50/A, Prowl H20 = $8.75/A, and Prowl EC = $6.75/A. Interestingly, 10 of the 12 winners of the 2015 Georgia Peanut Achievement Club (GPAC) prefer to use Sonalan.

15
HOW DO THE TOP GEORGIA PEANUT GROWERS MANAGE WEEDS? In 2015, 12 winners of the GPAC produced an average peanut yield of 6426 lbs/A (state average was 4470 lb/A). Survey results from these high yield growers indicated the following production practices were used to manage weeds on their farms:
12/12 – irrigated
9/12 - bottom plow
12/12 - twin rows
Peanut Rotation (1-4 years = 2/12; 1-3 years = 8/12; 1-2 years = 2/12)
Herbicides (10/12 - Sonalan; 10/12 - Valor; 2/12 - Dual; 9/12 - Cadre; 6/12 - 2,4-DB; 2/12 - Strongarm; 2/12 – Prowl)
PEANUT RESPONSE TO AUXIN HERBICIDES With the recent registration of Xtendimax (dicamba) and likely registration of Enlist Duo (glyphosate + 2,4-D choline) for use on tolerant cotton and soybean varieties, there is some concern about the potential drift effects of these herbicides on peanut. UGA weed scientists have been investigating this issue for several years. Generally, the response of peanut to these herbicides is dependent upon several factors including rate and time of application. Results of 2016 simulated drift studies are presented in the following tables: Table 1. Irrigated Peanut (GA-12Y) Yield Losses (%) Caused by Simulated Drift of Enlist Duo 3.3 SL (glyphosate + 2,4-D choline), 2016.
Rate/A
Time of Application (DAP1)
15 30 60 90
56 oz/A (1X) 45 61 64 56
5.6 oz/A (1/10X) 12 11 7 3
0.56 oz/A
(1/100X) 12 5 5 5
LSD 0.10 8
1DAP = days after planting.
Table 2. Irrigated Peanut (GA-06G) Yield Losses (%) Caused by Engenia 5SL (dicamba-BAPMA), 2016.
Rate/A
Time of Application (DAP1)
15 30 60 90
12.8 oz (1X) 87 93 87 38
1.28 oz (1/10X) 16 19 23 3
0.128 oz (1/100X)
6 8 3 0
LSD 0.10 7 1DAP = days after planting.

16
POTENTIAL NEW PEANUT HERBICIDE LABELS At some point in the future, Zidua (pyroxasulfone), Anthem Flex (pyroxasulfone + carfentrazone) and Brake (fluridone) could be labeled for use in peanut. UGA weed scientists have been evaluating crop tolerance and use patterns and will provide appropriate recommendations when labeled. HERBICIDE-RESISTANT WEEDS UGA weed scientists are currently investigating potential Cadre (imazapic) resistance in several species including sicklepod and yellow nutsedge. PPO-resistance is on the rise in other areas of the country (3 species in US). At this point, PPO-resistance has not been confirmed in Georgia. Frequently used PPO herbicides include Aim (carfentrazone), Cobra (lactofen), Reflex (fomesafen), Spartan (sulfentrazone) and Valor (flumioxazin). Avoid repeated applications of PPO herbicides in the same year and hand-remove weed escapes before seed production! PEANUT WEED CONTROL PROGRAMS Peanut growers are fortunate to have 18 active ingredients registered for use as herbicides. In general, these herbicides are very effective when applied at the appropriate rate and time. Failure to start clean at planting, residual herbicides that are not activated with timely irrigation/ rainfall, POST applications to large weeds (>3” tall), and unfavorable environmental conditions (hot and dry) are the most common causes of reduced herbicide performance. The most cost-effective peanut weed control programs combine the use of cultural, mechanical, and chemical practices. The following herbicide programs are recommended for use in Georgia: Table 3. Recommended Herbicide Programs for Managing Weeds in Peanut in Georgia, 2017.1
Preplant
Incorporated Preemergence2
Cracking or early postemergence3
(weeds ≤ 3”)
15-25 DAP10
Postemergence4 (weeds ≤ 3”)
30-40 DAP
Late Postemergence
(as needed)
Prowl5 or Sonalan
Valor6,9
(Add Strongarm if annual morningglory
is a concern)
Cadre or Cobra7 or Ultra Blazer7 + Dual Magnum8 or
Warrant8 + 2,4-DB
2,4-DB11
Prowl5 or Sonalan
Gramoxone SL or Firestorm or Parazone or
Helmquat + Storm + Warrant or Dual
Magnum8
Cadre, or Cobra7
or Ultra Blazer7 + Dual Magnum8 or Warrant8 + 2,4-
DB
2,4-DB11
1ALS-resistant Palmer amaranth is a very serious concern. An aggressive management program is necessary to slow spread of the resistant biotypes and to reduce selection pressure in areas currently not infested with resistant biotypes. A combination of tillage, soil residuals, and postemergence herbicides will be required for optimum control. 2Strongarm can be tank-mixed with Valor to improve the control of broadleaf weeds especially annual morningglory.
3Apply cracking or early postemergence treatment only if weeds have emerged.

17
4Cadre may be tank-mixed with Cobra or Ultra Blazer if needed for control of other weed species. Cadre is an ALS- inhibitor. Because of concerns with weed resistance to ALS-inhibitors, a mixture of Cobra or Ultra Blazer with Cadre would be preferred over Cadre alone. When using Cadre, follow all labeled crop rotation restrictions. 5Generic brands of Prowl (pendimethalin) are available and perform similarly. Prowl or Sonalan can be used preemergence if 0.5-0.75" of water can be applied within 48 hours of application. Either can be tank-mixed with Valor or Valor + Strongarm in this situation. 6If Valor is properly activated with 0.5-0.75" of rainfall or irrigation within 7 days of application, it is unlikely that an “at-cracking” treatment will be required. However, if control with Valor is unacceptable, an “at-cracking” treatment of Gramoxone or Firestorm or Parazone or Helmquat + Storm + Dual Magnum or Warrant should be applied. 7Valor, Cobra, Spartan Charge, Storm, and Ultra Blazer have the same mode of action (PPO inhibitor). Consequently, no more than 2 applications of these herbicides should be used in a season. 8Generic brands of metolachlor are available (Stalwart, Parallel PCS, Me-Too-Lachlor). However, these generic brands have not provided the same length of residual control as Dual Magnum (S-metolachlor) in some UGA field trials. When tank-mixing paraquat, Cobra or Ultra Blazer with Dual Magnum/generics, additional spray adjuvants (NIS, COC) are not recommended and will likely increase peanut injury. When using Warrant with POST applications, add NIS. 9Generic formulations of Valor 51WG (flumioxazin) are also available including Outflank, Panther, Red Eagle-Flumioxazin, and Rowel. Panther SC and Valor EZ are liquid formulations but have not yet been adequately tested by UGA weed scientists. Valor EZ is not labeled for use in peanut. No data has been collected with the Red Eagle-flumioxazin formulation. 10DAP = days after planting. 11Label restrictions permit only 2 applications of 2,4-DB per year. Pre-harvest interval for 2,4-DB is 45-60 days depending upon the label. SPECIAL NOTE: Dual Magnum and Warrant are in the same herbicide family and have the same mode of action (inhibit very long chain fatty acids). Multiple applications (> 2) of these herbicides in a single year should be avoided to prevent or delay the evolution of resistance. These herbicides have no postemergence activity.
PEANUT INSECT MANAGEMENT
Mark Abney, Peanut Entomologist THRIPS Thrips are present every year in Georgia, but it is impossible to predict how severe infestations will be in a given growing season. Thrips populations have been moderate to high in peanut fields every year since 2013. The pattern during this time has been for adult thrips move into peanut fields in early to mid-May. These adults lay eggs, and it is the immature thrips from these eggs that cause most of the feeding injury we see on the foliage. Most growers will use an at-plant insecticide or seed treatment to control thrips. Applying a foliar insecticide can reduce damage
18
when no at-plant treatment is made or when the residual activity of at-plant products begins to diminish, but timing is important. Treatments should be applied when adult thrips are present but before severe damage is observed. This is not as easy as it sounds, and many foliar sprays targeting thrips are applied too late. Growers should be aware that thrips flights can occur anytime from mid-April to early June. It is important that we continue to use the recommendations found in Peanut Rx for reducing thrips pressure and Tomato Spotted Wilt Virus. Phorate (Thimet®) is still the only insecticide that has been shown to reduce TSWV incidence in peanut, and it provides good protection against direct feeding damage. In-furrow applications of liquid imidacloprid (Admire Pro®) have shown good efficacy against thrips in a number of University trials in recent years. Resistance to neonicotinoid insecticides (e.g. imidacloprid) has been documented in tobacco thrips populations from the Mid-South, Mid-Atlantic and Southern regions of the US. As of spring 2016, no thrips control failures associated with resistance to this class of insecticides have been documented in Georgia peanut. Available peanut seed treatments do not provide adequate thrips suppression in years with heavy pest pressure. It is common to see some thrips feeding injury on peanut seedlings regardless of what at-plant insecticide is used; no insecticide will be completely effective 100% of the time. The impact of direct thrips feeding on yield and time to maturity is not well understood. Until economic thresholds are available, minimizing crop stress will continue to be an important consideration in making thrips management decisions. SOUTHERN CORN ROOTWORM Southern corn rootworm (SCRW) is not typically a major pest in Georgia peanut, but infestations in 2016 were the most widespread in recent memory. The immature stage of the rootworm lives entirely below the soil surface where it feeds on developing peanut roots and pods. Infestations are almost always found in moist soil with high clay or organic matter content, and larvae cannot survive dry soil conditions. The irrigated, high clay soils in southwest GA are at much higher risk of SCRW than the coarser, sandy soils in other parts of the production region. Granular chlorpyrifos is the only insecticide that has been proven to reduce SCRW populations, and applications made after infestations are established are generally not effective. This creates a serious management challenge for growers who must decide whether or not to treat fields before the insect is present. Because SCRW infestations are sporadic and because the use of granular chlorpyrifos increases the likelihood of secondary pest outbreaks, UGA does not recommend that all peanut fields be treated. Nevertheless, insecticide application is probably warranted on irrigated fields with high percent clay content and a history of SCRW damage. In late 2016, the US Environmental Protection Agency proposed that all food use tolerances for chlorpyrifos be revoked. The loss of chlorpyrifos will leave peanut producers with no viable option for SCRW control. Research is planned for 2017 that will evaluate the efficacy of alternative insecticide chemistry against SCRW. BURROWER BUG Burrower bug damage resulting in grade reductions and lost profit for some growers was observed in 2016. The burrower bug thrives in hot, dry conditions. While sometimes a problem in irrigated fields, it is most prevalent and damaging in non-irrigated peanut. Granular chlorpyrifos is the only insecticide that has been shown to have efficacy against burrower bug, and it does not provide complete control. The factors that are known to increase the risk of burrower bug damage are conservation tillage and hot, dry soil conditions. Conversely, deep turning and irrigation reduce the likelihood of infestations. Many growers have asked the question, “Will abandoning conservation tillage in favor of a turning plow eliminate the burrower bug problem?” Previous research suggests that the risk of damage will decline, but there are no certainties. Burrower bug damage has been reported in GA from fields that were turned prior to planting. Work is currently

19
underway to quantify the risk associated with different production practices, location, soil type, etc. In the near term, management options available to growers who have experienced significant losses due to burrower bug are limited to deep turning and application of granular chlorpyrifos. A USDA funded research project was initiated in the fall of 2016 to develop a risk index for peanut burrower bug. The success of this project will depend on cooperation between UGA Extension, peanut growers, and buying point operators. Identifying fields where burrower bug damage occurred and collecting field and production information will provide the foundational data from which the risk assessment tool will be created. THE USE OF PYRETHROID INSECTICIDES IN PEANUT The pyrethroids constitute a useful class of insecticides that have provided many years of effective insect control. Because of the low cost of these materials and their history of good efficacy against a wide range of pests, it is not uncommon for a pyrethroid to be added to a tank mix with peanut fungicides to “clean up” any insects that might be present in the field. The reality is that in 2017, a pyrethroid in the peanut field can create more problems than it solves if the chemistry is not used wisely. Broad spectrum insecticides will destroy beneficial insects, and this can lead to outbreaks of secondary pests. The use of pyrethroids increases the risk of two spotted spider mite outbreaks in non-irrigated peanut fields. Spider mites are one of the most difficult to control pests that attack peanut. It is also important to recognize that many of the insect pests found in peanut are no longer susceptible to pyrethroids; tobacco budworm, soybean looper, and most armyworms will not be controlled by pyrethroids applications. With this information in mind, pyrethroids can and do have a fit in peanut production. They are the chemistry of choice for several of our “bug” pests like three cornered alfalfa hopper and potato leafhopper and can be a good option for some caterpillars (like velvetbean caterpillar) when conditions do not favor spider mite outbreaks. Using pyrethroid insecticides only when scouting indicates that susceptible pests are present and the likelihood of secondary pest outbreak is low makes good economic and environmental sense.
PEANUT IRRIGATION UPDATE
Wesley M. Porter, Irrigation & Precision Ag Specialist WEATHER CONDITIONS Weather conditions from year to year are variable, can be difficult to plan for, and have a large impact on crop growth, development, and yield. So we must find ways to adapt to changing conditions and manage our crop to these varying conditions. The vast differences between 2014, 2015, and 2016 was a prime example of variable weather conditions. During 2014 we had a very wet early season which was good to build soil moisture, but heavy rains in late April and early May caused split plantings in the peanut crop. This is a major problem because the crop had to be managed for two maturity levels. Then later in the season the rain amounts were greatly reduced and dryland crops suffered tremendously. However, the 2015 season brought the opposite in many regions of the state. While there were areas throughout the state of sporadic drought, overall more than ample rainfall throughout the season was received. Similar to 2015, 2016 brought a high level of rainfall. At my research site near Camilla, GA the weather station reported 25.80 inches of rain from May 11 until October 15, or the time from planting until harvest on these peanut plots. Based on the UGA Peanut Production guide, peanut only requires 23 inches of water for production. So theoretically during 2016 ample rainfall was received and no irrigation should have been required. Notice the word theoretically, results will be discussed later
20
in this update. This main goal of this update is to discuss how to manage irrigation in varied weather conditions from year to year.
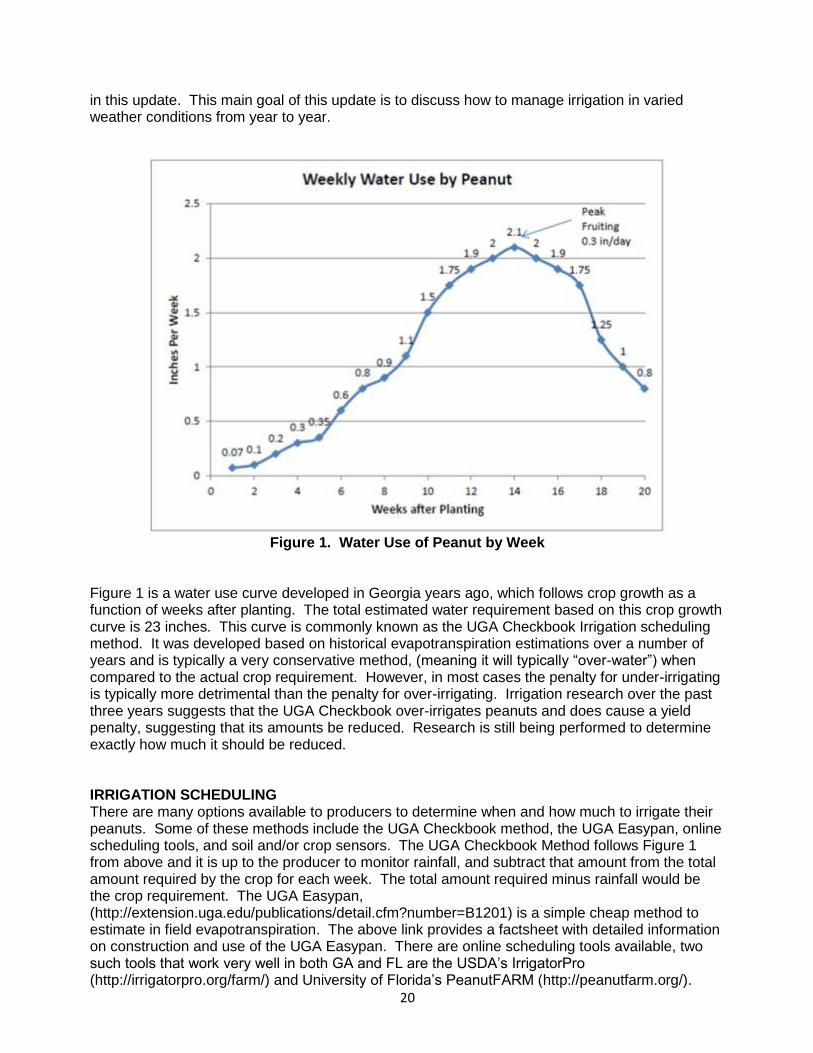
Figure 1. Water Use of Peanut by Week
Figure 1 is a water use curve developed in Georgia years ago, which follows crop growth as a function of weeks after planting. The total estimated water requirement based on this crop growth curve is 23 inches. This curve is commonly known as the UGA Checkbook Irrigation scheduling method. It was developed based on historical evapotranspiration estimations over a number of years and is typically a very conservative method, (meaning it will typically “over-water”) when compared to the actual crop requirement. However, in most cases the penalty for under-irrigating is typically more detrimental than the penalty for over-irrigating. Irrigation research over the past three years suggests that the UGA Checkbook over-irrigates peanuts and does cause a yield penalty, suggesting that its amounts be reduced. Research is still being performed to determine exactly how much it should be reduced. IRRIGATION SCHEDULING There are many options available to producers to determine when and how much to irrigate their peanuts. Some of these methods include the UGA Checkbook method, the UGA Easypan, online scheduling tools, and soil and/or crop sensors. The UGA Checkbook Method follows Figure 1 from above and it is up to the producer to monitor rainfall, and subtract that amount from the total amount required by the crop for each week. The total amount required minus rainfall would be the crop requirement. The UGA Easypan, (http://extension.uga.edu/publications/detail.cfm?number=B1201) is a simple cheap method to estimate in field evapotranspiration. The above link provides a factsheet with detailed information on construction and use of the UGA Easypan. There are online scheduling tools available, two such tools that work very well in both GA and FL are the USDA’s IrrigatorPro (http://irrigatorpro.org/farm/) and University of Florida’s PeanutFARM (http://peanutfarm.org/).
21
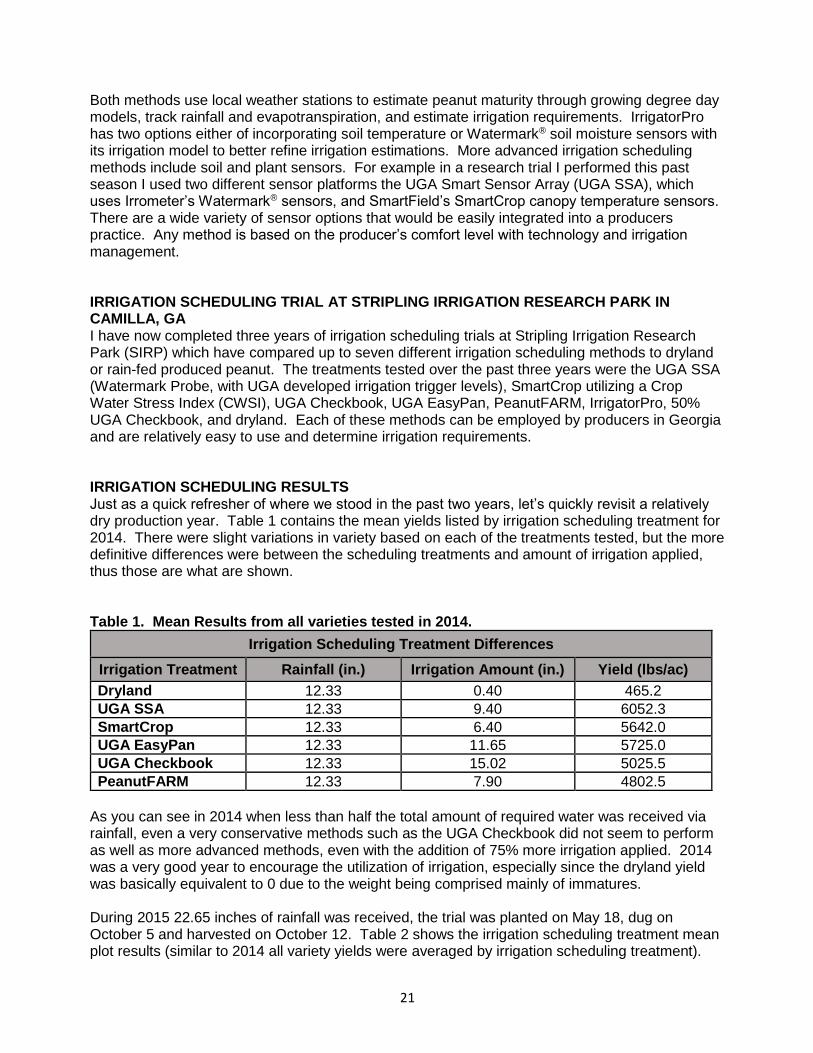
Both methods use local weather stations to estimate peanut maturity through growing degree day models, track rainfall and evapotranspiration, and estimate irrigation requirements. IrrigatorPro has two options either of incorporating soil temperature or Watermark® soil moisture sensors with its irrigation model to better refine irrigation estimations. More advanced irrigation scheduling methods include soil and plant sensors. For example in a research trial I performed this past season I used two different sensor platforms the UGA Smart Sensor Array (UGA SSA), which uses Irrometer’s Watermark® sensors, and SmartField’s SmartCrop canopy temperature sensors. There are a wide variety of sensor options that would be easily integrated into a producers practice. Any method is based on the producer’s comfort level with technology and irrigation management. IRRIGATION SCHEDULING TRIAL AT STRIPLING IRRIGATION RESEARCH PARK IN CAMILLA, GA I have now completed three years of irrigation scheduling trials at Stripling Irrigation Research Park (SIRP) which have compared up to seven different irrigation scheduling methods to dryland or rain-fed produced peanut. The treatments tested over the past three years were the UGA SSA (Watermark Probe, with UGA developed irrigation trigger levels), SmartCrop utilizing a Crop Water Stress Index (CWSI), UGA Checkbook, UGA EasyPan, PeanutFARM, IrrigatorPro, 50% UGA Checkbook, and dryland. Each of these methods can be employed by producers in Georgia and are relatively easy to use and determine irrigation requirements. IRRIGATION SCHEDULING RESULTS Just as a quick refresher of where we stood in the past two years, let’s quickly revisit a relatively dry production year. Table 1 contains the mean yields listed by irrigation scheduling treatment for 2014. There were slight variations in variety based on each of the treatments tested, but the more definitive differences were between the scheduling treatments and amount of irrigation applied, thus those are what are shown.
Table 1. Mean Results from all varieties tested in 2014.
Irrigation Scheduling Treatment Differences
Irrigation Treatment Rainfall (in.) Irrigation Amount (in.) Yield (lbs/ac)
Dryland 12.33 0.40 465.2
UGA SSA 12.33 9.40 6052.3
SmartCrop 12.33 6.40 5642.0
UGA EasyPan 12.33 11.65 5725.0
UGA Checkbook 12.33 15.02 5025.5
PeanutFARM 12.33 7.90 4802.5
As you can see in 2014 when less than half the total amount of required water was received via rainfall, even a very conservative methods such as the UGA Checkbook did not seem to perform as well as more advanced methods, even with the addition of 75% more irrigation applied. 2014 was a very good year to encourage the utilization of irrigation, especially since the dryland yield was basically equivalent to 0 due to the weight being comprised mainly of immatures. During 2015 22.65 inches of rainfall was received, the trial was planted on May 18, dug on October 5 and harvested on October 12. Table 2 shows the irrigation scheduling treatment mean plot results (similar to 2014 all variety yields were averaged by irrigation scheduling treatment).
22
Table 2. Mean Irrigation Scheduling Results 2015.
Irrigation Scheduling Treatment Differences
Irrigation Treatment Irrigation Amount (in.) Total Water (in.) Yield (lbs/ac)
Dryland 0.5 23.30 5193.6
UGA SSA 4.45 27.25 5478.6
SmartCrop CWSI 3.55 26.35 5172.8
UGA Checkbook 12.50 35.30 5313.4
UGA EasyPan 5.20 28.00 5404.9
PeanutFARM 5.20 28.00 5327.3
IrrigatorPro 2.80 25.60 5542.6
50% Checkbook 6.76 29.56 5176.1
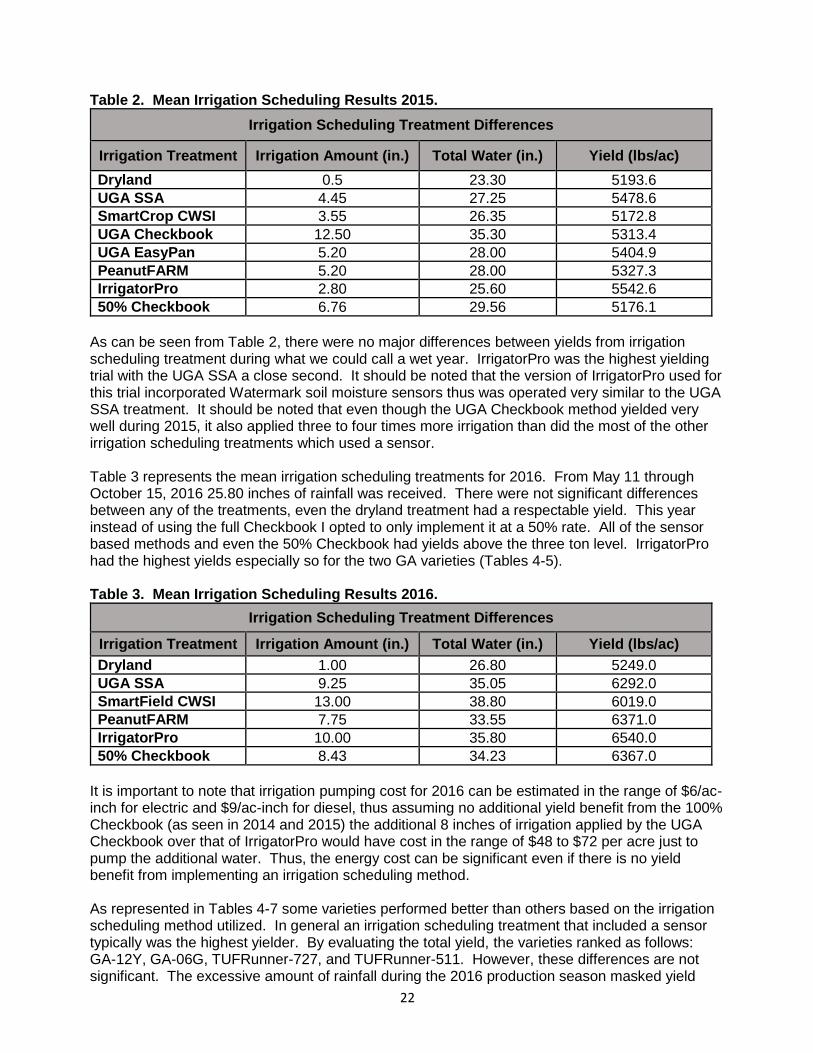
As can be seen from Table 2, there were no major differences between yields from irrigation scheduling treatment during what we could call a wet year. IrrigatorPro was the highest yielding trial with the UGA SSA a close second. It should be noted that the version of IrrigatorPro used for this trial incorporated Watermark soil moisture sensors thus was operated very similar to the UGA SSA treatment. It should be noted that even though the UGA Checkbook method yielded very well during 2015, it also applied three to four times more irrigation than did the most of the other irrigation scheduling treatments which used a sensor. Table 3 represents the mean irrigation scheduling treatments for 2016. From May 11 through October 15, 2016 25.80 inches of rainfall was received. There were not significant differences between any of the treatments, even the dryland treatment had a respectable yield. This year instead of using the full Checkbook I opted to only implement it at a 50% rate. All of the sensor based methods and even the 50% Checkbook had yields above the three ton level. IrrigatorPro had the highest yields especially so for the two GA varieties (Tables 4-5). Table 3. Mean Irrigation Scheduling Results 2016.
Irrigation Scheduling Treatment Differences
Irrigation Treatment Irrigation Amount (in.) Total Water (in.) Yield (lbs/ac)
Dryland 1.00 26.80 5249.0
UGA SSA 9.25 35.05 6292.0
SmartField CWSI 13.00 38.80 6019.0
PeanutFARM 7.75 33.55 6371.0
IrrigatorPro 10.00 35.80 6540.0
50% Checkbook 8.43 34.23 6367.0
It is important to note that irrigation pumping cost for 2016 can be estimated in the range of $6/ac-inch for electric and $9/ac-inch for diesel, thus assuming no additional yield benefit from the 100% Checkbook (as seen in 2014 and 2015) the additional 8 inches of irrigation applied by the UGA Checkbook over that of IrrigatorPro would have cost in the range of $48 to $72 per acre just to pump the additional water. Thus, the energy cost can be significant even if there is no yield benefit from implementing an irrigation scheduling method. As represented in Tables 4-7 some varieties performed better than others based on the irrigation scheduling method utilized. In general an irrigation scheduling treatment that included a sensor typically was the highest yielder. By evaluating the total yield, the varieties ranked as follows: GA-12Y, GA-06G, TUFRunner-727, and TUFRunner-511. However, these differences are not significant. The excessive amount of rainfall during the 2016 production season masked yield
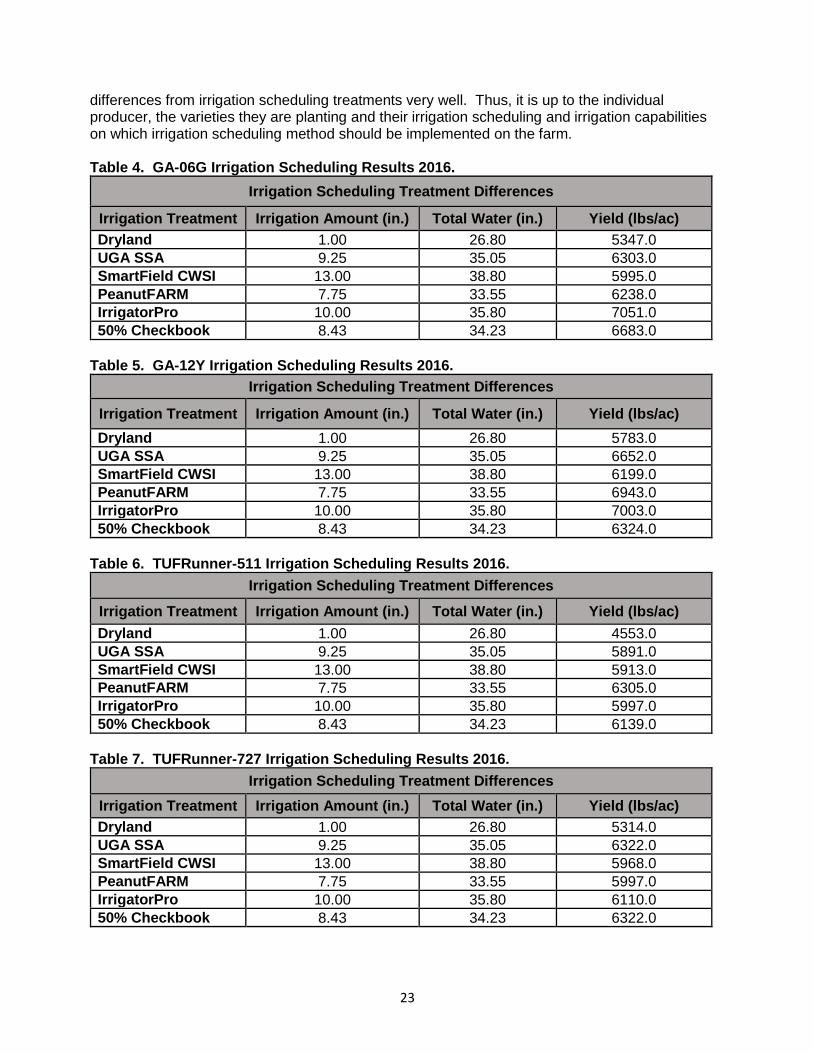
23
differences from irrigation scheduling treatments very well. Thus, it is up to the individual producer, the varieties they are planting and their irrigation scheduling and irrigation capabilities on which irrigation scheduling method should be implemented on the farm. Table 4. GA-06G Irrigation Scheduling Results 2016.
Irrigation Scheduling Treatment Differences
Irrigation Treatment Irrigation Amount (in.) Total Water (in.) Yield (lbs/ac)
Dryland 1.00 26.80 5347.0
UGA SSA 9.25 35.05 6303.0
SmartField CWSI 13.00 38.80 5995.0
PeanutFARM 7.75 33.55 6238.0
IrrigatorPro 10.00 35.80 7051.0
50% Checkbook 8.43 34.23 6683.0
Table 5. GA-12Y Irrigation Scheduling Results 2016.
Irrigation Scheduling Treatment Differences
Irrigation Treatment Irrigation Amount (in.) Total Water (in.) Yield (lbs/ac)
Dryland 1.00 26.80 5783.0
UGA SSA 9.25 35.05 6652.0
SmartField CWSI 13.00 38.80 6199.0
PeanutFARM 7.75 33.55 6943.0
IrrigatorPro 10.00 35.80 7003.0
50% Checkbook 8.43 34.23 6324.0
Table 6. TUFRunner-511 Irrigation Scheduling Results 2016.
Irrigation Scheduling Treatment Differences
Irrigation Treatment Irrigation Amount (in.) Total Water (in.) Yield (lbs/ac)
Dryland 1.00 26.80 4553.0
UGA SSA 9.25 35.05 5891.0
SmartField CWSI 13.00 38.80 5913.0
PeanutFARM 7.75 33.55 6305.0
IrrigatorPro 10.00 35.80 5997.0
50% Checkbook 8.43 34.23 6139.0
Table 7. TUFRunner-727 Irrigation Scheduling Results 2016.
Irrigation Scheduling Treatment Differences
Irrigation Treatment Irrigation Amount (in.) Total Water (in.) Yield (lbs/ac)
Dryland 1.00 26.80 5314.0
UGA SSA 9.25 35.05 6322.0
SmartField CWSI 13.00 38.80 5968.0
PeanutFARM 7.75 33.55 5997.0
IrrigatorPro 10.00 35.80 6110.0
50% Checkbook 8.43 34.23 6322.0

24
CONCLUSIONS AND RECOMMENDATIONS The 2016 production season near Camilla, GA can be considered a very wet production year. The dryland treatment yielded just below any of the irrigation scheduling treatments, however, well timed irrigation in specific varieties had the opportunity to increase yield by around 1,300 lbs/ac. This implies that irrigation was may not have be absolutely necessary during 2016, but had a significant impact if it were properly implemented and managed. It is still important to note the differences between the amounts of applied irrigation between treatments. Based on these results I would suggest that from a profitability standpoint, that irrigation scheduling is just as critical during wet years as it is during dry years. During a dry year over irrigating seemed to reduce yield potential, while on average there were lower yields during 2015 than 2014 and 2016, over-irrigating did not seem to have the significant yield reducing effect during 2015 as it did during 2014 and 2016. Profit can be reduced by over irrigating in either a dry or a wet year based on the data from 2014-2016. Yields were not reduced in 2015 from using the UGA Checkbook method compared to more advanced methods, but profitability was reduced by the addition cost of pumping irrigation water to the crop when it was not required. Clear differences between varieties were present based on which irrigation scheduling method was implemented during 2016, thus, it is up to the farmer to determine which method is best for their individual operation. For example, the IrrigatorPro treatment produced approximately 1000 lbs/ac higher yields on the GA varieties than it did on the TUFRunner varieties. It is strongly suggested that producers implement some sort of irrigation scheduling strategy beyond a checkbook, or historical evapotranspiration replacement method. There are free methods such as PeanutFARM and IrrigatorPro that perform very well and do a great job at estimating irrigation timing and requirements. There can be additional benefits from employing more advanced methods that include sensors, in both wet and dry years.
PEANUT DISEASE UPDATE
Bob Kemerait, Extension Plant Pathologist, Tim Brenneman, Plant Pathologist, and Albert Culbreath, Plant Pathologist
The objective of this section is to provide growers both with a primer for the management of diseases and nematodes affecting the peanut crop and to update recommendations for 2017 based upon developments over the past season. NOTES FOR 2017
1. Peanut Rx 2017 has been reviewed and updated for the coming season. Several new varieties have been included this year. Also, the impact of planting date and risk to leaf spot disease has been adjusted. The 2017 Peanut Rx can be found following the Disease and Nematode section.
2. Peanut Rx Smartphone app: The Peanut Rx app (available for free as “Peanut Rx” at
the iTunes APP Store and “UGA Peanut Rx” at GOOGLE PLAY) will be completely updated for 2017 as will the prescription fungicide programs.
25
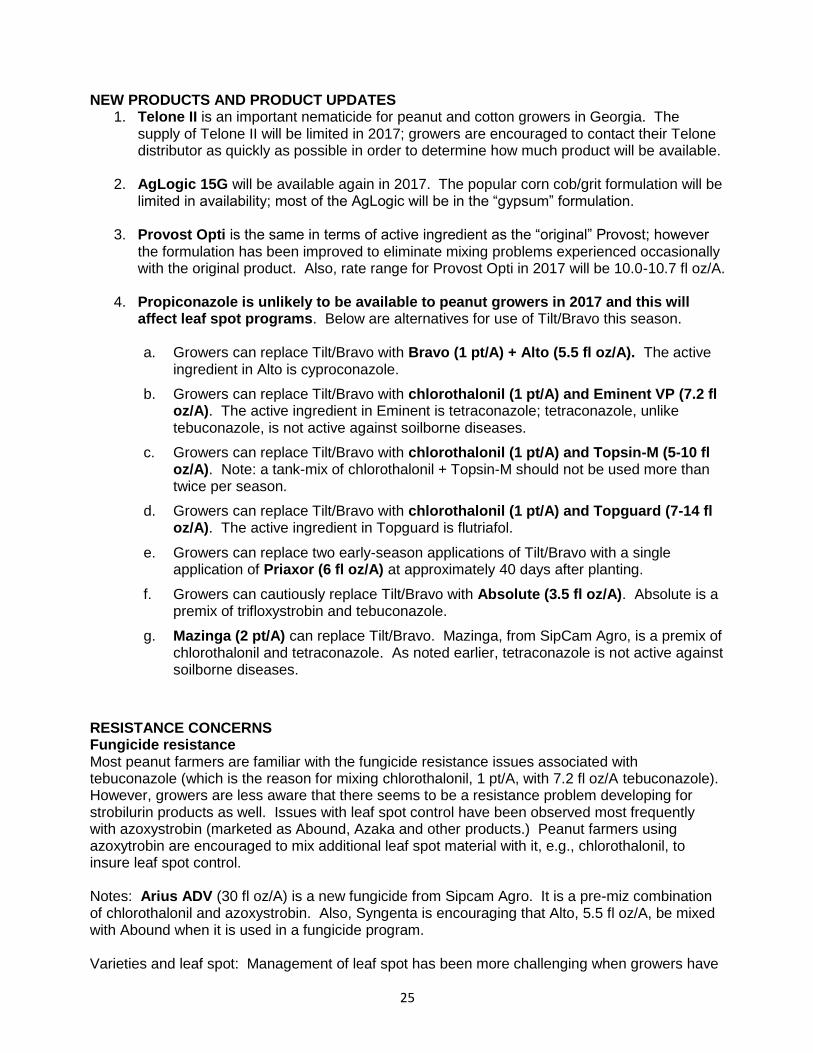
NEW PRODUCTS AND PRODUCT UPDATES 1. Telone II is an important nematicide for peanut and cotton growers in Georgia. The
supply of Telone II will be limited in 2017; growers are encouraged to contact their Telone distributor as quickly as possible in order to determine how much product will be available.
2. AgLogic 15G will be available again in 2017. The popular corn cob/grit formulation will be
limited in availability; most of the AgLogic will be in the “gypsum” formulation. 3. Provost Opti is the same in terms of active ingredient as the “original” Provost; however
the formulation has been improved to eliminate mixing problems experienced occasionally with the original product. Also, rate range for Provost Opti in 2017 will be 10.0-10.7 fl oz/A.
4. Propiconazole is unlikely to be available to peanut growers in 2017 and this will
affect leaf spot programs. Below are alternatives for use of Tilt/Bravo this season.
a. Growers can replace Tilt/Bravo with Bravo (1 pt/A) + Alto (5.5 fl oz/A). The active ingredient in Alto is cyproconazole.
b. Growers can replace Tilt/Bravo with chlorothalonil (1 pt/A) and Eminent VP (7.2 fl oz/A). The active ingredient in Eminent is tetraconazole; tetraconazole, unlike tebuconazole, is not active against soilborne diseases.
c. Growers can replace Tilt/Bravo with chlorothalonil (1 pt/A) and Topsin-M (5-10 fl oz/A). Note: a tank-mix of chlorothalonil + Topsin-M should not be used more than twice per season.
d. Growers can replace Tilt/Bravo with chlorothalonil (1 pt/A) and Topguard (7-14 fl oz/A). The active ingredient in Topguard is flutriafol.
e. Growers can replace two early-season applications of Tilt/Bravo with a single application of Priaxor (6 fl oz/A) at approximately 40 days after planting.
f. Growers can cautiously replace Tilt/Bravo with Absolute (3.5 fl oz/A). Absolute is a premix of trifloxystrobin and tebuconazole.
g. Mazinga (2 pt/A) can replace Tilt/Bravo. Mazinga, from SipCam Agro, is a premix of chlorothalonil and tetraconazole. As noted earlier, tetraconazole is not active against soilborne diseases.
RESISTANCE CONCERNS Fungicide resistance Most peanut farmers are familiar with the fungicide resistance issues associated with tebuconazole (which is the reason for mixing chlorothalonil, 1 pt/A, with 7.2 fl oz/A tebuconazole). However, growers are less aware that there seems to be a resistance problem developing for strobilurin products as well. Issues with leaf spot control have been observed most frequently with azoxystrobin (marketed as Abound, Azaka and other products.) Peanut farmers using azoxytrobin are encouraged to mix additional leaf spot material with it, e.g., chlorothalonil, to insure leaf spot control. Notes: Arius ADV (30 fl oz/A) is a new fungicide from Sipcam Agro. It is a pre-miz combination of chlorothalonil and azoxystrobin. Also, Syngenta is encouraging that Alto, 5.5 fl oz/A, be mixed with Abound when it is used in a fungicide program. Varieties and leaf spot: Management of leaf spot has been more challenging when growers have

26
planted varieties such as ‘Georgia-13M’ and TUFRunner TM ‘511’. Growers planting there varieties and other more-susceptible varieties (see Peanut Rx) should insure that they deploy an aggressive fungicide program. FUNDAMENTALS FOR DISEASE AND NEMATODE MANAGEMENT IN 2017
1. Tomato Spotted Wilt. Losses to tomato spotted wilt in 2016 were estimated to be 3.5%; this is up slightly from 3% in 2015. Losses were typically low in many fields; however there were significant losses in some fields. Tomato spotted wilt has been of only minor importance to disease loss in recent years, however it is increasingly a disease that demands attention from the grower. IMPORTANT NOTES: A) Although the severity of tomato spotted wilt had been in decline until 2014, this disease continues to be a potential threat to peanut production in Georgia. Growers must continue to incorporate the lessons spelled out in Peanut Rx to minimize the threat from this disease. B) The University of Georgia continues to recommend that growers consider planting a portion of their peanut crop in the latter part of April. Spreading the peanut crop over April and May offers many advantages to peanut producers. Although there continues to be increased risk to tomato spotted wilt for peanuts planted in April, this risk is of lesser importance when our newer, more resistant, varieties are planted
2. White Mold. White mold was severe in many peanut fields again in Georgia in 2016.
This was likely because a) warm conditions favored development of the disease, b) lack of rainfall inhibited movement of the fungicides from foliage to the crown of the plant, c) lack of rainfall increased incidence of “underground white mold” and d) peanuts in many fields were planted on short rotations. Losses were especially severe in non-irrigated fields. Below are points that are critical for growers to remember as they develop a plan for reducing loss to white mold.
a. The most commonly asked questions from agents, consultants, and growers about disease control over the past four years continue to be about management of white mold.
b. As a reminder, the basic steps to minimizing the impact of white mold in a field include:
i. Rotation away from peanuts and soybean; it is recommended that peanuts not be planted in a field more than one out of three years.
ii. Selection of newer peanut varieties with improved resistance to white mold, for example ‘Georgia-12Y’ (see the chapter on the 2017 Peanut Rx).
iii. White mold can be particularly difficult to control in “dryland” or “non-irrigated” fields. Although the fungus (Sclerotium rolfsii) that causes white mold may thrive in irrigated fields with vigorously growing peanut plants that produce a thick canopy of foliage; white mold may be MORE difficult to control in dryland fields. Growers should remember that it is CRITICAL to get help from irrigation (or rainfall) to move fungicides from the leaves to the crown and limbs of the plant for white mold control. In dryland fields, growers should consider spraying white-mold materials at night or increasing spray volume to better relocate fungicides.
CROP ROTATION The practice of good crop rotation has always been at the foundation of optimum disease management in peanut, affecting not only nematodes and soilborne diseases, e.g. white mold, Rhizoctonia limb rot, and Cylindrocladium black rot, but leaf spot diseases as well. For this

27
reason, Extension specialists at the University of Georgia stress the importance of avoiding planting peanuts in the same field more often than once every three years and rotating with a grass crop, e.g. bahiagrass or corn, if at all possible. Since the recent change in the Peanut Farm Program, peanut farming in Georgia has expanded into “non-traditional” production areas in the southeastern portion of the state. Growers in this area frequently ask “Can I grow peanuts on my land in back-to-back seasons as I have not grown them here before?” The simple answer is, of course, you can plant peanuts on your land whenever you want to. However, even growers who are planting peanuts on “new peanut ground” should be discouraged from back-to-back peanuts if possible. Reasons for this include:
1. Many peanut growers around the state would love to have access to “new peanut ground” as populations of pathogens attacking the crop should be initially low. Therefore, it does not make much sense to lose this competitive edge in pursuit of the short-term goal of growing two or three crops of peanuts in succession.
2. Many new peanut growers are producing peanuts on land that has been cropped to cotton in recent years. Although cotton is not affected by the peanut root-knot nematode, early or late leaf spot, or Cylindrocladium black rot (CBR), and is only slightly affected by white mold, it is susceptible to diseases caused by Rhizoctonia solani. It is likely that despite previous cropping in a field, there will be significant populations of R. solani and perhaps smaller populations of Sclerotium rolfsii (white mold) in the field when peanuts are first planted. Without effective crop rotation, these populations may increase quickly.
One of the greatest benefits of crop rotation is that it increases the effectiveness of all disease management programs. Effective crop rotation takes some of the “pressure off” of a fungicide program to minimize the impact of disease. Any fungicide program will be more effective where good crop rotation is practiced. In some situations, fields that are well rotated will require fewer, or at least less expensive, fungicide applications by the grower. Recommendations from the University of Georgia for crop rotation and peanut production include the following:
1. Avoid planting peanut in the same field more than once out of every three years. Longer rotations, for example once every four years, are even better.
2. The best crops to rotate with peanut are grass crops, such as corn, sorghum, and bahiagrass. These crops will help to reduce the severity of diseases caused by Rhizoctonia solani, as well as CBR, white mold, and leaf spot diseases. Although corn and sorghum are alternate hosts for the peanut root-knot nematode, they are less affected than peanut is. Therefore, planting corn and sorghum should help to reduce populations of peanut root-knot nematode, though perhaps not as fast as when a non-host such as cotton is planted. Bahiagrass is susceptible to the lesion nematode, which can reduce the pod brightness important for the green peanut market.
3. Cotton is a very good rotation crop with peanut and should help to reduce the severity of white mold, leaf spot diseases, and CBR on future crops. Cotton is not a host for the peanut root-knot nematode, so this will be a beneficial effect as well. Cotton is a host for Rhizoctonia solani, so diseases caused by this pathogen will remain a concern in peanut-cotton rotations, especially in conservation tillage where crop debris remains on the surface.
4. Soybeans, other leguminous crops, and many vegetable crops are not preferred for rotation with peanut. Although such rotations are likely to reduce the severity of leaf spot diseases, they may not reduce the severity of white mold, Rhizoctonia limb rot, the peanut root-knot nematode, or, in the case of soybean, CBR.
28
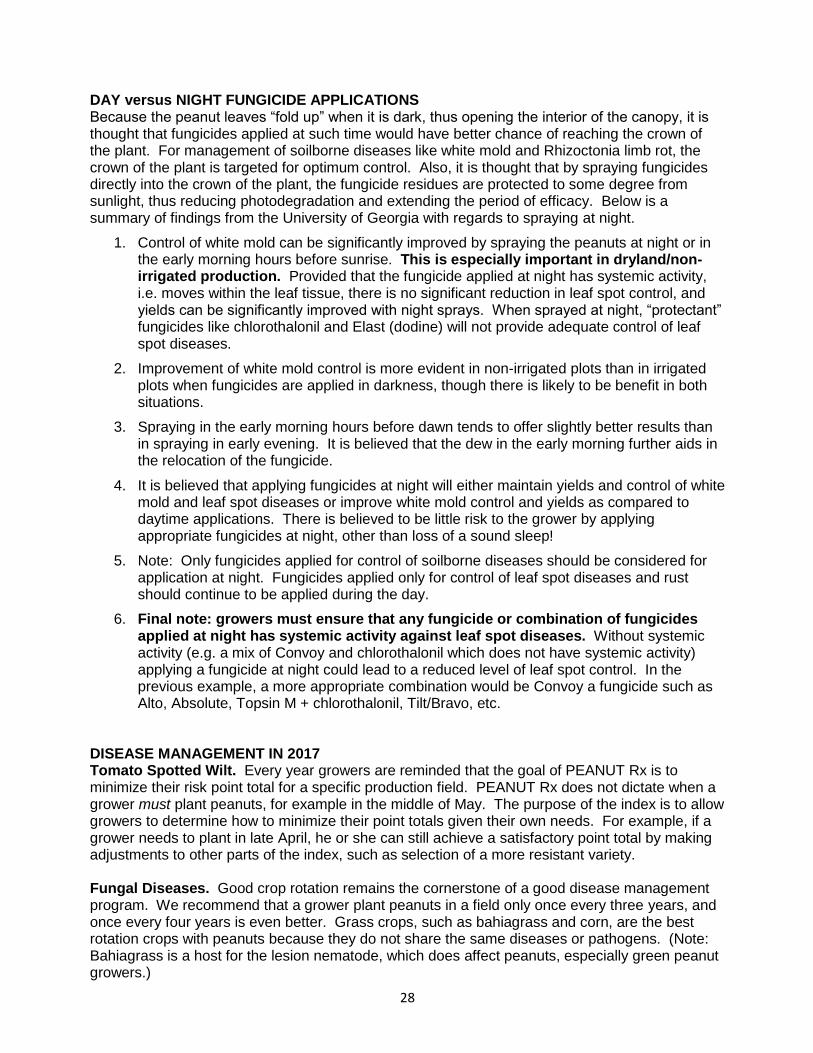
DAY versus NIGHT FUNGICIDE APPLICATIONS Because the peanut leaves “fold up” when it is dark, thus opening the interior of the canopy, it is thought that fungicides applied at such time would have better chance of reaching the crown of the plant. For management of soilborne diseases like white mold and Rhizoctonia limb rot, the crown of the plant is targeted for optimum control. Also, it is thought that by spraying fungicides directly into the crown of the plant, the fungicide residues are protected to some degree from sunlight, thus reducing photodegradation and extending the period of efficacy. Below is a summary of findings from the University of Georgia with regards to spraying at night.
1. Control of white mold can be significantly improved by spraying the peanuts at night or in the early morning hours before sunrise. This is especially important in dryland/non-irrigated production. Provided that the fungicide applied at night has systemic activity, i.e. moves within the leaf tissue, there is no significant reduction in leaf spot control, and yields can be significantly improved with night sprays. When sprayed at night, “protectant” fungicides like chlorothalonil and Elast (dodine) will not provide adequate control of leaf spot diseases.
2. Improvement of white mold control is more evident in non-irrigated plots than in irrigated plots when fungicides are applied in darkness, though there is likely to be benefit in both situations.
3. Spraying in the early morning hours before dawn tends to offer slightly better results than in spraying in early evening. It is believed that the dew in the early morning further aids in the relocation of the fungicide.
4. It is believed that applying fungicides at night will either maintain yields and control of white mold and leaf spot diseases or improve white mold control and yields as compared to daytime applications. There is believed to be little risk to the grower by applying appropriate fungicides at night, other than loss of a sound sleep!
5. Note: Only fungicides applied for control of soilborne diseases should be considered for application at night. Fungicides applied only for control of leaf spot diseases and rust should continue to be applied during the day.
6. Final note: growers must ensure that any fungicide or combination of fungicides applied at night has systemic activity against leaf spot diseases. Without systemic activity (e.g. a mix of Convoy and chlorothalonil which does not have systemic activity) applying a fungicide at night could lead to a reduced level of leaf spot control. In the previous example, a more appropriate combination would be Convoy a fungicide such as Alto, Absolute, Topsin M + chlorothalonil, Tilt/Bravo, etc.
DISEASE MANAGEMENT IN 2017 Tomato Spotted Wilt. Every year growers are reminded that the goal of PEANUT Rx is to minimize their risk point total for a specific production field. PEANUT Rx does not dictate when a grower must plant peanuts, for example in the middle of May. The purpose of the index is to allow growers to determine how to minimize their point totals given their own needs. For example, if a grower needs to plant in late April, he or she can still achieve a satisfactory point total by making adjustments to other parts of the index, such as selection of a more resistant variety. Fungal Diseases. Good crop rotation remains the cornerstone of a good disease management program. We recommend that a grower plant peanuts in a field only once every three years, and once every four years is even better. Grass crops, such as bahiagrass and corn, are the best rotation crops with peanuts because they do not share the same diseases or pathogens. (Note: Bahiagrass is a host for the lesion nematode, which does affect peanuts, especially green peanut growers.)
29
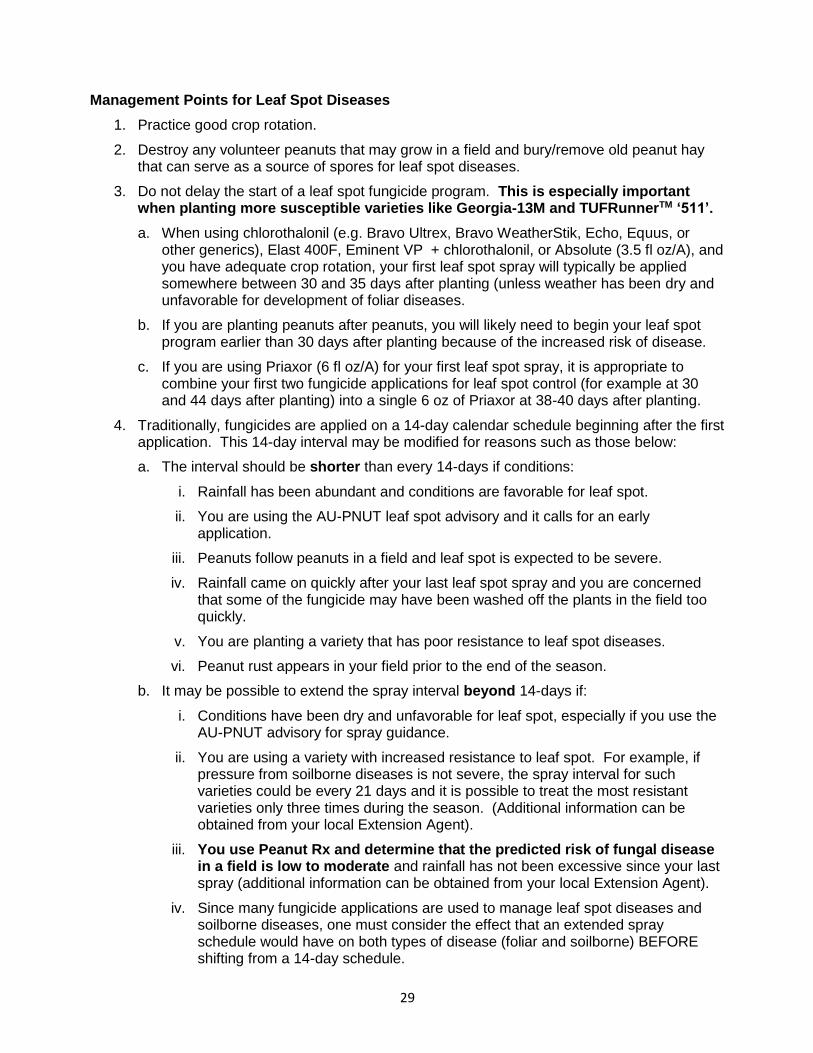
Management Points for Leaf Spot Diseases
1. Practice good crop rotation.
2. Destroy any volunteer peanuts that may grow in a field and bury/remove old peanut hay that can serve as a source of spores for leaf spot diseases.
3. Do not delay the start of a leaf spot fungicide program. This is especially important when planting more susceptible varieties like Georgia-13M and TUFRunnerTM ‘511’.
a. When using chlorothalonil (e.g. Bravo Ultrex, Bravo WeatherStik, Echo, Equus, or other generics), Elast 400F, Eminent VP + chlorothalonil, or Absolute (3.5 fl oz/A), and you have adequate crop rotation, your first leaf spot spray will typically be applied somewhere between 30 and 35 days after planting (unless weather has been dry and unfavorable for development of foliar diseases.
b. If you are planting peanuts after peanuts, you will likely need to begin your leaf spot program earlier than 30 days after planting because of the increased risk of disease.
c. If you are using Priaxor (6 fl oz/A) for your first leaf spot spray, it is appropriate to combine your first two fungicide applications for leaf spot control (for example at 30 and 44 days after planting) into a single 6 oz of Priaxor at 38-40 days after planting.
4. Traditionally, fungicides are applied on a 14-day calendar schedule beginning after the first application. This 14-day interval may be modified for reasons such as those below:
a. The interval should be shorter than every 14-days if conditions:
i. Rainfall has been abundant and conditions are favorable for leaf spot.
ii. You are using the AU-PNUT leaf spot advisory and it calls for an early application.
iii. Peanuts follow peanuts in a field and leaf spot is expected to be severe.
iv. Rainfall came on quickly after your last leaf spot spray and you are concerned that some of the fungicide may have been washed off the plants in the field too quickly.
v. You are planting a variety that has poor resistance to leaf spot diseases.
vi. Peanut rust appears in your field prior to the end of the season.
b. It may be possible to extend the spray interval beyond 14-days if:
i. Conditions have been dry and unfavorable for leaf spot, especially if you use the AU-PNUT advisory for spray guidance.
ii. You are using a variety with increased resistance to leaf spot. For example, if pressure from soilborne diseases is not severe, the spray interval for such varieties could be every 21 days and it is possible to treat the most resistant varieties only three times during the season. (Additional information can be obtained from your local Extension Agent).
iii. You use Peanut Rx and determine that the predicted risk of fungal disease in a field is low to moderate and rainfall has not been excessive since your last spray (additional information can be obtained from your local Extension Agent).
iv. Since many fungicide applications are used to manage leaf spot diseases and soilborne diseases, one must consider the effect that an extended spray schedule would have on both types of disease (foliar and soilborne) BEFORE shifting from a 14-day schedule.
30
5. Finding some leaf spot in a field at the end of the season is usually not a problem. As long the diseases are controlled throughout the season, limited defoliation (up to about 30-40%) is not likely to affect your yield. The appearance of leaf spot at the end of the season typically does not mean that your program was ineffective or a failure.
6. Some growers in Florida are mixing chlorothalonil with Topsin-M or Topsin 4.5F or copper fungicides such as Kocide for their final leaf spot sprays to increase peg strength prior to harvest. What do we recommend in Georgia?
a. Combinations of chlorothalonil and Topsin-M currently provide excellent control of leaf spot.
b. Combinations of chlorothalonil and copper are also effective in the control of leaf spot.
c. Data collected at Clemson University demonstrates that peg strength is not increased with use of Topsin-M, Topsin 4.5F, or copper (e.g. Kocide).
7. Failures in leaf spot management in a peanut field are often linked to:
a. Planting a peanut variety that is very susceptible to leaf spot.
b. Unacceptable delays in starting your program.
c. Improper calibration of equipment (not enough material was applied).
d. Unacceptable delays between applications, such as when weather conditions keep the grower out of the field.
e. Rain events immediately after a fungicide application have washed the fungicide away too quickly.
f. Possibly, over-use of strobilurin fungicides (e.g., azoxystrobin and pyraclostrobin) in a management program.
8. Use of Chlorothalonil. Chlorothalonil is the active ingredient in Bravo products, Echo products, and a number of generics. It is quite effective in the management of leaf spot diseases.
a. All chlorothalonil products for peanut appear to be effective. Differences between one brand and another are related to the “stickers” and other substances that are added to the active ingredient to increase effectiveness.
b. There is no difference in efficacy between a flowable and dry-flowable formulation of chlorothalonil.
c. Two likely benefits from chlorothalonil products when compared to other products for leaf spot control are:
i. Price.
ii. Use for fungicide resistance management.
d. The typical rate for a 720-F formulation is 1.5 pt/A; for a 90-DF formulation is 1.4 lb/A.
e. Chlorothalonil products are not systemic and must be applied to the leaf surface prior to infection by the fungus.
f. Generally, chlorothalonil products have been on the foliage long enough prior to a rain event IF they have had time to dry completely.
g. If you feel that your chlorothalonil application may not have had enough time to dry before rain, consider timing your next fungicide application a little earlier to compensate for any reduction in efficacy.
31
h. When conditions have been very favorable for leaf spot (a lot of rain), it is generally true that research plots treated with chlorothalonil will have more leaf spot at the end of the season than plots treated with a systemic fungicide for leaf spot control. This increase in leaf spot rarely results in a reduction in yield.
i. Tank mixing Topsin M with chlorothalonil provides a good option for growers who are looking for a “rescue treatment” when leaf spot is developing too quickly in their field.
9. Use of Elast 400F:
a. Elast (dodine) is in a fungicide class different than others used in peanut production. Thus when used in a peanut program it can help to reduce the chances of fungicide resistance that occur with overuse of certain “at risk” fungicides.
b. Elast is a “protectant” fungicide like chlorothalonil and must be applied before infection by leaf spot pathogens has occurred. If infection has already occurred, application of Elast will be of minimal benefit for disease control.
c. Elast is used at either 15.0 fl oz/A alone or at 12.8 fl oz/A when tank-mixed with a product like tebuconazole (7.2 fl oz/A) for additional leaf spot control.
d. Use of Elast is most appropriate where chlorothalonil would be used.
e. Elast is MOST effectively used earlier in the season. Full-season use of Elast has been found in some trials to lead to reduced management of leaf spot diseases when compared to other fungicides applied for leaf spot control
10. Topsin-M (thiophanate methyl) is a fungicide in the benzimidazole class.
a. Topsin-M can be a very effective part of a leaf spot management program.
b. Growers who use a 4-block tebuconazole program can increase the control of leaf spot by tank-mixing 5.0 fl oz/A Topsin-M with 7.2 fl oz of tebuconazole in alternating applications (either 1 & 3 or 2 & 4).
c. Growers who use a 4-block Artisan program (13-16 fl oz/A on each of four applications, may also want to consider using Topsin as described above.
d. Growers who are looking for an effective fungicide treatment, should leaf spot become a problem in a field, can make an application of Topsin-M (5.0-10.0 fl oz/A) tank-mixed with 1.5 pt/A chlorothalonil. This can be followed up with a second application of the same tank-mix or with an application of Tilt/Bravo.
e. Growers should make no more than two tank-mix applications of Topsin-M pert season in order to avoid fungicide resistance problems.
11. Priaxor fungicide (BASF, a premix of SDHI/fluxapyroxad and strobilurin/pyraclostrobin fungicides)
a. Priaxor will can be used twice in a cropping season; early (~ 45 days after planting) at 6 fl oz/A to initiate a strong leaf spot program and then again on the third spray (~ 74 DAP) for leaf spot and soilborne disease control.
b. Fungicides like Convoy, and tebuconazole are among fungicides recommended to compliment a full soilborne disease program.
12. Abound + Alto (azoxystrobin + cyproconazole) is a new combination of fungicides promoted to both improve leaf spot efficacy and also protect against fungicide resistance. Abound should continue to be applied at the standard rate (typically 18.5 fl oz/A) and Alto should be applied at 5.5 fl oz/A. The Alto/Abound combination will offer excellent control of leaf spot diseases.

32
13. Abound, Elatus, Evito, Priaxor, Provost Opti, Fontelis, Quash (metconazole)and tebuconazole products are primarily for control of soilborne diseases; however they are applied at times when control of leaf spot diseases is critical as well. Priaxor, Provost Opti, Elatus, and Fontelis provide effective leaf spot protection alone.
Because of concern for leaf spot resistance, it is recommended that additional leaf spot fungicides be mixed with strobilurin fungicides like Abound, Evito and Headline. This is especially important when a growers plants peanuts on a short rotation or plants a more-susceptible variety. Although Quash (metconazole) alone may also provide adequate leaf spot control, where growers who have experienced leaf spot problems when using tebuconazole can assume that similar problems will exist with Quash unless it is tank-mixed with another fungicide for increased leaf spot control. Problems associated with tebuconazole and leaf spot are usually related to fungicide resistance issues or are traced back to rain or irrigation soon after application. To maximize leaf spot and white mold/limb rot control with tebuconazole, it is best that the crop dry for 12-24 hours before irrigation. Where rainfall is abundant and/or resistance is likely, most growers will add a half-rate of chlorothalonil or Topsin to 7.2 fl oz/A of tebuconazole for added leaf spot protection.
SOILBORNE DISEASES Seedling Diseases: Seedling diseases were typically not a concern for peanut growers in Georgia prior to the arrival of the tomato spotted wilt virus. Even if some plants were lost in a stand, the neighboring peanut plants were often able to compensate for the loss by growing into the vacated space. However, it is clear that spotted wilt can be devastating when fields have poor stands. For this reason, getting a good stand has become critical for growers. Aspergillus crown rot was especially severe in some fields in 2017; most commonly on fields planted with “farmer-saved” seed. Hot-and-dry conditions at planting greatly increases risk to Aspergilllus crown rot, as do use of poor-quality seed and lack of fungicide seed treatment (or a poorly-applied seed treatment). Below are some management techniques to reduce seedling diseases (primarily caused by Rhizoctonia solani and Aspergillus niger).
1. Rotate peanuts with grass crops to reduce the populations of Rhizoctonia solani.
2. Plant the peanut crop when soil temperatures are warm enough to produce rapid, vigorous germination and growth. This can help protect the plants from disease. Excessive moisture at planting will also increase the risk of seedling diseases.
3. Planting seed into droughty, hot soil greatly increases risk to Aspergillus crown rot. Irrigation and rainfall help to reduce risk to this disease.
4. Use quality seed that has a good germination rating and will grow vigorously. As mentioned above, farmer-saved-seed is most affected by Aspergillus crown rot.
5. Choose varieties that are known to germinate and emerge uniformly and with vigor.
6. Use only seed treated with a commercial fungicide seed treatment. The seed treatments that are put on commercial seed prior to purchase are outstanding and provide protection for the seed and seedling. Seed treatments include:
a. Vitavax PC
b. Dynasty PD (azoxystrobin + mefenoxam + fludioxonil)
33
7. Use an in-furrow fungicide where the risk of seedling disease is great or where the grower wants increased insurance of a good stand.
a. Abound at 6.0 fl oz/A in the furrow at planting can provide increased control of seedling diseases, including Aspergillus crown rot.
b. Terraclor (64 fl oz/A) also provides additional control of seedling diseases when applied in-furrow.
c. Growers who are most likely to yield benefits from these in-furrow fungicides are those that have poor crop rotation and a history of seedling disease in the field.
White Mold and Rhizoctonia Limb Rot Diseases: White mold will likely to occur in nearly every peanut field in Georgia; Rhizoctonia limb rot can be an important problem in some fields. Losses caused by these diseases can be severe and they are much more difficult to control than leaf spot diseases. Prior to 1994 when Folicur (tebuconazole) was first labeled, growers did not have any truly effective fungicides to control these diseases. Since 1994, growers now have six different fungicides from three different classes that can effectively control both white mold and Rhizoctonia limb rot. Still, white mold and limb rot remain troublesome to growers. Two of the reasons for difficulty in control are 1) it can be tough to tell when you need to begin spraying, and 2) it is not easy to get the fungicide to its target where it can affect the pathogen. Management points for white mold and Rhizoctonia limb rot.
1. Practice good crop rotation.
a. Corn, grass crops, and bahiagrass are good rotation partners reducing effect of white mold and Rhizoctonia limb rot.
b. Cotton will reduce the risk of white mold but will have less benefit on Rhizoctonia limb rot.
2. Choose resistant varieties when available.
a. Some new varieties, such as Georgia-12Y, have increased resistance to white mold.
b. However, Georgia-12Y may be more susceptible to Rhizoctonia limb rot.
3. Consider an application of Proline 480SC (5.7 fl oz/A) or Abound (0.4-0.8 fl oz/1000 ft) early in the season (2-5 weeks after planting) and follow it with a traditional fungicide program.
4. Apply fungicides for control of soilborne diseases at night when leaves are folded to allow greater penetration to the crown of the plant. Soilborne diseases are most effectively controlled when the fungicide reaches the crown and lower limbs of the plant.
a. Fungicides applied in late evening for management of soilborne diseases are at least as effective, and often more effective, then the same fungicides applied during the day.
b. Fungicides applied for management of soilborne diseases appear to be most effective when applied early in the morning after dew set, but before daylight. The moisture from the dew seems to further help in the re-distribution of the fungicide on the crown and limbs of the crop.
c. Because fungicides applied for control of soilborne diseases must also protect against leaf spot diseases as well, it is important that the grower use a fungicide, or tank-mix an additional fungicide, that has systemic movement in the leaf.
d. All “leaf spot only” fungicide applications should be applied during the day to achieve maximum coverage of the leaves.
34
5. Use appropriate fungicides.
a. NOTE: No fungicide program will give the grower complete control of soilborne diseases in a field. We estimate that, at best, a good soilborne fungicide program will give 60-70% control under ideal conditions.
b. Initiating fungicide applications is often imprecise and is based upon experience.
c. The timing of fungicides for controlling white mold and limb rot must be early enough to protect the crop when the disease first appears. However, growers should avoid applying soilborne fungicides too early so that they will be available when needed later in the season.
d. Initial appearance of soilborne diseases is related to the soil temperature, the growth of the crop, and rainfall/irrigation.
e. In Georgia, we generally start spraying for soilborne diseases approximately 60 days after planting. At this time in the season, the growth of the crop and the environmental conditions are suitable for disease to occur. Because white mold and Rhizoctonia limb rot can occur earlier than this, the grower should watch his fields carefully to determine when the diseases appear.
f. Example: In 2003 (and 2013), rainfall was abundant and we predicted that severe white mold would occur early in the season. However, white mold did not appear until later in the season and was much of a late-season problem. The most probable reason for this was temperature. Although the moisture was suitable for white mold (and limb rot), the cooler-than-normal summer temperatures delayed the onset of white mold. In 2006 (and 2014), white mold was severe across much of the production region of Georgia despite dry conditions. Again, the warm soil temperatures resulted in outbreaks of white mold, though the drought reduced the severity of Rhizoctonia limb rot.
g. Fungicides are applied to the foliage, but must reach the crown and limbs of the plant in order to be effective against soilborne diseases.
i. The fungicides can be moved by rainfall and irrigation. If rainfall or irrigation occurs too quickly after application, the fungicide may not provide enough protection for leaf spot.
ii. If the rainfall or irrigation is delayed, absorption of the fungicide into the foliage may reduce the amount available to fight soilborne disease.
iii. In a dryland situation, lack of rainfall, and thus movement down the plant, will reduce the effectiveness of a soilborne fungicide. Still, the fungicide was probably not wasted; some of the product likely reached the desired target with the spray mix.
iv. If fungicides are applied during the night after the leaves have folded, more fungicide will reach the crown of the plant where it is needed to control soilborne disease.
h. Management with tebuconazole.
i. Tebuconazole is marketed as Folicur, Tebuzol, Orius, Tri$um, Integral, Muscle, Tebustar, etc.
ii. Tebuconazole is effective against white mold and Rhizoctonia limb rot.
iii. Tebuconazole remains effective against early and late leaf spot; however the fungicide is not as effective as it once was due to development of resistance by the fungal pathogens.
35
iv. It is recommended that tebuconazole remain on the leaf surface for 24 hours after application to insure enough is absorbed for leaf spot control.
v. If tebuconazole is washed from the leaves too quickly, leaf spot control may suffer, though the grower may get maximum control of white mold and limb rot.
vi. In extremely wet weather, or when the threat from leaf spot diseases is elevated or where resistance has developed, growers should choose to mix 0.75-1.0 pt of chlorothalonil or 5 fl oz Topsin with 7.2 fl oz of tebuconazole to insure leaf spot control. At one time the addition of chlorothalonil was thought to impede the movement of Folicur from the foliage; however this has not found to be a problem. Note: Topsin is added to two alternating applications of tebuconazole in a 4-block program.
vii. Tebuconazole is applied at a rate of 7.2 fl oz/A, beginning approximately 60 days after planting.
viii. In the most traditional program, tebuconazole is applied in a four-block program, on a 14-day interval.
ix. Fewer than four applications of tebuconazole may be sufficient in some low disease situations; however this will be an off-label program.
x. Improper use of tebuconazole with Stratego, Tilt/Bravo, or Echo-PropiMax could increase the risk of fungal resistance to the sterol-inhibitor fungicides.
i. Management with Quash (metconazole)
i. Quash is a triazole fungicide that is in the same chemical class as tebuconazole.
ii. Quash is sold by Valent and is used at rates between 2.5 and 4 oz/A.
iii. Ideally, when Quash is applied at rates of 2.5 to 4 oz/A, a grower should not need to tank-mix additional materials for enhanced leaf spot control. However, where leaf spot resistance to tebuconazole has developed, growers can expect that leaf spot resistance to Quash may also exist. In such cases, it may be important to find a leaf spot tank-mix partner to ensure adequate control when using Quash.
iv. Quash at 2.5 oz/A should be sufficient for control of white mold and Rhizoctonia limb rot under “normal” conditions. Where conditions are favorable for severe outbreaks of white mold, e.g. poor rotation, favorable weather, growers should use the higher rate at 4.0 oz/A.
j. Management with Provost Opti (tebuconazole + prothioconazole)
i. In 2017, the standard rate range for Provost Opti is 10.0 fl oz/A to 10.7 fl oz/A.
ii. Because Provost is a combination of two fungicides within the same chemical class (triazoles/DMI fungicides), it is EXTREMELY important that growers practice good fungicide resistance management principals with this product in order to maintain its efficacy over an extended period of time.
iii. From University data, Provost Opti has provided excellent control of leaf spot diseases and control of white mold, Rhizoctonia limb rot, and CBR that is at least as good as that of Folicur.
iv. To avoid causing injury to the foliage, growers should carefully read the Provost Opti label before tank-mixing this product with other fungicides.
k. Management with Elatus.
36
i. Elatus is a combination of azoxystrobin and solatenol. This mixure provides additional resistance management for the at-risk azoxystrobin.
ii. Elatus has performed very well in UGA research trials against white mold, Rhizoctonia limb rot and also leaf spot diseases. It is also labeled for suppression of CBR.
iii. Elatus can be applied twice during the season (9.5 fl oz/A at 60 and 90 DAP).
iv. Elatus can also be applied three times during the season, e.g. 30, 60 and 90 DAP at a rate of 7.3 fl oz/A.
l. Management with azoxystrobin.
i. Azoxystrobin is marketed as Abound and new generic formulations. It is typically applied at 60 and 90 days after planting at 18.5 fl oz/A. ARIUS ADV is a new formulation of azoxystrobin and chlorothalonil and is applied at 30 fl oz/A. Custodia is a pre-mix of azoxystrobin and tebuconazole and is applied at a rate of 15.5 fl oz/A.
ii. A lower rate (12.0 fl oz/A) is allowed by label in dryland situations or in reduced-risk “Prescription Programs”; however it must be used with caution, as it will not have the “power” of the full rate. We typically do not recommend this rate unless each Abound application is alternated with applications of tebuconazole at 7.2 fl oz/A OR a grower is carefully using a prescription program in a reduced risk field.
iii. Abound is effective against leaf spot diseases, white mold, and Rhizoctonia limb rot.
iv. For maximum efficacy against white mold and limb rot, the field should receive irrigation or rainfall within 72 hours after application.
v. Fungicide resistance management: To avoid problems with fungicide resistance, Abound should not be used in the same program with Evito, Absolute, Stratego or Headline.
vi. Abound + Alto (azoxystrobin + cyproconazole) is a new combination of fungicides promoted to both improve leaf spot efficacy and also protect against fungicide resistance. Abound should continue to be applied at the standard rate (typically 18.5 fl oz/A) and Alto should be applied at 5.5 fl oz/A. The Alto/Abound combination will offer excellent control of leaf spot diseases.
m. Management with fluoxastrobin.
i. Fluoxastrobin is marketed as Evito 480SC.
ii. Evito is in the same chemical class (strobilurins) as are Headline, Abound, Stratego, and Absolute and should not be used in the same fungicide programs as these products. Like Headline and Abound, Evito is likely less effective now in management of leaf spot. For this reason, growers who use Evito in a fungicide program should A) tank-mix and additional leaf-spot fungicide with it for additional control or B) use the product “Evito T” which is a mixture of fluoxastrobin and tebuconazole.
iii. Recommended use for Evito is two applications of product (5.7 fl oz/A) timed approximately 60 and 90 days after planting.
iv. Evito is an effective component of a peanut disease management program; however it may not be quite as effective against leaf spot and soilborne diseases as are other fungicides.
37
v. Evito is NOT “generic Abound”.
vi. Evito T (a combination of Evito and tebuconazole) is also available as a pre-mix from Arysta Lifesciences and should provide good management of peanut diseases.
n. Management with Fontelis.
i. Based upon research results, Fontelis appears to be a very strong fungicide for the management of white mold, leaf spot, Rhizoctonia limb rot and the suppression of CBR.
ii. Fontelis is in the same chemical class as are Artisan and Convoy.
iii. The typical use pattern for Fontelis is 3 applications at 16 fl oz to be applied beginning 60 days after planting.
o. Management with flutolanil.
i. Flutolanil is an excellent fungicide for the management of white mold and is also effective against Rhizoctonia limb rot. It is not effective against leaf spot diseases.
ii. Flutolanil is marketed as Convoy.
1. Convoy, contains only flutolanil and must be mixed with the full-rate of another fungicide for control of leaf spot. Convoy is typically applied at 26 fl oz/A twice (60 and 90 days) or at 13 fl oz/A in a four-block program.
2. Convoy have performed well in field trials where white mold was severe.
p. Management with pyraclostrobin + fluxapyroxad (Priaxor).
i. Priaxor is effective in a soilborne disease management program against white mold and limb rot when applied at a rate of 8 fl oz/A.
ii. Priaxor is typically not used as “stand-alone” soilborne fungicides, but rather is used in combination with tebuconazole or Convoy.
iii. Priaxor is generally not to be used with Headline, Evito, Absolute, Stratego, Elatus, Abound or generic formulations of azoxystrobin for fungicide resistance management concerns.
iv. Use of Priaxor at 8.0 fl oz/A will provide adequate control of white mold and limb rot when used as a part of a soilborne program and will provide exceptional leaf spot control.
v. An ideal use of Priaxor would be 4 fl oz/A at 40 days after planting, 7.2 fl oz/A Folicur at 60 days after planting, and 8.0 fl oz/A Priaxor at 74 days after planting.
q. Management with mixed programs. Some peanut growers in Georgia are experimenting with fungicide programs that mix different fungicides for the control of soilborne diseases and the results can be outstanding. The goal in mixing fungicides is to capture the best control available through the use of multiple chemistries. While some of these programs, like the alternate use of Folicur and Abound, for a total of four soilborne fungicide applications, appear to be quite effective, the grower must accept all responsibility if his program is off-label.
Cylindrocladium Black Rot (CBR): CBR is a very challenging disease to control and of increasing importance to growers across the state. Crop rotation away from peanut and soybean is an important management tool. Also, it is important that growers not introduce infested soil from fields where CBR occurs to fields where it is not yet present. This can be done best by

38
cleaning equipment and vehicles before traveling between fields. In recent years, it has been proven that CBR can be transmitted via seed, though at a very low rate. Growers should try to obtain seed produced in fields free of CBR. They should also recognize that much of the seed for Virginia varieties is produced in the Virginia-Carolina region where CBR is of even greater importance than it is in Georgia. Management points for CBR
1. Crop rotation away from peanut and soybean. Unfortunately, once CBR is established in a field, it is very difficult to eliminate. Not only can the fungal pathogen survive for long periods of time in the soil, but it can also infect common weeds such as beggarweed and coffee weed.
2. Proline 480SC (prothioconazole) is a fungicide that is labeled to be applied in-furrow at planting time for management of CBR. The in-furrow rate is 5.7 fl oz/A. The in-furrow application of Proline promises to be a critical component for the management of CBR when followed by foliar application of the effective fungicides noted below. From numerous studies, it is demonstrated that liquid inoculants can be mixed with Proline without loss of efficacy of the fungicide or the inoculant.
a. Where peanuts are planted in single-row patterns, the Proline is applied at 5.7 fl oz/A beneath the row.
b. Where peanuts are planted in twin-row patterns, the Proline rate must be split under each row so that the TOTAL rate remains at 5.7 fl oz/A. Where twin rows are planted, the grower can come back an additional 5.7 fl oz/A to the seedlings 14 days after cracking.
3. Provost Opti, Elatus, Abound, and Priaxor and Fontelis are labeled for the “suppression” of CBR. This means that these fungicides may reduce the symptoms of disease and possibly increase yields above other fungicides.
4. Varieties with some level of resistance were not available to growers until recently. In the past several years, varieties Georgia-02C, Georgia Greener and Carver, have been released and appear to have at lest some level of resistance to CBR. (Note: Tifguard is no longer recognized as resistant to CBR.) Though these varieties are typically not available now, growers who have fields where CBR is found may want to consider planting CBR-resistant varieties as they become available.
5. It has been found that CBR is more severe in fields where the peanut root-knot nematode also occurs. Therefore, growers who manage nematodes with Telone II, Velum Total or AgLogic may find some suppression of CBR.
6. Fumigation with metam sodium (e.g. Vapam) at 10 gal/A directly beneath the row 10 days prior to planting is currently our best management strategy for the control of CBR.
PRESCRIPTION FUNGICIDE PROGRAMS “Prescription fungicide programs” are defined as strategies designed to maximize yields and maintain disease control in a field using the appropriate number and type of fungicide applications based upon the risk to disease in the field. The goal of prescription fungicide programs is too use the right amount of fungicide for the level of disease expected in a field and to modify the fungicide use as the risk of disease increases or decreases as the season progresses. Fields where the risk to disease is high, for example where fields have shorted crop rotation, are planted to less resistant varieties, and weather favors disease development should receive at

39
least seven fungicide applications during the season, and perhaps more.
Fields where the risk to disease is reduced to a low or moderate level, for example where fields have longer rotations and are planted to more resistant varieties, typically do not need the same fungicide program as a higher risk field in order to maximize yields. Research data from many on-farm and small plot studies conducted at the University of Georgia have demonstrated that growers who manage their crop so as to reduce the risk to leaf spot, white mold, and Rhizoctonia limb rot can also reduce the number of fungicide applications and increase the value of their crop by cutting production costs. In low risk fields, it is quite possible to reduce the number of fungicide applications from seven to four, so long as the grower is willing to watch the field to insure that disease does not begin to develop unnoticed.
Growers interested in developing prescription programs should first assess the risk in their field(s) using the PEANUT Rx Disease Risk Index and then contact their local county agent for guidance on a suitable fungicide program. Syngenta Crop Protection, Nichino-America, BASF, Arysta LifeSciences, DuPont, Sipcam Agro and Bayer CropScience have developed their on prescription programs with input from University researchers. Growers who use an industry-sponsored prescription program in reduced risk fields can have the confidence that the company will “stand behind” these programs as long as risk level has been appropriately assessed and the appropriate fungicide program has been used. MANAGEMENT OF PEANUT ROOT-KNOT NEMATODES IN 2017
1. Peanut root-knot nematodes are frequently under-managed in Georgia, either because the symptoms are not recognized or because growers are reluctant to take the steps needed to ensure adequate control.
2. Rotation with a crop such as cotton (not a host for peanut root-knot nematode) is a very effective management tool.
3. Growers planting peanuts in fields with damaging levels of peanut root-knot nematodes MUST consider planting ‘Tifguard’ or ‘Georgia-14N’. These two varieties are nearly resistant to the peanut root-knot nematode, do NOT need to be treated with a nematicide, and perform exceptionally well as compared to other varieties that are treated with nematicides.
4. Growers who plant the new peanut variety ‘Tifguard’ and ‘Georgia-14N can expect excellent control of nematodes.
5. Fumigation with Telone II (4.5-6 GPA) is our most aggressive treatment to manage peanut root-knot nematodes and provides our best opportunity to manage nematodes affecting peanut IF the grower does not plant a resistant variety.
6. Velum Total is a combination of fluopyram and imidicloprid. Velum Total is an effective tool for the management of nematodes and thrips. Important points to remember when considering Velum Total include:
a. In studies at the University of Georgia, use of Velum Total has effectively reduced nematode damage to the peanut plants.
b. Use of Velum Total has effectively increased yield versus plots not treated with a nematicide.
c. The performance of Velum Total has been similar (or better than) Temik 15G, 10 lb/A at plant.
d. Velum Total will be applied as a liquid formulation to the open-furrow at planting time.
40
e. Propulse (13.7 fl oz/A) is a combination of prothioconazole and fluopyram. It can be applied at pegging time either through chemigation of followed by an immediate irrigation event to provide additional protection from nematodes.
7. AgLogic 15G (aldicarb) will be available to growers again 2017.
a. AgLogic 15G must be applied according to label with specific restrictions as far as distance from a water source and worker personal protection equipment.
b. AgLogic 15G is applied at 7 lb/A at planting.
c. AgLogic 15G is applied at 10 lb/A as a pegging time application.
8. Vydate C-LV for management of nematodes on peanut and cotton is unlikely to be available in 2017.
MINIMIZING DISEASES OF PEANUT IN THE SOUTHEASTERN UNITED STATES
Robert Kemerait, Albert Culbreath, Eric Prostko, Tim Brenneman, Scott Tubbs, Rajagopalbabu Srinivasan, Mark Abney, Scott Monfort and Adam Rabinowitz
University of Georgia
Barry Tillman, Nicholas Dufault, Diane Rowland, and Michael Mulvaney University of Florida
Austin Hagan
Auburn University
Jason Sarver Mississippi State University
Dan Anco and Nathan Smith
Clemson University
In 2016, losses to tomato spotted wilt across the peanut production region of the southeastern United States increased slightly to estimated losses from 2015. Losses associated with spotted wilt were approximately 3% in 2015 and 3.5% in 2016, though tomato spotted wilt was more severe in some fields than in others. Also, tomato spotted wilt was less severe in Mississippi and the panhandle of Florida and more severe in South Carolina and parts of Georgia. Growers can

41
successfully manage this disease, and other important diseases, using Peanut Rx. This disease risk index can help growers better understand how careful selection of production practices can reduce the risk to disease losses. The Spotted Wilt Index and the Peanut Fungal Disease Risk Index were successfully combined in 2005 to produce the Peanut Disease Risk Index for peanut producers in the southeastern United States. The Peanut Disease Risk Index, developed by researchers and Extension specialists at the University of Georgia, the University of Florida, and Auburn University, is officially known as “PEANUT Rx”. It allows growers to assess their risk to tomato spotted wilt, leaf spot diseases and white mold. It also notes which varieties have some resistance (or increased susceptibility) to the peanut root-knot nematode (Meloidogyne arenaria), Cylindrocladium black rot (CBR) and Rhizoctonia limb rot. The 2016 version of PEANUT Rx has been fully reviewed and updated by the authors based upon data and observations from the 2015 field season. UPDATES TO THE 2017 PEANUT Rx There have been a few updates to PEANUT Rx 2016 from the 2015 version. Most of the changes that have been made can be found in the cultivar/variety section of Peanut Rx. Also, risk points have been adjusted for “leaf spot” under the “planting date” category to better reflect our better understanding of the relationship between later planting dates and increased risk to leaf spot. The planting date ranges have been adjusted slightly. With additional data, risk points for “spotted wilt” assigned to variety TUFRunnerTM ‘297’ have been reduced from “15” to “10”. Two new varieties have been added to the 2017 version of Peanut Rx; both have “hi oleic” chemistries. These varieties include runner-type FloRunTM ‘157’ and virginia-type ‘Sullivan’. Because seed for these varieties is generally no longer commercially available, varieties ‘Georgia Greener’ and TUFRunnerTM ‘727’ have been removed from the index for 2017. As in the previous versions of the Disease Index, growers will note that attention to variety selection, planting date, plant population, good crop rotation, tillage, and other factors, has a tremendous impact on the potential for diseases in a field. SPOTTED WILT OF PEANUT When tomato spotted wilt virus (TSWV) infects a host plant, it can cause a disease that severely weakens or kills that plant. This particular virus is capable of infecting a large number of plant species to include several that are important crops in the southeastern United States. Peanut, tobacco, tomato and pepper crops have been seriously damaged by TSWV. The only known method of TSWV transmission is via certain species of thrips that have previously acquired the virus by feeding on infected plants. The factors leading to the rapid spread of this disease in the Southeast are very complicated and no single treatment or cultural practice has been found to be a consistently effective control measure. However, research continues to identify factors that influence the severity of TSWV in individual peanut fields.
PEANUTS AND FUNGAL DISEASES: AN UNAVOIDABLE UNION Successful peanut production in the southeastern United States requires that growers use a variety of tactics and strategies to minimize losses to disease. Weather patterns in Georgia and neighboring areas during the growing season, including high temperatures, high humidity and the potential for daily rainfall and thunder storms, create nearly perfect environmental conditions for outbreaks of fungal diseases. Common fungal diseases include early and late leaf spot, rust,
42
Rhizoctonia limb rot, southern stem rot (referred to locally as “white mold”), Cylindrocladium black rot and a host of other diseases that are common, but of sporadic importance. If peanut growers do not take appropriate measures to manage fungal diseases, crop loss in a field may exceed 50%. Strategies for managing fungal diseases of peanut are typically dependent on the use of multiple fungicide applications during the growing season. Fungicide applications are initiated approximately 30 days after planting, as the interaction between the growth of the crop and environmental conditions are likely to support the development of leaf spot diseases. The length of the effective protective interval of the previous fungicide application determines the timing for subsequent applications. The length of time in which a fungicide can protect the peanut plant from infection is dependent on the properties of the fungicide and on weather conditions. Many growers will begin treating for soilborne diseases approximately 60 days after planting. With attention to proper timing of applications and complete coverage of the peanut canopy, growers can expect good to excellent control of leaf spot and reasonable control of soilborne diseases. Although control of leaf spot may approach 100%, growers typically can only expect about 60-70% control of soilborne diseases with effective fungicide programs. Weather plays a major role in the potential for disease. Most fungal diseases will be more severe during periods of increased rainfall and of less concern during drier periods. When weather conditions are very favorable for disease, severe epidemics may occur in fields where disease was not thought to be a problem. When weather conditions are unfavorable for fungal growth, disease severity may be low even in fields where it has been common in the past. The AU-pnut leaf spot advisory that has been used to effectively manage diseases in peanut is based on this relationship between disease and weather. Even those growers who do not use AU-pnut recognize the need to shorten the time between fungicide applications during wet weather. FACTORS AFFECTING THE SEVERITY OF TSWV ON PEANUT Peanut Variety No variety of peanut is immune to TSWV. However, some varieties have consistently demonstrated moderate levels of resistance. In addition to resistance, (reduced disease incidence), some varieties appear to have some degree of tolerance (reduced severity in infected plants) as well. Higher levels of resistance and tolerance are anticipated since peanut breeding programs are now evaluating potential new varieties for response to TSWV. Peanut varieties can have a major impact on fungal diseases as well as TSWV incidence. The variety ‘Georgia-06G’ is currently planted on much of the peanut acreage in the Southeast and it has a significant level of resistance to tomato spotted wilt. However, newer varieties may have improved resistance. For example, the variety ‘Georgia-12Y’ has resistance to tomato spotted wilt and to white mold that is better than that found in Georgia-06G. Just as none of the current varieties is immune to spotted wilt, none is completely immune to fungal disease either. However, improved resistance will likely lead to a reduction in disease severity. It is important to remember that improved resistance to one disease does not mean that the variety also possesses superior resistance to other diseases. Planting Date Thrips populations and peanut susceptibility to infection are at their highest in the early spring. The timing of peanut emergence in relation to rapidly changing thrips populations can make a big difference in the incidence of TSWV for the remainder of the season. Optimum planting dates vary from year to year, but in general, early-planted and late-planted peanuts tend to have higher

43
levels of TSWV than peanuts planted in the middle of the planting season. Note: In recent years, peanut planted in the second half of May and in June have been less affected by spotted wilt than in previous years. It is important for larger acreage peanut farmers to spread their harvest season. Some staggering of planting dates may be necessary, but to avoid spotted wilt pressure, it may be more effective to plant varieties with different time-to-maturity requirements as closely as possible within a low-risk time period. If peanuts must be planted during a high-risk period, try to minimize the risk associated with other index factors. Planting date can affect the severity of fungal diseases in a field. Earlier planted peanuts (April-early May) tend to have more severe outbreaks of white mold than do later planted peanuts. Earlier planted peanuts are likely to be exposed to longer periods of hot weather, favorable for white mold, than later planted peanuts which will continue to mature into late summer or early fall. However, the threat from leaf spot increases as planting date is moves from April to early May to later May and June. Reasons for this include the warmer temperatures later in the season that are more favorable for the growth and spread of the leaf spot pathogens and because the level of inoculum (number of spores) in the environment increases as the season progresses. Thus, later planted peanuts spend a greater portion of their growth exposed to increased leaf spot pressure than do earlier plantings. NOTE: Because of the reduction of tomato spotted wilt in recent years, the increased resistance in new varieties, and the need for timely harvest of the peanut crop, growers may consider planting a portion of their crop in April, assuming the risk to tomato spitted wilt is appropriately managed. Growers who plant the MORE RESISTANT peanut varieties in the latter part of April should not be at a significant risk to losses from tomato spotted wilt in the 2017 season. Plant Population An association between “skippy” stands and higher levels of TSWV was noted soon after the disease began to impact peanut production in Georgia. More recently, research has confirmed the impact of plant population on TSWV incidence. Low and high plant populations may actually have the same number of infected plants, but the percentage of infected plants is greater in low plant populations. In other words, a higher plant population may not reduce the number of infected plants, but it will increase the number of healthy plants that can fill in and compensate for infected plants. In some cases, low plant populations may result in increased numbers of thrips per plant thereby increasing the probability of infection. When plant populations are as low as two plants per foot, severe losses to TSWV have been observed even when other factors would indicate a low level of risk. Getting a rapid, uniform stand with the desired plant population is a function of not only seeding rate but also seed quality, soil moisture, soil temperature and planting depth. NOTE: In the 2017 version of Peanut Rx, peanut varieties with a risk of TSWV at 25 points or less have a reduced risk (10 points) when planted at 3-4 seeds per foot than do varieties with a risk of 30 points or greater (15 points). This is based upon recent research conducted at the University of Georgia by Dr. Scott Tubbs. Plant population has less effect on fungal diseases than on spotted wilt. However, it is now known that the severity of white mold increases when the space between the crowns of individual plants decreases. This is because the shorter spacing allows for greater spread of the white mold fungus, Sclerotium rolfsii.
44
Insecticide Usage In general, the use of insecticides to control thrips, the insect that transmits or “vectors” the tomato spotted wilt virus, has been an ineffective means of suppressing tomato spotted wilt disease. In theory, lowering overall thrips populations with insecticides should effectively reduce in-field spread of TSWV and growers now have a selection of products that are effective in killing thrips. However, most insecticides have proven to be ineffective at suppressing primary infection, which accounts for most virus transmission in peanut fields. Despite the overall disappointing results with insecticides, one particular chemical - phorate (Thimet 20G), has demonstrated consistent, low-level suppression of TSWV. The mechanism of phorate’s TSWV suppression is not known, but the level of thrips control obtained with phorate is not greater than that obtained with other insecticides. Phorate may induce a defense response in the peanut plant that allows the plant to better resist infection or inhibits virus replication. IMPORTANT NOTE: In Peanut Rx, use of Thimet 20G, but not other insecticides, reduces risk of tomato spotted wilt. However this does not mean that other products offer good-to-excellent control of thrips which is also an important production consideration. Row Pattern Seven to ten-inch twin row spacing, utilizing the same seeding rate per acre as single row spacing, has become increasingly popular in Georgia. Research on irrigated peanuts has shown a strong tendency for significantly higher yields, a one to two point increase in grade and reductions in spotted wilt severity that have averaged 25-30%. The reason for this reduction in spotted wilt is not fully understood. Row pattern, either single or twin row plantings, also has some effect on the potential for disease in a field. Work done at the Coastal Plain Experiment Station has lead to the observation that white mold is more severe in single rows (six seed per foot) than in twin rows (three seed per foot). White mold often develops in a field by infecting sequential plants within the same row. Planting the seed in twin rows rather than single rows increases the distance between the crowns of the peanut plants and delays the spread of white mold from plant to plant. The difference in leaf spot between single and twin row peanuts appears to be negligible. Tillage The tillage method that a grower utilizes can make a big difference in peanut yields. There are many different methods to choose from, each with its own merits and disadvantages for a given situation. Strip tillage has been shown to have some strong advantages (including reduced soil erosion and reduced time and labor required for planting), but in some situations, yields have been disappointing. Unbiased tillage research is difficult to accomplish, but studies have consistently shown that peanuts grown in strip till systems have less thrips damage and slightly less spotted wilt. On-farm observations have corroborated these results, but more studies are needed in order to characterize the magnitude of the reduction. We do not suggest that growers should change their tillage method just to reduce spotted wilt, but we have included tillage in the risk index in an attempt to better identify total risks. Conservation tillage, such as strip tillage, can reduce the amount of disease in a peanut field. For a number of years it has been recognized that spotted wilt is less severe in strip-tilled fields than in fields with conventional tillage. However, in results from recent field trials, it has been documented that leaf spot is also less severe in strip-tilled fields than in conventionally tilled fields, so long as peanut is not planted in consecutive season. Although the exact mechanism is currently unknown, the appearance of leaf spot is delayed in strip-tilled fields and the severity at the end of the season is significantly lower than in conventional tillage. Use of conservation tillage does not eliminate the need for fungicides to control leaf spot, but helps to insure added disease control from a fungicide program. Additional studies have found that white mold may be slightly more sever in strip tillage above conventional tillage; deep turning the soil may help to reduce the
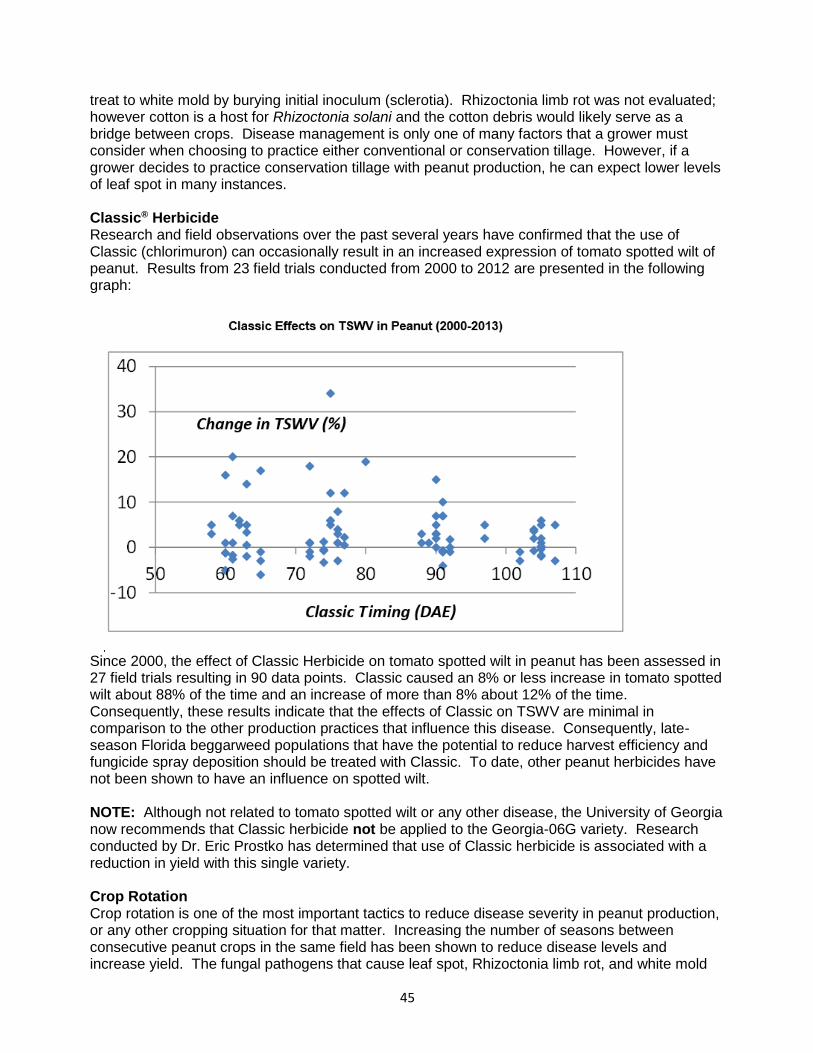
45
treat to white mold by burying initial inoculum (sclerotia). Rhizoctonia limb rot was not evaluated; however cotton is a host for Rhizoctonia solani and the cotton debris would likely serve as a bridge between crops. Disease management is only one of many factors that a grower must consider when choosing to practice either conventional or conservation tillage. However, if a grower decides to practice conservation tillage with peanut production, he can expect lower levels of leaf spot in many instances. Classic® Herbicide Research and field observations over the past several years have confirmed that the use of Classic (chlorimuron) can occasionally result in an increased expression of tomato spotted wilt of peanut. Results from 23 field trials conducted from 2000 to 2012 are presented in the following graph:
Since 2000, the effect of Classic Herbicide on tomato spotted wilt in peanut has been assessed in 27 field trials resulting in 90 data points. Classic caused an 8% or less increase in tomato spotted wilt about 88% of the time and an increase of more than 8% about 12% of the time. Consequently, these results indicate that the effects of Classic on TSWV are minimal in comparison to the other production practices that influence this disease. Consequently, late-season Florida beggarweed populations that have the potential to reduce harvest efficiency and fungicide spray deposition should be treated with Classic. To date, other peanut herbicides have not been shown to have an influence on spotted wilt. NOTE: Although not related to tomato spotted wilt or any other disease, the University of Georgia now recommends that Classic herbicide not be applied to the Georgia-06G variety. Research conducted by Dr. Eric Prostko has determined that use of Classic herbicide is associated with a reduction in yield with this single variety. Crop Rotation Crop rotation is one of the most important tactics to reduce disease severity in peanut production, or any other cropping situation for that matter. Increasing the number of seasons between consecutive peanut crops in the same field has been shown to reduce disease levels and increase yield. The fungal pathogens that cause leaf spot, Rhizoctonia limb rot, and white mold
46
survive between peanut crops on peanut crop debris, as survival structures in the soil, and on volunteer peanuts. The time that passes between consecutive peanut crops allows for the degradation of the peanut crop debris, thus depriving the fungal pathogens of a source of nutrition. Also, fungal survival structures and spores that are present in the soil have a finite period of viability in which to germinate and infect another peanut plant before they are no longer viable. Fields with longer crop rotations will have less pressure from leaf spot diseases, Rhizoctonia limb rot, white mold, and perhaps CBR, than fields with shorter rotations, or no rotation at all. In Georgia, the Cooperative Extension recommends at least two years between peanut crops to help manage diseases. Choice of rotation crops, along with the length of the rotation, will have an impact on the potential for disease in a field. Rotation of peanut with ANY other crop will reduce the potential for early leaf spot, late leaf spot, and peanut rust. The pathogens that cause these diseases do not affect other crops. Rotation of peanuts with cotton, or a grass crop such as corn, sorghum, or bahiagrass, will reduce the potential for white mold because the white mold pathogen does not infect these crops, or at least not very well. Rotation of peanut with a grass crop will reduce the risk of Rhizoctonia limb rot. However, because cotton is also infected by Rhizoctonia solani, rotation with this crop will not help to reduce Rhizoctonia limb rot. Other crops, such as tobacco and many vegetables are quite susceptible to diseases caused by Rhizoctonia solani and will not help to reduce the severity of limb rot in a peanut field. Growers must remember that soybeans and peanuts are affected by many of the same diseases. Planting soybeans in rotation with peanuts will not reduce the risk for CBR or peanut root-knot nematodes and will have only limited impact of risk to white mold and Rhizoctonia limb rot. Field History The history of disease in a field can be an important hint at the possibility of disease in the future, for much the same reason as noted in the crop rotation section above. Fields where growers have had difficulty managing disease in the past, despite the implementation of a good fungicide program, are more likely to have disease problems in the future than are fields with less histories of disease. There is some difference between white mold and Rhizoctonia limb rot with regards to field history. Where white mold has been a problem in the past, it can be expected to be again in the future. Without effective crop rotation, outbreaks of white mold can be expected to become increasingly severe each season. Rhizoctonia limb rot is a disease that is more sensitive to environmental conditions, especially rainfall and irrigation, than white mold. Therefore, the severity of Rhizoctonia limb rot is likely to be more variable than white mold from year to year based upon the abundance of moisture during the season. Irrigation Irrigation is a critical component of a production system and can result in large peanut yields. However, the water applied to a crop with irrigation is also beneficial for the fungal pathogens that cause common diseases such as leaf spot, Rhizoctonia limb rot, and white mold. Rhizoctonia limb rot is likely to be more severe in irrigated fields with heavy vine growth; the increase in white mold may be less obvious. High soil temperatures as well as moisture from irrigation affect the severity of white mold. Fungi causing leaf spot diseases need water for several important reasons, including growth, spore germination and infection of the peanut plant, and in some cases, spread of the fungal spores. Use of irrigation may extend the period of leaf wetness and the time of conditions favorable for leaf spot diseases beyond favorable conditions in a non-irrigated field. In two otherwise similar fields, the potential for disease is greater in the irrigated field.
47
Special note on irrigation and risk to white mold: From the discussion above, irrigation (and ample rainfall) can create conditions that favor outbreaks of white mold- to include more abundant moisture for growth and also greater humidity within a canopy which favors growth and spread of white mold. However, rainfall and, especially, irrigation are essential in the movement of foliar-applied fungicides from the leaves to the limbs and the crown of the plant where protection is needed from white mold. Under non-irrigated conditions, growers may actually observe MORE white mold than for irrigated peanuts, largely because effective fungicides are not “washed” to the parts of the plant that must be protected from this disease. Growers can use several strategies to improve efficacy of fungicides for management of white mold in non-irrigated fields.
1. Apply fungicides for control of soilborne diseases ahead of anticipated rain events to facilitate movement of fungicides.
2. Apply fungicides for control of soilborne diseases at night when the leaves are folded; such timing of application will increase coverage of the limbs and crowns of the plants.
REDUCING RISK TO LOSSES FROM PEANUT ROOT-KNOT NEMATODES Peanut root-knot nematode is not specifically included in Peanut Rx; however several of the factors that affect risk to other diseases also affect risk to losses from nematodes. These factors include the following.
1. Variety selection: Varieties ‘Tifguard’ and ‘Georgia-14N’ are highly resistant to infestation from the peanut root-knot nematode (Meloidogyne arenaria). Growers who plant these varieties in a root-knot nematode infested field will not need to use a nematicide. Use of nematode-resistant varieties not only protects the crop in the field, but also reduces nematode populations for the next peanut crop as compared if a susceptible variety like ‘Georgia-06G’ was planted.
2. Crop rotation: Like risk to other diseases, the threat from peanut root-knot nematode is greatly reduced by rotating fields away from peanut and other susceptible crops like soybeans. Cotton and corn are excellent rotation crops to reduce the risk of peanut root-knot nematodes in a field. Corn is also a host for the peanut root-knot nematode, but is a better rotation crop than either peanut or soybeans.
3. Tillage: Though much research is still needed, there is some indication that there is higher risk to nematodes in fields are prepared with reduced tillage than with conventional tillage. This effect is much less important than variety selection or crop rotation, and is not always observed. However, there is some evidence that disrupting the soil, such as occurs in conventional tillage, could help to disperse nematode populations present in the root zone of the developing seedling.
4. UGA Extension recommends that with high populations of root-knot nematodes growers are strongly recommended to plant nematode resistant varieties, and these varieties do not require the use of a nematicide. However, with low-to-moderate populations, growers could also consider using Velum Total or Telone II, and still plant susceptible cultivars such as GA-06G.
MEASURING TSWV RISK Many factors combine to influence the risk of losses to TSWV in a peanut crop. Some factors are more important than others, but no single factor can be used as a reliable TSWV control measure. However, research data and on-farm observations indicate that when combinations of several factors are considered, an individual field’s risk of losses due to TSWV can be estimated. There is no way to predict with total accuracy how much TSWV will occur in a given situation or how the

48
disease will affect yield, but by identifying high risk situations, growers can avoid those production practices that are conducive to major yield losses. The University of Georgia Tomato Spotted Wilt Risk Index for Peanuts was developed as a tool for evaluation of risk associated with individual peanut production situations. When high-risk situations are identified, growers should consider making modifications to their production plan (i.e. variety, planting date, seeding rate, etc.) to reduce their level of risk. Using preventative measures to reduce risk of TSWV losses is the only way to control the disease. After the crop is planted, there are no known control measures. The index combines what is known about individual risk factors into a comprehensive, but simple, estimate of TSWV risk for a given field. It assigns a relative importance to each factor so that an overall level of risk can be estimated. The first version of the index was developed in 1996 and was based on available research data. Small plot studies and on-farm observations have been used to evaluate index performance each year since release of the first version. In research plots where multiple TSWV management practices were used, as little as 5% of the total row feet were severely affected by TSWV compared to over 60% in high-risk situations. Yield differences were over 2000 lbs. per acre in some cases. Results of these and other validation studies have been used to make modifications in all subsequent versions of the index. Future changes are expected as we learn more about TSWV. Keep in mind that the risk levels assigned by this index are relative. In other words, if this index predicts a low level of risk, we would expect that field to be less likely to suffer major losses due to TSWV than a field that is rated with a higher level of risk. A low index value does not imply that a field is immune from TSWV losses. Losses due to TSWV vary from year to year. In a year where incidence is high statewide, even fields with a low risk level may experience significant losses. MEASURING RISK TO FUNGAL DISEASES OF PEANUT The index presented here is based upon better understanding of factors that affect disease incidence and severity. It is designed to help growers approximate the magnitude of the risk that they face from foliar and soilborne diseases in the coming season. More importantly, it should serve as an educational tool that allows the grower to predict the benefits of different management practices to produce a better crop. The risks associated with leaf spot, white mold and Rhizoctonia limb rot diseases are to be determined independently in the index system to be presented here. The magnitude of points associated with each variable is not linked between soilborne and foliar disease categories. However, the points allotted to each variable in the PEANUT Rx are weighted within a disease category according to the importance of the variable (such as variety or field history) to another variable (such as planting date). For example, within the category for leaf spot diseases, a maximum of 30 points is allotted to the variable “variety” while 0 points is allotted to the variable “row pattern”. The magnitude of points assigned within each category and to each variable has been checked to ensure that the total number of points assigned to a field is consistent with research and experience. For example, while it would be possible for a non-irrigated field planted to Georgia Green to fall in the lowest risk category, a field of irrigated Georgia Green could be in a category of “medium risk” but not “low risk”. NOTE: When weather conditions are favorable for fungal diseases, especially when rainfall is abundant, even fields at initial “low risk” to fungal diseases may become “high risk”.
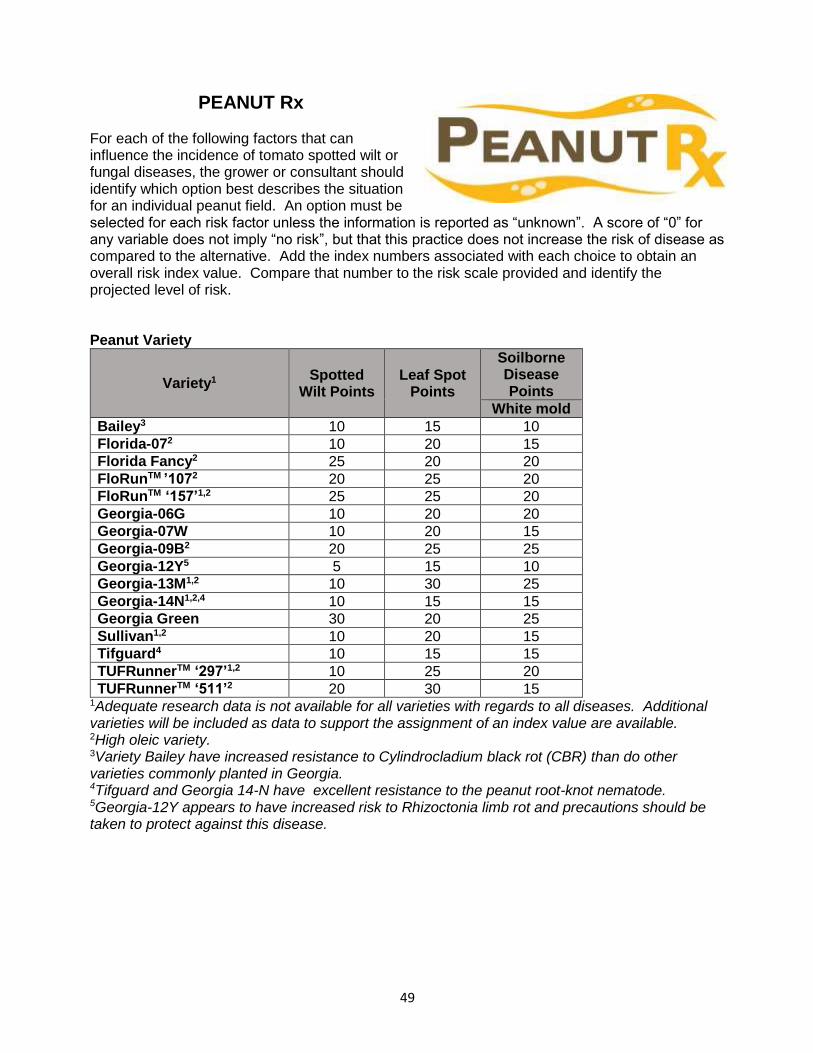
49
PEANUT Rx For each of the following factors that can influence the incidence of tomato spotted wilt or fungal diseases, the grower or consultant should identify which option best describes the situation for an individual peanut field. An option must be selected for each risk factor unless the information is reported as “unknown”. A score of “0” for any variable does not imply “no risk”, but that this practice does not increase the risk of disease as compared to the alternative. Add the index numbers associated with each choice to obtain an overall risk index value. Compare that number to the risk scale provided and identify the projected level of risk.
Peanut Variety
Variety1 Spotted
Wilt Points Leaf Spot
Points
Soilborne Disease Points
White mold
Bailey3 10 15 10
Florida-072 10 20 15
Florida Fancy2 25 20 20
FloRunTM ’1072 20 25 20
FloRunTM ‘157’1,2 25 25 20
Georgia-06G 10 20 20
Georgia-07W 10 20 15
Georgia-09B2 20 25 25
Georgia-12Y5 5 15 10
Georgia-13M1,2 10 30 25
Georgia-14N1,2,4 10 15 15
Georgia Green 30 20 25
Sullivan1,2 10 20 15
Tifguard4 10 15 15
TUFRunnerTM ‘297’1,2 10 25 20
TUFRunnerTM ‘511’2 20 30 15 1Adequate research data is not available for all varieties with regards to all diseases. Additional varieties will be included as data to support the assignment of an index value are available. 2High oleic variety. 3Variety Bailey have increased resistance to Cylindrocladium black rot (CBR) than do other varieties commonly planted in Georgia. 4Tifguard and Georgia 14-N have excellent resistance to the peanut root-knot nematode. 5Georgia-12Y appears to have increased risk to Rhizoctonia limb rot and precautions should be taken to protect against this disease.
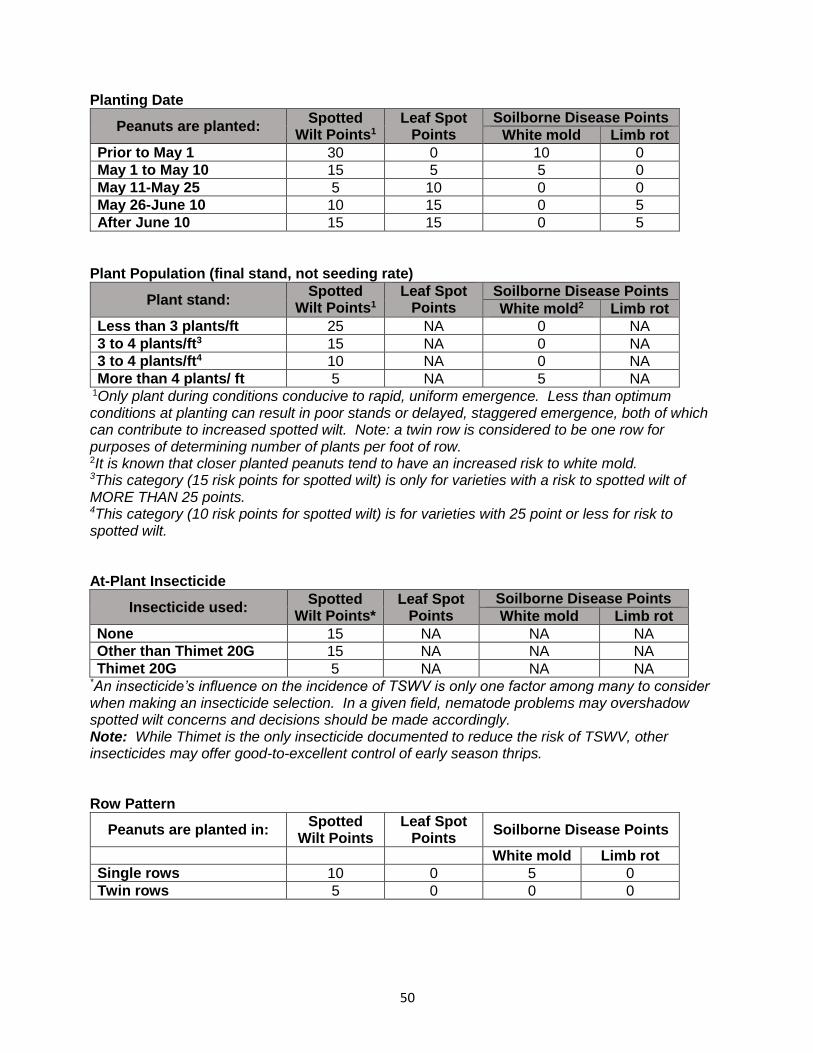
50
Planting Date
Peanuts are planted: Spotted
Wilt Points1 Leaf Spot
Points Soilborne Disease Points
White mold Limb rot
Prior to May 1 30 0 10 0
May 1 to May 10 15 5 5 0
May 11-May 25 5 10 0 0
May 26-June 10 10 15 0 5
After June 10 15 15 0 5
Plant Population (final stand, not seeding rate)
Plant stand: Spotted
Wilt Points1 Leaf Spot
Points Soilborne Disease Points
White mold2 Limb rot
Less than 3 plants/ft 25 NA 0 NA
3 to 4 plants/ft3 15 NA 0 NA
3 to 4 plants/ft4 10 NA 0 NA
More than 4 plants/ ft 5 NA 5 NA 1Only plant during conditions conducive to rapid, uniform emergence. Less than optimum conditions at planting can result in poor stands or delayed, staggered emergence, both of which can contribute to increased spotted wilt. Note: a twin row is considered to be one row for purposes of determining number of plants per foot of row. 2It is known that closer planted peanuts tend to have an increased risk to white mold. 3This category (15 risk points for spotted wilt) is only for varieties with a risk to spotted wilt of MORE THAN 25 points. 4This category (10 risk points for spotted wilt) is for varieties with 25 point or less for risk to spotted wilt. At-Plant Insecticide
Insecticide used: Spotted
Wilt Points* Leaf Spot
Points
Soilborne Disease Points
White mold Limb rot
None 15 NA NA NA
Other than Thimet 20G 15 NA NA NA
Thimet 20G 5 NA NA NA *An insecticide’s influence on the incidence of TSWV is only one factor among many to consider when making an insecticide selection. In a given field, nematode problems may overshadow spotted wilt concerns and decisions should be made accordingly. Note: While Thimet is the only insecticide documented to reduce the risk of TSWV, other insecticides may offer good-to-excellent control of early season thrips. Row Pattern
Peanuts are planted in: Spotted
Wilt Points Leaf Spot
Points Soilborne Disease Points
White mold Limb rot
Single rows 10 0 5 0
Twin rows 5 0 0 0
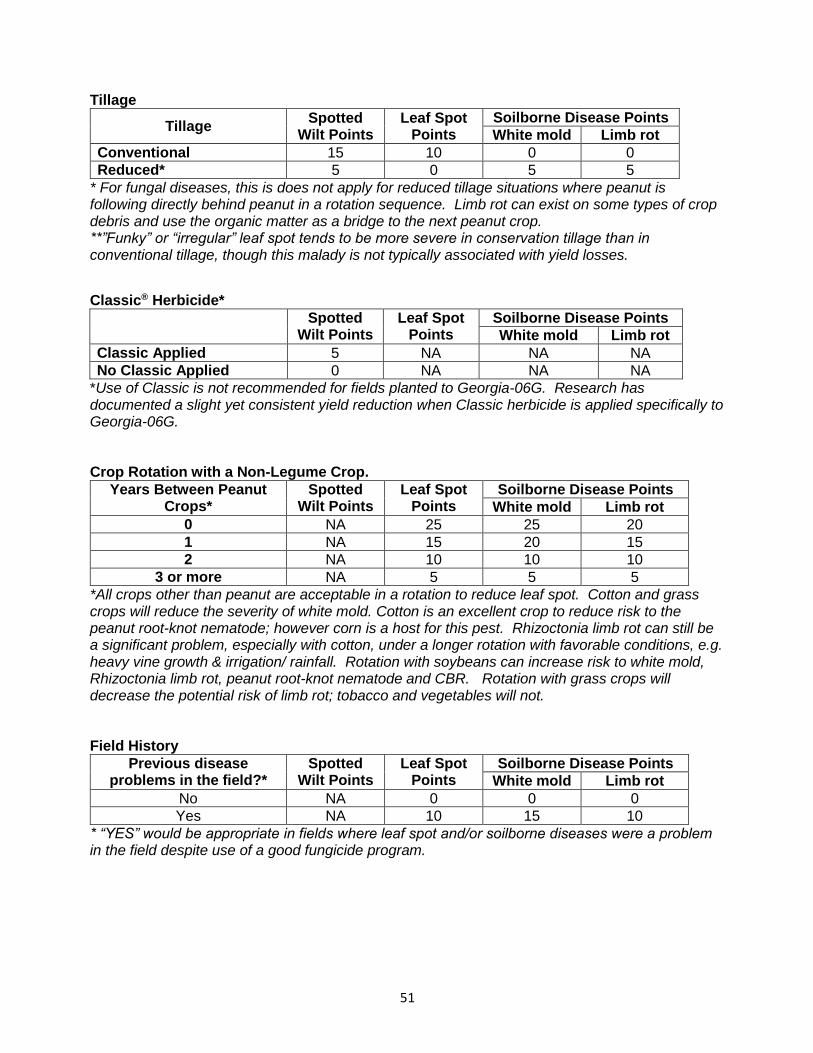
51
Tillage
Tillage Spotted
Wilt Points Leaf Spot
Points Soilborne Disease Points
White mold Limb rot
Conventional 15 10 0 0
Reduced* 5 0 5 5
* For fungal diseases, this is does not apply for reduced tillage situations where peanut is following directly behind peanut in a rotation sequence. Limb rot can exist on some types of crop debris and use the organic matter as a bridge to the next peanut crop. **”Funky” or “irregular” leaf spot tends to be more severe in conservation tillage than in conventional tillage, though this malady is not typically associated with yield losses.
Classic® Herbicide*
Spotted Wilt Points
Leaf Spot Points
Soilborne Disease Points
White mold Limb rot
Classic Applied 5 NA NA NA
No Classic Applied 0 NA NA NA
*Use of Classic is not recommended for fields planted to Georgia-06G. Research has documented a slight yet consistent yield reduction when Classic herbicide is applied specifically to Georgia-06G. Crop Rotation with a Non-Legume Crop.
Years Between Peanut Crops*
Spotted Wilt Points
Leaf Spot Points
Soilborne Disease Points
White mold Limb rot
0 NA 25 25 20
1 NA 15 20 15
2 NA 10 10 10
3 or more NA 5 5 5
*All crops other than peanut are acceptable in a rotation to reduce leaf spot. Cotton and grass crops will reduce the severity of white mold. Cotton is an excellent crop to reduce risk to the peanut root-knot nematode; however corn is a host for this pest. Rhizoctonia limb rot can still be a significant problem, especially with cotton, under a longer rotation with favorable conditions, e.g. heavy vine growth & irrigation/ rainfall. Rotation with soybeans can increase risk to white mold, Rhizoctonia limb rot, peanut root-knot nematode and CBR. Rotation with grass crops will decrease the potential risk of limb rot; tobacco and vegetables will not. Field History
Previous disease problems in the field?*
Spotted Wilt Points
Leaf Spot Points
Soilborne Disease Points
White mold Limb rot
No NA 0 0 0
Yes NA 10 15 10
* “YES” would be appropriate in fields where leaf spot and/or soilborne diseases were a problem in the field despite use of a good fungicide program.
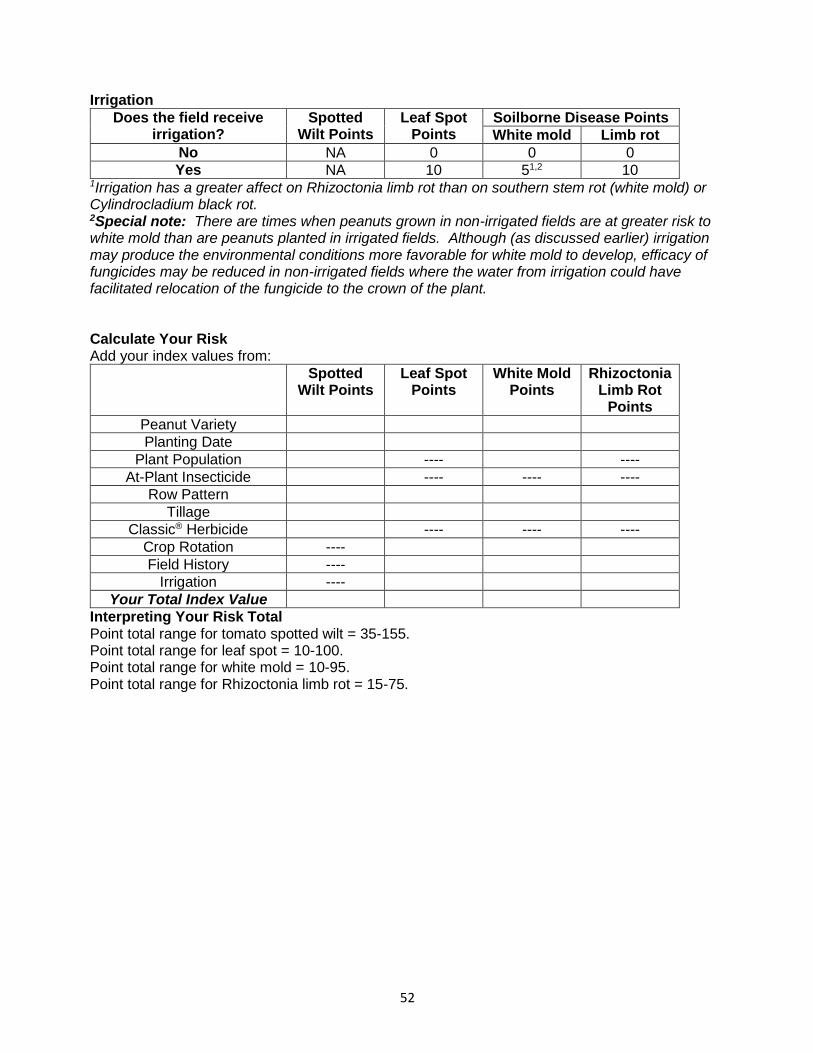
52
Irrigation
Does the field receive irrigation?
Spotted Wilt Points
Leaf Spot Points
Soilborne Disease Points
White mold Limb rot
No NA 0 0 0
Yes NA 10 51,2 10 1Irrigation has a greater affect on Rhizoctonia limb rot than on southern stem rot (white mold) or Cylindrocladium black rot. 2Special note: There are times when peanuts grown in non-irrigated fields are at greater risk to white mold than are peanuts planted in irrigated fields. Although (as discussed earlier) irrigation may produce the environmental conditions more favorable for white mold to develop, efficacy of fungicides may be reduced in non-irrigated fields where the water from irrigation could have facilitated relocation of the fungicide to the crown of the plant. Calculate Your Risk Add your index values from:
Spotted Wilt Points
Leaf Spot Points
White Mold Points
Rhizoctonia Limb Rot
Points
Peanut Variety
Planting Date
Plant Population ---- ----
At-Plant Insecticide ---- ---- ----
Row Pattern
Tillage
Classic® Herbicide ---- ---- ----
Crop Rotation ----
Field History ----
Irrigation ----
Your Total Index Value
Interpreting Your Risk Total Point total range for tomato spotted wilt = 35-155. Point total range for leaf spot = 10-100. Point total range for white mold = 10-95. Point total range for Rhizoctonia limb rot = 15-75.
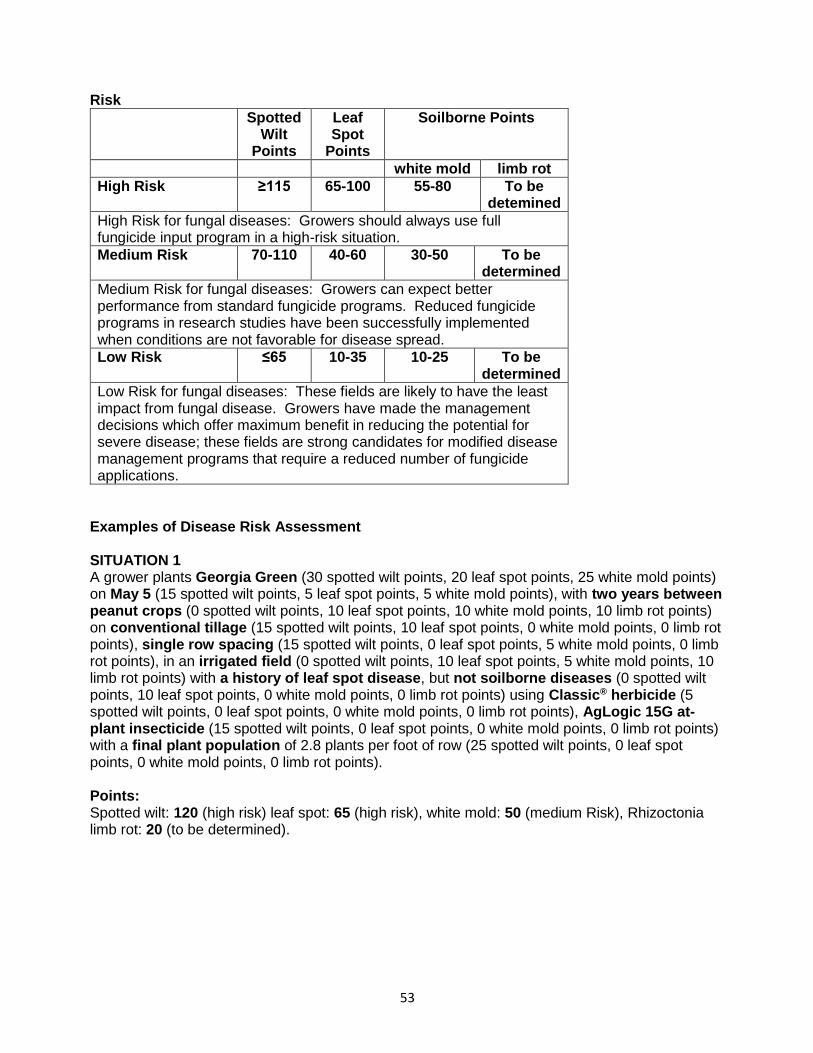
53
Risk
Spotted Wilt
Points
Leaf Spot
Points
Soilborne Points
white mold limb rot
High Risk ≥115 65-100 55-80 To be detemined
High Risk for fungal diseases: Growers should always use full fungicide input program in a high-risk situation.
Medium Risk 70-110 40-60 30-50 To be determined
Medium Risk for fungal diseases: Growers can expect better performance from standard fungicide programs. Reduced fungicide programs in research studies have been successfully implemented when conditions are not favorable for disease spread.
Low Risk ≤65 10-35 10-25 To be determined
Low Risk for fungal diseases: These fields are likely to have the least impact from fungal disease. Growers have made the management decisions which offer maximum benefit in reducing the potential for severe disease; these fields are strong candidates for modified disease management programs that require a reduced number of fungicide applications.
Examples of Disease Risk Assessment SITUATION 1 A grower plants Georgia Green (30 spotted wilt points, 20 leaf spot points, 25 white mold points) on May 5 (15 spotted wilt points, 5 leaf spot points, 5 white mold points), with two years between peanut crops (0 spotted wilt points, 10 leaf spot points, 10 white mold points, 10 limb rot points) on conventional tillage (15 spotted wilt points, 10 leaf spot points, 0 white mold points, 0 limb rot points), single row spacing (15 spotted wilt points, 0 leaf spot points, 5 white mold points, 0 limb rot points), in an irrigated field (0 spotted wilt points, 10 leaf spot points, 5 white mold points, 10 limb rot points) with a history of leaf spot disease, but not soilborne diseases (0 spotted wilt points, 10 leaf spot points, 0 white mold points, 0 limb rot points) using Classic® herbicide (5 spotted wilt points, 0 leaf spot points, 0 white mold points, 0 limb rot points), AgLogic 15G at-plant insecticide (15 spotted wilt points, 0 leaf spot points, 0 white mold points, 0 limb rot points) with a final plant population of 2.8 plants per foot of row (25 spotted wilt points, 0 leaf spot points, 0 white mold points, 0 limb rot points). Points: Spotted wilt: 120 (high risk) leaf spot: 65 (high risk), white mold: 50 (medium Risk), Rhizoctonia limb rot: 20 (to be determined).
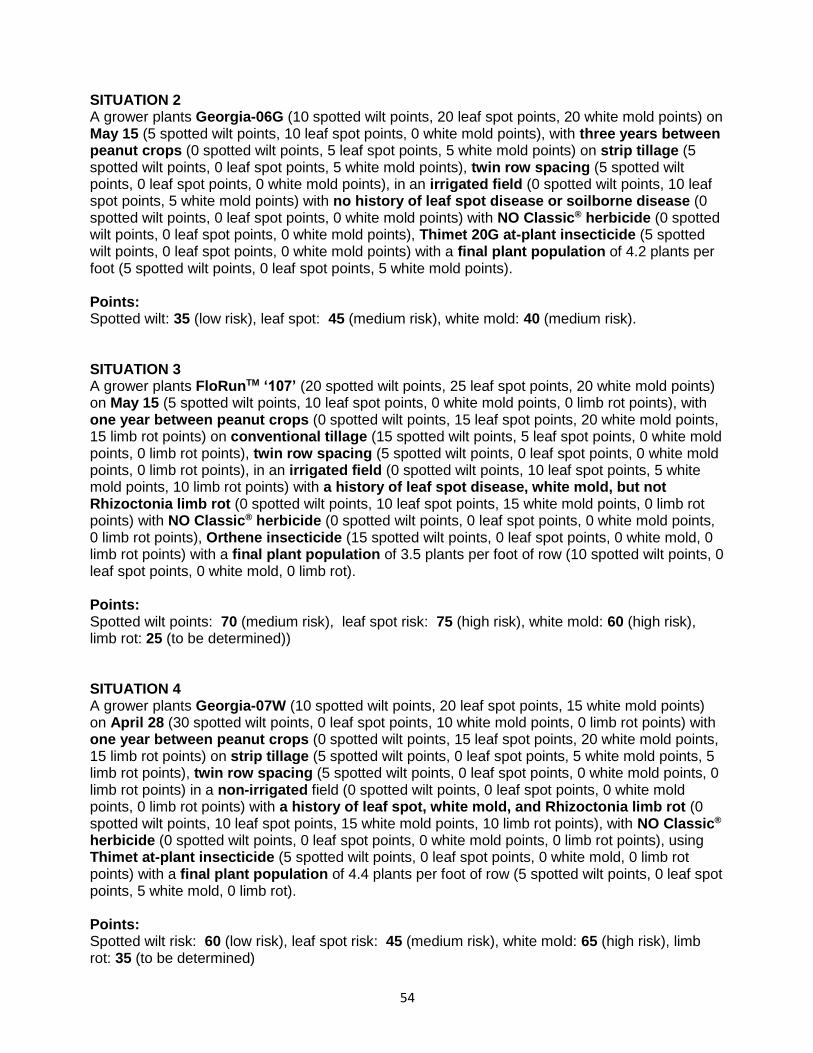
54
SITUATION 2 A grower plants Georgia-06G (10 spotted wilt points, 20 leaf spot points, 20 white mold points) on May 15 (5 spotted wilt points, 10 leaf spot points, 0 white mold points), with three years between peanut crops (0 spotted wilt points, 5 leaf spot points, 5 white mold points) on strip tillage (5 spotted wilt points, 0 leaf spot points, 5 white mold points), twin row spacing (5 spotted wilt points, 0 leaf spot points, 0 white mold points), in an irrigated field (0 spotted wilt points, 10 leaf spot points, 5 white mold points) with no history of leaf spot disease or soilborne disease (0 spotted wilt points, 0 leaf spot points, 0 white mold points) with NO Classic® herbicide (0 spotted wilt points, 0 leaf spot points, 0 white mold points), Thimet 20G at-plant insecticide (5 spotted wilt points, 0 leaf spot points, 0 white mold points) with a final plant population of 4.2 plants per foot (5 spotted wilt points, 0 leaf spot points, 5 white mold points). Points: Spotted wilt: 35 (low risk), leaf spot: 45 (medium risk), white mold: 40 (medium risk). SITUATION 3 A grower plants FloRunTM ‘107’ (20 spotted wilt points, 25 leaf spot points, 20 white mold points) on May 15 (5 spotted wilt points, 10 leaf spot points, 0 white mold points, 0 limb rot points), with one year between peanut crops (0 spotted wilt points, 15 leaf spot points, 20 white mold points, 15 limb rot points) on conventional tillage (15 spotted wilt points, 5 leaf spot points, 0 white mold points, 0 limb rot points), twin row spacing (5 spotted wilt points, 0 leaf spot points, 0 white mold points, 0 limb rot points), in an irrigated field (0 spotted wilt points, 10 leaf spot points, 5 white mold points, 10 limb rot points) with a history of leaf spot disease, white mold, but not Rhizoctonia limb rot (0 spotted wilt points, 10 leaf spot points, 15 white mold points, 0 limb rot points) with NO Classic® herbicide (0 spotted wilt points, 0 leaf spot points, 0 white mold points, 0 limb rot points), Orthene insecticide (15 spotted wilt points, 0 leaf spot points, 0 white mold, 0 limb rot points) with a final plant population of 3.5 plants per foot of row (10 spotted wilt points, 0 leaf spot points, 0 white mold, 0 limb rot). Points: Spotted wilt points: 70 (medium risk), leaf spot risk: 75 (high risk), white mold: 60 (high risk), limb rot: 25 (to be determined)) SITUATION 4 A grower plants Georgia-07W (10 spotted wilt points, 20 leaf spot points, 15 white mold points) on April 28 (30 spotted wilt points, 0 leaf spot points, 10 white mold points, 0 limb rot points) with one year between peanut crops (0 spotted wilt points, 15 leaf spot points, 20 white mold points, 15 limb rot points) on strip tillage (5 spotted wilt points, 0 leaf spot points, 5 white mold points, 5 limb rot points), twin row spacing (5 spotted wilt points, 0 leaf spot points, 0 white mold points, 0 limb rot points) in a non-irrigated field (0 spotted wilt points, 0 leaf spot points, 0 white mold points, 0 limb rot points) with a history of leaf spot, white mold, and Rhizoctonia limb rot (0 spotted wilt points, 10 leaf spot points, 15 white mold points, 10 limb rot points), with NO Classic® herbicide (0 spotted wilt points, 0 leaf spot points, 0 white mold points, 0 limb rot points), using Thimet at-plant insecticide (5 spotted wilt points, 0 leaf spot points, 0 white mold, 0 limb rot points) with a final plant population of 4.4 plants per foot of row (5 spotted wilt points, 0 leaf spot points, 5 white mold, 0 limb rot). Points: Spotted wilt risk: 60 (low risk), leaf spot risk: 45 (medium risk), white mold: 65 (high risk), limb rot: 35 (to be determined)
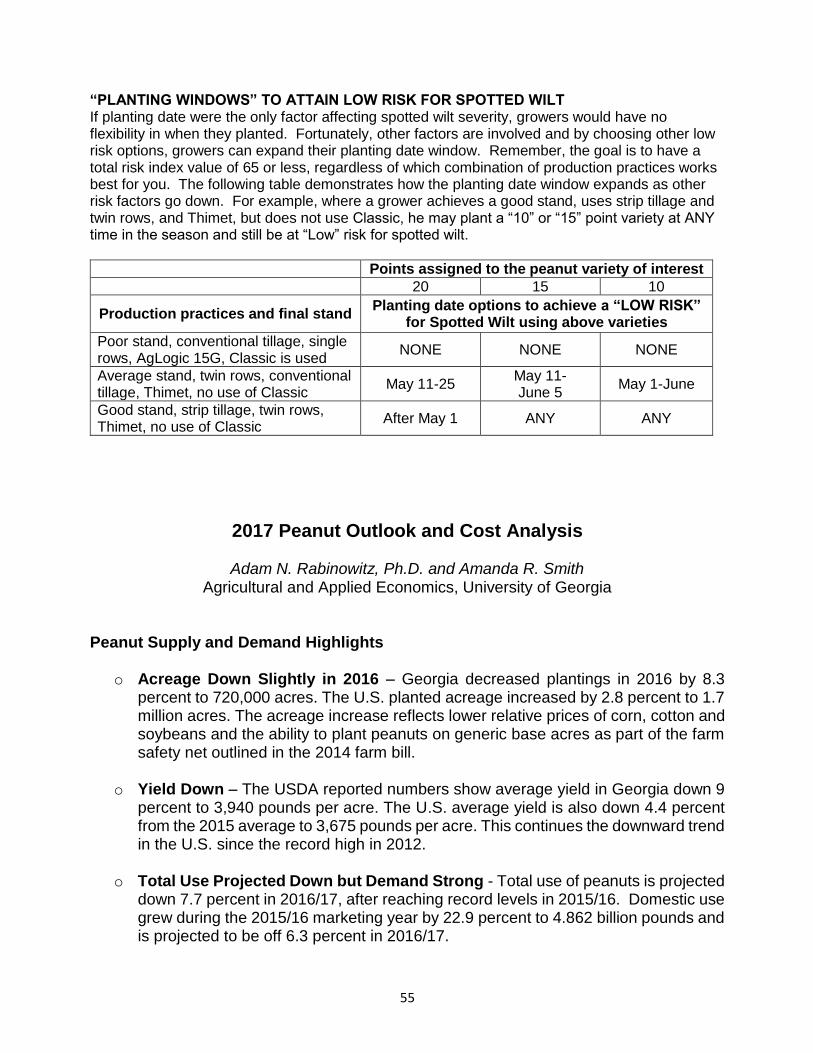
55
“PLANTING WINDOWS” TO ATTAIN LOW RISK FOR SPOTTED WILT If planting date were the only factor affecting spotted wilt severity, growers would have no flexibility in when they planted. Fortunately, other factors are involved and by choosing other low risk options, growers can expand their planting date window. Remember, the goal is to have a total risk index value of 65 or less, regardless of which combination of production practices works best for you. The following table demonstrates how the planting date window expands as other risk factors go down. For example, where a grower achieves a good stand, uses strip tillage and twin rows, and Thimet, but does not use Classic, he may plant a “10” or “15” point variety at ANY time in the season and still be at “Low” risk for spotted wilt.
Points assigned to the peanut variety of interest
20 15 10
Production practices and final stand Planting date options to achieve a “LOW RISK”
for Spotted Wilt using above varieties
Poor stand, conventional tillage, single rows, AgLogic 15G, Classic is used
NONE NONE NONE
Average stand, twin rows, conventional tillage, Thimet, no use of Classic
May 11-25 May 11- June 5
May 1-June
Good stand, strip tillage, twin rows, Thimet, no use of Classic
After May 1 ANY ANY
2017 Peanut Outlook and Cost Analysis
Adam N. Rabinowitz, Ph.D. and Amanda R. Smith Agricultural and Applied Economics, University of Georgia
Peanut Supply and Demand Highlights
o Acreage Down Slightly in 2016 – Georgia decreased plantings in 2016 by 8.3 percent to 720,000 acres. The U.S. planted acreage increased by 2.8 percent to 1.7 million acres. The acreage increase reflects lower relative prices of corn, cotton and soybeans and the ability to plant peanuts on generic base acres as part of the farm safety net outlined in the 2014 farm bill.
o Yield Down – The USDA reported numbers show average yield in Georgia down 9 percent to 3,940 pounds per acre. The U.S. average yield is also down 4.4 percent from the 2015 average to 3,675 pounds per acre. This continues the downward trend in the U.S. since the record high in 2012.
o Total Use Projected Down but Demand Strong - Total use of peanuts is projected down 7.7 percent in 2016/17, after reaching record levels in 2015/16. Domestic use grew during the 2015/16 marketing year by 22.9 percent to 4.862 billion pounds and is projected to be off 6.3 percent in 2016/17.

56
o Carryover manageable – Stocks of peanuts carried over on August 1, 2017 are projected at 1.7 billion pounds, the lowest level since 2011/12. This is a better situation than prior years, especially with expectations of a large number of plantings in 2017.
o Peanut Prices Rebounding – Farmer stock prices averaged $384 per ton in Georgia for 2015/16. Prices have been rebounding and 2017 contracts are being offered around $475.
Peanut Supply Situation A record peanut crop of 3.4 billion pounds occurred in 2015 for Georgia. Typically, this will result in a drop in planted acres of more than 75 percent of the prior years’ increase, but that did not happen in 2016. Even with early concerns about warehousing space and lower contract prices, GA growers only decreased planted acres in 2016 by 8.3 percent to 720,000. The large number of planted acres was a result of the relatively low price for other crops and the available Price Loss Coverage (PLC) on peanuts. As the 2016 season progressed, drought, strong exports, and corrected USDA stocks alleviated concerns about supply. The USDA National Agricultural Statistics Service has estimated the 2016 crop at 2.8 billion pounds on a yield of 3,940 pounds per acre. The U.S. production was also down in 2016 to 5.7 billion pounds, however, this was on a 2.8 percent increase of planted acres, primarily occurring in Texas. Georgia production represents 49 percent of the total U.S. production in 2016.
Source: USDA - NASS
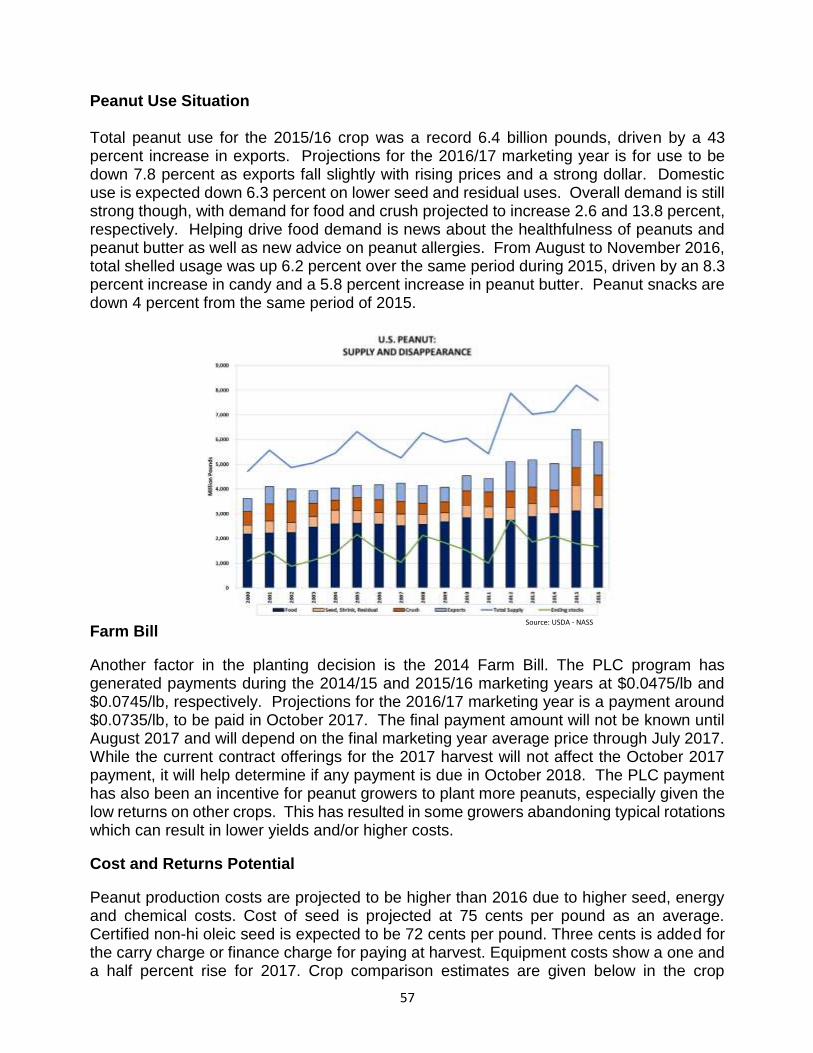
57
Peanut Use Situation Total peanut use for the 2015/16 crop was a record 6.4 billion pounds, driven by a 43 percent increase in exports. Projections for the 2016/17 marketing year is for use to be down 7.8 percent as exports fall slightly with rising prices and a strong dollar. Domestic use is expected down 6.3 percent on lower seed and residual uses. Overall demand is still strong though, with demand for food and crush projected to increase 2.6 and 13.8 percent, respectively. Helping drive food demand is news about the healthfulness of peanuts and peanut butter as well as new advice on peanut allergies. From August to November 2016, total shelled usage was up 6.2 percent over the same period during 2015, driven by an 8.3 percent increase in candy and a 5.8 percent increase in peanut butter. Peanut snacks are down 4 percent from the same period of 2015.
Farm Bill
Another factor in the planting decision is the 2014 Farm Bill. The PLC program has generated payments during the 2014/15 and 2015/16 marketing years at $0.0475/lb and $0.0745/lb, respectively. Projections for the 2016/17 marketing year is a payment around $0.0735/lb, to be paid in October 2017. The final payment amount will not be known until August 2017 and will depend on the final marketing year average price through July 2017. While the current contract offerings for the 2017 harvest will not affect the October 2017 payment, it will help determine if any payment is due in October 2018. The PLC payment has also been an incentive for peanut growers to plant more peanuts, especially given the low returns on other crops. This has resulted in some growers abandoning typical rotations which can result in lower yields and/or higher costs.
Cost and Returns Potential
Peanut production costs are projected to be higher than 2016 due to higher seed, energy and chemical costs. Cost of seed is projected at 75 cents per pound as an average. Certified non-hi oleic seed is expected to be 72 cents per pound. Three cents is added for the carry charge or finance charge for paying at harvest. Equipment costs show a one and a half percent rise for 2017. Crop comparison estimates are given below in the crop
Source: USDA - NASS
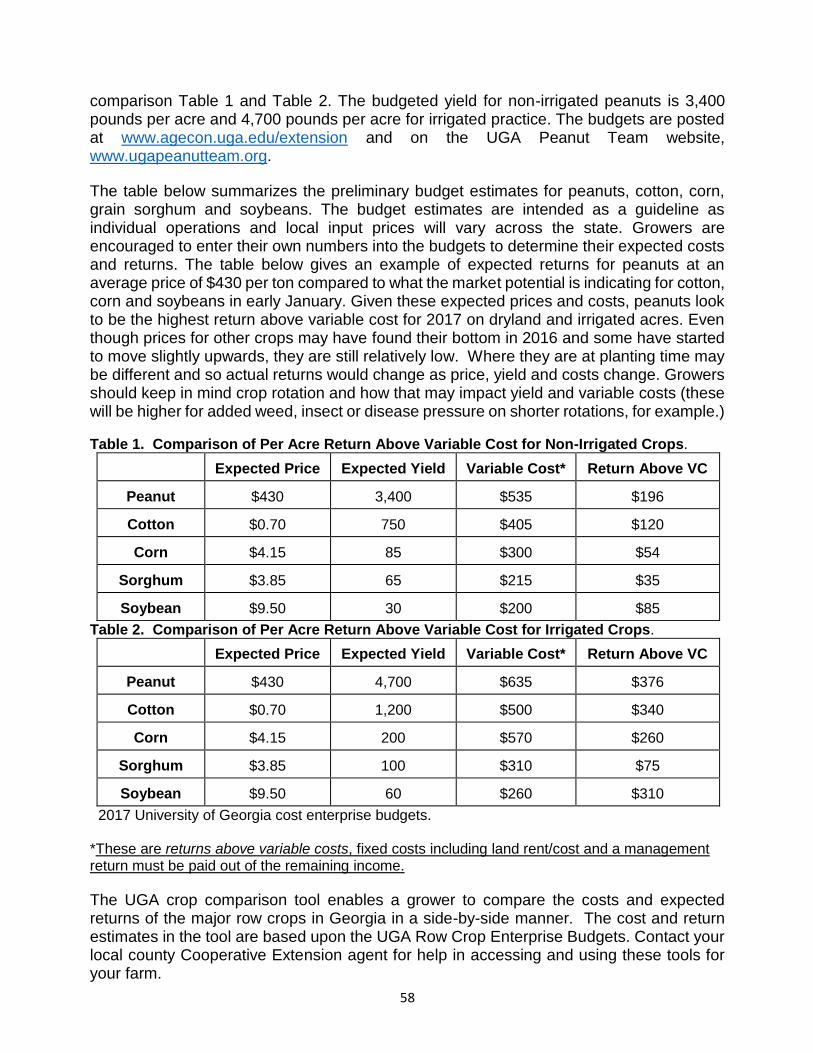
58
comparison Table 1 and Table 2. The budgeted yield for non-irrigated peanuts is 3,400 pounds per acre and 4,700 pounds per acre for irrigated practice. The budgets are posted at www.agecon.uga.edu/extension and on the UGA Peanut Team website, www.ugapeanutteam.org.
The table below summarizes the preliminary budget estimates for peanuts, cotton, corn, grain sorghum and soybeans. The budget estimates are intended as a guideline as individual operations and local input prices will vary across the state. Growers are encouraged to enter their own numbers into the budgets to determine their expected costs and returns. The table below gives an example of expected returns for peanuts at an average price of $430 per ton compared to what the market potential is indicating for cotton, corn and soybeans in early January. Given these expected prices and costs, peanuts look to be the highest return above variable cost for 2017 on dryland and irrigated acres. Even though prices for other crops may have found their bottom in 2016 and some have started to move slightly upwards, they are still relatively low. Where they are at planting time may be different and so actual returns would change as price, yield and costs change. Growers should keep in mind crop rotation and how that may impact yield and variable costs (these will be higher for added weed, insect or disease pressure on shorter rotations, for example.)
Table 1. Comparison of Per Acre Return Above Variable Cost for Non-Irrigated Crops.
Expected Price Expected Yield Variable Cost* Return Above VC
Peanut $430 3,400 $535 $196
Cotton $0.70 750 $405 $120
Corn $4.15 85 $300 $54
Sorghum $3.85 65 $215 $35
Soybean $9.50 30 $200 $85
Table 2. Comparison of Per Acre Return Above Variable Cost for Irrigated Crops.
Expected Price Expected Yield Variable Cost* Return Above VC
Peanut $430 4,700 $635 $376
Cotton $0.70 1,200 $500 $340
Corn $4.15 200 $570 $260
Sorghum $3.85 100 $310 $75
Soybean $9.50 60 $260 $310
2017 University of Georgia cost enterprise budgets. *These are returns above variable costs, fixed costs including land rent/cost and a management return must be paid out of the remaining income.
The UGA crop comparison tool enables a grower to compare the costs and expected returns of the major row crops in Georgia in a side-by-side manner. The cost and return estimates in the tool are based upon the UGA Row Crop Enterprise Budgets. Contact your local county Cooperative Extension agent for help in accessing and using these tools for your farm.
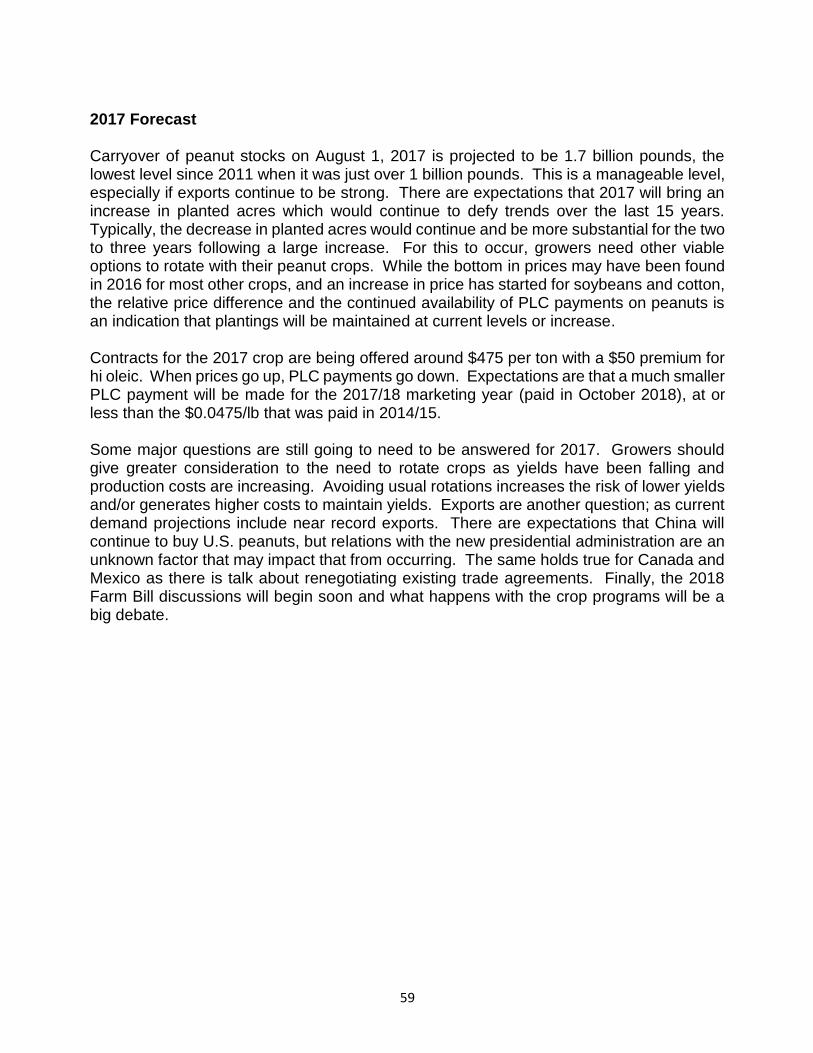
59
2017 Forecast Carryover of peanut stocks on August 1, 2017 is projected to be 1.7 billion pounds, the lowest level since 2011 when it was just over 1 billion pounds. This is a manageable level, especially if exports continue to be strong. There are expectations that 2017 will bring an increase in planted acres which would continue to defy trends over the last 15 years. Typically, the decrease in planted acres would continue and be more substantial for the two to three years following a large increase. For this to occur, growers need other viable options to rotate with their peanut crops. While the bottom in prices may have been found in 2016 for most other crops, and an increase in price has started for soybeans and cotton, the relative price difference and the continued availability of PLC payments on peanuts is an indication that plantings will be maintained at current levels or increase. Contracts for the 2017 crop are being offered around $475 per ton with a $50 premium for hi oleic. When prices go up, PLC payments go down. Expectations are that a much smaller PLC payment will be made for the 2017/18 marketing year (paid in October 2018), at or less than the $0.0475/lb that was paid in 2014/15. Some major questions are still going to need to be answered for 2017. Growers should give greater consideration to the need to rotate crops as yields have been falling and production costs are increasing. Avoiding usual rotations increases the risk of lower yields and/or generates higher costs to maintain yields. Exports are another question; as current demand projections include near record exports. There are expectations that China will continue to buy U.S. peanuts, but relations with the new presidential administration are an unknown factor that may impact that from occurring. The same holds true for Canada and Mexico as there is talk about renegotiating existing trade agreements. Finally, the 2018 Farm Bill discussions will begin soon and what happens with the crop programs will be a big debate.
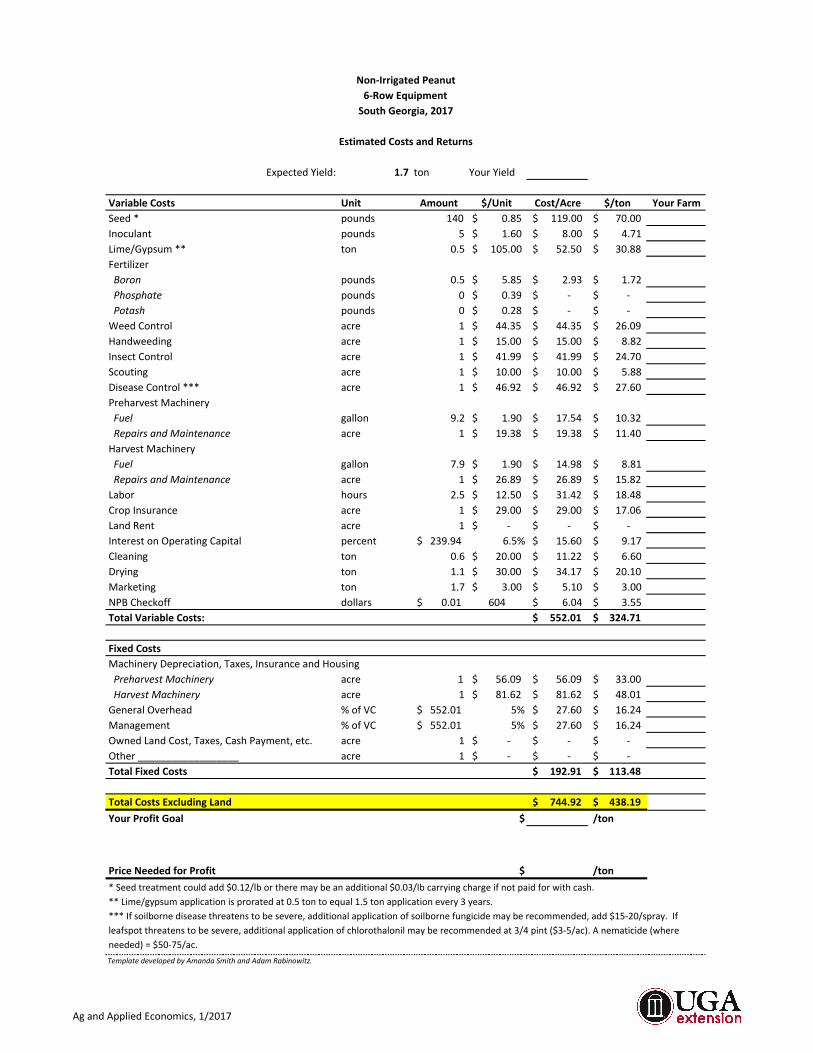
AgandAppliedEconomics,1/2017
ExpectedYield: 1.7 ton YourYield
VariableCosts Unit Amount $/Unit Cost/Acre $/ton YourFarmSeed* pounds 140 0.85$ 119.00$ 70.00$Inoculant pounds 5 1.60$ 8.00$ 4.71$Lime/Gypsum** ton 0.5 105.00$ 52.50$ 30.88$FertilizerBoron pounds 0.5 5.85$ 2.93$ 1.72$Phosphate pounds 0 0.39$ -$ -$Potash pounds 0 0.28$ -$ -$WeedControl acre 1 44.35$ 44.35$ 26.09$Handweeding acre 1 15.00$ 15.00$ 8.82$InsectControl acre 1 41.99$ 41.99$ 24.70$Scouting acre 1 10.00$ 10.00$ 5.88$DiseaseControl*** acre 1 46.92$ 46.92$ 27.60$PreharvestMachineryFuel gallon 9.2 1.90$ 17.54$ 10.32$RepairsandMaintenance acre 1 19.38$ 19.38$ 11.40$HarvestMachineryFuel gallon 7.9 1.90$ 14.98$ 8.81$RepairsandMaintenance acre 1 26.89$ 26.89$ 15.82$Labor hours 2.5 12.50$ 31.42$ 18.48$CropInsurance acre 1 29.00$ 29.00$ 17.06$LandRent acre 1 -$ -$ -$InterestonOperatingCapital percent 239.94$ 6.5% 15.60$ 9.17$Cleaning ton 0.6 20.00$ 11.22$ 6.60$Drying ton 1.1 30.00$ 34.17$ 20.10$Marketing ton 1.7 3.00$ 5.10$ 3.00$NPBCheckoff dollars 0.01$ 604 6.04$ 3.55$
552.01$ 324.71$
FixedCosts
PreharvestMachinery acre 1 56.09$ 56.09$ 33.00$HarvestMachinery acre 1 81.62$ 81.62$ 48.01$GeneralOverhead %ofVC 552.01$ 5% 27.60$ 16.24$Management %ofVC 552.01$ 5% 27.60$ 16.24$OwnedLandCost,Taxes,CashPayment,etc. acre 1 -$ -$ -$Other__________________ acre 1 -$ -$ -$
192.91$ 113.48$
TotalCostsExcludingLand 744.92$ 438.19$YourProfitGoal $ /ton
PriceNeededforProfit $ /ton
Non-IrrigatedPeanut
**Lime/gypsumapplicationisproratedat0.5tontoequal1.5tonapplicationevery3years.
6-RowEquipment
EstimatedCostsandReturns
TotalVariableCosts:
SouthGeorgia,2017
*Seedtreatmentcouldadd$0.12/lbortheremaybeanadditional$0.03/lbcarryingchargeifnotpaidforwithcash.
MachineryDepreciation,Taxes,InsuranceandHousing
TotalFixedCosts
TemplatedevelopedbyAmandaSmithandAdamRabinowitz.
***Ifsoilbornediseasethreatenstobesevere,additionalapplicationofsoilbornefungicidemayberecommended,add$15-20/spray.Ifleafspotthreatenstobesevere,additionalapplicationofchlorothalonilmayberecommendedat3/4pint($3-5/ac).Anematicide(whereneeded)=$50-75/ac.

AgandAppliedEconomics,1/2017
-25% -10% Expected +10% +25%1.28 1.53 1.70 1.87 2.13
$350 -$105.76 -$16.51 $42.99 $102.49 $191.74$375 -$73.88 $21.74 $85.49 $149.24 $244.87$400 -$42.01 $59.99 $127.99 $195.99 $297.99$425 -$10.13 $98.24 $170.49 $242.74 $351.12$450 $21.74 $136.49 $212.99 $289.49 $404.24
Operation Acres/Hour
NumberofTimesOver
LaborUse***(hrs/ac)
FuelUse(gal/ac)
Repairs($/ac)
FixedCosts($/ac)
HeavyDisk27'withTractor(180-199hp)MFWD190
13.2 2 0.19 1.48 3.75$ 10.88$
Plow4BottomSwitchwithTractor(180-199hp)MFWD190
2.3 1 0.54 4.20 7.43$ 22.40$
Disk&Incorporate32'withTractor(180-199hp)MFWD190
15.3 1 0.08 0.64 1.96$ 5.14$
FieldCultivateFld32'withTractor(180-199hp)MFWD190
21.4 1 0.06 0.46 1.03$ 4.28$
Plant&Pre-Rigid6R-36withTractor(120-139hp)2WD130
8.9 1 0.14 0.75 2.18$ 6.06$
Spray(Broadcast)60'withTractor(120-139hp)2WD130
35.5 9 0.32 1.70 3.04$ 7.33$
TotalPreharvestValues 1.32 9.23 19.38$ 56.09$
HarvestOperations
Operation Acres/Hour
NumberofTimesOver
LaborUse***(hrs/ac)
FuelUse(gal/ac)
Repairs($/ac)
FixedCosts($/ac)
PeanutDig/Inverter6R-36withTractor(180-199hp)MFWD190
5.3 1 0.23 1.83 $7.20 $16.47
Pull-typePeanutCombine6R-36withTractor 3.3 1 0.38 2.99 $14.99 $52.68PeanutWagon21'withTractor(120-139hp)2WD130
2.2 1 0.57 3.07 $4.70 $12.47
TotalHarvestValues 1.19 7.88 26.89$ 81.62$
EstimatedLaborandMachineryCostsperAcrePreharvestOperations
TemplatedevelopedbyAmandaSmithandAdamRabinowitz.
SensitivityAnalysisofNon-IrrigatedPeanutNetReturnsAboveVariableCostsPerAcre
VaryingPricesandYields(ton)
TemplatedevelopedbyAmandaSmithandAdamRabinowitz.
***Includesunallocatedlaborfactorof0.25.Unallocatedlaborfactorispercentageallowanceforadditionallaborrequiredtomove
Price\ton/Acre
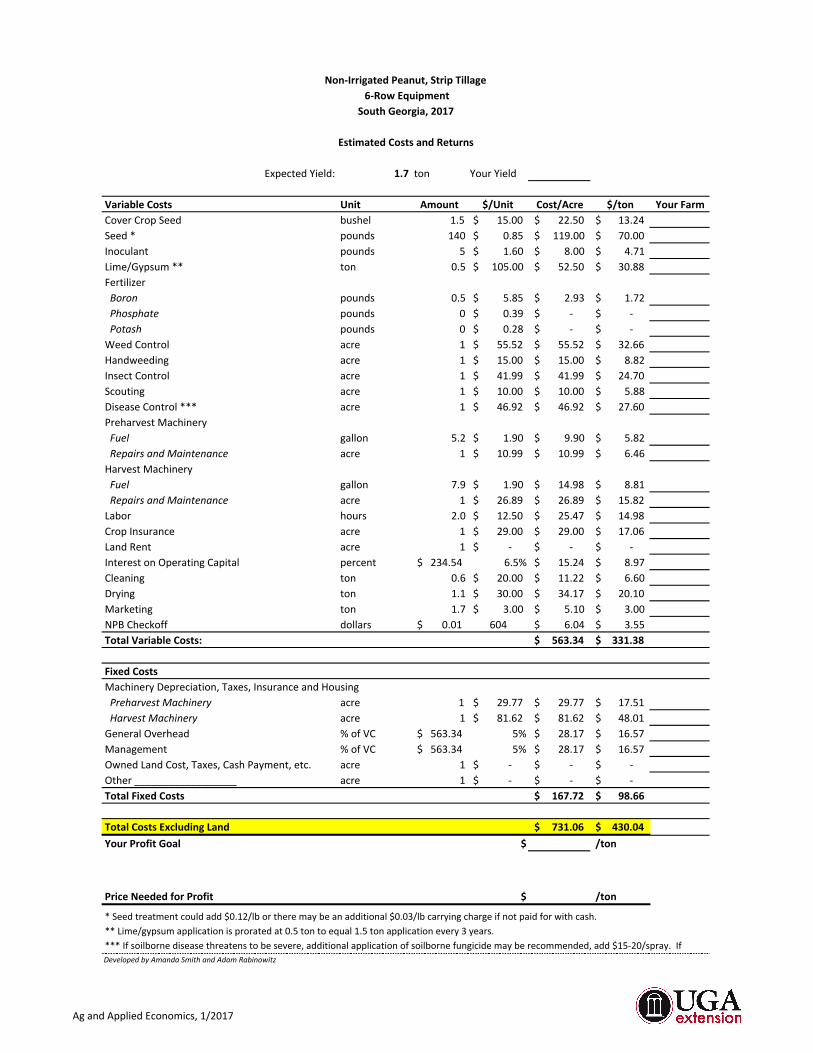
AgandAppliedEconomics,1/2017
ExpectedYield: 1.7 ton YourYield
VariableCosts Unit Amount $/Unit Cost/Acre $/ton YourFarmCoverCropSeed bushel 1.5 15.00$ 22.50$ 13.24$Seed* pounds 140 0.85$ 119.00$ 70.00$Inoculant pounds 5 1.60$ 8.00$ 4.71$Lime/Gypsum** ton 0.5 105.00$ 52.50$ 30.88$FertilizerBoron pounds 0.5 5.85$ 2.93$ 1.72$Phosphate pounds 0 0.39$ -$ -$Potash pounds 0 0.28$ -$ -$WeedControl acre 1 55.52$ 55.52$ 32.66$Handweeding acre 1 15.00$ 15.00$ 8.82$InsectControl acre 1 41.99$ 41.99$ 24.70$Scouting acre 1 10.00$ 10.00$ 5.88$DiseaseControl*** acre 1 46.92$ 46.92$ 27.60$PreharvestMachineryFuel gallon 5.2 1.90$ 9.90$ 5.82$RepairsandMaintenance acre 1 10.99$ 10.99$ 6.46$HarvestMachineryFuel gallon 7.9 1.90$ 14.98$ 8.81$RepairsandMaintenance acre 1 26.89$ 26.89$ 15.82$Labor hours 2.0 12.50$ 25.47$ 14.98$CropInsurance acre 1 29.00$ 29.00$ 17.06$LandRent acre 1 -$ -$ -$InterestonOperatingCapital percent 234.54$ 6.5% 15.24$ 8.97$Cleaning ton 0.6 20.00$ 11.22$ 6.60$Drying ton 1.1 30.00$ 34.17$ 20.10$Marketing ton 1.7 3.00$ 5.10$ 3.00$NPBCheckoff dollars 0.01$ 604 6.04$ 3.55$
563.34$ 331.38$
FixedCosts
PreharvestMachinery acre 1 29.77$ 29.77$ 17.51$HarvestMachinery acre 1 81.62$ 81.62$ 48.01$GeneralOverhead %ofVC 563.34$ 5% 28.17$ 16.57$Management %ofVC 563.34$ 5% 28.17$ 16.57$OwnedLandCost,Taxes,CashPayment,etc. acre 1 -$ -$ -$Other__________________ acre 1 -$ -$ -$
167.72$ 98.66$
TotalCostsExcludingLand 731.06$ 430.04$YourProfitGoal $ /ton
PriceNeededforProfit $ /ton
Non-IrrigatedPeanut,StripTillage
**Lime/gypsumapplicationisproratedat0.5tontoequal1.5tonapplicationevery3years.
6-RowEquipment
EstimatedCostsandReturns
TotalVariableCosts:
SouthGeorgia,2017
*Seedtreatmentcouldadd$0.12/lbortheremaybeanadditional$0.03/lbcarryingchargeifnotpaidforwithcash.
MachineryDepreciation,Taxes,InsuranceandHousing
TotalFixedCosts
DevelopedbyAmandaSmithandAdamRabinowitz
***Ifsoilbornediseasethreatenstobesevere,additionalapplicationofsoilbornefungicidemayberecommended,add$15-20/spray.If
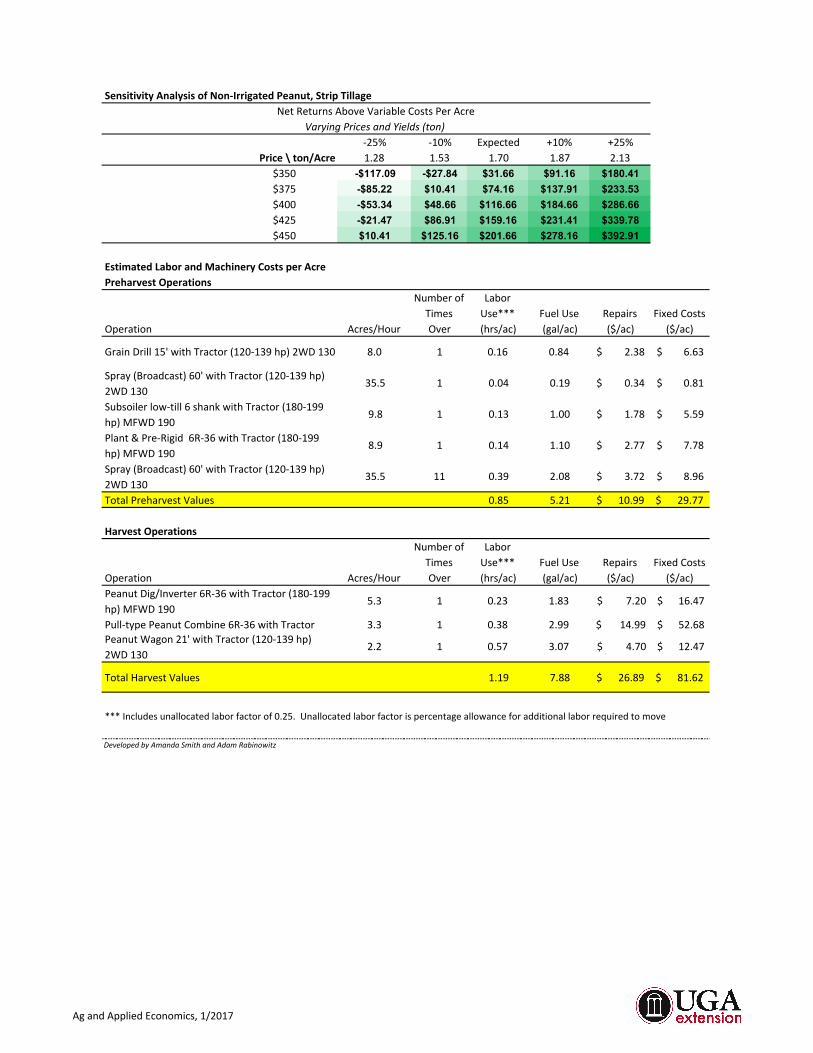
AgandAppliedEconomics,1/2017
-25% -10% Expected +10% +25%1.28 1.53 1.70 1.87 2.13
$350 -$117.09 -$27.84 $31.66 $91.16 $180.41$375 -$85.22 $10.41 $74.16 $137.91 $233.53$400 -$53.34 $48.66 $116.66 $184.66 $286.66$425 -$21.47 $86.91 $159.16 $231.41 $339.78$450 $10.41 $125.16 $201.66 $278.16 $392.91
Operation Acres/Hour
NumberofTimesOver
LaborUse***(hrs/ac)
FuelUse(gal/ac)
Repairs($/ac)
FixedCosts($/ac)
GrainDrill15'withTractor(120-139hp)2WD130 8.0 1 0.16 0.84 2.38$ 6.63$
Spray(Broadcast)60'withTractor(120-139hp)2WD130
35.5 1 0.04 0.19 0.34$ 0.81$
Subsoilerlow-till6shankwithTractor(180-199hp)MFWD190
9.8 1 0.13 1.00 1.78$ 5.59$
Plant&Pre-Rigid6R-36withTractor(180-199hp)MFWD190
8.9 1 0.14 1.10 2.77$ 7.78$
Spray(Broadcast)60'withTractor(120-139hp)2WD130
35.5 11 0.39 2.08 3.72$ 8.96$
TotalPreharvestValues 0.85 5.21 10.99$ 29.77$
HarvestOperations
Operation Acres/Hour
NumberofTimesOver
LaborUse***(hrs/ac)
FuelUse(gal/ac)
Repairs($/ac)
FixedCosts($/ac)
PeanutDig/Inverter6R-36withTractor(180-199hp)MFWD190
5.3 1 0.23 1.83 $7.20 $16.47
Pull-typePeanutCombine6R-36withTractor 3.3 1 0.38 2.99 $14.99 $52.68PeanutWagon21'withTractor(120-139hp)2WD130
2.2 1 0.57 3.07 $4.70 $12.47
TotalHarvestValues 1.19 7.88 26.89$ 81.62$
EstimatedLaborandMachineryCostsperAcrePreharvestOperations
DevelopedbyAmandaSmithandAdamRabinowitz
SensitivityAnalysisofNon-IrrigatedPeanut,StripTillageNetReturnsAboveVariableCostsPerAcre
VaryingPricesandYields(ton)
DevelopedbyAmandaSmithandAdamRabinowitz
***Includesunallocatedlaborfactorof0.25.Unallocatedlaborfactorispercentageallowanceforadditionallaborrequiredtomove
Price\ton/Acre
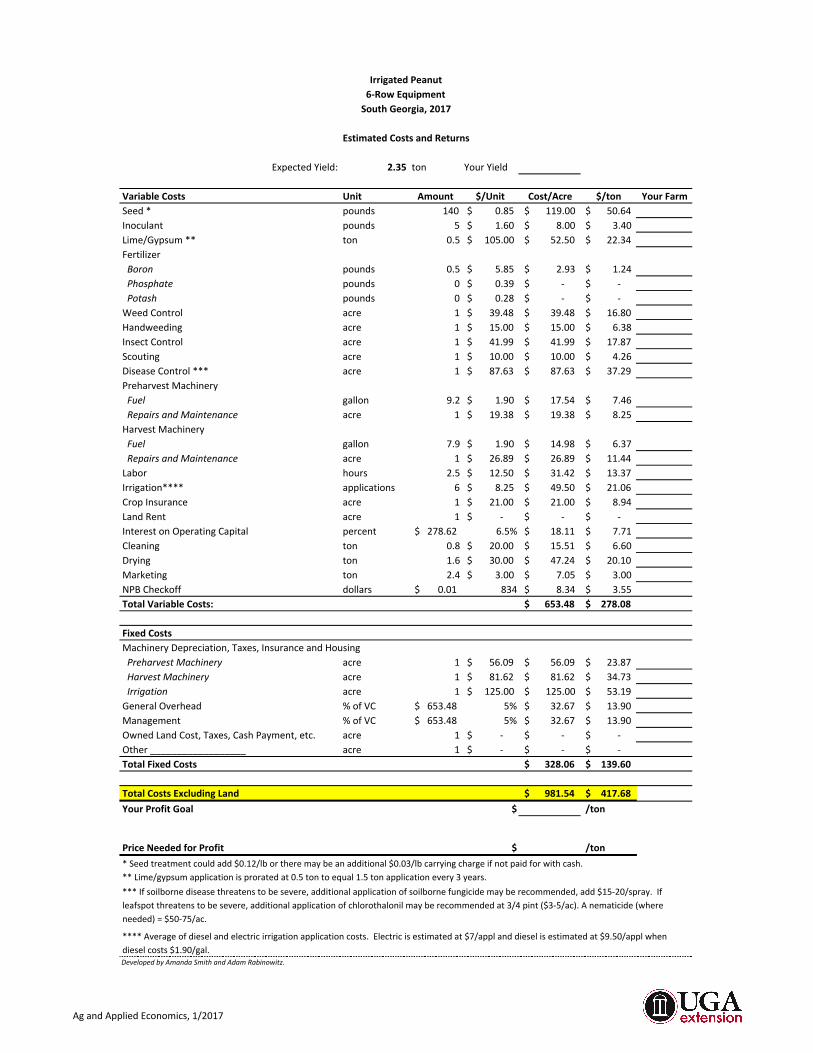
AgandAppliedEconomics,1/2017
ExpectedYield: 2.35 ton YourYield
VariableCosts Unit Amount $/Unit Cost/Acre $/ton YourFarmSeed* pounds 140 0.85$ 119.00$ 50.64$Inoculant pounds 5 1.60$ 8.00$ 3.40$Lime/Gypsum** ton 0.5 105.00$ 52.50$ 22.34$FertilizerBoron pounds 0.5 5.85$ 2.93$ 1.24$Phosphate pounds 0 0.39$ -$ -$Potash pounds 0 0.28$ -$ -$WeedControl acre 1 39.48$ 39.48$ 16.80$Handweeding acre 1 15.00$ 15.00$ 6.38$InsectControl acre 1 41.99$ 41.99$ 17.87$Scouting acre 1 10.00$ 10.00$ 4.26$DiseaseControl*** acre 1 87.63$ 87.63$ 37.29$PreharvestMachineryFuel gallon 9.2 1.90$ 17.54$ 7.46$RepairsandMaintenance acre 1 19.38$ 19.38$ 8.25$HarvestMachineryFuel gallon 7.9 1.90$ 14.98$ 6.37$RepairsandMaintenance acre 1 26.89$ 26.89$ 11.44$Labor hours 2.5 12.50$ 31.42$ 13.37$Irrigation**** applications 6 8.25$ 49.50$ 21.06$CropInsurance acre 1 21.00$ 21.00$ 8.94$LandRent acre 1 -$ -$ -$InterestonOperatingCapital percent 278.62$ 6.5% 18.11$ 7.71$Cleaning ton 0.8 20.00$ 15.51$ 6.60$Drying ton 1.6 30.00$ 47.24$ 20.10$Marketing ton 2.4 3.00$ 7.05$ 3.00$NPBCheckoff dollars 0.01$ 834 8.34$ 3.55$
653.48$ 278.08$
FixedCosts
PreharvestMachinery acre 1 56.09$ 56.09$ 23.87$HarvestMachinery acre 1 81.62$ 81.62$ 34.73$Irrigation acre 1 125.00$ 125.00$ 53.19$GeneralOverhead %ofVC 653.48$ 5% 32.67$ 13.90$Management %ofVC 653.48$ 5% 32.67$ 13.90$OwnedLandCost,Taxes,CashPayment,etc. acre 1 -$ -$ -$Other__________________ acre 1 -$ -$ -$
328.06$ 139.60$
TotalCostsExcludingLand 981.54$ 417.68$YourProfitGoal $ /ton
PriceNeededforProfit $ /ton
IrrigatedPeanut
**Lime/gypsumapplicationisproratedat0.5tontoequal1.5tonapplicationevery3years.
****Averageofdieselandelectricirrigationapplicationcosts.Electricisestimatedat$7/applanddieselisestimatedat$9.50/applwhendieselcosts$1.90/gal.
6-RowEquipment
EstimatedCostsandReturns
TotalVariableCosts:
SouthGeorgia,2017
MachineryDepreciation,Taxes,InsuranceandHousing
TotalFixedCosts
DevelopedbyAmandaSmithandAdamRabinowitz.
***Ifsoilbornediseasethreatenstobesevere,additionalapplicationofsoilbornefungicidemayberecommended,add$15-20/spray.Ifleafspotthreatenstobesevere,additionalapplicationofchlorothalonilmayberecommendedat3/4pint($3-5/ac).Anematicide(whereneeded)=$50-75/ac.
*Seedtreatmentcouldadd$0.12/lbortheremaybeanadditional$0.03/lbcarryingchargeifnotpaidforwithcash.
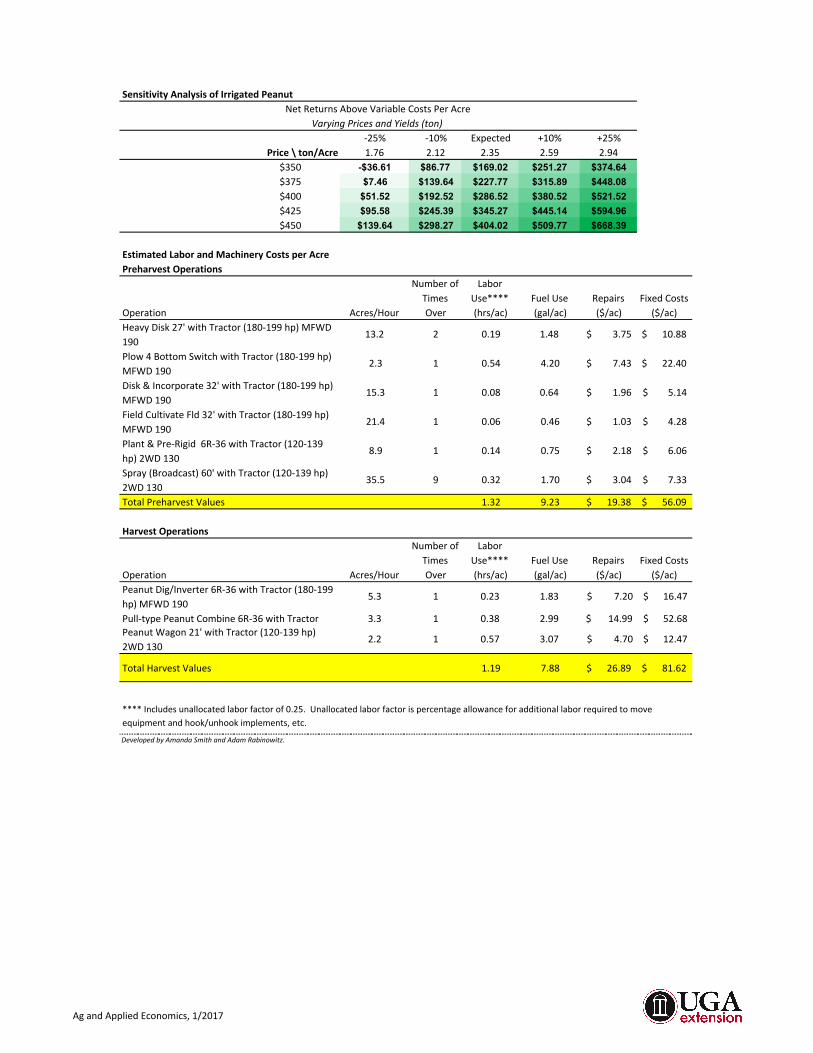
AgandAppliedEconomics,1/2017
-25% -10% Expected +10% +25%1.76 2.12 2.35 2.59 2.94
$350 -$36.61 $86.77 $169.02 $251.27 $374.64$375 $7.46 $139.64 $227.77 $315.89 $448.08$400 $51.52 $192.52 $286.52 $380.52 $521.52$425 $95.58 $245.39 $345.27 $445.14 $594.96$450 $139.64 $298.27 $404.02 $509.77 $668.39
Operation Acres/Hour
NumberofTimesOver
LaborUse****(hrs/ac)
FuelUse(gal/ac)
Repairs($/ac)
FixedCosts($/ac)
HeavyDisk27'withTractor(180-199hp)MFWD190
13.2 2 0.19 1.48 3.75$ 10.88$
Plow4BottomSwitchwithTractor(180-199hp)MFWD190
2.3 1 0.54 4.20 7.43$ 22.40$
Disk&Incorporate32'withTractor(180-199hp)MFWD190
15.3 1 0.08 0.64 1.96$ 5.14$
FieldCultivateFld32'withTractor(180-199hp)MFWD190
21.4 1 0.06 0.46 1.03$ 4.28$
Plant&Pre-Rigid6R-36withTractor(120-139hp)2WD130
8.9 1 0.14 0.75 2.18$ 6.06$
Spray(Broadcast)60'withTractor(120-139hp)2WD130
35.5 9 0.32 1.70 3.04$ 7.33$
TotalPreharvestValues 1.32 9.23 19.38$ 56.09$
HarvestOperations
Operation Acres/Hour
NumberofTimesOver
LaborUse****(hrs/ac)
FuelUse(gal/ac)
Repairs($/ac)
FixedCosts($/ac)
PeanutDig/Inverter6R-36withTractor(180-199hp)MFWD190
5.3 1 0.23 1.83 $7.20 $16.47
Pull-typePeanutCombine6R-36withTractor 3.3 1 0.38 2.99 $14.99 $52.68PeanutWagon21'withTractor(120-139hp)2WD130
2.2 1 0.57 3.07 $4.70 $12.47
TotalHarvestValues 1.19 7.88 26.89$ 81.62$
EstimatedLaborandMachineryCostsperAcrePreharvestOperations
DevelopedbyAmandaSmithandAdamRabinowitz.
SensitivityAnalysisofIrrigatedPeanutNetReturnsAboveVariableCostsPerAcre
VaryingPricesandYields(ton)
DevelopedbyAmandaSmithandAdamRabinowitz.
****Includesunallocatedlaborfactorof0.25.Unallocatedlaborfactorispercentageallowanceforadditionallaborrequiredtomoveequipmentandhook/unhookimplements,etc.
Price\ton/Acre
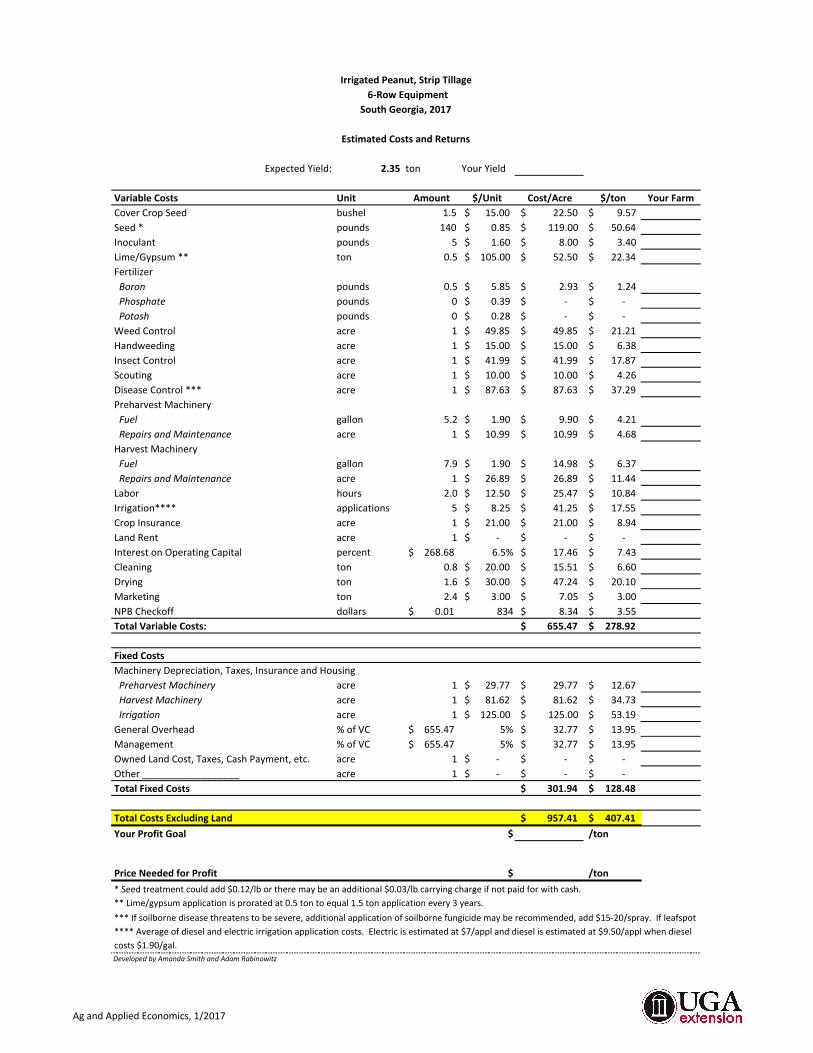
AgandAppliedEconomics,1/2017
ExpectedYield: 2.35 ton YourYield
VariableCosts Unit Amount $/Unit Cost/Acre $/ton YourFarmCoverCropSeed bushel 1.5 15.00$ 22.50$ 9.57$Seed* pounds 140 0.85$ 119.00$ 50.64$Inoculant pounds 5 1.60$ 8.00$ 3.40$Lime/Gypsum** ton 0.5 105.00$ 52.50$ 22.34$FertilizerBoron pounds 0.5 5.85$ 2.93$ 1.24$Phosphate pounds 0 0.39$ -$ -$Potash pounds 0 0.28$ -$ -$WeedControl acre 1 49.85$ 49.85$ 21.21$Handweeding acre 1 15.00$ 15.00$ 6.38$InsectControl acre 1 41.99$ 41.99$ 17.87$Scouting acre 1 10.00$ 10.00$ 4.26$DiseaseControl*** acre 1 87.63$ 87.63$ 37.29$PreharvestMachineryFuel gallon 5.2 1.90$ 9.90$ 4.21$RepairsandMaintenance acre 1 10.99$ 10.99$ 4.68$HarvestMachineryFuel gallon 7.9 1.90$ 14.98$ 6.37$RepairsandMaintenance acre 1 26.89$ 26.89$ 11.44$Labor hours 2.0 12.50$ 25.47$ 10.84$Irrigation**** applications 5 8.25$ 41.25$ 17.55$CropInsurance acre 1 21.00$ 21.00$ 8.94$LandRent acre 1 -$ -$ -$InterestonOperatingCapital percent 268.68$ 6.5% 17.46$ 7.43$Cleaning ton 0.8 20.00$ 15.51$ 6.60$Drying ton 1.6 30.00$ 47.24$ 20.10$Marketing ton 2.4 3.00$ 7.05$ 3.00$NPBCheckoff dollars 0.01$ 834 8.34$ 3.55$
655.47$ 278.92$
FixedCosts
PreharvestMachinery acre 1 29.77$ 29.77$ 12.67$HarvestMachinery acre 1 81.62$ 81.62$ 34.73$Irrigation acre 1 125.00$ 125.00$ 53.19$GeneralOverhead %ofVC 655.47$ 5% 32.77$ 13.95$Management %ofVC 655.47$ 5% 32.77$ 13.95$OwnedLandCost,Taxes,CashPayment,etc. acre 1 -$ -$ -$Other__________________ acre 1 -$ -$ -$
301.94$ 128.48$
TotalCostsExcludingLand 957.41$ 407.41$YourProfitGoal $ /ton
PriceNeededforProfit $ /ton
MachineryDepreciation,Taxes,InsuranceandHousing
TotalFixedCosts
DevelopedbyAmandaSmithandAdamRabinowitz
***Ifsoilbornediseasethreatenstobesevere,additionalapplicationofsoilbornefungicidemayberecommended,add$15-20/spray.Ifleafspot
IrrigatedPeanut,StripTillage
**Lime/gypsumapplicationisproratedat0.5tontoequal1.5tonapplicationevery3years.
****Averageofdieselandelectricirrigationapplicationcosts.Electricisestimatedat$7/applanddieselisestimatedat$9.50/applwhendieselcosts$1.90/gal.
6-RowEquipment
EstimatedCostsandReturns
TotalVariableCosts:
SouthGeorgia,2017
*Seedtreatmentcouldadd$0.12/lbortheremaybeanadditional$0.03/lbcarryingchargeifnotpaidforwithcash.

AgandAppliedEconomics,1/2017
-25% -10% Expected +10% +25%1.76 2.12 2.35 2.59 2.94
$350 -$38.59 $84.78 $167.03 $249.28 $372.66$375 $5.47 $137.66 $225.78 $313.91 $446.09$400 $49.53 $190.53 $284.53 $378.53 $519.53$425 $93.59 $243.41 $343.28 $443.16 $592.97$450 $137.66 $296.28 $402.03 $507.78 $666.41
Operation Acres/HourNumberofTimesOver
LaborUse****(hrs/ac)
FuelUse(gal/ac)
Repairs($/ac)
FixedCosts($/ac)
GrainDrill15'withTractor(120-139hp)2WD130
8.0 1 0.16 0.84 2.38$ 6.63$
Spray(Broadcast)60'withTractor(120-139hp)2WD130
35.5 1 0.04 0.19 0.34$ 0.81$
Subsoilerlow-till6shankwithTractor(180-199hp)MFWD190
9.8 1 0.13 1.00 1.78$ 5.59$
Plant&Pre-Rigid6R-36withTractor(180-199hp)MFWD190
8.9 1 0.14 1.10 2.77$ 7.78$
Spray(Broadcast)60'withTractor(120-139hp)2WD130
35.5 11 0.39 2.08 3.72$ 8.96$
TotalPreharvestValues 0.85 5.21 10.99$ 29.77$
HarvestOperations
Operation Acres/HourNumberofTimesOver
LaborUse****(hrs/ac)
FuelUse(gal/ac)
Repairs($/ac)
FixedCosts($/ac)
PeanutDig/Inverter6R-36withTractor(180-199hp)MFWD190
5.3 1 0.23 1.83 $7.20 $16.47
Pull-typePeanutCombine6R-36withTractor 3.3 1 0.38 2.99 $14.99 $52.68PeanutWagon21'withTractor(120-139hp)2WD130
2.2 1 0.57 3.07 $4.70 $12.47
TotalHarvestValues 1.19 7.88 26.89$ 81.62$
DevelopedbyAmandaSmithandAdamRabinowitz
SensitivityAnalysisofIrrigatedPeanut,StripTillageNetReturnsAboveVariableCostsPerAcre
VaryingPricesandYields(ton)
DevelopedbyAmandaSmithandAdamRabinowitz
****Includesunallocatedlaborfactorof0.25.Unallocatedlaborfactorispercentageallowanceforadditionallaborrequiredtomoveequipmentandhook/unhookimplements,etc.
Price\ton/Acre
EstimatedLaborandMachineryCostsperAcrePreharvestOperations