2017 Ontario Budget - Ministry of Finance / Ministère des ... or general inquiries regarding 2017...
330
The Honourable CHARLES SOUSA Minister of Finance Budget Papers A Stronger, Healthier Ontario 2017 Ontario Budget
-
Upload
duongxuyen -
Category
Documents
-
view
221 -
download
5
Transcript of 2017 Ontario Budget - Ministry of Finance / Ministère des ... or general inquiries regarding 2017...
The Honourable
CHARLES SOUSAMinister of Finance
Budget Papers
A Stronger, Healthier Ontario
2017 Ontario Budget

For general inquiries regarding 2017 Ontario Budget: Budget Papers, please call:
Toll-free English and French inquiries: 1-800-337-7222 Teletypewriter (TTY): 1-800-263-7776
For electronic copies of this document, visit our website at www.ontario.ca/budget
A printed copy of this publication can be ordered:
Online: www.serviceontario.ca/publications
By phone: ServiceOntario Contact Centre (Monday to Friday, 8:30 AM to 5:00 PM) Telephone: 416-326-5300 TTY: 416-325-3408 Toll-free across Canada: 1-800-668-9938 TTY Toll-free across Ontario: 1-800-268-7095
© Queen’s Printer for Ontario, 2017 ISBN 978-1-4868-0080-3 (Print) ISBN 978-1-4868-0081-0 (HTML) ISBN 978-1-4868-0082-7 (PDF)
Ce document est disponible en français sous le titre : Budget de l’Ontario 2017 – Documents budgétaires

Foreword

Foreword v
Foreword
A Balanced Approach The 2017 Budget is a balanced budget, the first one since the 2008–09 global recession. This was
achieved through the hard work and determination of the people of Ontario.
The recession had negative effects across the world, and Ontario was not immune. Many people
lost their jobs and the economy weakened, resulting in a substantial drop in the Province’s
revenues. Faced with this new reality, the Ontario government embarked upon a plan to invest in
our people and return to a balanced budget. Rather than slash the programs and services upon
which Ontario families rely to eliminate the deficit, our government chose to build Ontario up.
We chose to implement a plan that reflected the values and aspirations of Ontarians. We focused
on growing the economy and creating jobs. We listened to people in communities across the
province and we continued to invest in the things that matter most to them, particularly health
care and education.
We chose to build for the future, instead of trying to hold on to the past. We expanded and
renewed our infrastructure to make sure the needs of our growing population are met through
investments in hospitals, schools, public transit and roads. We built a clean, sustainable electricity
system and put ourselves at the forefront of fighting climate change, leading in green and
clean technologies.
Our plan was realistic and responsible. We managed our expenses and began transforming how
we deliver public services, making them more efficient and effective. We took aim at the
underground economy to ensure everyone pays their fair share. We embraced new opportunities
arising from an economy increasingly based on information and knowledge.
Our plan is working. Over the past three years, our economy has grown faster than Canada’s and
that of all G7 countries. Today, more Ontarians are working and our unemployment rate is the
lowest it has been since 2007. We have added nearly 700,000 net new jobs since the recession.
The vast majority of these are full‐time jobs, in the private sector, and in industries paying
above‐average wages. Our household incomes have risen and business investment has increased.
Our exports are up, along with gains in manufacturing, financial services and retail sales.
Our plan to achieve a balanced budget has also been successful. Last year, our deficit was
$1.5 billion, the eighth year in a row that we beat our deficit reduction target. Not only are
we presenting a balanced budget this year; we are on track for balanced budgets in 2018–19
and 2019–20.
vi Foreword
With our economic growth projected to continue and balanced budgets planned for the
foreseeable future, Ontario is once again in a strong and healthy position. Across the province,
people are working hard and deserve to share in the prosperity we’re building. Too many still feel
uncertain about the future and the rising cost of living. We will continue to invest in priorities such
as health care, education and making life more affordable, because when government makes sure
people can get ahead, that helps our economy stay ahead too. In this Budget, I hope you will see
the many ways that we are working hard to make that happen.
The Health Care Ontarians Deserve Everyone deserves access to high‐quality, publicly funded health care. Our health care system has
provided critical support and care to families for generations. Ontarians are proud of our universal
health care, and we are leading the way to strengthen it. Beginning in January 2018, we will be the
first province to provide drug coverage for every Ontarian aged 24 and under. This universal
pharmacare will help keep our children and youth healthy and ensure that parents are never put
in the position of having to choose between paying for their children’s medication or
other essentials.
To meet the needs of patients today and in the future, we are improving access to care, reducing
wait times, and enhancing their experience and recovery. Our additional investment of $7 billion
over the next three years will ensure patients receive care closer to home, see specialists faster,
and have access to expanded mental health and addictions services. This includes an additional
investment of $1.3 billion to reduce wait times throughout the province. Targeted investments
will help more people receive high‐priority procedures more quickly, including MRIs, cataract
and cardiovascular surgeries, and hip or knee replacements. To provide patients expanded
access to care, we will invest an additional $518 million in 2017–18 in hospitals, representing
a three‐per‐cent increase to the sector.
To meet the needs of our growing and aging population, we must ensure our health care is being
provided in modern facilities. Across Ontario, 34 major hospital projects are now underway.
We’re adding to that, with $9 billion over 10 years in new capital grants to support the
construction of several new major hospital projects. We will also be improving community health
infrastructure across the province.
Many of us spend time each day caring for loved ones. We are creating better supports for families
caring for aging parents, so that the people who raised us and loved us receive proper care when
they need it most. Caregivers will be better supported through access to respite care, a new
organization focused on providing training and resources, and a simplified approach to caregiver
tax credits, recognizing their additional cost pressures. As part of a new, comprehensive dementia
strategy, more people will be able to access day programs and respite services, providing safe
environments for those with dementia and reducing stress for loved ones.

Foreword vii
More funding for home and community care also means more patients will be able to continue
to live at home. Expanded community and personal support services will help meet increased
demand and support faster and more equitable access to services across the province. To help
meet the need for long‐term care, we are encouraging operators to accelerate the redevelopment
of more than 30,000 beds. And for those living in long‐term care facilities there will be increased
comfort and privacy with the elimination of four‐bed wards and more nutritious and culturally
sensitive food options.
Helping You and Your Family With a growing economy and a balanced budget, we are investing in key services and programs,
while finding ways to reduce everyday costs for families.
We all want our kids to get a great start. By helping 100,000 more children access affordable,
quality licensed child care, we are supporting families across Ontario, providing more parents with
choice when it comes to returning to work and assistance with their child care costs. This year,
our investments will support access to licensed child care for 24,000 more children through new
fee subsidies and spaces.
People from across the province shared their concerns about rising electricity bills. We listened
and we are responding. Recognizing that there needed to be a fairer way to share the costs of
building a cleaner, more modern and reliable electricity generation system, we are taking action
to reduce electricity costs. Through Ontario’s Fair Hydro Plan, starting this summer, household
electricity costs would be lowered by an average of 25 per cent. We are also capping rate
increases to inflation for the next four years. Low‐income families, and those living in rural,
remote or on‐reserve First Nation communities, would receive additional relief as well.
Like electricity, housing is essential for families. With a strong economy and more jobs created,
the demand for housing in Ontario, particularly in the Greater Toronto and Hamilton Area (GTHA),
has increased rapidly. While a strong housing market is a sign of Ontario’s growing prosperity,
this growth also brings challenges. People are struggling to buy a home, and they’re finding it
difficult to afford increasing rents. To help make housing more affordable for buyers and renters,
the government has proposed a Fair Housing Plan. This plan would include measures such as
expanding rent control, a proposal for a new 15‐per‐cent Non‐Resident Speculation Tax (NRST) in
the Greater Golden Horseshoe, and encouraging additional supply by giving municipalities the
power to tax vacant lots. As well, the City of Toronto will now have the ability to implement a
Vacant Homes Property Tax at a higher rate to encourage owners to sell unoccupied units or make
them available to be rented.

viii Foreword
Providing Greater Opportunities and Security Ontarians believe every child should have the opportunity to reach their full potential. That is why
we will continue to invest in our world‐class public education system. Families will benefit from
new class size caps on full‐day kindergarten classes and enhanced support for students with
special needs.
We know our schools are much more than places to learn. They connect us to others in our
community and act as natural gathering places for after‐school activities and events. So, we are
investing almost $16 billion over 10 years to build new schools in high‐growth areas and to
renovate schools across the province to better meet local needs.
We are also focused on helping Ontarians become equipped with the skills and competencies they
need to find meaningful work, adapt to changing technologies, create new businesses and
contribute to their communities. This is what our Highly Skilled Workforce Strategy is all about.
It is designed to ensure everyone finds their place in an evolving economy that is becoming more
technology‐driven and knowledge‐based every day.
This coming fall, as a result of our OSAP transformation, more than 210,000 students will attend
postsecondary campuses across the province without worrying about tuition — it will be free.
And to help more young people land employment upon graduation, Ontario is working with a
range of partners to launch a new Career Kick‐Start Strategy. Forty thousand more students will
now benefit from work‐related learning experiences during their studies, better preparing them
to enter the labour market and build their careers.
For adults looking to find their next learning opportunity, land a better job or move into their next
career, Ontario’s Lifelong Learning and Skills Plan will help provide the literacy, numeracy and
digital skills essential to being able to adapt and thrive in a changing economy.
And we know the nature of work is changing and more can be done to provide workers with
greater security. A modern economy requires a modern set of labour laws and standards.
Through the Changing Workplaces Review, we are identifying how we balance fostering a
competitive business climate while ensuring workers are treated with decency and dignity
and have the protections they deserve.
We’re also moving forward with our Basic Income Pilot to explore how we can provide more
consistent and predictable support to those with low incomes, including those who may be
precariously employed. Testing how a Basic Income Pilot may improve health, employment
and housing outcomes are all a part of our efforts to promote a growing economy that benefits
all Ontarians.
Foreword ix
Helping Ontario Businesses Succeed An integral part of our plan has been helping Ontario businesses succeed and grow. Through their
hard work, our economy has expanded and they have created more jobs. Moving forward,
our focus will continue to be on giving businesses the tools they need to succeed by maintaining
our competitive corporate income tax rates, modernizing regulations and reducing business costs.
By staying at the forefront of both the global shift to a low‐carbon economy and transformative,
potentially disruptive, technologies, we are well positioned to benefit from new employment
opportunities and economic growth. Strategic investments in emerging fields, such as artificial
intelligence, autonomous vehicles, fifth‐generation (5G) telecommunications, advanced computing
and quantum science research are keeping Ontario at the leading edge of research and
development, creating high‐value jobs, with significant potential to enhance our quality of life.
Helping people and goods move faster supports a growing economy and keeps our businesses
competitive. Our plan to invest more than $190 billion in public infrastructure over 13 years,
starting in 2014–15, is the greatest infrastructure investment in our province’s history. Through
our ongoing investments, we are building world‐class public transit and transportation systems,
as well as more schools and new hospitals.
Conclusion A balanced budget is about more than just the bottom line number. It’s about finding new ways to
help you and your family. It’s about creating opportunities and providing the supports people need
to succeed. It’s a reflection of the priorities that Ontarians share with us every day, and what we
heard during this year’s pre‐budget consultations, which included more than 80,000 people —
a record number of participants.
Whether expanding universal health care; helping people, young or old, develop skills and
knowledge; or working with businesses to grow the economy and create jobs, we are carrying out
our commitment to ensure that all have equal opportunities for success.
This year marks our province’s 150th anniversary. As we look ahead, we are at the start of an
exciting new chapter for our province. With a balanced budget and continued economic growth,
we will build on what we have accomplished together — a stronger, healthier Ontario.
The Honourable Charles Sousa
Minister of Finance
considhi
Typewritten Text
Original signed by
considhi
Typewritten Text
considhi
Typewritten Text
considhi
Typewritten Text
considhi
Typewritten Text

x Foreword
Contents xi
Contents
Foreword ..................................................................................................................... v
Chapter I: Restoring Balance — Ontario’s Economic and Fiscal Strength
Introduction .................................................................................................................. 3
Ontario’s Return to Balance ............................................................................................. 4
Ontario’s Balanced Budget ........................................................................................... 5
Declining Net Debt-to-GDP ........................................................................................... 7
Ontario’s Economic Performance ...................................................................................... 9
Ontario: A Growth Leader ............................................................................................ 9
Ontario: Creating High-Quality Jobs .............................................................................. 10
Ontario’s Diverse Economy .......................................................................................... 11
Ontario’s Strong Trade Connections with the United States .............................................. 12
Maintaining Tax Competitiveness ................................................................................. 13
Healthy Outlook for Ontario’s Economy ......................................................................... 15
The Path Forward for All................................................................................................. 16
Chapter II: Helping You and Your Family
Introduction ................................................................................................................. 19
Helping with Everyday Costs ........................................................................................... 20
Delivering the Largest Single Reduction to Electricity Rates in Ontario’s History .................. 20
Reducing Electricity Costs for Businesses ....................................................................... 23
Modernizing the Province’s Electricity Markets ................................................................ 23
Expanding Access to Natural Gas ................................................................................. 24
Elimination of the Drive Clean Emission Test Fee ............................................................ 24
Helping Parents ............................................................................................................ 25
OHIP+: Children and Youth Pharmacare ........................................................................ 25
Helping Families Access and Afford Child Care ................................................................ 26
Supporting Community Hubs ....................................................................................... 28
Helping Students .......................................................................................................... 30
Making Postsecondary Education More Affordable ........................................................... 30
Helping Seniors ............................................................................................................ 33
Promoting Healthy and Active Aging ............................................................................. 33

xii Contents
Lowering Public Transit Costs for Seniors ....................................................................... 35
Ensuring Sprinklers Are Installed in Licensed Retirement Homes ....................................... 35
Supporting Seniors’ Health ............................................................................................ 36
Supporting Ontarians Affected by Dementia ................................................................... 36
Community Investments ............................................................................................. 37
Increasing Investments in Long-Term Care .................................................................... 37
Expanding Seniors’ Access to Affordable Drugs ............................................................... 39
Housing Affordability .................................................................................................... 40
Rising Prices and Rents ............................................................................................... 40
Actions Underway ...................................................................................................... 41
Restoring Stability to the Housing Market ...................................................................... 41
Consumer Protection .................................................................................................... 47
Strengthening Financial Services and Pension Regulation ................................................. 47
Strengthening Consumer Protection for Owners of Newly Built Homes ............................... 48
Regulation of Financial Planning ................................................................................... 48
Supporting Financial Literacy ....................................................................................... 49
Strengthening Investor Protection ................................................................................ 50
Improving Auto Insurance ........................................................................................... 51
Chapter III: Creating Opportunities and Security
Introduction ................................................................................................................ 57
Investing in People Today ............................................................................................. 57
Investing in People’s Talents and Skills ......................................................................... 60
Ontario’s Career Kick-Start Strategy ............................................................................. 61
Ontario Lifelong Learning and Skills Plan ....................................................................... 63
Inclusive Skills Development ....................................................................................... 65
Changing Workplaces Review ....................................................................................... 69
Investing in Jobs for Today and Tomorrow ....................................................................... 70
Long-Term Infrastructure Plan ..................................................................................... 72
Business Growth Initiative ........................................................................................... 75
Promoting and Diversifying Trade ................................................................................. 82
Strategic Partnerships ................................................................................................ 84
Supporting Growth in Ontario’s Agricultural Sector .......................................................... 86
Promoting Regional Economic Development ................................................................... 87
Aboriginal Community Capital Grants Program ............................................................... 89
Helping Businesses Find Skilled Newcomers ................................................................... 90
Social Enterprises ...................................................................................................... 90

Contents xiii
Supporting the Sharing Economy ................................................................................. 91
Transitioning to a Low-Carbon Economy ........................................................................ 92
Improving Retirement Security ....................................................................................... 97
Enhancing the Canada Pension Plan .............................................................................. 97
Implementing Pooled Registered Pension Plans .............................................................. 98
Reviewing the Solvency Funding Framework .................................................................. 99
Introducing a Framework for Target Benefit Pension Plans ............................................. 100
Expanding the Framework for Defined Contribution Pension Plans ................................... 100
Expanding the Powers of the Superintendent ............................................................... 101
Missing Beneficiary Requirements ............................................................................... 101
Chapter IV: Public Services You Can Count On
Section A: Strengthening Health Care
Introduction ............................................................................................................... 105
Summary of New Investments ...................................................................................... 106
Increasing Access .................................................................................................... 106
Reducing Wait Times ................................................................................................ 106
Enhancing the Patient Experience ............................................................................... 107
Increasing Access ....................................................................................................... 108
Building More Health Infrastructure ............................................................................ 108
Increasing Operating Funding for All Public Hospitals ..................................................... 111
Investing in Primary Care .......................................................................................... 112
Increasing Equitable Access to Health Care through
Ontario’s First Nations Health Action Plan .................................................................... 114
Advancing Timely Cancer Care and Stem Cell Transplants .............................................. 115
Improving Pain Management ..................................................................................... 116
Acting on Ontario’s Opioid Strategy ............................................................................ 116
Preventing Fetal Alcohol Spectrum Disorder (FASD)
and Supporting Those Affected by FASD ...................................................................... 117
Reducing Wait Times ................................................................................................... 118
Improving Critical Procedures and Wait Times .............................................................. 118
Streamlining Access and Reducing Wait Times for Specialized Care ................................. 119
Expanding Home and Community Care ....................................................................... 121
Faster Access to Mental Health and Addiction Services .................................................. 123
Increased Access to Structured Psychotherapy ............................................................. 124

xiv Contents
Providing More Supportive Housing ............................................................................. 124
Bringing Together Youth Services in One-Stop Hubs ...................................................... 125
Enhancing Patient Experience ....................................................................................... 125
Supporting Seniors in Their Communities .................................................................... 125
Enhancing Long-Term Care ....................................................................................... 125
Ensuring the Best Quality of Care for Patients .............................................................. 125
Making Northern Health Travel More Affordable ............................................................ 126
Improving Care for Mothers, Babies and Children ......................................................... 126
Integrating Local Health Care Services ........................................................................ 127
Easy Access to Health Services .................................................................................. 128
Protecting Health Care for Tomorrow ............................................................................. 129
Encouraging a Smoke-Free Ontario ............................................................................. 129
Health Innovation .................................................................................................... 131
Health System Research Fund .................................................................................... 132
Section B: Investing in Education
Introduction ............................................................................................................... 133
Achieving Excellence ................................................................................................... 135
Reducing Class Sizes ................................................................................................ 135
Improving Math Knowledge and Skills ......................................................................... 136
Supporting Education for the Changing Economy .......................................................... 137
Implementing Ontario’s Indigenous Education Strategy ................................................. 138
Developing a Master Education Agreement with the Anishinabek Nation ........................... 138
Ensuring Equity .......................................................................................................... 139
Strengthening Supports for Students with Special Needs ............................................... 139
Enhancing Autism Supports ....................................................................................... 139
Promoting Student Well-Being ...................................................................................... 140
Building New and Improved Schools .............................................................................. 141
Negotiating Central Agreements for Teachers and Education Workers ................................. 144
Ensuring a High-Quality, Accessible Postsecondary Education System ................................. 145
Envisioning a French-Language University ................................................................... 145
Investing in Postsecondary Education Infrastructure ...................................................... 146
Advancing Education and Career Opportunities for Indigenous Learners ........................... 147

Contents xv
Section C: Building Transit and Transportation
Introduction ............................................................................................................... 149
Investing in Transit Projects ......................................................................................... 151
GO Transit .............................................................................................................. 151
Rapid Transit Projects ............................................................................................... 153
Municipal Infrastructure Projects ................................................................................ 154
Investing in Highway Infrastructure ............................................................................... 155
Other Investments in Transportation Infrastructure ......................................................... 157
Supporting Ontario’s Small and Northern Communities .................................................. 158
High-Speed Rail ....................................................................................................... 159
Moving Ontario Forward with the Trillium Trust ............................................................... 160
Broadening Hydro One Ownership .............................................................................. 160
Merging Hydro One Brampton ..................................................................................................... 161
Realizing Value from Ontario’s Real Estate Assets ....................................................................... 161
Section D: Building Inclusive Communities and Improving the Justice System
Introduction ............................................................................................................... 163
More Stable and Secure Incomes .................................................................................. 164
Introducing a Basic Income Pilot ................................................................................ 164
Reviewing the Income Security System ....................................................................... 165
Improving Social Assistance Benefits .......................................................................... 165
Increasing Access to Affordable and Adequate Housing for All Ontarians ............................. 167
Implementing the Updated Long-Term Affordable Housing Strategy ................................ 167
Leveraging Provincial Land Assets to Build Affordable Housing ........................................ 168
Social Infrastructure Fund ......................................................................................... 168
Helping Vulnerable People ............................................................................................ 169
Supporting Adults with Developmental Disabilities ........................................................ 169
Supporting Children and Youth...................................................................................... 170
Child Welfare Reform................................................................................................ 170
Collective Impact for At-Risk Youth ............................................................................. 170
Improving Autism Services ........................................................................................ 170
Addressing Racism ...................................................................................................... 171
Anti-Racism Strategy ................................................................................................ 171
Indigenous-Focused Anti-Racism Strategy ................................................................... 172
Ontario Black Youth Action Plan ................................................................................. 172
xvi Contents
Welcoming New Ontarians ............................................................................................ 173
Ontario’s Response to the Global Refugee Crisis ........................................................... 173
Multicultural Community Capacity Grant ...................................................................... 174
Improving the Justice System ....................................................................................... 175
Building Safer Communities ....................................................................................... 175
Ensuring Wage Parity for First Nation Police Officers ...................................................... 177
Expanding Indigenous Supports ................................................................................. 177
Taking Steps to End Human Trafficking ....................................................................... 178
Streamlining and Modernizing the Court System ........................................................... 179
Transforming the Corrections System ......................................................................... 180
Enhancing Mental Health in Corrections ....................................................................... 181
Justice Infrastructure ................................................................................................ 181
Chapter V: Working with Our Partners
Introduction: Continued Collaboration with Our Partners ................................................... 185
Working in Partnership with Municipalities ...................................................................... 187
Partnerships with Indigenous Communities ..................................................................... 190
The Journey Together: Ontario’s Commitment to Reconciliation with Indigenous Peoples .... 190
Walking Together: Ontario’s Long-Term Strategy
to End Violence against Indigenous Women ................................................................. 192
Partnering with First Nations on Tobacco ..................................................................... 192
Modernizing the Ontario Gas Card Program .................................................................. 193
Protecting Sensitive and Confidential Information ......................................................... 193
Achieving Federal–Provincial Fiscal Sustainability in the Federation ..................................... 194
Ontario’s Growing Contribution to the Federation .......................................................... 195
Federal–Provincial Collaboration: Effective, Efficient and
Equitable Intergovernmental Relations in Canada ............................................................ 198
Protecting the Canadian Health System ....................................................................... 198
Taking a Balanced Approach to the Next Phase of the Federal Infrastructure Investment .... 199
Renewing Labour Market Transfers to Meet Modern Labour Market Demands .................... 200
Contents xvii
Chapter VI: Responsible Fiscal Management
Section A: Transforming Government for Sustainability and Fairness
Introduction ............................................................................................................... 203
Evidence-Based Decision-Making ................................................................................... 204
Improving Programs and Services through Behavioural Science Research ........................ 204
Transformation and Efficiency Initiatives ........................................................................ 205
Government Made Simple ......................................................................................... 206
Ensuring Everyone Pays Their Fair Share ........................................................................ 209
Addressing the Underground Economy ........................................................................ 209
Addressing Unregulated Tobacco ................................................................................ 210
Managing Compensation .............................................................................................. 212
Recent Negotiations and Compensation Outcomes ........................................................ 213
Broader Public-Sector Executive Compensation ............................................................ 213
Going Forward: Leveraging Collective Bargaining to Promote Transformation .................... 214
Government Transparency, Financial Management and Fiscal Accountability ........................ 215
Government Transparency ........................................................................................ 215
Financial Management .............................................................................................. 217
Fiscal Accountability ................................................................................................. 218
Section B: Details on Ontario’s Finances and Economic Outlook
Ontario’s Fiscal Outlook ............................................................................................... 219
2016–17 Interim Fiscal Performance .............................................................................. 220
In-Year Revenue Performance ................................................................................... 221
In-Year Expense Performance .................................................................................... 223
Medium-Term Fiscal Outlook......................................................................................... 225
Key Changes since the 2016 Budget ........................................................................... 225
Ontario’s Revenue Outlook ........................................................................................ 226
Medium-Term Revenue Outlook ................................................................................. 227
Key Changes in the Medium-Term Revenue Outlook since the 2016 Budget ...................... 232
Medium-Term Expense Outlook .................................................................................. 235
Fiscal Prudence ........................................................................................................ 238
Details of Ontario’s Finances ......................................................................................... 239
Economic Outlook Details ............................................................................................. 246
External Economic Environment .................................................................................... 250
Ontario Economic Outlook Details .................................................................................. 251
Uncertain Global Environment ....................................................................................... 253

xviii Contents
Private-Sector Forecasts .............................................................................................. 254
Comparison to the 2016 Budget .................................................................................... 255
Section C: Borrowing and Debt Management
Introduction ............................................................................................................... 257
Long-Term Public Borrowing ......................................................................................... 258
Ensuring Preferred Market Access .................................................................................. 260
Leading Canadian-Dollar Green Bond Market ................................................................... 261
Extending Term of Borrowing ........................................................................................ 262
Interest on Debt Savings and Affordability ...................................................................... 263
Ensuring Adequate Liquidity Levels ................................................................................ 265
Reducing Net Debt-to-GDP ........................................................................................... 266
Total Debt Composition ................................................................................................ 268
Cost of Debt ............................................................................................................... 269
Limiting Risk Exposure ................................................................................................. 270
Using Derivatives to Mitigate Risks ................................................................................ 271
Reducing Ontario’s Electricity Sector Stranded Debt ......................................................... 272
Consolidated Financial Tables ........................................................................................ 273
Chapter VII: A Fair and Sustainable Tax System
Introduction ............................................................................................................... 277
Section A: Taxation
Paralleling Federal Measures ......................................................................................... 279
Clarifying the Treatment of Fertility-Related Expenses
under the Medical Expense Tax Credit ......................................................................... 279
Consolidating Tax Credits for Caregivers ...................................................................... 280
Other Measures .......................................................................................................... 281
Lowering Public Transit Costs for Seniors ..................................................................... 281
Granting Municipalities the Authority to Levy a Hotel Tax ............................................... 281
Supporting Renewable Biodiesel in the Coloured Fuel Market .......................................... 282
Strengthening Ontario’s Tax System ........................................................................... 283
Income Tax Avoidance .............................................................................................. 283
Employer Health Tax Avoidance ................................................................................. 283
Technical Measures ..................................................................................................... 284
Multijurisdictional Tax Filers ....................................................................................... 284

Contents xix
Section B: Tobacco
Supporting Smoke-Free Ontario .................................................................................... 285
Section C: Strengthening Ontario’s Property Tax and Assessment System
Strengthening the Governance of the Municipal Property Assessment Corporation ................ 287
Property Tax Measures ................................................................................................ 287
Modernizing Railway Right-of-Way Property Taxation .................................................... 287
Encouraging Small-Scale Agri-Food Business on Farms .................................................. 288
Moving Forward with Provincial Land Tax Reform ............................................................. 289
Ensuring the Ongoing Integrity of Education Property Tax Revenue .................................... 289
Summary of Measures ................................................................................................. 290
Technical Amendments ................................................................................................ 291
Other Legislative Initiatives .......................................................................................... 292
xx Contents
List of Tables
Chapter I: Restoring Balance — Ontario’s Economic and Fiscal Strength
Table 1.1 Strong Sectors in Ontario’s Economy ....................................................... 11
Chapter III: Creating Opportunities and Security
Table 3.1 Progress Update on the Business Growth Initiative ..................................... 76
Table 3.2 New Investments through the Business Growth Initiative ............................ 77
Table 3.3 Recent Strategic Investments through the Jobs and Prosperity Fund ............ 84
Table 3.4 Recent Regional Development Investments............................................... 88
Table 3.5 Carbon Pricing Scenarios — Impacts by 2020 ............................................ 93
Chapter IV: Public Services You Can Count On
Table 4.1 Newly Approved Major Hospital Projects .................................................. 108
Table 4.2 Examples of Projects Benefiting from Shared Investments under
the Post-Secondary Institutions Strategic Investment Fund in Ontario ......... 146
Table 4.3 Highlights of Highway Projects ............................................................... 156
Chapter VI: Responsible Fiscal Management
Table 6.1 Ontario’s Fiscal Plan and Outlook ............................................................ 219
Table 6.2 2016–17 In-Year Fiscal Performance ....................................................... 220
Table 6.3 Summary of Revenue Changes since the 2016 Budget ............................... 221
Table 6.4 Summary of Expense Changes since the 2016 Budget ............................... 223
Table 6.5 Change in Medium-Term Fiscal Outlook since the 2016 Budget ................... 226
Table 6.6 Summary of Medium-Term Revenue Outlook ........................................... 227
Table 6.7 Personal Income Tax Revenue Outlook .................................................... 228
Table 6.8 Sales Tax Revenue Outlook ................................................................... 229
Table 6.9 Corporations Tax Revenue Outlook ......................................................... 230
Table 6.10 Summary of Medium-Term Revenue Changes since the 2016 Budget .......... 232
Table 6.11 Selected Economic and Revenue Risks and Sensitivities ............................. 234
Table 6.12 Summary of Medium-Term Expense Outlook ............................................ 235
Table 6.13 Selected Expense Sensitivities ............................................................... 237
Table 6.14 Revenue ............................................................................................. 239
Table 6.15 Total Expense ...................................................................................... 240
Table 6.16 2017–18 Infrastructure Expenditures ...................................................... 243
Table 6.17 Ten-Year Review of Selected Financial and Economic Statistics ................... 244
Contents xxi
Table 6.18 Ontario Economic Outlook ..................................................................... 246
Table 6.19 Outlook for External Factors .................................................................. 250
Table 6.20 The Ontario Economy, 2015–20 ............................................................. 252
Table 6.21 Impacts of Sustained Changes in Key External Factors
on Ontario’s Real GDP Growth ............................................................... 253
Table 6.22 Private-Sector Forecasts for Ontario Real GDP Growth ............................... 254
Table 6.23 Changes in Ministry of Finance Key Economic Forecast Assumptions:
2016 Budget Compared with 2017 Budget ............................................... 256
Table 6.24 Borrowing Program and Medium-Term Outlook ........................................ 258
Table 6.25 Consolidated Derivative Portfolio Notional Value ....................................... 271
Table 6.26 Net Debt and Accumulated Deficit .......................................................... 273
Table 6.27 Medium-Term Outlook: Net Debt and Accumulated Deficit ......................... 274
Chapter VII: A Fair and Sustainable Tax System
Table 7.1 Proposed Measures to Modernize Railway Right-of-Way Taxation ................ 288
Table 7.2 Tax Measures ...................................................................................... 290

xxii Contents
List of Charts
Chapter I: Restoring Balance — Ontario’s Economic and Fiscal Strength
Chart 1.1 Ontario’s Return to Balance ..................................................................... 5
Chart 1.2 Net Debt-to-GDP .................................................................................... 7
Chart 1.3 Net Debt Growth after Balance Is Due Only to Investments in
Capital Assets ........................................................................................ 8
Chart 1.4 Ontario’s Economic Growth Outpacing G7 .................................................. 9
Chart 1.5 Employment Gains since June 2009 Concentrated in Full-Time and
Private-Sector Positions ........................................................................ 10
Chart 1.6 Ontario Is a Key Export Market for the United States ................................. 12
Chart 1.7 Ontario’s Internationally Competitive Corporate Income Tax Rate ............... 14
Chart 1.8 Ontario’s Growth To Continue to Outpace Canada ..................................... 15
Chapter II: Helping You and Your Family
Chart 2.1 Making Tuition More Affordable: Jacqueline in College — Living at Home ....... 32
Chart 2.2 Making Tuition More Affordable: Jerome in University —
Living away from Home ......................................................................... 32
Chart 2.3 Greater Toronto Area Price Increases Outstrip Other Cities .......................... 40
Chapter III: Creating Opportunities and Security
Chart 3.1 Support from Early Years to Adulthood ..................................................... 59
Chart 3.2 Significant Infrastructure Investments ..................................................... 73
Chart 3.3 Economic Impact of the Ontario Government’s Infrastructure Plan ............... 74
Chart 3.4 Ontario among the Leaders in Venture Capital Investment .......................... 80
Chart 3.5 Reducing Red Tape for Ontario Businesses Is a Key Element of
the Government’s Plan to Create Jobs and Grow the Economy ..................... 81
Chart 3.6 Ontario’s Exports Expanding to New Markets ............................................ 82
Chart 3.7 Planned Use of Carbon Allowance Proceeds ............................................... 94
Chart 3.8 Retirement Income from the Canada Pension Plan Enhancement ................. 98

Contents xxiii
Chapter IV: Public Services You Can Count On
Chart 4.1 Hospital Projects Completed and Underway ............................................. 109
Chart 4.2 Examples of Schools To Be Opened or Under Construction in 2017–18 ........ 142
Chart 4.3 Aboriginal Postsecondary Education and Training Institutes in Ontario ......... 148
Chart 4.4 Investments in Transit and Transportation over the Next 10 Years .............. 150
Chart 4.5 Ontario’s Response to the Global Refugee Crisis ....................................... 173
Chapter V: Working with Our Partners
Chart 5.1 Growth in Ongoing Provincial Support for Municipalities ............................. 187
Chart 5.2 Net Contribution to the Equalization Program, 2017–18 ............................. 196
Chart 5.3 Ontario’s Economy Is Strengthening Relative to the Canadian Average ........ 197
Chapter VI: Responsible Fiscal Management
Chart 6.1 Ontario Public/Private Wage Settlement Trends ........................................ 212
Chart 6.2 Composition of Revenue, 2017–18 ......................................................... 242
Chart 6.3 Composition of Total Expense, 2017–18 .................................................. 242
Chart 6.4 Ontario Economic Growth Expected to Broaden ........................................ 247
Chart 6.5 900,000 Jobs Created by 2020 .............................................................. 248
Chart 6.6 Demographic Fundamentals to Support Housing Starts
over the Medium Term ......................................................................... 249
Chart 6.7 2016–17 Borrowing .............................................................................. 259
Chart 6.8 Canadian Dollar and Foreign Currency Borrowing ..................................... 260
Chart 6.9 Weighted-Average Term of Borrowing in Years ......................................... 262
Chart 6.10 Interest on Debt: Budget Forecast versus Actual ...................................... 263
Chart 6.11 Interest on Debt-to-Revenue Ratio ......................................................... 264
Chart 6.12 Average Unrestricted Liquid Reserve Levels ............................................. 265
Chart 6.13 Net Debt-to-GDP and Accumulated Deficit-to-GDP .................................... 266
Chart 6.14 Factors for Growth in Net Debt .............................................................. 267
Chart 6.15 Total Debt Composition as of March 31, 2017 .......................................... 268
Chart 6.16 Effective Interest Rate (Weighted Average) on Total Debt .......................... 269
Chart 6.17 Net Interest Rate Resetting and Foreign Exchange Exposure ...................... 270

xxiv Contents
restoring Balance — ontario’s economic and Fiscal strength
chapter i


Chapter I: Restoring Balance — Ontario’s Economic and Fiscal Strength 3
CHAPTER
I
Introduction The government is projecting that it will restore balance to the Province’s finances for the first
time since the 2008–09 global recession. In addition, Ontario’s economy has fully recovered from
the global recession and has outpaced the economic growth not just of Canada, but of all G7
countries over the last three years.
In the 2010 Budget, the government committed to eliminating the deficit and returning to
a balanced budget by 2017–18, a commitment that has been reiterated year after year.
Through targeted, measured and fiscally responsible decisions, Ontario has restored its fiscal and
economic strength. Ontario has not only eliminated its deficit of more than $19 billion at the
height of the recession; it has done so without cutting vital programs and services. The benefits of
balanced budgets and a strengthening economy are already providing the government with the
fiscal flexibility to do more to help Ontarians.
A balanced budget means that the government will no longer need to borrow to pay for its
ongoing operating costs. The result: more money to invest in health care, education and other
public services that matter most to Ontario families. A strong economy, together with a balanced
budget, is positioning Ontario for long‐term fiscal sustainability.
The Importance of Balanced Budgets and Forward-Looking Economic Policy “Balanced budgets give governments the ability to respond in the event of unexpected shocks. But eliminating red ink is not enough to ensure…long-term prosperity. The next step is to implement a comprehensive strategy for economic growth, increased business investment and job creation.”
John Manley, President and CEO, The Business Council of Canada
A return to balanced budgets and investing to strengthen the economy is important for Ontarians because:
Balanced budgets increase confidence in Ontario as a destination for investment that will further create jobs and economic growth.
Enhancements to programs and services that Ontarians depend on, such as health care and education, are prioritized over paying interest costs on accumulating debt.
The Province is in a stronger position and has greater flexibility to face the potential economic and demographic challenges that will arise over the next decade.
The Province’s overall debt burden shifts away from borrowing for deficits to focusing solely on funding Ontario’s infrastructure plan. This means the youth of Ontario and future generations will not be burdened because of borrowing for deficits today.

4 Chapter I: Restoring Balance — Ontario’s Economic and Fiscal Strength
Ontario’s Return to Balance The global recession of 2008–09 hit Ontario hard. Key sectors like manufacturing and forestry
faced significant job losses and declines in economic output. Following a period of balanced
budgets, Ontario was facing a critical challenge. Real gross domestic product (GDP) in Ontario
declined at a faster pace than in the rest of Canada or the United States. Indeed, no other
Canadian jurisdiction experienced a sharper decline in corporate tax revenues during the recession
than Ontario.
In meeting the challenge of the recession head‐on, the government refused to put vital public
services at risk or resort to arbitrary, across‐the‐board cuts to programs. Instead, it chose to lessen
the impact of the recession on Ontario families through short‐term stimulus investments that
preserved and created jobs while helping to restore economic growth. The government also chose
to protect health care, education and other public services. In so doing, Ontario, like other
jurisdictions in Canada and across the world, ran a deficit.
Supporting Ontarians and Ontario businesses was the right thing to do. To position the province to
emerge from the global economic recession and return to sound financial footing, the government
set out a plan to foster job creation and economic growth. A central tenet of that plan was to
balance the budget by 2017–18.
The plan to balance was realistic and responsible. The government managed growth in program
spending and began a process of transformation designed to improve the efficiency and
effectiveness of public services, resulting in program expense, relative to GDP, returning to
pre‐recession levels. For example, the government retrained thousands of laid‐off Ontarians who
lost their jobs as a result of the recession, preparing them for new careers in Ontario’s diversifying
economy. The government also encouraged businesses to stay in Ontario by reducing corporate
income taxes and implementing the Harmonized Sales Tax (HST), a value‐added tax system that
removed billions in embedded costs paid by businesses.
The plan also responded to shifts in the economic climate and the needs of Ontarians. Beginning
in 2012, as expectations for global economic growth weakened, the government took action
to renew the economy and help Ontario seize new opportunities for growth and job creation.
It is making historic investments in infrastructure, which are now projected to total more than
$190 billion over the 13‐year period beginning in 2014–15. Planned investments are expected
to support 125,000 jobs, on average, each year. The Province also launched the 10‐year,
$2.7‐billion Jobs and Prosperity Fund to attract significant business investments, creating and
retaining more than 37,600 jobs since 2013.

Chapter I: Restoring Balance — Ontario’s Economic and Fiscal Strength 5
CHAPTER
I
Ontario’s plan to grow the economy and protect services has paid off. Despite an uncertain global
environment, Ontario’s economy continues to grow. Exports are up, businesses are hiring more
workers and household incomes are rising. In fact, Ontario’s real GDP is now 19.1 per cent above
its recessionary low. Ontario’s unemployment rate also declined to 6.5 per cent in 2016, its lowest
annual rate since 2007 and below the national average for the past two years. The strengthening
of the economy has also resulted in increased revenue for the Province, supporting Ontario’s
return to a balanced budget.
Ontario’s Balanced Budget
The 2017 Budget plan delivers on the government’s 2010 Budget commitment to restore balance
in 2017–18. The Province is also projecting balanced budgets in both 2018–19 and 2019–20.
For the 2016–17 fiscal year, the government is forecasting a deficit of $1.5 billion, the eighth year
in a row that it is projecting to beat its deficit target.
By continuing to overachieve on its fiscal targets, the Province’s accumulated deficit is $29.0 billion
lower than it otherwise would have been relative to the 2010 Budget forecast. In addition, interest
on debt savings over the period to balance now totals $24.0 billion relative to the 2010 Budget
forecast.
Fiscal Balance($ Billions)
Ontario’s Return to BalanceCHART 1.1
(19.3)
(14.0) (13.0)
(9.2)(10.5) (10.3)
(3.5) (1.5)0.0 0.0
(24.7)
(19.7)(17.3)
(15.9)(13.3) (12.5)
(8.5)
(4.3)
0.0
(25.0)
(20.0)
(15.0)
(10.0)
(5.0)
0.0
5.02009–10 2010–11 2011–12 2012–13 2013–14 2014–15 2015–16 2016–17 2017–18 2018–19 2019–20
Actual Outlook
Fiscal Forecast2
Performance/Outlook1
1 Represents the 2017 Budget outlook for 2016–17 to 2019–20. For 2009–10 to 2015–16, actual results are presented. The 2015–16 actuals have been restated to reflect recognizing jointly sponsored net pension assets for the Ontario Public Service Employees’ Union Pension Plan and the Ontario Teachers’ Pension Plan on the Province’s financial statements, consistent with the 2016 Budget and as described in the 2016–17 Third Quarter Finances.
2 Forecast for 2009–10 is based on the 2009 Ontario Economic Outlook and Fiscal Review, 2010–11 to 2013–14 is based on the 2010 Budget; 2014–15 is based on the 2014 Budget; 2015–16 is based on the 2015 Budget; 2016–17 is based on the 2016 Budget.
Source: Ontario Ministry of Finance.
PlanInterim
6 Chapter I: Restoring Balance — Ontario’s Economic and Fiscal Strength
Together with a growing economy, the government’s strategic approach to investing in and
transforming public services has resulted in the program expense‐to‐GDP ratio returning to its
pre‐recession level. This achievement stems from prudent management of resources and
responsible restraint of program spending growth, where appropriate, allowing Ontario to remain
the province with the lowest program spending per capita. Historically low interest rates have also
helped the government overachieve on its fiscal targets and supported its efforts to balance the
budget while cost‐effectively managing debt.
As outlined in the recently released Ontario’s Long‐Term Report on the Economy, restoring balance
adds stability to Ontario’s finances and positions the government to better respond to
demographic challenges and unexpected global economic shocks that the province will face over
the next decade. The government’s efforts to grow the economy, transform public services and
manage spending responsibly over the past several years have also positioned the Province to
build on the investments it has made to support health care, public education, modern
infrastructure and lower business costs. A balanced budget means that Ontarians will continue
to benefit from expanded services and more assistance with everyday costs. These include
covering the costs of pharmacare for children and youth, providing electricity cost relief, and
helping 100,000 more children access affordable, quality licensed child care.
Chapter I: Restoring Balance — Ontario’s Economic and Fiscal Strength 7
CHAPTER
I
Declining Net Debt-to-GDP
Like many jurisdictions around the world, the government responded to the global economic
recession by making a choice to invest in the economy to stimulate economic growth, supporting
jobs for Ontarians and enhancing opportunities for families and businesses. These investments
resulted in more schools, more hospitals and modernized infrastructure in the form of improved
roads, bridges and transit networks to increase Ontario’s competitiveness and spur economic
growth. While these stimulus investments helped lift Ontario out of the economic recession,
they also resulted in a rise to the net debt‐to‐GDP ratio starting in 2008–09.
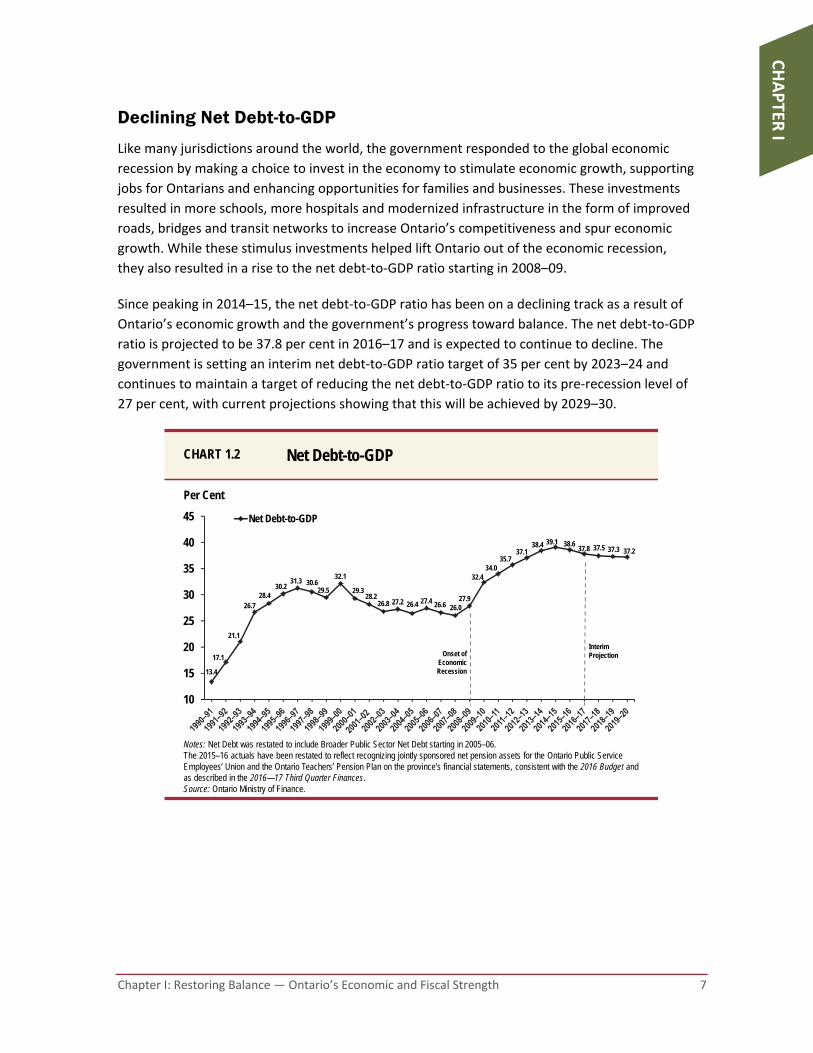
Since peaking in 2014–15, the net debt‐to‐GDP ratio has been on a declining track as a result of
Ontario’s economic growth and the government’s progress toward balance. The net debt‐to‐GDP
ratio is projected to be 37.8 per cent in 2016–17 and is expected to continue to decline. The
government is setting an interim net debt‐to‐GDP ratio target of 35 per cent by 2023–24 and
continues to maintain a target of reducing the net debt‐to‐GDP ratio to its pre‐recession level of
27 per cent, with current projections showing that this will be achieved by 2029–30.
13.4
17.1
21.1
26.728.4
30.231.3 30.6
29.5
32.1
29.328.2
26.8 27.2 26.4 27.4 26.6 26.027.9
32.434.0
35.737.1
38.4 39.1 38.637.8 37.5 37.3 37.2
10
15
20
25
30
35
40
45 Net Debt-to-GDP
Interim ProjectionOnset of
Economic Recession
Net Debt-to-GDPCHART 1.2
Notes: Net Debt was restated to include Broader Public Sector Net Debt starting in 2005–06. The 2015–16 actuals have been restated to reflect recognizing jointly sponsored net pension assets for the Ontario Public Service Employees’ Union and the Ontario Teachers’ Pension Plan on the province’s financial statements, consistent with the 2016 Budget and as described in the 2016—17 Third Quarter Finances. Source: Ontario Ministry of Finance.
Per Cent

8 Chapter I: Restoring Balance — Ontario’s Economic and Fiscal Strength
About 61 per cent of the increase in net debt from 2008–09 to 2016–17 is due to the deficit.
The remaining net debt increase is a result of investments in capital assets. Balanced budgets
from 2017–18 onwards will ensure that increases in net debt will be limited to net investments in
capital assets. Such investments will work to increase economic growth and result in GDP
growing more quickly than debt, thereby helping to lower the net debt‐to‐GDP ratio to its
pre‐recession level.
A declining net debt‐to‐GDP ratio together with lower interest on debt costs, as a percentage of
revenues, will allow for a greater percentage of government spending to be invested in programs
and services.
Notes: The 2015–16 actuals have been restated to reflect recognizing jointly sponsored net pension assets for the Ontario Public Service Employees’ Union and the Ontario Teachers’ Pension Plan on the Province’s financial statements, consistent with the 2016 Budget and as described in the 2016—17 Third Quarter Finances. Source: Ontario Financing Authority.
Per Cent
CHART 1.3
41.2
24.334.9 34.3
47.237.1 37.4
54.8
79.4
100.0 100.0 100.0
58.8
75.765.1 65.7
52.862.9 62.6
45.2
20.6
0
10
20
30
40
50
60
70
80
90
100
2008–09 2009–10 2010–11 2011–12 2012–13 2013–14 2014–15 2015–16 2016–17 2017–18 2018–19 2019–20
% Change in Net Debt Growth Due to Annual Deficits
% Change in Net Debt Growth Due to Net Investments in Capital Assets
Net Debt Growth after Balance Is Due Only to Investments in Capital Assets

Chapter I: Restoring Balance — Ontario’s Economic and Fiscal Strength 9
CHAPTER
I
Ontario’s Economic Performance Ontario’s economy is performing well, with output and jobs rising.
The province was hit hard by the global recession, causing real GDP to decline by 4.7 per cent
and resulting in more than 270,000 lost jobs.
Since the recession, Ontario’s economy has recovered, with real GDP rising by 19.1 per cent
and nearly 700,000 jobs being created.
Ontario: A Growth Leader
Since 2014, Ontario has been an economic growth leader in Canada, and private‐sector
economists expect Ontario to remain one of the fastest growing provinces over the next two
years. Over the 2014–16 period, Ontario’s real GDP growth has outpaced that of Canada and
all other G7 countries.
Sources: Organisation for Economic Co-operation and Development, Statistics Canada and Ontario Ministry of Finance.
0.6
0.81.0
1.61.7
2.22.4
2.6
0.0
0.5
1.0
1.5
2.0
2.5
3.0
Italy Japan France Canada Germany U.S. U.K. Ontario
Real GDP Growth 2014–16, Average Annual Per Cent
Ontario’s Economic Growth Outpacing G7CHART 1.4

10 Chapter I: Restoring Balance — Ontario’s Economic and Fiscal Strength
Ontario: Creating High-Quality Jobs
The majority of the jobs created since the recession were in industries that pay above‐average
wages, in the private sector and in full‐time positions. The province’s unemployment rate declined
from 9.6 per cent during the global recession to 6.4 per cent in March 2017, below the national
average for the 24th consecutive month.
6,300
6,400
6,500
6,600
6,700
6,800
6,900
7,000
7,100
2008 2009 2010 2011 2012 2013 2014 2015 2016 2017
Employment Gains since June 2009 Concentrated in Full-Time and Private-Sector Positions
CHART 1.5
Note: Above-average wage industries are defined as those with earnings above the average hourly earnings of all industries in 2016.Sources: Statistics Canada and Ontario Ministry of Finance.
Composition of Job Gains
Full-Time98%
Part-Time2%
Private-Sector73%
Public-Sector14%
Self-Employed13%
Above-Average Wage78%
Below-Average
Wage22%
+691,000 jobs
created since
recessionary low
June 2009 Recessionary Low
Employment (000s)
+676,800 Full-Time +503,600 Private-Sector +538,900 in Above-Average Wage Industries
-272,500 jobs lost
October 2008 Pre-Recession Peak
March 2017
Chapter I: Restoring Balance — Ontario’s Economic and Fiscal Strength 11
CHAPTER
I
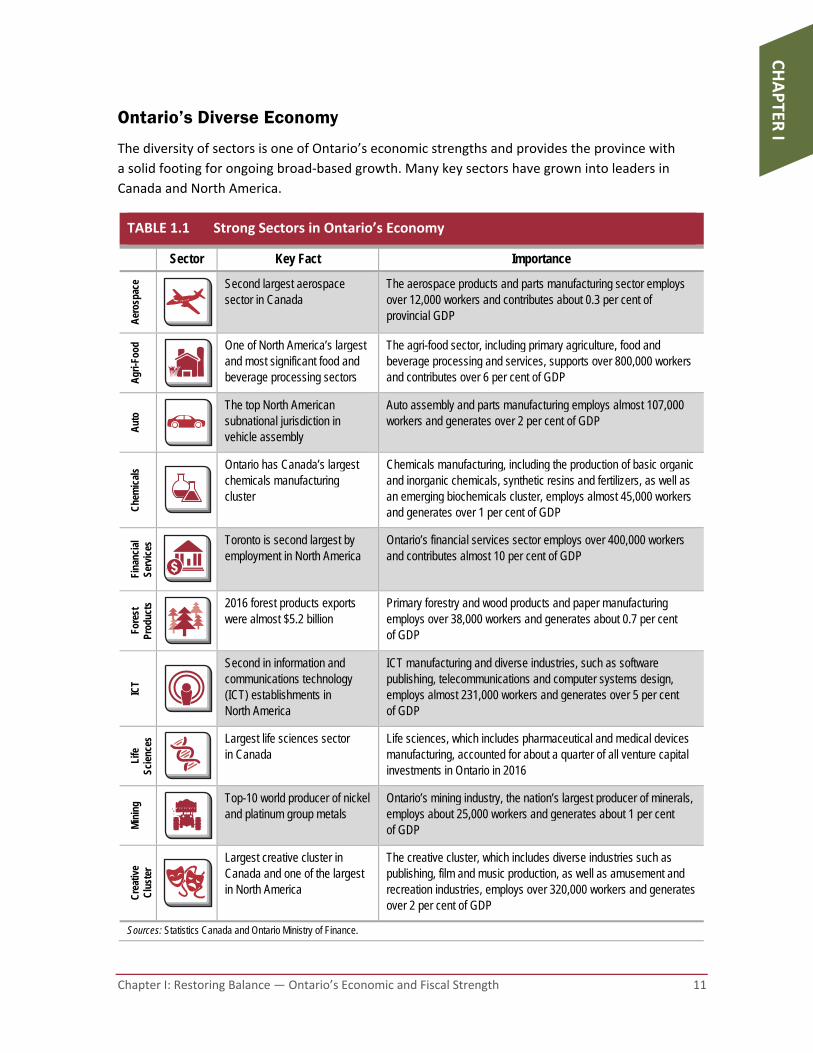
Ontario’s Diverse Economy
The diversity of sectors is one of Ontario’s economic strengths and provides the province with
a solid footing for ongoing broad‐based growth. Many key sectors have grown into leaders in
Canada and North America.
TABLE 1.1 Strong Sectors in Ontario’s Economy
Sector Key Fact Importance
Aer
ospa
ce
Second largest aerospace sector in Canada
The aerospace products and parts manufacturing sector employs over 12,000 workers and contributes about 0.3 per cent of provincial GDP
Agr
i-Foo
d
One of North America’s largest and most significant food and beverage processing sectors
The agri-food sector, including primary agriculture, food and beverage processing and services, supports over 800,000 workers and contributes over 6 per cent of GDP
Aut
o
The top North American subnational jurisdiction in vehicle assembly
Auto assembly and parts manufacturing employs almost 107,000 workers and generates over 2 per cent of GDP
Che
mic
als
Ontario has Canada’s largest chemicals manufacturing cluster
Chemicals manufacturing, including the production of basic organic and inorganic chemicals, synthetic resins and fertilizers, as well as an emerging biochemicals cluster, employs almost 45,000 workers and generates over 1 per cent of GDP
Fina
ncia
l Se
rvic
es
Toronto is second largest by employment in North America
Ontario’s financial services sector employs over 400,000 workers and contributes almost 10 per cent of GDP
Fore
st
Prod
ucts
2016 forest products exports were almost $5.2 billion
Primary forestry and wood products and paper manufacturing employs over 38,000 workers and generates about 0.7 per cent of GDP
ICT
Second in information and communications technology (ICT) establishments in North America
ICT manufacturing and diverse industries, such as software publishing, telecommunications and computer systems design, employs almost 231,000 workers and generates over 5 per cent of GDP
Life
Sc
ienc
es
Largest life sciences sector in Canada
Life sciences, which includes pharmaceutical and medical devices manufacturing, accounted for about a quarter of all venture capital investments in Ontario in 2016
Min
ing
Top-10 world producer of nickel and platinum group metals
Ontario’s mining industry, the nation’s largest producer of minerals, employs about 25,000 workers and generates about 1 per cent of GDP
Cre
ativ
e C
lust
er
Largest creative cluster in Canada and one of the largest in North America
The creative cluster, which includes diverse industries such as publishing, film and music production, as well as amusement and recreation industries, employs over 320,000 workers and generates over 2 per cent of GDP
Sources: Statistics Canada and Ontario Ministry of Finance.
12 Chapter I: Restoring Balance — Ontario’s Economic and Fiscal Strength
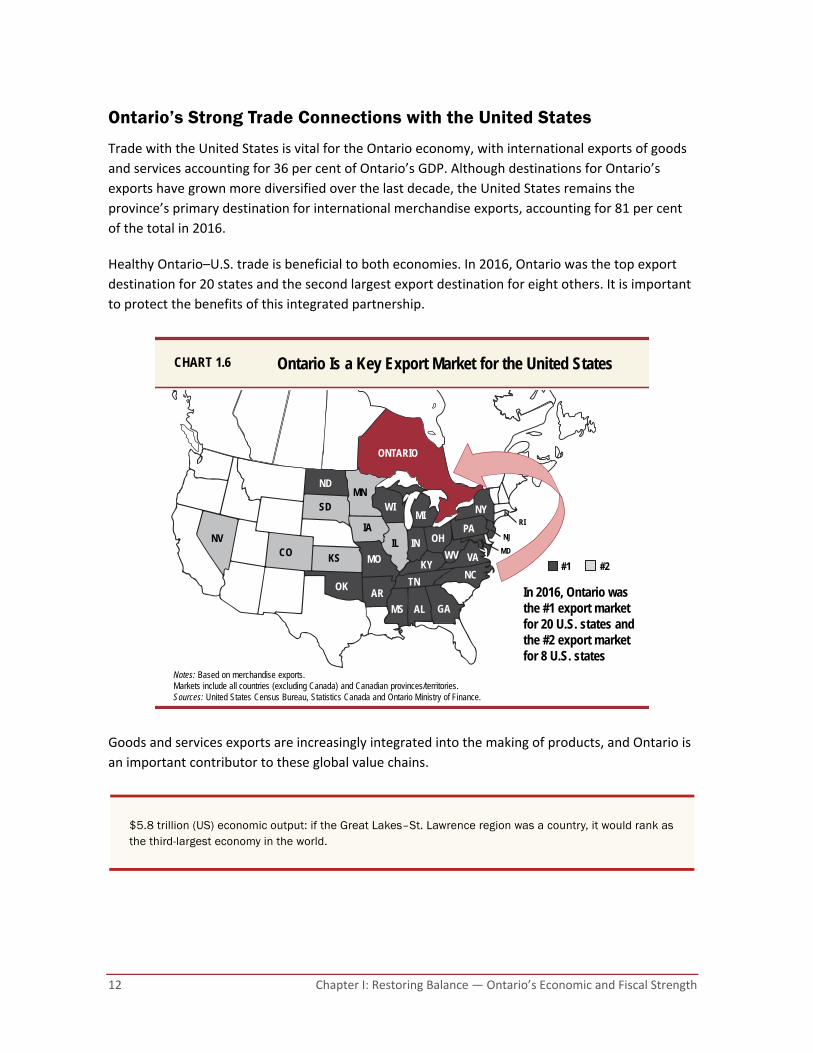
Ontario’s Strong Trade Connections with the United States
Trade with the United States is vital for the Ontario economy, with international exports of goods
and services accounting for 36 per cent of Ontario’s GDP. Although destinations for Ontario’s
exports have grown more diversified over the last decade, the United States remains the
province’s primary destination for international merchandise exports, accounting for 81 per cent
of the total in 2016.
Healthy Ontario–U.S. trade is beneficial to both economies. In 2016, Ontario was the top export
destination for 20 states and the second largest export destination for eight others. It is important
to protect the benefits of this integrated partnership.
Goods and services exports are increasingly integrated into the making of products, and Ontario is
an important contributor to these global value chains.
$5.8 trillion (US) economic output: if the Great Lakes–St. Lawrence region was a country, it would rank as the third-largest economy in the world.
Ontario Is a Key Export Market for the United StatesCHART 1.6
Notes: Based on merchandise exports.Markets include all countries (excluding Canada) and Canadian provinces/territories.Sources: United States Census Bureau, Statistics Canada and Ontario Ministry of Finance.
In 2016, Ontario was the #1 export market for 20 U.S. states and the #2 export market for 8 U.S. states
ND
IN
MIWI
AROK
GAALMS
OHPA
NY
TN
MO KYWV VA
NC
ONTARIO
MD
NJ
SD
IA
IL
MN
KS
RI
CONV
#1 #2

Chapter I: Restoring Balance — Ontario’s Economic and Fiscal Strength 13
CHAPTER
I
The Province will continue to strengthen partnerships with the new administration in the United
States, with partners in the Great Lakes region and with other states, recognizing that trade
between Ontario and the United States and fair tax policy create benefits for workers and
businesses on both sides of the border.
Maintaining Tax Competitiveness
Business tax reforms implemented by the government have lowered taxes and compliance costs,
helping Ontario businesses become more competitive globally and contributing to the creation of
more jobs for Ontarians. Experts have recently noted that Ontario enjoys a competitive advantage
over a number of American states because of provincial and federal policy action on corporate
income taxes over the past two decades.1
Ontario has introduced a number of reforms that have significantly enhanced Ontario’s tax
competitiveness and business investment climate, saving businesses more than $10 billion per
year. These savings are often reinvested into Ontario businesses, helping to spur further growth
and create more jobs for Ontarians. These reforms include:
Implementing the Harmonized Sales Tax (HST);
Maintaining low Corporate Income Tax (CIT) rates;
Eliminating the Capital Tax; and
Cutting Business Education Tax (BET) rates.
Ontario’s general Corporate Income Tax (CIT) rate was reduced in stages from 14.0 per cent
in 2009 to the current 11.5 per cent, and from 12 per cent to 10 per cent for resources,
manufacturers and processors.
The Province’s combined federal–Ontario general CIT rate of 26.5 per cent is competitive within
Canada and internationally. Ontario’s combined rate is lower than the comparable rate in any of
the U.S. states and is lower than the average of Canadian provinces and the average of G7
member countries (see Chart 1.7).
1 Ontario, Legislative Assembly, Official Report of Debates (Hansard), 41st Parliament, 2nd Session,
(January 18, 2017) at 1340.
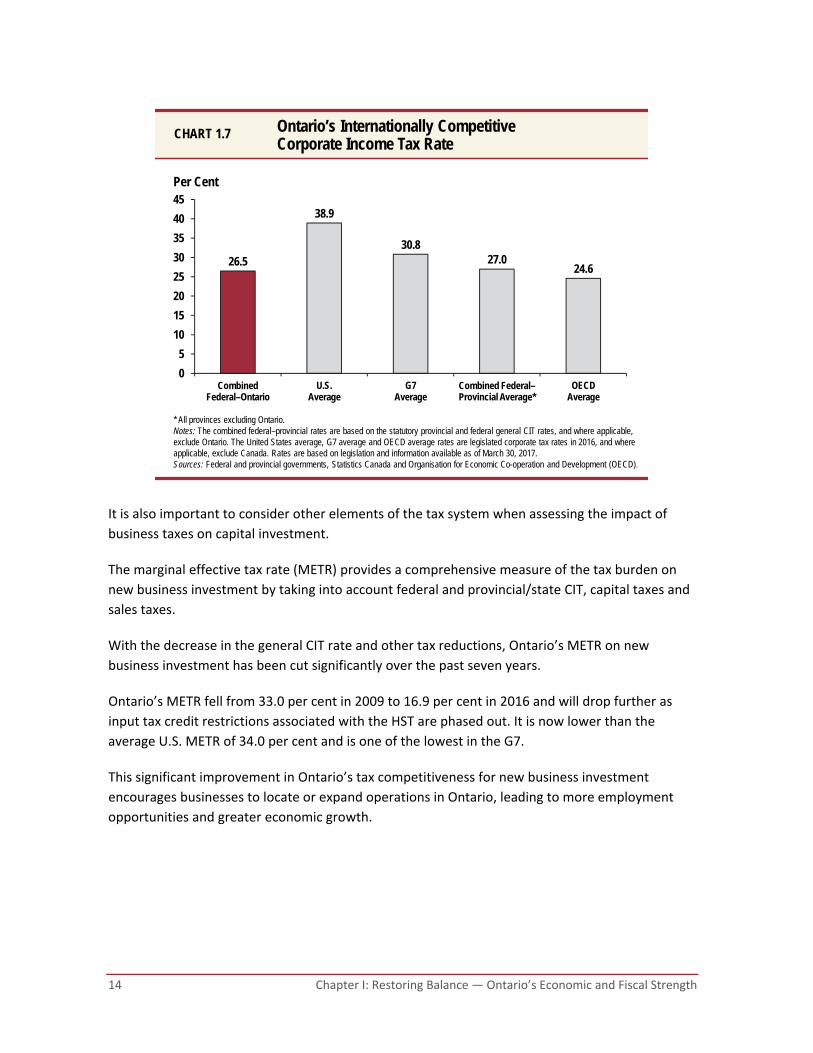
14 Chapter I: Restoring Balance — Ontario’s Economic and Fiscal Strength
It is also important to consider other elements of the tax system when assessing the impact of
business taxes on capital investment.
The marginal effective tax rate (METR) provides a comprehensive measure of the tax burden on
new business investment by taking into account federal and provincial/state CIT, capital taxes and
sales taxes.
With the decrease in the general CIT rate and other tax reductions, Ontario’s METR on new
business investment has been cut significantly over the past seven years.
Ontario’s METR fell from 33.0 per cent in 2009 to 16.9 per cent in 2016 and will drop further as
input tax credit restrictions associated with the HST are phased out. It is now lower than the
average U.S. METR of 34.0 per cent and is one of the lowest in the G7.
This significant improvement in Ontario’s tax competitiveness for new business investment
encourages businesses to locate or expand operations in Ontario, leading to more employment
opportunities and greater economic growth.
* All provinces excluding Ontario.Notes: The combined federal–provincial rates are based on the statutory provincial and federal general CIT rates, and where applicable, exclude Ontario. The United States average, G7 average and OECD average rates are legislated corporate tax rates in 2016, and where applicable, exclude Canada. Rates are based on legislation and information available as of March 30, 2017.Sources: Federal and provincial governments, Statistics Canada and Organisation for Economic Co-operation and Development (OECD).
26.5
38.9
30.827.0
24.6
0
5
10
15
20
25
30
35
40
45
CombinedFederal–Ontario
U.S.Average
G7Average
Combined Federal–Provincial Average*
OECDAverage
Per Cent
Ontario’s Internationally Competitive Corporate Income Tax Rate
CHART 1.7
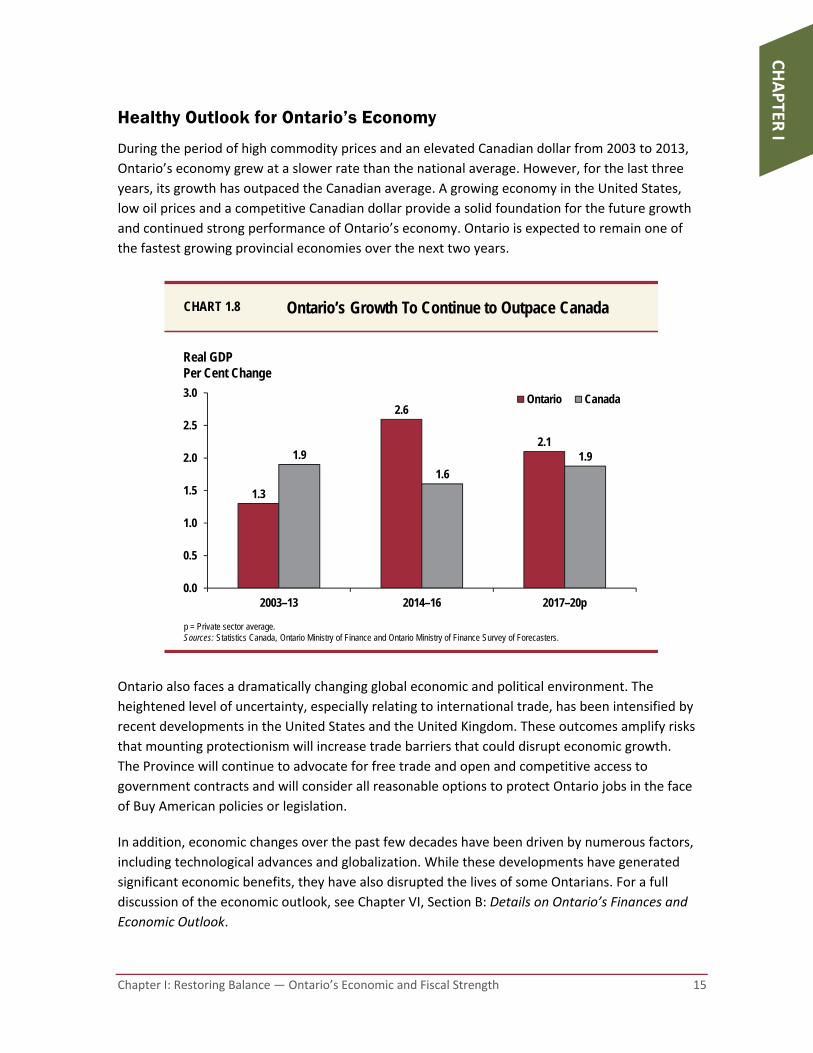
Chapter I: Restoring Balance — Ontario’s Economic and Fiscal Strength 15
CHAPTER
I
Healthy Outlook for Ontario’s Economy
During the period of high commodity prices and an elevated Canadian dollar from 2003 to 2013,
Ontario’s economy grew at a slower rate than the national average. However, for the last three
years, its growth has outpaced the Canadian average. A growing economy in the United States,
low oil prices and a competitive Canadian dollar provide a solid foundation for the future growth
and continued strong performance of Ontario’s economy. Ontario is expected to remain one of
the fastest growing provincial economies over the next two years.
Ontario also faces a dramatically changing global economic and political environment. The
heightened level of uncertainty, especially relating to international trade, has been intensified by
recent developments in the United States and the United Kingdom. These outcomes amplify risks
that mounting protectionism will increase trade barriers that could disrupt economic growth.
The Province will continue to advocate for free trade and open and competitive access to
government contracts and will consider all reasonable options to protect Ontario jobs in the face
of Buy American policies or legislation.
In addition, economic changes over the past few decades have been driven by numerous factors,
including technological advances and globalization. While these developments have generated
significant economic benefits, they have also disrupted the lives of some Ontarians. For a full
discussion of the economic outlook, see Chapter VI, Section B: Details on Ontario’s Finances and
Economic Outlook.
p = Private sector average.Sources: Statistics Canada, Ontario Ministry of Finance and Ontario Ministry of Finance Survey of Forecasters.
1.3
2.6
2.11.9
1.6
1.9
0.0
0.5
1.0
1.5
2.0
2.5
3.0
2003–13 2014–16 2017–20p
Ontario Canada
Real GDPPer Cent Change
Ontario’s Growth To Continue to Outpace CanadaCHART 1.8

16 Chapter I: Restoring Balance — Ontario’s Economic and Fiscal Strength
The Path Forward for All Ontario is delivering on its commitment to balance the budget in 2017–18 in a fair and
responsible way.
Not all Ontarians are benefiting equally from the province’s return to economic strength. While
Ontario’s unemployment rate in 2016 was at a nine‐year low, and its economy is among the
strongest in the country, too many Ontarians are still out of work or struggling to make ends meet.
Even those with steady incomes are concerned about everyday costs. Hardworking Ontarians
across the province deserve to be included in the benefits of growth.
To ensure everyone shares in this prosperity, the government will continue to work with partners
in all regions and sectors to create jobs and strengthen communities. A strong economy, together
with a balanced budget, is creating more opportunities for individuals and businesses in Ontario to
get ahead and stay ahead. A balanced budget means that people will continue to benefit from
expanded health care and education, and receive more assistance with everyday costs.
Ensuring that legitimate businesses have an equal opportunity to succeed is also part of the
government’s plan to maintain balance. The government is taking action to combat the
underground economy, strengthen the integrity of the tax system and ensure everyone pays their
fair share of taxes. Additional ways to address tax loopholes and sophisticated tax planning
schemes will be developed.
When businesses fail to report income for tax purposes or avoid sales taxes, there is less money
available to fund public services. Going forward, the government will continue to introduce
measures to better coordinate and strengthen compliance in high‐risk sectors to ensure a fair and
equitable business environment.
Finally, the government will continue to review its programs to deliver the best possible results at
the lowest cost. Evidence‐based decision‐making supports the use of limited public resources to
improve outcomes and ensure the long‐term sustainability of provincial programs and services
that will meet the needs of Ontarians in the digital era.

helping You and Your FamilY
chapter ii

Chapter II: Helping You and Your Family 19
CHAPTER
II
Introduction Collectively, Ontarians are helping build a better future for their families every day. Across the
province, people are caring for loved ones who are aging, helping their children get ahead in
school, taking additional courses to upgrade their skills, and building new companies that will be
at the forefront of global innovation.
They are working hard to get ahead and stay ahead, but often face challenges including rising costs
of living — costs that can stretch monthly budgets to the limit.
With a growing economy and a balanced budget, the Ontario government is making investments
in key services like health care and education that matter most to people, while at the same time
lowering costs for necessities like electricity and child care. This includes:
Lowering household electricity bills on average by 25 per cent, beginning this summer;
Starting on January 1, 2018, Ontario will launch OHIP+: Children and Youth Pharmacare —
providing universal drug coverage to all children across the province aged 24 years and
under, regardless of family income;
Helping 100,000 more children access affordable, quality licensed child care;
Transforming the Ontario Student Assistance Program (OSAP) to make average tuition free
for more than 210,000 Ontario students and reduce the cost for many more;
Providing better supports for families and caregivers; and
Introducing a Fair Housing Plan to increase affordability for both buyers and renters and to
support stability in the housing market.
The government is also focused on strengthening consumer protection in a number of areas,
including financial services and pension regulation, and auto insurance.
20 Chapter II: Helping You and Your Family
Helping with Everyday Costs Delivering the Largest Single Reduction to Electricity Rates in Ontario’s History
Electricity is an essential part of people’s daily lives. For decades, Ontario enjoyed one of the
largest, most impressive and up‐to‐date electricity systems in North America. However,
years of underinvestment by successive governments led to a system that was outdated and
unreliable — resulting in instances of blackouts and brownouts.
The system was due for major upgrades, and since 2003, more than $50 billion has been invested
in electricity generation and grid infrastructure across the province, to ensure Ontarians benefit
from a cleaner, more modern and more reliable system. In addition, $12.8 billion is being invested
to refurbish the Darlington Nuclear Generating Station, to secure affordable, reliable,
emissions‐free power. Ontario also became the first jurisdiction in North America to end the use
of coal‐fired electricity generation, choosing instead to produce more clean power.
The much‐needed rebuilding of an aging and unreliable electricity system that depended on
expensive electricity imports and dirty coal resulted in rapidly rising rates for many people across
Ontario. The government recognizes that rates rose too much and too quickly, and that people
want substantial relief from high electricity bills that will last.
That is why, starting this summer, Ontario’s proposed Fair Hydro Plan would reduce electricity bills
by 25 per cent on average for eligible households. Approximately 500,000 small businesses and
farms would also benefit. Low‐income Ontarians and those living in eligible rural, remote or
on‐reserve First Nation communities would receive even greater reductions to their
electricity bills.
As part of this plan, rate increases over the next four years would be held to the rate of inflation
for residential customers and eligible farm and small business consumers. These measures also
include an eight per cent rebate on electricity bills equal to the provincial portion of the
Harmonized Sales Tax, effective January 1, 2017.
Taken together, these changes would deliver the largest reduction to electricity rates
in Ontario’s history.
Chapter II: Helping You and Your Family 21
CHAPTER
II
Reducing Electricity Rates by 25 Per Cent
Through the following measures, Ontario’s
proposed Fair Hydro Plan would reduce
electricity bills by 25 per cent on average for
eligible households. Approximately 500,000
small businesses and farms would also benefit.
Recognizing that existing electricity
infrastructure is expected to last for
decades to come, the Province would
refinance the cost of those capital
investments to ensure that system
costs are more equitably distributed
over time.
A number of important electricity support programs would now be funded by the Province
rather than by ratepayers, which would reduce electricity costs for all consumers.
These new measures would cost up to $2.5 billion over the next three years.
These changes would allocate costs more fairly and ensure they are not disproportionately placed
on the shoulders of today’s electricity ratepayers.
Support for the Fair Hydro Plan “We are pleased that electricity ratepayers will see the positive benefits of [Ontario’s Fair Hydro Plan] in the near future and for the commitment that rates will not increase beyond the rate of inflation for the next four years.”
Alan Spacek, President of the Federation of Northern Ontario Municipalities (FONOM) and Mayor of Kapuskasing, March 2, 2017
Ontario is reducing electricity bills by 25 per cent on average to make everyday life more affordable.
22 Chapter II: Helping You and Your Family
Providing Targeted and Expanded Relief for Rural, Remote, Low-Income and First Nation Customers
Providing Further Support for Rural and Remote Communities
The Rural or Remote Electricity Rate Protection (RRRP) program currently provides a rate subsidy
to eligible rural and remote residential customers who face higher distribution costs compared to
those in urban areas.
The Province intends to expand the RRRP to provide distribution delivery charge relief to a total
of about 800,000 customers served by local distribution companies (LDCs) with the highest rates,
including Hydro One R2 and R1 rate classes (residential low and medium density areas,
respectively), Northern Ontario Wires Inc., Lakeland Power Distribution Ltd. (Parry Sound service
territory), Chapleau Public Utilities Corporation, Sioux Lookout Hydro Inc., InnPower Corporation,
Atikokan Hydro Inc. and Algoma Power Inc.
Lowering Electricity Costs for the Most Vulnerable Consumers
The Ontario Electricity Support Program (OESP) is an income‐tested, application‐based program
that lowers electricity costs for the most vulnerable, providing a rebate directly on bills.
The Province is working with the Ontario Energy Board on the Province’s proposal to increase the
OESP monthly benefit amounts by 50 per cent, which would significantly enhance the benefit that
eligible consumers receive. The OESP would also become available to more Ontarians by
introducing new eligibility categories.
To help OESP‐eligible Ontarians receive their credits, the government is pursuing automatic
qualifications for customers who are enrolled in other provincial social assistance programs.
Promoting Energy-Efficient Improvements to Ontario Homes
The Province has established an Affordability Fund to provide support to Ontarians who do not
qualify for low‐income conservation programs so that they can adopt energy efficiency
improvements to help reduce their future electricity bills. The fund was developed with input from
electricity distributors and other stakeholders.
The Province is committed to supporting electricity conservation through existing programs such
as the Save on Energy Home Assistance Program, Heating & Cooling Incentive program, and
Coupon Event. Local natural gas distribution companies also offer conservation programs such as
the Home Weatherization Program, Home Winterproofing Program and the Ontario Home Energy
Conservation Incentive Program.

Chapter II: Helping You and Your Family 23
CHAPTER
II
Providing a First Nations On-Reserve Delivery Credit
The Province is planning to introduce legislation that, if passed, would enable a First Nations
On‐Reserve Delivery Credit that would eliminate delivery charges for eligible households,
saving them an average of about $1,020 per year.
Support for the Fair Hydro Plan “The elimination of the delivery charge will assist our citizens by reducing energy poverty in our communities. It also represents recognition for the use of the land in the development and expansion of the provincial energy grid... Today’s commitment by the Ontario government is commendable and allows a path forward for greater quality of life for First Nations in Ontario.”
Isadore Day, Ontario Regional Chief, March 2, 2017
Reducing Electricity Costs for Businesses
The government is continuing to lower electricity costs for businesses to help maintain a
competitive environment. Ontario is proposing to further expand the Industrial Conservation
Initiative (ICI) program by reducing the eligibility threshold from one megawatt (MW) to
500 kilowatts (kW) for targeted manufacturing and industrial sectors, including greenhouses.
The ICI program helps consumers reduce their electricity bills by providing an incentive to shift
consumption to off‐peak hours.
This proposed change is in addition to the Province’s existing actions to reduce electricity costs for
businesses, such as providing ongoing annual support totalling up to $120 million to qualifying
large industrial facilities in northern Ontario and ending the debt retirement charge (DRC) for
commercial, industrial and all other electricity users as of April 1, 2018.
Modernizing the Province’s Electricity Markets
Ontario’s commitment to lowering energy costs for ratepayers includes working with Provincial
agencies to identify opportunities to drive efficiency and productivity improvements.
The Ontario Energy Board (OEB) regulates and licenses more than 70 LDCs and will identify
opportunities to further drive transmitter and LDC efficiencies and productivity
improvements, including the use of innovative technologies and business processes.
The Independent Electricity System Operator (IESO) plans for the province’s electricity
needs, balances supply and demand in real time, and administers conservation programs.
The IESO’s Market Renewal initiative is estimated to save up to $5.2 billion over a 10‐year
period, starting in 2021.
24 Chapter II: Helping You and Your Family
More details on these and other measures to drive costs out of the system, encourage
conservation to help meet Ontario’s climate change goals, and reduce the supply cost of electricity
will be included in the Province’s upcoming Long‐Term Energy Plan (LTEP), which is expected to be
released in spring 2017.
Expanding Access to Natural Gas
Ontario is investing $100 million in the new Natural Gas Grant Program. The program will support
the building of infrastructure to expand access to natural gas to areas currently underserved,
including rural, northern Ontario and First Nation communities.
Natural gas is consistently less expensive than many other sources of energy. By providing access
to natural gas to more communities, Ontario will attract new industry, increase affordability of
agriculture, provide a cleaner source of energy, and reduce costs.
Elimination of the Drive Clean Emission Test Fee
Ontario’s mandatory vehicle emissions inspection and
maintenance program, Drive Clean, tests over two million
vehicles annually. As of April 1, 2017, the government
eliminated the initial $30 fee drivers used to pay for Drive
Clean emissions tests. To make everyday life easier for
Ontarians, the Province also eliminated testing requirements
during the resale of light‐duty vehicles, such as most cars,
vans, SUVs and light trucks.

Chapter II: Helping You and Your Family 25
CHAPTER
II
Helping Parents OHIP+: Children and Youth Pharmacare
Ontario’s health care system has provided
critical support and care to families for
generations. It is part of the social fabric of
Ontario that gives everyone access to a high
quality of life and the chance to succeed.
The government is committed to ensuring all
Ontarians have equitable access to the care
they need to be healthy and to thrive.
Appropriately used prescription drugs are an
essential and integral part of a modern health
care system.
Over the past several years, Ontario has been advocating for a national pharmacare program so
that no family has to worry about the affordability of life‐saving drugs, should they ever need
them. Comprehensive public pharmacare would expand access to prescription drugs for all
Ontarians who need them and eliminate the financial barriers that currently exist for the
estimated one in 10 Ontarians who cannot afford prescription drugs.
Access to prescription drugs is essential for a truly responsive and sustainable health care system.
Pharmacare will help ensure access to prescribed medications, particularly for those who are most
in need and least able to pay. It is the natural next step in the evolution of Canada’s most revered
social program — universal public health care.
Today over 3.9 million people in Ontario benefit from prescription drug coverage under the
Ontario Drug Benefit (ODB) Program, including over 2.3 million seniors and over 900,000 people
on social assistance.
Starting on January 1, 2018, Ontario will launch OHIP+: Children and Youth Pharmacare —
providing universal drug coverage to all children and youth across the province.
OHIP+: Children and Youth Pharmacare will be available to all children and youth aged 24 and
under, regardless of family income. It will completely cover the cost of all medicines funded
through the ODB Program. There will be no deductible and no co‐payment. OHIP+: Children and
Youth Pharmacare is the first program of its kind in Canada.
OHIP+: Children and Youth Pharmacare means free prescription drugs for four million Ontarians.

26 Chapter II: Helping You and Your Family
Helping Families Access and Afford Child Care
Finding quality and affordable child care
can be a challenge for families in some
communities due to long waitlists for
subsidies and spaces. The government is
helping 100,000 more children access
affordable, quality licensed child care to give
them the best start in life and support
families across Ontario. As a first step, the
Province invested an additional $65.5 million
to help create 3,400 licensed child care
spaces in fall 2016.
In addition to creating new licensed spaces, the renewed investment in child care will also:
Help to provide a subsidy to approximately 60 per cent of new spaces to address
affordability and reduce fee subsidy waitlists; and
Provide greater responsiveness to parents’ needs and ease the transition for children with
special needs.
By 2017–18, this new investment will support access to licensed child care for 24,000 more
children up to four years old through new fee subsidy spaces and support for new licensed child
care spaces in schools. These new supports will reduce waitlists, better ensuring that parents with
low‐ and middle‐incomes can benefit in a variety of ways.
This new commitment builds upon the 56,000 licensed child
care spaces the government has helped create over the past
three years. Ontario has also invested an additional
$63.5 million each year since 2010 to help fill the gap left when
the federal government stepped away from its child care
responsibility. The Province welcomes the federal government
supporting Ontario’s investment as part of the infrastructure
announcement outlined in the 2017 federal budget.
Moving forward, government will continue to work with schools and municipalities to provide
funding through a mixed approach of school‐, community‐ and home‐based expansion to provide
care that is convenient, flexible and in line with parents’ needs.
Ontario has removed child care waitlist fees to help families with young children.
The government will double the current capacity for child care in Ontario for children up to age four to help meet the demands of a growing and changing province.

Chapter II: Helping You and Your Family 27
CHAPTER
II
The government will also expand five existing child and family programs on‐reserve in the
following communities:
M’Chigeeng First Nation;
Nibinamik First Nation;
Six Nations of the Grand River;
Walpole Island First Nation; and
Wikwemikong Unceded Indian Reserve.
Ontario will continue to work with Indigenous partners to help increase the number of quality,
affordable licensed child care spaces.
See also Chapter V: Working with Our Partners for more information on Ontario’s Commitment to
Reconciliation with Indigenous Peoples.
Full-Day Kindergarten With the province-wide implementation of full-day kindergarten (FDK), Ontario became a leader in early learning, and the first jurisdiction in North America to implement this program. With more than $1.5 billion in funding annually, FDK is one of the most significant education investments Ontario has made in a generation.
About 260,000 four- and five-year-olds are benefiting from FDK annually in approximately 3,600 schools across the province.
Families are saving up to $6,500 per child per year in child care costs.
Comparisons of children with two years of FDK instruction and children with no FDK instruction
showed that FDK:1
Reduced risks in social competence development from 10.5 per cent to 5.8 per cent.
Reduced risks in language and cognitive development from 15.8 per cent to 4.3 per cent.
Reduced risks in communication skills and general knowledge development from 10.5 per cent to 5.8 per cent.
1 The Social Program Evaluation Group — Queen’s University, Final Report: Evaluation of the Implementation of
the Ontario Full‐Day Early Learning‐Kindergarten Program (Fall 2012) and the Offord Centre for Child Studies — McMaster University, The Full Day Kindergarten Early Learning Program Final Report (October 2012).

28 Chapter II: Helping You and Your Family
Supporting Community Hubs
Community hubs are vibrant centres of community life that generate economic and social benefits
while improving the efficiency of local services. The Province is taking measures to coordinate
health, social and education services to better serve people and their communities by creating
spaces for community use in schools, and expanding child care and family services. As an example,
in the education sector, Ontario is taking specific actions to encourage community hubs in
schools, including:
Creating space for new child care and
child family support programs through
Ontario Early Years Child and Family
Centres in schools;
Retrofitting existing child care space
within schools to open up more spaces
for children under four years old; and
Renovating surplus school space to
make it available for use by community
partners and the public.
To enable development of more community hubs, the government will be taking into
consideration broader economic and community benefits when making decisions on the
disposition of surplus Provincial properties.
The Province is committed to making it easier
to create community hubs and ensuring the
best possible use of public properties,
including schools, hospitals and Provincial
properties that are no longer needed for
their original purpose.
In line with Community Hubs in Ontario:
A Strategic Framework and Action Plan,
the government is transforming the way in
which public properties are divested to
ensure a meaningful assessment of
opportunities to retain them within the
public sphere.
Community hubs offer a central point of access for a range of vital services like health and education.
Francophone Community Arts Centre — Place des Arts Project Ontario is contributing $3.25 million to support the construction of the Place des Arts, a state-of-the-art shared artistic facility that will contribute to the revitalization of downtown Sudbury. In addition to attracting tourism and creating jobs, the new cultural centre will create an artistic space for the area’s francophones, as well as the wider community.
Place des Arts is led by Regroupement des organismes culturels de Sudbury (ROCS), an informal coalition of seven artistic and cultural organizations within Greater Sudbury. These organizations have worked collaboratively since 2010 and collectively represent three generations of Franco-Ontarian cultural institutions.

Chapter II: Helping You and Your Family 29
CHAPTER
II
The government is reviewing relevant Provincial policies to ensure alignment with community‐
focused objectives. It will also promote coordinated planning with local partners and across
government, encourage integrated service delivery, and incorporate multi‐use design as part of its
long‐term infrastructure planning. As well, the Province is hosting the Community Hubs Summit in
May 2017 to bring together those who are working in, or planning for, a community hub in
Ontario. The summit will launch a new resource network, encourage knowledge sharing, and
provide an engagement opportunity for the ongoing implementation of the community hub
recommendations.
Community Hubs across the Province
Ontario is seeking to preserve vital community services, including autism supports and licensed child care, by proposing to acquire McNicoll Public School in North York and Silver Creek Public School in Etobicoke from the Toronto District School Board to maintain the existing community services as community hubs.
Ontario is supporting the construction of a new health hub in Orléans that will consolidate selected services from three hospitals and four community service providers on one site. When complete, patients in the Orléans area will benefit from bilingual, integrated and patient-centred services closer to home.
In October, the Province announced it is supporting a new Community Health Centre satellite site in Limoges, Ontario that will focus on preventive health care, health promotion, chronic diseases, mental health and addictions, and diabetes education, with services to be provided in both French and English, to better meet the needs of people in this region. This satellite is part of a community hub and is a collaborative project between local community organizations and private-sector partners.
Ontario is supporting the construction of a new four-storey building in Ottawa that will be used to co-locate the Carlington Community Health Centre and Ottawa Community Housing Corporation’s senior housing units.

30 Chapter II: Helping You and Your Family
Helping Students Making Postsecondary Education More Affordable
Access to a postsecondary education should not be based on ability to pay — it should be based
on desire to learn. The government is fundamentally transforming the Ontario Student Assistance
Program (OSAP) to make postsecondary education more accessible and affordable for Ontario
students and their families, including mature students. Enhancing opportunities for postsecondary
education will help students improve their employment prospects by gaining the knowledge and
skills they need to compete in the global economy.
Starting this fall, Ontario is rolling out the new OSAP to provide more transparent, timely and
targeted financial assistance to students with the greatest financial need. These changes will make
average tuition free for more than 210,000 Ontario students and reduce the cost for many more.
Most Ontario students will receive more aid than they have been eligible for under the
current framework.
Transforming OSAP to help more students pursue postsecondary education, regardless of family income.

Chapter II: Helping You and Your Family 31
CHAPTER
II
Starting this fall, the government will:
Introduce the new OSAP that will replace many existing Provincial grants with a single upfront grant, helping students cover educational expenses as they become due.
Increase weekly aid limits for all students while continuing to index aid to inflation on a yearly basis.
Starting in 2018, Ontario will:
Reduce what parents and spouses are expected to contribute to a student’s educational costs under OSAP, further increasing support for students from middle- to upper-income families.
In addition to changes announced in the 2016 Budget, OSAP enhancements will:
Better assist families that have saved for their children’s postsecondary education by ensuring savings from Registered Education Savings Plans (RESPs) will not reduce the amount of financial assistance provided to students through OSAP.
Help remove financial barriers to postsecondary education for Indigenous students. The government is working with Indigenous partners to identify additional targeted OSAP supports that will address economic barriers and improve access to postsecondary education for Indigenous students.
Help make the transition into the workforce easier, increasing the minimum salary an individual needs to earn from $25,000 to $35,000 before they start repaying the Provincial portion of OSAP loans.
Try the online OSAP calculator.2 See Chapter II: Helping You and Your Family for more details on OSAP.
These changes to OSAP will also help ensure students have an accurate understanding of
postsecondary education costs well before they start their school year. The simpler, integrated,
upfront grant and net tuition will make it easier for Ontario families to plan and budget for
education costs.
Eligible students, including mature students and adult learners with annual family incomes
of $50,000 or less, will receive enough in OSAP grants to cover average tuition costs;
80 per cent of students with annual family incomes below $90,000 will receive grants that
equal or exceed the average cost of tuition and will not need to be repaid;
About 230,000 students will have less debt than they would have had under previous OSAP
rules; and
No Ontario student will receive less than they are currently eligible for through the 30% Off
Ontario Tuition Grant.
2 https://osap.gov.on.ca/AidEstimatorWeb/enterapp/enter.xhtml

32 Chapter II: Helping You and Your Family
Non-repayable grants: $4,528+ Repayable loans: $2,011
Total OSAP aid: $6,539
Making Tuition More AffordableJacqueline in College — Living at Home
CHART 2.1
Jacqueline (Family Income: $40,000/year) — Illustrative College Student
Jacqueline is anticipated to pay regular college tuition of $2,768 in 2015–16 and $3,026 in 2018–19. She is from a family of four. * Total student costs of $8,914 are covered by student contribution of $3,000 and OSAP aid of $5,914. ** Total student costs of $9,539 are covered by student contribution of $3,000 and OSAP aid of $6,539.
• Total OSAP aid increases by $625
• Non-repayable grants reach $4,528, an increase of $1,757 under the new OSAP
• No parental contribution required
• Upon graduation, the repayment of her Ontario loan can begin when she earns $35,000 per year, instead of $25,000
New OSAP means significantly more non-repayable grants covering her tuition
Under the new OSAP**
In 2018–19, total student costs: $9,539
Under the old OSAP*
In 2015–16, total student costs: $8,914
All grants are now available upfront
Non-repayable grants: $2,771+ Repayable loans: $3,143
Total OSAP aid: $5,914
Making Tuition More AffordableJerome in University — Living away from Home
CHART 2.2
Jerome (Family Income: $80,000/year) — Illustrative University Arts and Science Student
Jerome is anticipated to pay average arts and science tuition of $6,160 in 2015–16 and $6,712 in 2018–19. He is from a family of four.* Total student costs of $18,000 are covered by OSAP aid of $11,744, student contribution of $3,000, parental contribution of $2,256, and scholarship of $1,000. ** Total student costs of $19,236 are covered by OSAP aid of $15,236, student contribution of $3,000, and scholarship of $1,000.
• Total OSAP aid increases by $3,492
• Non-repayable grants reach $6,226, an increase of $1,882 under the new OSAP
• Parental contribution no longer required
• Upon graduation, the repayment of his Ontario loan can begin when he earns $35,000 per year, instead of $25,000
New OSAP means significantly more aid
Under the new OSAP**
Non-repayable grants: $6,226+ Repayable loans: $9,010
Total OSAP aid: $15,236
In 2018–19, total student costs: $19,236
Under the old OSAP*
Non-repayable grants: $4,344+ Repayable loans: $7,400
Total OSAP aid: $11,744
In 2015–16, total student costs: $18,000
All grants are now available upfront
Most grants
received after
the school
year finishes
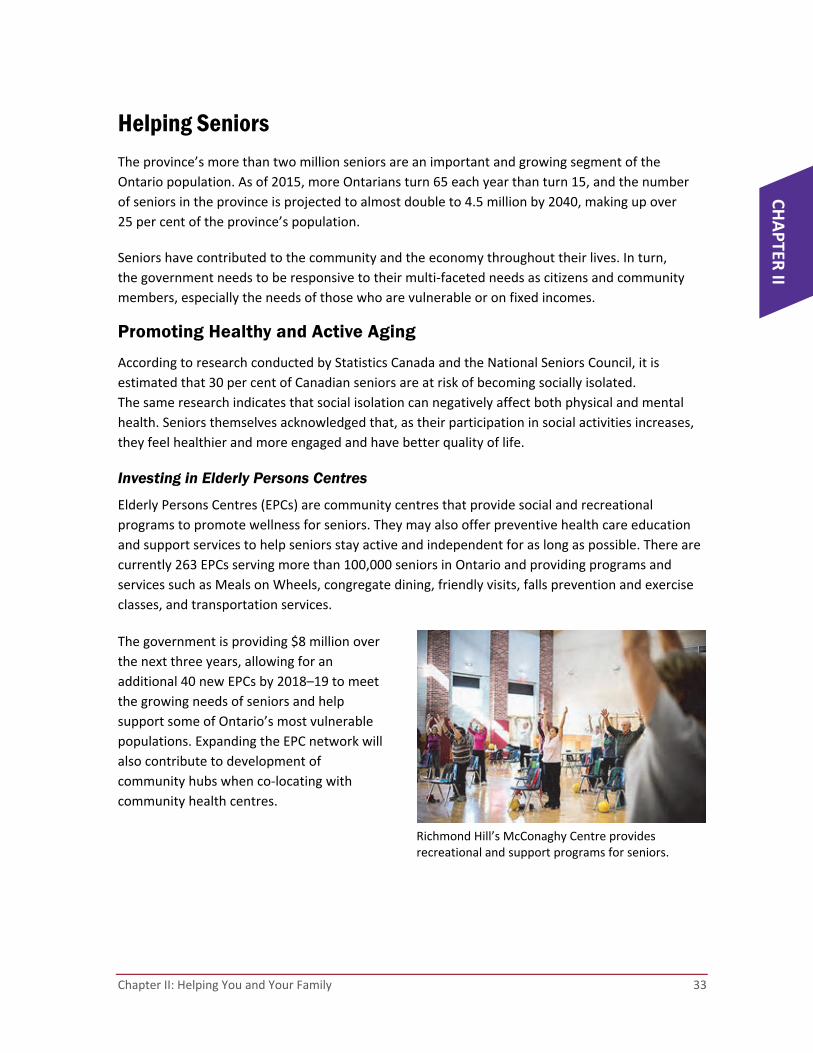
Chapter II: Helping You and Your Family 33
CHAPTER
II
Helping Seniors The province’s more than two million seniors are an important and growing segment of the
Ontario population. As of 2015, more Ontarians turn 65 each year than turn 15, and the number
of seniors in the province is projected to almost double to 4.5 million by 2040, making up over
25 per cent of the province’s population.
Seniors have contributed to the community and the economy throughout their lives. In turn,
the government needs to be responsive to their multi‐faceted needs as citizens and community
members, especially the needs of those who are vulnerable or on fixed incomes.
Promoting Healthy and Active Aging
According to research conducted by Statistics Canada and the National Seniors Council, it is
estimated that 30 per cent of Canadian seniors are at risk of becoming socially isolated.
The same research indicates that social isolation can negatively affect both physical and mental
health. Seniors themselves acknowledged that, as their participation in social activities increases,
they feel healthier and more engaged and have better quality of life.
Investing in Elderly Persons Centres
Elderly Persons Centres (EPCs) are community centres that provide social and recreational
programs to promote wellness for seniors. They may also offer preventive health care education
and support services to help seniors stay active and independent for as long as possible. There are
currently 263 EPCs serving more than 100,000 seniors in Ontario and providing programs and
services such as Meals on Wheels, congregate dining, friendly visits, falls prevention and exercise
classes, and transportation services.
The government is providing $8 million over
the next three years, allowing for an
additional 40 new EPCs by 2018–19 to meet
the growing needs of seniors and help
support some of Ontario’s most vulnerable
populations. Expanding the EPC network will
also contribute to development of
community hubs when co‐locating with
community health centres.
Richmond Hill’s McConaghy Centre provides recreational and support programs for seniors.

34 Chapter II: Helping You and Your Family
Ontario Seniors are Already Benefiting from the EPC Program
The Thunder Bay 55 Plus Centre’s programs include fitness, visual arts workshops, general interest classes, as well as sessions to learn about technology and computers.
The Beachcombers Senior Citizens’ Association (Ridgeway) organizes classes in computers, upholstery, dancing, quilting and more.
South Riverdale Community Health Centre and Harmony Hall (Toronto), also known as Call-A-Service Inc., empowers and connects seniors 55 and older by delivering transportation, recreational and support services in Bengali, Chinese, English and Tamil.
Rendez-vous des aînés francophones d’Ottawa (RAFO) is a francophone EPC with over 750 members and 230 volunteers. RAFO purchased a former elementary school to deliver its own programming, including a meal service and seasonal garden, while also renting out space to help support a wider range of programs and services.
Connecting Seniors with Community, Culture and Technology
The Seniors Community Grant (SCG) Program
aims to support small grassroots
organizations that work exclusively with
seniors. Since 2014, SCG funding has
supported 923 projects reaching
approximately 256,000 seniors.
Grants support social inclusion, learning,
volunteerism and community engagement.
The government will extend funding for the
program and provide an additional
$11 million over three years to support
facilities to help seniors engage socially,
volunteer and continue their lifelong learning.
Ontario’s Seniors Community Grant helps older adults stay involved, active and engaged in their communities.

Chapter II: Helping You and Your Family 35
CHAPTER
II
Seniors Community Grants Seniors Community Grants funded a wide range of activities, such as:
Senior volunteers led education sessions for groups of seniors on elder abuse prevention in Dutton (Elgin County).
Henvey Inlet First Nation supported a personal development and well-being elders circle geared towards physical, emotional, mental and spiritual health.
Giuseppe Garibaldi Seniors’ Club hosted multicultural music and dance events in collaboration with the Thornhill Senior Citizens Club, Filipino Seniors Club and First Chinese Senior Association of Vaughan.
The Heritage Green Family Council (Stoney Creek) purchased digital tablets for seniors to use as communication and educational tools in the nursing home.
The Kitchener-Waterloo Multicultural Centre held a workshop series for settlement workers to support immigrant seniors.
Lowering Public Transit Costs for Seniors
To help Ontario’s seniors participate in community life, the Province is committed to making public
transportation more affordable for them.
The government is proposing a new Ontario Seniors’ Public Transit Tax Credit for all Ontarians
aged 65 or older, covering eligible public transit costs as of July 1, 2017.
It would provide a refundable benefit of 15 per cent of eligible public transit costs, providing
an average annual benefit of $130.
Details about eligibility for the credit would be announced in time for the July 1 implementation
date.
Ensuring Sprinklers Are Installed in Licensed Retirement Homes
The Province is enhancing seniors’ safety by providing funding to small and rural retirement homes
to help with the cost of installing sprinklers, so that licensed retirement homes in Ontario are
compliant with the new requirements of the Fire Code by 2019.

36 Chapter II: Helping You and Your Family
Supporting Seniors’ Health As part of Ontario’s investments in health care this year, the Province will support seniors through
new innovative models to ensure patients are receiving care in the most appropriate setting
possible, within their community. Investments will support local solutions for new models of care
that avoid unnecessary hospital stays by leveraging other service providers, such as retirement
homes and supportive housing providers. For more information on the Province’s actions to help
ensure individuals are in appropriate care settings, please refer to Chapter IV, Section A:
Strengthening Health Care.
Vouchers A hospital stay after an acute episode, such as a fall or a bout of pneumonia, can take a toll on a senior who was previously living well in their community. Too often, a senior and their family must discuss whether to move into long-term care, since a return to independent living may seem unsafe during that difficult time.
In many jurisdictions, voucher programs are used to support delaying entry into long-term care. As a first step, the Province will explore a demonstration project through the Ministry of Health and Long-Term Care to offer seniors a new choice, such as accommodation vouchers for seniors who may no longer require hospital care after an acute episode. This accommodates those who wish to try a period of recovery and restoration in a more suitable environment.
Supporting Ontarians Affected by Dementia
In 2016, the Ontario government announced plans to develop a comprehensive new Dementia
Strategy and released a discussion paper3 to support the strategy’s development. An estimated
214,000 Ontarians now live with dementia; that number is expected to rise to 266,000 by 2022,
and to over 430,000 by 2038.4
The responsibility of caring for someone living with dementia can take an enormous physical,
emotional and financial toll on care partners — family members, friends and neighbours.
Nearly half of people living with Alzheimer’s or other dementias have caregivers who are
distressed. Caregivers may also have additional responsibilities, such as a job or a young family,
further adding to the physical, emotional and financial distress they experience.
3 Ontario Ministries of Health and Long‐Term Care and Education, Developing Ontario’s Dementia Strategy:
A Discussion Paper (September 2016). https://www.ontario.ca/page/developing‐ontarios‐dementia‐strategy‐discussion‐paper#section‐9
4 Ministry of Health and Long‐Term Care, Dementia Capacity Planning Project, 2017.

Chapter II: Helping You and Your Family 37
CHAPTER
II
Ontario’s new Dementia Strategy will provide more than $100 million over three years to support
people with dementia and those who care for them through better coordinated and enhanced
services. This will include funding to expand province‐wide access to community programs and
other investments to enhance access to care, information and support from as early as possible
once a diagnosis is made. The strategy will help patients and their caregivers find and access the
most appropriate care and supports and improve training and education in dementia care for
personal support workers, physicians, nurses and other front‐line workers.
The Province will invest an additional $20 million in 2017 for respite care. This builds on the 2016
investment to offer respite to the unpaid caregivers (family and friends) of seniors, people living
with dementia and other home care patients. This funding is used for personal support services or
nursing support at home, allowing caregivers to schedule breaks from the crucial work of caring
for a loved one. With these new investments in respite care, the Province’s three‐year investment
for respite care will total $120 million.
Community Investments
Since 2013, the government has increased its investment in home and community care by about
$250 million a year to fulfill the commitment outlined in “Patients First: A Roadmap to Strengthen
Home and Community Care.” Continuing this investment in 2017–18 will support more hours of
care for complex patients, much needed respite for caregivers, and the delivery of key
improvements in mental health and addiction services, health care for Indigenous populations,
and implementation of a dementia strategy in Ontario, among other priorities.
Increasing Investments in Long-Term Care
Long‐term care (LTC) homes provide residential care and support to some of Ontario’s most
vulnerable citizens, including seniors with complex care needs such as dementia and multiple
medical conditions. In 2017, an additional $58 million, representing a two per cent increase,
will be invested in resident care.
Funding will also be provided to expand the exemplary work already underway in the long‐term
care sector to improve access to training and supports for quality palliative and end‐of‐life care in
long‐term care homes. This investment will support the care that loved ones deserve, and provide
comfort and dignity towards the end of life.

38 Chapter II: Helping You and Your Family
The government will increase the food allowance by over six percent this year, or $15 million,
to ensure that LTC homes can provide nutritious menus that are responsive to medical and
ethno‐cultural needs.
Behavioural Supports Ontario (BSO) BSO provides specialized supports and services to meet the needs of older people with cognitive impairments who exhibit challenging and complex behaviours, wherever they live. With a new $10-million investment in 2017–18, the total BSO commitment is now $64 million, representing a $20-million increase in the past two years. The Province is working towards the goal of a BSO resource in every long-term care home in Ontario.
The Province is encouraging operators to accelerate the redevelopment of more than 30,000 LTC
beds by 2025. Growth in the demand for LTC beds continues to outpace existing supply. The
Province will undertake planning and modernize its approach to provide better services to seniors
who require long‐term care.
In the past year, the Province announced plans to fund the redevelopment of 963 LTC beds in the
communities listed below:
100 in Aylmer;
120 in Brampton;
95 in Cambridge;
69 in Iroquois Falls;
72 in Mattawa;
96 in Mount Forest;
160 in Niagara‐on‐the‐Lake;
59 in Quinte West;
32 in Stouffville; and
160 in Whitby.
The government is committed to ensuring that all LTC home operators provide safe, quality care
for residents and their families. While the vast majority of LTC homes are consistently in
compliance, Ontario is strengthening its quality and safety inspection program. In January 2017,
the government announced new enforcement tools to include fees and penalties for operators
with repeated non‐compliance issues. These enforcement changes will require legislative and
regulatory amendments.

Chapter II: Helping You and Your Family 39
CHAPTER
II
Expanding Seniors’ Access to Affordable Drugs
Every year, an additional 30,000 seniors will become eligible for lower out‐of‐pocket drug costs.
As announced in the 2016 Budget, the government expanded access to the Seniors Co‐Payment
Program by raising the income threshold level to allow more seniors to qualify.
Ontario is the first jurisdiction in Canada to provide the shingles vaccine free of charge to seniors 65 to 70 years of age, saving approximately 850,000 eligible seniors about $170 each. Helping seniors stay healthy also reduces emergency room visits and hospital stays.
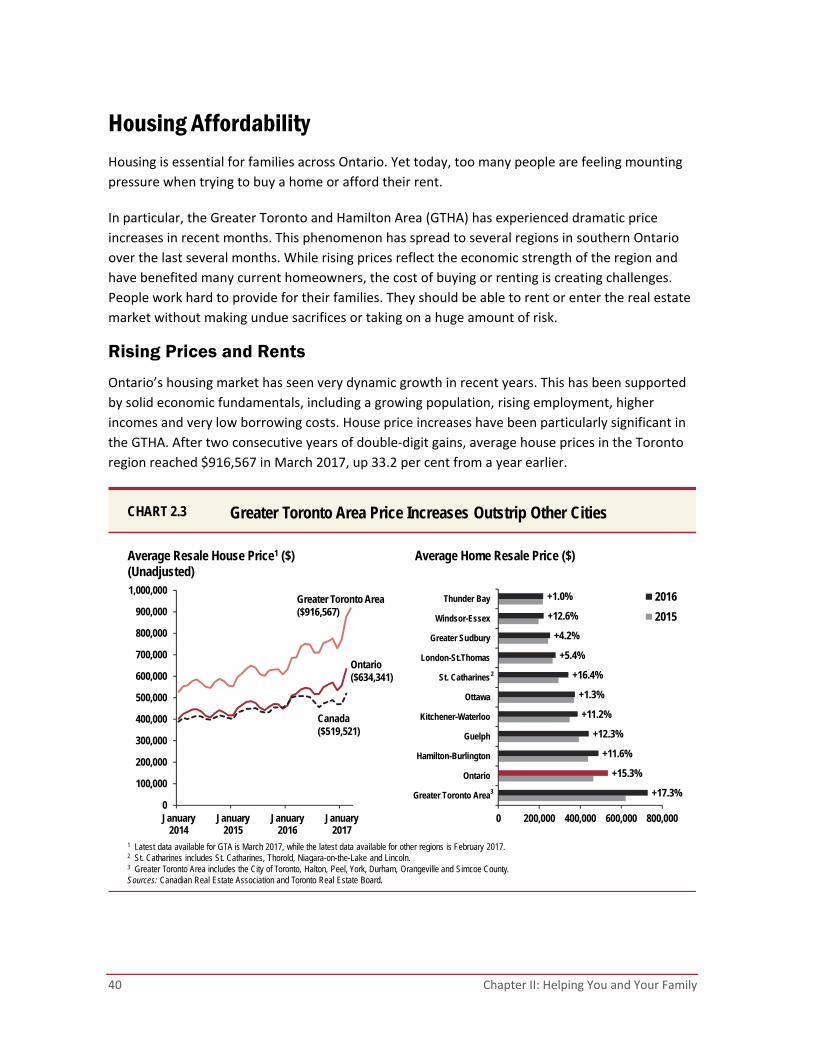
40 Chapter II: Helping You and Your Family
Housing Affordability Housing is essential for families across Ontario. Yet today, too many people are feeling mounting
pressure when trying to buy a home or afford their rent.
In particular, the Greater Toronto and Hamilton Area (GTHA) has experienced dramatic price
increases in recent months. This phenomenon has spread to several regions in southern Ontario
over the last several months. While rising prices reflect the economic strength of the region and
have benefited many current homeowners, the cost of buying or renting is creating challenges.
People work hard to provide for their families. They should be able to rent or enter the real estate
market without making undue sacrifices or taking on a huge amount of risk.
Rising Prices and Rents
Ontario’s housing market has seen very dynamic growth in recent years. This has been supported
by solid economic fundamentals, including a growing population, rising employment, higher
incomes and very low borrowing costs. House price increases have been particularly significant in
the GTHA. After two consecutive years of double‐digit gains, average house prices in the Toronto
region reached $916,567 in March 2017, up 33.2 per cent from a year earlier.
Greater Toronto Area Price Increases Outstrip Other CitiesCHART 2.3
1 Latest data available for GTA is March 2017, while the latest data available for other regions is February 2017.2 St. Catharines includes St. Catharines, Thorold, Niagara-on-the-Lake and Lincoln.3 Greater Toronto Area includes the City of Toronto, Halton, Peel, York, Durham, Orangeville and Simcoe County. Sources: Canadian Real Estate Association and Toronto Real Estate Board.
0
100,000
200,000
300,000
400,000
500,000
600,000
700,000
800,000
900,000
1,000,000
January2014
January2015
January2016
January2017
+17.3%
+15.3%
+11.6%
+12.3%
+11.2%
+1.3%
+16.4%
+5.4%
+4.2%
+12.6%
+1.0%
0 200,000 400,000 600,000 800,000
Greater Toronto Area
Ontario
Hamilton-Burlington
Guelph
Kitchener-Waterloo
Ottawa
St. Catharines
London-St.Thomas
Greater Sudbury
Windsor-Essex
Thunder Bay 2016
2015
Average Home Resale Price ($)Average Resale House Price1 ($)(Unadjusted)
Greater Toronto Area($916,567)
Ontario($634,341)
Canada($519,521)
3
2
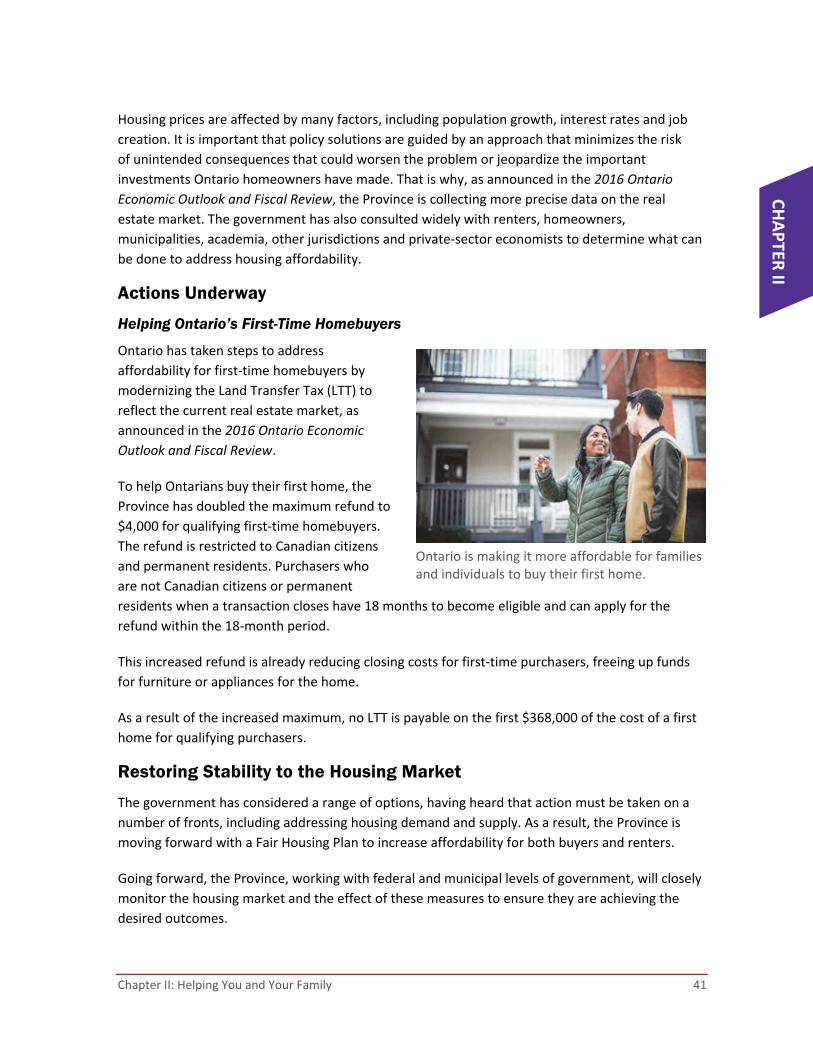
Chapter II: Helping You and Your Family 41
CHAPTER
II
Housing prices are affected by many factors, including population growth, interest rates and job
creation. It is important that policy solutions are guided by an approach that minimizes the risk
of unintended consequences that could worsen the problem or jeopardize the important
investments Ontario homeowners have made. That is why, as announced in the 2016 Ontario
Economic Outlook and Fiscal Review, the Province is collecting more precise data on the real
estate market. The government has also consulted widely with renters, homeowners,
municipalities, academia, other jurisdictions and private‐sector economists to determine what can
be done to address housing affordability.
Actions Underway
Helping Ontario’s First-Time Homebuyers
Ontario has taken steps to address
affordability for first‐time homebuyers by
modernizing the Land Transfer Tax (LTT) to
reflect the current real estate market, as
announced in the 2016 Ontario Economic
Outlook and Fiscal Review.
To help Ontarians buy their first home, the
Province has doubled the maximum refund to
$4,000 for qualifying first‐time homebuyers.
The refund is restricted to Canadian citizens
and permanent residents. Purchasers who
are not Canadian citizens or permanent
residents when a transaction closes have 18 months to become eligible and can apply for the
refund within the 18‐month period.
This increased refund is already reducing closing costs for first‐time purchasers, freeing up funds
for furniture or appliances for the home.
As a result of the increased maximum, no LTT is payable on the first $368,000 of the cost of a first
home for qualifying purchasers.
Restoring Stability to the Housing Market
The government has considered a range of options, having heard that action must be taken on a
number of fronts, including addressing housing demand and supply. As a result, the Province is
moving forward with a Fair Housing Plan to increase affordability for both buyers and renters.
Going forward, the Province, working with federal and municipal levels of government, will closely
monitor the housing market and the effect of these measures to ensure they are achieving the
desired outcomes.
Ontario is making it more affordable for families and individuals to buy their first home.
42 Chapter II: Helping You and Your Family
Non-Resident Speculation Tax
Ontario’s economy benefits greatly from newcomers who decide to make the province home.
The government is concerned that non‐resident investors — who are not planning on living in the
province — have been purchasing Ontario homes primarily for speculation purposes. On April 20,
2017, the Province proposed a new 15 per cent tax on the price of homes in the Greater Golden
Horseshoe (GGH) purchased by individuals who are not citizens or permanent residents of Canada
or by foreign corporations.
The proposed Non‐Resident Speculation Tax (NRST) would apply to transfers of land that contains
at least one and not more than six single family residences. The NRST would not apply to
purchases of other types of properties, including multi‐residential rental apartment buildings,
agricultural land or commercial land.
If passed, the proposed NRST would be effective as of April 21, 2017. Legislation to implement the
tax would allow for expansion to other regions of the province, if warranted by market conditions.
Binding agreements of purchase and sale signed on or before April 20, 2017 would not be subject
to the NRST.
Refugees and nominees under the Ontario Immigrant Nominee Program would not be subject
to the NRST. Subject to eligibility requirements, a rebate would be available for those who
subsequently attain citizenship or permanent resident status as well as foreign nationals working
in Ontario and international students. Further details on the NRST are available in the bulletin
posted on the Ministry of Finance website.5
Improving Transparency and Reducing Tax Avoidance in Pre-Sale Agreements
“Paper flipping” refers to the practice of entering into a contractual agreement to buy a residential
unit and assigning it to another person prior to closing. It can also refer to arrangements in which
one party substitutes another party in a contract to buy a residential unit. This practice may be
contributing to tax avoidance and excessive speculation in the housing market.
To better understand the extent of the problem, the government will require information about
assignments of agreements and similar arrangements through the Land Transfer Tax (LTT) system.
At the time the transfer is registered and LTT is payable, purchasers would be required to declare
whether they entered the agreement by way of assignment or another similar arrangement.
Information gathered through this declaration would assist the Ministry of Finance in ensuring that
the correct amount of tax is paid. For example, any consideration for an assignment should be
included as part of the value of the consideration used to calculate the LTT amount.
Additional details about the changes will be made available in the coming months.
5 http://www.fin.gov.on.ca/en/bulletins/nrst/nrst.html

Chapter II: Helping You and Your Family 43
CHAPTER
II
Ontario also intends to work with the federal government to explore more comprehensive
reporting requirements related to paper flipping. This would better enable the Ministry of Finance
and the Canada Revenue Agency to ensure that the correct federal and provincial taxes, including
income and sales taxes, are paid on purchases and sales of real estate in Ontario.
Increasing Housing Affordability in the Rental Market
The government proposes to improve rent control in Ontario to help strengthen protections for
tenants and keep costs affordable. The Province is proposing to expand rent control to all private
rental units, including those occupied on or after November 1, 1991.
The Province also proposes to:
Create a standard lease to help both tenants and landlords know their rights and
responsibilities, while reducing the number of disputes;
Protect tenants from eviction resulting from abuse of the “landlord’s own use” provision;
Prevent landlords from pursuing former tenants for unauthorized charges;
Delay above‐guideline rent increases until elevator maintenance orders are addressed; and
Remove above‐guideline rent increases for utilities to protect tenants from the cost of
carbon pricing and encourage landlords to make their buildings more energy efficient.
Expanding rent control and strengthening protections for tenants is one part of the government’s
plan to address rising housing costs and ensure that all Ontarians have a safe, suitable and
affordable place to call home.
Incenting the Development of New Apartment Buildings
To further encourage the development of purpose‐built rental buildings, the government will
rebate a portion of development charges for eligible new multi‐residential projects. This rebate
program will provide $125 million over five years for eligible projects.
Development charges are upfront fees that represent a significant portion of construction costs,
and some developers have suggested that they can be a barrier to the development of new
purpose‐built rental housing. The rebate program will be scoped to target projects that would
not have proceeded in the absence of this incentive.
Municipalities that opt to participate could help tailor the design of the program to meet the
needs of their communities. For example, eligible projects could include those that meet key
criteria such as affordability and providing an appropriate mix of unit types. Working with
municipalities, the Province will also target projects in those communities that are most in need
of new purpose‐built rental housing.

44 Chapter II: Helping You and Your Family
Improving the Fairness of the Property Taxation of Apartment Buildings
The government has heard concerns about the significantly higher property tax burden for
multi‐residential apartment buildings and its effect on housing affordability.
The property tax levied on owners of multi‐residential apartment buildings is generally reflected
in rents paid by tenants. This has implications for rental affordability, as the average municipal
property tax burden on apartment buildings is more than double that of other residential
properties, such as condominiums. This higher tax burden is particularly concerning given the
lower average incomes of tenants in apartment buildings.
As a first step in addressing these concerns, the government has frozen the municipal property tax
burden for multi‐residential properties in communities where these taxes are high. A review of the
potential implications of multi‐residential property taxation on rent affordability is also underway.
As part of this review, the government is consulting with affected stakeholders, including
municipalities, tenants and apartment building owners.
Based on early feedback received during this review, the government will ensure that new
multi‐residential apartment developments will be taxed in a way that parallels the taxation of
other residential properties to support and encourage the development of new purpose‐built
rental units.
The Province already provides municipalities with the option to tax new multi‐residential
apartments at a rate similar to other residential properties. Many municipalities have adopted this
option, and in order to ensure a consistent approach across Ontario, the Province will make this
lower tax level mandatory. This measure will further support and encourage development of new
multi‐residential apartment units.
This change will not result in any loss of existing municipal tax revenues, as it will apply only
to newly constructed apartments. Moreover, municipalities will levy property taxes on
these properties using the same tax rate that would have applied if they had been developed
as condominiums.
Chapter II: Helping You and Your Family 45
CHAPTER
II
Vacant Homes Property Tax
The government understands the concerns that have been raised about residential units
potentially being left vacant by speculators while many people are looking for housing they
can afford. The City of Toronto has identified a tax on vacant homes as a tool that should be
considered. A vacant home tax could help encourage property owners to sell unoccupied units
or make them available to be rented. This could, in turn, increase housing supply and help
promote affordability.
For this reason, the government is proposing amendments to legislation that would grant Toronto
broad authority to levy an additional property tax on vacant homes. Under this approach, the City
would be responsible for the detailed design, implementation and administration of the tax.
The government will also work with other interested municipalities that are experiencing issues
with homes being left vacant as a result of speculation.
Unlocking Housing Development
The government will also work with municipalities to ensure they have the tools they need to help
encourage the supply of new housing. This could include providing municipalities with the
flexibility to use property tax tools to assist with unlocking development opportunities, such as
imposing a higher tax on vacant land which has been approved and serviced for new housing.
This initiative would complement additional Provincial efforts to streamline the development
approvals process and help bring new housing to market more rapidly.
Supportive Growth Planning
The Province has been working with municipalities across the GTHA, and data shows that there
is enough serviced land and units ready to be built to meet the requirements of Provincial policy.
The Growth Plan for the Greater Golden Horseshoe, together with the Greenbelt Plan, is designed
to help manage the significant growth coming to this region. It already plans for enough land and a
range of housing types to accommodate growth, and directs it to existing built‐up areas and to
where transit can best serve all residents and businesses. To better reflect the needs of a growing
region, new provisions will require municipalities to consider the appropriate range of, and unit
sizes in, apartments, condominiums and townhouses to accommodate a diverse range of
household sizes and incomes. This will directly support building more of the affordable “missing
middle” housing for which people are looking. Ontario continues to work with municipalities on
their Housing and Homelessness Plans to ensure a complete range of housing options are provided
in communities.

46 Chapter II: Helping You and Your Family
Streamlining Approvals
To help unlock development opportunities where the regulatory approvals process or other
barriers are slowing housing development from coming to market, the government is creating a
special “Residential Land Development Facilitation Team” to help all parties come to the table and
find solutions to build housing in places where it is approved and makes the most sense. As part of
this effort, over the coming months Provincial officials will fast‐track efforts with developers and
municipalities to review the development approvals process and recommend ways that
stakeholders can work together to responsibly streamline it.
Additional Land Use Planning Reforms
The government is also making a number of reforms to the land use planning system to make
it more efficient, more transparent and easier to build needed housing, including some long
overdue reforms that will be proposed to the Ontario Municipal Board. Legislation has been
passed to allow municipalities to bring in inclusionary zoning programs to increase the supply of
affordable housing units and to support the creation of secondary suites or apartments in existing
homes. This work includes consulting on potential regulatory changes to the Building Code —
an important way to bring more rental units into the market and help homeowners with their
mortgage costs.

Chapter II: Helping You and Your Family 47
CHAPTER
II
Consumer Protection Consumer protection is increasingly important as individuals assume growing responsibility for
their own financial security. Ontarians relying on the financial services industry deserve a strong
regulatory framework to protect their interests.
Strengthening Financial Services and Pension Regulation
The government is committed to establishing a new, flexible and innovative financial services and
pension regulator that will strengthen consumer, investor and pension plan beneficiary protection,
and is taking key steps to begin the transition to a new regulatory authority.
In December 2016, the Financial Services Regulatory Authority of Ontario Act, 2016 (FSRA Act) was
passed, establishing the initial parameters of the new regulator. The government’s next step will
be appointing a board of directors to oversee the management of FSRA’s affairs as it builds its
regulatory capacity. The government expects to appoint a board in spring 2017.
The government will also continue to consult with stakeholders and review recommendations
from the expert advisory panel that recommended the creation of FSRA. This work will inform
the development of FSRA’s mandate and governance structure, as well as the structure and
powers of the Financial Services Tribunal (FST). Legislative amendments regarding these priorities
are expected to be introduced by the end of 2017. In the interim, the government is introducing
legislative amendments that would enable the FST to manage its caseload more efficiently.
The government also intends to transfer responsibility for the incorporation of cooperative
corporations from the Financial Services Commission of Ontario (FSCO) to the Ministry of
Government and Consumer Services (MGCS). This change is intended to consolidate the
incorporation process for cooperatives with those currently in place for other types of Ontario
businesses. It is expected that MGCS would begin incorporating cooperative corporations in 2018.
In addition, the government plans to transfer regulatory oversight of syndicated mortgage
investments from FSCO to the securities regulator. This is consistent with both the expert advisory
panel’s report and the manner in which these products are regulated in other provinces.
Going forward, the government will work with regulators to plan an orderly transfer of the
oversight of these products.
In advance of the transfer, the government is taking action to strengthen protections for investors
in syndicated mortgages. New regulations would establish investment limits on these products
and require mortgage brokerages to document their assessments of the suitability of such
products for their clients. FSCO would also expand requirements relating to information provided
by mortgage brokerages to ensure that investors are aware of the potential risks associated with
these types of investments.
48 Chapter II: Helping You and Your Family
Strengthening Consumer Protection for Owners of Newly Built Homes
Ontario has released the final report from the Honourable J. Douglas Cunningham, QC on the
Ontario New Home Warranties Plan Act and the Tarion Warranty Corporation, and will move
forward to further protect owners of newly built homes across the province.
To improve consumer protection, accountability, transparency and board governance,
Ontario proposes to:
Make the dispute resolution process easier for homeowners if they discover a problem in
the construction of their new home;
Separate the provider of the new home warranty program from the new home builders
regulator to increase consumer confidence; and
Give the government responsibility in making rules, setting standards and introducing
modern oversight measures to improve accountability and transparency.
The government has asked Tarion to introduce new deposit protection measures to better reflect
today’s home prices and deposit requirements.
Regulation of Financial Planning
To ensure that Ontarians have access to services that will help them reach their financial goals,
the government appointed an independent expert committee in 2015 to review the regulatory
framework relating to financial planning and advisory services.
In March 2017, the government released the expert committee’s final report. Its
recommendations represent an opportunity to strengthen consumer protection and the quality of
information available to individuals as they make decisions essential to their long‐term financial
well‐being.
The government is considering the report’s recommendations in the context of the ongoing
transformation of Ontario’s financial services regulatory system. Elements of this transformation
include efforts to increase harmonization across the country through the Cooperative Capital
Markets Regulatory System (CCMR) and plans to improve consumer, investor and pension plan
beneficiary protection through a new regulatory authority.
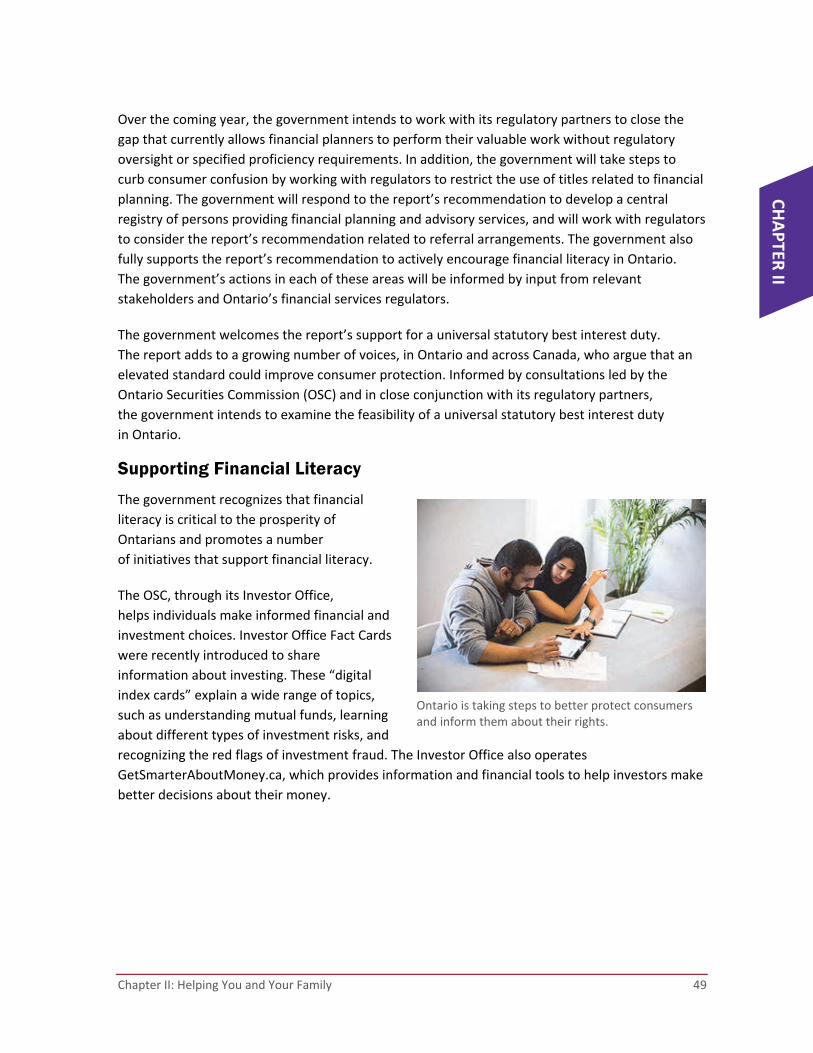
Chapter II: Helping You and Your Family 49
CHAPTER
II
Over the coming year, the government intends to work with its regulatory partners to close the
gap that currently allows financial planners to perform their valuable work without regulatory
oversight or specified proficiency requirements. In addition, the government will take steps to
curb consumer confusion by working with regulators to restrict the use of titles related to financial
planning. The government will respond to the report’s recommendation to develop a central
registry of persons providing financial planning and advisory services, and will work with regulators
to consider the report’s recommendation related to referral arrangements. The government also
fully supports the report’s recommendation to actively encourage financial literacy in Ontario.
The government’s actions in each of these areas will be informed by input from relevant
stakeholders and Ontario’s financial services regulators.
The government welcomes the report’s support for a universal statutory best interest duty.
The report adds to a growing number of voices, in Ontario and across Canada, who argue that an
elevated standard could improve consumer protection. Informed by consultations led by the
Ontario Securities Commission (OSC) and in close conjunction with its regulatory partners,
the government intends to examine the feasibility of a universal statutory best interest duty
in Ontario.
Supporting Financial Literacy
The government recognizes that financial
literacy is critical to the prosperity of
Ontarians and promotes a number
of initiatives that support financial literacy.
The OSC, through its Investor Office,
helps individuals make informed financial and
investment choices. Investor Office Fact Cards
were recently introduced to share
information about investing. These “digital
index cards” explain a wide range of topics,
such as understanding mutual funds, learning
about different types of investment risks, and
recognizing the red flags of investment fraud. The Investor Office also operates
GetSmarterAboutMoney.ca, which provides information and financial tools to help investors make
better decisions about their money.
Ontario is taking steps to better protect consumers and inform them about their rights.

50 Chapter II: Helping You and Your Family
The Financial Services Commission of Ontario also undertakes a number of activities to promote
financial literacy. In November 2016, FSCO’s Financial Literacy Month campaign included a focus
on increasing knowledge about mortgages among first‐time homebuyers aged 25 to 34. As part of
this campaign, FSCO conducted a survey that showed this demographic has limited knowledge of
the risks associated with mortgages. FSCO also operates an “Understanding Mortgages” website6
that provides useful tips to consumers on shopping and applying for a mortgage.
Ontario is partnering with educators on pilot projects across the province to revise the current
career studies course and help students develop the skills they need to compete, including those
relating to financial literacy. For more information, please refer to Chapter IV, Section B: Investing
in Education.
Strengthening Investor Protection
Effective enforcement is essential to any reliable regulatory regime. The government plans
to propose legislative changes that would improve enforcement of investment industry
self‐regulatory organizations’ (SROs) decisions, by allowing these decisions to be filed with the
court. This measure will improve SROs’ ability to collect fines levied against individuals, helping to
deter potential offenders and increasing funds available to the SROs for strengthening
investor protection.
6 www.fsco.gov.on.ca/en/understanding‐mortgages

Chapter II: Helping You and Your Family 51
CHAPTER
II
Improving Auto Insurance
The government continues to make auto
insurance more affordable for Ontario’s
almost 10 million drivers, while protecting
consumers and ensuring that people hurt in
auto accidents get the medical treatment they
need. Currently, Ontarians are protected by
the most generous accident benefit coverage
of any comparable jurisdiction in Canada.
Reforms implemented since 2013 and other
cost‐reduction strategies have resulted in
significantly lower auto insurance rates
and are expected to deliver further rate
reductions as insurance policies continue to be renewed through 2017.
Recent auto insurance system reforms include:
Requiring insurers to offer a discount for the use of winter tires.
Creating a new dispute resolution system to help Ontario claimants get faster access to the benefits they need.
Prohibiting premium increases for minor at-fault accidents.
Lowering the maximum interest rate charged on monthly premium payments.
While rates have decreased, the Province recognizes that more can be done to make the system
more efficient and affordable. This year, drivers will benefit from the option of using electronic
proof of insurance. This will allow drivers to confirm their proof of insurance through their mobile
device, instead of the current paper “pink slips” issued by insurance companies. When using this
option, drivers will no longer need to replace a paper copy of their proof of insurance each time
they renew their auto insurance policies.
Distributing documents electronically, including proof of insurance and other documents such
as policy renewals, will enhance consumer convenience and result in savings for insurance
companies. To ensure that these savings are passed along to the consumer, the government
will require that insurers offer a discount to policyholders who choose to receive
documents electronically.
Drivers with winter tires can have their auto insurance rates cut by two to five per cent.
52 Chapter II: Helping You and Your Family
Long-Term Changes to the System
Over the long term, the government remains committed to finding ways to continue to lower auto
insurance rates and improve health outcomes for victims of auto accidents without reducing
benefits. While the Province has made significant reforms to auto insurance, there is a concern
that the current structure may allow individual players to profit unfairly or for fraud to occur.
Recognizing this, the Minister of Finance tasked David Marshall, former president and chief
executive officer of the Workplace Safety and Insurance Board, and now advisor to the
government on auto insurance and pensions, with examining the auto insurance system and
providing recommendations to improve health outcomes for accident victims and make auto
insurance more affordable for all Ontario drivers.
The report was posted on April 11, 2017.7
These recommendations propose a wide‐scale transformation of the current system to deliver
better outcomes for accident victims while creating a more efficient and cost‐effective system.
The recommendations aim to:
Ensure that people hurt in auto accidents receive the care they need to recover in a timely
manner through new evidence‐based mandatory programs of care designed to treat
all injuries;
Establish independent medical evaluation centres to minimize the likelihood that accident
victims are drawn into the dispute process; and
Allow more competition and innovation in auto insurance that is more responsive to the
needs of consumers and changing market conditions, while ensuring strong oversight by
the regulator.
The government is reviewing the recommendations and will be hosting consultations in the
coming months.
7 http://www.fin.gov.on.ca/en/autoinsurance/fair‐benefits.html
Chapter II: Helping You and Your Family 53
CHAPTER
II
Protecting Ride-Sharing Consumers and Drivers
The government is modernizing auto insurance in Ontario to be more responsive to changes
in consumer preferences and provide greater choice and protection for drivers and consumers
participating in ride‐sharing.
Ride‐sharing enables privately owned vehicles to be used for other purposes. This means that
the auto insurance system needs to be more flexible in accommodating this innovation to further
promote competition and consumer choice in the market.
Recognizing that Ontarians were not adequately protected, the government took immediate steps
last year to enable auto insurance coverage for ride‐sharing participants, including drivers and
passengers of ride‐sharing companies including Uber, RideCo and Turo.
The government is now seeking advice from a working group that includes representatives from
FSCO and the insurance industry. This working group is examining a number of issues relating to
ride‐sharing and associated services, including the interaction of multiple policies. The government
looks forward to receiving the working group’s advice.

54 Chapter II: Helping You and Your Family

creating opportunities and securitY
chapter iii

Chapter III: Creating Opportunities and Security 57
CHAPTER
III
Introduction Over the past three years, Ontario has been a leader in economic growth in Canada and the G7
countries. While private‐sector economists expect Ontario to remain one of the fastest growing
provinces over the next two years, there are challenges, and opportunities, facing the economy.
The population of Ontario, like many parts of the world, is aging, and it is growing at a slower pace
than it has in the past. The impact this will have on the working‐age population places increasing
importance on enhancing the skills and productivity of workers in the province. Businesses also
face challenges from global competition and technological advancement; however, these changes
will open the doors for new markets and jobs. The government is preparing for tomorrow through
the investments it is making today.
The Province is creating opportunities for people to find jobs and for business to grow and prosper
in the new economy by developing a highly skilled workforce, investing in infrastructure,
supporting business innovation and growth, and expanding exports. The government will ensure
these opportunities are available in all regions of the province, fostering an environment of
inclusive growth where everyone will benefit from, and contribute to, Ontario’s prosperity.
Investing in People Today Every Ontarian deserves the opportunity to achieve their full potential and develop the skills they
need to succeed in the modern, knowledge‐based economy.
Ontario’s people have always been its strength, and building their talent and skills is at the heart
of Ontario’s economic plan. The Province is making significant investments in education, from
full‐day kindergarten to postsecondary education, adult education and skills training. These
investments will help people prosper and help Ontario maintain the competitive advantage of a
highly skilled workforce. In 2016, 68 per cent of adults in Ontario had a postsecondary credential,
up from 56 per cent in 2002 — higher than rates for any country in the Organisation for Economic
Co‐operation and Development.
By further strengthening education and training, the government is ensuring all Ontarians are
equipped with the skills and competencies they need to find meaningful work, adapt to changing
technologies, build skills to grow in their careers and contribute to their communities.
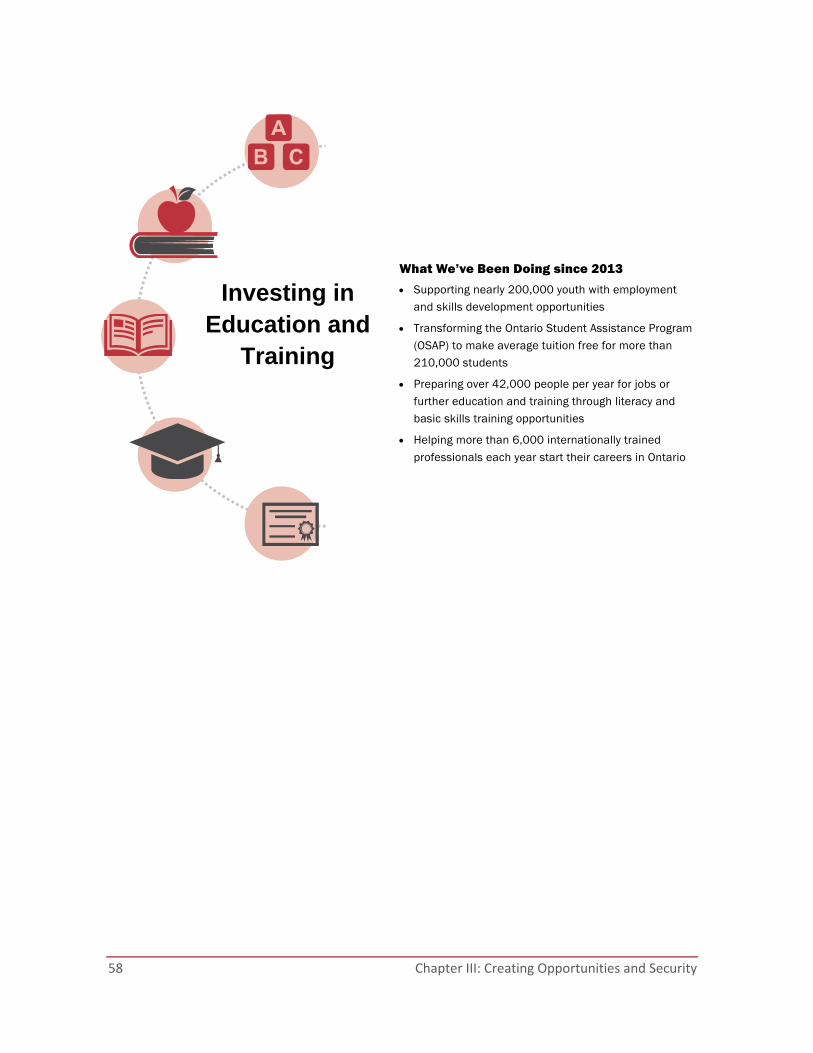
58 Chapter III: Creating Opportunities and Security
What We’ve Been Doing since 2013
Supporting nearly 200,000 youth with employment and skills development opportunities
Transforming the Ontario Student Assistance Program (OSAP) to make average tuition free for more than 210,000 students
Preparing over 42,000 people per year for jobs or further education and training through literacy and basic skills training opportunities
Helping more than 6,000 internationally trained professionals each year start their careers in Ontario
Investing in Education and
Training
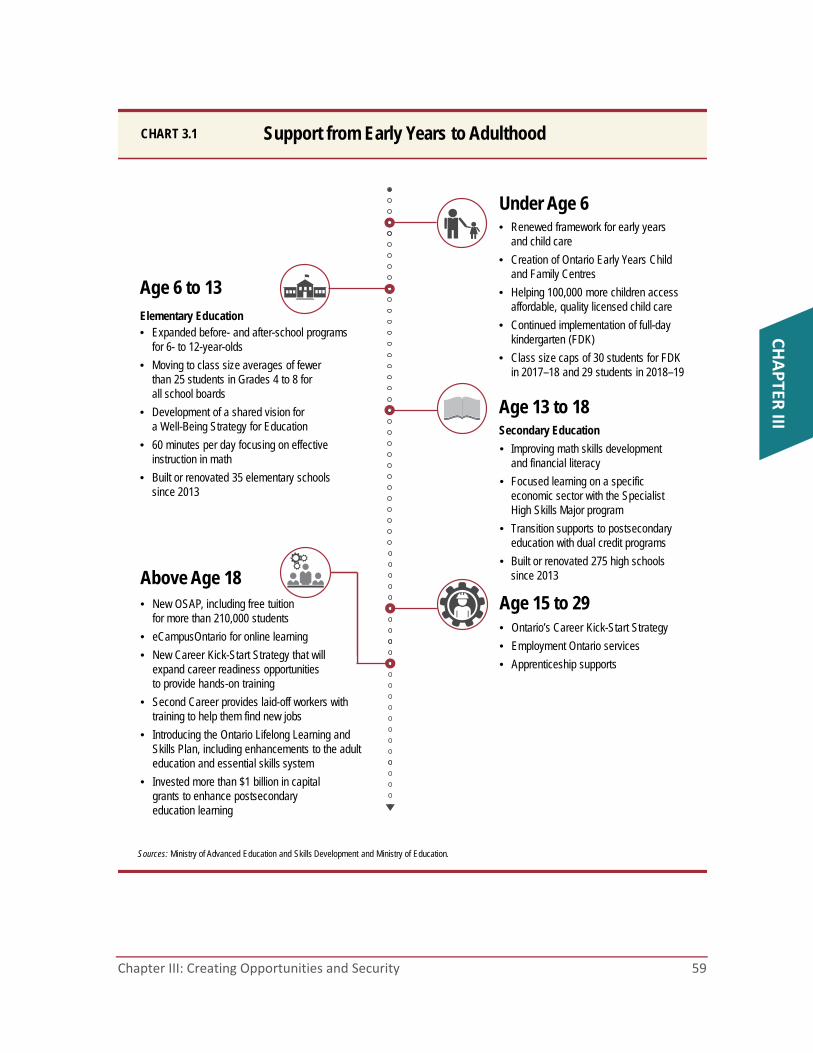
Chapter III: Creating Opportunities and Security 59
CHAPTER
III
Support from Early Years to AdulthoodCHART 3.1
Sources: Ministry of Advanced Education and Skills Development and Ministry of Education.
Above Age 18
Elementary Education• Expanded before- and after-school programs
for 6- to 12-year-olds
• Moving to class size averages of fewer than 25 students in Grades 4 to 8 for all school boards
• Development of a shared vision for a Well-Being Strategy for Education
• 60 minutes per day focusing on effective instruction in math
• Built or renovated 35 elementary schools since 2013
Age 6 to 13
Under Age 6
Age 13 to 18
Age 15 to 29
• Renewed framework for early years and child care
• Creation of Ontario Early Years Child and Family Centres
• Helping 100,000 more children access affordable, quality licensed child care
• Continued implementation of full-day kindergarten (FDK)
• Class size caps of 30 students for FDK in 2017–18 and 29 students in 2018–19
Secondary Education
• Improving math skills development and financial literacy
• Focused learning on a specific economic sector with the Specialist High Skills Major program
• Transition supports to postsecondary education with dual credit programs
• Built or renovated 275 high schools since 2013
• Ontario’s Career Kick-Start Strategy
• Employment Ontario services
• Apprenticeship supports
• New OSAP, including free tuition for more than 210,000 students
• eCampusOntario for online learning
• New Career Kick-Start Strategy that will expand career readiness opportunities to provide hands-on training
• Second Career provides laid-off workers with training to help them find new jobs
• Introducing the Ontario Lifelong Learning and Skills Plan, including enhancements to the adult education and essential skills system
• Invested more than $1 billion in capital grants to enhance postsecondary education learning

60 Chapter III: Creating Opportunities and Security
Investing in People’s Talents and Skills
Globalization and new technology are changing the nature
of work in Ontario. Changes include increased demand for
highly skilled workers; declining shares of middle‐skill and
middle‐paying jobs; growth in alternative forms of
employment, such as contract and part‐time work; and a
shift from goods‐producing to service industries.
As Ontario’s economy becomes more technology‐driven
and knowledge‐based, the province’s competitiveness and
prosperity depend increasingly on a highly skilled
workforce. The government is focusing on getting people
the skills they need, targeting support for those entering
the labour market and those who face barriers to success
or need support in meeting the demands of a changing economy.
Through Ontario’s Highly Skilled Workforce (HSW) Strategy, people of all abilities and backgrounds
can develop their talents, knowledge and skills to benefit from, and contribute to, an evolving
economy. The strategy will provide people with opportunities across the continuum of learning —
from Grades K–12, to apprenticeship and postsecondary education — as well as skills
development and lifelong learning for both unemployed workers and those active in the labour
market, but looking to acquire new skills. High‐quality education and training directly contribute to
a better quality of life for Ontarians.
To guide the implementation of this strategy, including advice on how to support those impacted
by new technology in the workplace, the government will be bringing together employers,
educators, labour and other stakeholders as part of a Planning and Partnership Table.
The Province will also be investing in providing labour market information through a new website
to help individuals and employers make decisions, such as choosing a career, developing
educational and training programs, or undertaking workforce planning.
The government will be partnering with labour unions and employers to support sectoral training. For example, the government will work with SEIU Healthcare to explore options around the creation of a training program and facility for the ongoing skills development of Personal Support Workers (PSW), who are critical in the delivery of home care services across the province.
1 http://www.ontla.on.ca/committee‐proceedings/committee‐reports/files_html/ pre‐budget%20consultation%202017%20report%20english%20‐%20final.htm
The Standing Committee on Finance and Economic Affairs (SCFEA)
recommended1 that the Minister of Finance commit to:
Continue to invest in a highly skilled workforce strategy to broaden labour force participation and improve productivity.
Improve the quality and availability of labour market information.
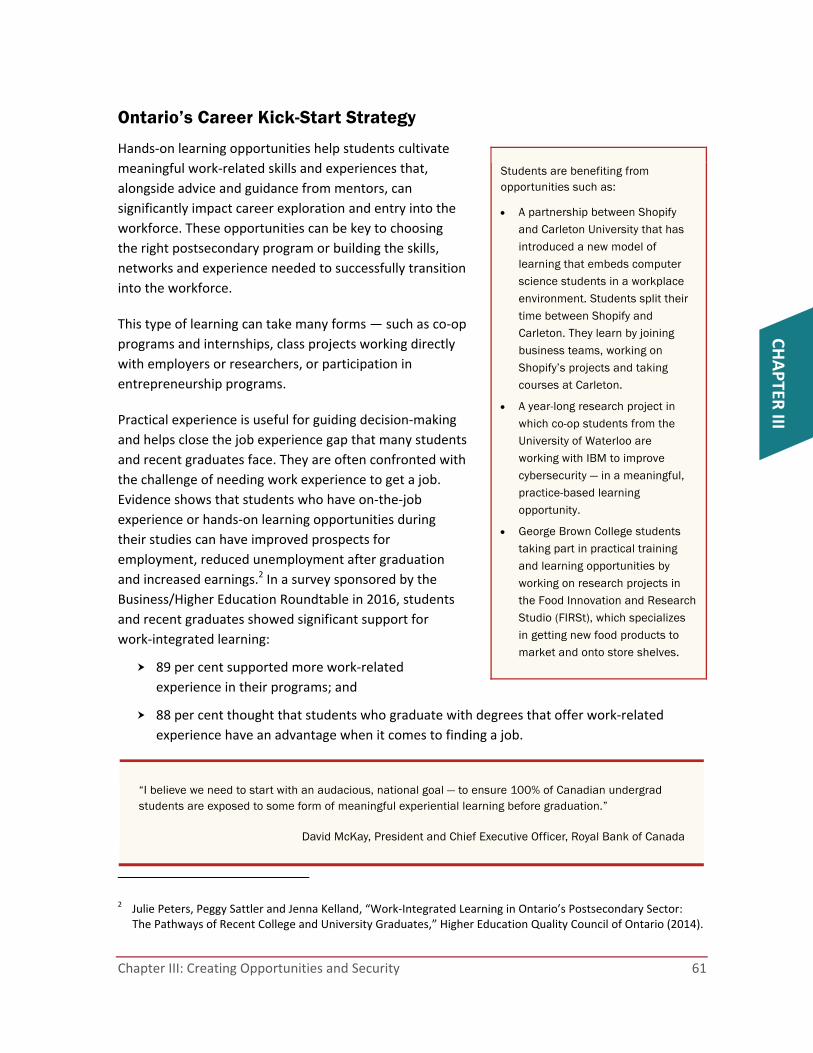
Chapter III: Creating Opportunities and Security 61
CHAPTER
III
Ontario’s Career Kick-Start Strategy
Hands‐on learning opportunities help students cultivate
meaningful work‐related skills and experiences that,
alongside advice and guidance from mentors, can
significantly impact career exploration and entry into the
workforce. These opportunities can be key to choosing
the right postsecondary program or building the skills,
networks and experience needed to successfully transition
into the workforce.
This type of learning can take many forms — such as co‐op
programs and internships, class projects working directly
with employers or researchers, or participation in
entrepreneurship programs.
Practical experience is useful for guiding decision‐making
and helps close the job experience gap that many students
and recent graduates face. They are often confronted with
the challenge of needing work experience to get a job.
Evidence shows that students who have on‐the‐job
experience or hands‐on learning opportunities during
their studies can have improved prospects for
employment, reduced unemployment after graduation
and increased earnings.2 In a survey sponsored by the
Business/Higher Education Roundtable in 2016, students
and recent graduates showed significant support for
work‐integrated learning:
89 per cent supported more work‐related
experience in their programs; and
88 per cent thought that students who graduate with degrees that offer work‐related
experience have an advantage when it comes to finding a job.
“I believe we need to start with an audacious, national goal — to ensure 100% of Canadian undergrad students are exposed to some form of meaningful experiential learning before graduation.”
David McKay, President and Chief Executive Officer, Royal Bank of Canada
2 Julie Peters, Peggy Sattler and Jenna Kelland, “Work‐Integrated Learning in Ontario’s Postsecondary Sector: The Pathways of Recent College and University Graduates,” Higher Education Quality Council of Ontario (2014).
Students are benefiting from opportunities such as:
A partnership between Shopify and Carleton University that has introduced a new model of learning that embeds computer science students in a workplace environment. Students split their time between Shopify and Carleton. They learn by joining business teams, working on Shopify’s projects and taking courses at Carleton.
A year-long research project in which co-op students from the University of Waterloo are working with IBM to improve cybersecurity — in a meaningful, practice-based learning opportunity.
George Brown College students taking part in practical training and learning opportunities by working on research projects in the Food Innovation and Research Studio (FIRSt), which specializes in getting new food products to market and onto store shelves.
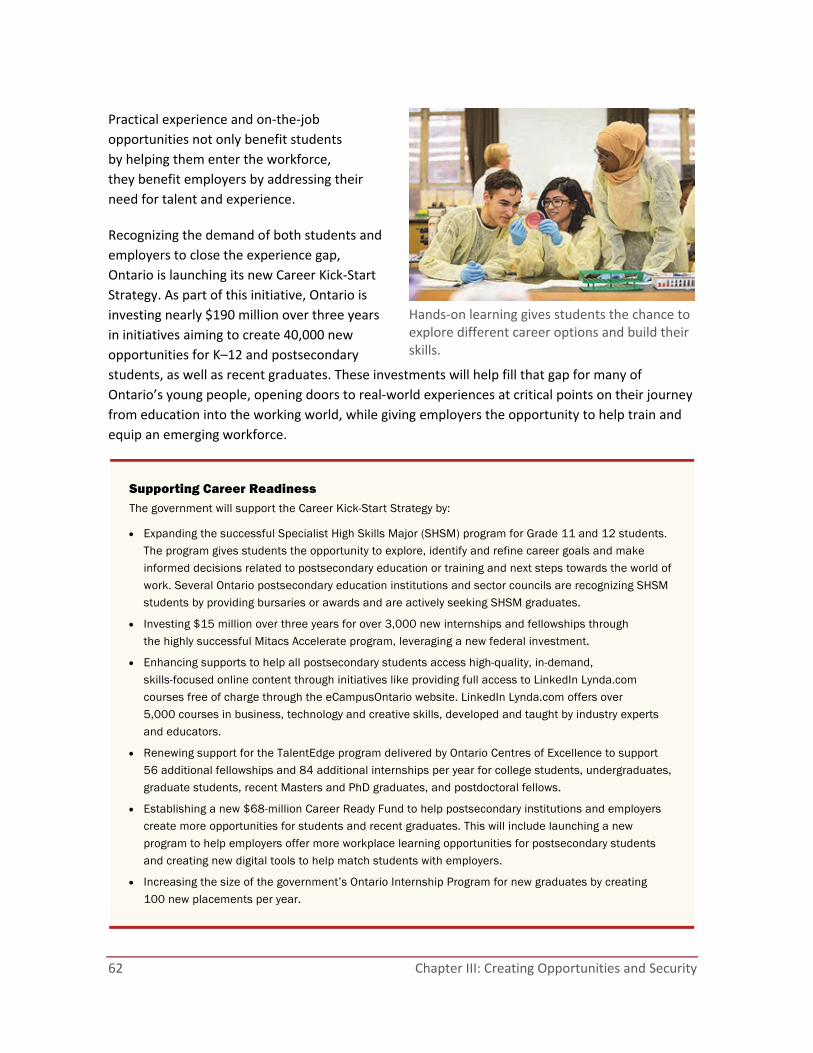
62 Chapter III: Creating Opportunities and Security
Practical experience and on‐the‐job
opportunities not only benefit students
by helping them enter the workforce,
they benefit employers by addressing their
need for talent and experience.
Recognizing the demand of both students and
employers to close the experience gap,
Ontario is launching its new Career Kick‐Start
Strategy. As part of this initiative, Ontario is
investing nearly $190 million over three years
in initiatives aiming to create 40,000 new
opportunities for K–12 and postsecondary
students, as well as recent graduates. These investments will help fill that gap for many of
Ontario’s young people, opening doors to real‐world experiences at critical points on their journey
from education into the working world, while giving employers the opportunity to help train and
equip an emerging workforce.
Supporting Career Readiness The government will support the Career Kick-Start Strategy by:
Expanding the successful Specialist High Skills Major (SHSM) program for Grade 11 and 12 students. The program gives students the opportunity to explore, identify and refine career goals and make informed decisions related to postsecondary education or training and next steps towards the world of work. Several Ontario postsecondary education institutions and sector councils are recognizing SHSM students by providing bursaries or awards and are actively seeking SHSM graduates.
Investing $15 million over three years for over 3,000 new internships and fellowships through the highly successful Mitacs Accelerate program, leveraging a new federal investment.
Enhancing supports to help all postsecondary students access high-quality, in-demand, skills-focused online content through initiatives like providing full access to LinkedIn Lynda.com courses free of charge through the eCampusOntario website. LinkedIn Lynda.com offers over 5,000 courses in business, technology and creative skills, developed and taught by industry experts and educators.
Renewing support for the TalentEdge program delivered by Ontario Centres of Excellence to support 56 additional fellowships and 84 additional internships per year for college students, undergraduates, graduate students, recent Masters and PhD graduates, and postdoctoral fellows.
Establishing a new $68-million Career Ready Fund to help postsecondary institutions and employers create more opportunities for students and recent graduates. This will include launching a new program to help employers offer more workplace learning opportunities for postsecondary students and creating new digital tools to help match students with employers.
Increasing the size of the government’s Ontario Internship Program for new graduates by creating 100 new placements per year.
Hands‐on learning gives students the chance to explore different career options and build their skills.
Chapter III: Creating Opportunities and Security 63
CHAPTER
III
The Province will continue to offer Experience Ontario, a two‐year career exploration pilot
program to support recent high school graduates in determining their postsecondary pathway
with greater certainty and confidence, and to facilitate better outcomes for them.
Career Kick‐Start also builds upon some of Ontario’s continued investments in hands‐on,
work‐integrated opportunities within the apprenticeship system, such as the Ontario Youth
Apprenticeship Program (OYAP) and Pre‐Apprenticeship Programs, which support youth in high
school and those who are out of work and not in school. Apprenticeships are an important
pathway for youth to access good jobs and careers, and a key element in building a highly
skilled workforce.
The government will be working with key partners to identify opportunities to modernize the
apprenticeship system, focusing on simplifying the experience for apprentices, enhancing access
and awareness of apprenticeship as a career pathway, and increasing completions.
Ontario Lifelong Learning and Skills Plan
Ontario is responding to the changing economy by making sure Ontarians have the support they
need to adapt and thrive at every stage of their career.
The government is introducing the Ontario Lifelong Learning and Skills Plan, which is about
opening doors and creating opportunities for adult learners and workers.
The critical building blocks to economic success are literacy, numeracy and aptitude with digital
tools like computers, the Internet and new workplace technologies. More than 15 per cent of
working‐age Ontarians have low levels of literacy and numeracy skills, meaning day‐to‐day
activities, such as reading instruction manuals or sending emails, can be difficult or impossible.
Many people with low literacy and numeracy skills are employed, but these skill gaps can close
doors to other opportunities.
Whether acquired through a training program or by securing an Ontario Secondary School
Diploma, these essential building blocks open doors — to advancement in the workplace,
new opportunities, or enrolment in an apprenticeship, college or university program that will
help individuals launch into their next career.
The Ontario Lifelong Learning and Skills Plan includes three elements:
Investment and enhancements to the adult education and essential skills system;
The new OSAP support for mature students to access postsecondary education; and
The updating of key Employment Ontario programs that support unemployed,
displaced and incumbent workers who require retraining and skills building.
64 Chapter III: Creating Opportunities and Security
Ontario will enhance its adult education system, making it more learner‐centred by improving
pathways and expanding services and programs that will provide around 90,000 more adults with
easier access to skills training and upgrading. This will help adult learners meet their employment
and education goals as quickly as possible. The plan will include an expansion and improvement of
the Literacy and Basic Skills program, enhance dual credit opportunities for adults, fund technical
and workplace‐based skills training pilots, and support Ontario Bridge Training for internationally
trained immigrants.
Employment and Training Services Transformation
The government currently invests more than $1 billion annually in a range of employment and
training programs that support unemployed Ontarians, improve their skills and help them find
jobs, as well as assist employers in addressing their workforce needs. Through Employment
Ontario, employment services and training programs serve approximately one million people
every year, helping them make career choices, access training and find good jobs.
While the employment and training system continues to support unemployed workers, it must
also respond to the needs of the changing economy and offer support to other groups, including
employed workers who need to build their skills to adapt or find their next job.
Second Career was established in response to the global recession of 2008–09. While it was
successful in helping retrain workers who were laid off following the recession, the global
economic landscape continues to change. The emerging needs of Ontarians require that programs,
such as Second Career, designed for the challenges of yesterday, be recalibrated to address the
challenges of today and tomorrow.
3 https://osap.gov.on.ca/AidEstimatorWeb/enterapp/enter.xhtml
A core element of the plan is the new OSAP, which will make average tuition free for low-income and most middle-income students, including mature students and adult learners. Students with children may be eligible to receive OSAP funding for child care costs, making it easier for people with children to go back to school. Starting in 2017–18, mature students will be able to access the same full suite of OSAP support as younger students. Try the online OSAP calculator.3 See Chapter II: Helping You and Your Family for more details on OSAP.
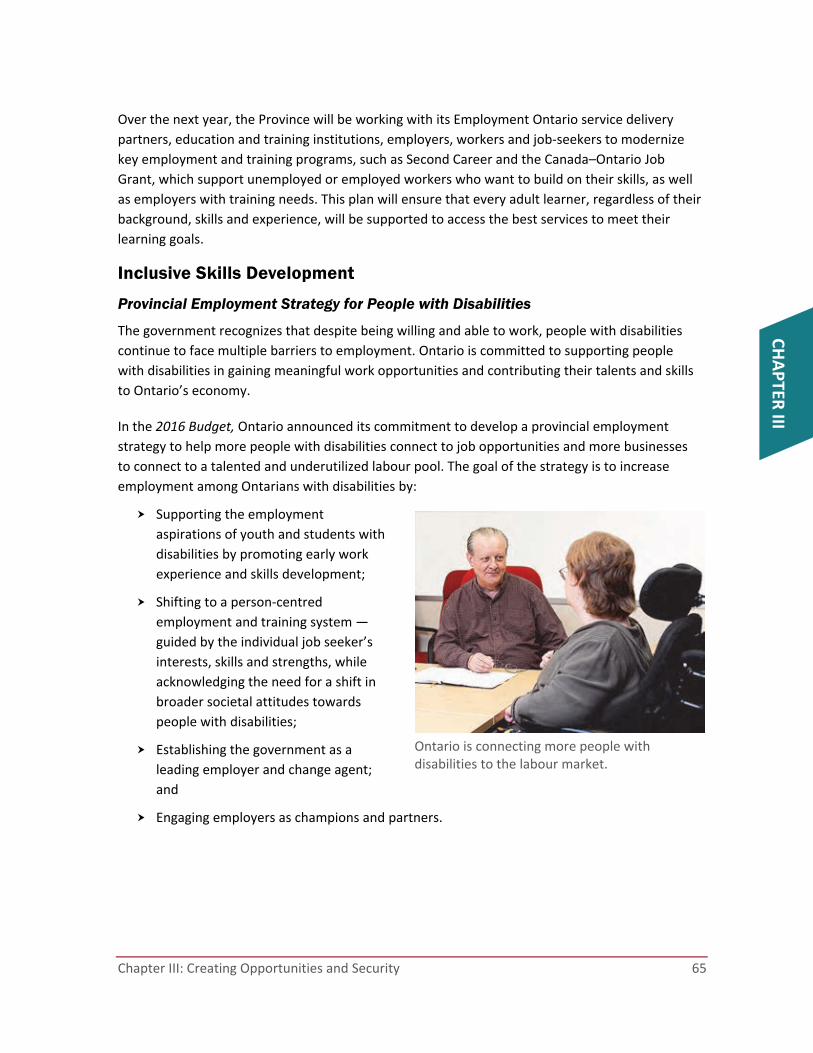
Chapter III: Creating Opportunities and Security 65
CHAPTER
III
Over the next year, the Province will be working with its Employment Ontario service delivery
partners, education and training institutions, employers, workers and job‐seekers to modernize
key employment and training programs, such as Second Career and the Canada–Ontario Job
Grant, which support unemployed or employed workers who want to build on their skills, as well
as employers with training needs. This plan will ensure that every adult learner, regardless of their
background, skills and experience, will be supported to access the best services to meet their
learning goals.
Inclusive Skills Development
Provincial Employment Strategy for People with Disabilities
The government recognizes that despite being willing and able to work, people with disabilities
continue to face multiple barriers to employment. Ontario is committed to supporting people
with disabilities in gaining meaningful work opportunities and contributing their talents and skills
to Ontario’s economy.
In the 2016 Budget, Ontario announced its commitment to develop a provincial employment
strategy to help more people with disabilities connect to job opportunities and more businesses
to connect to a talented and underutilized labour pool. The goal of the strategy is to increase
employment among Ontarians with disabilities by:
Supporting the employment
aspirations of youth and students with
disabilities by promoting early work
experience and skills development;
Shifting to a person‐centred
employment and training system —
guided by the individual job seeker’s
interests, skills and strengths, while
acknowledging the need for a shift in
broader societal attitudes towards
people with disabilities;
Establishing the government as a
leading employer and change agent;
and
Engaging employers as champions and partners.
Ontario is connecting more people with disabilities to the labour market.
66 Chapter III: Creating Opportunities and Security
The strategy will also help colleges and universities increase capacity to support students with
disabilities. An early focus on students with Autism Spectrum Disorders will support students as
they transition into postsecondary education, complete their studies and enter the workforce.
Two demonstration projects led by Algonquin College and York University, in partnership with
district school boards, have developed and implemented a new process to help these students
transition into postsecondary education, and support them during their studies thereafter. In the
first three years, over 87 per cent of the students involved completed their first year of study.
To develop its new strategy, the Province has consulted with individuals with disabilities and other
key groups, including disability organizations, service providers, educators, business leaders and
not‐for‐profit organizations. Ontario also took the advice of the Partnership Council on
Employment Opportunities for People with Disabilities and the Premier’s Highly Skilled Workforce
Expert Panel.
Helping People with Disabilities Ontario Government Was a Sponsor of Dolphin Disabilities Mentoring Day 2016
Dolphin Digital Technologies Inc. is an information and communications technology consulting company that founded Disabilities Mentoring Day (DMD) in 2011 on the belief that all businesses can benefit from employing people with disabilities. Launched in the Waterloo Region, DMD has grown to locations across Ontario, including London, Brantford, Hamilton, Toronto and Kingston.
The Ontario government was a sponsor of the 2016 DMD. There were 134 mentees, and in just one day of mentorship, DMD resulted in 18 offers of full-time employment. An additional two people who were not mentees were hired by mentor employers working with DMD community partners.
DMD has had success in other provinces in Canada, in the United States and in China. Employers who participate in DMD have not only offered full-time employment to their mentees, but also hired additional people with disabilities from various service providers after attending the mentoring day.

Chapter III: Creating Opportunities and Security 67
CHAPTER
III
Helping Newcomers Integrate into the Labour Market
Ontario remains a highly desirable destination
for newcomers. Throughout the past decade,
an average of over 100,000 immigrants came
to Ontario each year. Many immigrants are
highly educated and their earnings improve
over time, regardless of whether they arrived
as economic immigrants or refugees. Helping
newcomers integrate quickly into the labour
market is a key priority for the Province and
helps build strong and inclusive communities.
Ontario continues to support various
settlement and integration programs,
including Ontario Bridge Training programs
that serve skilled newcomers seeking licensing or certification and connect them to the labour
market. Ontario is investing $21 million over three years to support the Ontario Bridge Training
program. Each year, over 6,000 highly skilled immigrants access Ontario Bridge Training projects
in up to 100 occupations across a wide variety of sectors, including pharmacy, engineering,
nursing, physiotherapy, financial services, information and communications technology, and the
skilled trades.
Empowering Newcomers’ Financial Literacy
To help newcomers integrate and succeed, the government is also providing support for a financial
literacy program so that newcomers have the knowledge they need to establish their financial
security. The government is providing funding to Credit Canada for Newcomers & Money 101,
a new initiative that will provide newcomers with the financial literacy training and tools they need
to navigate the Canadian banking system, understand budgeting and money management,
handle credit and protect themselves from fraud.
See Chapter IV, Section D: Building Inclusive Communities and Improving the Justice System for
details on refugee resettlement initiatives in Ontario.
Bridge training programs help internationally trained individuals find meaningful jobs.

68 Chapter III: Creating Opportunities and Security
Championing Women’s Empowerment
Ontario is proud to lead in the pursuit of gender equality. Ontario has taken a government‐wide
approach to supporting women, including the creation of a stand‐alone Ministry of the Status of
Women dedicated to the security, equality and empowerment of women and girls.
The Province understands the value of women in the workforce, and what their contribution
means for economic prosperity in Ontario, and indeed the country. That’s why the government
has played a leadership role in women’s economic empowerment and corporate leadership
through the action plan to close the gender wage gap and an initiative to support women in
corporate leadership.
Ontario is also committed to strengthening
the use of gender‐based analysis within
government to make sure considerations of
gender are an essential component of the
policy development process.
In June 2016, informed by a Catalyst Canada
report commissioned by the Province,
Ontario announced gender diversity targets
for both government appointees and private
sector boards of directors. The government
also convened a steering committee of
corporate governance leaders to provide
strategic insights for developing a plan to accelerate greater representation of women on boards
of directors. The plan will be released in the coming months.
This plan will be part of a new women’s economic empowerment strategy. This summer,
the Province will be engaging with key stakeholder groups to help shape this strategy, so that
more women are able to reach their full economic potential.
The government has long recognized that empowerment has to start with security. Ontario is
leading here too by taking a stand on sexual, domestic and gender‐based violence. The
government’s globally recognized #WhoWillYouHelp and #ItsNeverOkay bilingual campaigns,
Sexual Violence and Harassment Action Plan, and Domestic Violence Action Plan continue to raise
awareness and provide support for survivors of gender‐based violence. The Province will continue
its work, including through an updated domestic violence action plan, to ensure women have
security and safety in all parts of their lives.
Ontario’s gender diversity targets are designed to help more women reach leadership positions.

Chapter III: Creating Opportunities and Security 69
CHAPTER
III
Changing Workplaces Review
In Ontario, decency, dignity and fairness in the workplace are the expectation, not the exception.
Ontario continues to approach workplace rights and responsibilities from a shared sense of
decency, no matter what workplaces look like or how they change.
The Labour Relations Act and Employment Standards Act are being reviewed in order to address
the changing nature of work and the challenges that come with it. Businesses need to stay
competitive in a fast‐paced global economy, and just as importantly, workers need and deserve
protections that take into account the changing workplace.
The Changing Workplaces Review was designed to consider the broader issues affecting
workplaces, and assess how the labour and employment law framework should address these
trends and issues. This review is about developing reforms that reflect the realities of this modern
economy, and the government will be carefully considering the recommendations made by the
Special Advisors.
These recommendations will address fundamental issues including:
Whether more employees should be covered by labour relations protections and
minimum standards;
How “employee” and “employer” are defined under employment and labour laws;
How to deal with the differential treatment of part‐time and full‐time employees;
What minimum standards should be in place for personal emergency leave; and
Whether changes need to be made to better calibrate the protections for bargaining rights
enshrined in the Labour Relations Act.
The Special Advisors will also be making recommendations with respect to the enforcement of the
Province’s labour laws. As they identified in their Interim Report on the Changing Workplaces
Review, enforcement and the need for widespread compliance are critical requirements of a
system of employment standards. Strong, effective enforcement is essential to ensure that
employers who do not respect protections for workers are held accountable.
By creating a framework of fairness and respect, the government is building an economic
environment that will continue to attract the very best workers to Ontario. A final report
of the Changing Workplaces Review is expected in spring 2017.
70 Chapter III: Creating Opportunities and Security
Investing in Jobs for Today and Tomorrow While helping people prepare for the jobs of tomorrow, the government is also spurring business
growth and job creation. The Province has lowered the cost of doing business through its
competitive corporate income tax rates and its focus on modernizing regulations. It has made
critical investments in infrastructure to facilitate economic activity, resulting in more jobs for
Ontarians. Strategic partnerships between government, the private sector and communities are
creating opportunities for people and companies across the province.
Remaining at the forefront of the globally competitive world of transformative technologies,
Ontario positions itself to anticipate and respond to the impacts of new employment opportunities
and economic growth. The government continues to make significant investments to support
Ontario’s transition to an innovation‐based, low‐carbon economy.
Due to these efforts, Ontario continues to attract international business investment. Ontario is
recognized as an economic leader in Canada, with ongoing employment growth in high‐quality
jobs. With private‐sector forecasters signalling Ontario will remain among Canada’s growth leaders
over the next two years, the government is focused on ensuring the benefits are more evenly
shared across the province.

Chapter III: Creating Opportunities and Security 71
CHAPTER
III
What We’ve Been Doing since 2013
Supporting an economy that has generated nearly 700,000 net new jobs since the depths of the 2008–09 global recession
Creating and retaining more than 37,600 jobs across the province through the Jobs and Prosperity Fund
Making investments in public infrastructure to support jobs
Maintaining a competitive business tax environment
Collaborating with communities to take a strategic approach to supporting employers’ needs through Local Employment Planning Councils
Helping Ontario businesses, including small and medium-sized enterprises (SMEs), expand and hire by supporting the adoption of innovation, increasing access to capital, and helping firms grow their exports
The unemployment rate declined from 9.6 per cent during the global recession to 6.4 per cent in March 2017, below the national average for the 24th consecutive month
Investing in Jobs
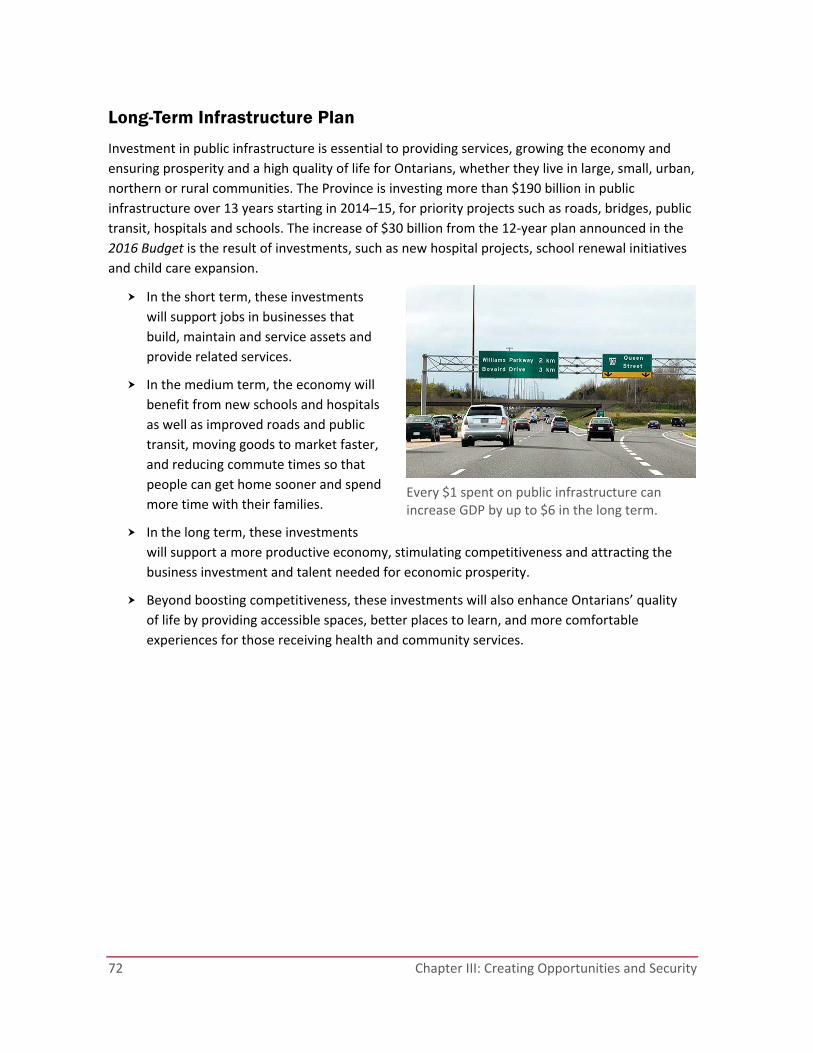
72 Chapter III: Creating Opportunities and Security
Long-Term Infrastructure Plan
Investment in public infrastructure is essential to providing services, growing the economy and
ensuring prosperity and a high quality of life for Ontarians, whether they live in large, small, urban,
northern or rural communities. The Province is investing more than $190 billion in public
infrastructure over 13 years starting in 2014–15, for priority projects such as roads, bridges, public
transit, hospitals and schools. The increase of $30 billion from the 12‐year plan announced in the
2016 Budget is the result of investments, such as new hospital projects, school renewal initiatives
and child care expansion.
In the short term, these investments
will support jobs in businesses that
build, maintain and service assets and
provide related services.
In the medium term, the economy will
benefit from new schools and hospitals
as well as improved roads and public
transit, moving goods to market faster,
and reducing commute times so that
people can get home sooner and spend
more time with their families.
In the long term, these investments
will support a more productive economy, stimulating competitiveness and attracting the
business investment and talent needed for economic prosperity.
Beyond boosting competitiveness, these investments will also enhance Ontarians’ quality
of life by providing accessible spaces, better places to learn, and more comfortable
experiences for those receiving health and community services.
Every $1 spent on public infrastructure can increase GDP by up to $6 in the long term.
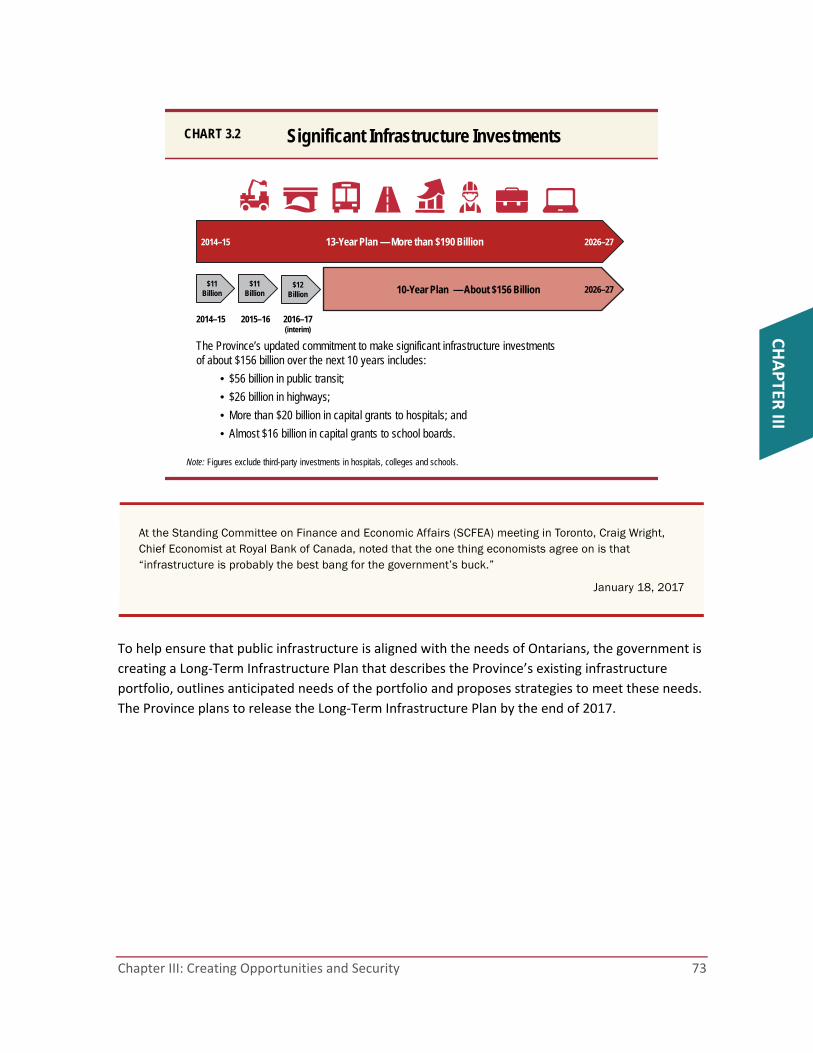
Chapter III: Creating Opportunities and Security 73
CHAPTER
III
At the Standing Committee on Finance and Economic Affairs (SCFEA) meeting in Toronto, Craig Wright, Chief Economist at Royal Bank of Canada, noted that the one thing economists agree on is that “infrastructure is probably the best bang for the government’s buck.”
January 18, 2017
To help ensure that public infrastructure is aligned with the needs of Ontarians, the government is
creating a Long‐Term Infrastructure Plan that describes the Province’s existing infrastructure
portfolio, outlines anticipated needs of the portfolio and proposes strategies to meet these needs.
The Province plans to release the Long‐Term Infrastructure Plan by the end of 2017.
$11Billion
$11Billion
13-Year Plan — More than $190 Billion
10-Year Plan — About $156 Billion
2014–15 2015–16
2014–15 2026–27
Significant Infrastructure InvestmentsCHART 3.2
Note: Figures exclude third-party investments in hospitals, colleges and schools.
$12Billion
2016–17 (interim)
2026–27
The Province’s updated commitment to make significant infrastructure investments of about $156 billion over the next 10 years includes:
• $56 billion in public transit;
• $26 billion in highways;
• More than $20 billion in capital grants to hospitals; and
• Almost $16 billion in capital grants to school boards.
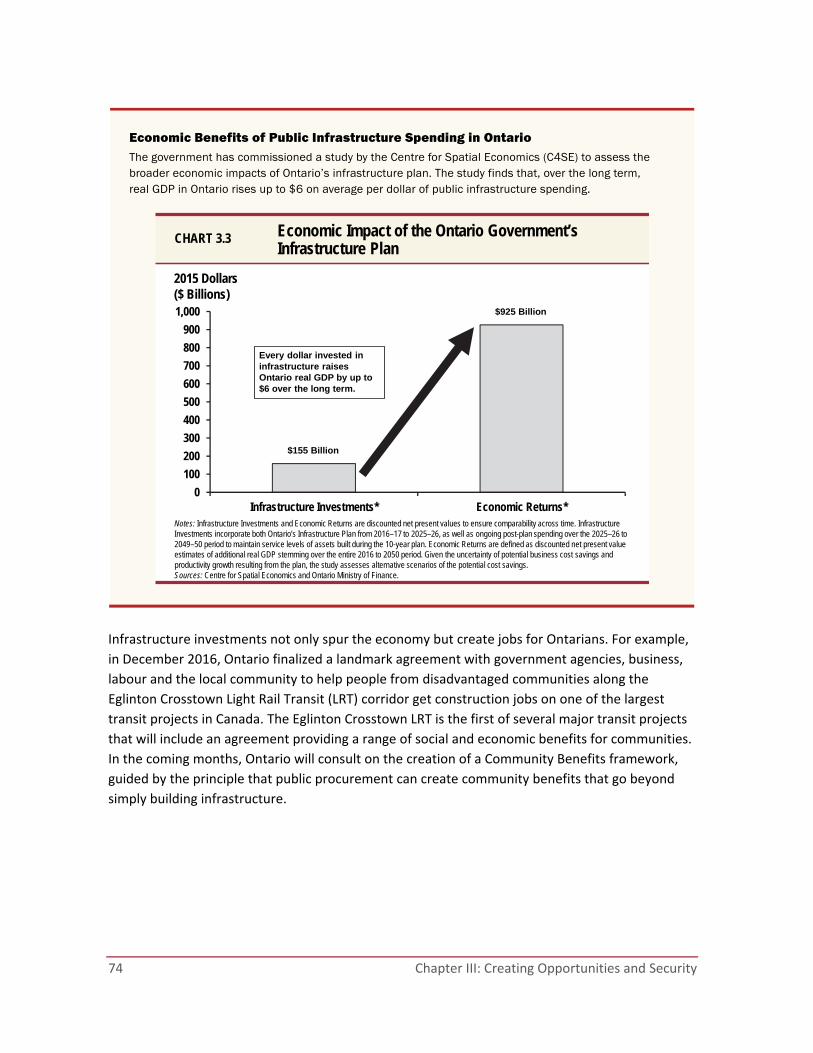
74 Chapter III: Creating Opportunities and Security
Economic Benefits of Public Infrastructure Spending in Ontario The government has commissioned a study by the Centre for Spatial Economics (C4SE) to assess the broader economic impacts of Ontario’s infrastructure plan. The study finds that, over the long term, real GDP in Ontario rises up to $6 on average per dollar of public infrastructure spending.
Infrastructure investments not only spur the economy but create jobs for Ontarians. For example,
in December 2016, Ontario finalized a landmark agreement with government agencies, business,
labour and the local community to help people from disadvantaged communities along the
Eglinton Crosstown Light Rail Transit (LRT) corridor get construction jobs on one of the largest
transit projects in Canada. The Eglinton Crosstown LRT is the first of several major transit projects
that will include an agreement providing a range of social and economic benefits for communities.
In the coming months, Ontario will consult on the creation of a Community Benefits framework,
guided by the principle that public procurement can create community benefits that go beyond
simply building infrastructure.
Notes: Infrastructure Investments and Economic Returns are discounted net present values to ensure comparability across time. Infrastructure Investments incorporate both Ontario’s Infrastructure Plan from 2016–17 to 2025–26, as well as ongoing post-plan spending over the 2025–26 to 2049–50 period to maintain service levels of assets built during the 10-year plan. Economic Returns are defined as discounted net present value estimates of additional real GDP stemming over the entire 2016 to 2050 period. Given the uncertainty of potential business cost savings and productivity growth resulting from the plan, the study assesses alternative scenarios of the potential cost savings.Sources: Centre for Spatial Economics and Ontario Ministry of Finance.
0
100
200
300
400
500
600
700
800
900
1,000
Infrastructure Investments* Economic Returns*
2015 Dollars ($ Billions)
Economic Impact of the Ontario Government’s Infrastructure Plan
CHART 3.3
Every dollar invested in infrastructure raises Ontario real GDP by up to $6 over the long term.
$155 Billion
$925 Billion
Chapter III: Creating Opportunities and Security 75
CHAPTER
III
Business Growth Initiative
As announced in the 2016 Budget, the Business Growth Initiative (BGI) is the government’s plan to
support Ontario’s transition to the new economy. Ontario already has a strong foundation for
innovation and entrepreneurship, with internationally recognized research institutions, and more
than 574,000 Ontarians employed in science and engineering occupations in 2016. The BGI will
create opportunities to make Ontario’s economy more innovative, help scale up small businesses
into medium‐sized and large enterprises, and reduce the regulatory burden on businesses.
Through the BGI, more well‐paying jobs will be created across Ontario.
The Standing Committee on Finance and Economic Affairs (SCFEA) recommended4 that the Minister of Finance commit to:
Continue to reduce the regulatory burden for businesses in Ontario.
Continue launching the ScaleUP Ventures program to help growth-oriented firms with the highest potential to scale into large employers by providing them with the tools necessary to get their products to the global marketplace by the end of 2017.
Seize on the tremendous potential of northern industries.
Create regional economic development strategies that foster inclusive growth.
Continue to reduce interprovincial trade barriers.
The 2017 Budget demonstrates progress in all of these areas.
4 http://www.ontla.on.ca/committee‐proceedings/committee‐reports/files_html/ pre‐budget%20consultation%202017%20report%20english%20‐%20final.htm
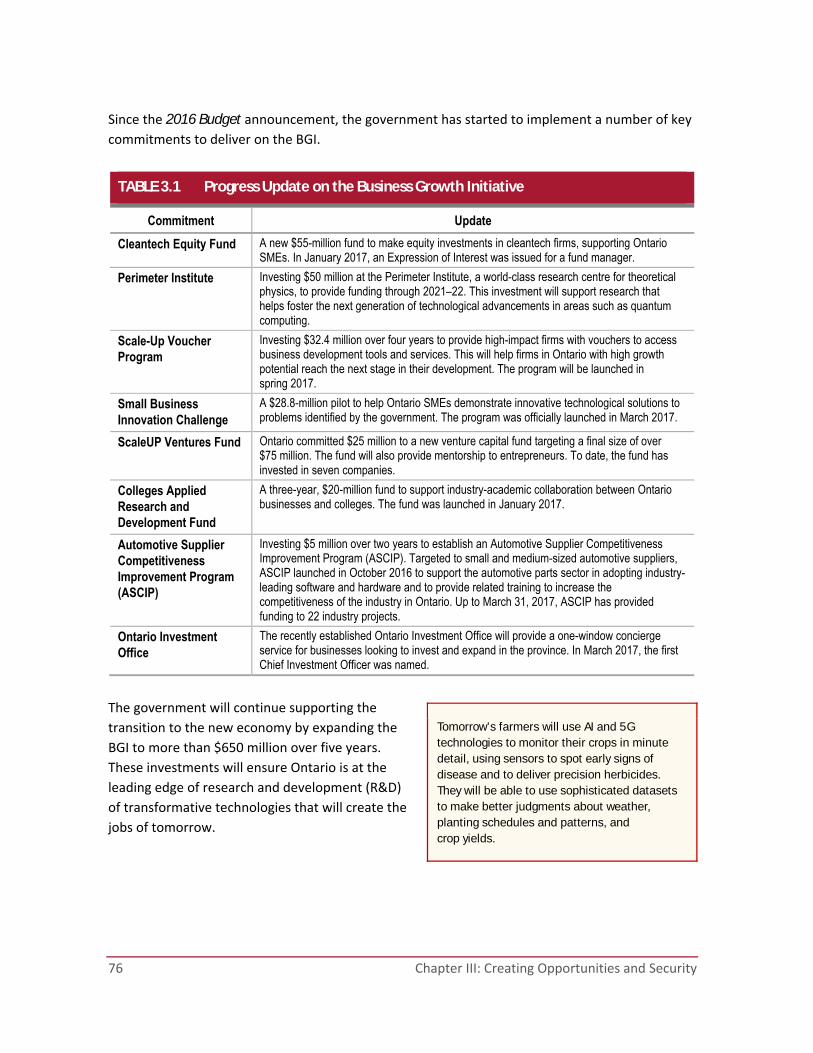
76 Chapter III: Creating Opportunities and Security
Since the 2016 Budget announcement, the government has started to implement a number of key commitments to deliver on the BGI.
TABLE 3.1 Progress Update on the Business Growth Initiative
Commitment Update
Cleantech Equity Fund A new $55-million fund to make equity investments in cleantech firms, supporting Ontario SMEs. In January 2017, an Expression of Interest was issued for a fund manager.
Perimeter Institute Investing $50 million at the Perimeter Institute, a world-class research centre for theoretical physics, to provide funding through 2021–22. This investment will support research that helps foster the next generation of technological advancements in areas such as quantum computing.
Scale-Up Voucher Program
Investing $32.4 million over four years to provide high-impact firms with vouchers to access business development tools and services. This will help firms in Ontario with high growth potential reach the next stage in their development. The program will be launched in spring 2017.
Small Business Innovation Challenge
A $28.8-million pilot to help Ontario SMEs demonstrate innovative technological solutions to problems identified by the government. The program was officially launched in March 2017.
ScaleUP Ventures Fund Ontario committed $25 million to a new venture capital fund targeting a final size of over $75 million. The fund will also provide mentorship to entrepreneurs. To date, the fund has invested in seven companies.
Colleges Applied Research and Development Fund
A three-year, $20-million fund to support industry-academic collaboration between Ontario businesses and colleges. The fund was launched in January 2017.
Automotive Supplier Competitiveness Improvement Program (ASCIP)
Investing $5 million over two years to establish an Automotive Supplier Competitiveness Improvement Program (ASCIP). Targeted to small and medium-sized automotive suppliers, ASCIP launched in October 2016 to support the automotive parts sector in adopting industry-leading software and hardware and to provide related training to increase the competitiveness of the industry in Ontario. Up to March 31, 2017, ASCIP has provided funding to 22 industry projects.
Ontario Investment Office
The recently established Ontario Investment Office will provide a one-window concierge service for businesses looking to invest and expand in the province. In March 2017, the first Chief Investment Officer was named.
The government will continue supporting the transition to the new economy by expanding the BGI to more than $650 million over five years. These investments will ensure Ontario is at the leading edge of research and development (R&D) of transformative technologies that will create the jobs of tomorrow.
Tomorrow’s farmers will use AI and 5G technologies to monitor their crops in minute detail, using sensors to spot early signs of disease and to deliver precision herbicides. They will be able to use sophisticated datasets to make better judgments about weather, planting schedules and patterns, and crop yields.

Chapter III: Creating Opportunities and Security 77
CHAPTER
III
TABLE 3.2 New Investments through the Business Growth Initiative
Artificial Intelligence
Artificial intelligence (AI) allows computers to improve productivity in companies by performing complex physical and intellectual tasks. The potential application of AI, with a specific focus on deep learning and machine learning more broadly, will affect all sectors of the economy. Examples of applications include improved medical diagnostic imaging and self-driving cars.
The government is investing $50 million to establish the Vector Institute for artificial intelligence. The institute will also be supported by the federal government, other institutions, and more than 30 private-sector companies that have committed to invest over $80 million. The institute will work to produce, attract and retain top talent in the field, support AI technology startups, and generate investment from companies looking to hire experts and expand their AI divisions.
5G
5G (fifth-generation wireless technology) aims to increase telecommunications network capacity and speed by up to 1,000 times for mobile and connected devices. It will serve as the backbone infrastructure for technologies such as autonomous vehicles.
The Province will invest $130 million over five years in two projects — $67 million in ENCQOR (Evolution of Networked Services through a Corridor in Québec and Ontario for Research and Innovation) and $63 million in CENGN (Centre of Excellence in Next Generation Networks). These industry-led consortiums will advance the development and commercialization of 5G and next-generation technologies and networks across Ontario. Northern and rural Ontario will be connected to the testing facilities through the Ontario Research and Innovation Optical Network.
Quantum Technologies
Quantum science seeks to understand and apply the behaviour of matter and energy at the atomic level. The application of quantum science could help improve the efficiency of computers, as well as communications and sensor technologies.
To help facilitate application-based research and commercialization, the Province will partner with Waterloo’s Quantum Valley to create the Quantum Valley Ideas Lab. A Provincial investment of $20 million over five years will help develop the cutting-edge research, train highly qualified personnel, and support academics in the field of quantum science.
Advanced Computing
Ontario’s researchers and businesses need access to state-of-the-art computers and the capability to process large amounts of information in areas such as genomics and neuroscience.
The Province will invest $75 million over the next five years in an Advanced Research Computing and Big Data Strategy. This investment will support operating costs for advanced computing across the province, new hardware investments at the University of Toronto and the University of Waterloo, new research projects, and improved coordination.
Autonomous Vehicles
The Province is investing $80 million over five years to create the Autonomous Vehicle (AV) Innovation Network, in partnership with Ontario Centres of Excellence. The network will capitalize on the economic potential of AVs (vehicles capable of sensing and communicating with their environment and navigating without human input) and help the province’s transportation systems and infrastructure adapt to AV technology. Ontario’s investment will support industry-led AV R&D projects; create sites across the province to develop, test and validate new technology, including a Demonstration Zone in Stratford; and attract and grow talent in the AV sector.
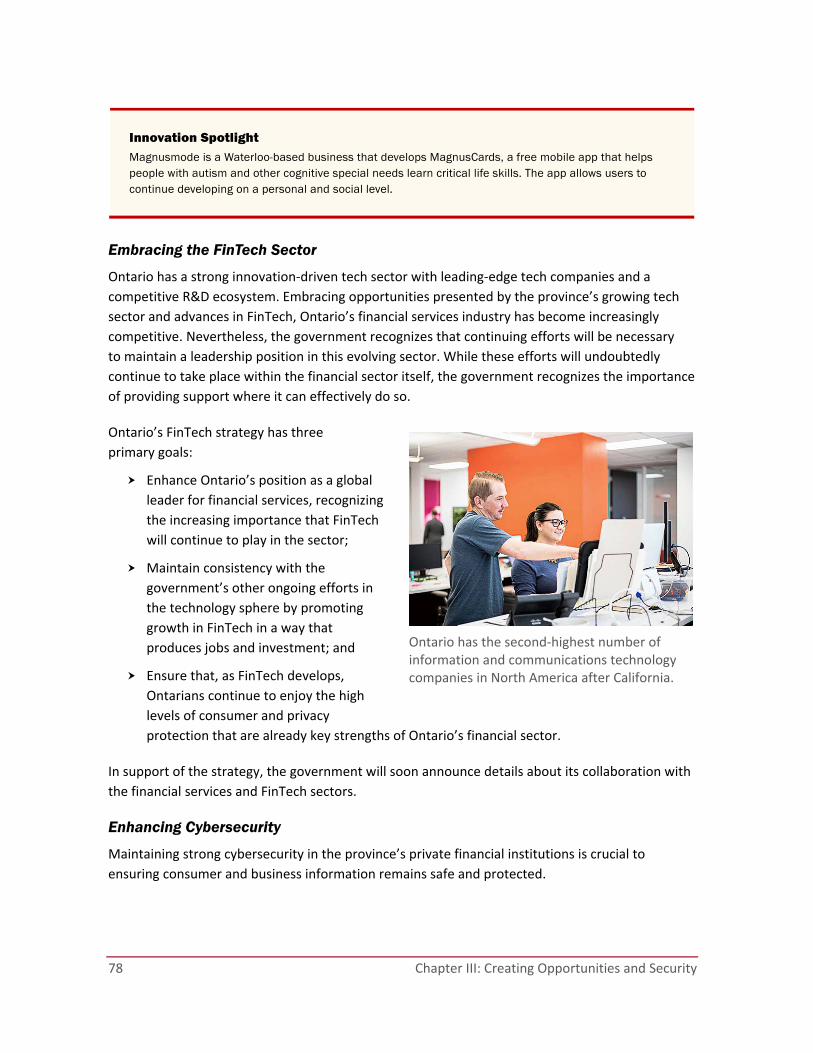
78 Chapter III: Creating Opportunities and Security
Innovation Spotlight Magnusmode is a Waterloo-based business that develops MagnusCards, a free mobile app that helps people with autism and other cognitive special needs learn critical life skills. The app allows users to continue developing on a personal and social level.
Embracing the FinTech Sector
Ontario has a strong innovation‐driven tech sector with leading‐edge tech companies and a
competitive R&D ecosystem. Embracing opportunities presented by the province’s growing tech
sector and advances in FinTech, Ontario’s financial services industry has become increasingly
competitive. Nevertheless, the government recognizes that continuing efforts will be necessary
to maintain a leadership position in this evolving sector. While these efforts will undoubtedly
continue to take place within the financial sector itself, the government recognizes the importance
of providing support where it can effectively do so.
Ontario’s FinTech strategy has three
primary goals:
Enhance Ontario’s position as a global
leader for financial services, recognizing
the increasing importance that FinTech
will continue to play in the sector;
Maintain consistency with the
government’s other ongoing efforts in
the technology sphere by promoting
growth in FinTech in a way that
produces jobs and investment; and
Ensure that, as FinTech develops,
Ontarians continue to enjoy the high
levels of consumer and privacy
protection that are already key strengths of Ontario’s financial sector.
In support of the strategy, the government will soon announce details about its collaboration with
the financial services and FinTech sectors.
Enhancing Cybersecurity
Maintaining strong cybersecurity in the province’s private financial institutions is crucial to
ensuring consumer and business information remains safe and protected.
Ontario has the second‐highest number of information and communications technology companies in North America after California.
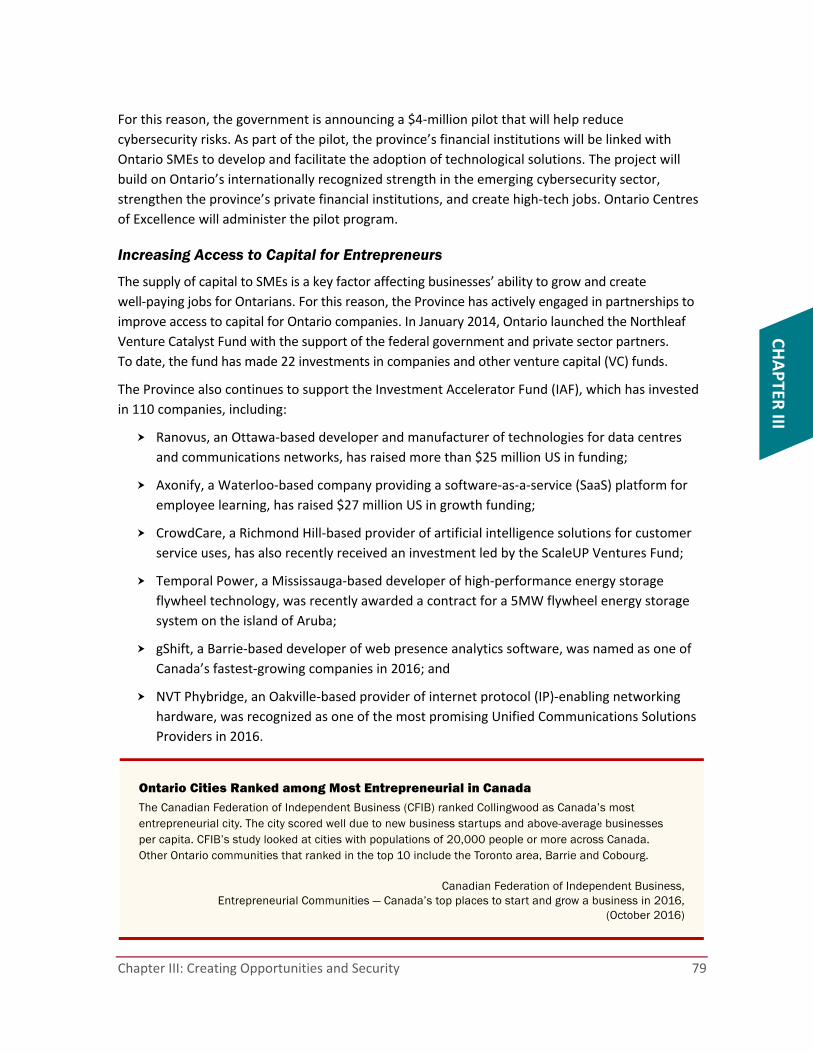
Chapter III: Creating Opportunities and Security 79
CHAPTER
III
For this reason, the government is announcing a $4‐million pilot that will help reduce
cybersecurity risks. As part of the pilot, the province’s financial institutions will be linked with
Ontario SMEs to develop and facilitate the adoption of technological solutions. The project will
build on Ontario’s internationally recognized strength in the emerging cybersecurity sector,
strengthen the province’s private financial institutions, and create high‐tech jobs. Ontario Centres
of Excellence will administer the pilot program.
Increasing Access to Capital for Entrepreneurs
The supply of capital to SMEs is a key factor affecting businesses’ ability to grow and create
well‐paying jobs for Ontarians. For this reason, the Province has actively engaged in partnerships to
improve access to capital for Ontario companies. In January 2014, Ontario launched the Northleaf
Venture Catalyst Fund with the support of the federal government and private sector partners.
To date, the fund has made 22 investments in companies and other venture capital (VC) funds.
The Province also continues to support the Investment Accelerator Fund (IAF), which has invested
in 110 companies, including:
Ranovus, an Ottawa‐based developer and manufacturer of technologies for data centres
and communications networks, has raised more than $25 million US in funding;
Axonify, a Waterloo‐based company providing a software‐as‐a‐service (SaaS) platform for
employee learning, has raised $27 million US in growth funding;
CrowdCare, a Richmond Hill‐based provider of artificial intelligence solutions for customer
service uses, has also recently received an investment led by the ScaleUP Ventures Fund;
Temporal Power, a Mississauga‐based developer of high‐performance energy storage
flywheel technology, was recently awarded a contract for a 5MW flywheel energy storage
system on the island of Aruba;
gShift, a Barrie‐based developer of web presence analytics software, was named as one of
Canada’s fastest‐growing companies in 2016; and
NVT Phybridge, an Oakville‐based provider of internet protocol (IP)‐enabling networking
hardware, was recognized as one of the most promising Unified Communications Solutions
Providers in 2016.
Ontario Cities Ranked among Most Entrepreneurial in Canada The Canadian Federation of Independent Business (CFIB) ranked Collingwood as Canada’s most entrepreneurial city. The city scored well due to new business startups and above-average businesses per capita. CFIB’s study looked at cities with populations of 20,000 people or more across Canada. Other Ontario communities that ranked in the top 10 include the Toronto area, Barrie and Cobourg.
Canadian Federation of Independent Business, Entrepreneurial Communities — Canada’s top places to start and grow a business in 2016,
(October 2016)
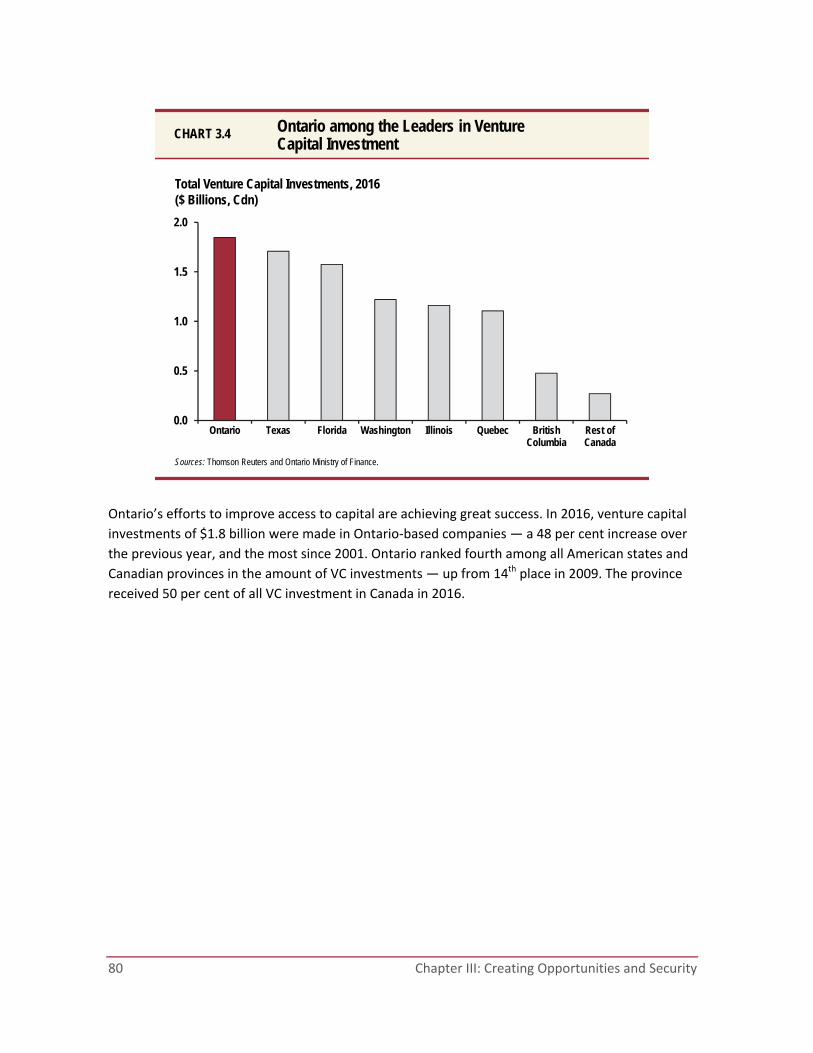
80 Chapter III: Creating Opportunities and Security
Ontario’s efforts to improve access to capital are achieving great success. In 2016, venture capital
investments of $1.8 billion were made in Ontario‐based companies — a 48 per cent increase over
the previous year, and the most since 2001. Ontario ranked fourth among all American states and
Canadian provinces in the amount of VC investments — up from 14th place in 2009. The province
received 50 per cent of all VC investment in Canada in 2016.
Sources: Thomson Reuters and Ontario Ministry of Finance.
0.0
0.5
1.0
1.5
2.0
Ontario Texas Florida Washington Illinois Quebec BritishColumbia
Rest ofCanada
Total Venture Capital Investments, 2016($ Billions, Cdn)
Ontario among the Leaders in Venture Capital Investment
CHART 3.4
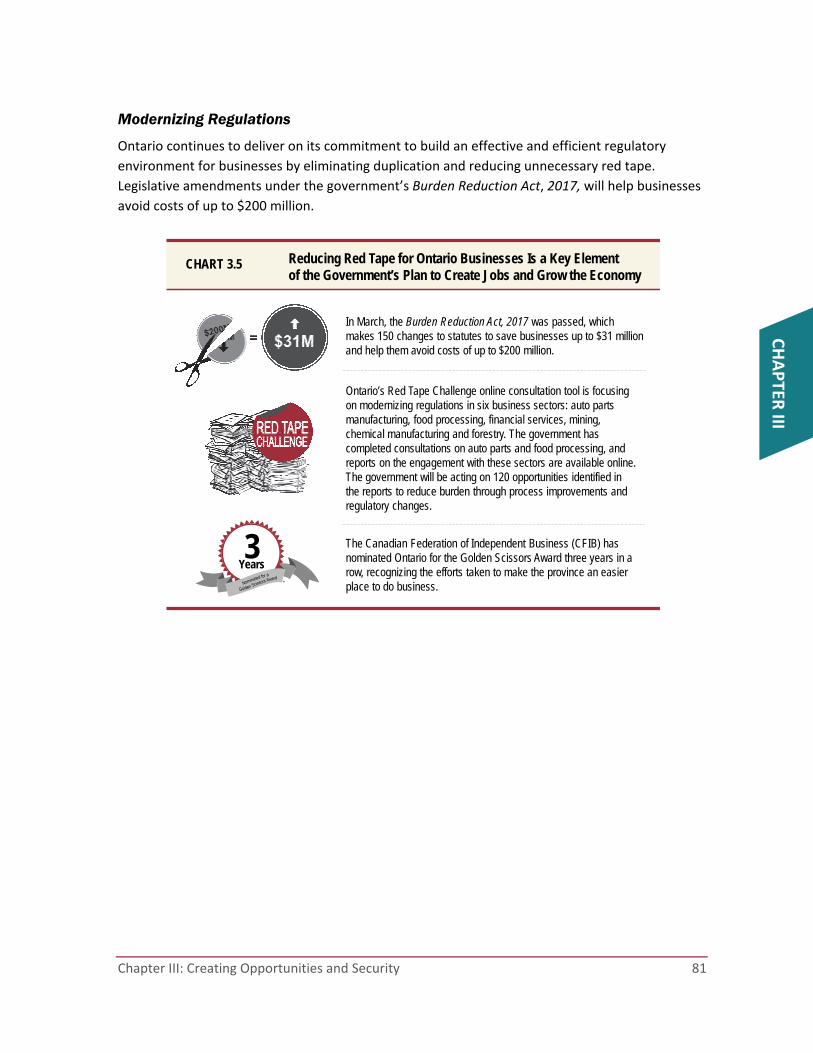
Chapter III: Creating Opportunities and Security 81
CHAPTER
III
Modernizing Regulations
Ontario continues to deliver on its commitment to build an effective and efficient regulatory
environment for businesses by eliminating duplication and reducing unnecessary red tape.
Legislative amendments under the government’s Burden Reduction Act, 2017, will help businesses
avoid costs of up to $200 million.
Reducing Red Tape for Ontario Businesses Is a Key Element of the Government’s Plan to Create Jobs and Grow the Economy
CHART 3.5
In March, the Burden Reduction Act, 2017 was passed, which makes 150 changes to statutes to save businesses up to $31 million and help them avoid costs of up to $200 million.
Ontario’s Red Tape Challenge online consultation tool is focusing on modernizing regulations in six business sectors: auto parts manufacturing, food processing, financial services, mining, chemical manufacturing and forestry. The government has completed consultations on auto parts and food processing, and reports on the engagement with these sectors are available online. The government will be acting on 120 opportunities identified in the reports to reduce burden through process improvements and regulatory changes.
The Canadian Federation of Independent Business (CFIB) has nominated Ontario for the Golden Scissors Award three years in a row, recognizing the efforts taken to make the province an easier place to do business.
3Years
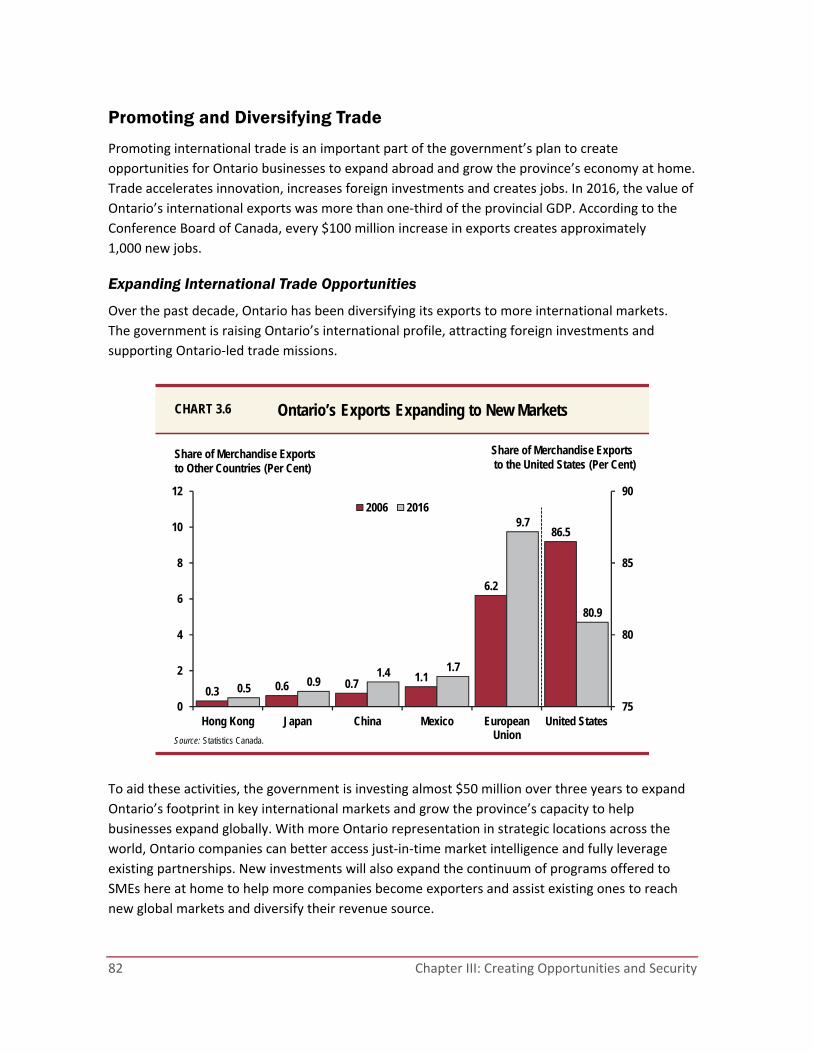
82 Chapter III: Creating Opportunities and Security
Promoting and Diversifying Trade
Promoting international trade is an important part of the government’s plan to create
opportunities for Ontario businesses to expand abroad and grow the province’s economy at home.
Trade accelerates innovation, increases foreign investments and creates jobs. In 2016, the value of
Ontario’s international exports was more than one‐third of the provincial GDP. According to the
Conference Board of Canada, every $100 million increase in exports creates approximately
1,000 new jobs.
Expanding International Trade Opportunities
Over the past decade, Ontario has been diversifying its exports to more international markets.
The government is raising Ontario’s international profile, attracting foreign investments and
supporting Ontario‐led trade missions.
To aid these activities, the government is investing almost $50 million over three years to expand
Ontario’s footprint in key international markets and grow the province’s capacity to help
businesses expand globally. With more Ontario representation in strategic locations across the
world, Ontario companies can better access just‐in‐time market intelligence and fully leverage
existing partnerships. New investments will also expand the continuum of programs offered to
SMEs here at home to help more companies become exporters and assist existing ones to reach
new global markets and diversify their revenue source.
86.5
80.9
0.3 0.6 0.7 1.1
6.2
0.5 0.91.4 1.7
9.7
0
2
4
6
8
10
12
Hong Kong Japan China Mexico EuropeanUnion
United States75
80
85
902006 2016
Source: Statistics Canada.
Share of Merchandise Exports to Other Countries (Per Cent)
Ontario’s Exports Expanding to New MarketsCHART 3.6
Share of Merchandise Exports to the United States (Per Cent)

Chapter III: Creating Opportunities and Security 83
CHAPTER
III
On October 30, 2016, the Canada–European Union (EU) Comprehensive Economic and Trade
Agreement (CETA) was formally signed. The reduction and elimination of trade barriers will make
Ontario’s goods more competitive in the European Union, the largest single market in the world.
The trade agreement is expected to create 30,000 new Ontario jobs and boost the province’s GDP
by $4.5 billion.
The Province is also working with the federal government to diversify international trade through
the negotiation of free trade agreements, including seeking opportunities with other trading
partners in Asia.
Reducing Barriers to Interprovincial Trade
Regulatory inconsistencies across provinces can cause unnecessary barriers to doing business.
Ontario has been working with the federal, provincial and territorial governments to renew and
modernize the 20‐year‐old Agreement on Internal Trade (AIT). The new Canadian Free Trade
Agreement that was announced in April 2017 replaces the AIT and will improve the flow of goods
and services and reduce the cost of doing business across provinces.
U.S. Engagement
Ontario is continuing to support workers and businesses by advocating for continued free trade
with the United States. Nowhere else is open trade more important than in Ontario’s strong
business relationships with the United States. In 2016, Ontario exported $166 billion worth of
goods to the United States, which is equivalent to one‐fifth of the province’s GDP. Ontario is taking
a number of proactive steps to support businesses so they can continue to strengthen this
longstanding and mutually beneficial economic tie with the United States. For example:
Establishing a Premier’s Committee on Ontario‐U.S. Economic and Trade Relations.
This committee provides a forum to discuss progress and provide advice on Ontario’s
U.S. engagement strategy, including the promotion of Ontario’s interests in the context
of any discussions on the North American Free Trade Agreement.
The Premier has travelled to neighbouring U.S. states to highlight the role two‐way trade
plays in supporting jobs and economic growth. In July 2017, the Premier will travel to the
National Governors Association meeting in Rhode Island to foster closer connections with
state‐level partners.
In the fall, Premier Wynne and Governor Snyder of Michigan will co‐host the Conference
of Great Lakes and St. Lawrence Governors and Premiers Leadership Summit, bringing
together Great Lakes–St. Lawrence governors and the premiers of Ontario and Quebec.
The Summit attendees will discuss how to advance sustainable development in the Great
Lakes region, and this event will reaffirm the importance of healthy Great Lakes to Ontario’s
environment, economy and society.
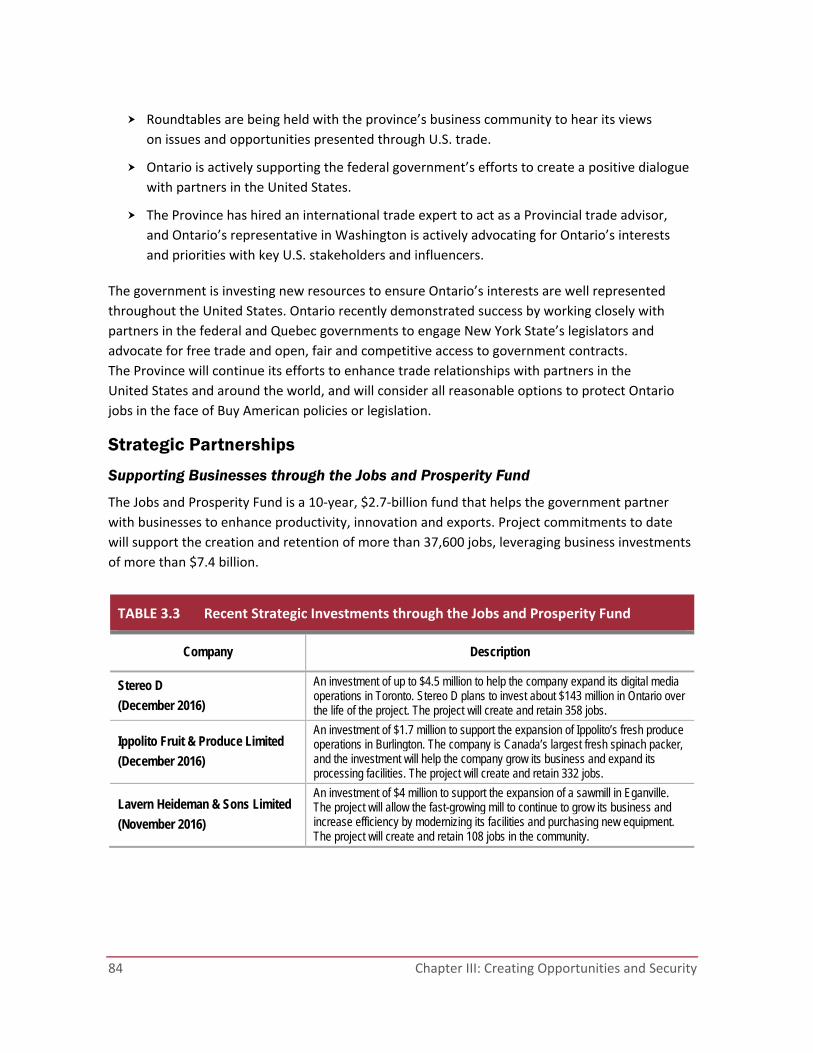
84 Chapter III: Creating Opportunities and Security
Roundtables are being held with the province’s business community to hear its views
on issues and opportunities presented through U.S. trade.
Ontario is actively supporting the federal government’s efforts to create a positive dialogue
with partners in the United States.
The Province has hired an international trade expert to act as a Provincial trade advisor,
and Ontario’s representative in Washington is actively advocating for Ontario’s interests
and priorities with key U.S. stakeholders and influencers.
The government is investing new resources to ensure Ontario’s interests are well represented
throughout the United States. Ontario recently demonstrated success by working closely with
partners in the federal and Quebec governments to engage New York State’s legislators and
advocate for free trade and open, fair and competitive access to government contracts.
The Province will continue its efforts to enhance trade relationships with partners in the
United States and around the world, and will consider all reasonable options to protect Ontario
jobs in the face of Buy American policies or legislation.
Strategic Partnerships
Supporting Businesses through the Jobs and Prosperity Fund
The Jobs and Prosperity Fund is a 10‐year, $2.7‐billion fund that helps the government partner
with businesses to enhance productivity, innovation and exports. Project commitments to date
will support the creation and retention of more than 37,600 jobs, leveraging business investments
of more than $7.4 billion.
TABLE 3.3 Recent Strategic Investments through the Jobs and Prosperity Fund
Company Description
Stereo D
(December 2016)
An investment of up to $4.5 million to help the company expand its digital media operations in Toronto. Stereo D plans to invest about $143 million in Ontario over the life of the project. The project will create and retain 358 jobs.
Ippolito Fruit & Produce Limited
(December 2016)
An investment of $1.7 million to support the expansion of Ippolito’s fresh produce operations in Burlington. The company is Canada’s largest fresh spinach packer, and the investment will help the company grow its business and expand its processing facilities. The project will create and retain 332 jobs.
Lavern Heideman & Sons Limited
(November 2016)
An investment of $4 million to support the expansion of a sawmill in Eganville. The project will allow the fast-growing mill to continue to grow its business and increase efficiency by modernizing its facilities and purchasing new equipment. The project will create and retain 108 jobs in the community.
Chapter III: Creating Opportunities and Security 85
CHAPTER
III
Investing in the Future of Ontario’s Auto Sector
The government continues to make strategic investments to create and retain jobs in the auto
sector. Since 2004, Ontario has committed $1.35 billion, leveraging $15.62 billion in private‐sector
investments, which has helped support 70,524 direct jobs, as well as thousands more in the auto
supply chain. Recently, the government announced the following new investments:
In January 2017, the government secured an investment by Honda of up to $492 million by
committing up to $41.8 million for upgrades at its Alliston assembly plant. This includes a
new state‐of‐the‐art paint shop and leading‐edge vehicle assembly technologies, as well as
R&D, and will support future vehicle models while securing 4,000 direct jobs.
In March 2017, the government secured an investment by Ford of over $1 billion by
committing up to $102.4 million for projects including upgrades to its Windsor Engine Plant
to preserve 500 jobs. The investment also establishes a global Connectivity Innovation
Centre with almost 300 new engineering positions in Ottawa, Waterloo and Oakville,
along with significant additional R&D expenditures.
Supporting Ontario’s Manufacturing Sector
Ontario’s dynamic and diverse manufacturing sector is sustaining jobs across the province and
generating most of Ontario’s goods exports. Manufacturing directly accounts for over 660,000 jobs
and generates over 12 per cent of Ontario’s GDP. Supported by greater demand and a more
competitive Canadian dollar, Ontario manufacturing sales increased over 37 per cent between
2009 and 2016, to almost $301 billion.
The Province has taken significant measures to help support the growth of the manufacturing
sector. Ontario’s competitive business taxes have helped maintain the province’s position as an
attractive jurisdiction for manufacturing investment. Additionally, significant investments through
the Jobs and Prosperity Fund have helped to secure anchor investments across a variety of key
manufacturing sectors, including auto, aerospace, chemicals and food processing.
Ontario is taking action to help manufacturers manage electricity costs. On January 1, 2017,
the Industrial Conservation Initiative, which helps large electricity users reduce their bills by
providing an incentive to shift electricity consumption to off‐peak hours, was expanded to include
more than 1,000 newly eligible customers by reducing the threshold for eligibility and opening the
program to all sectors. The Northern Industrial Electricity Rate Program allows qualifying large
northern industrial energy consumers reduce electricity costs to help maintain competitiveness.
The Corporate Income Tax (CIT) rate on income from resources, manufacturing and processing
(M&P) was reduced from 12 per cent to 10 per cent in 2010. Ontario manufacturers and
processors also benefit from an accelerated depreciation rate for manufacturing and processing
machinery and equipment from 2016 to the end of 2025.
86 Chapter III: Creating Opportunities and Security
Supporting Growth in Ontario’s Agricultural Sector
Ontario’s agri‐food sector — including primary agriculture, food and beverage processing and
services — is a cornerstone of the economy and helps underpin growth in rural Ontario. The sector
contributes over $36 billion to GDP and supports over 800,000 jobs across the province.
Since the announcement in 2013 of the Premier’s Agri‐Food Challenge for the sector to double
its growth rate and create 120,000 jobs by 2020, the agri‐food sector has created over
40,000 net new jobs.
The government recognizes the importance of risk management for farmers across the province
and continues to support farmers through farm income stabilization and business risk
management programs.
The government will also continue to partner with other provinces, territories and the federal
government to create Canada’s next agri‐food policy framework.
In March 2017, the government announced $19 million for the Greenhouse Competitiveness and
Innovation Initiative to help the greenhouse farming sector invest in innovative technologies,
reduce production costs and increase productivity. The initiative will also help greenhouses
expand their businesses, attract new investment and create good jobs. In 2016, Ontario’s
greenhouse sector and related value chain supported over 81,000 jobs and $3.2 billion towards
Ontario’s GDP. The government will continue to provide the greenhouse sector with supports to
foster jobs and economic prosperity in the province.
Budget Talks: Reducing and Preventing Food Waste This pilot was one of the top three ideas selected by the public for funding through the Budget Talks platform.
To help keep edible food from ending up in the green bin or garbage can, the Province will introduce a Supermarket Recovery Program to redistribute food to Ontarians in need.
The pilot program will make grants available to food banks and food rescue organizations to expand their capacity to transport and store surplus perishable and prepared foods.
The idea will receive a one-time investment of $600,000 in 2017–18, and progress updates will be provided throughout the year at Ontario.ca/budgettalks.
Chapter III: Creating Opportunities and Security 87
CHAPTER
III
Promoting Regional Economic Development
Ontario’s prosperity arises from the collective economies of its regions. Over time, these regional
economies have evolved in different ways, based on their respective strengths and specialities.
Strong Growth in Ontario’s Regional Economies in 2016
All of Ontario’s regional economies experienced job gains. Employment growth was strongest in eastern Ontario, increasing by 1.8 per cent.
Unemployment rates declined in northern, eastern and southwestern Ontario as well as the GTA. The unemployment rate in central Ontario remained unchanged at 5.9 per cent, the lowest in Ontario, and lower than the provincial and national average.
Guelph (4.8 per cent) and Peterborough (5.1 per cent) had the second- and third-lowest unemployment rates among all Canadian major metropolitan areas.
Despite the strong growth Ontario is experiencing, there is still work to be done to create
opportunities for further economic growth across the province. The government is committed to
developing regional economic development plans that will include strategies to build on the
unique strengths of each region and aim to bolster their economic growth. Ontario will continue
consultations this summer and work in partnership with key stakeholders, including communities,
business, labour partners, and colleges and universities to develop these plans.

88 Chapter III: Creating Opportunities and Security
Investing in Regional and Community Partnerships
Investing in regional development is a vital part of the government’s plan to strengthen Ontario’s
economy and create a dynamic environment where businesses thrive.
TABLE 3.4 Recent Regional Development Investments
Company Amount Outcome Description
DRS Technologies Canada Ltd.
$718,482 274 jobs created and retained
Ontario supported an investment in Kanata in new equipment and facility expansion through the Eastern Ontario Development Fund (EODF). The plant manufactures electronics for aerospace, defence and space applications.
Dajcor Aluminum Ltd. $1 million 175 jobs created and retained
Ontario supported an investment through the Southwestern Ontario Development Fund (SWODF) in new state-of-the-art fabrication equipment that will increase capacity and efficiency, enabling Dajcor to expand into new markets. The Chatham-based company manufactures extruded and fabricated aluminum components used in various applications that include automotive, marine and construction.
Mariposa Dairy $500,000 146 jobs created and retained
Through the Rural Economic Development (RED) program, Ontario supported Mariposa Dairy in becoming an industry leader through the introduction of cutting-edge equipment. The company, located in Kawartha Lakes, produces high-quality goat and sheep cheese.
Stack Brewing Corp. $918,183 34 jobs created and retained
Ontario supported an investment in equipment and leasehold improvements to increase brewing capacity at Stack Brewing through the Northern Ontario Heritage Fund Corporation (NOHFC). The Sudbury-based company produces craft beer that is available across Ontario.

Chapter III: Creating Opportunities and Security 89
CHAPTER
III
Strengthening Indigenous Communities
Ontario has made it a priority to improve social, economic and health outcomes for Indigenous
peoples by investing in an Aboriginal Economic Development Fund (AEDF) designed to improve
access to financing, skills training and community economic planning supports.
In 2016, the Province committed to investing $70 million over the next seven years to extend the
fund, originally launched in 2014, for a total combined investment of $95 million over 10 years.
To date, Ontario has funded 57 projects with Indigenous partners through the AEDF.
Aboriginal Community Capital Grants Program
The Aboriginal Community Capital Grants Program (ACCGP) promotes strong Indigenous
communities, by funding community capital projects that provide a delivery point for community
services and business activity. The ACCGP provides funding for First Nation communities and
Indigenous organizations to build or renovate needed community infrastructure, such as
community centres, daycare facilities or small business centres.
From 2003 to 2016, Ontario has provided more than $38 million in capital grants to Indigenous
communities through the ACCGP. Ontario will invest $3 million through the ACCGP in 2017–18.
Kenora‐based Raysolar Inc., a renewable energy solutions company, sells and installs solar systems, including panels. With an investment from the AEDF, the company built a warehouse in Kenora and supported five jobs.
Dynamo’s Industries Inc. builds play structures in Ontario. With support from the AEDF, the company created 10 new full‐time positions in Plantagenet.
90 Chapter III: Creating Opportunities and Security
Helping Businesses Find Skilled Newcomers
Ontario is continuing to help businesses by accepting more skilled newcomers through the Ontario
Immigrant Nominee Program (OINP). Through the OINP, Ontario nominates people for permanent
resident status, including skilled workers, international students, temporary workers and
experienced entrepreneurs with established foreign companies who are looking to expand their
business operations in Ontario. Recognizing the success of the OINP and its importance to
Ontario’s economy, the federal government has increased the province’s 2017 allocation by
500 nominees to a total of 6,000. The OINP is also modernizing its application process this year
with a new, paperless online system that will speed up the application process, improve customer
service, and help employers find the skilled workers they need more quickly.
Social Enterprises Ontario’s growing and diverse social enterprise sector
currently supports approximately 10,000 enterprises.
These social enterprises contribute to job creation
while also creating positive social outcomes,
including providing employment opportunities and
training to persons facing barriers. To further
accelerate the growth of the social enterprise sector, the Province launched Ontario’s Social
Enterprise Strategy 2016–2021 in summer 2016.
Since the launch of the strategy, the Province has partnered with the Ontario Network of
Entrepreneurs (ONE) to build capacity and provide specialized supports to social entrepreneurs.
The Province also launched the second round of the Social Enterprise Demonstration Fund and
opened applications for 200 vouchers through the Ontario Social Impact Voucher Program.
These programs support Ontario’s social enterprises by providing access to capital and
value‐added supports and services.
Social Enterprise Makes an Impact across Ontario Komodo Open Lab is a Picton-based company that develops Tecla, a set of hardware and software tools that allow people with mobility disabilities to operate touchscreen devices. Tecla provides users with new ways of operating their phones, tablets and computers, enhancing their independence.
What is a Social Enterprise? Social enterprises are organizations that use business strategies to achieve positive social or environmental impacts.
Chapter III: Creating Opportunities and Security 91
CHAPTER
III
Supporting the Sharing Economy
Ontario recognizes the sharing economy as an integral part of an innovation‐driven economy with
potential to stimulate entrepreneurship, productivity and economic growth. Sharing economy
platforms continue to leverage technology to diversify traditional business models and are
becoming increasingly popular among consumers. Participating in the sharing economy can
provide Ontarians with economic benefits including increased choice, affordability and better
resource utilization.
Recent data from Statistics Canada showed seven per cent of adults over the age of 18 used ride- or home-sharing services in 2015–16, spending $241 million in ride services and over $1 billion in home-sharing services, with $367 million of that spent in Canada. Ontarians were the highest users of ride-sharing services (11 per cent of the population), and the third highest users of home-sharing services (4.3 per cent of the population) behind British Columbia and Alberta.
Since the 2016 Budget, the Province has continued to use a whole‐of‐government approach to
support the growth of the sharing economy while also protecting workers, consumers and
communities. This includes closing the gap in auto insurance coverage for private vehicles for hire,
and undertaking a Changing Workplaces Review that takes into consideration new employment
structures.
Collaborating with Cities
Building on the government’s commitment to explore a framework for home‐sharing in Ontario
that balances municipal and provincial responsibilities and objectives, the Province is collaborating
with the City of Toronto to increase Ontario’s understanding of municipal concerns and inform the
Province’s framework. The Province is also engaged with the Large Urban Mayor’s Caucus of
Ontario (LUMCO) and the City of Guelph to investigate how municipalities may address local issues
and opportunities associated with the sharing economy at the community level. The Province and
LUMCO will develop assessment tools to help councils and communities analyze the impact of
various online services on their residents and on new and existing businesses.
Mapping the Provincial Sharing Economy Strategy
In 2017, the government will release its integrated Sharing Economy Strategy. Using broad,
evidence‐based research, the strategy will reflect the Province’s principled approach to supporting
the new innovation economy, while ensuring strong standards for consumer protection and
worker well‐being.
The strategy will build on Ontario’s commitment to respect existing business interests by
modernizing regulations and reducing red tape.
92 Chapter III: Creating Opportunities and Security
The Province is also partnering with Ryerson University to co‐host three policy research and
design events. Participants will explore how social enterprise initiatives can innovate and
collaborate with government and communities to grow the sharing economy while creating
positive social and environmental impact.
Ontario is well positioned to lead the way as it prepares a highly skilled workforce to play a key
role in growing an innovation‐driven, knowledge‐based digital sharing economy. This economy will
create jobs, support businesses, satisfy consumers’ demand for choice, and operate in a fair and
competitive marketplace with minimal government intervention.
Transitioning to a Low-Carbon Economy
Fighting climate change is key to creating the kind of
future Ontarians want. Rising average temperatures
have already led to widespread extreme weather
events, including severe storms, flooding and heat
waves, which have damaged communities, homes,
businesses and crops and have also increased
insurance rates. A study conducted by the Canadian
Medical Association also indicated that the economic
costs of air pollution were over $8 billion in 2008.6
Forests, wildlife, agriculture and tourism are facing new challenges in a changing climate. In the
Far North, rising temperatures in recent years have shortened the duration of winter roads,
which are an important economic lifeline to remote communities. These impacts and the
associated costs will only worsen if timely action is not taken. To avoid the potentially devastating
impacts of climate change in the future, reducing greenhouse gas (GHG) emissions today is crucial.
Acting now also positions the economy to take advantage of the accelerating global transition
towards the production and use of low‐carbon goods and services.
That is why Ontario has committed to a plan that will result in economic growth and job creation
by protecting the environment against further climate change. Through steps being taken today,
Ontario is tackling climate change in a way that produces a cleaner environment, builds a
low‐carbon economy and creates jobs. Over the past year, the release of the Climate Change
Action Plan and the recent implementation of a program to cap emissions have already begun to
deliver results through key investments that will improve the everyday lives of Ontarians while
helping to reduce GHG emissions.
5 http://www.ontla.on.ca/committee‐proceedings/committee‐reports/files_html/ pre‐budget%20consultation%202017%20report%20english%20‐%20final.htm
6 http://www.simcoemuskokahealth.org/docs/default‐source/jfy‐communities/pdf_jfy_municipality_enewsletter_feb2010_cma_icap_sum_e
The Standing Committee on Finance and
Economic Affairs (SCFEA) recommended5 that the Minister of Finance commit to:
Continue the implementation of Ontario’s first five-year plan to fight climate change, reduce GHG pollution and transition to a low-carbon economy.
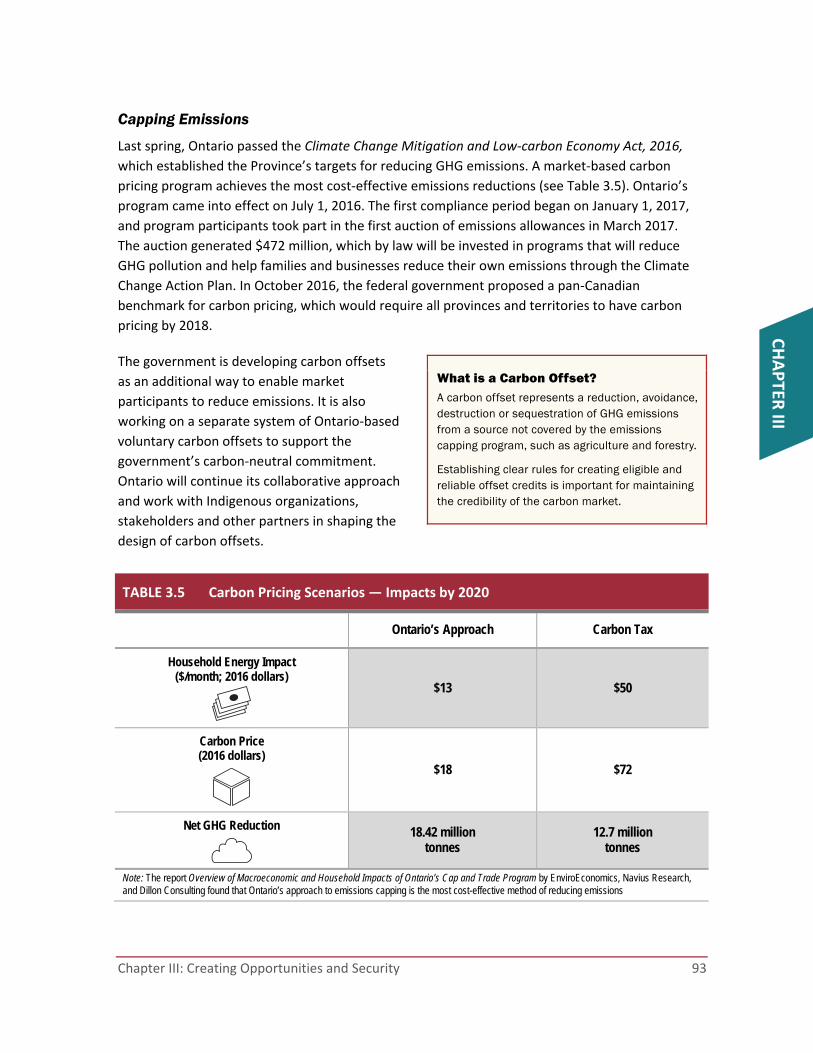
Chapter III: Creating Opportunities and Security 93
CHAPTER
III
Capping Emissions
Last spring, Ontario passed the Climate Change Mitigation and Low‐carbon Economy Act, 2016,
which established the Province’s targets for reducing GHG emissions. A market‐based carbon
pricing program achieves the most cost‐effective emissions reductions (see Table 3.5). Ontario’s
program came into effect on July 1, 2016. The first compliance period began on January 1, 2017,
and program participants took part in the first auction of emissions allowances in March 2017.
The auction generated $472 million, which by law will be invested in programs that will reduce
GHG pollution and help families and businesses reduce their own emissions through the Climate
Change Action Plan. In October 2016, the federal government proposed a pan‐Canadian
benchmark for carbon pricing, which would require all provinces and territories to have carbon
pricing by 2018.
The government is developing carbon offsets
as an additional way to enable market
participants to reduce emissions. It is also
working on a separate system of Ontario‐based
voluntary carbon offsets to support the
government’s carbon‐neutral commitment.
Ontario will continue its collaborative approach
and work with Indigenous organizations,
stakeholders and other partners in shaping the
design of carbon offsets.
TABLE 3.5 Carbon Pricing Scenarios — Impacts by 2020
Ontario’s Approach Carbon Tax
Household Energy Impact ($/month; 2016 dollars)
$13 $50
Carbon Price (2016 dollars)
$18 $72
Net GHG Reduction
18.42 million tonnes
12.7 million tonnes
Note: The report Overview of Macroeconomic and Household Impacts of Ontario’s Cap and Trade Program by EnviroEconomics, Navius Research, and Dillon Consulting found that Ontario’s approach to emissions capping is the most cost-effective method of reducing emissions
What is a Carbon Offset? A carbon offset represents a reduction, avoidance, destruction or sequestration of GHG emissions from a source not covered by the emissions capping program, such as agriculture and forestry.
Establishing clear rules for creating eligible and reliable offset credits is important for maintaining the credibility of the carbon market.
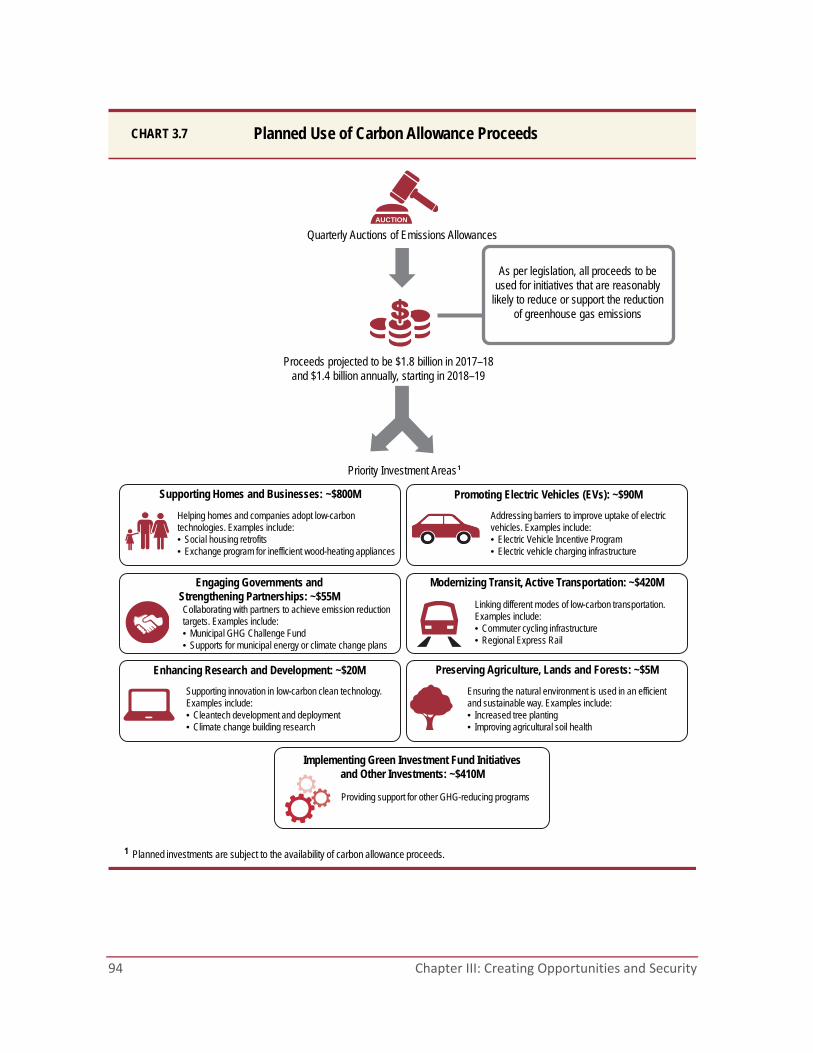
94 Chapter III: Creating Opportunities and Security
Planned Use of Carbon Allowance ProceedsCHART 3.7
Priority Investment Areas
Proceeds projected to be $1.8 billion in 2017–18 and $1.4 billion annually, starting in 2018–19
Quarterly Auctions of Emissions Allowances
Providing support for other GHG-reducing programs
As per legislation, all proceeds to be used for initiatives that are reasonably
likely to reduce or support the reduction of greenhouse gas emissions
Helping homes and companies adopt low-carbon technologies. Examples include:• Social housing retrofits• Exchange program for inefficient wood-heating appliances
Linking different modes of low-carbon transportation. Examples include:• Commuter cycling infrastructure• Regional Express Rail
Supporting innovation in low-carbon clean technology. Examples include:• Cleantech development and deployment • Climate change building research
Ensuring the natural environment is used in an efficient and sustainable way. Examples include:• Increased tree planting• Improving agricultural soil health
Addressing barriers to improve uptake of electric vehicles. Examples include:• Electric Vehicle Incentive Program• Electric vehicle charging infrastructure
AUCTION
Collaborating with partners to achieve emission reduction targets. Examples include:• Municipal GHG Challenge Fund• Supports for municipal energy or climate change plans
Supporting Homes and Businesses: ~$800M Promoting Electric Vehicles (EVs): ~$90M
Engaging Governments and Strengthening Partnerships: ~$55M
Modernizing Transit, Active Transportation: ~$420M
Enhancing Research and Development: ~$20M Preserving Agriculture, Lands and Forests: ~$5M
Implementing Green Investment Fund Initiatives and Other Investments: ~$410M
1
1 Planned investments are subject to the availability of carbon allowance proceeds.

Chapter III: Creating Opportunities and Security 95
CHAPTER
III
Investing to Grow a Low-Carbon Economy
At the centre of Ontario’s climate change strategy is its five‐year Climate Change Action Plan,
which guides the investment of proceeds from carbon allowances and outlines ways to make a
positive difference in people’s everyday lives and create jobs in a low‐carbon economy. Proceeds
are already being invested in initiatives, which will make it easier for Ontarians to make better
choices that benefit them and support a low‐carbon economy.
Ontario is investing $377 million in 2017–18 through the Green Ontario Fund to make
it easier for households and businesses to adopt proven low‐carbon technologies. It will
provide a range of programs, incentives and information to assist households, including
low‐income households and Indigenous communities. The fund will also work with SMEs as
well as with large industries to adopt new technologies to reduce their GHG emissions.
Ontario is providing $200 million in funding in 2017–18 for schools to improve energy
efficiency and install renewable energy technologies. See Chapter IV, Section B: Investing in
Education for more information.
Buildings in Ontario are responsible for nearly 20 per cent of the province’s GHG emissions.7
Ontario is investing $85 million in 2017–18 to support additional retrofit activities in social
housing apartment buildings across the province. These retrofits will reduce GHG emissions
and improve living conditions for low‐income and vulnerable tenants, including those in
small, rural, northern and Indigenous communities.
The Province is investing $50 million in 2017–18 in commuter cycling infrastructure to give
Ontarians a safe and low‐cost commuting alternative between residential communities,
workplaces, major transit stations and other destinations. It will implement cycling facilities
and related infrastructure, such as cycling lanes separated by a curb and cycling signals,
and will remove barriers to local cycling networks. This will enable people to take bikes
and transit for their daily commute instead of personal vehicles, effectively reducing
GHG emissions.
The Province will invest more than $22 million in 2017–18 in electric vehicle (EV) charging
infrastructure across the province, including at government facilities, making electric
vehicles a viable option for more people.
7 National Inventory Report 1990–2014: Greenhouse Gas Sources and Sinks in Canada, Environment and Climate Change Canada (2016).

96 Chapter III: Creating Opportunities and Security
These programs are in addition to the initiatives supported by the Green Investment Fund (GIF)
which are already underway and kick‐starting climate change actions by:
Helping homeowners use less energy and reduce energy bills through home retrofits;
Supporting more electric vehicle charging stations across Ontario;
Retrofitting social housing developments to boost energy efficiency;
Helping businesses reduce emissions;
Funding local environmental organizations doing important conservation work; and
Providing Indigenous communities with training, tools and infrastructure to address
climate change.
As per the Climate Change Mitigation and Low‐carbon Economy Act, 2016, all proceeds from
carbon allowances must be used for initiatives that are reasonably likely to reduce or support
the reduction of GHG emissions, as outlined in Chart 3.7.
Advancing Ontario Clean Technologies To further advance its successful cleantech sector, Ontario is investing in a Cleantech Equity Fund to help firms get the capital they need to grow their businesses and create jobs. In partnering with Ontario Centres of Excellence, the Province is also enabling collaboration among industry, small and medium-sized cleantech companies, and research consortiums to boost cleantech commercialization and adoption.
Ontario cleantech companies are already leading the way:
Toronto-based Ecobee’s smart thermostats are helping residential and commercial users conserve energy.
London-based Trojan Technologies is a global leader in ultraviolet (UV) water purification.
Mississauga-based Electrovaya is known for its advanced lithium ion battery solutions for clean transportation, smart grid and renewable energy.
London’s TrojanUV develops water treatment solutions using environmentally friendly ultraviolet (UV) light.
Chapter III: Creating Opportunities and Security 97
CHAPTER
III
Improving Retirement Security
Evidence suggests that about one‐quarter of Canadian families do not have sufficient retirement
savings. Of middle‐income Canadian families without workplace pension plans, about half are not
saving enough for retirement. The decline in workplace pension plan participation and the
increase in life expectancy have made it more difficult to save enough for retirement. This is why
the Province is focusing on strengthening the retirement income system so that Ontarians can be
confident that they will have a secure retirement.
The recently achieved national agreement to enhance the Canada Pension Plan (CPP) is an
essential part of the Province’s strategy to improve retirement security. Voluntary savings vehicles,
such as pooled registered pension plans (PRPPs), also play an important role in Ontario’s
retirement income strategy.
At the same time, workplace pension plans remain integral to retirement income security,
helping provide many Ontario workers with the resources they need for a healthy and meaningful
retirement. The government is engaged in many initiatives to strengthen and modernize these
plans to build on the strong foundation provided by the CPP so that Ontarians can reach their
retirement savings goals.
Enhancing the Canada Pension Plan
The Province is proud of its central role in achieving an enhancement to the CPP. The legislation
to implement the enhancement came into force in March 2017. This historic accomplishment is
the culmination of years of effort by Ontario, working with the federal government and other
provinces and territories, to make the CPP better meet the retirement savings needs of
today’s workers.
The Ontario government’s leadership and dedication to strengthening retirement security were
fundamental to achieving the CPP enhancement. In late 2013, when faced with an impasse at the
national level, Ontario turned its efforts to the development of the Ontario Retirement Pension
Plan (ORPP). The Province’s advocacy for improving retirement saving, combined with its plans for
introducing the ORPP, played a key role in ensuring that retirement security remained on the
national agenda. Ontario’s work was also essential in driving the negotiations among the federal
government, provinces and territories that resulted in the agreement to enhance the CPP.
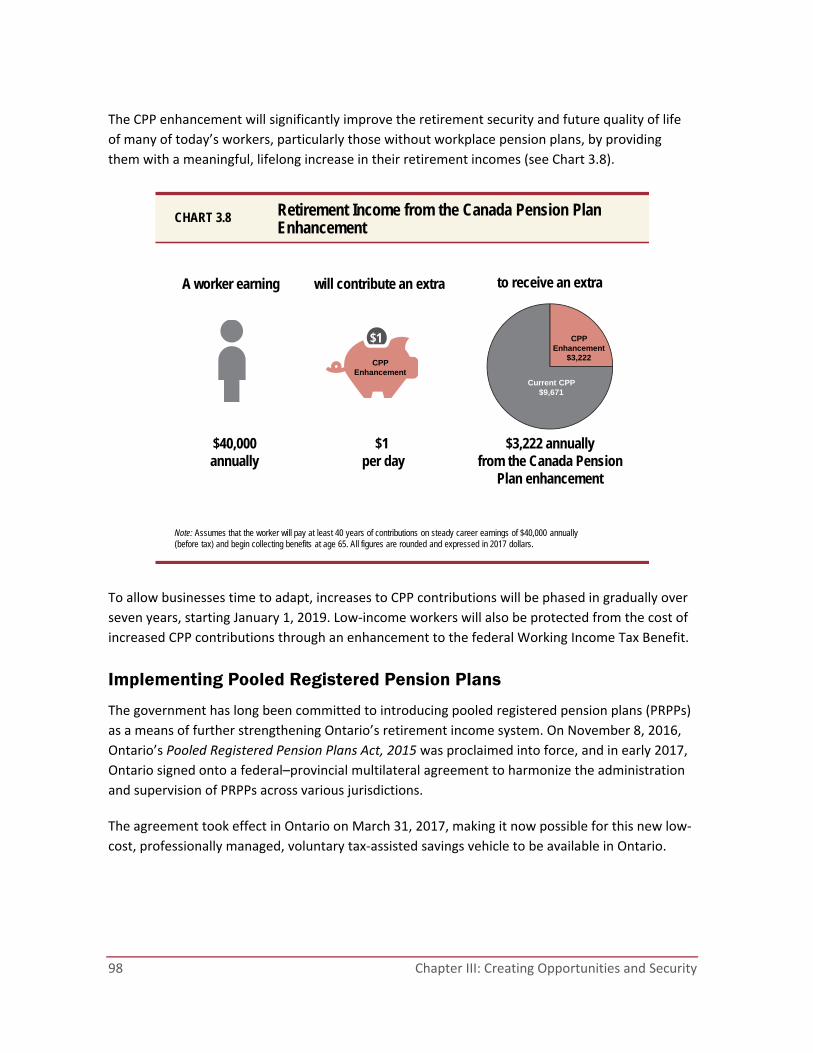
98 Chapter III: Creating Opportunities and Security
The CPP enhancement will significantly improve the retirement security and future quality of life
of many of today’s workers, particularly those without workplace pension plans, by providing
them with a meaningful, lifelong increase in their retirement incomes (see Chart 3.8).
To allow businesses time to adapt, increases to CPP contributions will be phased in gradually over
seven years, starting January 1, 2019. Low‐income workers will also be protected from the cost of
increased CPP contributions through an enhancement to the federal Working Income Tax Benefit.
Implementing Pooled Registered Pension Plans
The government has long been committed to introducing pooled registered pension plans (PRPPs)
as a means of further strengthening Ontario’s retirement income system. On November 8, 2016,
Ontario’s Pooled Registered Pension Plans Act, 2015 was proclaimed into force, and in early 2017,
Ontario signed onto a federal–provincial multilateral agreement to harmonize the administration
and supervision of PRPPs across various jurisdictions.
The agreement took effect in Ontario on March 31, 2017, making it now possible for this new low‐
cost, professionally managed, voluntary tax‐assisted savings vehicle to be available in Ontario.
Retirement Income from the Canada Pension Plan Enhancement
CHART 3.8
Note: Assumes that the worker will pay at least 40 years of contributions on steady career earnings of $40,000 annually (before tax) and begin collecting benefits at age 65. All figures are rounded and expressed in 2017 dollars.
A worker earning
$40,000annually
$1
to receive an extra
$3,222 annually from the Canada Pension
Plan enhancement
Current CPP $9,671
CPP Enhancement
$3,222CPP
Enhancement
will contribute an extra
$1 per day
Chapter III: Creating Opportunities and Security 99
CHAPTER
III
Reviewing the Solvency Funding Framework
An essential aspect of the government’s commitment to improving retirement security is Ontario’s
work to improve the framework for the regulation of defined benefit pension plans and establish a
framework for target benefit pension plans. At the heart of these improvement efforts is the
objective of bringing the frameworks into alignment with current economic realities in a way that
best supports plan sustainability, affordability and benefit security.
Ontario’s current defined benefit funding framework, including solvency funding requirements,
was introduced nearly 30 years ago. While some reforms have been made since then, a changing
economic landscape, volatility in investment returns and low interest rates have created funding
challenges for defined benefit pension plan sponsors. Temporary solvency relief was provided in
2009 and 2012 to assist plan sponsors in managing these challenges. The 2015 Ontario Economic
Outlook and Fiscal Review announced a review of the current solvency funding framework, along
with another round of temporary solvency relief that was enacted in July 2016.
Review of Ontario’s Solvency Funding Framework The solvency funding framework under the Pension Benefits Act forms part of the funding requirements plan sponsors must comply with. While these obligations can at times be challenging for sponsors, the funding rules are intended to ensure that pension plan beneficiaries are provided with a secure benefit. The review of the framework aims to produce a balanced set of reforms that would focus on plan sustainability, affordability and benefit security, and take into account the interests of pension stakeholders — including sponsors, unions, members and retirees.
The review has involved extensive stakeholder engagement, including in‐person consultations
facilitated through a Stakeholder Reference Group; roundtable discussions with representatives
from labour, employers, retirees and plan administrators, including those of jointly sponsored
pension plans in the broader public sector; and individual stakeholder meetings. The government
also reviewed more than 90 submissions that were received in response to its consultation paper
released in July 2016.
The government intends to announce the guiding principles of the new framework later this
spring, with draft regulations released for public consultation in fall 2017. Measures to support
transition to the new framework will also be implemented this spring.
The government is continuing to work with other Canadian jurisdictions to modernize the
agreement that governs multijurisdictional defined benefit pension plans, with the goal
of maintaining protections for Ontario plan beneficiaries while facilitating the operation of
multijurisdictional plans.

100 Chapter III: Creating Opportunities and Security
Introducing a Framework for Target Benefit Pension Plans
The government remains committed to developing a new regulatory framework for target benefit
multi‐employer pension plans (MEPPs). This framework would replace the time‐limited funding
regulations in place for certain MEPPs, known as specified Ontario multi‐employer pension plans
(SOMEPPs), whose members are unionized.
In developing the framework, the government is taking into consideration feedback received from
stakeholders in response to the consultation paper released in summer 2015. The government
intends to announce its proposed target benefit MEPP framework later this spring and release
draft regulations for public consultation in fall 2017. The new framework will provide a transition
period for plans to make necessary adjustments.
The government will also continue to explore options for a target benefit MEPP framework for
plans that do not currently meet the SOMEPP criteria.
Expanding the Framework for Defined Contribution Pension Plans
Defined contribution (DC) pension plans are another important component of retirement security
for Ontarians, since they represent a growing share of workplace pension plans. The government is
taking steps to expand and modernize the legislative and regulatory framework related to DC
plans, and consider innovative options for payouts in retirement.
As a first step, the government is introducing amendments to facilitate the implementation of
variable benefits, and intends to develop regulations later this spring. Enabling the payment
of variable benefits so that payments can be made directly from DC plans would allow retirees
with variable benefit accounts to take advantage of investment expertise and cost efficiencies
of the plan.
Effective disclosure to pension plan members, investors and consumers is one of Ontario’s
priorities in all areas of pension and financial services regulation. It is critical that DC plan members
be given the information necessary to make informed decisions around their retirement planning.
For example, members’ annual statements could provide more guidance with respect to the
retirement income than a DC plan may be able to generate. The government will engage DC plan
sponsors, the financial services industry and pension experts on potential changes to the annual
statements that could help DC plan members prepare more effectively for retirement. The
government will also explore other options to enhance transparency that would modernize
member communications and create regulatory efficiencies.
More broadly, Ontario will examine new approaches to managing the payout phase in retirement,
often referred to as the “decumulation phase,” when retirees are drawing down their savings in
order to produce retirement income.

Chapter III: Creating Opportunities and Security 101
CHAPTER
III
As more workers with DC plans and other capital accumulation plans, such as PRPPs, retire,
ensuring that these individuals have enough funds to maintain their standard of living throughout
their retirement years will become increasingly important. The Province will engage the federal
government, the financial services industry and pension experts to explore new avenues for
Ontarians to manage investment and longevity risk. These would include new tools for Ontarians
to draw down their savings in an efficient and cost‐effective manner during the decumulation
phase of their retirement.
The government will also explore other options to strengthen DC participation and performance.
Expanding the Powers of the Superintendent
The 2016 Economic Outlook and Fiscal Review announced that Ontario is taking steps to
strengthen the regulatory oversight of workplace pension plans. In the fall of 2016, amendments
to the Pension Benefits Act (PBA) were enacted to provide the Superintendent of Financial Services
(Superintendent) with the authority to impose administrative monetary penalties (AMPs) in the
pensions sector. Regulations required to implement AMPs will be posted this spring for public
consultation.
Additional amendments are being introduced to further enhance the powers of the
Superintendent. These amendments would give the Superintendent new powers, including the
authority to direct a plan administrator to provide plan beneficiaries with information specified by
the Superintendent, and to hold a meeting to discuss matters specified by the Superintendent.
The government will continue to develop other amendments to better protect pension plan
beneficiaries and ensure more effective and efficient regulation of the sector, taking into account
the experience of other jurisdictions.
Missing Beneficiary Requirements
The government is aware of the gap in the legislative and regulatory framework concerning
pension plan beneficiaries who are difficult to locate. Currently, there are no guidelines in Ontario
for locating missing plan beneficiaries and no ability to deal with monies owed to plan
beneficiaries if they do not come forward to claim their benefits. For those plan administrators
attempting to wind up pension plans, the inability to pay benefits to missing individuals can add
delay and costs. For plan beneficiaries, it can be difficult to locate a benefit many years after
leaving an employer.

102 Chapter III: Creating Opportunities and Security
To address this situation and modernize the current framework, the government will instruct the
Superintendent to develop a policy to provide direction to administrators on steps they should
take to locate beneficiaries. As some individuals may be difficult to locate, which can mean both
increased cost and the risk of privacy violations, the government will also introduce an
amendment to the PBA providing authority to the Superintendent to waive the requirement of
providing periodic pension statements in situations where a plan administrator can demonstrate
that the beneficiary should be considered missing.
The government will consider further changes to assist employers in dealing with missing
beneficiaries and help individuals in locating pension benefits. These changes may include,
for example, a registry where employers or administrators could post information regarding
missing beneficiaries and individuals could search for missing benefits. The government will also
explore options to allow the wind‐up of pension plans in cases where missing beneficiaries remain,
while continuing to protect the benefits of those who are missing.

puBlic services You can count on
chapter iv

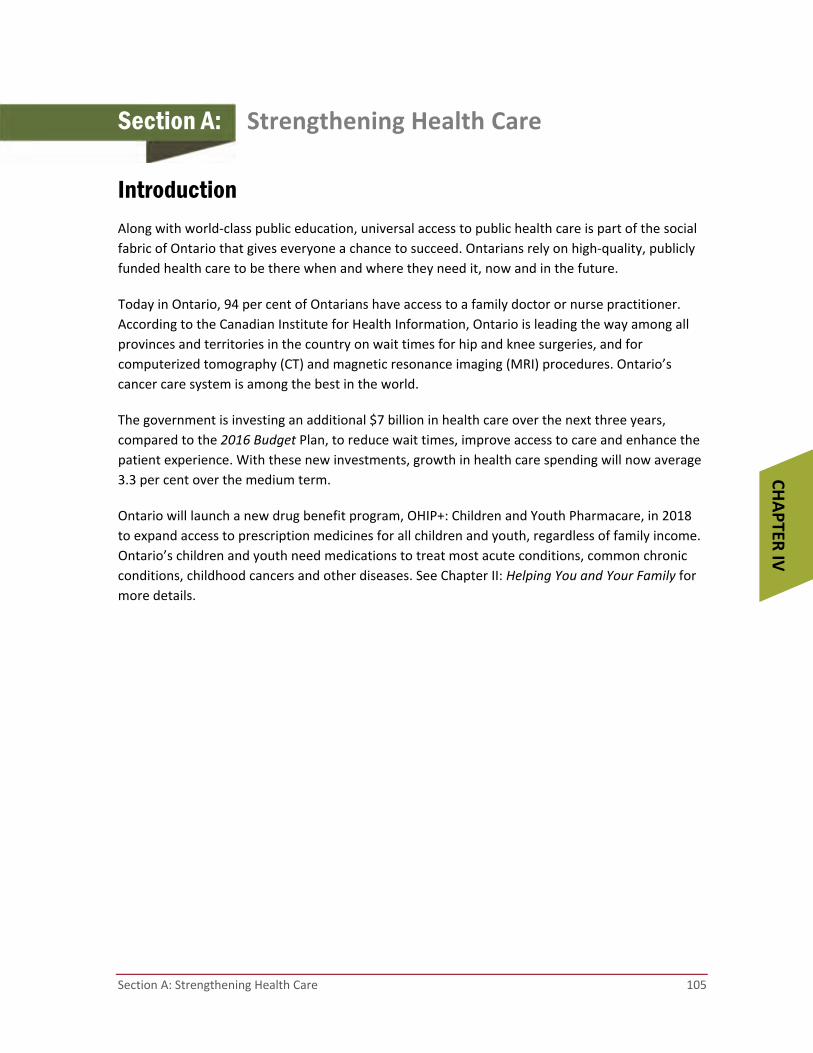
Section A: Strengthening Health Care 105
CHAPTER
IV
Section A: Strengthening Health Care
Introduction Along with world‐class public education, universal access to public health care is part of the social
fabric of Ontario that gives everyone a chance to succeed. Ontarians rely on high‐quality, publicly
funded health care to be there when and where they need it, now and in the future.
Today in Ontario, 94 per cent of Ontarians have access to a family doctor or nurse practitioner.
According to the Canadian Institute for Health Information, Ontario is leading the way among all
provinces and territories in the country on wait times for hip and knee surgeries, and for
computerized tomography (CT) and magnetic resonance imaging (MRI) procedures. Ontario’s
cancer care system is among the best in the world.
The government is investing an additional $7 billion in health care over the next three years,
compared to the 2016 Budget Plan, to reduce wait times, improve access to care and enhance the
patient experience. With these new investments, growth in health care spending will now average
3.3 per cent over the medium term.
Ontario will launch a new drug benefit program, OHIP+: Children and Youth Pharmacare, in 2018
to expand access to prescription medicines for all children and youth, regardless of family income.
Ontario’s children and youth need medications to treat most acute conditions, common chronic
conditions, childhood cancers and other diseases. See Chapter II: Helping You and Your Family for
more details.

106 Chapter IV: Public Services You Can Count On
Summary of New Investments Increasing Access
Building New Hospitals — an additional $9 billion over 10 years to support the construction
of new major hospital projects across the province. These transformational investments
will provide Ontarians with faster access to care and support the delivery of high‐quality
services.
Increasing Operating Funding for All Public Hospitals — an investment of $518 million will
provide a three‐per‐cent increase to the hospital sector. This investment will support vital
hospital services, keep wait times low, and maintain access to elective surgeries.
Enhancing Interprofessional Primary Care Teams — $15‐million investment to enhance
Ontarians’ access to primary care and a suite of OHIP‐funded non‐physician specialized
health services.
Modernizing and Enhancing Cancer Screening — enabling early identification and
treatment based on the latest evidence.
Reducing Wait Times
Reducing the Time to See a Specialized Care Provider through an additional investment of
$245 million over three years in enhanced referral pathways for treatment of back pain and
other bone and joint conditions, including using new digital tools like eReferrals, and the
expansion of a central intake system for each Local Health Integration Network (LHIN).
Reducing Wait Times for Key Services through an additional investment of $890 million
over three years by funding more procedures such as foot, knee, hip and cataract surgeries,
and other priority procedures.
Expanding Home and Community Care through an additional investment of $85 million
over three years to enhance programs such as home nursing, personal support and
physiotherapy as well as respite care services. Home and community care programs provide
valuable services to Ontarians, including 23,000 home care visits per day.
Faster Access to Mental Health Services through an additional investment of $74 million
over three years to provide faster access to mental health services, including new
supportive housing units and structured psychotherapy.

Section A: Strengthening Health Care 107
CHAPTER
IV
Enhancing the Patient Experience
Launching Ontario’s Dementia Strategy with more than $100 million over three years,
improving and better coordinating services for Ontarians living with dementia, and their
caregivers.
Expanding the Northern Health Travel Grant Program through a $10‐million enhancement
that helps northern patients with costs associated with receiving care outside their
communities.
Helping People Live Well in Their Homes by investing $18 million in new funding for
community programs, such as Meals on Wheels and transportation support.
Improving Maternal Care, such as funding breast pumps for mothers of premature babies,
enhanced newborn screening and more midwifery services.
What We’ve Been Doing since 2013
Adding almost 1,700 additional doctors and over 8,400 more nurses to provide Ontario families with quality care
Improving access to home and community care and increasing wages for personal support workers
Enabling more seniors to qualify for lower out-of-pocket drug costs and offering free shingles vaccines to those aged 65–70
Providing approximately $4 billion in capital grants to expand, renew and modernize hospitals
Approximately 39 major hospital projects have been completed or are under construction
Enabling more than 365,000 children and youth from low-income families to be eligible for free dental services
Helping more than 7,200 families each year by covering the cost of one cycle of in vitro fertilization
Expanding mental health supports for more than 50,000 children and youth by hiring more front-line staff in schools, communities and courts
Strengthening Health Care

108 Chapter IV: Public Services You Can Count On
Increasing Access Building More Health Infrastructure
Investments in health infrastructure support the creation of a sustainable, high-quality health care system that will meet the needs of future generations. Over the next 10 years, the Province plans to provide more than $20 billion in capital grants to hospitals. This includes a new commitment of approximately $9 billion to support the construction of new major hospital projects across the province. These transformational investments will support timely access to the right care, in the right place, at the right time.
The Province is committing to several new priority major hospital projects that will address growing demand for health care services and facility condition deficiencies, and support new and innovative models of care. Continued investment in health infrastructure will ensure that the health system remains sustainable into the future.
The Province has demonstrated its commitment to securing the future of Ontario’s health care system by providing several hospitals with planning grants since 2013. Through detailed upfront planning work, the Province is taking a responsible approach to addressing the emerging needs of the health care system. Planning grants ensure that proposals meet the needs of local communities across Ontario.
TABLE 4.1 Newly Approved Major Hospital Projects
Southwest Niagara Health System — New South Niagara Hospital Capital Project
The project will include construction of a new hospital in support of service transformation in the Niagara Region.
Windsor Regional Health Centre — New Greenfield Hospital Project
The project will include construction of a new hospital in support of service transformation in the Windsor Region.
Central Hamilton Health Sciences — Hamilton Redevelopment Project
The project will address Hamilton Health Sciences’ high-growth needs and update aging infrastructure to meet current hospital standards.
Trillium Health Partners — Broader Redevelopment Project
The project includes investment in the Mississauga Hospital and Queensway Health Centre to add new spaces to address capacity issues, as well as renovate existing space.
North Weeneebayko Area Health Authority — Replacement Hospital Project
Ontario is committing to the provincial share of the project costs for a new hospital to serve the health care needs of the population along the James Bay coast. Ontario will work with the federal government to advance planning for this project.

Section A: Strengthening Health Care 109
CHAPTER
IV
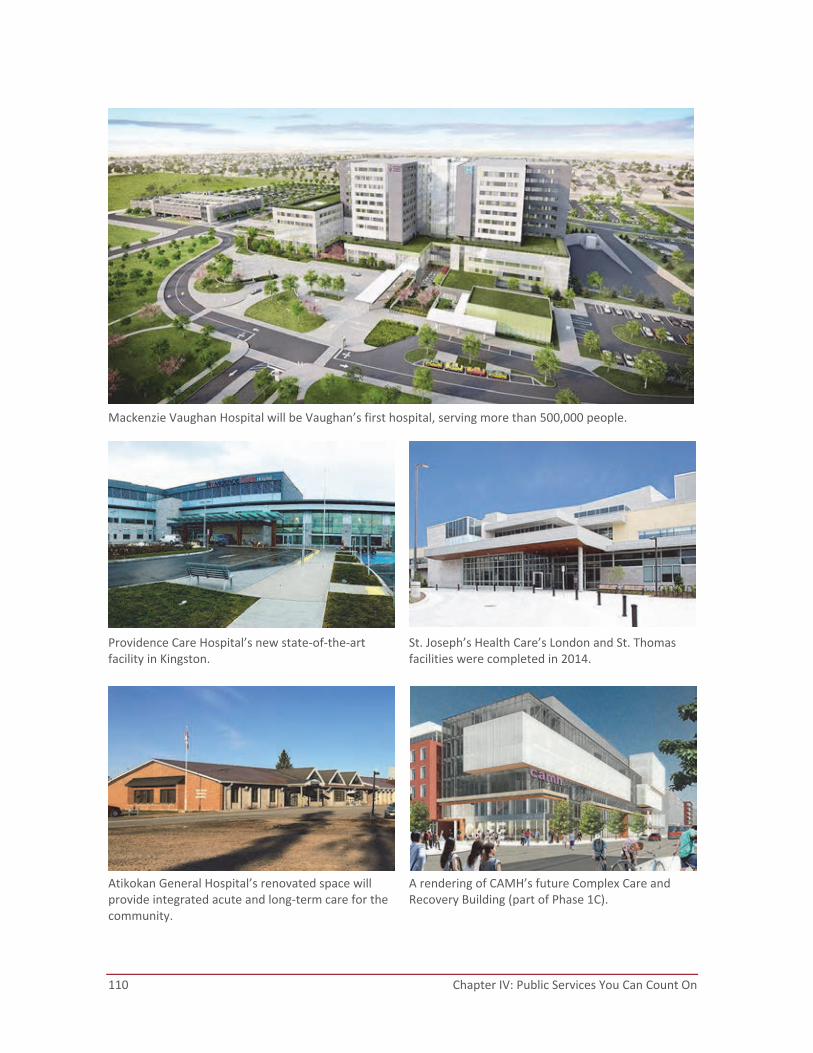
110 Chapter IV: Public Services You Can Count On
Mackenzie Vaughan Hospital will be Vaughan’s first hospital, serving more than 500,000 people.
Providence Care Hospital’s new state‐of‐the‐art facility in Kingston.
St. Joseph’s Health Care’s London and St. Thomas facilities were completed in 2014.
Atikokan General Hospital’s renovated space will provide integrated acute and long‐term care for the community.
A rendering of CAMH’s future Complex Care and Recovery Building (part of Phase 1C).
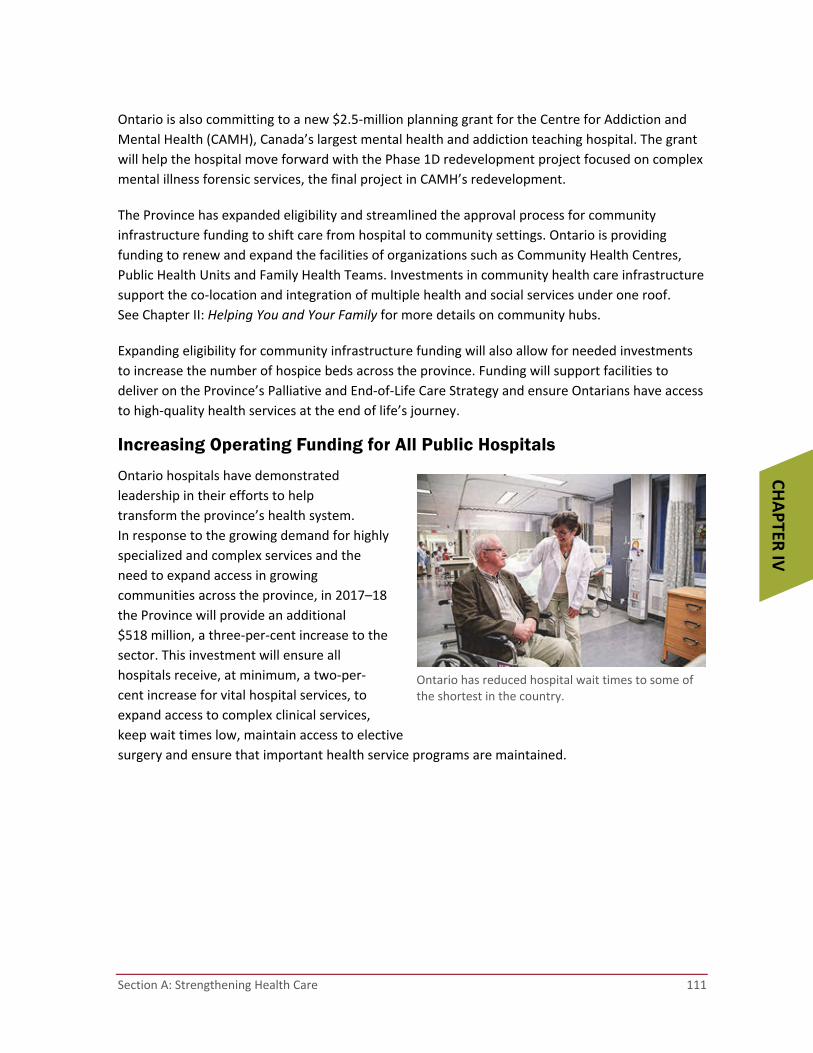
Section A: Strengthening Health Care 111
CHAPTER
IV
Ontario is also committing to a new $2.5‐million planning grant for the Centre for Addiction and
Mental Health (CAMH), Canada’s largest mental health and addiction teaching hospital. The grant
will help the hospital move forward with the Phase 1D redevelopment project focused on complex
mental illness forensic services, the final project in CAMH’s redevelopment.
The Province has expanded eligibility and streamlined the approval process for community
infrastructure funding to shift care from hospital to community settings. Ontario is providing
funding to renew and expand the facilities of organizations such as Community Health Centres,
Public Health Units and Family Health Teams. Investments in community health care infrastructure
support the co‐location and integration of multiple health and social services under one roof.
See Chapter II: Helping You and Your Family for more details on community hubs.
Expanding eligibility for community infrastructure funding will also allow for needed investments
to increase the number of hospice beds across the province. Funding will support facilities to
deliver on the Province’s Palliative and End‐of‐Life Care Strategy and ensure Ontarians have access
to high‐quality health services at the end of life’s journey .
Increasing Operating Funding for All Public Hospitals
Ontario hospitals have demonstrated
leadership in their efforts to help
transform the province’s health system.
In response to the growing demand for highly
specialized and complex services and the
need to expand access in growing
communities across the province, in 2017–18
the Province will provide an additional
$518 million, a three‐per‐cent increase to the
sector. This investment will ensure all
hospitals receive, at minimum, a two‐per‐
cent increase for vital hospital services, to
expand access to complex clinical services,
keep wait times low, maintain access to elective
surgery and ensure that important health service programs are maintained.
Ontario has reduced hospital wait times to some of the shortest in the country.
112 Chapter IV: Public Services You Can Count On
Investing in Primary Care
Primary health care is the entry point to
the health care system for most Ontarians.
Primary care is generally understood as the
first level of care Ontarians turn to, including
the services of family physicians, nurse
practitioners, nurses, pharmacists and others.
These care providers play an important role in
improving the health and well‐being of
Ontarians and helping them access other
health and social services, such as specialized
care and broader community supports. The
experience that Ontarians have in the health
care system is largely influenced by the type
of access, care and coordination they receive
through their primary care provider or team.
Ontario has made considerable improvements in primary care. Currently, 94 per cent of Ontarians
report having access to a regular primary care provider — 1.7 million more people than in 2003.
New models of primary care have been introduced or expanded, including Aboriginal Health
Access Centres, Community Health Centres, Family Health Teams and Nurse Practitioner‐Led
Clinics. Advances have also been made in quality improvement, programs to help people stay
healthy, and care coordination for complex patients.
Access to high‐quality primary care, including prevention and early management of health
problems, a focus on the patient as a whole person, and ensuring appropriate use of specialized
care, can be expected to lead to improved population health, health equity and lower costs
of care.
More Health Care Professionals
Ontario has experienced a significant increase in its health workforce. Since 2013, some notable examples of net increases* include:
98 midwives (16.0%).
1,680 physicians (6.2%).
8,439 nurses (6.4%), including 601 nurse practitioners (29.2%).
* Physician data current to 2015 calendar year. Nurse and midwife statistics current to 2016.
Improving access to primary care by recruiting nurse practitioners, social workers and registered dietitians.
Section A: Strengthening Health Care 113
CHAPTER
IV
Enhancing Interprofessional Primary Care Teams
Since 2003, the government has created 184 Family Health Teams and 25 Nurse Practitioner‐Led
Clinics, and has expanded and supported 75 Community Health Centres and 10 Aboriginal Health
Access Centres.
These interprofessional primary care organizations deliver comprehensive primary care services
and programs through a team of health care professionals, including physicians, nurse
practitioners, registered nurses, physician assistants, dietitians, pharmacists, mental health
workers, social workers, psychologists, physiotherapists, chiropractors and other professionals.
Programs are designed and delivered around the holistic needs of patients, ranging from programs
to help people manage their chronic diseases, to services that help with life challenges that
negatively impact health.
Collectively, these 294 primary care organizations are delivering team‐based, OHIP‐funded
comprehensive care to more than 4 million Ontarians.
The Province’s investments in these models of team‐based care have helped to improve access to
primary care for communities that need it most, resulting in health care improvement
in communities across the province. In 2017, Ontario will invest an additional $15 million in
team‐based primary care to create new or expand existing interprofessional care teams so that
all 76 sub‐regions across the province have a team.
To further support and improve these important services, the government is continuing its
commitment by investing an additional $145 million over the next three years to effectively recruit
and retain nurses, nurse practitioners, dietitians, social workers, pharmacists, reception staff and
other care providers who provide valuable services alongside family doctors on these teams. This
is in addition to the $85 million in investments in interprofessional teams announced in the 2016
Budget.
Expanding Registered Nurses’ Scope of Practice
To further reduce wait times for key health services, Ontario has also expanded scopes of practice
for some health professionals. Most recently, the government has taken steps toward expanding
the scope of practice of registered nurses so they can independently prescribe some medications
to patients. This initiative would give patients more choice in primary care and improve timely
access to care and patient experience, particularly in rural and northern communities. Starting in
2017, Ontario will further improve access by expanding or enhancing the scopes of practice for
additional health care providers.

114 Chapter IV: Public Services You Can Count On
Increasing Equitable Access to Health Care through Ontario’s First Nations Health Action Plan
Investing in the health and wellness of
Indigenous communities is one of many
steps on Ontario’s journey of healing and
reconciliation with Indigenous peoples.
See also Chapter V: Working with Our
Partners for more information on
Ontario’s Commitment to Reconciliation
with Indigenous Peoples.
As highlighted in Ontario’s First Nations
Health Action Plan (OFNHAP), Ontario is
investing nearly $222 million over three
years, followed by sustained funding of
$104.5 million annually, to address health
inequities and improve access to culturally appropriate health services over the long term. While
focused on northern First Nations, where there are significant gaps in health services, the OFNHAP
also includes investments in Indigenous health care across Ontario in home and community care,
primary care, and diabetes prevention and management, both on‐ and off‐reserve.
Providing Health Care for Ontario’s Indigenous Peoples Both federal and provincial governments provide health care services for Indigenous peoples in Ontario. All eligible residents of Ontario, including Indigenous people, are entitled to receive insured health services anywhere in the province. As well, some provincially funded health care services focus on specific needs of Indigenous people, both on- and off-reserve, especially in remote and northern communities. These include:
10 Aboriginal Health Access Centres and five Indigenous-governed Family Health Teams across the province, which provide traditional healing; culturally sensitive primary and chronic care; and mental health, addictions and social support services.
Investing up to $30 million for the development and operation of up to 10 expanded culturally appropriate interprofessional primary care teams.
Physician services for 30,000 people in 28 First Nation communities in the Sioux Lookout region.
Aboriginal midwifery services (described later in this section).
Four on-reserve long-term care homes.
Air and land ambulance services and first response teams for First Nation communities.
The First Nations Health Action Plan focuses on primary and hospital care, public health and crisis support.

Section A: Strengthening Health Care 115
CHAPTER
IV
Advancing Timely Cancer Care and Stem Cell Transplants
Stem cell transplants can be an essential component of treatment for people with lymphoma,
leukemia, myeloma and other blood disorders. While the Province provides funding for Ontario
residents for treatment outside of Canada, the government is building capacity within Ontario
to treat complex cancers so that more Ontarians can receive the care they need closer to home.
Last year, Ontario announced investments of $130 million over three years for cancer care
services. Over the past year, the Province has also announced investments in infrastructure to
improve access to highly specialized stem cell transplant programs at University Health Network,
Hamilton Health Sciences Centre, The Ottawa Hospital and Sunnybrook Health Sciences Centre.
In 2017, the government will focus on continuing to build capacity to provide stem cell transplant
treatment for complex blood cancers within the province by investing an additional $32 million.
This means that up to 150 more Ontarians will receive life‐saving stem cell transplants.
As additional capacity is developed, fewer patients will require transplants in the United States.
Modernizing and Enhancing Cancer Screening
Ontario continues to modernize and enhance cancer screening programs to enable early
identification and treatment based on the latest evidence. Working with Cancer Care Ontario,
the Province will modernize two primary cancer screening tests and develop a new screening
program for those at high risk of developing lung cancer. These tests, based on the latest
technology, include modernizing colorectal cancer screening from the existing fecal occult blood
test (FOBT) to the fecal immunochemical test (FIT), and the primary screening test for cervical
cancer from the existing Papanicolaou (Pap) test to the human papillomavirus (HPV) test for
women aged 30 to 69. In addition, the Province will launch a lung cancer screening project for
people at high risk at three pilot sites: The Ottawa Hospital, Health Sciences North and
Lakeridge Health.
Expanding Access to Safe AbortionIn 2017, Ontario will expand access to health care options for women by publicly funding the new abortion pill Mifegymiso (combination mifepristone/misoprostol).

116 Chapter IV: Public Services You Can Count On
Improving Pain Management
One in five Canadians experiences chronic pain. With new investments, Ontarians will have better
access to support and guidance in managing chronic pain through interprofessional Chronic Pain
Management Clinics and other services. Additionally, health professionals will have better access
to tools and resources that will improve the treatment of chronic pain.
In 2017, the government committed $17 million under this strategy, including funding for five
pediatric hospitals, 11 academic hospitals and one hospital‐affiliated community clinic to enhance
or develop chronic pain programs. In 2018, an additional program is planned for Health Sciences
North, to serve Sudbury and the surrounding area. The programs focus on prescribing principles
and treatments that prioritize patient safety, decrease reliance on opioids in pain management,
and increase patients’ ability to manage pain and improve their quality of life.
Acting on Ontario’s Opioid Strategy
Individuals, families and communities across Ontario have been affected by opioid addiction
and overdose.
Preventing Opioid Overdose One of the key components of Ontario’s Opioid Strategy is the prevention of overdose deaths. Increasing access to naloxone, an anti-overdose medication, is part of the strategy’s commitment to reducing the harm associated with opioid use and misuse.
On June 6, 2016, naloxone kits were made available free of charge, over-the-counter, and without prescription at pharmacies through the Ontario Naloxone Program for Pharmacies (ONPP). Ontario is expanding access to naloxone by providing it in over 200 cities across the province. As of March 31, 2017, over 28,000 naloxone kits have been distributed by over 1,000 participating pharmacies, and at 40 public health units and community-based organizations that provide needle exchange and hepatitis C programs. In addition, new easier-to-use nasal spray kits are available through participating public health units and are being rolled out for at-risk inmates when they are released from provincial correctional facilities. The government is exploring other opportunities to make the nasal spray available for Ontarians, which may include access through pharmacies.
To ensure that patients with opioid addiction are receiving care that allows them to balance
addiction treatment and recovery with the rest of their lives, since 2016, Ontarians have had
greater access to buprenorphine/naloxone (brand name Suboxone) as a first‐line treatment for
opioid substitution therapy.
Supervised injection services (SIS) are one part of the broader strategy that responds to growing
public health concerns related to injection drug use. Community‐supported and community‐run
SIS permit people to inject their own personally acquired drugs in controlled health care settings.
As part of a larger strategy for comprehensive harm reduction, with supports for people struggling
with addiction, SIS will save lives.
Section A: Strengthening Health Care 117
CHAPTER
IV
The government plans to fund three locations for SIS in Toronto and one in Ottawa, pending their
required exemption from federal legislation, and will set up a provincial review panel to consider
future applications for SIS on a case‐by‐case basis.
Preventing Fetal Alcohol Spectrum Disorder (FASD) and Supporting Those Affected by FASD
Ontario is investing $26 million over four years to expand support for children, youth and families
affected by FASD. To increase awareness of the disorder and how it can be prevented, Ontario is
supporting six initiatives that will:
Create one‐stop access to information/training resources;
Provide funding for 56 FASD workers to support approximately 2,500 Ontarians with FASD;
Support parent support networks;
Increase access to FASD initiatives developed by Indigenous partners;
Establish a consultation group to provide advice and feedback to inform implementation
planning and prioritization of efforts; and
Create a research fund and invest in knowledge mobilization.
These initiatives will help reduce the prevalence of the disorder, increase coordination of services,
improve the quality of life for those with FASD, and enhance support for families and caregivers.

118 Chapter IV: Public Services You Can Count On
Reducing Wait Times According to the Canadian Institute for Health Information, Ontario is leading the way among all
provinces and territories in the country on wait times for hip and knee surgeries, as well as MRI
and CT scans.1
Over the next three years, the Province will invest $1.3 billion in additional funding to reduce
wait times, including $890 million for key surgical and other priority procedures; $245 million to
improve specialist access, including new digital solutions to streamline consults and eReferrals;
$85 million in new home and community care services; and $74 million to provide more timely
mental health services.
Thousands of Patients See Benefits through Shorter Wait Times Over 230,000 patients have seen benefits — including shorter waits for needed surgeries, shorter hospital stays and fewer readmissions — linked to the growing use of evidence-based best practices, called Quality-Based Procedures (QBPs). QBPs have been used almost 300,000 times for 24 common conditions, including stroke, congestive heart failure, cataracts, hip fractures, and in hip and knee replacements.
QBPs promote efficient, consistent, high-quality patient care and improve patient outcomes. Providers are compensated based on an established price.
In 2017, Ontario will increase targeted QBP funding by over two per cent to address growing patient demand and reduce wait times for about 4,000 more patients. Increased funding for QBPs is projected to treat over 330 more patients with stroke, 2,800 with incremental hip or knee replacements (up eight per cent over the previous year), about 2,100 more with cataracts and over 500 more with congestive heart failure this year.
Improving Critical Procedures and Wait Times
Since 2003, the Province has made significant investments to help reduce wait times for Ontario
patients, including more than three million additional specialized priority procedures, such as hip
and knee replacements, cancer radiation therapy and cataract surgeries. These investments have
resulted in more than 322 million days of wait time saved for patients since 2005.
In the coming year, to help more patients access the care they need within target times,
the Province is focusing investments on high‐priority procedures where access is challenging or
demand is increasing. These will include more than 28,000 additional MRIs, about 2,100 more
cataract surgeries, as well as over 2,800 more hip or knee replacement surgeries.
1 Canadian Institute for Health Information, “Wait Times for Priority Procedures in Canada” (2017).
https://www.cihi.ca/sites/default/files/document/wait‐times‐report‐2017_en.pdf

Section A: Strengthening Health Care 119
CHAPTER
IV
This year, as part of increased funding for hospitals, Ontario will provide $114 million to increase
the number of critical services available in hospitals and help constrain wait times for treatment,
including new cardiovascular procedures, expanded care for people with rare diseases, and
organ transplants.
Appropriate Care, When and Where It’s Needed A key indicator of whether Ontarians are receiving care when and where they need it is alternative levels of care (ALC) utilization (the proportion of patients who no longer require hospital care but remain in hospital awaiting an available bed or appropriate services elsewhere — whether at home or in the community). Over 15 per cent of hospital beds are currently occupied by patients who are eligible for care in other settings, and who, if they could receive their care elsewhere, would open up hospital beds for others who need them.
In 2017, $24 million in funding will be invested in new innovative models to ensure patients are receiving care in the most appropriate care settings possible — at home or in the community. These new care models will offer patients and care providers more choices and put patients first.
Streamlining Access and Reducing Wait Times for Specialized Care
The government will continue to reduce wait times for health services so that patients can access
specialized care as soon as possible. Ontario is making additional investments to help improve
access to specialized care providers, including $20 million to improve timely, appropriate
and transparent referral pathways to care, with improved electronic tools linking primary and
specialized care providers and interprofessional team services. In addition, the government is
investing $15 million to increase the availability of insured optometry services.
Innovating for Timely Specialized Care
To streamline access to specialized care for patients being assessed for hip or knee replacement
surgery, some regions are using a central intake and assessment centre. Patients who need a
surgical consultation are referred to a surgeon based on their choice or the shortest surgical
waitlist; those whose conditions do not require surgery receive non‐surgical treatment
recommendations. This program will be expanded across the province.

120 Chapter IV: Public Services You Can Count On
Ontario will expand programs like Inter‐professional Spine Assessment and Education Clinics
(ISAECs). ISAECs assess patients’ need for treatment and work with primary and specialized care
providers like chiropractors, physiotherapists and surgeons. They leverage the expertise and full
scope of practice of health professionals, giving patients faster access to the care they need and
reducing their risks, such as opioid addiction through pain management while awaiting treatment.
In 2017, $10 million in new funding will go towards this expansion.
eConsult Many Ontarians already enjoy the benefits of eConsult, a web-based service in which patients have access to advice from specialists. On average, patients receive a response within three business days, and 40 per cent of eConsult cases remove the need for patients to be referred to a specialist for an in-person appointment.
Building on the successful Champlain LHIN BASE eConsult Service, the ministry plans to expand the eConsult service province-wide in 2017–18.
eReferral Working with the eHealth Centre of Excellence, physicians in Waterloo-Wellington can now use an online eReferral system to connect their patients to specialists and other health care services in their community.
In 2017–18, the ministry will explore ways to help make this innovative eReferral system available to patients across the province, starting with its expansion to at least five more LHIN areas.
Section A: Strengthening Health Care 121
CHAPTER
IV
Expanding Home and Community Care
Since 2013, the government has grown its investment in home and community care by about
$250 million per year, in addition to the government’s ongoing funding of more than $5 billion.
This investment has provided more Ontarians with greater access to nursing care, personal
support and caregiver support, and has been foundational to helping more people live
independently at home, where they want to be. The funding has provided more services and more
hours of care for patients. In 2016, 94 per cent of home care clients received home nursing
services within five days of their health care provider’s authorization.2 Part of the home and
community care funding also improved stability in the workforce and enhanced wages for
personal support workers.
Personal Support Worker Registry Personal support workers are at the front lines of care and provide services and supports to the most vulnerable citizens. The government will establish a mandatory registry for personal support workers so that Ontarians have peace of mind knowing that the people delivering essential care have the necessary training to care for them and their loved ones, helping them feel safe and supported. The registry will provide transparent information on details such as education and training, and adherence to a code of conduct.
A continued investment of $250 million in 2017–18 for community and personal support services
will help meet increased demand and support faster and more equitable access to services across
the province. The funding will continue to support more hours of care for complex patients,
much‐needed respite for caregivers, and the delivery of key improvements in mental health and
addiction services. It will also help provide health care for Indigenous peoples, and support
implementation of a strategy to help those affected by dementia, including their caregivers.
See Chapter II: Helping You and Your Family for further details.
Starting in the fall of 2017, Ontario will also support more education and training programs to
support caregivers. The Province is committed to the development of a caregiver toolkit, which
will be available online and in paper format as a resource for these valuable care partners.
2 Health Quality Ontario website, http://www.hqontario.ca/System‐Performance/Home‐Care‐Performance
122 Chapter IV: Public Services You Can Count On
Better system integration, assistance with navigation of services, increased caregiver respite
and more caregiver education and training programs were all key recommendations of the
“Bringing Care Home” report. The government is responding to these recommendations and the
needs of caregivers by creating an organization focused on coordinating supports and
information resources.
Ontario Caregiver Tax Credit To make life a little easier for caregivers so they can focus on helping loved ones, the Province proposes to simplify and improve access to tax relief by replacing the caregiver and infirm dependant tax credits with a new Ontario Caregiver Tax Credit (OCTC). For further details, see Chapter VII: A Fair and Sustainable Tax System.

Section A: Strengthening Health Care 123
CHAPTER
IV
Faster Access to Mental Health and Addiction Services
Mental illness results in more person‐years lost to death than cancer, and requires the same
determined focus on driving improvements to treatment and access to supports and services.
Mental health must be seen as just as important as physical health, and prioritized equally.
The Government of Ontario believes there is no health without mental health.
Phase 1 of Open Minds, Healthy Minds: Ontario’s Comprehensive Mental Health and Addictions
Strategy (from 2011 to 2014) focused on services and supports for children and youth. Building on
those, Phase 2 of the Strategy also includes adults, youth in transition and people with addictions,
and is meant to ensure that every person in Ontario can access consistent, appropriate services,
no matter where they live, so that Ontarians living with mental illness or addiction can recover and
participate more fully in community life.
Ontario already provides more than $3.7 billion in ongoing funding for mental health and
addictions services, including those for children and youth. In February 2017, the Province
announced an additional investment of $140 million over three years to advance the expansion
of important evidence‐based mental health and addictions initiatives.
Care Teams Integrate Bundled Patient Care from Hospital to Home Patients are benefiting from having the support of the same interdisciplinary health care team both when being treated in hospital and later, when recovering at home. This bundled care approach supports smoother patient transitions in several cities in the province, including London, Hamilton, Brampton, Mississauga and Toronto.
Patients are seeing improved initial results:
At four bundled-care sites, emergency department visits after release from hospital dropped by over 25 per cent.
At two sites, patients’ hospital stays were 50 per cent shorter than before.
At three sites, hospital readmission rates declined by half.
When patients get the coordinated care they need, their health care experience is better and they benefit from better outcomes.
Helping more patients transition out of hospital and into their homes with the same health care team.
124 Chapter IV: Public Services You Can Count On
As outlined in Open Minds, Healthy Minds, the Province will create mental health and addictions
services based on recommendations from Ontario’s Mental Health and Addictions Leadership
Advisory Council. The Council consists of representatives from diverse sectors, including experts
and people with lived experience of mental illness and addictions.
Additionally, in recognition of the need to address mental health and addictions across sectors,
the government is establishing a special committee of cabinet to drive system change.
Expanding effective mental health and addictions services will enable people living with mental
illness or addiction to have earlier access to services in their community. This will help improve
access to early identification before crises arise. Investing more in community services is expected
to reduce the frequency and length of patients’ stays in psychiatric facilities or hospitals, and to
support people in the community.
Increased Access to Structured Psychotherapy
The government is investing close to $73 million over three years to provide greater access
to publicly funded structured psychotherapy for thousands of Ontarians living with conditions like
anxiety and depression. Ontario is the first province in Canada to commit to a publicly funded
psychotherapy program. Structured psychotherapy helps people learn strategies to improve
their mental health and their quality of life. More Ontarians will now have access to this
evidence‐based therapy, either online or in‐person, through individual or group sessions.
Meanwhile, the government will work with Health Quality Ontario and other stakeholders to
develop quality standards for a provincial structured psychotherapy program.
Ontario is also exploring opportunities to better integrate patient care for major depression
disorder, by improving referrals to the most appropriate health care providers and expanding tools
linking primary care providers to psychiatrists. This will allow more patients to benefit from well
coordinated, team‐based care.
Providing More Supportive Housing
Ontario is investing more than $45 million over three years to provide up to 1,150 additional
supportive housing units for those with serious mental illness or addictions who are homeless or at
risk of becoming homeless. These housing units would provide residents with support services and
secure, affordable, stable places to live. With these new investments, by 2019, the government
will have funded a total of almost 17,000 units of supportive housing for people living with mental
illness or addictions, and other vulnerable people.
Section A: Strengthening Health Care 125
CHAPTER
IV
Bringing Together Youth Services in One-Stop Hubs
Integrated youth service hubs offer an innovative approach to the early identification of, and
intervention in, mental health and addiction issues among youth and young adults to help prevent
more serious conditions from developing later in life. Working in new ways with community
partners, the government is developing and evaluating a network of up to nine hubs where young
people aged 12 to 25 can find walk‐in, one‐stop access to mental health and addictions services,
as well as other health, social and employment supports in a youth‐oriented environment.
Enhancing Patient Experience Supporting Seniors in Their Communities
Ontario is undertaking a number of important initiatives in 2017 to support the health of seniors
and their families, outlined in further detail in Chapter II: Helping You and Your Family.
The government is launching a new Dementia Strategy that will provide more than $100 million
over three years to expand access to the most appropriate care and supports province‐wide for
patients and their caregivers.
The Province is also providing $8 million over the next three years to support 40 new community
centres. These centres — 263 in all — provide transportation services, social and recreational
programs, and other supports to help seniors stay active and independent in their communities.
Enhancing Long-Term Care
Long‐term care homes provide residential care and support to some of Ontario’s most vulnerable
citizens. Ontario is making investments in long‐term care to improve services, such as $58 million
for resident care. For additional information on long‐term care homes, see Chapter II: Helping You
and Your Family.
Ensuring the Best Quality of Care for Patients
The Excellent Care for All Act (ECFAA) underlines the importance of quality in the health care
system by defining quality for the health care sector, reinforcing the shared responsibility for
quality of care, and ensuring health care organizations make information on their quality of care
publicly available. Health Quality Ontario (HQO), established through ECFAA, helps improve the
care delivered in Ontario by promoting health care that is supported by the best available scientific
evidence. In 2017–18, HQO will be releasing quality standards in a number of clinical areas,
establishing important elements of high‐quality care for patients in the health system.
Every year, Health Quality Ontario publishes Measuring Up — a comprehensive report outlining
details on the health experience of patients in Ontario so they can better understand how the
system is performing.
126 Chapter IV: Public Services You Can Count On
Through its Ontario Health Technology Advisory Committee (OHTAC), HQO also makes
recommendations to government regarding funding based on the best available evidence for
health care services and medical devices. This advice guides important decisions on what new,
innovative services and technologies should be invested in. For example, HQO advice has
supported investments in 2017–18 in innovative technologies for cardiovascular care, such as
Stroke Endovascular Treatment (EVT). Since 2011, OHTAC has provided the government with over
70 recommendations.
Making Northern Health Travel More Affordable
The government is increasing the amount of assistance available to help patients in northern
Ontario who must travel long distances to access specialized medical services.
The Northern Health Travel Grant Program helps cover medically related travel costs that
residents of northern Ontario incur in order to access OHIP‐insured health care services through
a medical specialist or designated health care facility, unavailable locally within a radius of
100 kilometres.
Over the last three years, the program has helped over 600,000 northern Ontarians access
specialized medical services or health facility‐based procedures.
The investment of $10 million will provide additional funding for northern Ontarians through an
enhanced accommodation allowance. It will cover more than one night’s accommodation for
people who are required to stay away from home for more than one night when travelling from
the north for an OHIP‐insured service. This investment will ensure that the cost of travelling for
northern Ontarians to receive the care they need doesn’t impede their ability to access needed
health care services not available close to their home.
Improving Care for Mothers, Babies and Children
In 2017, Ontario will be investing in new and existing programs to improve maternal and child
health. This includes a new infant hearing screen as part of the Newborn Screening Ontario
program. This new screen will identify approximately 100 babies per year who are affected by
hearing loss, and will allow for earlier intervention and improved outcomes. Ontario is also
investing in the creation of a provincial prenatal screening program that will enhance access to
standardized and high‐quality prenatal screening across the province.
A new integrated health network for children, the Kids Health Alliance at Sick Kids Hospital will be
introduced in Ontario and will improve the care children receive in emergency departments in
hospitals across the province. This network will also achieve a more coordinated, consistent and
high‐quality system of health care for children and their families.
Section A: Strengthening Health Care 127
CHAPTER
IV
Additionally, improved supports for premature babies and their families are being made through
investment in Ontario’s Human Donor Milk Bank, as well as a new program to improve access to
breast pumps for mothers of premature babies.
The Province continues to invest in and support families who have experienced pregnancy or
infant loss by expanding support services and improving the collection of data to support the
commitments under the Pregnancy and Infant Loss Awareness, Research and Care Act, 2015.
Midwifery services provide low‐risk birthing options to improve the quality of care and value for
Ontarians. In 2017, the government will continue to support more choice and high‐quality care
for expectant families by continuing to grow Ontario’s midwifery sector by up to 90 new midwives.
This continued growth will increase access to safe and family‐centred pregnancy and newborn
care for Ontario’s families across the province.
About 250 new midwives are expected to enter the profession over the next three years. Families
with low‐risk births will have increased choices for quality care, reducing the need for more costly
hospital or specialized care.
As part of Ontario’s enhanced midwifery services program, two new Indigenous midwives will be
hired at the Dilico Family Health Team Clinic in Fort William First Nation. These midwives will
provide culturally appropriate child and maternity care for up to 30 Indigenous women and their
children in the Robinson Superior Treaty area (the districts of Thunder Bay and Algoma) over the
next three years.
The government is investing to establish a further five Indigenous midwifery programs across the
province: K’Tigaaning Midwives, Powassan; Kenhte:ke Midwives, Tyendinaga Mohawk Territory;
Onkwehon:we Midwives, Akwesasne; Shkagamik‐Kwe Health Centre, Sudbury; and Southwest
Ontario Aboriginal Health Access Centre, London. Ontario is also offering development grants to
Indigenous organizations across the province to explore how midwifery services could be
established in their communities.
Integrating Local Health Care Services
Since 2006, Local Health Integration Networks (LHINs) have guided funding and planning for
hospitals, home and community care, mental health services and long‐term care. In the
2016 Budget, following extensive public consultations as part of the “Patients First: Action Plan for
Health Care,” the Province proposed to better integrate health care, particularly primary,
home and community care, and to foster a closer collaboration with public health, to help ensure
seamless, consistent, high‐quality health care for Ontarians.
In 2017, Ontario will take the next steps to enhance the model by expanding the authority of
LHINs to assume responsibility for the planning of primary care and the delivery of home and
community care.
128 Chapter IV: Public Services You Can Count On
Beginning in 2017, LHINs will also start working through smaller sub‐regions to ensure that
individual communities’ health needs are better identified and addressed. These sub‐regions
ensure a better, more local lens for planning and performance improvement in Ontario’s
diverse communities.
In alignment with the Patients First Act, 2016, Ontario is supporting patient engagement.
The Minister of Health and Long‐Term Care will establish a provincial Patient and Family Advisory
Council to advise on strengthening patient engagement and key health policy priorities that impact
patient care and experience, to ensure the needs and concerns of patients and caregivers are
heard and understood. Each of Ontario’s 14 LHINs will also establish a regional Patient and Family
Advisory Committee to improve communication between patients, families and the LHINs, support
improved patient care experiences, and foster patient involvement in care delivery.
Easy Access to Health Services
Similar to businesses, international organizations and other governments, Ontario recognizes the
importance and value of information and communication technologies to inform and advance
patient care. The investments made to‐date have laid the foundation for the digital health system
in place today, and have appropriately focused on health care organizations and clinicians. It is
time to do more. As Ontarians are finding new ways of using technology to make their daily lives
easier and more convenient, Ontario must do the same for patients — from accessing health
records online to accessing home care support for a loved one without leaving home, or using
telemedicine technology.
In 2017, Ontario will release a 10‐point action plan for Digital Health in Ontario, investing
$15 million focused on opening up new ways for patients and families to access health information
and services digitally. These actions will strengthen the quality, effectiveness and accountability
of the care delivered, and stimulate innovation and growth for the economy through investments
in digital health that will reduce wait times, improve access to care, and improve the patient
experience.
Providing Easy-to-Access Health Information In 2017, the government will launch Ontario.ca/Health — a user-focused, mobile-friendly trusted source for information about health services in Ontario. Ontario.ca/Health will be designed to help people make informed choices about their health and effectively navigate the province’s health care system. The site will be designed and organized around patient needs, based on their experience and feedback.
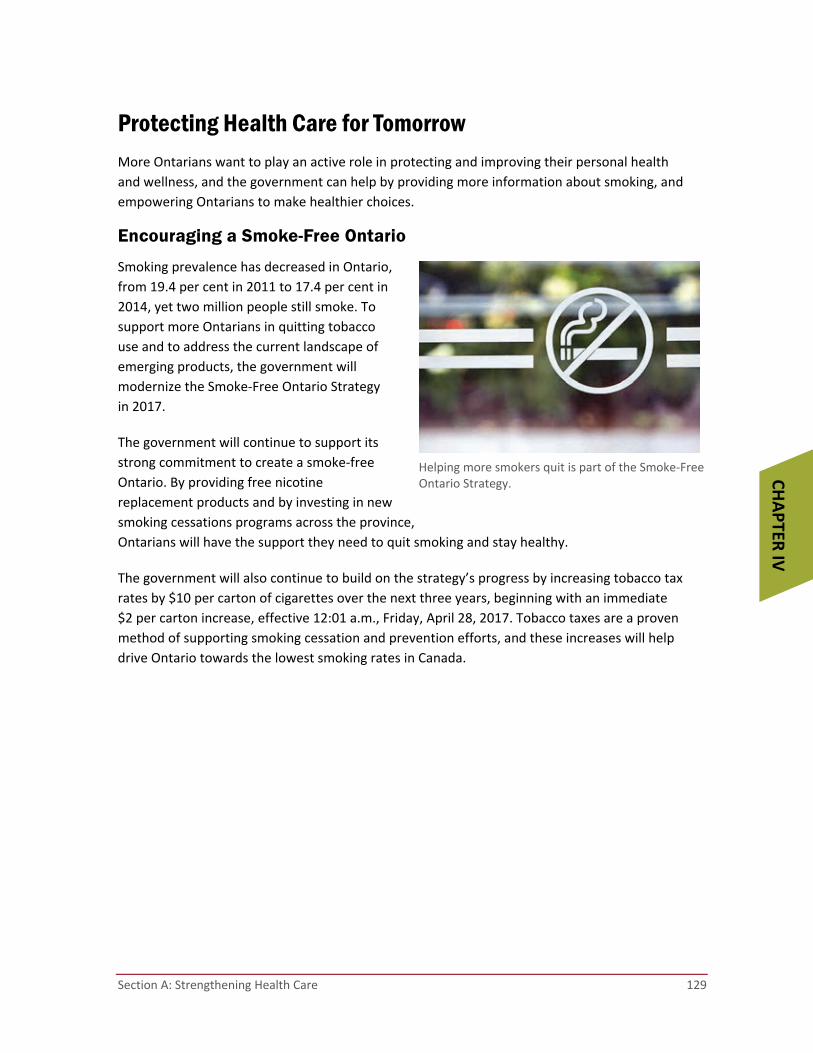
Section A: Strengthening Health Care 129
CHAPTER
IV
Protecting Health Care for Tomorrow More Ontarians want to play an active role in protecting and improving their personal health
and wellness, and the government can help by providing more information about smoking, and
empowering Ontarians to make healthier choices.
Encouraging a Smoke-Free Ontario
Smoking prevalence has decreased in Ontario,
from 19.4 per cent in 2011 to 17.4 per cent in
2014, yet two million people still smoke. To
support more Ontarians in quitting tobacco
use and to address the current landscape of
emerging products, the government will
modernize the Smoke‐Free Ontario Strategy
in 2017.
The government will continue to support its
strong commitment to create a smoke‐free
Ontario. By providing free nicotine
replacement products and by investing in new
smoking cessations programs across the province,
Ontarians will have the support they need to quit smoking and stay healthy.
The government will also continue to build on the strategy’s progress by increasing tobacco tax
rates by $10 per carton of cigarettes over the next three years, beginning with an immediate
$2 per carton increase, effective 12:01 a.m., Friday, April 28, 2017. Tobacco taxes are a proven
method of supporting smoking cessation and prevention efforts, and these increases will help
drive Ontario towards the lowest smoking rates in Canada.
Helping more smokers quit is part of the Smoke‐Free Ontario Strategy.

130 Chapter IV: Public Services You Can Count On
Helping Ontarians Make Healthy Choices — So They Stay Healthy Longer
To give people the information they need to make healthier food choices, as of 2017, the Healthy
Menu Choices Act requires food outlets with 20 or more Ontario locations to post calorie information.
Ontario provides screening of about 140,000 newborn babies for 29 diseases that are all treatable, including metabolic, endocrine and sickle cell diseases, and cystic fibrosis. In 2003, newborns were screened for only two diseases.
To protect Ontarians against preventable — and sometimes serious — diseases, like measles, mumps, tetanus, whooping cough and chicken pox, 23 routine vaccinations are now offered free of charge for babies, children and adults. In 2003, just 15 such vaccines were publicly funded.
Ontario’s Healthy Kids Strategy encourages kids, families and communities to support healthy behaviours and healthy weights before birth and in the early years.
The Province’s Healthy Kids Community Challenge, offered in 45 communities across Ontario, including six Indigenous communities, enhances the well-being of Ontario’s children by promoting nutritious eating, physical activity and healthy behaviours.
The Province will be providing $5 million over five years to the Canadian Men’s Health Foundation to lead initiatives that will promote and improve men’s health across the province, using an outcome-based strategy to achieve patient-centric behavioural change.
The Healthy Kids Community Challenge helps create communities where it’s easy for children to lead healthier lives.

Section A: Strengthening Health Care 131
CHAPTER
IV
Health Innovation
With the creation of the Office of the Chief Health Innovation Strategist, the government is driving
the adoption and diffusion of new health technologies and processes to improve patient
outcomes, add value to Ontario’s health care system and create jobs. This is part of the
government’s efforts to grow small and medium‐sized enterprises in Ontario while transforming
the health care system.
Through the $20‐million Health Technologies Fund, Ontario is improving patient care with cutting‐
edge health technology by providing grants for 15 new projects that will improve people’s care at
home and in their communities. The Ontario government will be providing grants to additional
projects in the coming year. The fund supports the development of Ontario‐based health
technologies that improve care for people, bring value to the health care system, and create jobs.
Budget Talks: Accessing Digitized Health Data This pilot was one of the top three ideas selected by the public for funding through the Budget Talks platform.
Through this initiative, the Province will develop a proof-of-concept digital registration and public authentication service that will allow parents and/or guardians to securely and easily access their child’s “Yellow Card” immunization records electronically, using their banking credentials. This digital process may be expanded to test a Patients’ First Access Channel where patients can find their health data (e.g., lab records, current medications, hospital visits), regardless of where the digital record actually resides.
The idea will receive a one-time investment of $1 million in 2017–18, and progress updates will be provided throughout the year at Ontario.ca/budgettalks.
Spotlight on Innovative Technology BresoDx — A simple-to-use, cordless diagnostic device for obstructive sleep apnea. It provides a more patient-centred option for sleep testing because it is suitable for use at home instead of a sleep laboratory. Left untreated, sleep apnea can lead to serious health complications, including increased risk of hypertension, stroke and heart failure. Funded by the Ministry of Health and Long-Term Care, the MaRS EXCITE program demonstrated the benefits of BresoDx, the first technology to complete the EXCITE program.

132 Chapter IV: Public Services You Can Count On
Health System Research Fund
The need for scientific evidence to solve complex health sector challenges is greater now than ever
before. Ontario will continue to invest in the Health System Research Fund (HSRF) including two
new awards in 2017: the Program Awards and the Targeted Call for Nursing Research. By fostering
collaboration between the researchers and knowledge users, this Fund is contributing to strategic
health system priorities and delivering on the Patients First Action Plan.

Section B: Investing in Education 133
CHAPTER
IV
Section B: Investing in Education
Introduction
Ontario’s highly educated workforce is one of its greatest strengths. More students —
85.5 per cent — are graduating from high school than ever before. And in 2016, the province
achieved a 68 per cent postsecondary attainment rate, higher than rates for any country in the
Organisation for Economic Co‐operation and Development.
Ontario’s world‐class education system provides learners, young and old, with opportunities to
access high‐quality education and training programs, giving them the knowledge and skills they
need for success in the modern economy.
The Province is committed to helping all children and students reach their full potential by
preparing them for postsecondary education and training. All children benefit from a stronger
start in school and in life, beginning with a full‐day kindergarten (FDK) program. More than
one million children have been enrolled in the FDK program, preparing them for greater success
in school and increasing overall Grade 1 reading, writing and math scores.
Through innovative programs and an enhanced focus on hands‐on learning, Ontario is ensuring
that high school students are prepared for further education and the world of work. By making
postsecondary education more accessible and affordable, the government is helping people
pursue or retrain for their career of choice.
Across the province, the government has invested in new and renovated classrooms and school
facilities. Since 2013, 146 new schools and 183 major additions and renovations have been
completed to better support student achievement and well‐being.

134 Chapter IV: Public Services You Can Count On
What We’ve Been Doing since 2013
Creating 56,000 new licensed child care spaces and committing to help 100,000 more children access affordable, quality licensed child care
Completing the rollout of full-day kindergarten for all four- and five-year olds
Implementing a renewed math strategy that includes 60 minutes per day of dedicated math learning in Grades 1–8
Strengthening communities by building 146 new schools and expanding or renovating 183 schools across Ontario
Transforming OSAP to make average tuition free for more than 210,000 students
Modernizing research facilities at colleges and universities and expanding access to postsecondary education, including building new university sites in Markham, Brampton and Milton
Investing in
Education
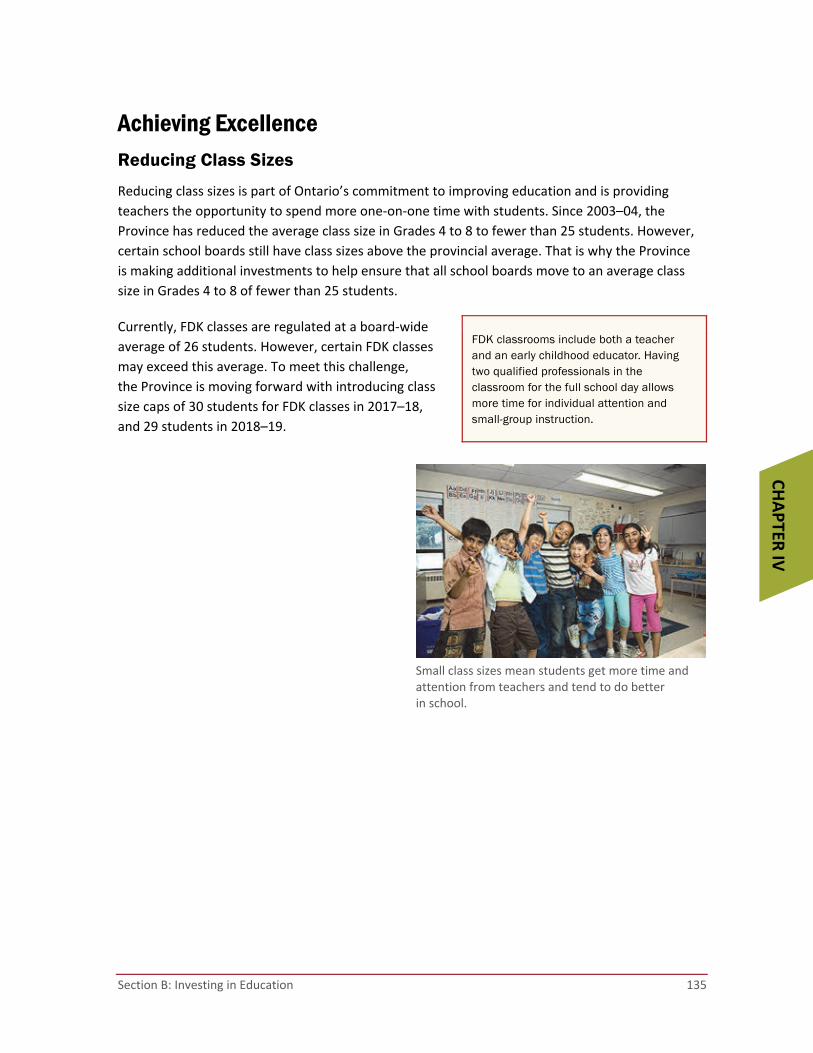
Section B: Investing in Education 135
CHAPTER
IV
Achieving Excellence
Reducing Class Sizes
Reducing class sizes is part of Ontario’s commitment to improving education and is providing
teachers the opportunity to spend more one‐on‐one time with students. Since 2003–04, the
Province has reduced the average class size in Grades 4 to 8 to fewer than 25 students. However,
certain school boards still have class sizes above the provincial average. That is why the Province
is making additional investments to help ensure that all school boards move to an average class
size in Grades 4 to 8 of fewer than 25 students.
Currently, FDK classes are regulated at a board‐wide
average of 26 students. However, certain FDK classes
may exceed this average. To meet this challenge,
the Province is moving forward with introducing class
size caps of 30 students for FDK classes in 2017–18,
and 29 students in 2018–19.
FDK classrooms include both a teacher and an early childhood educator. Having two qualified professionals in the classroom for the full school day allows more time for individual attention and small-group instruction.
Small class sizes mean students get more time and attention from teachers and tend to do better in school.
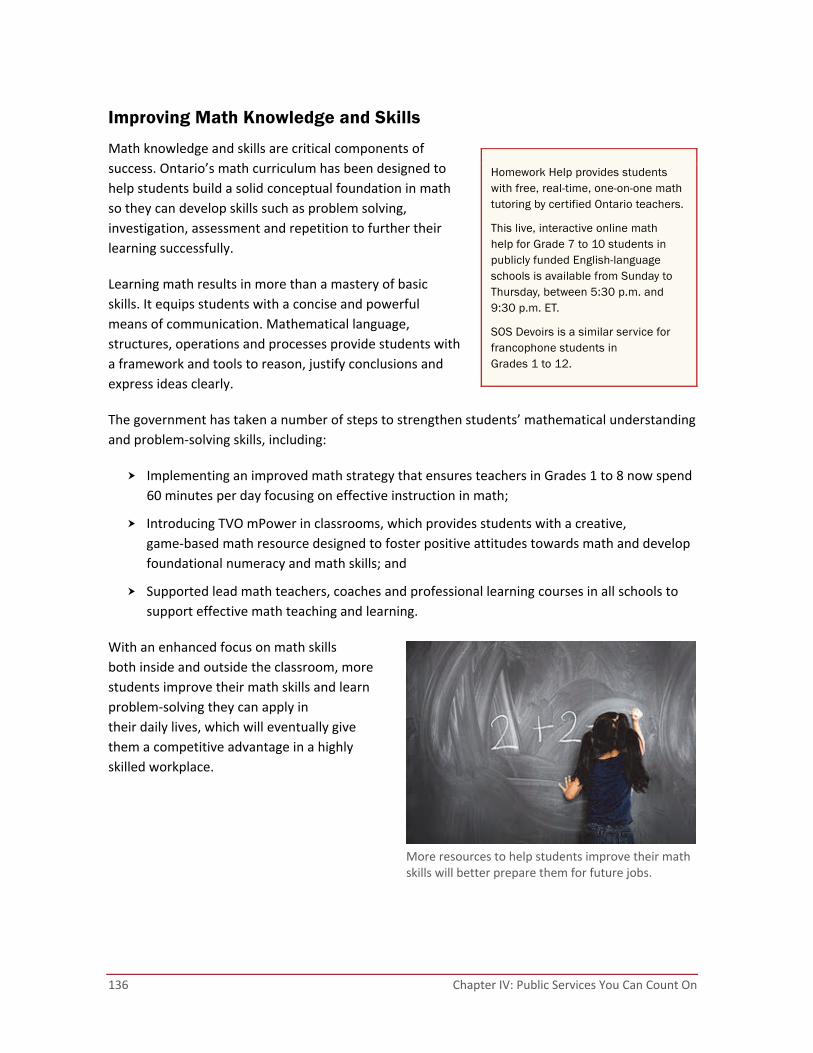
136 Chapter IV: Public Services You Can Count On
Improving Math Knowledge and Skills
Math knowledge and skills are critical components of
success. Ontario’s math curriculum has been designed to
help students build a solid conceptual foundation in math
so they can develop skills such as problem solving,
investigation, assessment and repetition to further their
learning successfully.
Learning math results in more than a mastery of basic
skills. It equips students with a concise and powerful
means of communication. Mathematical language,
structures, operations and processes provide students with
a framework and tools to reason, justify conclusions and
express ideas clearly.
The government has taken a number of steps to strengthen students’ mathematical understanding
and problem‐solving skills, including:
Implementing an improved math strategy that ensures teachers in Grades 1 to 8 now spend
60 minutes per day focusing on effective instruction in math;
Introducing TVO mPower in classrooms, which provides students with a creative,
game‐based math resource designed to foster positive attitudes towards math and develop
foundational numeracy and math skills; and
Supported lead math teachers, coaches and professional learning courses in all schools to
support effective math teaching and learning.
With an enhanced focus on math skills
both inside and outside the classroom, more
students improve their math skills and learn
problem‐solving they can apply in
their daily lives, which will eventually give
them a competitive advantage in a highly
skilled workplace.
Homework Help provides students with free, real-time, one-on-one math tutoring by certified Ontario teachers.
This live, interactive online math help for Grade 7 to 10 students in publicly funded English-language schools is available from Sunday to Thursday, between 5:30 p.m. and 9:30 p.m. ET.
SOS Devoirs is a similar service for francophone students in Grades 1 to 12.
More resources to help students improve their math skills will better prepare them for future jobs.

Section B: Investing in Education 137
CHAPTER
IV
Supporting Education for the Changing Economy
Ontario is partnering with educators on 29 pilot projects across the province to revise the current
high school career studies course and help students develop the skills they need to compete in the
rapidly changing and highly competitive global economy.
The career studies pilot projects will include the development of innovative learning opportunities
related to financial literacy, entrepreneurship skills, digital literacy and career/life planning.
Teachers will examine ways to:
Equip students with the skills and knowledge they will need in the new global economy;
Help students explore all career paths and opportunities; and
Support the teaching and learning of the course through a variety of new methods.
Teachers’ feedback from these pilots will be instrumental
in helping to determine what the career studies course
might become.
Ontario has also introduced a Financial Literacy Strategy into
Grade 4 to 12 classrooms. This strategy focuses learning on
integrating four key components of financial literacy into the curriculum: personal finance,
economic understanding, consumer awareness and citizenship.
TVO’s TeachOntario features innovative ways for teachers to engage students in mathematics with coding and programming.

138 Chapter IV: Public Services You Can Count On
Implementing Ontario’s Indigenous Education Strategy
Through meaningful engagement with Indigenous partners, improving Indigenous education in
Ontario is an important part of the government’s plan to create jobs, grow the economy and help
people in their everyday lives.
The Province provides support to all school boards across Ontario to hire a dedicated Indigenous
Education Lead to collaborate with First Nation, Métis and Inuit communities, organizations,
students and families to support the implementation of Ontario’s Indigenous Education Strategy.
The strategy focuses on achieving two primary objectives:
Improving achievement and well‐being
among First Nation, Métis and Inuit
students; and
Closing the achievement gap between
Indigenous students and all other
students.
Investing in Indigenous education, well‐being
and achievement is one of many steps on
Ontario’s journey of reconciliation with
Indigenous peoples and part of the broader
goals of ensuring Ontario’s education system
promotes the success of all students.
Developing a Master Education Agreement with the Anishinabek Nation
The Province is developing a Master Education Agreement with the Anishinabek Nation, which
represents 40 First Nations throughout Ontario, from Golden Lake in the east, to Sarnia in the
south, and Thunder Bay and Lake Nipigon in the north.
The agreement will support ongoing collaboration on strategies to promote Anishinabek student
success and well‐being, support transitions between First Nation schools and Ontario schools,
and assist the Anishinabek Education System by providing high‐quality, Anishinabek educational
programs and services in First Nation schools.
Teaching every child in Ontario the truth about our past and what it means today.

Section B: Investing in Education 139
CHAPTER
IV
Ensuring Equity Strengthening Supports for Students with Special Needs
Ontario is committed to ensuring all children and students will be inspired to reach their full
potential, with access to robust services and effective programs in their home communities. Equity and inclusion in Ontario’s education system help all students achieve excellence, regardless
of their background or personal circumstances.
The Province is strengthening supports for students with special needs through a number of
investments, including:
Keeping all provincial and demonstration schools open to support students who are deaf or
hard of hearing; blind or have low vision; deafblind; or who have severe learning disabilities;
Piloting intensive reading intervention projects in school boards to increase the availability
and responsiveness of local community supports for students with severe learning
disabilities;
Establishing a reference group to provide guidance and input on strengthening supports
for students who are deaf or hard of hearing; and
Pursuing legislative changes to transfer the governance structure of Centre Jules‐Léger to
the 12 French‐language school boards to better support French‐language communities.
Enhancing Autism Supports
The Province is enhancing autism supports in schools to help children transition to, and continue
in, full‐time school, including:
Multidisciplinary, student‐specific, school‐based transition teams supporting all children
transitioning from Intensive Behavioural Intervention services; and
After‐school skills development programs to provide students with additional opportunities
to develop targeted skills outside the instructional day and to better equip them for
classroom success.
See Chapter IV, Section D: Building Inclusive Communities and Improving the Justice System
for additional details.

140 Chapter IV: Public Services You Can Count On
Promoting Student Well-Being Ontario knows the importance of well‐being to the overall growth and development of children
and students. For 70 per cent of adults who are living with mental health challenges, their
symptoms developed during childhood or adolescence. Necessary treatment is often not given
early enough, with many families struggling to navigate services and get the right support for their
children and youth.
Children who have a positive sense of self are better positioned to reach their full potential. That is
why the government is investing an additional $49 million over the next three years in developing
and strengthening programs to improve students’ cognitive, emotional, social and physical
development through Equity and Inclusive Education, Safe and Accepting Schools, Healthy Schools
and Positive Mental Health.
The Province is looking to develop a shared vision of how the government can best support the
well‐being of all students and staff in collaboration with community members. To support this
shared vision, Ontario is seeking input to develop an understanding of the challenges,
opportunities and meaningful indicators of well‐being from kindergarten to Grade 12, such as
physical activity, bullying and mental health. The government has also established School Mental
Health ASSIST, which helps school boards build capacity to support student mental health and
well‐being.
A revised health and physical education curriculum is also helping students develop the skills and
knowledge that will enable them to enjoy being active and healthy throughout their lives, through
opportunities to participate regularly and safely in physical activity and to learn how to develop
and improve their own personal fitness.
The Province has selected the Hamilton‐Wentworth District School Board, in partnership with
the Offord Centre for Child Studies at McMaster University, to lead a province‐wide knowledge
network that will connect front‐line educators to the most up‐to‐date research on student
well‐being. The goal is to promote evidence‐based practices, such as high‐quality professional
learning, local leadership and the implementation of social and emotional learning.
Youth-in-care, such as those in foster homes, face unique challenges to their education. When young people move homes, they often have to relocate to another school, even if they stay within the same general area. The government is investing $21 million over the next three years in services for youth-in-care, including transportation services so that they can stay at the same school, even if their housing situation changes locally. This will help ensure that these students can build connections with their school and teachers, providing significant stability for their education.

Section B: Investing in Education 141
CHAPTER
IV
Building New and Improved Schools The Province is providing almost $16 billion in capital grants over 10 years to help build new
schools in high‐growth areas, improve the condition of existing schools and invest in projects to
reduce surplus space.
As part of this investment, Ontario is continuing to fund school renewal across the province.
Building on the 2016 commitment to increase renewal funding for schools, the Province will
extend the commitment with an additional $1.2 billion in funding for repairs and renewal over the
next two school years. This funding will continue to enable school boards to repair roofs, update
HVAC units and modernize electrical and plumbing systems. This investment will also improve
visible elements of schools that impact students’ learning and well‐being, including flooring, walls,
ceilings and playing fields.
The Province will also make investments in school renewal as part of Ontario’s Climate Change
Action Plan. Ontario will provide funding for existing schools to improve energy efficiency and
install renewable energy technologies. Technologies could include building automation systems,
energy‐efficient windows, solar energy and geothermal systems. These improvements will help
reduce greenhouse gas pollution, improve financial sustainability, promote environmental
stewardship and support student achievement.
Across the province, Ontario is investing in new and improved schools, which will help deliver
high‐quality programs to all students and will increase student achievement and well‐being.
Currently, the Province is building 95 new schools and expanding and renovating 54 existing ones.
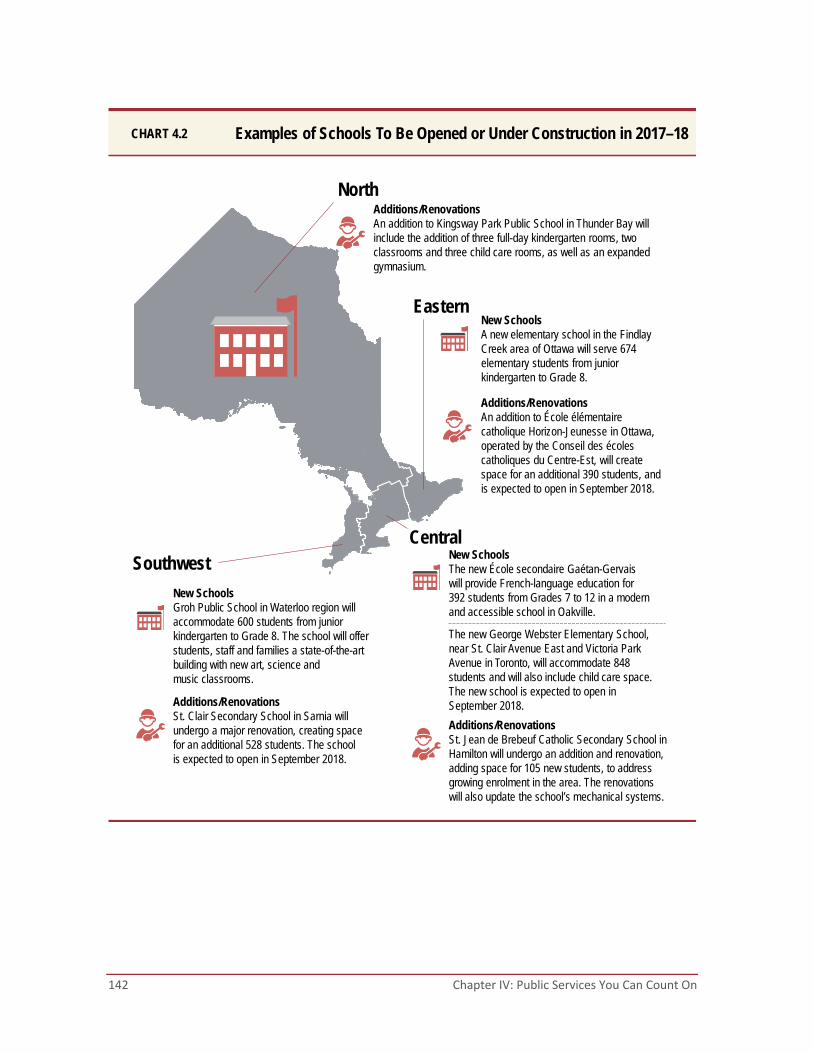
142 Chapter IV: Public Services You Can Count On
Examples of Schools To Be Opened or Under Construction in 2017–18CHART 4.2
North
Southwest
Eastern
Central
Additions/RenovationsAn addition to Kingsway Park Public School in Thunder Bay will include the addition of three full-day kindergarten rooms, two classrooms and three child care rooms, as well as an expanded gymnasium.
New SchoolsA new elementary school in the Findlay Creek area of Ottawa will serve 674 elementary students from junior kindergarten to Grade 8.
Additions/RenovationsAn addition to École élémentairecatholique Horizon-Jeunesse in Ottawa, operated by the Conseil des écolescatholiques du Centre-Est, will create space for an additional 390 students, and is expected to open in September 2018.
Additions/RenovationsSt. Clair Secondary School in Sarnia will undergo a major renovation, creating space for an additional 528 students. The school is expected to open in September 2018.
New SchoolsGroh Public School in Waterloo region will accommodate 600 students from junior kindergarten to Grade 8. The school will offer students, staff and families a state-of-the-art building with new art, science and music classrooms.
Additions/RenovationsSt. Jean de Brebeuf Catholic Secondary School in Hamilton will undergo an addition and renovation, adding space for 105 new students, to address growing enrolment in the area. The renovations will also update the school’s mechanical systems.
The new George Webster Elementary School, near St. Clair Avenue East and Victoria Park Avenue in Toronto, will accommodate 848 students and will also include child care space. The new school is expected to open in September 2018.
New SchoolsThe new École secondaire Gaétan-Gervais will provide French-language education for 392 students from Grades 7 to 12 in a modern and accessible school in Oakville.

Section B: Investing in Education 143
CHAPTER
IV
Rendering of the new Sioux Lookout high school, replacing Queen Elizabeth District High School, and slated to be completed by September 2018.
West Gate Public School in Windsor opened in September 2014.
Orillia Secondary School opened in March 2016.
Michaëlle Jean Public School in Ajax opened in September 2015.
St. Benedict Catholic Elementary School inNepean opened in September 2016.

144 Chapter IV: Public Services You Can Count On
Negotiating Central Agreements for Teachers and Education Workers The government recently reached tentative agreements with teachers’ federations and education
workers’ unions to extend the current contracts for two years. These agreements include modest
wage increases and additional support for teachers and classrooms. The tentative agreements
reached allow teachers to stay focused on students’ success and reduce the risk of disruptions
during the school year.
In March 2017, amendments to the School Boards Collective Bargaining Act, 2014 were passed,
allowing the Province to implement the recently negotiated agreements and enhance an already‐
successful model for collective bargaining in Ontario’s education sector with increased flexibility,
transparency and consistency.

Section B: Investing in Education 145
CHAPTER
IV
Ensuring a High-Quality, Accessible Postsecondary Education System Ontario’s universities and colleges are among the best in the world. They play a significant role
in ensuring students receive the knowledge and skills they need to succeed in the modern,
knowledge‐based economy. Many students now face a rapidly changing and uncertain world after
graduation. The government is transforming the postsecondary education system to ensure that it
remains highly competitive and equips students for the challenges and opportunities of a changing
global economy.
It starts with access. Beginning this fall, Ontario is rolling out the redesigned Ontario Student
Assistance Program (OSAP) to provide more transparent, timely and targeted financial assistance
to students with the greatest financial need. These changes will make average tuition free for
more than 210,000 Ontario students and reduce the cost for many more, ensuring that more
Ontarians are able to pursue a postsecondary education. See Chapter II: Helping You and Your
Family for additional details.
It’s also about opportunity. Ontario is increasing its focus on giving students the skills and
experience required for the economy of tomorrow. This includes promoting innovative teaching,
helping with career readiness and creating an outcome‐oriented postsecondary education system.
Through partnerships with universities, colleges and employers, Ontario will launch its new Career
Kick‐Start Strategy. For more information, see Chapter III: Creating Opportunities and Security.
In order to provide people with the best education and opportunities, the system needs to be
adaptive, supportive and sustainable. Over the last two years, the Province has been working with
universities and colleges to reform their funding formulas, effective 2017–18. The new funding
model will support a renewed focus on providing high‐quality outcomes for students by tying a
portion of college and university funding to performance outcomes and areas of institutional
strength. Using both institutional and system‐level metrics, the government will work with
colleges and universities to set clear performance targets through strategic mandate agreements.
Envisioning a French-Language University
Ontario is committed to supporting a vibrant learning environment for francophone
postsecondary programs and services. In 2016, the Province created the French‐language
University Planning Board consisting of representatives from Ontario’s francophone community
with a strong understanding of, and expertise in, francophone/bilingual postsecondary education.
The planning board will provide advice to the government on cost and design elements for the
university, so that more students can access French‐language postsecondary education.

146 Chapter IV: Public Services You Can Count On
Investing in Postsecondary Education Infrastructure
The Province also collaborated with the federal government, colleges, universities and Aboriginal
Institutes to implement the Post‐Secondary Institutions Strategic Investment Fund in Ontario.
Shared investments of more than $1.9 billion from 2016–17 to 2018–19 will enhance and
modernize research facilities on campuses and improve the environmental sustainability of
these facilities.
TABLE 4.2 Examples of Projects Benefiting from Shared Investments under the Post‐Secondary Institutions Strategic Investment Fund in Ontario
Durham College — Building a new Centre for Collaborative Education that will include a Global Class initiative that connects students with subject-matter experts around the world, and an Entrepreneurship Centre that connects students with local business leaders, providing access to the resources and expertise needed to launch new companies and startup ideas.
Fanshawe College — Renovation of the college’s existing building to include a new Centre for Advanced Research and Innovation in Biotechnology.
Sault College — Development of a new Institute for the Environment, Education and Entrepreneurship (iE3), allowing industries and academia to collaborate in areas of vital importance to the north, including information and communication technology and the management of forestry, water, wildlife and energy resources.
Trent University — Establishment of the Bata Research and Innovation Cluster, which entails a LEED-inspired renovation of two floors to create seven centres dedicated to research and innovation, as well as three interactive spaces.
University of Toronto — Renewal of 546 labs across the university’s three campuses, which will result in students, professors and researchers working in state-of-the-art facilities that advance the country’s best research.

Section B: Investing in Education 147
CHAPTER
IV
Advancing Education and Career Opportunities for Indigenous Learners
The government is committed to strengthening the pathways to postsecondary education and
training for Indigenous learners, while recognizing and building the capacity of the nine
Indigenous‐owned and ‐operated Aboriginal Institutes in Ontario.
That is why the Province is investing about $200 million over three years to support key
initiatives that will help more First Nation, Métis and Inuit learners access high‐quality
postsecondary education and training opportunities. This includes an investment of $56 million
over three years to enhance the capacity and sustainability of nine publicly funded Aboriginal
Institutes in Ontario.
This historic investment in the sustainability of Aboriginal Institutes supports the shared goal of
increasing educational access and opportunity while providing certainty for Indigenous learners
in Ontario.
The institutes provide a pathway for Indigenous
learners to successfully advance their educational
and career goals in culturally appropriate and safe
learning environments that are close to home and
are run and governed by Indigenous communities.
They offer postsecondary education and training
programs, in direct response to local labour market
needs, to over 1,000 students annually. On average,
about 300 learners graduate from Aboriginal
Institutes every year.
The investment also reflects broader government
priorities, including reconciliation with Indigenous
peoples and the development of a highly
skilled workforce.
Aboriginal Institutes in Ontario deliver a wide range of accredited postsecondary programs in partnership with colleges and universities. These institutions also develop curricula to address the current and future human resource needs of local communities.
Examples include:
The First Nations Technical Institute operates a flight program, in partnership with North Bay’s Canadore College, which is the only Indigenous postsecondary aviation program in Canada.
The Bachelor of Arts degree in Ogwehoweh (Cayuga and Mohawk) Languages at Six Nations Polytechnic Aboriginal Institute in Ohsweken, started in January 2016.

148 Chapter IV: Public Services You Can Count On
Budget Talks: Improving Digital Services for Libraries This pilot was one of the top three ideas selected by the public for funding through the Budget Talks platform.
The Province is investing to improve digital services in 45 provincially funded First Nation Public Libraries as well as 165 rural and 82 remote public libraries to better connect people to web-based information and opportunities.
Depending on local needs, investments could provide Wi-Fi hotspot lending programs, hardware and software resources, and technology-focused training opportunities.
The idea will receive a one-time investment of $1 million in 2017–18 and progress updates will be provided throughout the year at Ontario.ca/budgettalks.
SGEI Kenora Campus
Seven Generations Education Institute (SGEI)
AEI Thunder Bay Campus
Oshki-Pimache-O-Win Education and Training Institute (OSHKI)
Shingwauk Kinoomaage Gamig (SHINGWAUK)
Anishinabek Educational Institute (AEI)
Kenjgewin Teg Educational Institute (KTEI)
Iohahi:io Akwesasne Adult Education and Training Centre (IOHAHI:IO)
First Nations Technical Institute (FNTI)
Ogwehoweh Skills and Trades Training Centre (OSTTC)
AEI Munsee-Delaware Campus
Six Nations Polytechnic (SNP)
4
3
Aboriginal Postsecondary Education and Training Institutes in Ontario
CHART 4.3
2
1
5 6
7 8
910
12Satellite campuses
1
2
3
4
5
6
7
8
10
11
1211
9
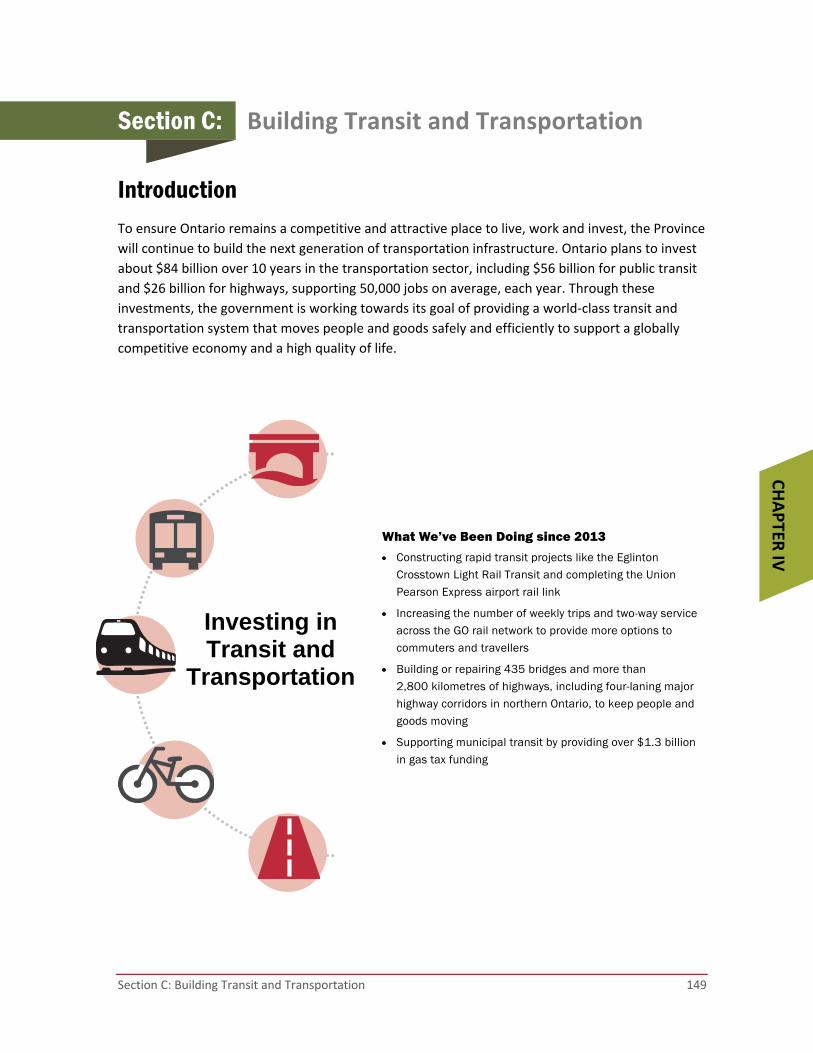
Section C: Building Transit and Transportation 149
CHAPTER
IV
Section C: Building Transit and Transportation
Introduction To ensure Ontario remains a competitive and attractive place to live, work and invest, the Province
will continue to build the next generation of transportation infrastructure. Ontario plans to invest
about $84 billion over 10 years in the transportation sector, including $56 billion for public transit
and $26 billion for highways, supporting 50,000 jobs on average, each year. Through these
investments, the government is working towards its goal of providing a world‐class transit and
transportation system that moves people and goods safely and efficiently to support a globally
competitive economy and a high quality of life.
What We’ve Been Doing since 2013
Constructing rapid transit projects like the Eglinton Crosstown Light Rail Transit and completing the Union Pearson Express airport rail link
Increasing the number of weekly trips and two-way service across the GO rail network to provide more options to commuters and travellers
Building or repairing 435 bridges and more than 2,800 kilometres of highways, including four-laning major highway corridors in northern Ontario, to keep people and goods moving
Supporting municipal transit by providing over $1.3 billion in gas tax funding
Investing in Transit and
Transportation

150 Chapter IV: Public Services You Can Count On
The Province is leading the renewal and expansion of transportation and other critical
infrastructure for Ontarians. A signature component is the Moving Ontario Forward plan, which
includes investments for public transit, transportation and other priority infrastructure projects
throughout the province.
In January 2017, the Province released its BuildON 2017 Infrastructure Update and an interactive
website1 that features a sample of more than 2,500 key projects currently underway or completed
across different sectors. Visit this website for further information about ongoing transportation
projects in communities across the province.
1 https://www.ontario.ca/page/building‐ontario
$26B• About 5,000 kilometres of highways
and more than 750 bridges will be built or rehabilitated across the province by 2021–22.
• About 2,400 kilometres of these highways and 200 of these bridges will be in northern Ontario.
Investments in Transit and Transportation over the Next 10 Years
CHART 4.4
$56B• Rapid transit projects will be built
in Waterloo, Hamilton, Mississauga and Brampton, Ottawa and Toronto.
• The GO rail system will be transformed through the GO Regional Express Rail initiative, which will quadruple the number of weekly trips from about 1,500 to nearly 6,000 by 2024–25.
in public transit in highways
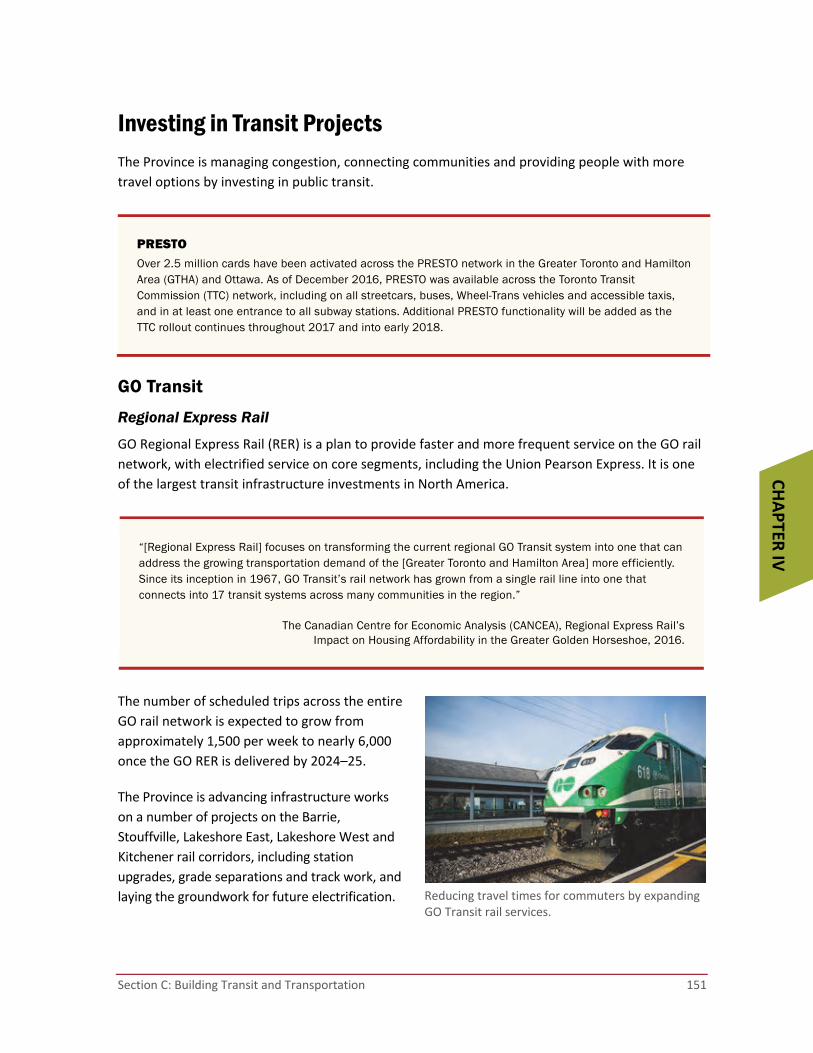
Section C: Building Transit and Transportation 151
CHAPTER
IV
Investing in Transit Projects The Province is managing congestion, connecting communities and providing people with more
travel options by investing in public transit.
PRESTO Over 2.5 million cards have been activated across the PRESTO network in the Greater Toronto and Hamilton Area (GTHA) and Ottawa. As of December 2016, PRESTO was available across the Toronto Transit Commission (TTC) network, including on all streetcars, buses, Wheel-Trans vehicles and accessible taxis, and in at least one entrance to all subway stations. Additional PRESTO functionality will be added as the TTC rollout continues throughout 2017 and into early 2018.
GO Transit
Regional Express Rail
GO Regional Express Rail (RER) is a plan to provide faster and more frequent service on the GO rail
network, with electrified service on core segments, including the Union Pearson Express. It is one
of the largest transit infrastructure investments in North America.
“[Regional Express Rail] focuses on transforming the current regional GO Transit system into one that can address the growing transportation demand of the [Greater Toronto and Hamilton Area] more efficiently. Since its inception in 1967, GO Transit’s rail network has grown from a single rail line into one that connects into 17 transit systems across many communities in the region.”
The Canadian Centre for Economic Analysis (CANCEA), Regional Express Rail’s Impact on Housing Affordability in the Greater Golden Horseshoe, 2016.
The number of scheduled trips across the entire
GO rail network is expected to grow from
approximately 1,500 per week to nearly 6,000
once the GO RER is delivered by 2024–25.
The Province is advancing infrastructure works
on a number of projects on the Barrie,
Stouffville, Lakeshore East, Lakeshore West and
Kitchener rail corridors, including station
upgrades, grade separations and track work, and
laying the groundwork for future electrification. Reducing travel times for commuters by expanding GO Transit rail services.

152 Chapter IV: Public Services You Can Count On
GO Rail Extensions and Expansion
Working with freight rail partners, Ontario is also moving forward with extending GO rail service to
Bowmanville and Niagara, and expanding service to Kitchener.
The 20‐kilometre extension of the Lakeshore East
GO corridor from Oshawa to Bowmanville is
expected to be in service by 2023–24. This GO rail
extension will serve Durham residents with four
proposed new stations at Thornton Road and
Ritson Road in Oshawa, Courtice Road in Courtice
and Martin Road in Bowmanville.
Weekday GO rail service between the future
Confederation GO Station in Hamilton and the
Niagara Region is expected to begin in 2021, with
service to Niagara Falls by 2023. In addition to this station in Hamilton, three new or
upgraded train stations are proposed along the corridor in Grimsby, St. Catharines and
Niagara Falls.
Planning and technical analyses are underway to enable two‐way, all‐day GO rail service
along the Kitchener corridor.
SmartTrack The Province and the City of Toronto have agreed to an integrated GO RER/SmartTrack service concept, which includes six new stations along the Kitchener and Stouffville/Lakeshore East GO rail corridors within the City of Toronto, and a western extension of the Eglinton Crosstown LRT to Pearson International Airport. The Province and the City have reached an agreement on the sharing of capital and ongoing operating and maintenance costs.
Ontario welcomes the federal government’s commitment to invest about $1.9 billion in portions
of the GO RER project, and will continue to seek partnership with the federal government to
advance transit and transportation projects across the province.
GO by the Numbers Since 2013, Metrolinx has built three new stations, completed major expansions or renovations at 10 stations, added a total of more than 8,000 parking spots and purchased 220 new buses, 124 new train coaches and 10 new train locomotives.

Section C: Building Transit and Transportation 153
CHAPTER
IV
Rapid Transit Projects
Several major provincial transit projects are planned or underway across the Greater Toronto
and Hamilton Area (GTHA).
Hamilton Rapid Transit — The Province is proceeding with the construction of a dedicated
light rail transit (LRT) line between McMaster University and the Queenston traffic circle.
This project will support rapid, reliable and convenient transit for commuters in the
Hamilton area. A request for proposals is expected to be released later in 2017. In addition
to the LRT, Ontario is also moving forward with the planning for a proposed 16‐kilometre
bus rapid transit (BRT) line that would connect the Hamilton waterfront to Hamilton
International Airport.
Hurontario LRT — The Province is proceeding with procurement for approximately
20 kilometres of modern, reliable, rapid transit to Mississauga and south Brampton along
the Hurontario corridor from Port Credit GO Station to Steeles Avenue. A request for
proposals is expected to be released later in 2017.
Eglinton Crosstown LRT —
Construction is well underway for the
Eglinton Crosstown LRT in Toronto,
which will run across Eglinton Avenue
between Mount Dennis (Weston Road)
and Kennedy Station. The 19‐kilometre
corridor will include a 10‐kilometre
underground portion between Keele
Street and Laird Drive. Tunnelling work
on the underground section of the LRT
is now complete, and progress
continues with early works at all
underground stations.
Finch West LRT — This project will bring 11 kilometres of dedicated rapid transit to
Toronto between Humber College and Keele Street. The procurement process for the
project is ongoing.
Mississauga Transitway — The 18‐kilometre transitway will have 12 stations from Winston
Churchill Boulevard in the west to Renforth Drive in the east. Construction of Winston
Churchill station is complete and the entire project is expected to be in service this year.
York VIVA Next BRT — This project is being implemented in several segments, with the
Markham, Richmond Hill and Newmarket segments already opened. The Highway 7
Vaughan Metropolitan Centre segment east of Jane Street is scheduled to be operational
in spring 2017, and the remaining segments, along Yonge Street, in Richmond Hill and
Newmarket, and along Highway 7 in Vaughan, will be in service by December 2019.
The tunnel‐boring machine at the Eglinton Crosstown LRT construction site.
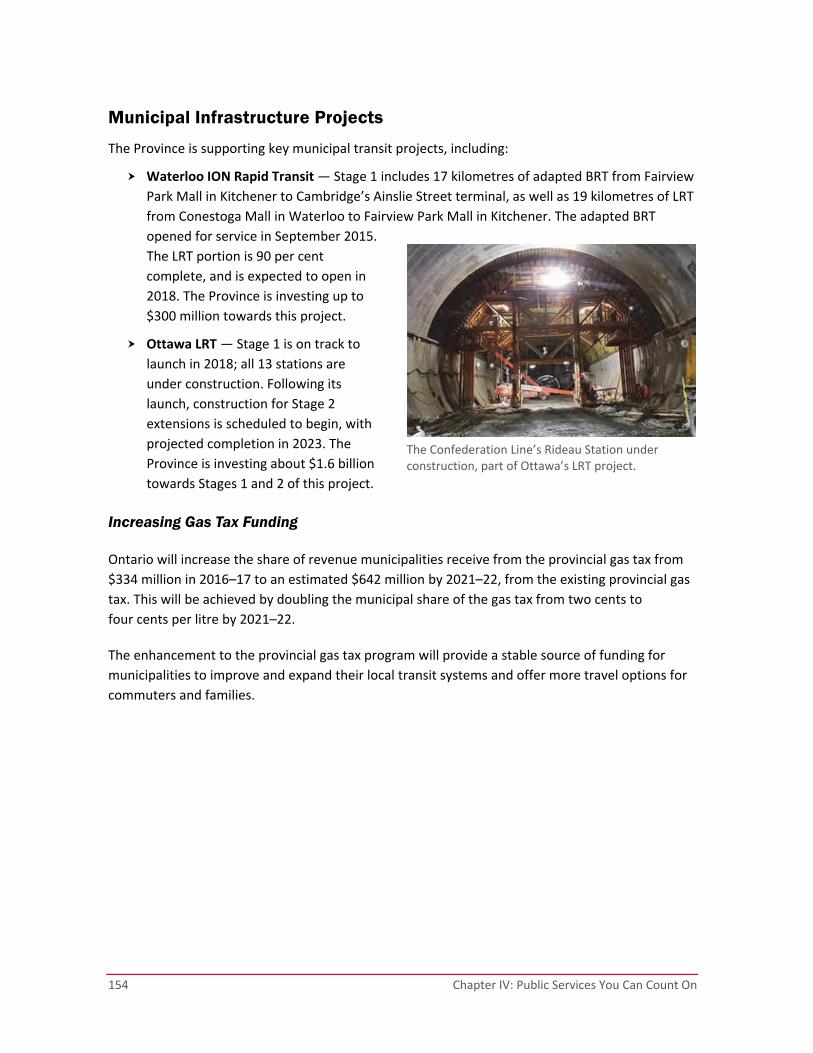
154 Chapter IV: Public Services You Can Count On
Municipal Infrastructure Projects
The Province is supporting key municipal transit projects, including:
Waterloo ION Rapid Transit — Stage 1 includes 17 kilometres of adapted BRT from Fairview
Park Mall in Kitchener to Cambridge’s Ainslie Street terminal, as well as 19 kilometres of LRT
from Conestoga Mall in Waterloo to Fairview Park Mall in Kitchener. The adapted BRT
opened for service in September 2015.
The LRT portion is 90 per cent
complete, and is expected to open in
2018. The Province is investing up to
$300 million towards this project.
Ottawa LRT — Stage 1 is on track to
launch in 2018; all 13 stations are
under construction. Following its
launch, construction for Stage 2
extensions is scheduled to begin, with
projected completion in 2023. The
Province is investing about $1.6 billion
towards Stages 1 and 2 of this project.
Increasing Gas Tax Funding
Ontario will increase the share of revenue municipalities receive from the provincial gas tax from
$334 million in 2016–17 to an estimated $642 million by 2021–22, from the existing provincial gas
tax. This will be achieved by doubling the municipal share of the gas tax from two cents to
four cents per litre by 2021–22.
The enhancement to the provincial gas tax program will provide a stable source of funding for
municipalities to improve and expand their local transit systems and offer more travel options for
commuters and families.
The Confederation Line’s Rideau Station under construction, part of Ottawa’s LRT project.

Section C: Building Transit and Transportation 155
CHAPTER
IV
Increasing Funding for Local Transit Municipalities can use gas tax funds toward local transit priorities, such as making infrastructure upgrades, buying transit vehicles, adding more routes, extending hours of service, implementing fare strategies and improving accessibility.
Gas tax allocations are calculated through a formula based 70 per cent on ridership and 30 per cent on population. Through the gas tax program, Ontario helped 99 cities and towns improve their transit systems in 2016–17, including:
$170.8 million for the City of Toronto
$34.4 million for the City of Ottawa
$16.7 million for the City of Mississauga
$15.4 million for the Region of York
$10.7 million for the City of Hamilton
$9.4 million for the City of London
$3.5 million for the City of Windsor
$2.3 million for the City of Kingston
$1.9 million for the City of Thunder Bay
$1.1 million for the City of Sault Ste. Marie
Investing in Highway Infrastructure The Province is making new investments in highway infrastructure. Planning and design work is
underway to support:
Rehabilitation of Highway 400, from 16th Sideroad to Lloydtown‐Aurora Road in York Region,
including reconstruction of the Lloydtown‐Aurora Road interchange and the replacement of
the 16th Sideroad overpass bridge. Construction is expected to start in 2017 and be
completed in 2020.
Replacement of the bridges over the Grand River on Highway 401 in the City of Kitchener.
Construction is expected to start in 2019 and be completed in 2022.
Rehabilitation of Highway 401, from 4.4 kilometres east of Merlin Road to 5.0 kilometres
east of Bloomfield Road, and from 2.0 kilometres west of Mull Side Road to 1.4 kilometres
west of Victoria Road, in the Municipality of Chatham‐Kent. Construction is expected to
start in 2018 and be completed in 2020.

156 Chapter IV: Public Services You Can Count On
Additionally, the Province continues to move forward with highway expansion and renewal
projects to support economic growth and improve mobility.
TABLE 4.3 Highlights of Highway Projects
Region Description
Central Highway 427 — Extending the highway by 6.6 kilometres from Highway 7 to Major Mackenzie Drive, and adding lanes from Finch Avenue to Highway 7. It will also include High-Occupancy Toll (HOT) lanes anticipated to open in 2021.
Highway 404 — Widening the existing highway from six to eight lanes to add High-Occupancy Vehicle (HOV) lanes between Highway 407 ETR and Stouffville Road, starting in 2018, in collaboration with the federal government.
Highway 410 — Continuing with the construction work by widening and rehabilitating structures between Eglinton Avenue on Highway 403 and Queen Street on Highway 410. Highway 407E — The new Highway 407E project includes three highways: Highways 407, 412 and 418, which will help relieve congestion and support the efficient movement of people and goods through the eastern GTHA and beyond. Phase 1 of the project is open to traffic, and construction on Phase 2 will continue until 2020.
Southwest Highway 401 in Cambridge — Expanding a stretch of highway between Hespeler Road and Townline Road, starting in 2018, in collaboration with the federal government. The project includes HOV lanes and the replacement of two bridges.
Highway 7 in Kitchener — Expanding Shirley Avenue in Kitchener from two to four lanes to facilitate future construction of Highway 7 between Kitchener and Guelph, reconstructing a section on Wellington Street North, building sidewalks and bike lanes, and making other improvements.
East Highway 417 — Expanding the Ottawa Queensway from six to eight lanes between Maitland Avenue and Island Park Drive to improve safety and traffic flow, starting in summer 2017. This project also includes rehabilitating the Merivale Road bridge.
Highway 401 in Kingston — Replacing the Cataraqui River bridge starting in spring 2017 and widening the highway from four to six lanes between Highway 15 and Montreal Street.
North Northern Highways Program — Investing $648 million in highway infrastructure across the region. Work continues on:
Highway 11/17 — Continuing with four-laning between Thunder Bay and Nipigon, from 5.0 kilometres west of Highway 587 easterly, and from Stillwater Creek to Red Rock Road No. 9.
Highway 69 — Continuing with four-laning, from 1.0 kilometre north of Highway 522.
Highway 11 — Resurfacing 5.0 kilometres of the northbound lanes south of Highway 534, including bridge and culvert rehabilitation.
Highways 6 and 17 — Resurfacing Highway 17 from west of Highway 6 easterly for 22.0 kilometres, along with bridge rehabilitations on both highways.
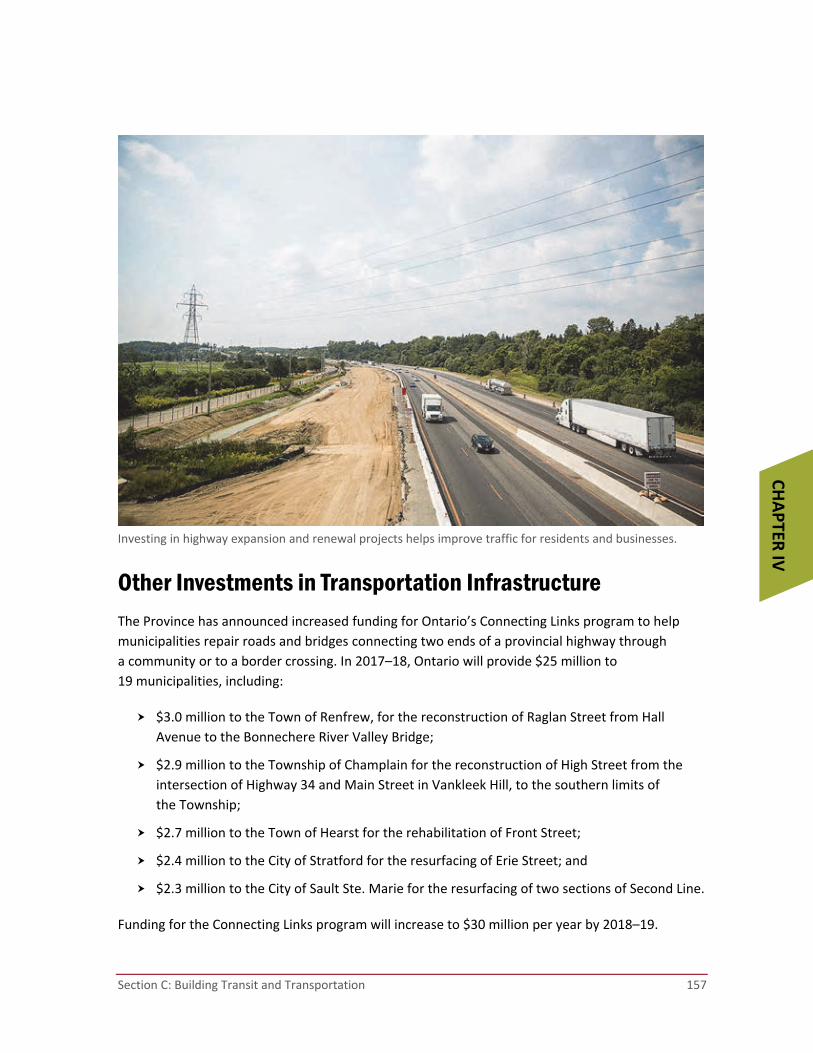
Section C: Building Transit and Transportation 157
CHAPTER
IV
Other Investments in Transportation Infrastructure The Province has announced increased funding for Ontario’s Connecting Links program to help
municipalities repair roads and bridges connecting two ends of a provincial highway through
a community or to a border crossing. In 2017–18, Ontario will provide $25 million to
19 municipalities, including:
$3.0 million to the Town of Renfrew, for the reconstruction of Raglan Street from Hall
Avenue to the Bonnechere River Valley Bridge;
$2.9 million to the Township of Champlain for the reconstruction of High Street from the
intersection of Highway 34 and Main Street in Vankleek Hill, to the southern limits of
the Township;
$2.7 million to the Town of Hearst for the rehabilitation of Front Street;
$2.4 million to the City of Stratford for the resurfacing of Erie Street; and
$2.3 million to the City of Sault Ste. Marie for the resurfacing of two sections of Second Line.
Funding for the Connecting Links program will increase to $30 million per year by 2018–19.
Investing in highway expansion and renewal projects helps improve traffic for residents and businesses.
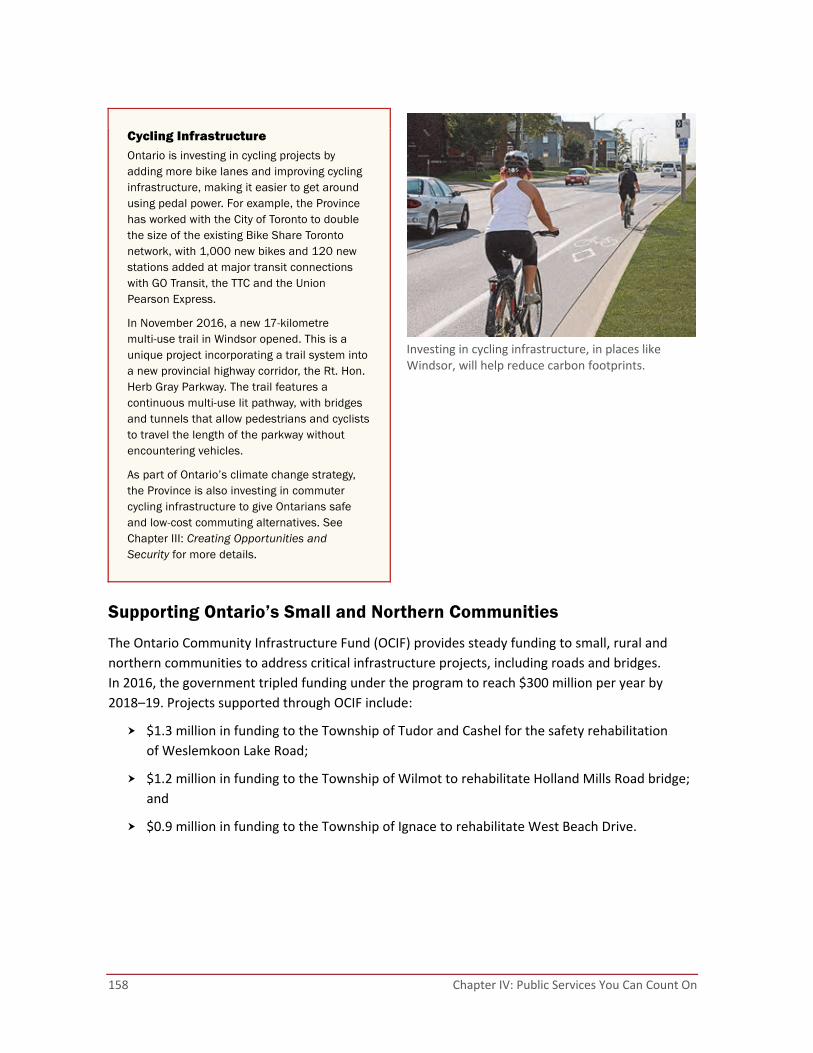
158 Chapter IV: Public Services You Can Count On
Cycling Infrastructure Ontario is investing in cycling projects by adding more bike lanes and improving cycling infrastructure, making it easier to get around using pedal power. For example, the Province has worked with the City of Toronto to double the size of the existing Bike Share Toronto network, with 1,000 new bikes and 120 new stations added at major transit connections with GO Transit, the TTC and the Union Pearson Express.
In November 2016, a new 17-kilometre multi-use trail in Windsor opened. This is a unique project incorporating a trail system into a new provincial highway corridor, the Rt. Hon. Herb Gray Parkway. The trail features a continuous multi-use lit pathway, with bridges and tunnels that allow pedestrians and cyclists to travel the length of the parkway without encountering vehicles.
As part of Ontario’s climate change strategy, the Province is also investing in commuter cycling infrastructure to give Ontarians safe and low-cost commuting alternatives. See Chapter III: Creating Opportunities and Security for more details.
Supporting Ontario’s Small and Northern Communities
The Ontario Community Infrastructure Fund (OCIF) provides steady funding to small, rural and
northern communities to address critical infrastructure projects, including roads and bridges.
In 2016, the government tripled funding under the program to reach $300 million per year by
2018–19. Projects supported through OCIF include:
$1.3 million in funding to the Township of Tudor and Cashel for the safety rehabilitation
of Weslemkoon Lake Road;
$1.2 million in funding to the Township of Wilmot to rehabilitate Holland Mills Road bridge;
and
$0.9 million in funding to the Township of Ignace to rehabilitate West Beach Drive.
Investing in cycling infrastructure, in places like Windsor, will help reduce carbon footprints.

Section C: Building Transit and Transportation 159
CHAPTER
IV
Moving Forward on Transportation Plans and Projects Developing the Northern Ontario Multimodal Transportation Strategy — This is the first pan-northern, integrated multimodal strategy that encompasses road, rail, air and marine transportation systems. It will set long-term directions and considerations for the movement of people and goods in the north.
Investing in Planning and Design Work for Priority Transit Projects in the GTHA — The Province continues to support ongoing transit planning for the Toronto Relief Line, Yonge North Subway Extension and rapid transit projects in the GTHA.
London Rapid Transit Project — The Province continues to engage with the City of London on its proposed project to connect neighbourhoods, businesses, and key hubs and economic activities across the city.
High-Speed Rail
In 2015, the government appointed the Honourable David Collenette as a Special Advisor to assist
in bringing high‐speed rail to the Toronto, Kitchener‐Waterloo, London and Windsor corridor.
The Province will now advance the comprehensive environmental assessment and support
additional design and planning work for the corridor. Ontario is also considering the development
of a governing body that would provide oversight for the ambitious work required to design and
implement high‐speed rail.
High‐speed rail could cut travel times between Toronto and Windsor from four hours to just
over two, and would make Ontario the first province to transform its rail network through
high‐speed rail.
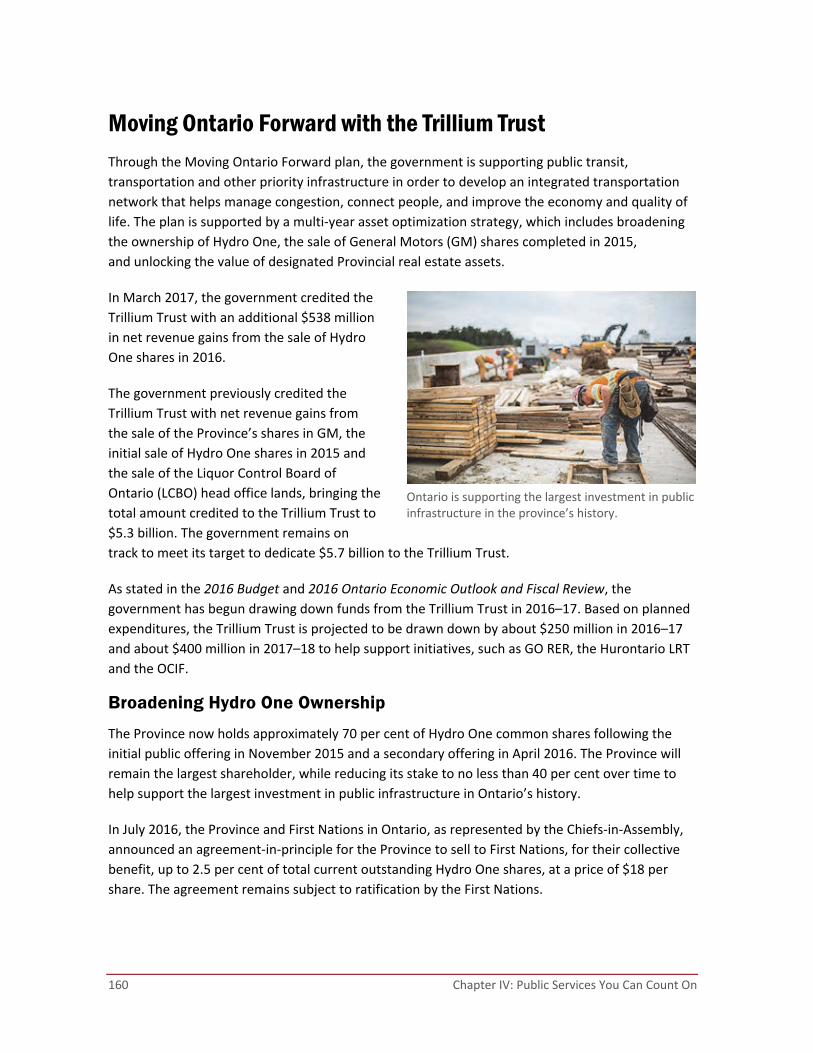
160 Chapter IV: Public Services You Can Count On
Moving Ontario Forward with the Trillium Trust Through the Moving Ontario Forward plan, the government is supporting public transit,
transportation and other priority infrastructure in order to develop an integrated transportation
network that helps manage congestion, connect people, and improve the economy and quality of
life. The plan is supported by a multi‐year asset optimization strategy, which includes broadening
the ownership of Hydro One, the sale of General Motors (GM) shares completed in 2015,
and unlocking the value of designated Provincial real estate assets.
In March 2017, the government credited the
Trillium Trust with an additional $538 million
in net revenue gains from the sale of Hydro
One shares in 2016.
The government previously credited the
Trillium Trust with net revenue gains from
the sale of the Province’s shares in GM, the
initial sale of Hydro One shares in 2015 and
the sale of the Liquor Control Board of
Ontario (LCBO) head office lands, bringing the
total amount credited to the Trillium Trust to
$5.3 billion. The government remains on
track to meet its target to dedicate $5.7 billion to the Trillium Trust.
As stated in the 2016 Budget and 2016 Ontario Economic Outlook and Fiscal Review, the
government has begun drawing down funds from the Trillium Trust in 2016–17. Based on planned
expenditures, the Trillium Trust is projected to be drawn down by about $250 million in 2016–17
and about $400 million in 2017–18 to help support initiatives, such as GO RER, the Hurontario LRT
and the OCIF.
Broadening Hydro One Ownership
The Province now holds approximately 70 per cent of Hydro One common shares following the
initial public offering in November 2015 and a secondary offering in April 2016. The Province will
remain the largest shareholder, while reducing its stake to no less than 40 per cent over time to
help support the largest investment in public infrastructure in Ontario’s history.
In July 2016, the Province and First Nations in Ontario, as represented by the Chiefs‐in‐Assembly,
announced an agreement‐in‐principle for the Province to sell to First Nations, for their collective
benefit, up to 2.5 per cent of total current outstanding Hydro One shares, at a price of $18 per
share. The agreement remains subject to ratification by the First Nations.
Ontario is supporting the largest investment in public infrastructure in the province’s history.

Section C: Building Transit and Transportation 161
CHAPTER
IV
Through the broadening of Hydro One ownership, the Province remains on track to generate
$4 billion in net revenue gains that, through the Trillium Trust, will be reinvested in infrastructure
under Moving Ontario Forward, and $5 billion to reduce debt.
Merging Hydro One Brampton
The Province has successfully completed the sale of Hydro One Brampton to Alectra Utilities,
a newly merged entity consisting of three former local distribution companies (Enersource,
Horizon Utilities and PowerStream), creating the second largest local distribution company (LDC)
in Ontario. This represents a major step forward in LDC consolidation and will allow for more
efficient services and continued provision of safe, reliable electricity. The government will credit
the net proceeds from the sale to the Trillium Trust.
Realizing Value from Ontario’s Real Estate Assets
Ontario Power Generation (OPG) has reached an agreement for the sale of its head office
properties. The transaction is estimated to result in net proceeds of over $200 million, which will
be credited to the Trillium Trust.
The Province is also moving forward with its plans to unlock value from other real estate assets,
including the Seaton and Lakeview lands.

162 Chapter IV: Public Services You Can Count On
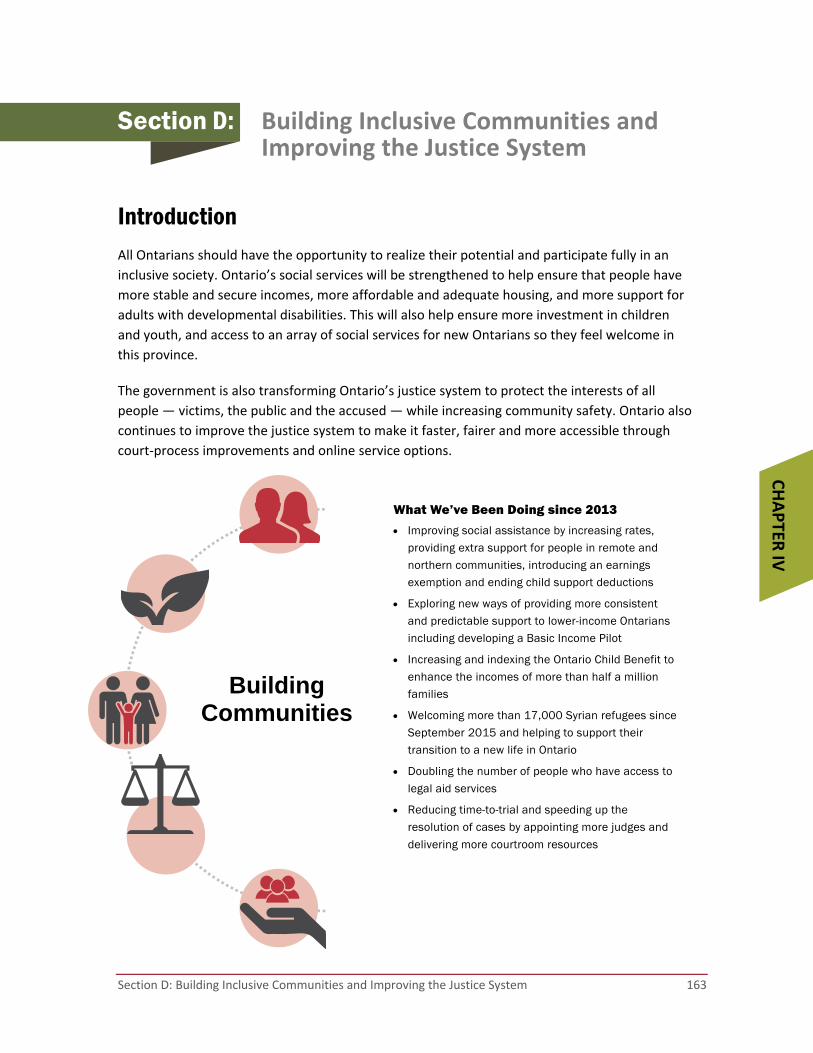
Section D: Building Inclusive Communities and Improving the Justice System 163
CHAPTER
IV
Section D: Building Inclusive Communities and Improving the Justice System
Introduction All Ontarians should have the opportunity to realize their potential and participate fully in an
inclusive society. Ontario’s social services will be strengthened to help ensure that people have
more stable and secure incomes, more affordable and adequate housing, and more support for
adults with developmental disabilities. This will also help ensure more investment in children
and youth, and access to an array of social services for new Ontarians so they feel welcome in
this province.
The government is also transforming Ontario’s justice system to protect the interests of all
people — victims, the public and the accused — while increasing community safety. Ontario also
continues to improve the justice system to make it faster, fairer and more accessible through
court‐process improvements and online service options.
What We’ve Been Doing since 2013
Improving social assistance by increasing rates, providing extra support for people in remote and northern communities, introducing an earnings exemption and ending child support deductions
Exploring new ways of providing more consistent and predictable support to lower-income Ontarians including developing a Basic Income Pilot
Increasing and indexing the Ontario Child Benefit to enhance the incomes of more than half a million families
Welcoming more than 17,000 Syrian refugees since September 2015 and helping to support their transition to a new life in Ontario
Doubling the number of people who have access to legal aid services
Reducing time-to-trial and speeding up the resolution of cases by appointing more judges and delivering more courtroom resources
Building Communities

164 Chapter IV: Public Services You Can Count On
More Stable and Secure Incomes Globalization, new technologies, automation and other factors have led to structural changes in
the labour market. This includes an increase in non‐standard employment, such as temporary and
part‐time work. While non‐standard employment can provide workers with greater flexibility,
it can sometimes be precarious and reduce an individual’s ability to earn a stable and secure
income. In this context, and to prepare for the future, bold steps are needed to strengthen
Ontario’s income security system.
Ontario is responding to these changes with a multi‐faceted approach that includes modernizing
the Province’s employment and labour laws as part of the Changing Workplaces Review,
and equipping workers with the skills needed to succeed through the Highly Skilled Workforce
Strategy. See Chapter III: Creating Opportunities and Security for more details. As part of this
approach, the Province is also examining new ways to improve the income security system and is
enhancing existing supports for Ontarians who need them most.
Introducing a Basic Income Pilot
In response to structural changes in the labour market, the government is developing innovative
approaches to support Ontarians. This includes moving forward with the Basic Income Pilot, first
announced in the 2016 Budget. A three‐year pilot will test the idea that providing people with a basic income could be a simpler and more effective way to ensure security and opportunity in a
changing job market, support people living on low incomes, and reduce poverty.
The Honourable Hugh Segal, a long‐time advocate and the Province’s Special Advisor for the
design and implementation of Ontario’s Basic Income Pilot, delivered a discussion paper in fall
2016. Guided in part by this paper, the government prepared a consultation document that
focused on key questions, such as eligibility for the pilot, where the pilot should take place, what
the basic income level should be, and how best to evaluate it. Public consultations took place from
November 2016 to January 2017, with more than 35,000 people and a number of organizations
participating.
In March 2017, the government released the Basic Income Consultations: What We Heard report
summarizing the feedback from the consultations. Many participants voiced support for a basic
income pilot that includes a representative sample of Ontarians, lifts people out of poverty,
reflects the province’s diversity, runs efficiently and measures specific outcomes. In addition,
through a separate but parallel process, a basic income pilot for First Nations is being co‐created
and designed.

Section D: Building Inclusive Communities and Improving the Justice System 165
CHAPTER
IV
Three communities across the province — Hamilton, Thunder Bay, and Lindsay — will be eligible
for participants aged 18 to 64. Through this pilot, people earning below a specified amount will
receive regular payments that will help them better afford basic needs like housing or food, and
participate in the community. Enrollment will be voluntary and based on informed consent. Work
will continue with experts and communities to ensure delivery of a Basic Income Pilot that is fair,
effective, and based on a representative sample.
Basic Income in Other Jurisdictions There is considerable interest at home and abroad in the potential for a basic income to improve outcomes for people. The idea of a basic income is also being explored in Prince Edward Island, Quebec, the Netherlands, Scotland and Kenya, and is being tested in Finland. Ontario’s leadership in launching and evaluating its Basic Income Pilot will provide an important contribution to this emerging body of policy research, as well as insight into what could work here at home.
Reviewing the Income Security System
Building inclusive communities also requires examining how the province’s system of income
supports, including social assistance programs, can better reflect Ontarians’ needs. That is why the
government established the Income Security Reform Working Group, and separate working groups
with First Nations and urban Indigenous partners. These groups will help guide the Province’s
efforts to reduce poverty, support people in their efforts to participate in the economy and their
communities, and provide services in a way that makes sense to the people who need them.
Work is underway on the development of a multi‐year roadmap for an income security system
that is based on equity, adequacy, sustainability and simplicity. A report with recommendations is
anticipated before the end of 2017.
Improving Social Assistance Benefits
Ontario’s social assistance programs play a critical role in the province’s income security system
and are integral to building communities that are resilient and inclusive.
To help improve Ontario Works and the Ontario Disability Support Program (ODSP), the
government is investing more than $480 million over four years to raise asset limits, increase
income exemptions for cash gifts, and provide a rate increase that will benefit more than 900,000
people across Ontario.

166 Chapter IV: Public Services You Can Count On
Raising Social Assistance Asset Limits and Gift Exemptions
People who are able to build savings are more resilient and better able to manage temporary
financial setbacks. This is why the government is providing more opportunities for people
receiving social assistance to save and avoid the need to deplete their assets before getting help.
The government is increasing limits on cash and other liquid assets. These limits will be increased
for single individuals receiving Ontario Works from $2,500 to $10,000, and from $5,000 to $15,000
for couples. For ODSP recipients, the cash and other liquid asset limits will be increased from
$5,000 to $40,000 for single individuals, and from $7,500 to $50,000 for couples. Increases to
asset limits will take effect by January 2018.
Recognizing that people receiving social assistance may also rely on the support of family or
friends, the income exemption for cash gifts will be increased from $6,000 up to $10,000 per year
in both ODSP and Ontario Works. In addition, gifts in any amount will not reduce the amount of
social assistance people receive if the funds are used to pay for first and last month’s rent,
purchase a principal residence, or buy a vehicle that they may need. These changes will take effect
in September 2017.
Increasing Social Assistance Rates
The government is also increasing Ontario Works and ODSP benefit rates for everyone by
two per cent. This change will include increases to other social assistance benefits and allowances,
such as the Personal Needs Allowance, which is available for those residing in institutions and
emergency shelters. These rate increases will take effect in September 2017 for ODSP, and in
October 2017 for Ontario Works.
In addition, the Comfort Allowance provided by the Ministry of Health and Long‐Term Care to
low‐income residents of long‐term care homes will be raised by two per cent.
To help address the unique challenges in northern and remote communities, including the higher
cost of food and transportation, the Province will also increase the Remote Communities
Allowance by providing an additional $50 per month for the first person and $25 for each
additional family member.
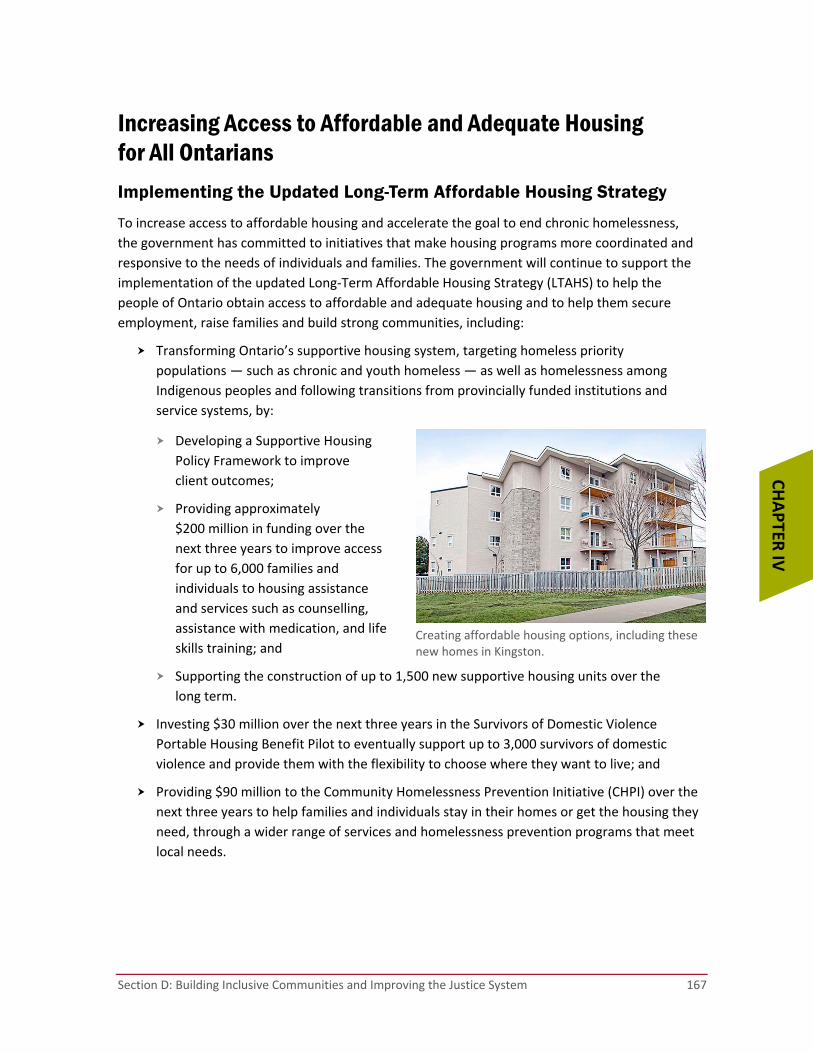
Section D: Building Inclusive Communities and Improving the Justice System 167
CHAPTER
IV
Increasing Access to Affordable and Adequate Housing for All Ontarians
Implementing the Updated Long-Term Affordable Housing Strategy
To increase access to affordable housing and accelerate the goal to end chronic homelessness,
the government has committed to initiatives that make housing programs more coordinated and
responsive to the needs of individuals and families. The government will continue to support the
implementation of the updated Long‐Term Affordable Housing Strategy (LTAHS) to help the
people of Ontario obtain access to affordable and adequate housing and to help them secure
employment, raise families and build strong communities, including:
Transforming Ontario’s supportive housing system, targeting homeless priority
populations — such as chronic and youth homeless — as well as homelessness among
Indigenous peoples and following transitions from provincially funded institutions and
service systems, by:
Developing a Supportive Housing
Policy Framework to improve
client outcomes;
Providing approximately
$200 million in funding over the
next three years to improve access
for up to 6,000 families and
individuals to housing assistance
and services such as counselling,
assistance with medication, and life
skills training; and
Supporting the construction of up to 1,500 new supportive housing units over the
long term.
Investing $30 million over the next three years in the Survivors of Domestic Violence
Portable Housing Benefit Pilot to eventually support up to 3,000 survivors of domestic
violence and provide them with the flexibility to choose where they want to live; and
Providing $90 million to the Community Homelessness Prevention Initiative (CHPI) over the
next three years to help families and individuals stay in their homes or get the housing they
need, through a wider range of services and homelessness prevention programs that meet
local needs.
Creating affordable housing options, including thesenew homes in Kingston.
168 Chapter IV: Public Services You Can Count On
Leveraging Provincial Land Assets to Build Affordable Housing
The affordable housing sector faces a number of challenges, including a high level of demand for
new units, an overall lack of supply, and limited capacity for construction in the not‐for‐profit
housing sector.
To address this challenge, the Ontario government, through its agency Infrastructure Ontario, will
establish a new program that would strategically leverage Provincial land assets as a way to build
more affordable housing units across the province. The program would involve disposing of
appropriate Provincial surplus land for below market value as a mechanism to leverage long‐term
affordable housing supply as part of the development.
This program would complement the work being done to establish Community Hubs, which will
also use land assets to advance community use of public properties, when a clear provincial
interest is identified and a viable business case can be demonstrated. A key element of the
initiative’s success will be ensuring that the new units have access to efficient and well‐aligned
support services that meet the community needs. The new units will also support the
government’s environmental and climate change goals.
The Province will pilot the program at multiple sites in the Greater Toronto and Hamilton Area
(GTHA). Under the program, the Province will commit $70–100 million in land to develop up to
2,000 new housing units, including a mix of market and affordable housing. Beginning in spring
2017, the Province will work with municipalities, the federal government, the housing sector and
other interested stakeholders to confirm the pilot sites and final program design.
Social Infrastructure Fund
Under the Social Infrastructure Fund, the Province and federal government have agreed to provide
more than $640 million from 2016–17 to 2018–19 to support the repair and modernization of
community infrastructure and address local service capacity and emerging needs. The funding will,
among other things, expand the Investment in Affordable Housing for Ontario Program, support
the new construction and renovation of affordable housing units for seniors, renovate and retrofit
social housing units, and assist in the construction and renovation of shelters for victims of
family violence.
Section D: Building Inclusive Communities and Improving the Justice System 169
CHAPTER
IV
Helping Vulnerable People
Supporting Adults with Developmental Disabilities
The government remains committed to transforming Ontario’s developmental services system
with the goal of supporting people to live as independently as possible in inclusive communities
across Ontario.
The government will take immediate action and invest $677 million over four years to help keep
people out of crises and give more people the supports that are right for them. In particular,
in 2017–18, the government will:
Provide over 375 additional residential developmental services placements for individuals
with urgent needs and youth transitioning from the child welfare system;
Support 1,000 additional adults with developmental disabilities to participate in their
communities through the Passport program;
Establish a specialized residential support home for individuals with complex needs who are
moving from justice facilities;
Expand specialized clinical responses for individuals with complex special needs; and
Improve access to local community services by making the system easier to navigate.
Over the next two years, the government will work with families and community partners
to transition over 400 young adults currently in the children’s system into adult
developmental services.
This investment will support the government’s response to the recommendations of the
Ombudsman of Ontario to address situations of crisis involving people with urgent and complex
care needs. The Province is committed to continuing to work with individuals, families and
champions to build on the foundation set to date. The government’s goal is to provide greater
flexibility, choice and inclusion in the developmental services that are offered.

170 Chapter IV: Public Services You Can Count On
Supporting Children and Youth Child Welfare Reform
The government is committing an additional $134 million over four years to support
new initiatives in the Child Welfare sector. In addition, on December 8, 2016, Ontario took key
steps to support future system transformation by introducing legislation to strengthen and
modernize child and youth services. The Supporting Child, Youth and Family Services Act, 2017,
if passed, would put children at the centre of decision‐making; support more accountable,
responsive and accessible child and youth services; and strengthen oversight for children’s aid
societies (CASs) and licensed residential services by:
Raising the age of protection from 16 to 18 to increase protection services for more
vulnerable youth in unsafe living conditions. These services would support their educational
achievement and reduce their risk for homelessness and human trafficking.
Improving oversight of service providers, including CASs, so that children and youth receive
consistent, high‐quality services across the province.
Incorporating new initiatives from the Province that will also support better service planning
and delivery, such as the creation of the Supporting Families Fund, as well as the
implementation of the One Vision One Voice plan in CASs.
Collective Impact for At-Risk Youth
In 2016, the government committed to pilot a Collective Impact (CI) approach to improve
outcomes for the approximately 170,000 youth in Ontario who are not employed or in education
or training. CI is an innovative approach to achieve social change that encourages cross‐sectoral
collaboration. The government is working with a group of senior leaders from the public, private,
philanthropic and not‐for‐profit sectors to facilitate and support communities to better align
services and support for at‐risk youth. The Leadership Council will work with five pilot
communities in 2017 to remove community‐identified barriers to collaboration across sectors and
to improve education and labour market opportunities for these young people.
Improving Autism Services
In 2016, the government announced changes to autism services and supports, and introduced
the new Ontario Autism Program. This commitment was supported with new investments of
$500 million over five years. Ontario is providing children with more flexible services at a level that
meets each child’s individual needs, reduces wait times for service, and increases the number of
treatment spaces available to assist children. From January 2017 to March 2018, five new
diagnostic hubs will be established to improve the availability of more timely Autism Spectrum
Disorder diagnostic assessments so children can start accessing services as quickly as possible.
Section D: Building Inclusive Communities and Improving the Justice System 171
CHAPTER
IV
Addressing Racism As part of the 2016 Budget, the government committed to addressing racism in all forms —
including individual, systemic and cultural racism — and to advance equality for all Ontarians
regardless of race, ethnicity, creed or cultural background. This included the creation of the new
Anti‐Racism Directorate.
Anti-Racism Strategy
Following province‐wide consultations, the government released A Better Way Forward: Ontario’s
3‐Year Anti‐Racism Strategic Plan in March 2017. The strategy includes:
Developing a framework for the collection of race‐based data in various institutions,
including the child welfare system and the justice, education and health sectors;
A new Ontario Black Youth Action Plan targeted at increasing access to supports and
opportunities for Black children, youth and their families, to address outcome disparities;
Implementing an anti‐racism impact assessment framework to help anticipate and remove
unconscious bias in proposed policies, programs and decisions;
New legislation that would, if passed, ensure the sustainability and accountability of the
Province’s anti‐racism work by providing a framework for government and organizations
to identify and combat systemic racism; and
Public education and awareness initiatives targeting racism, including Islamophobia
and anti‐Semitism.
As part of the strategy, the government will continue to deepen its understanding of systemic
racism with race‐based data and stronger community collaboration, and will develop tools and
methods to intervene before unconscious biases influence government decision‐making
and impact the people of Ontario.

172 Chapter IV: Public Services You Can Count On
Indigenous-Focused Anti-Racism Strategy
As part of Ontario’s Action Plan for Reconciliation, and as a key component of Ontario’s broader
Anti‐Racism Strategy, the government is providing $4 million over two years to support
development of two Indigenous‐designed and delivered anti‐racism programs. This includes
a youth‐leading‐youth program to train Indigenous youth to lead interactive workshops in
elementary schools, high schools, postsecondary schools and other community settings,
and to discuss their community’s experiences with racism and biases and their impact.
The second program is an anti‐racism training toolkit for use in postsecondary institutions and
professional organizations to help build self‐reflection and the ability to recognize biases that can
impact the provision of services to Indigenous peoples.
Ontario Black Youth Action Plan
Ontario is committed to developing a plan to more specifically address the needs and improve
the outcomes of Black youth in Windsor, Ottawa and the GTHA.
As announced on March 7, 2017, an investment of $47 million over four years will increase access
to supports for 10,800 Black children and youth by 2019–20. The Action Plan will:
Invest in culturally focused parenting
initiatives and mentoring programs;
Encourage Black children to stay in
school by investing in early
intervention programming;
Help Black students access higher
education through culturally focused
outreach;
Ensure programs and policies meet the
specific needs of at‐risk youth through
Ontario‐based research;
Help Black youth find their career path by investing in targeted skills development
programs; and
Invest in community outreach and promote anti‐violence.
The Action Plan outcomes are focused on ending disparities related to graduation rates,
admission to postsecondary education, and youth unemployment rates.
Ontario is building partnerships in the community toprovide more targeted support for Black youths.
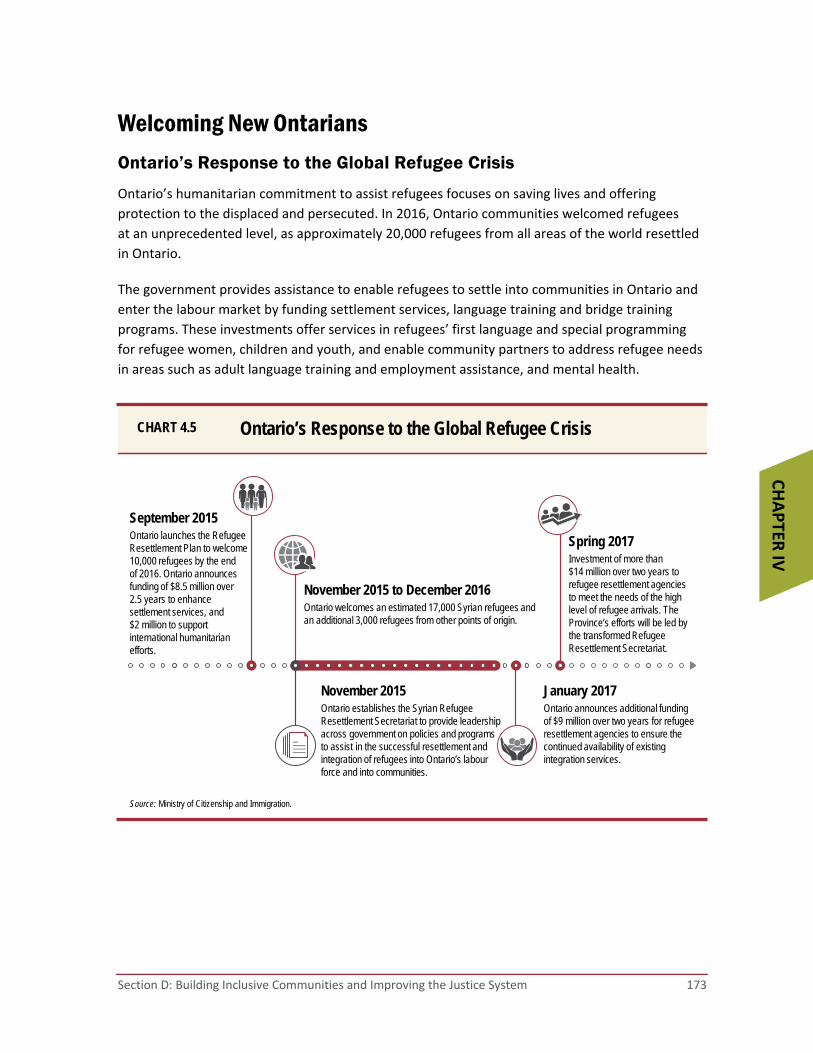
Section D: Building Inclusive Communities and Improving the Justice System 173
CHAPTER
IV
Welcoming New Ontarians
Ontario’s Response to the Global Refugee Crisis
Ontario’s humanitarian commitment to assist refugees focuses on saving lives and offering
protection to the displaced and persecuted. In 2016, Ontario communities welcomed refugees
at an unprecedented level, as approximately 20,000 refugees from all areas of the world resettled
in Ontario.
The government provides assistance to enable refugees to settle into communities in Ontario and
enter the labour market by funding settlement services, language training and bridge training
programs. These investments offer services in refugees’ first language and special programming
for refugee women, children and youth, and enable community partners to address refugee needs
in areas such as adult language training and employment assistance, and mental health.
Ontario’s Response to the Global Refugee CrisisCHART 4.5
September 2015Ontario launches the Refugee Resettlement Plan to welcome 10,000 refugees by the end of 2016. Ontario announces funding of $8.5 million over 2.5 years to enhance settlement services, and $2 million to support international humanitarian efforts.
November 2015 to December 2016 Ontario welcomes an estimated 17,000 Syrian refugees and an additional 3,000 refugees from other points of origin.
November 2015Ontario establishes the Syrian Refugee Resettlement Secretariat to provide leadership across government on policies and programs to assist in the successful resettlement and integration of refugees into Ontario’s labour force and into communities.
January 2017Ontario announces additional funding of $9 million over two years for refugee resettlement agencies to ensure the continued availability of existing integration services.
Spring 2017Investment of more than $14 million over two years to refugee resettlement agencies to meet the needs of the high level of refugee arrivals. The Province’s efforts will be led by the transformed Refugee Resettlement Secretariat.
Source: Ministry of Citizenship and Immigration.

174 Chapter IV: Public Services You Can Count On
Ontario expects to receive high levels of
refugees and newcomers in the coming years.
Refugees will also continue to arrive in
Ontario through secondary migration and
relocation from other provinces as they
search for work opportunities. The Province’s
ongoing investments will help newcomers
and refugees build new lives in Ontario.
Multicultural Community Capacity Grant
Ontario receives an average of 100,000
immigrants per year and has the most ethnically diverse population in Canada. Ontario will
provide $3 million each year for the next two years to establish the Multicultural Community
Capacity Grant to help immigrants, refugees and ethnocultural communities navigate barriers and
advance toward full integration and participation in Ontario society. Funding would target
activities that facilitate community engagement, social integration, education and empowerment
to promote intercultural understanding and break down barriers to participation
in community life and civic decision‐making processes.
Helping refugees start new lives by supporting settlement agencies and local partners.

Section D: Building Inclusive Communities and Improving the Justice System 175
CHAPTER
IV
Improving the Justice System The justice sector continues to undergo long‐term transformation to create a justice system
that is modern, focused on prevention, community‐based and people‐centred. To achieve this,
the government is focusing on initiatives that will increase community safety and well‐being,
enhance system effectiveness and efficiency, improve outcomes for those in contact with the
justice system, and strengthen relationships with Indigenous communities.
Building Safer Communities
The government is committed to finding smarter, better ways to build safer communities.
Working with police services, local agencies and the communities they serve, the Province is
developing the Strategy for a Safer Ontario to help create stronger, more integrated communities
across the province and modernize police services to ensure they are community‐focused,
accountable, sustainable and culturally responsive.
The Province’s Strategy for a Safer Ontario is about proactive and collaborative approaches to
build even safer communities. The government’s goal is to build a proactive, sustainable and
effective model of policing, focused on community safety and well‐being.
The Strategy will include a new:
Collaborative, risk‐based approach to community safety and well‐being with improved
interactions between police and vulnerable Ontarians;
Community safety services structure that clarifies core police responsibilities, provides
flexibility for the use of a range of community safety personnel, and modernizes entry
and training requirements for police officers;
Suite of measures to enhance civilian governance and oversight for police services that
strengthens accountability to the public; and
Legislative framework that ensures the sustainability of First Nations policing.
The government will be introducing legislation to modernize the Police Services Act and implement
the Strategy.

176 Chapter IV: Public Services You Can Count On
This modern approach will also help ensure
police can focus on core services that reduce
victimization and harm, which will be
reflected in an updated Police Services Act.
The Act has been largely unchanged since
its drafting in 1990. Modernizing the Act
will help communities better respond to
21st‐century issues and provide the blueprint
that brings police and social service
providers together.
Key pillars of the Strategy for a Safer
Ontario include:
Modernizing core police
responsibilities to ensure the right
personnel provide the right response
at the right time; and
Improving interactions between police
and vulnerable Ontarians by enhancing
the front‐line response to persons in
crisis and addressing the increasing
number of mental health‐related calls
that could be more appropriately
handled by other community
service providers.
In April 2016, the Ministry of the Attorney General appointed Justice Michael Tulloch to conduct a
review of Ontario’s independent police civilian oversight bodies: the Special Investigations
Unit, the Office of the Independent Police Review Director, and the Ontario Civilian Police
Commission.
Justice Tulloch’s review will help inform the government’s Strategy for a Safer Ontario in a number
of areas, including as it relates to oversight for sworn officers, community safety personnel,
board members and other members of the policing community.
Ontario is modernizing police services to improve public safety in communities across the province.
Section D: Building Inclusive Communities and Improving the Justice System 177
CHAPTER
IV
Ensuring Wage Parity for First Nation Police Officers
The Ontario and federal governments are partners in supporting First Nation police services, under
the First Nations Policing Program (FNPP), funded 52 per cent by Canada and 48 per cent by
Ontario. Historically, under this partnership, salaries for officers employed by First Nation police
services were lower than those for OPP officers.
Earlier in 2017, the Ontario government provided 100 per cent of the necessary funding to ensure
that all First Nation police officers in communities across the province are remunerated at the
same rate as those employed by the OPP. The Province will continue to work with First Nation
partners and the federal government to strengthen policing and community safety in Ontario’s
First Nations, including as Canada engages in a review of the FNPP.
Expanding Indigenous Supports
The government is also investing $44.2 million over two years to expand or establish programs
that support a justice system which is culturally relevant and responsive to Indigenous
communities, including:
Expanding the Gladue Program, which directs courts to consider non‐custodial sentencing
options and provides after‐sentencing supports for Indigenous offenders;
Providing Indigenous‐specific services for victims to help address unique needs;
Offering dispute‐resolution processes that divert accused persons from the justice system
and focus on restoring relationships based on Indigenous principles; and
Enhancing healing services and cultural supports for inmates in custody and offenders
under supervision.
See also Chapter V: Working with Our Partners for more information on Ontario’s Commitment
to Reconciliation with Indigenous Peoples.
178 Chapter IV: Public Services You Can Count On
Taking Steps to End Human Trafficking
Though human trafficking is a largely hidden problem, its effect on survivors and their families is
acute and pervasive. In June 2016, the government announced its anti‐human trafficking strategy,
together with an investment of up to $72 million. This investment will improve survivors’ access
to services, increase awareness and coordination, and establish two separate funds for
community‐based supports and for Indigenous‐led initiatives.
The strategy is also enhancing justice‐sector initiatives by:
Increasing funding by $6.7 million over four years to Victim Crisis Assistance Ontario,
under which 47 community‐based service partners deliver programs to provide better
supports for survivors;
Expanding the Victim/Witness Assistance Program to hire specialized human trafficking
survivor services workers in Newmarket, Brampton and Toronto;
Expanding the Victim Quick Response Program by $1.9 million over four years to allow
victims of human trafficking to access new benefits, such as tattoo removal, replacement
of government documents and recovery in a trauma‐informed facility; and
Recruiting a Provincial Crown Coordinator who will create a Provincial Human Trafficking
Prosecution Team that will ensure the province‐wide coordination of an enhanced
prosecutorial model and work collaboratively with police and survivor assistance programs
to improve and enhance investigations and prosecutions.
Ontario will also continue to look for ways to partner with governments across the country on
issues such as a national hotline to support survivors of human trafficking.
Section D: Building Inclusive Communities and Improving the Justice System 179
CHAPTER
IV
Streamlining and Modernizing the Court System
The government, in collaboration with the judiciary and other justice participants, is undertaking
several court modernization initiatives, including:
Standardizing pre‐trial practices to reduce the number of court appearances in a case.
Supporting early resolution of cases where appropriate.
Exploring alternatives to costly in‐court appearances to better use police, court and
corrections resources. These include the increased use of video technology for defence
counsel consultations with in‐custody accused, as well as for bail hearings and remand
court appearances.
Through its plan to reduce time‐to‐trial and improve the bail system, the government is delivering
new courtroom resources, including more Crown Attorneys, duty counsel and court staff, and will
allow a focus on early case resolution and increase capacity in the system. The plan also includes:
Province‐wide expansion and enhancement of the Bail Verification and Supervision Program
to help facilitate the successful release on bail of low‐risk accused pending trial, by making
the program available at a number of weekend court locations and extending eligibility to
allow more vulnerable people to be served across the province;
Launching an innovative new “bail beds” program to provide safe, supervised housing for
low‐risk individuals in five Ontario communities;
Making duty counsel available at six correctional facilities across the province to allow for
more effective bail hearings; and
Developing a new, culturally responsive program to provide supports to Indigenous people
undergoing the bail and remand process.
The government is also appointing 13 more judges to support more effective and timely case
progression, bringing Ontario’s complement of full‐time judges to 299.

180 Chapter IV: Public Services You Can Count On
Transforming the Corrections System
The government is also undertaking broad reform of Ontario’s corrections system, based on a
progressive and collaborative approach to individual rehabilitation and reintegration. The
initiatives will seek to reduce — through prevention and diversion — the number of individuals in
custody, ensure those in custody receive services and programs that are responsive to individual
needs, and better support staff in corrections.
To reduce the number of people held — and time spent — in segregation, and to improve the
conditions under which individuals are held, the Province is:
Hiring an additional 239 staff to increase health and social supports for inmates, particularly
those with significant challenges related to long‐term segregation;
Enhancing services for inmates on remand and those serving custodial sentences to ensure
they have access to a standardized set of core services, spiritual services and programming
with a focus on enhanced mental health and well‐being of inmates;
Implementing dedicated managers at institutions with higher segregation rates to help
reduce the use of segregation, and support inmates as they transition back to the general
population; and
Retrofitting, repairing and repurposing existing spaces, including common rooms and yards,
by, for example, changing/upgrading doors, and repainting and creating new day areas.
The government is committed to providing humane and compassionate care to individuals in
custody and ensuring their legal and human rights are respected. The government appointed
independent advisor Howard Sapers to review the use of all forms of segregation in corrections
facilities and to identify opportunities for longer‐term transformation of the corrections system
in Ontario.
Mr. Sapers has been asked to provide advice on building a system where appropriate alternatives
to segregation are more available for vulnerable populations — particularly people with acute
mental health issues. He has also been asked for advice on delivering enhanced oversight of
inmates and correctional institutions, and improving the living conditions for inmate populations.
Work is ongoing to develop a better approach to segregation as part of Ontario’s broader
corrections transformation initiative. The government is also exploring options for correctional
facilities that will improve the health and safety of both inmates and staff, address capacity issues,
and better accommodate the delivery of programming.
Section D: Building Inclusive Communities and Improving the Justice System 181
CHAPTER
IV
Enhancing Mental Health in Corrections
As part of transforming the provincial correctional system, the government is increasing access to
health care services, including mental health and addictions services, for persons with mental
illness who are involved in the justice system. The Province is investing $51 million over three
years to improve services for people with mental health and addictions issues, from their first
point of contact with the system, until reintegration into the community after release. This
investment will help provide more effective services where appropriate and reduce pressure on
the criminal justice system. It will expand the availability of safe beds, providing time‐limited
emergency housing where suitable as an alternative to hospital or jail. It will also increase access
to supports that will help facilitate the reintegration of people with mental illness back into the
community, helping reduce the likelihood of re‐offending.
For further information on the Province’s mental health investments and Ontario’s Opioid
Strategy, which includes increasing access to naloxone, an anti‐overdose medication, see
Chapter IV, Section A: Strengthening Health Care.
Justice Infrastructure
The Province is continuing to make investments in justice facilities that support the long‐term
transformation of the justice system. These investments help strengthen community safety while
providing timely access to justice and assisting vulnerable populations.
Examples of Projects in Planning or Underway
Work is underway to open the first phase (32 beds) of dedicated mental health units for
female adult inmates at the site of the Roy McMurtry Youth Centre by 2018. The centre will
address the unique environmental and programming needs of adult female offenders,
including those who require specialized mental health services.
The second phase of modernizing OPP facilities across the province is underway, with the
construction of several new OPP detachments.
Construction is expected to start in 2017–18 for a new London Provincial Communications
Centre, which will address growing demand and will link the public and the police during
emergency and non‐emergency situations, 24 hours a day.
Construction of a policing detachment is planned for the Weagamow Lake First Nation
community, in a funding partnership with the government of Canada.

182 Chapter IV: Public Services You Can Count On

working with our partners
chapter v


Chapter V: Working with Our Partners 185
CHAPTER
V
Introduction: Continued Collaboration with Our Partners
Ontario has embraced a collaborative approach with its partners across the country to address
the increasingly complex challenges facing governments in Canada — challenges such as uncertain
global economic growth, the perils of climate change and demographic changes.
The need for collaboration within the federation has never been greater.
Ontario believes that the best results for Canadians come from working together with all levels of
government — driven by shared values and a shared sense of responsibility to address the needs
of all Canadians equally. Along with its partners, the Province is making the investments necessary
to help Ontarians adapt and excel in the changing global economy.
The Province is committed to continue building constructive partnerships with the federal
government, other provinces and territories, municipalities and Indigenous communities
to achieve meaningful improvements in the lives of people in Ontario.
186 Chapter V: Working with Our Partners
Ontario150 As Ontarians and Canadians proudly celebrate the 150-year anniversary of Confederation and recognize the history and experiences of Indigenous peoples in these lands, the government is investing in projects across Ontario. The Ontario150 Community Capital Program is a $25-million investment to mark the 150th anniversary of the Confederation of Canada in 2017, and the creation of the Province of Ontario. With grants ranging from $5,000 to $500,000, community facilities and spaces across the province are being repaired, renovated or retrofitted. Projects include:
$500,000 to make needed renovations to the Ray Twinney Recreation Complex in Newmarket, helping promote physical activity for 86,000 people.
$400,000 to renovate Variety Village in Scarborough, helping 6,000 people to foster more active lifestyles through family-friendly fitness and sports.
$249,800 to make accessibility and interior upgrades to the Maryborough Community Centre in the Township of Mapleton, providing appropriate spaces for arts, culture and heritage activities for 10,400 people.
$150,000 to repair the parking area of the Rendez-vous des aînés francophones d’Ottawa community centre, improving access for 2,000 francophone seniors.
$147,800 to upgrade mechanical equipment and replace the windows at the St. Catharines Walker Family YMCA, promoting physical activity for 8,500 people.
$145,300 to install a new geothermal HVAC unit and upgrade the phone system at the Ojibwe Cultural Foundation on Manitoulin Island, providing appropriate spaces for arts, culture and heritage activities for 15,000 people.
$141,500 to renovate the Régie Locale des Services Publics de Jogues, a centre for athletic, social and cultural activities in Jogues, promoting active lifestyles for 350 people.
$77,000 for the Fort Frances Museum to replace the roof, install a ramp and make accessibility upgrades, providing appropriate spaces for arts, culture and heritage activities for 12,000 people.
$39,600 to renovate the Centre Charles-Émile-Claude in Cornwall and make it accessible, helping diverse groups work together to improve community life for 10,950 people.
$30,000 to make safety and accessibility upgrades to the Blake Community Hall and its outdoor rink in the Municipality of Neebing, helping 10,000 people build connections in their community.
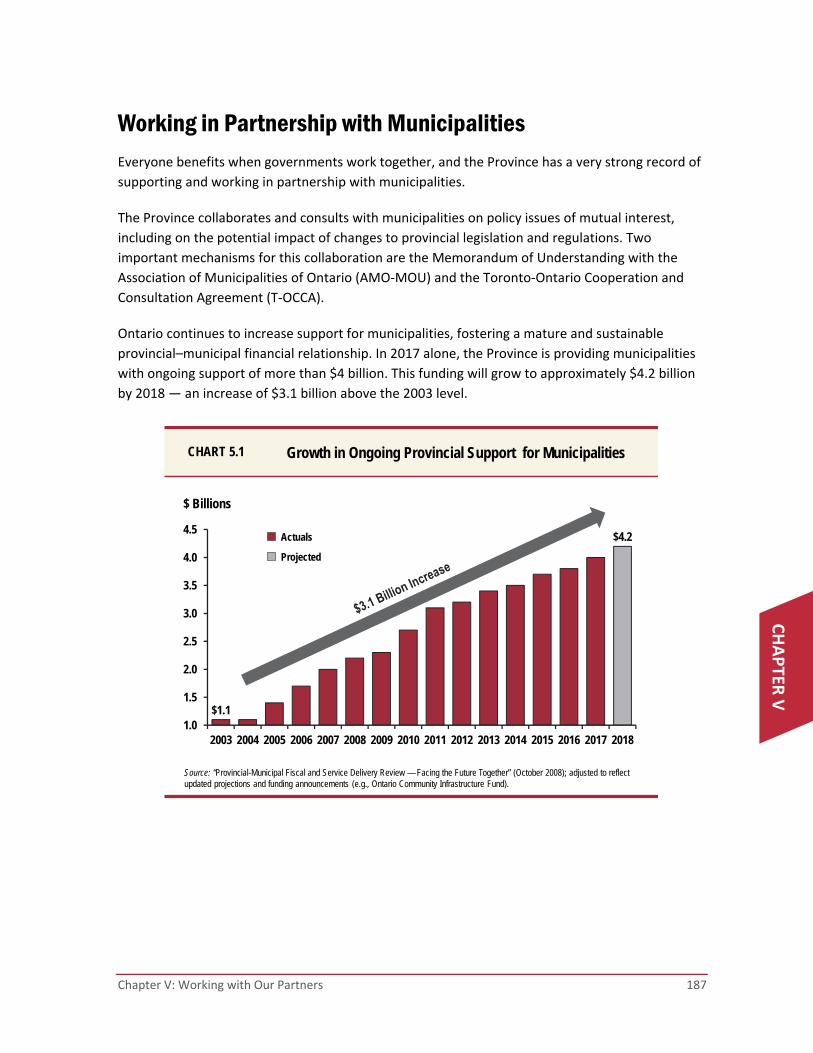
Chapter V: Working with Our Partners 187
CHAPTER
V
Working in Partnership with Municipalities Everyone benefits when governments work together, and the Province has a very strong record of
supporting and working in partnership with municipalities.
The Province collaborates and consults with municipalities on policy issues of mutual interest,
including on the potential impact of changes to provincial legislation and regulations. Two
important mechanisms for this collaboration are the Memorandum of Understanding with the
Association of Municipalities of Ontario (AMO‐MOU) and the Toronto‐Ontario Cooperation and
Consultation Agreement (T‐OCCA).
Ontario continues to increase support for municipalities, fostering a mature and sustainable
provincial–municipal financial relationship. In 2017 alone, the Province is providing municipalities
with ongoing support of more than $4 billion. This funding will grow to approximately $4.2 billion
by 2018 — an increase of $3.1 billion above the 2003 level.
Growth in Ongoing Provincial Support for MunicipalitiesCHART 5.1
$1.1
$4.2
1.0
1.5
2.0
2.5
3.0
3.5
4.0
4.5
2003 2004 2005 2006 2007 2008 2009 2010 2011 2012 2013 2014 2015 2016 2017 2018
$ Billions
Source: “Provincial-Municipal Fiscal and Service Delivery Review — Facing the Future Together” (October 2008); adjusted to reflect updated projections and funding announcements (e.g., Ontario Community Infrastructure Fund).
Projected
Actuals

188 Chapter V: Working with Our Partners
This support includes:
Provincial uploads of social assistance benefit costs, as well as court security and prisoner
transportation costs (up to $125 million annually by 2018). Ontario is fulfilling its
commitment to municipalities to fully implement these uploads by 2018. This represents
a significant milestone in the provincial–municipal relationship, and has helped put
municipalities on a financially sustainable footing.
Maintaining unconditional funding under the Ontario Municipal Partnership Fund (OMPF)
at $505 million, which will provide support to 388 municipalities across the province.
The Province is working with municipalities to ensure this funding is targeted to northern
and rural municipalities with the most challenging fiscal circumstances.
Funding to support cost‐sharing of land ambulance costs and an increased provincial share
of public health care costs.
Steady support to small, rural and northern communities through the Ontario
Community Infrastructure Fund (OCIF), including tripling funding to $300 million per year by
2018–19 to support renewal of critical road, bridge, water and wastewater infrastructure.
The Province has also taken steps to increase fairness in funding support and property tax
flexibility for municipalities. For example, it has increased municipal flexibility to manage business
property taxes, including the Business Property Tax Capping Program and Business Vacant Unit
Rebate and Vacant/Excess Land Subclasses.
Going forward, the Province will focus on investing in the infrastructure that is vital to the health,
prosperity and quality of life of Ontarians.
As announced earlier this year, Ontario will increase gas tax funding starting in 2019, doubling the
municipal share from two to four cents per litre by 2021 with an estimated funding of $642 million
in 2021–22, with no added tax at the gas pump. This program provides eligible municipalities with
a guaranteed source of funding to address priorities, such as building capacity, and improving and
expanding transit services.
“Ontario’s decision to provide more funding for transit through the gas tax program is a welcome one for Sault Ste. Marie. We know the importance of transit to our residents. This funding will help us reach our transit goals and assist in our efforts to build a more convenient system.”
Christian Provenzano, Mayor of Sault Ste. Marie
Chapter V: Working with Our Partners 189
CHAPTER
V
In partnership with the federal government and local communities, the Province is making
strategic investments to revitalize municipal infrastructure. In fall 2016, the Province announced
a bilateral agreement with the federal government that will make available more than $1.1 billion
under the Clean Water and Wastewater Fund (CWWF). Under the agreement with the federal
government, the Province has submitted over 1,300 projects for federal approval. Forty‐one initial
projects were approved under the CWWF for federal and provincial funding, including:
$3.2 million for upgrading of the water main line under Spruce Street in the City of
Greater Sudbury;
$3.0 million for upgrading the Hespeler Wastewater Treatment Plant in the Regional
Municipality of Waterloo; and
$1.4 million for supporting the City of Barrie’s Water, Wastewater and Stormwater Master
Plans and Needs Studies.

190 Chapter V: Working with Our Partners
Partnerships with Indigenous Communities
Ontario remains committed to transforming relationships with Indigenous peoples to move
forward on the journey of reconciliation. The Province is working with First Nations, Métis, Inuit
and urban Indigenous partners to close gaps and remove barriers, through the creation of
culturally relevant and responsive supports. This includes continuing to collaborate to implement
initiatives outlined in The Journey Together: Ontario’s Commitment to Reconciliation with
Indigenous Peoples, Walking Together: Ontario’s Long‐Term Strategy to End Violence Against
Indigenous Women and the First Nations Health Action Plan. See Chapter IV, Section A:
Strengthening Health Care for more details.
The Journey Together: Ontario’s Commitment to Reconciliation with Indigenous Peoples
The Journey Together, released in May 2016, details Ontario’s efforts with partners to support the
journey of reconciliation with funding of $250 million over three years. The Province, in
partnership with Indigenous communities and organizations, has delivered on the first year of its
commitment to the calls to action of the Truth and Reconciliation Commission of Canada (TRC).
Together, the government and Indigenous partners will continue to advance a range of initiatives
in the following five program/action areas:
Understanding the legacy of residential schools through developing a shared understanding
of mutual histories and addressing the overt and systemic racism that Indigenous people
continue to face.
Closing gaps and removing barriers to address the social and economic challenges.
Creating a culturally relevant and responsive justice system by closing service gaps and
ensuring the development and availability of community‐led restorative justice programs.
Supporting Indigenous culture by celebrating and promoting Indigenous languages
and cultures.
Reconciling relationships with Indigenous peoples through trust, mutual respect and
shared benefits.
Chapter V: Working with Our Partners 191
CHAPTER
V
The Province is committed to acting on the recommendations provided by the TRC and takes a
whole‐of‐government approach when designing policy or delivering programs, and is moving
forward with funding in 2017–18 and 2018–19, including:
Strengthening health care through dedicated funding to support a First Nations Health
Action Plan, providing culturally appropriate health services (see Chapter IV, Section A:
Strengthening Health Care);
Supporting up to six new or expanded Indigenous Mental Health and Addictions Healing
and Treatment Centres;
Expanding child care and early years programming provided by Indigenous communities
and organizations (see Chapter II: Helping You and Your Family);
Improving access to financing, skills training and community economic planning supports by
enhancing the Aboriginal Economic Development Fund (see Chapter III: Creating
Opportunities and Security);
Enhancing the capacity and sustainability of nine publicly funded Aboriginal institutes in
Ontario (see Chapter IV, Section B: Investing in Education);
Supporting the development of a province‐wide anti‐racism strategy, including a youth‐
leading‐youth program (see Chapter IV, Section D: Building Inclusive Communities and
Improving the Justice System);
Expanding or establishing programs that support a culturally relevant and responsive justice
system (see Chapter IV, Section D: Building Inclusive Communities and Improving the Justice
System);
Honouring residential school survivors and victims through commemoration efforts; and
Taking active steps to apply a model of reconciliation in its daily business, including
acknowledging treaties within Ministers’ statements, the Public Service Oath of Office and
government‐issued documents.
192 Chapter V: Working with Our Partners
Walking Together: Ontario’s Long-Term Strategy to End Violence against Indigenous Women
In March 2017, the Province released an update on its work with Indigenous partners to
implement Walking Together: Ontario’s Long‐Term Strategy to End Violence Against Indigenous
Women. The Provincial strategy, released last year, focuses on raising awareness of and
preventing violence against Indigenous women, providing more effective community services,
improving socioeconomic conditions that support healing, and keeping communities safe.
Today, more Indigenous women, children, youth and families are getting the support they need
in their communities. Some key accomplishments include:
Providing more than 200 communities with supports and services through the Family
Well‐Being program, which includes hiring and training more front‐line service workers,
developing community‐based programs and creating safe spaces;
Expanding the Kizhaay Anishinaabe Niin: I Am a Kind Man program from five to 26
friendship centres across Ontario, to support Indigenous men and boys through healing and
violence prevention programs;
Launching the Indigenous Anti‐Human Trafficking Liaisons program with partners to support
the development of culturally relevant services for survivors in Indigenous communities
throughout the province; and
Hosting the fifth National Indigenous Women’s Summit in March 2017, with over
250 participants from across Canada, including representatives from the five national
Indigenous organizations.
As announced in September 2016, Ontario is also supporting the National Inquiry into Missing
and Murdered Indigenous Women and Girls. Ontario has passed an Order‐in‐Council to ensure the
inquiry can investigate areas of provincial jurisdiction, such as policing and social services.
Support is also being provided to families of murdered and missing Indigenous women and girls.
Partnering with First Nations on Tobacco
In the 2016 Budget, the government reiterated its commitment to a dialogue with First Nation
communities and leaders on tobacco and gasoline. The government remains committed to this
dialogue and has been meeting with numerous First Nation communities including working closely
with the Mohawk Council of Akwesasne and the Chippewas of the Thames First Nation on pilot
projects supporting self‐regulation of tobacco on‐reserve and revenue‐sharing, as well as with the
Anishinabek Nation on a framework for tobacco and gasoline.
Chapter V: Working with Our Partners 193
CHAPTER
V
Working together towards community‐based regulation of gasoline and tobacco provides a basis
for mutually beneficial outcomes for the Province and First Nation communities. This cooperation
builds relationships and trust, supports economic development and diversification of First Nation
communities, and improves business certainty for on‐reserve sales. It also demonstrates the
commitment set out in the Political Accord to collaborate on shared priorities in a spirit of
respectful co‐existence.
As part of this dialogue with First Nation communities across Ontario, the government is discussing
sharing a portion of provincial tobacco tax revenues with communities that agree to regulate
tobacco sales on‐reserve.
The government is prepared to collaborate with First Nations on amendments to the Tobacco Tax
Act and other pieces of legislation to support effective coordination and integration of provincial
legislation with First Nation tobacco laws in the future.
Modernizing the Ontario Gas Card Program
Based on input received in fall 2016 through engagement on modernizing the Ontario Gas Card
Program, the government will replace the current Ontario Gas Card in 2017–18 with a more secure
card. The Province will also work with First Nations and industry stakeholders to identify and
implement the best technological solution to make it easier and faster for authorized First Nation
gasoline retailers to receive their refunds.
Protecting Sensitive and Confidential Information
Indigenous communities often share sensitive information with the Province and municipalities for
a variety of reasons, such as facilitating resource management discussions, designing consultation
processes, and negotiating land claim settlements and other agreements. To protect this
information, the Province is proposing legislative amendments to the Freedom of Information and
Protection of Privacy Act and the Municipal Freedom of Information and Protection of Privacy Act.
Amendments to these Acts would enable Provincial and municipal institutions to protect from
disclosure information received in confidence from Indigenous communities, or information
reasonably expected to prejudice the conduct of relations between institutions and Indigenous
communities. These changes are an important step toward facilitating open discussions that will
strengthen relationships while enhancing Provincial and municipal efforts to engage with
Indigenous communities as full partners.

194 Chapter V: Working with Our Partners
Achieving Federal–Provincial Fiscal Sustainability in the Federation
Ontario and the federal government share a commitment to an ongoing and constructive
partnership. This collaboration is vital to ensuring that Ontarians continue to receive the high
quality services expected of their government, and a dynamic economy in which they can thrive.
Together, Ontario and the federal government need to develop the solutions to address
demographic and economic risks.
The strength and sustainability of the federal system face rising challenges, including an aging
population and long‐term economic uncertainty. These issues will likely impose significant fiscal
pressure on the provinces and territories, as they are predominantly responsible for programs
and services sensitive to demographic changes.
The Province is already responding to these demographic and economic shifts by transforming the
delivery of public services such as health care and social services. See Chapter VI, Section A:
Transforming Government for Sustainability and Fairness for more details.
However, a number of studies1 have shown that the provinces and territories as a whole are in
a fiscally unsustainable position over the long term. At the same time, the federal government,
though it is currently in a deficit position, has a greater ability to raise revenue relative to the
services it delivers, and is projected to be fiscally sustainable. In fact, the recent Department of
Finance Canada report, Update of Long‐Term Economic and Fiscal Projections, projected that
federal net‐debt‐to‐GDP will decline over time.
Owing to the interconnectedness of federal, provincial and territorial governments in Canada,
strong social programs and robust action to support economic growth depend on the ability of
governments to tackle key challenges together — to meet the needs of Ontarians and Canadians.
This partnership should be based on shared principles: ensuring agreements are adequate,
sustainable and flexible enough to respond to unique local priorities, while respecting the
experience and expertise of provinces and territories.
Sustainability of the federation depends on both orders of government sharing equally in
the opportunities and risks facing the country.
1 Office of the Parliamentary Budget Officer, “Fiscal Sustainability Report 2016,” (2016), http://www.pbo‐
dpb.gc.ca/web/default/files/Documents/Reports/2016/FSR_2016/FSR_2016_EN.pdf; Conference Board of Canada, “A Difficult Road Ahead: Canada’s Economic and Fiscal Prospects” (2014), http://www.canadaspremiers.ca/phocadownload/publications/conf_bd_difficultroadahead_aug_2014.pdf

Chapter V: Working with Our Partners 195
CHAPTER
V
Ontario’s Growing Contribution to the Federation
In an environment of federal–provincial fiscal imbalance, Ontario continues to be a significant net
financial contributor to the Canadian federation — and this contribution is expected to grow as
the Ontario economy strengthens.
As research by the Mowat Centre and others has shown, the people of Ontario have consistently
contributed more to the federal government in total tax revenue than the federal government has
invested back in Ontario. The Mowat Centre has recently estimated that this shortfall was
$7.7 billion, or equal to 1.1 per cent of provincial GDP in 2014–15. This gap has been increasing
since it was measured by the Mowat Centre in 2009–10.2
When looking at the composition of Ontario’s significant net contribution, the Equalization
program is a major factor. For example, in 2017–18, Ontarians are estimated to contribute about
$7.1 billion to help fund the Equalization program, but the Province will receive about $1.4 billion
in Equalization payments (Chart 5.2).
2 Mowat Centre, “Mind the Gap (2017),” https://mowatcentre.ca/wp‐
content/uploads/publications/142_mind_the_gap.pdf. Findings from Mowat Centre’s 2013 Filling the Gap study revealed an $11.1 billion imbalance between what the Province contributes to the federal government in total tax revenue compared to what it gets back in federal spending. In January 2017, following Statistics Canada’s conversion to Government Finance Statistics, the Mowat Centre found that, in 2014–15, Ontarians made a net contribution of $7.7 billion to the federation, equivalent to 1.1 per cent of provincial GDP. When extending Statistics Canada’s new data methodology to past years to ensure comparability, the currently estimated gap for 2014–15 is greater than in 2009–10. In other words, Ontario’s net contribution to the federation is increasing.

196 Chapter V: Working with Our Partners
Sources: Ontario Ministry of Finance calculations using data from Statistics Canada’s Provincial Economic Accounts (CANSIM 384-0047) and Finance Canada.
5.7
3.12.3
0.6 0.3
(0.3)(1.3) (1.4) (1.5)
(7.6)(10)
(8)
(6)
(4)
(2)
0
2
4
6
8
ON AB BC SK NL PE MB NS NB QC
Of those provinces that receive Equalization, Ontario is the only one that is a net contributor to the program.
Ontario’s net contribution in 2017–18 is $5.7 billion
$ Billions
Net Contribution to the Equalization Program, 2017–18CHART 5.2
Equalization-Receiving Provinces
Other Provinces
Net Contributor
Net Beneficiary

Chapter V: Working with Our Partners 197
CHAPTER
V
Ontario’s economy continues to perform well. After being below the national average in GDP per
capita following the global recession, the province’s economy is projected to exceed the average in
the near term (Chart 5.3). As its economic growth strengthens relative to the national average,
Ontario’s contribution to the federation will continue to grow.
Ontario recognizes its long‐standing role as a net contributor to the Canadian federation. However,
there is a need for critical assessment of current federal–provincial fiscal arrangements to ensure
they are responding efficiently and effectively to the changing needs in the federation, and to align
resources and jurisdictional responsibilities in a more equitable manner.
90
100
110
2012 2013 2014 2015 2016
Notes: Nominal GDP of Ontario from 2012 to 2016 is based on the 2017 Budget. Sources: Statistics Canada (CANSIM Table 051-0001 and 384-0038), Conference Board of Canada and Ontario Ministry of Finance. Ontario Ministry of Finance calculation.
Ontario’s Economy Is Strengthening Relative to the Canadian Average
CHART 5.3
National Per Capita GDP = 100
Per Cent of National Per Capita GDP (%)
198 Chapter V: Working with Our Partners
Federal–Provincial Collaboration: Effective, Efficient and Equitable Intergovernmental Relations in Canada Ontario firmly believes that building strong partnerships allows the federation to share risks while
providing an opportunity to focus on what brings Canadians together. The Province’s vision for an
effective, efficient and equitable system of fiscal federalism in Canada emphasizes strong
partnerships in key areas.
Protecting the Canadian Health System
Over the past year, Ontario worked with provincial and territorial partners to find evidence‐based
solutions with the federal government to help sustain core services and commit to long‐term
investments to meet the demands of health care systems across the country.
Provinces and territories are on the front lines providing health services in an era of rising costs
and tight fiscal constraints. Ontario has invested in strengthening the health system to better
serve the patients of today and tomorrow (See Chapter IV, Section A: Strengthening Health Care
for more detail). Ensuring that Ontarians have access to the care they need, when and where they
need it, is a key component of the government’s plan to put patients first. In support of this goal,
the Province has increased funding for home and community care, and mental health and
addiction services to nearly $9 billion annually.
In March, the federal government and the Province agreed to new federal funding of $4.2 billion
over 10 years in support of home care and mental health initiatives in Ontario. This funding builds
on investments the Province is already making in these health priorities (see Chapter IV, Section A:
Strengthening Health Care for more detail).
This new agreement with the federal government means that the Province can move forward on
its work to transform the health care system.
At the same time, this agreement also means that the federal government’s share of health care
funding is likely to decrease, particularly at a time when the cost pressures and demand for health
care services are set to increase.
As provinces and territories continue to invest in adapting to a growing and aging population and
implementing new procedures and technologies, it is critical that the federal government provide
a consistent and adequate level of support over the long term.
A collaborative and national approach for long‐term sustainable funding and a fair and equal
federal partner at the table is the best way to protect Canada’s universal, publicly funded system
and ensure that all Canadians receive the support they need.

Chapter V: Working with Our Partners 199
CHAPTER
V
Taking a Balanced Approach to the Next Phase of the Federal Infrastructure Investment
Over the past year, a number of bilateral infrastructure agreements have been reached between
the Province and the federal government, including the Social Infrastructure Fund, Clean Water
and Wastewater Fund, and Public Transit Infrastructure Fund, to connect people and enhance the
lives of Ontarians. This reflects the fact that infrastructure is a top priority for both Ontario and
the federal government.
Federal funding is an important component of Ontario’s long‐term infrastructure plan, which
includes investments of more than $190 billion over 13 years, starting in 2014–15.
However, to maximize the benefits of federal investments, support sound infrastructure planning
and build on Ontario’s plan — as well as to ensure that the Province can make investments in a
timely manner — it is essential that the federal government adopt a flexible approach to funding
as it rolls out the next phase of its infrastructure investment plan. Agreements should allow
provinces and territories to direct federal funding towards existing priorities and programs without
additional unexpected fiscal costs to the Province and municipalities.
A more flexible overall approach is necessary for a fairer and more appropriate recognition of the
many years of critical capital planning and prioritization work already undertaken by Ontario
and municipalities.
Further, this funding must be allocated in an equitable manner and with respect to provincial and
municipal relationships.
Altogether, this approach will allow Ontario to build more infrastructure. For example, with
the recently announced $1.9 billion in federal funding in support of Ontario’s $13.5‐billion
GO Regional Express Rail project, the Province now has the ability to invest even more in other
priority projects.
Ontario looks forward to partnering with the federal government as it develops the Canada
Infrastructure Bank (CIB) in a way that builds on best practices and ensures affordable financing
to support public infrastructure in Canada. It is important that the CIB allows provinces and
territories to set their own infrastructure priorities, ensure alignment with existing plans
and maximize positive impacts on the economy.

200 Chapter V: Working with Our Partners
Renewing Labour Market Transfers to Meet Modern Labour Market Demands
Ontario has already embarked on multifaceted, long‐term transformation of employment and
training programs and services that aim to support a highly skilled and inclusive workforce in the
province (See Chapter III: Creating Opportunities and Security and Chapter IV, Section B: Investing
in Education for more detail). The federal government has committed to significantly reform
labour market transfer agreements in collaboration with provinces and territories. This presents
an opportunity to align federal support with the needs of Ontario’s labour market.
For many years, the primary challenge for Ontario has been the requirement, in existing federal
funding arrangements, to direct about 70 per cent of funding for training to current or recent
Employment Insurance (EI) recipients. As only 28 per cent of unemployed Ontarians received EI
regular benefits in 2016, the majority of Ontario’s unemployed workers were not eligible
for federally funded training.
Ontario welcomes the federal government’s announcements to improve and strengthen labour
market funding, including the proposed new Workforce Development Agreements, as well as
proposed amendments to the Employment Insurance Act to broaden worker eligibility for
programs and services under the Labour Market Development Agreements.
Ontario will continue to work closely with the federal government and other partners to ensure
labour market agreements meet the needs of Ontarians today and in the future. As part of labour
market transfers reform, the renewed agreements should:
Maximize flexibility in labour market transfers to give the Province freedom to design
and deliver inclusive labour market programs to help all Ontarians;
Increase overall federal investment in national labour market transfers, fully delivering
on federal platform commitments; and
Allocate a proportional and fair share of new federal investments to Ontario.

responsiBle Fiscal management
chapter vi

Section A: Transforming Government for Sustainability and Fairness 203
CHAPTER
VI
Section A: Transforming Government for Sustainability and Fairness
Introduction Across Ontario, people access government information and services every day. Last year, for
example, there were more than 14 million views of Ontario Student Assistance Program (OSAP)
information on mobile devices, and the government processed 185 million OHIP medical claims
and over 200,000 online driver’s licence renewals.
Through Program Review, Renewal and Transformation (PRRT), the government is supporting
evidence‐based decision‐making, and identifying major short‐ and long‐term transformational
initiatives focused on modernizing services, finding savings and improving outcomes for Ontarians.
To support the sustainable funding of these public services, a fair and balanced tax system where
everyone pays their share is essential. When businesses intentionally avoid meeting their tax
obligations, the integrity of the tax system is compromised. This results in an uneven playing field
for people and businesses, and in turn jeopardizes the government’s ability to deliver high‐quality
services that people deserve.
Transforming government delivery takes time, but recent initiatives are helping to accelerate
that change:
The Behavioural Insights Unit supports transformation by pilot testing new, human‐centric
approaches to improve outcomes and lower costs — and using evidence to inform what
does and doesn’t work — before scaling up, which includes redesigning communications
and access points to make programs and services easier to use.
The government is modernizing program delivery by redesigning programs so that Ontarians
can more easily access services such as income‐based benefits and the new OSAP.
The government has appointed its first Minister Responsible for Digital Government as well
as its first Chief Digital Officer to transform government services and improve the online
experience for citizens. Ontario’s Digital Government Action Plan will help drive the delivery
of services, which are simpler, faster and better for Ontarians.
Moving forward, the government will continue to place an emphasis on collective
bargaining outcomes that maintain an affordable, stable and high‐performing public‐
sector workforce.
The Province continues to support transparency and effective decision‐making in its
financial reporting, including through the consistent application of accounting policies,
reporting structures, and risk management and control activities.
204 Chapter VI: Responsible Fiscal Management
Evidence-Based Decision-Making Improving Programs and Services through Behavioural Science Research
Programs and services work best when they are designed with the people who use them in mind.
Ontario’s Behavioural Insights Unit (BIU) is among the leaders in supporting the design and
redesign of public services that better reflect how people respond to, engage with and use
these services.
Applying behavioural science to public policy and service design enables a higher return on
investment through low‐ to no‐cost solutions and evidence generation about what does —
and doesn’t work — before scaling up. This approach also accelerates public‐sector innovation
through low‐risk experimentation that encourages behaviour change rather than enforcing it,
improving outcomes and making programs more client‐centred.
Moving Forward
In 2017, the BIU will continue to focus on supporting initiatives that use behavioural science
insights to improve outcomes and accelerate innovative program delivery.
Advancing the Goals of the Poverty Reduction Strategy
Making it easier for parents to save more for their children’s education — from the very
beginning, by presenting educational savings options when a baby’s birth is registered.
Improving the Health and Well-Being of Ontarians
Improving the health of women living in Ontario through a pilot that will help increase the
number of women who participate in regular cervical cancer screening.
Optimizing Digital Services
Increasing Ontarians’ use of convenient, online public services by testing different ways
to make these services more visible and user‐friendly.
Section A: Transforming Government for Sustainability and Fairness 205
CHAPTER
VI
Transformation and Efficiency Initiatives Transformation and efficiency initiatives are driving improvement across government. Being able
to deliver effectively and efficiently on the things that matter most to Ontarians going forward
involves adopting a two‐pronged approach to support transformation.
Improving Sustainability and Value for Money for Existing Programs
The government has a strong track record in meeting its fiscal targets, and is building on the
success of recent initiatives to support the Province’s fiscal objectives. Ontario will expand the
review of current programs to identify opportunities for modernization and to ensure that
expense growth is managed within the plan that is laid out in this Budget.
Using the PRRT lenses of effectiveness, efficiency and long‐term sustainability, programs will be
reviewed and redesigned to improve value for money. A coordinated and systematic approach will
ensure that Ontarians will continue to get the supports they need in the most cost‐effective way
possible, and programs that no longer meet people’s needs will be changed or eliminated.
Outcome-Focused and User-Centred Transformation
A focus of government modernization is doing things differently. Key priorities include using
evidence‐based approaches to improve outcomes, harnessing innovative business practices and
service delivery models, and maximizing the use of digital channels and solutions. The government
is identifying opportunities to pilot and test new approaches, to find out what works. Steps will be
taken to scale up new approaches where evidence shows that they help to improve outcomes or
enhance service experience.

206 Chapter VI: Responsible Fiscal Management
Government Made Simple
Every day across Ontario, people access government services and information online.
The government is committed to making this process easier — whether it’s ordering a vehicle
permit, applying for OSAP or finding health services near home.
In 2016, Ontario became the first province in Canada to appoint a Minister Responsible for Digital
Government, demonstrating its commitment to deliver high‐impact digital projects and give
people a stronger voice in their government. Examples of projects include:
A simple online immunization calendar that helps parents and families view and save
vaccination schedules for young children;
A digital consultation platform that has allowed thousands of people to provide input to
government on topics ranging from fairness in ticket sales to a basic income pilot; and
Budget Talks, an interactive web platform that empowered Ontarians to identify and vote
on initiatives that are funded in the 2017 Budget.
The Ontario Digital Service
After a global search, the government introduced its first Chief Digital Officer (CDO) who will be
responsible for shaping and executing Ontario’s Digital Government Action Plan, which will make
services simpler, faster and better for Ontarians.
The CDO will lead the new Ontario Digital Service (ODS). The ODS will lead efforts to attract and
nurture digital talent in the Ontario government, including new, paid digital internships for recent
graduates, student co‐op placements at the ODS outpost at the Communitech Innovation Hub in
Kitchener‐Waterloo, and greater access to training and support around digital skills for
government staff.
Simpler, Better Digital Services
In 2017–18, a series of online services that millions of Ontarians use every year will be redesigned
to visibly transform the experience with government, including applying for student assistance
through the new OSAP, changing an address or renewing a driver’s licence.
A new Digital Service Standard for all public‐facing transactions will also be introduced and
published online to ensure that government services meet people’s needs, are easy to complete
and can be accessed anytime, anywhere and on any device.
Digital Literacy and Inclusion
As Ontario’s economy, society and democracy become increasingly digitized, access to new
technologies can connect people to their communities and each other, and remove barriers that
prevent people from accessing job markets, education, health care and other public services.
Section A: Transforming Government for Sustainability and Fairness 207
CHAPTER
VI
To ensure everyone has the opportunity to participate in the new economy, the government’s
focus on digital literacy and inclusion will:
Expand access to technology in public places, including in Ontario’s schools and libraries;
Support the launch of Code for Canada, an organization that will tackle civic technology and
design challenges in local communities in Ontario and across the country, with partners like
Shopify and Google Canada; and
Improve the design of digital government services so they are inclusive and accessible.
Transforming the Delivery of Income-Based Benefits
The government is transforming the way income‐based benefit programs are delivered to
Ontarians to ensure programs and services are effective, efficient and sustainable.
Since the release of the 2016 Budget, Ontario has introduced and passed new framework
legislation that will allow for information sharing across benefit programs, which will improve
client access and the delivery of benefits. Once fully implemented, clients will no longer be
required to provide personal information multiple times when applying to different benefit
programs.
Ontario has also partnered with the Canada Revenue Agency (CRA) so that applicants to a growing
number of programs can choose to have their income verified automatically. These applicants will
no longer be required to bring paper‐based proof of income.
Managing Health Care Spending and Growth
Health care represents the government’s largest single expense. As part of PRRT, Ontario
continues to transform the health care system and redesign programs to better meet the needs of
patients, caregivers and their families. For example, going forward, Local Health Integration
Networks (LHINs) will assume responsibility for the planning and performance of primary care and
the delivery of home and community care services.
To support investments in public drug funding, Ontario will also continue to ensure rigorous
evidence‐based assessment of pharmaceuticals and build on the success of the pan‐Canadian
Pharmaceutical Alliance (pCPA). This will also increase access to clinically and cost effective drug
treatment options and achieve better value by delivering lower drug costs on brand, generic and
emerging biosimilar medicines. As of December 31, 2016, these collaborative efforts between
provinces and territories have resulted in 122 completed joint negotiations on brand drugs and
price reductions on 18 generic drugs. This has resulted in over $710 million in combined savings
annually across all participating jurisdictions.
208 Chapter VI: Responsible Fiscal Management
The government is proposing amendments to the Ontario Drug Benefit Act that, if passed, would
enable it to adjust pharmacy payments and would support its work with the pharmacy sector since
2015 to obtain greater value for money. These actions would align with previous initiatives the
government has undertaken to reduce drug costs, and allow the Province to invest more in new
drug coverage for Ontarians.
Transformations such as this enable the government to invest in services for Ontarians like the
new OHIP+: Children and Youth Pharmacare program. For further information, please see
Chapter II: Helping You and Your Family.
Simpler, More Targeted Postsecondary Student Financial Assistance
The government is building on previous successes to make postsecondary education more
accessible and affordable. Students enrolled in college and university for September 2017 will be
the first to benefit from the new OSAP. With applications now open for college and university
programs, Ontario has launched a new online calculator, enabling students and their families to
find out quickly and easily whether they qualify for free tuition or other grants and supports from
the Province. Try the online OSAP calculator.1 See Chapter II: Helping You and Your Family for
additional details.
1 https://osap.gov.on.ca/AidEstimatorWeb/enterapp/enter.xhtml
Section A: Transforming Government for Sustainability and Fairness 209
CHAPTER
VI
Ensuring Everyone Pays Their Fair Share Addressing the Underground Economy
The government is delivering on its commitment to combat the underground economy and reduce
the loss of tax revenues. Since 2013–14, this government has moved forward with key initiatives
that aimed at levelling the playing field for legitimate businesses. Highlights include:
Enhanced compliance‐focused activities (e.g., auditing) that have generated over
$1.2 billion — a $350 million increase over the amount reported in the 2016 Budget.
These activities, undertaken in partnership with the Canada Revenue Agency (CRA),
help ensure everyone’s tax obligations are met.
Focused pilot initiatives in residential roofing and auto body repair that have promoted
compliance with broader regulatory obligations, helping to protect Ontario’s consumers
and workers.
The introduction of penalties for the sale, use or distribution of electronic sale
suppression devices.
Amendments made to the Ministry of Revenue Act to enable information sharing and allow
for enhanced targeting of sectors in which underground economic activity is most prevalent.
Moving forward, the government will continue to support revenue integrity by:
Using enhanced data analytics to better identify and address high‐risk areas for
underground economy activity;
Introducing a sales integrity pilot project in the retail and hospitality sectors to test and
evaluate security software that will identify businesses using electronic sales suppression
technology; and
Launching a campaign to increase public awareness of the risks and liabilities associated
with participation in the underground economy.
210 Chapter VI: Responsible Fiscal Management
Addressing Unregulated Tobacco
The presence of low‐cost, unregulated tobacco undermines the Province’s health objectives and
results in less revenue for important public services. It also compromises the public safety of
communities through links to organized crime and illicit activities.
Since 2008, Provincial inspections and investigations have resulted in assessed penalties of more than $38 million under the Tobacco Tax Act. In addition, the government has seized more than 260 million unregulated cigarettes, over 4 million untaxed cigars and more than 186 million grams of other unregulated tobacco products.
Since the 2016 Budget, the Province has successfully delivered on a number of key initiatives to
address unregulated tobacco, including:
Working with the Ontario Provincial Police to create the Contraband Tobacco Enforcement
Team. The Team has a number of ongoing tobacco investigations targeting organized crime
groups and has assisted other police forces with their major investigations.
Working with the Ministry of Health and Long‐Term Care and the Public Health Units of
Toronto, Niagara Region, Simcoe‐Muskoka and Thunder Bay to pilot cross‐designation of
tobacco retailer inspectors under both the Tobacco Tax Act and the Smoke‐Free Ontario Act.
Enhancing Provincial oversight of raw leaf tobacco by implementing measures to more
effectively monitor its movement through the supply chain, and impede its flow to
unlicensed manufacturers. The government continues to work with raw leaf tobacco
registrants, providing ongoing education to demonstrate a flexible and balanced approach
as the government implements the regulatory amendments.

Section A: Transforming Government for Sustainability and Fairness 211
CHAPTER
VI
Building on these measures, the government is taking further steps to reduce the prevalence of
unregulated tobacco by proposing amendments to the Tobacco Tax Act in order to:
Enable the forfeiture of items acquired from, or used to, engage in offences under the Act;
Restrict the importation and possession of cigarette filter components, such as acetate tow,
to registered manufacturers;
Further enhance Ontario’s oversight of raw leaf tobacco, including with increased penalties
and fines for non‐compliance;
Create new penalty and offence provisions related to the maintenance of books
and records;
Require that tobacco retailers in Ontario that currently hold a permit under the Retail Sales
Tax Act transition to the tobacco retail dealer’s permit, effective July 1, 2018; and
Publish convictions under the Act, and other Acts in the future, to promote compliance.
Ontario will continue to collaborate with its federal partners to ensure a consistent and
coordinated approach to addressing tobacco issues.
The Province recognizes that a balanced and reciprocal approach is critical in addressing tobacco
issues. This is why Ontario’s approach to tobacco includes building collaborative relationships with
First Nation communities to support a dialogue on ways to address this challenge as partners.
To read more on Ontario’s commitment to partnerships with First Nations, please see Chapter V:
Working with Our Partners.
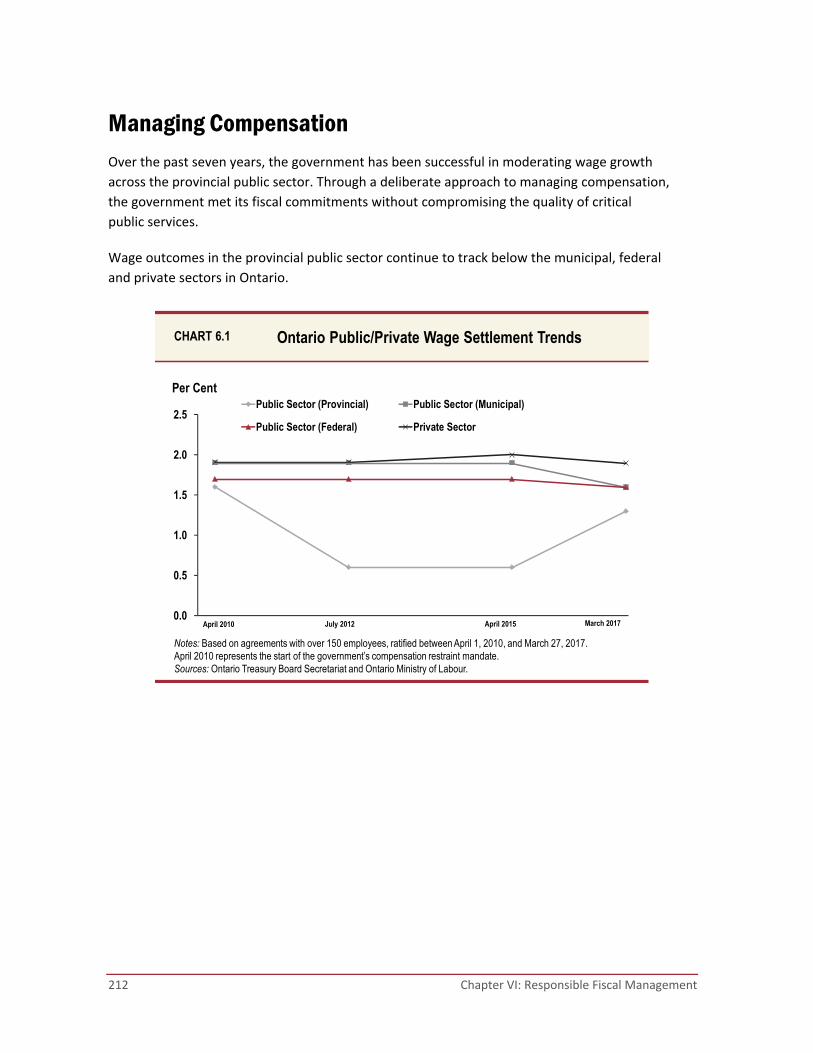
212 Chapter VI: Responsible Fiscal Management
Managing Compensation Over the past seven years, the government has been successful in moderating wage growth
across the provincial public sector. Through a deliberate approach to managing compensation,
the government met its fiscal commitments without compromising the quality of critical
public services.
Wage outcomes in the provincial public sector continue to track below the municipal, federal
and private sectors in Ontario.
Ontario Public/Private Wage Settlement TrendsCHART 6.1
Per Cent
0.0
0.5
1.0
1.5
2.0
2.5Public Sector (Provincial) Public Sector (Municipal)
Public Sector (Federal) Private Sector
July 2012April 2010
Notes: Based on agreements with over 150 employees, ratified between April 1, 2010, and March 27, 2017. April 2010 represents the start of the government’s compensation restraint mandate.Sources: Ontario Treasury Board Secretariat and Ontario Ministry of Labour.
March 2017April 2015
Section A: Transforming Government for Sustainability and Fairness 213
CHAPTER
VI
Recent Negotiations and Compensation Outcomes
Since the 2016 Budget, the government has reached a number of outcomes that are consistent
with the fiscal plan:
In May 2016, the government received an interest arbitration award for correctional staff
represented by the Ontario Public Service Employees Union (OPSEU). This award provides
modest wage increases that are offset through a freeze on salary grid progression.
Similarly, the government recently received an arbitration decision for the Ontario
Provincial Police Association, which provides outcomes below police‐sector norms.
The government also reached a four‐year agreement with the Professional Engineers
Government of Ontario (PEGO) in which wage increases were offset through changes to
benefits and termination pay.
In February, the government and the Ontario Medical Association took steps to re‐initiate
negotiations of the Physician Services Agreement, beginning with negotiations of a process
for binding interest arbitration. Re‐engagement will ensure that the government maintains
a strong and productive relationship with physicians and will help enhance access, reduce
wait times and improve the overall patient experience.
The government successfully negotiated two‐year contracts in the education sector,
which are set to expire in August 2019, and will continue to help achieve positive results
for students and those who work in the sector. The contracts will help build upon the gains
made in Ontario’s publicly funded education system. These gains include the highest
graduation rate in the province’s history, strong literacy results, and students who
are equipped with the skills and knowledge they need today for tomorrow’s rapidly
changing world.
Broader Public-Sector Executive Compensation
The government is committed to ensuring transparency and accountability in how broader public
sector employers set executive compensation. In keeping with this commitment, all designated
employers under the Broader Public Sector Executive Compensation Act, 2014 are developing
executive compensation programs that will be posted publicly.
Designated employers will have salary and performance‐related payments for executives
capped at no more than the 50th percentile of appropriate comparators. In addition, signing
bonuses, retention bonuses, cash housing allowances and pay in lieu of perquisites will not be
authorized. As part of these measures, designated employers will also consult with the public on
their programs.

214 Chapter VI: Responsible Fiscal Management
The government is enhancing its approach to ensure that employers are not only held accountable
to specific requirements, but that they also must be consistent with responsible and transparent
administration of executive compensation. This means that government will direct employers to
revisit any proposed compensation program that is not reasonable.
This enhanced approach will ensure that broader public‐sector organizations are accountable
for compensation decisions and are able to attract and retain the necessary talent to deliver
high‐quality public services while managing public dollars responsibly.
Going Forward: Leveraging Collective Bargaining to Promote Transformation
The government will continue to take a balanced approach to managing compensation.
This approach will recognize the need to maintain a stable, flexible and high‐performing public‐
sector workforce that supports the government’s transformational priorities and at the same time
ensures that public services continue to remain affordable.
Over the upcoming year, negotiations will be undertaken within key areas of the public and
broader public service, including health care, postsecondary education and social services.
Ontario’s public‐sector labour relations framework will focus on maintaining and enhancing
the positive and productive working relationships with its public‐sector partners and
bargaining agents.
Going forward, the government will focus on addressing longer‐term workforce challenges that
affect the sustainability of public services. Sector‐ and service‐wide transformation opportunities
will underpin the development of a dynamic and skilled public‐sector workforce that is best
positioned to meet the needs of Ontarians, now and in the future. To achieve this goal,
the government is committed to delivering collective bargaining outcomes across all key areas
of the public and broader public service that align with the current public‐sector wage trend and
support the Province’s transformation objectives.
Section A: Transforming Government for Sustainability and Fairness 215
CHAPTER
VI
Government Transparency, Financial Management and Fiscal Accountability Ontario continues to further strengthen government transparency, financial management and
fiscal accountability in supporting its fiscal plan and exercising effective stewardship of
public funds.
Government Transparency
Changes in Provincial Reporting Policies
The 2016–17 consolidated financial results of the Province will reflect a number of changes
consistent with the requirements of Public Sector Accounting Standards (PSAS) and the
Introduction to the PSA Handbook. Specifically, the Province’s 2016–17 Public Accounts
will reflect:
Recognition of net pension assets for the Ontario Teachers’ Pension Plan (OTPP) and the
Ontario Public Service Employees’ Union Pension Plan (OPSEUPP), the Province’s jointly
sponsored pension plans;
A change in the basis of consolidation of the financial results for Ontario Power Generation
and Hydro One on the Province’s financial statements to reflect International Financial
Reporting Standards (IFRS); and
Line‐by‐line presentation of the annual operating results for hospitals, school boards and
colleges on the Statement of Operations.
Accounting for Pensions of Jointly Sponsored Pension Plans
Consistent with the accounting policy the Province adopted in 2001 for jointly sponsored pension
plans and the results of the Pension Asset Expert Advisory Panel,2 the Province’s 2016–17 Public
Accounts will report the net pension assets for the jointly sponsored pension plans, OTPP and
OPSEUPP, in accordance with PSAS.
In last year’s Public Accounts, the government adopted a time‐limited regulatory amendment to
reflect the Auditor General’s interpretation for the treatment of net pension assets for 2015–16
(the “Pension Adjustment”), and subsequently established an independent Pension Asset Expert
Advisory Panel to further analyze and confirm the appropriate accounting policy for the Province’s
jointly sponsored pension plans.
2 https://news.ontario.ca/tbs/en/2016/11/pension‐asset‐expert‐advisory‐panel‐members.html
216 Chapter VI: Responsible Fiscal Management
Earlier this year, the Panel released its report3 and recommendations related to the accounting for
OTPP and OPSEUPP, which concluded that the net assets for the jointly sponsored plans should be
recognized on the Province’s financial statements. The government accepted the Panel’s advice,
which will be reflected in the 2016–17 Public Accounts.
Pension Asset Expert Advisory Panel’s Advice The panel’s report concluded that the Province’s share of the net pension assets in both the OTPP and the OPSEUPP should be recognized as an asset on Ontario’s financial statements, and that it would be misleading not to recognize the Province’s share of the net pension assets in the Public Accounts.4
The Panel subsequently reviewed the Province’s accounting for Healthcare of Ontario Pension Plan
(HOOPP) and Colleges of Applied Arts and Technology Pension Plan (CAATPP). The Panel
concluded that based on the difference in the governance structure of these plans as compared to
OTPP and OPSEUPP, a full valuation allowance should be applied to any net pension asset for
CAATPP or HOOPP until the surpluses are used to reduce contributions. For both of these plans,
the government does not have control or joint control over the decisions regarding contribution
levels or benefit changes, as the government is not a member of the committees responsible for
those decisions. To date, no net pension asset has been reported under either HOOPP or CAATPP;
however, it is possible that a net asset may result in future years for one or both plans.
Accounting for Government Business Enterprises
The financial results of the Province’s rate‐regulated Government Business Enterprises (Ontario
Power Generation Inc. and Hydro One Ltd.) are consolidated in the Province’s consolidated
financial reports using the modified equity method. As permitted by securities regulators,
the entities’ stand‐alone financial statements are reported based on U.S. Generally Accepted
Accounting Principles (US GAAP). Under PSAS, the results of government business enterprises are
required to be reflected on the Province’s financial statements based on International Financial
Reporting Standards (IFRS). As of April 1, 2016, the Province will consolidate the results of these
two rate‐regulated entities as they would be reported under IFRS (including IFRS 14 – Regulatory
Deferral Accounts). The entities themselves will continue to issue financial statements prepared on
a US GAAP‐basis.
3 https://www.ontario.ca/page/pension‐asset‐expert‐advisory‐panel‐report 4 https://news.ontario.ca/tbs/en/2017/02/pension‐asset‐expert‐advisory‐panel‐submits‐report.html
Section A: Transforming Government for Sustainability and Fairness 217
CHAPTER
VI
Presentation of Hospitals, School Boards and Colleges
Starting with the 2016–17 Public Accounts, the Province’s Statement of Operations will reflect the
revenues and expenses of hospitals, school boards and colleges on a line‐by‐line basis. Previously,
the results of these sectors were presented on a net‐expense basis, netting third‐party revenues
against the sector expenses. This change in presentation will not impact the Province’s reported
net annual surplus or deficit; however, third‐party revenues will be reported with other
government revenues and will no longer be netted against sector expenses, including interest
expense, which will be presented on a gross basis.
Recent Developments in Public-Sector Accounting Standards
The government continues to provide input to Public Sector Accounting Board (PSAB) on a number
of initiatives, including PSAB’s review of its conceptual framework; employment benefits, such as
pensions; and accounting for financial instruments and foreign currency translation. PSAB has also
initiated projects to review the accounting for asset retirement obligations, revenue reporting and
public–private partnerships.
Users, including the legislature and the public, need accountability in government reporting and
decision making. As a result, it is essential that public‐sector financial statements reflect the
economic substance of the government’s activities.
Financial Management
Interim Appropriation Act
The Interim Appropriation for 2017–2018 Act, 2016 received Royal Assent in December 2016 and
came into force on April 1, 2017, to provide interim legal spending authority for anticipated
2017–18 spending. All spending under this Act must be charged to the proper appropriation
following the voting of supply for the 2017–18 fiscal year. This is expected to enable the
government to continue operations until the Legislative Assembly has completed its consideration
of the 2017–18 Expenditure Estimates and a related supply bill.
Enterprise Risk Management
The government is transforming and modernizing public services by finding new and smarter ways
to both improve outcomes for Ontarians and to meet the Province’s fiscal commitments.
Government decisions must be focused on the need to both create and protect value, informed by
an understanding of internal and external contexts and stakeholder needs, supported by evidence,
and guided by a full consideration of both threats and opportunities.
The Province continues to implement enterprise risk management (ERM) across the Ontario Public
Service. This implementation will support the achievement of Provincial objectives through the
enterprise‐wide integration of risk management into decision‐making, policy development,
operations and transformation activities of ministries and Provincial agencies.
218 Chapter VI: Responsible Fiscal Management
Fiscal Accountability
Reporting and Designated Purpose Tracking
With the 2017 Budget, the government is reporting on the first investments to be tracked through
a Designated Purpose Account. The Trillium Trust, along with the Greenhouse Gas Reduction
Account, are the first two examples that use the new accountability framework to track and report
on the progress of designated‐purpose spending commitments based on identified
revenue streams.
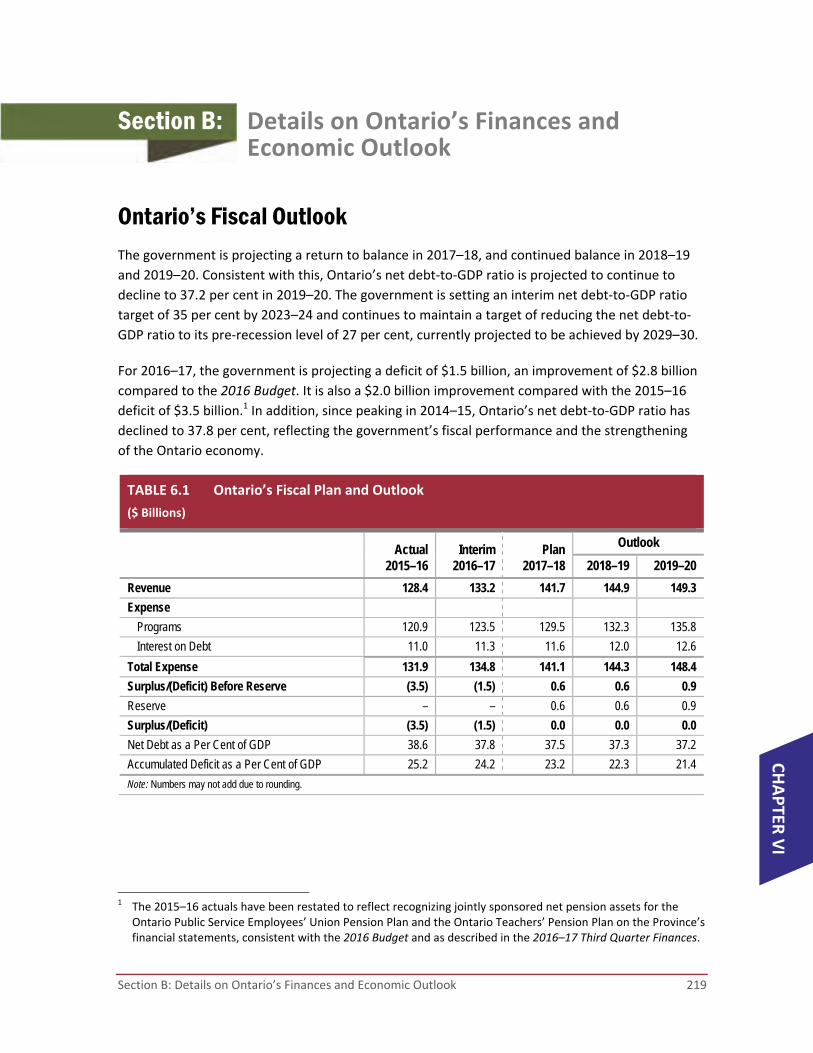
Section B: Details on Ontario’s Finances and Economic Outlook 219
CHAPTER
VI
Section B: Details on Ontario’s Finances and Economic Outlook
Ontario’s Fiscal Outlook The government is projecting a return to balance in 2017–18, and continued balance in 2018–19
and 2019–20. Consistent with this, Ontario’s net debt‐to‐GDP ratio is projected to continue to
decline to 37.2 per cent in 2019–20. The government is setting an interim net debt‐to‐GDP ratio
target of 35 per cent by 2023–24 and continues to maintain a target of reducing the net debt‐to‐
GDP ratio to its pre‐recession level of 27 per cent, currently projected to be achieved by 2029–30.
For 2016–17, the government is projecting a deficit of $1.5 billion, an improvement of $2.8 billion
compared to the 2016 Budget. It is also a $2.0 billion improvement compared with the 2015–16
deficit of $3.5 billion.1 In addition, since peaking in 2014–15, Ontario’s net debt‐to‐GDP ratio has
declined to 37.8 per cent, reflecting the government’s fiscal performance and the strengthening
of the Ontario economy.
TABLE 6.1 Ontario’s Fiscal Plan and Outlook
($ Billions)
Actual
2015–16 Interim
2016–17 Plan
2017–18
Outlook
2018–19 2019–20
Revenue 128.4 133.2 141.7 144.9 149.3
Expense
Programs 120.9 123.5 129.5 132.3 135.8
Interest on Debt 11.0 11.3 11.6 12.0 12.6
Total Expense 131.9 134.8 141.1 144.3 148.4
Surplus/(Deficit) Before Reserve (3.5) (1.5) 0.6 0.6 0.9
Reserve – – 0.6 0.6 0.9
Surplus/(Deficit) (3.5) (1.5) 0.0 0.0 0.0
Net Debt as a Per Cent of GDP 38.6 37.8 37.5 37.3 37.2
Accumulated Deficit as a Per Cent of GDP 25.2 24.2 23.2 22.3 21.4
Note: Numbers may not add due to rounding.
1 The 2015–16 actuals have been restated to reflect recognizing jointly sponsored net pension assets for the
Ontario Public Service Employees’ Union Pension Plan and the Ontario Teachers’ Pension Plan on the Province’s financial statements, consistent with the 2016 Budget and as described in the 2016–17 Third Quarter Finances.
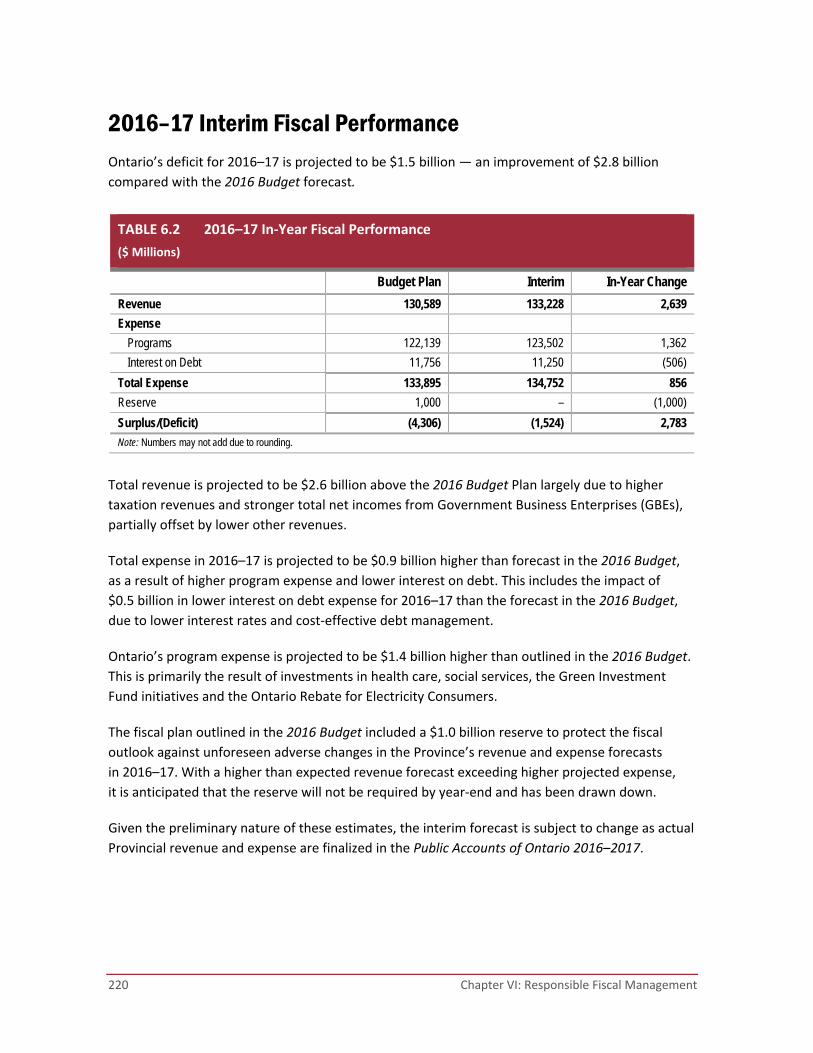
220 Chapter VI: Responsible Fiscal Management
2016–17 Interim Fiscal Performance Ontario’s deficit for 2016–17 is projected to be $1.5 billion — an improvement of $2.8 billion
compared with the 2016 Budget forecast.
TABLE 6.2 2016–17 In‐Year Fiscal Performance
($ Millions)
Budget Plan Interim In-Year Change
Revenue 130,589 133,228 2,639
Expense
Programs 122,139 123,502 1,362
Interest on Debt 11,756 11,250 (506)
Total Expense 133,895 134,752 856
Reserve 1,000 – (1,000)
Surplus/(Deficit) (4,306) (1,524) 2,783
Note: Numbers may not add due to rounding.
Total revenue is projected to be $2.6 billion above the 2016 Budget Plan largely due to higher
taxation revenues and stronger total net incomes from Government Business Enterprises (GBEs),
partially offset by lower other revenues.
Total expense in 2016–17 is projected to be $0.9 billion higher than forecast in the 2016 Budget,
as a result of higher program expense and lower interest on debt. This includes the impact of
$0.5 billion in lower interest on debt expense for 2016–17 than the forecast in the 2016 Budget,
due to lower interest rates and cost‐effective debt management.
Ontario’s program expense is projected to be $1.4 billion higher than outlined in the 2016 Budget.
This is primarily the result of investments in health care, social services, the Green Investment
Fund initiatives and the Ontario Rebate for Electricity Consumers.
The fiscal plan outlined in the 2016 Budget included a $1.0 billion reserve to protect the fiscal
outlook against unforeseen adverse changes in the Province’s revenue and expense forecasts
in 2016–17. With a higher than expected revenue forecast exceeding higher projected expense,
it is anticipated that the reserve will not be required by year‐end and has been drawn down.
Given the preliminary nature of these estimates, the interim forecast is subject to change as actual
Provincial revenue and expense are finalized in the Public Accounts of Ontario 2016–2017.
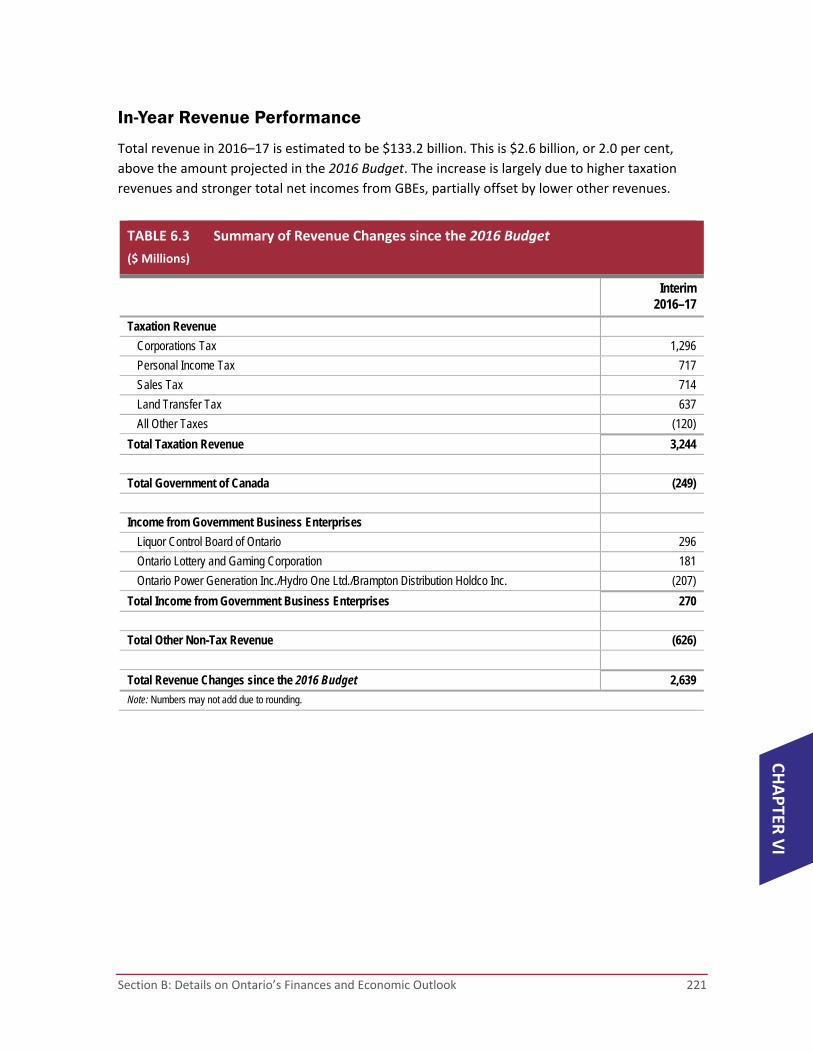
Section B: Details on Ontario’s Finances and Economic Outlook 221
CHAPTER
VI
In-Year Revenue Performance
Total revenue in 2016–17 is estimated to be $133.2 billion. This is $2.6 billion, or 2.0 per cent,
above the amount projected in the 2016 Budget. The increase is largely due to higher taxation
revenues and stronger total net incomes from GBEs, partially offset by lower other revenues.
TABLE 6.3 Summary of Revenue Changes since the 2016 Budget
($ Millions)
Interim
2016–17
Taxation Revenue
Corporations Tax 1,296
Personal Income Tax 717
Sales Tax 714
Land Transfer Tax 637
All Other Taxes (120)
Total Taxation Revenue 3,244
Total Government of Canada (249)
Income from Government Business Enterprises
Liquor Control Board of Ontario 296
Ontario Lottery and Gaming Corporation 181
Ontario Power Generation Inc./Hydro One Ltd./Brampton Distribution Holdco Inc. (207)
Total Income from Government Business Enterprises 270
Total Other Non-Tax Revenue (626)
Total Revenue Changes since the 2016 Budget 2,639
Note: Numbers may not add due to rounding.

222 Chapter VI: Responsible Fiscal Management
Revenue Changes
Highlights of key 2016–17 revenue changes from the 2016 Budget forecast are as follows:
Corporations Tax (CT) revenue is $1,296 million higher, mainly due to higher revenue in
2015 and prior years from tax returns processed and a stronger corporate profits outlook
relative to the 2016 Budget.
Personal Income Tax (PIT) revenue is $717 million higher than the 2016 Budget forecast,
primarily due to higher 2015 revenue from tax returns processed.
Sales Tax revenues are estimated to be $714 million higher, largely reflecting an increase
to Harmonized Sales Tax (HST) revenues due to a higher Ontario share of the overall
HST/GST revenue pool as the provincial economy has performed better than the rest of
Canada in 2015 and 2016.
Land Transfer Tax (LTT) revenues are estimated to be $637 million higher, due to higher
Ontario housing resale prices.
All Other Tax revenues combined are estimated to be $120 million lower, mainly due to
lower revenues from electricity payments in lieu (PIL) of taxes and Employer Health Tax,
partially offset by higher revenues from Education Property Tax, Gasoline Tax, Tobacco Tax
and Ontario Health Premium.
Government of Canada transfers are estimated to be $249 million lower than the
2016 Budget forecast, largely reflecting lower transfers for infrastructure projects, mainly
due to revised timelines for the Building Canada Fund and the absence of anticipated
federal health funding for home care.
Net income from the Liquor Control Board of Ontario (LCBO) is projected to be $296 million
higher than projected in the 2016 Budget, primarily due to the recategorization from Sales
and Rentals of the impact of the sale of its head office lands as part of the Province’s asset
optimization strategy.
Net income from the Ontario Lottery and Gaming Corporation (OLG) is estimated to be
$181 million higher than projected in the 2016 Budget, due to higher than projected
revenues in OLG’s lottery, slots and casinos, and resort casinos business lines.
The combined net incomes of Ontario Power Generation Inc. (OPG), Hydro One Ltd. (HOL)
and Brampton Distribution Holdco Inc. are projected to be $207 million below the
2016 Budget forecast. Lower HOL net income shown as consolidated by the Province mainly
reflects the recategorization of impacts of broadening Hydro One ownership that were
previously reflected under Sales and Rentals. Lower than projected OPG net income is
mainly due to a variance from gross margins assumed in the 2016 Budget.
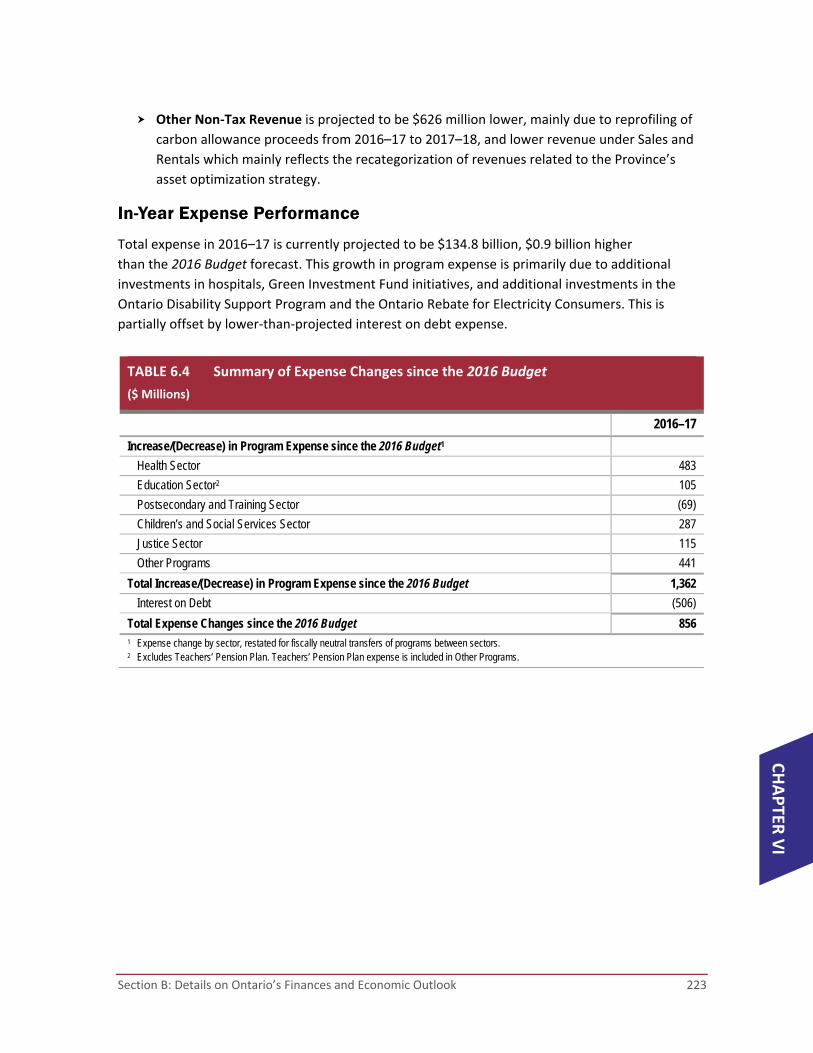
Section B: Details on Ontario’s Finances and Economic Outlook 223
CHAPTER
VI
Other Non‐Tax Revenue is projected to be $626 million lower, mainly due to reprofiling of
carbon allowance proceeds from 2016–17 to 2017–18, and lower revenue under Sales and
Rentals which mainly reflects the recategorization of revenues related to the Province’s
asset optimization strategy.
In-Year Expense Performance
Total expense in 2016–17 is currently projected to be $134.8 billion, $0.9 billion higher
than the 2016 Budget forecast. This growth in program expense is primarily due to additional
investments in hospitals, Green Investment Fund initiatives, and additional investments in the
Ontario Disability Support Program and the Ontario Rebate for Electricity Consumers. This is
partially offset by lower‐than‐projected interest on debt expense.
TABLE 6.4 Summary of Expense Changes since the 2016 Budget
($ Millions)
2016–17
Increase/(Decrease) in Program Expense since the 2016 Budget1
Health Sector 483
Education Sector2 105
Postsecondary and Training Sector (69)
Children’s and Social Services Sector 287
Justice Sector 115
Other Programs 441
Total Increase/(Decrease) in Program Expense since the 2016 Budget 1,362
Interest on Debt (506)
Total Expense Changes since the 2016 Budget 856 1 Expense change by sector, restated for fiscally neutral transfers of programs between sectors. 2 Excludes Teachers’ Pension Plan. Teachers’ Pension Plan expense is included in Other Programs.

224 Chapter VI: Responsible Fiscal Management
Expense Changes
The following expense changes have occurred since the 2016 Budget:
Health sector expense is projected to increase by $483 million, primarily due to additional
investments in hospitals to support the needs of patients and reduce wait times, and
funding to support additional stem cell transplants in Ontario.
Education sector expense is projected to be $105 million higher than forecast, primarily due
to higher‐than‐projected enrolment.
Postsecondary and training sector is projected to be $69 million lower than anticipated,
mainly as result of lower‐than‐forecasted demand in employment and training programs
and student financial assistance programs.
Children’s and social services sector expense is projected to increase by $287 million,
primarily due to additional investments to address demand for the Ontario Disability
Support Program and increased funding for autism services.
Justice sector expense is expected to increase by $115 million, primarily due to settlements
under the Proceedings Against the Crown Act, reforms to the corrections system and
ensuring wage parity for First Nation police officers.
Other programs expense is expected to increase by $441 million, mainly due to the Green
Investment Fund initiatives, the Ontario Rebate for Electricity Consumers, investments in
social and affordable housing, and the Clean Water and Wastewater Fund.
Interest on debt expense is projected to be $506 million lower than forecast in the 2016 Budget,
primarily due to lower‐than‐forecast interest rates, the lower forecasted deficit and cost‐effective
debt management.

Section B: Details on Ontario’s Finances and Economic Outlook 225
CHAPTER
VI
Medium-Term Fiscal Outlook The government is projecting a balanced budget in 2017–18, consistent with the plan first laid out
in the 2010 Budget. The Province is also projecting continued balance in 2018–19 and 2019–20.
Over the medium term, revenue is forecast to increase from $133.2 billion in 2016–17 to
$149.3 billion in 2019–20, while total expense is projected to increase from $134.8 billion to
$148.4 billion over the same period.
Key Changes since the 2016 Budget
The medium‐term revenue outlook is above the 2016 Budget Plan largely because of strong
performance in taxation revenues driven by a growing economy. Personal Income Tax and
Corporations Tax revenues are boosted by stronger‐than‐expected assessments for 2015 and prior
years. Higher HST revenues reflect upward federal revision to Ontario entitlements due to an
increase in Ontario’s share of the overall revenue pool and lower housing rebates. Land Transfer
Tax revenues have been boosted by higher‐than‐expected increases in housing prices.
Total expense over the medium term is projected to be higher than forecast at the time of the
2016 Budget as a result of the investments the government is making in health, education,
electricity cost relief and other public services that matter to Ontario families, partially offset by
lower interest on debt expense. Ontario’s medium‐term outlook for interest on debt expense is
currently below the 2016 Budget estimate, primarily as a result of lower‐than‐forecast interest
rates, along with effective and efficient debt management.
The program expense outlook over the medium term is projected to be higher in each of
2016–17, 2017–18 and 2018–19, compared with the medium‐term forecast in the 2016 Budget.
This increase reflects the investments the government can continue to make as a result of
restoring a balanced budget including:
Supporting hospitals, children and youth pharmacare, primary care, home care, and mental
health services;
Supporting enrolment growth in schools, child care expansion and the Highly Skilled
Workforce Strategy; and
Supporting electricity cost relief programs under the Fair Hydro Plan.
The reserve included in the fiscal plan has been set at $0.6 billion in 2017–18 and 2018–19,
reflecting continued prudence while recognizing the confidence arising from a strengthening
Ontario economy and a restoring of fiscal balance in Ontario.
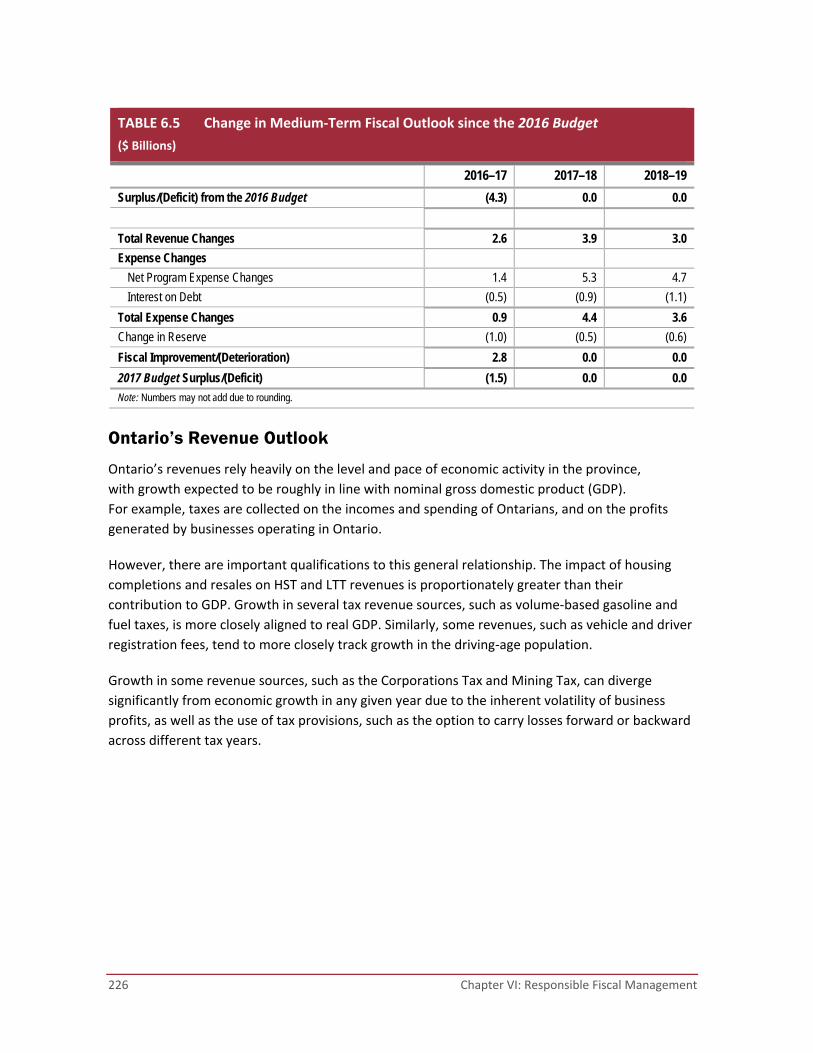
226 Chapter VI: Responsible Fiscal Management
TABLE 6.5 Change in Medium‐Term Fiscal Outlook since the 2016 Budget
($ Billions)
2016–17 2017–18 2018–19
Surplus/(Deficit) from the 2016 Budget (4.3) 0.0 0.0
Total Revenue Changes 2.6 3.9 3.0
Expense Changes
Net Program Expense Changes 1.4 5.3 4.7
Interest on Debt (0.5) (0.9) (1.1)
Total Expense Changes 0.9 4.4 3.6
Change in Reserve (1.0) (0.5) (0.6)
Fiscal Improvement/(Deterioration) 2.8 0.0 0.0
2017 Budget Surplus/(Deficit) (1.5) 0.0 0.0
Note: Numbers may not add due to rounding.
Ontario’s Revenue Outlook
Ontario’s revenues rely heavily on the level and pace of economic activity in the province,
with growth expected to be roughly in line with nominal gross domestic product (GDP).
For example, taxes are collected on the incomes and spending of Ontarians, and on the profits
generated by businesses operating in Ontario.
However, there are important qualifications to this general relationship. The impact of housing
completions and resales on HST and LTT revenues is proportionately greater than their
contribution to GDP. Growth in several tax revenue sources, such as volume‐based gasoline and
fuel taxes, is more closely aligned to real GDP. Similarly, some revenues, such as vehicle and driver
registration fees, tend to more closely track growth in the driving‐age population.
Growth in some revenue sources, such as the Corporations Tax and Mining Tax, can diverge
significantly from economic growth in any given year due to the inherent volatility of business
profits, as well as the use of tax provisions, such as the option to carry losses forward or backward
across different tax years.
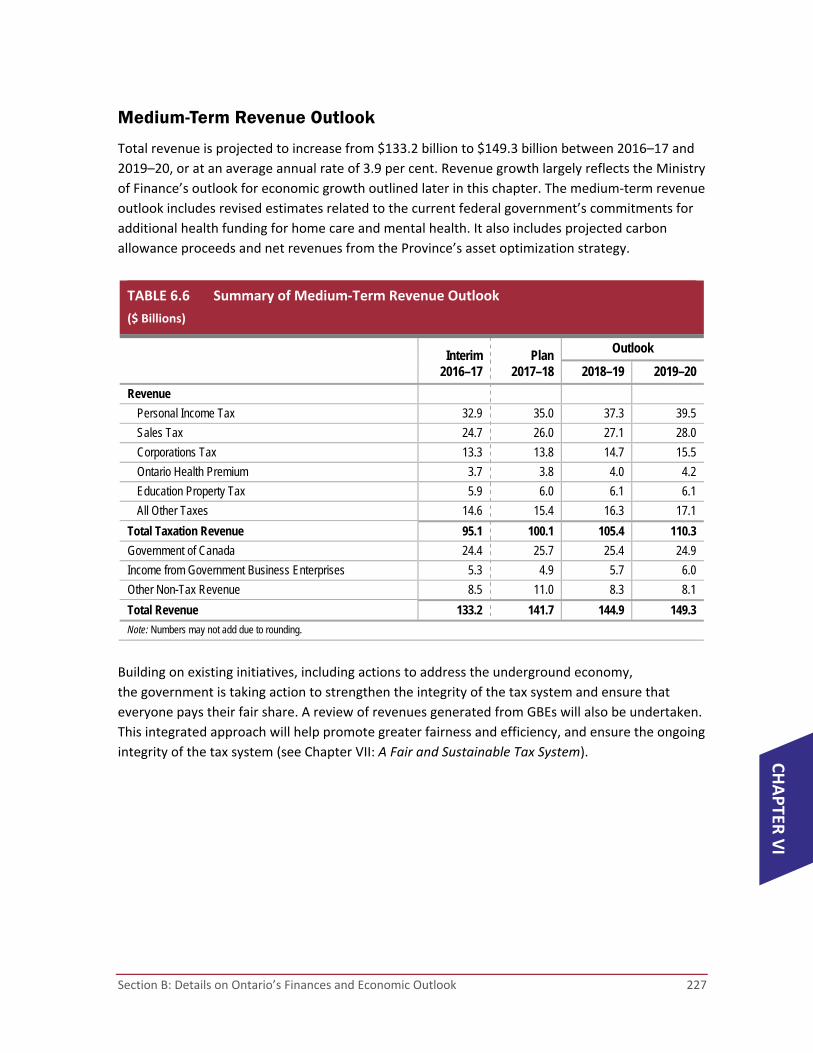
Section B: Details on Ontario’s Finances and Economic Outlook 227
CHAPTER
VI
Medium-Term Revenue Outlook
Total revenue is projected to increase from $133.2 billion to $149.3 billion between 2016–17 and
2019–20, or at an average annual rate of 3.9 per cent. Revenue growth largely reflects the Ministry
of Finance’s outlook for economic growth outlined later in this chapter. The medium‐term revenue
outlook includes revised estimates related to the current federal government’s commitments for
additional health funding for home care and mental health. It also includes projected carbon
allowance proceeds and net revenues from the Province’s asset optimization strategy.
TABLE 6.6 Summary of Medium‐Term Revenue Outlook
($ Billions)
Interim 2016–17
Plan 2017–18
Outlook
2018–19 2019–20
Revenue
Personal Income Tax 32.9 35.0 37.3 39.5
Sales Tax 24.7 26.0 27.1 28.0
Corporations Tax 13.3 13.8 14.7 15.5
Ontario Health Premium 3.7 3.8 4.0 4.2
Education Property Tax 5.9 6.0 6.1 6.1
All Other Taxes 14.6 15.4 16.3 17.1
Total Taxation Revenue 95.1 100.1 105.4 110.3
Government of Canada 24.4 25.7 25.4 24.9
Income from Government Business Enterprises 5.3 4.9 5.7 6.0
Other Non-Tax Revenue 8.5 11.0 8.3 8.1
Total Revenue 133.2 141.7 144.9 149.3
Note: Numbers may not add due to rounding.
Building on existing initiatives, including actions to address the underground economy,
the government is taking action to strengthen the integrity of the tax system and ensure that
everyone pays their fair share. A review of revenues generated from GBEs will also be undertaken.
This integrated approach will help promote greater fairness and efficiency, and ensure the ongoing
integrity of the tax system (see Chapter VII: A Fair and Sustainable Tax System).

228 Chapter VI: Responsible Fiscal Management
The medium‐term taxation revenue growth profile reflects growth in the economy, but may also
incorporate prior‐year adjustments and the impacts of past and proposed tax measures.
These latter impacts may result in a taxation revenue growth profile for a specific revenue source
that appears to be inconsistent with the growth profile of the main related economic driver.
To help explain the medium‐term growth profile of the major taxation revenues, the following
three tables adjust total projected revenues for each of Personal Income Tax, Sales Tax and
Corporations Tax, to remove prior‐year adjustments and impacts of measures to arrive at
“base revenue.” This base revenue measure is shown to be more closely aligned to the main
economic driver for the specific taxation revenue source.
TABLE 6.7 Personal Income Tax Revenue Outlook
($ Billions)
Interim 2016–17
Plan 2017–18
Outlook
Revenue 2018–19 2019–20
Total Projected Revenue 32.9 35.0 37.3 39.5
Tax Measures1 (0.0) 0.1 0.3 0.4
Other Adjustments (0.2) 0.0 0.0 0.0
Base Revenue2 33.1 34.9 36.9 39.1
Base Revenue Growth (Per Cent) – 5.4 5.7 5.9
Compensation of Employees3 (Per Cent Change)
– 4.1 4.5 4.6
1 Represents the revenue impact of all tax measures, announced previously or proposed in this Budget. 2 Total Projected Revenue less the impact of tax measures or other one-time factors, such as prior-year adjustments.
Base Revenue reflects the impact of underlying macroeconomic factors. 3 Includes wages, salaries and employers’ social contributions. Note: Numbers may not add due to rounding.
The primary economic driver of the forecast for Personal Income Tax (PIT) revenue is the outlook
for growth in the compensation of employees. The PIT revenue projection also reflects the impact
of tax measures, as well as prior‐year and other adjustments. Tax measures include those
announced in past Budgets and those proposed in this Budget (see Chapter VII: A Fair and
Sustainable Tax System), as well as the impact of federal measures including those announced in
the 2017 federal budget. Excluding the impacts of tax measures and other adjustments, the PIT
revenue base is projected to grow at an average annual rate of 5.7 per cent over the forecast
period. This compares with average annual growth of 4.4 per cent in compensation of employees
over this period. Personal Income Tax revenue tends to grow at a faster rate than incomes due to
the progressive structure of the PIT system.

Section B: Details on Ontario’s Finances and Economic Outlook 229
CHAPTER
VI
TABLE 6.8 Sales Tax Revenue Outlook
($ Billions)
Interim 2016–17
Plan 2017–18
Outlook
Revenue 2018–19 2019–20
Total Projected Sales Tax Revenue1 24.7 26.0 27.1 28.0
Tax Measures2 0.3 0.2 0.1 0.1
Other Adjustments 0.2 0.0 0.0 0.0
Base Revenue3 24.2 25.8 27.0 27.9
Base Revenue Growth (Per Cent) – 6.9 4.5 3.3
Nominal Consumption Growth (Per Cent) – 4.3 4.2 4.2 1 Revenues from sales tax include: the provincial portion of the Harmonized Sales Tax (HST), Ontario’s Retail Sales Tax (RST) on certain
insurance premiums, and the RST on private transfers of specified vehicles. Sales Tax Revenue is reported net of both the Ontario Sales Tax Credit and the energy component of the Ontario Energy and Property Tax Credit.
2 Represents the revenue impact of all tax measures, announced previously or proposed in this Budget. 3 Total Projected Revenue less the impact of tax measures or other one-time factors, such as prior-year adjustments.
Base Revenue reflects the impact of underlying macroeconomic factors. Note: Numbers may not add due to rounding.
The Sales Tax revenue projection is based primarily on growth in consumer spending. The Sales
Tax revenue projection also reflects the impact of tax measures and prior‐year adjustments.
Tax measures of $0.3 billion in 2016–17 primarily reflect the impact of transitional measures such
as input tax credits, which are being phased out by 2018–19. Other adjustments reflect a one‐time
adjustment of $0.2 billion in 2016–17 related to a variance from Sales Tax revenue reported in the
Public Accounts of Ontario 2015–2016. Excluding the impacts of measures and other adjustments,
the Sales Tax revenue base is projected to grow at an average annual rate of 4.9 per cent,
reflecting average annual growth in nominal consumption of 4.2 per cent over this period.

230 Chapter VI: Responsible Fiscal Management
TABLE 6.9 Corporations Tax Revenue Outlook
($ Billions)
Interim 2016–17
Plan 2017–18
Outlook
Revenue 2018–19 2019–20
Total Projected Revenue 13.3 13.8 14.7 15.5
Tax Measures1 0.2 0.3 0.4 0.4
Other Adjustments2 0.6 0.0 0.0 0.0
Base Revenue3 12.6 13.5 14.4 15.1
Base Revenue Growth (Per Cent) – 7.4 6.5 5.0
Net Operating Surplus — Corporations Growth (Per Cent)
– 6.8 7.1 5.4
1 Represents the revenue impact of all tax measures announced previously or proposed in this Budget. 2 Other Adjustments include net timing of payment adjustments due to the difference between projected Corporations Tax (CT) revenue
entitlements and projected federal CT remittances. 3 Total Projected Revenue less the impact of tax measures or other one-time factors, such as prior-year adjustments. Base Revenue reflects the
impact of underlying macroeconomic factors. Note: Numbers may not add due to rounding.
The forecast for Corporations Tax (CT) revenue is based on the annual growth in the net operating
surplus of corporations. The CT revenue projection reflects the impact of tax measures, as well as
prior‐year and other adjustments. Tax measures include those announced in past federal and
provincial budgets and those proposed in this Budget (see Chapter VII: A Fair and Sustainable Tax
System). After accounting for tax measures and other adjustments, the CT revenue base grows at
an average annual rate of 6.3 per cent over the forecast period. This is in line with the 6.5 per cent
average annual growth in the net operating surplus of corporations.
Ontario Health Premium revenue forecast is based primarily on the projected growth in the
compensation of employees. As a result, Ontario Health Premium revenue is projected to increase
at an average annual rate of 4.4 per cent over the forecast period.
Education Property Tax revenue is projected to increase at an average annual rate of 1.1 per cent
over the forecast period. This is largely due to growth in the property assessment base resulting
from new construction activities.
Revenues from All Other Taxes are projected to increase at an average annual rate of 5.4 per cent
over the forecast period. This includes revenues from the Land Transfer Tax, Beer and Wine Tax
and volume‐based taxes such as the Gasoline Tax, Fuel Tax and Tobacco Tax. The effect of the new
housing affordability policies on the housing market, and therefore on LTT revenues, are difficult
to predict. However, LTT revenues are projected to increase, but at a slower rate than last year,
reflecting a moderation in the pace of housing market activity.
Section B: Details on Ontario’s Finances and Economic Outlook 231
CHAPTER
VI
The forecast for Government of Canada transfers is based on existing federal–provincial funding
arrangements. Revenues are projected to grow slightly at an average annual rate of 0.6 per cent
over the forecast period, largely reflecting projected increases in the Canada Health Transfer and
Canada Social Transfer, partially offset by lower projections of Equalization payments. The forecast
also includes revised estimates related to the federal government’s 2017 budget announcement of
federal health funding for home care and mental health.
The outlook for Income from Government Business Enterprises (GBEs) is based on Ministry of
Finance estimates of net income for Hydro One and information provided by Ontario Power
Generation, Liquor Control Board of Ontario (LCBO) and the Ontario Lottery and Gaming
Corporation (OLG). Overall revenue from GBEs is projected to increase by $0.7 billion between
2016–17 and 2019–20, or at an average annual rate of 4.3 per cent.
The forecast for Other Non‐Tax revenue is based on projections provided by government
ministries and Provincial agencies. Between 2016–17 and 2019–20, Other Non‐Tax revenues are
projected to be slightly lower by $0.3 billion. This decrease largely reflects the removal of the Debt
Retirement Charge from commercial, industrial and all other electricity users in 2018–19 and the
projected net impact of the Province’s planned asset optimization strategy. This decline is partially
offset by higher revenue from vehicle and driver registration fees.

232 Chapter VI: Responsible Fiscal Management
Key Changes in the Medium-Term Revenue Outlook since the 2016 Budget
Compared with the 2016 Budget forecast, the outlook for revenues are higher over the 2016–17 to
2018–19 period.
TABLE 6.10 Summary of Medium‐Term Revenue Changes since the 2016 Budget
($ Billions)
2016–17 2017–18 2018–19
Taxation 3.2 4.1 5.2
Government of Canada Transfers (0.2) (0.1) (1.1)
Government Business Enterprises 0.3 (0.5) 0.0
Carbon Allowance Proceeds (0.5) (0.1) (0.5)
Other Non-Tax Revenue (0.1) 0.5 (0.7)
Total Revenue Changes 2.6 3.9 3.0
Note: Numbers may not add due to rounding.
Taxation revenues are higher, largely due to stronger economic growth and higher‐than‐expected
revenues from processing past years tax returns. Stronger estimates of economic growth for
2014 to 2016 have increased Ontario’s 2016 nominal GDP by $19.8 billion above the level
expected in the 2016 Budget. The latest tax data from processing of Personal and Corporate
Income Tax returns during 2016 boosted the 2015 base upon which growth is applied, increasing
revenue estimates over the forecast period. The HST base in 2015 was also higher as Ontario’s
relatively stronger economic growth exceeded expectations, increasing Ontario’s share of the
revenue pool. Taxation revenue also benefited from continued strength of the Ontario housing
market. Finally, the higher taxation revenue includes impact of tax measures announced in this
Budget (see Chapter VII: A Fair and Sustainable Tax System). Tax measures include a Tobacco Tax
rate increase and paralleling of the 2017 federal budget tax measures.
Lower Government of Canada Transfers in 2016–17 largely reflects lower‐than‐projected funding
for infrastructure projects and the absence of funding for home care as anticipated in the
2016 Budget. The decline in the plan year and the medium term mainly reflects lower projected
Equalization payments, partially offset in 2017–18 by higher federal transfer for public
transit projects.
Section B: Details on Ontario’s Finances and Economic Outlook 233
CHAPTER
VI
Income from Government Business Enterprises is projected to be higher in 2016–17 reflecting
stronger overall performance from OLG and LCBO, including the recategorization from Sales and
Rentals of the impact of the sale of LCBO’s head office lands as part of the Province’s asset
optimization strategy. The decrease in 2017–18 is mainly due to projected lower combined net
incomes of Hydro One Ltd. and the Ontario Power Generation Inc., including the impact of a
Provincial accounting consolidation adjustment, as required in Public Accounts under Public Sector
Accounting Standards, as discussed in Chapter VI, Section A: Transforming Government for
Sustainability and Fairness.
The revenue outlook also includes projected proceeds from the auctioning of carbon allowances
beginning in 2016–17. Lower proceeds in 2016–17 reflect revenue from the first auction in
March 2017 being certified and settled in fiscal year 2017–18. A lower medium‐term outlook also
reflects revised projections using more cautious assumptions.
The decrease in Other Non‐Tax Revenue in 2016–17 is largely due to lower Sales and Rentals
revenue recategorized under LCBO net income as indicated above; partially offset by higher
revenue from power supply contract recoveries that are fiscally neutral and other miscellaneous
revenue sources. The overall change in the medium term largely reflects revised net impacts of the
Province’s planned asset optimization strategy, higher miscellaneous revenues, and fiscally neutral
lower power supply contract recoveries.
Risks to the Revenue Outlook
Ontario’s revenue outlook is based on reasonable assumptions about the pace of growth in
Ontario’s economy. There are both positive and negative risks to the economic projections
underlying the revenue forecast. Some of these risks are discussed in this section.
The following section highlights some of the key sensitivities and risks to the fiscal plan that could
arise from unexpected changes in economic conditions. These estimates are only guidelines;
actual results will vary depending on the composition and interaction of the various factors.
The risks are those that could have the most material impact on the largest revenue sources.
A broader range of additional risks are not included because they are either less material or
difficult to quantify. For example, the outlook for Government of Canada transfers is subject to
changes in economic variables that affect federal funding, as well as changes by the federal
government to the funding arrangements themselves.

234 Chapter VI: Responsible Fiscal Management
TABLE 6.11 Selected Economic and Revenue Risks and Sensitivities
Economic Factors Revenue Sources 2017–18 Sensitivities*
Nominal GDP Total Taxation Revenue
$690 million revenue change for each percentage point change in Nominal GDP Growth
Compensation of Employees Personal Income Tax, Ontario Health Premium and Employer Health Tax
$425 million revenue change for each percentage point change in growth in Compensation of Employees
Household Consumption Expenditures
Harmonized Sales Tax $190 million for each percentage point change in growth of Household Consumption Expenditures
Net Corporations Operating Surplus Corporations Tax $145 million revenue change for each percentage point change in growth of Net Corporations Operating Surplus
Housing Resales and Resale Prices Land Transfer Tax $26 million for each percentage point change in growth of either the number or prices of Housing Resales
* Can vary significantly, depending on composition and source of changes in the underlying economic driver.

Section B: Details on Ontario’s Finances and Economic Outlook 235
CHAPTER
VI
Medium-Term Expense Outlook
The Province’s program expense outlook is projected to grow at an average annual rate of
2.9 per cent between 2015–16 and 2019–20. This reflects the government’s commitment to invest
in priority areas such as health care, education, child care expansion and electricity cost relief
programs.
The government has a strong track record in meeting its fiscal targets, and is building on the
success of recent initiatives to support the Province’s fiscal objectives. The government will
expand the review of current programs to identify opportunities for modernization and to ensure
that expense growth is managed within the plan laid out in this Budget (see Chapter VI, Section A:
Transforming Government for Sustainability and Fairness).
TABLE 6.12 Summary of Medium‐Term Expense Outlook
($ Billions)
Actual
2015–16
Interim
2016–17
Plan
2017–18
Outlook
Average Annual Growth
2015–16
to 2019–20 2018–19 2019–20
Programs
Health Sector 51.0 52.2 53.8 56.3 58.1 3.3%
Education Sector1 25.0 25.7 26.5 27.4 28.0 2.8%
Postsecondary and Training Sector 7.7 7.8 8.4 8.3 8.4 2.5%
Children’s and Social Services Sector 15.6 16.2 16.9 17.2 17.4 2.7%
Justice Sector 4.5 4.6 4.7 4.7 4.8 1.2%
Other Programs 17.1 17.0 19.2 18.4 19.2 2.9%
Total Programs 120.9 123.5 129.5 132.3 135.8 2.9%
Interest on Debt 11.0 11.3 11.6 12.0 12.6 3.6%
Total Expense 131.9 134.8 141.1 144.3 148.4 3.0% 1 Excludes Teachers’ Pension Plan. Teachers’ Pension Plan expense is included in Other Programs. Note: Numbers may not add due to rounding.

236 Chapter VI: Responsible Fiscal Management
Highlights of the program expense outlook over the medium term include the following:
Health sector expense is projected to grow on average by 3.3 per cent per year between
2015–16 and 2019–20 as a result of targeted funding for hospital services, reduced wait
times, new children and youth pharmacare, investments to increase access to primary care,
home care and community care, and increased supports for people requiring mental health
and addictions services.
Education sector expense is projected to grow on average by 2.8 per cent per year between
2015–16 and 2019–20, mainly due to increased funding to school boards to support
enrolment growth and new investments in child care.
Postsecondary and training sector expense is projected to grow on average by 2.5 per cent
per year between 2015–16 and 2019–20, mainly due to investments in the Highly Skilled
Workforce initiatives and postsecondary infrastructure investments.
Children’s and social services sector expense is projected to grow on average by
2.7 per cent per year between 2015–16 and 2019–20, primarily reflecting investments in
social assistance and developmental services, as well as funding to support transformation
of autism and child welfare services.
Justice sector expense is projected to grow on average by 1.2 per cent per year between
2015–16 and 2019–20, mainly due to reforms to the corrections system, the continuing
upload of court security costs from municipalities, the expansion of access to legal aid for
low‐income Ontarians, appointing more judges, initiatives to support more timely resolution
of cases, and planned capital investments.
Other programs expense is projected to grow on average by 2.9 per cent per year between
2015–16 and 2019–20, mainly due to electricity cost relief programs under the Fair Hydro
Plan, initiatives under the Climate Change Action Plan, and investments in transit and
transportation.
The total expense outlook includes interest on debt expense, which is projected to increase
on average by 3.6 per cent per year between 2015–16 and 2019–20. This increase is mainly due
to borrowing for investment in capital assets.
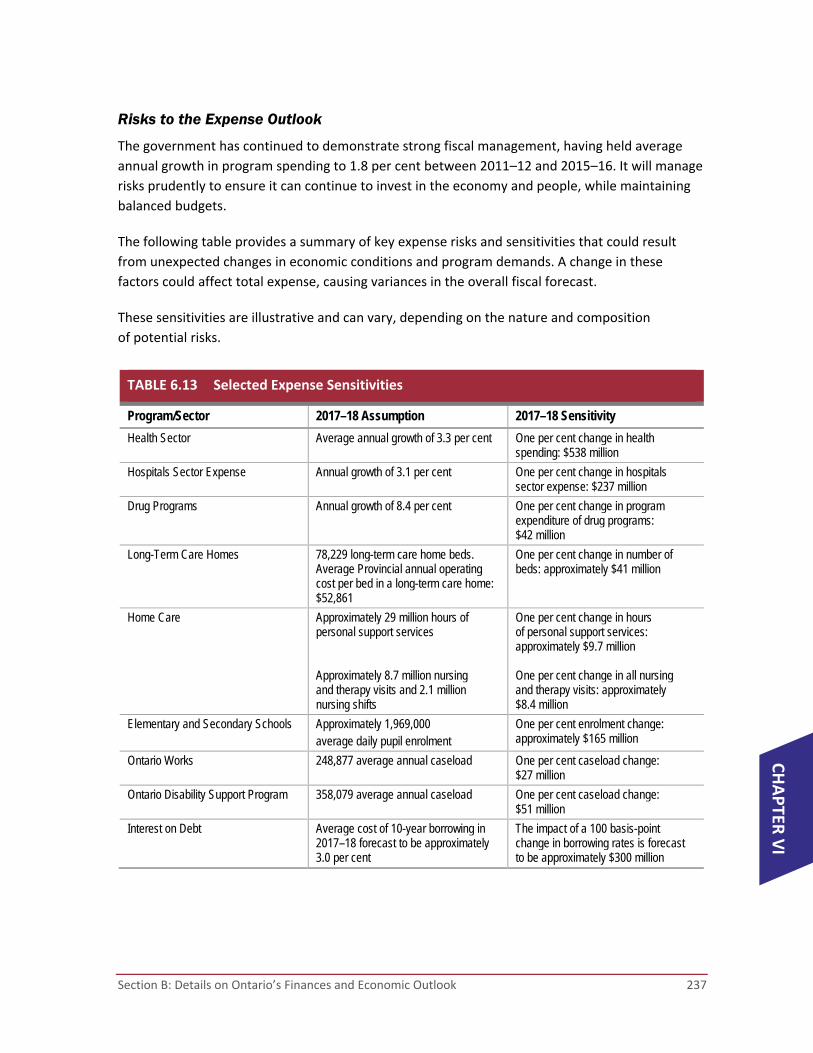
Section B: Details on Ontario’s Finances and Economic Outlook 237
CHAPTER
VI
Risks to the Expense Outlook
The government has continued to demonstrate strong fiscal management, having held average
annual growth in program spending to 1.8 per cent between 2011–12 and 2015–16. It will manage
risks prudently to ensure it can continue to invest in the economy and people, while maintaining
balanced budgets.
The following table provides a summary of key expense risks and sensitivities that could result
from unexpected changes in economic conditions and program demands. A change in these
factors could affect total expense, causing variances in the overall fiscal forecast.
These sensitivities are illustrative and can vary, depending on the nature and composition
of potential risks.
TABLE 6.13 Selected Expense Sensitivities
Program/Sector 2017–18 Assumption 2017–18 Sensitivity
Health Sector Average annual growth of 3.3 per cent One per cent change in health spending: $538 million
Hospitals Sector Expense Annual growth of 3.1 per cent One per cent change in hospitals sector expense: $237 million
Drug Programs Annual growth of 8.4 per cent One per cent change in program expenditure of drug programs: $42 million
Long-Term Care Homes 78,229 long-term care home beds. Average Provincial annual operating cost per bed in a long-term care home: $52,861
One per cent change in number of beds: approximately $41 million
Home Care Approximately 29 million hours of personal support services Approximately 8.7 million nursing and therapy visits and 2.1 million nursing shifts
One per cent change in hours of personal support services: approximately $9.7 million One per cent change in all nursing and therapy visits: approximately $8.4 million
Elementary and Secondary Schools Approximately 1,969,000 average daily pupil enrolment
One per cent enrolment change: approximately $165 million
Ontario Works 248,877 average annual caseload One per cent caseload change: $27 million
Ontario Disability Support Program 358,079 average annual caseload One per cent caseload change: $51 million
Interest on Debt Average cost of 10-year borrowing in 2017–18 forecast to be approximately 3.0 per cent
The impact of a 100 basis-point change in borrowing rates is forecast to be approximately $300 million
238 Chapter VI: Responsible Fiscal Management
Contingent Liabilities
In addition to the key demand sensitivities and economic risks to the fiscal plan, there are risks
stemming from the government’s contingent liabilities. Whether these contingencies will result in
actual liabilities for the Province is beyond the direct control of the government. Losses could
result from legal settlements, defaults on projects, and loan and funding guarantees. Provisions for
losses that are likely to occur and can be reasonably estimated are expensed and reported
as liabilities in the Province’s financial statements. Any significant contingent liabilities related to
the 2016–17 fiscal year will be disclosed as part of the 2016–2017 Annual Report and
Consolidated Financial Statements, expected to be released in the summer.
Fiscal Prudence
As required by the Fiscal Transparency and Accountability Act, 2004 (FTAA), Ontario’s fiscal plan
incorporates prudence in the form of a reserve to protect the fiscal outlook against unforeseen
adverse changes in the Province’s revenue and expense. The reserve has been set at $0.6 billion
in 2017–18, $0.6 billion in 2018–19, and $0.9 billion in 2019–20.
The fiscal plan also includes contingency funds (both operating and capital) to help mitigate
expense risks — particularly in cases where health and safety may be compromised or services
to the most vulnerable are jeopardized — that may otherwise adversely affect Ontario’s fiscal
performance.
In keeping with sound fiscal practices, the Province’s revenue outlook is based on prudent
economic assumptions, as discussed later in this section.

Section B: Details on Ontario’s Finances and Economic Outlook 239
CHAPTER
VI
Details of Ontario’s Finances The following tables and charts provide information on the Province’s historical financial performance, key fiscal indicators, and fiscal plan and outlook.
TABLE 6.14 Revenue ($ Millions)
2014–15 Actual
2015–16 Interim
2016–17 Plan
2017–18 Taxation Revenue Personal Income Tax 29,313 31,141 32,884 35,032 Sales Tax1 21,689 23,455 24,690 26,011 Corporations Tax 9,557 11,428 13,346 13,817 Education Property Tax2 5,561 5,839 5,900 6,002 Employer Health Tax 5,415 5,649 5,882 6,117 Ontario Health Premium 3,366 3,453 3,664 3,789 Gasoline Tax 2,447 2,459 2,602 2,663 Land Transfer Tax 1,778 2,118 2,688 3,139 Tobacco Tax 1,163 1,226 1,247 1,291 Fuel Tax 739 751 736 746 Beer and Wine Tax 560 582 594 619 Electricity Payments in Lieu of Taxes 180 3,247 373 405 Other Taxes 507 470 457 466
82,275 91,818 95,063 100,097 Government of Canada Canada Health Transfer 12,408 13,089 13,910 14,340 Canada Social Transfer 4,847 4,984 5,146 5,307 Equalization 1,988 2,363 2,304 1,424 Infrastructure Programs 137 146 837 2,328 Labour Market Programs 896 927 974 977 Social Housing 465 455 434 412 Other Federal Payments 874 893 790 893
21,615 22,857 24,395 25,681 Government Business Enterprises Ontario Lottery and Gaming Corporation 1,995 2,234 2,134 2,134 Liquor Control Board of Ontario 1,831 1,956 2,321 2,137 Ontario Power Generation Inc./Hydro One Ltd./ Brampton Distribution Holdco Inc. 1,789 719 842 617
5,615 4,909 5,297 4,888 Other Non-Tax Revenue Reimbursements 985 991 979 984 Vehicle and Driver Registration Fees 1,433 1,565 1,721 1,934 Electricity Debt Retirement Charge 956 859 625 623 Power Supply Contract Recoveries 950 875 739 292 Sales and Rentals 2,336 2,102 1,980 3,006 Carbon Allowance Proceeds – – – 1,778 Other Fees and Licences 693 964 1,007 984 Net Reduction of Power Purchase Contract Liability 217 172 129 74 Royalties 275 274 278 265 Miscellaneous Other Non-Tax Revenue 1,196 991 1,015 1,044
9,041 8,793 8,473 10,984
Total Revenue 118,546 128,377 133,228 141,650 1 Sales Tax revenue is net of the Ontario Sales Tax Credit and the energy component of the Ontario Energy and Property Tax Credit. 2 Education Property Tax revenue is net of the Ontario Senior Homeowners’ Property Tax Grant and the property tax component of the Ontario
Energy and Property Tax Credit. Note: Numbers may not add due to rounding.
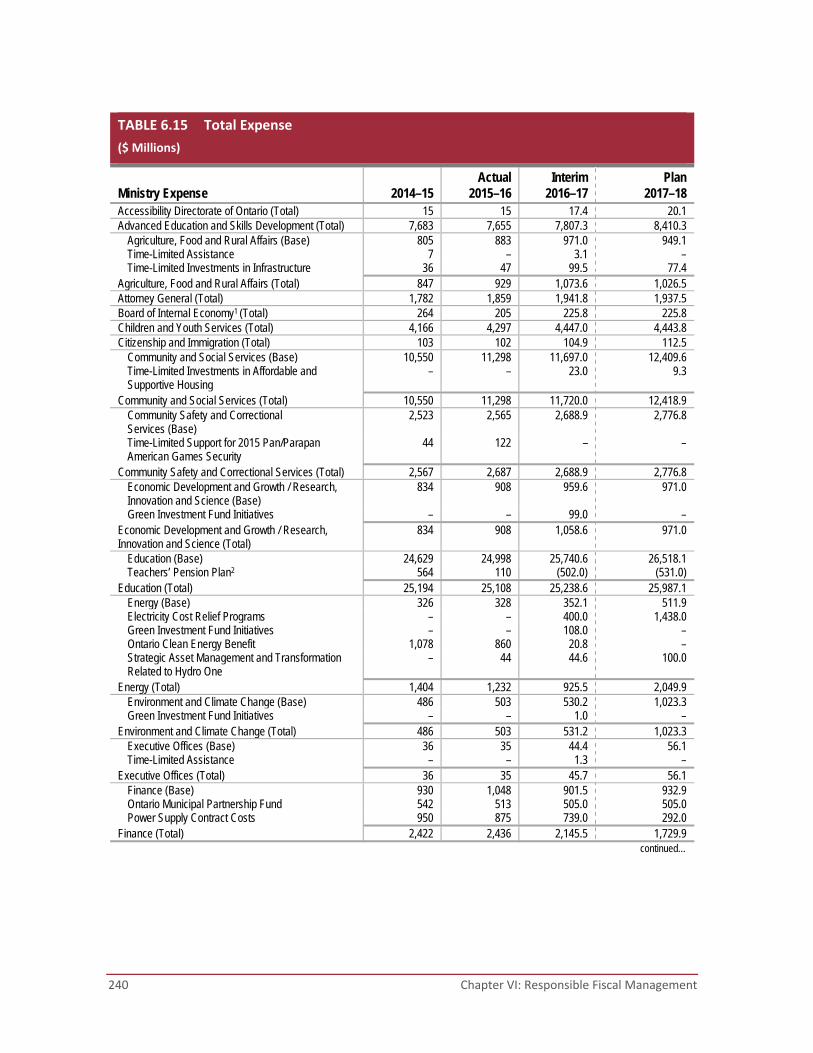
240 Chapter VI: Responsible Fiscal Management
TABLE 6.15 Total Expense
($ Millions)
Ministry Expense 2014–15 Actual
2015–16 Interim
2016–17 Plan
2017–18 Accessibility Directorate of Ontario (Total) 15 15 17.4 20.1 Advanced Education and Skills Development (Total) 7,683 7,655 7,807.3 8,410.3 Agriculture, Food and Rural Affairs (Base) 805 883 971.0 949.1 Time-Limited Assistance 7 – 3.1 – Time-Limited Investments in Infrastructure 36 47 99.5 77.4 Agriculture, Food and Rural Affairs (Total) 847 929 1,073.6 1,026.5 Attorney General (Total) 1,782 1,859 1,941.8 1,937.5 Board of Internal Economy1 (Total) 264 205 225.8 225.8 Children and Youth Services (Total) 4,166 4,297 4,447.0 4,443.8 Citizenship and Immigration (Total) 103 102 104.9 112.5 Community and Social Services (Base) 10,550 11,298 11,697.0 12,409.6 Time-Limited Investments in Affordable and
Supportive Housing – – 23.0 9.3
Community and Social Services (Total) 10,550 11,298 11,720.0 12,418.9 Community Safety and Correctional
Services (Base) 2,523 2,565 2,688.9 2,776.8
Time-Limited Support for 2015 Pan/Parapan American Games Security
44 122 – –
Community Safety and Correctional Services (Total) 2,567 2,687 2,688.9 2,776.8 Economic Development and Growth / Research,
Innovation and Science (Base) 834 908 959.6 971.0
Green Investment Fund Initiatives – – 99.0 – Economic Development and Growth / Research, Innovation and Science (Total)
834 908 1,058.6 971.0
Education (Base) 24,629 24,998 25,740.6 26,518.1 Teachers’ Pension Plan2 564 110 (502.0) (531.0) Education (Total) 25,194 25,108 25,238.6 25,987.1 Energy (Base) 326 328 352.1 511.9 Electricity Cost Relief Programs – – 400.0 1,438.0 Green Investment Fund Initiatives – – 108.0 – Ontario Clean Energy Benefit 1,078 860 20.8 – Strategic Asset Management and Transformation
Related to Hydro One – 44 44.6 100.0
Energy (Total) 1,404 1,232 925.5 2,049.9 Environment and Climate Change (Base) 486 503 530.2 1,023.3 Green Investment Fund Initiatives – – 1.0 – Environment and Climate Change (Total) 486 503 531.2 1,023.3 Executive Offices (Base) 36 35 44.4 56.1 Time-Limited Assistance – – 1.3 – Executive Offices (Total) 36 35 45.7 56.1 Finance (Base) 930 1,048 901.5 932.9 Ontario Municipal Partnership Fund 542 513 505.0 505.0 Power Supply Contract Costs 950 875 739.0 292.0 Finance (Total) 2,422 2,436 2,145.5 1,729.9 continued…
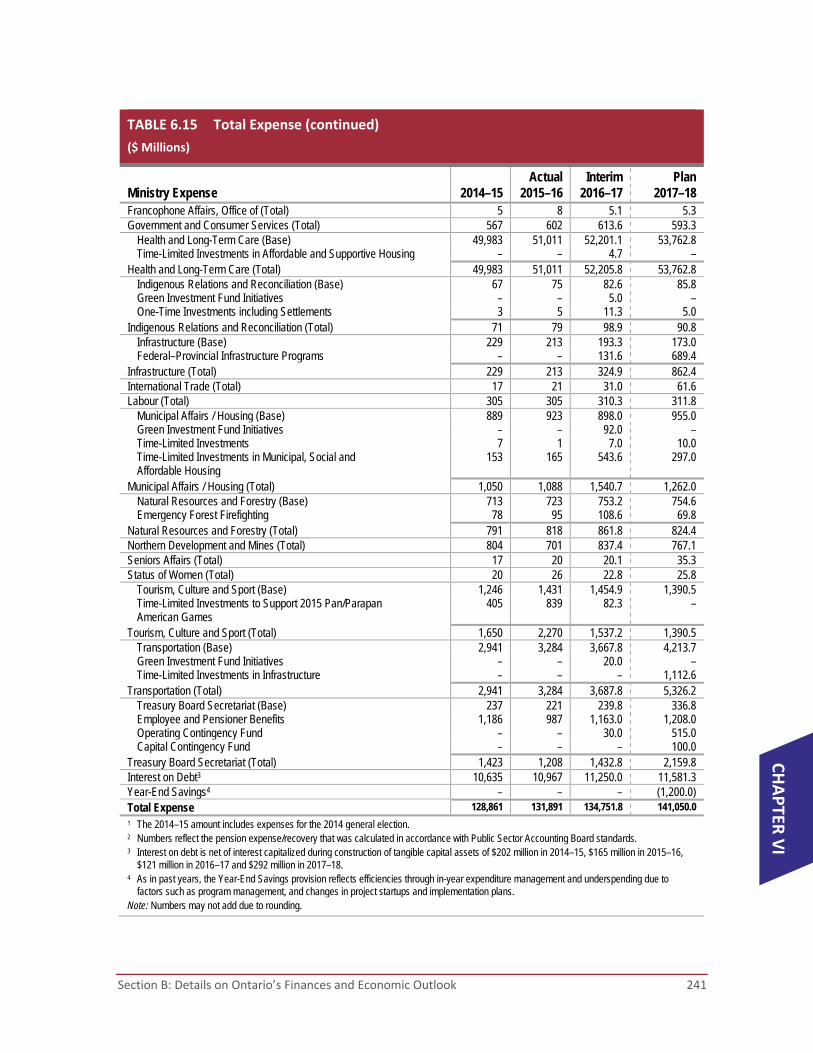
Section B: Details on Ontario’s Finances and Economic Outlook 241
CHAPTER
VI
TABLE 6.15 Total Expense (continued)
($ Millions)
Ministry Expense 2014–15 Actual
2015–16 Interim
2016–17 Plan
2017–18 Francophone Affairs, Office of (Total) 5 8 5.1 5.3 Government and Consumer Services (Total) 567 602 613.6 593.3 Health and Long-Term Care (Base) 49,983 51,011 52,201.1 53,762.8 Time-Limited Investments in Affordable and Supportive Housing – – 4.7 – Health and Long-Term Care (Total) 49,983 51,011 52,205.8 53,762.8 Indigenous Relations and Reconciliation (Base) 67 75 82.6 85.8 Green Investment Fund Initiatives – – 5.0 – One-Time Investments including Settlements 3 5 11.3 5.0 Indigenous Relations and Reconciliation (Total) 71 79 98.9 90.8 Infrastructure (Base) 229 213 193.3 173.0 Federal–Provincial Infrastructure Programs – – 131.6 689.4 Infrastructure (Total) 229 213 324.9 862.4 International Trade (Total) 17 21 31.0 61.6 Labour (Total) 305 305 310.3 311.8 Municipal Affairs / Housing (Base) 889 923 898.0 955.0 Green Investment Fund Initiatives – – 92.0 – Time-Limited Investments 7 1 7.0 10.0 Time-Limited Investments in Municipal, Social and
Affordable Housing 153 165 543.6 297.0
Municipal Affairs / Housing (Total) 1,050 1,088 1,540.7 1,262.0 Natural Resources and Forestry (Base) 713 723 753.2 754.6 Emergency Forest Firefighting 78 95 108.6 69.8 Natural Resources and Forestry (Total) 791 818 861.8 824.4 Northern Development and Mines (Total) 804 701 837.4 767.1 Seniors Affairs (Total) 17 20 20.1 35.3 Status of Women (Total) 20 26 22.8 25.8 Tourism, Culture and Sport (Base) 1,246 1,431 1,454.9 1,390.5 Time-Limited Investments to Support 2015 Pan/Parapan
American Games 405 839 82.3 –
Tourism, Culture and Sport (Total) 1,650 2,270 1,537.2 1,390.5 Transportation (Base) 2,941 3,284 3,667.8 4,213.7 Green Investment Fund Initiatives – – 20.0 – Time-Limited Investments in Infrastructure – – – 1,112.6 Transportation (Total) 2,941 3,284 3,687.8 5,326.2 Treasury Board Secretariat (Base) 237 221 239.8 336.8 Employee and Pensioner Benefits 1,186 987 1,163.0 1,208.0 Operating Contingency Fund – – 30.0 515.0 Capital Contingency Fund – – – 100.0 Treasury Board Secretariat (Total) 1,423 1,208 1,432.8 2,159.8 Interest on Debt3 10,635 10,967 11,250.0 11,581.3 Year-End Savings4 – – – (1,200.0) Total Expense 128,861 131,891 134,751.8 141,050.0 1 The 2014–15 amount includes expenses for the 2014 general election. 2 Numbers reflect the pension expense/recovery that was calculated in accordance with Public Sector Accounting Board standards. 3 Interest on debt is net of interest capitalized during construction of tangible capital assets of $202 million in 2014–15, $165 million in 2015–16,
$121 million in 2016–17 and $292 million in 2017–18. 4 As in past years, the Year-End Savings provision reflects efficiencies through in-year expenditure management and underspending due to
factors such as program management, and changes in project startups and implementation plans. Note: Numbers may not add due to rounding.
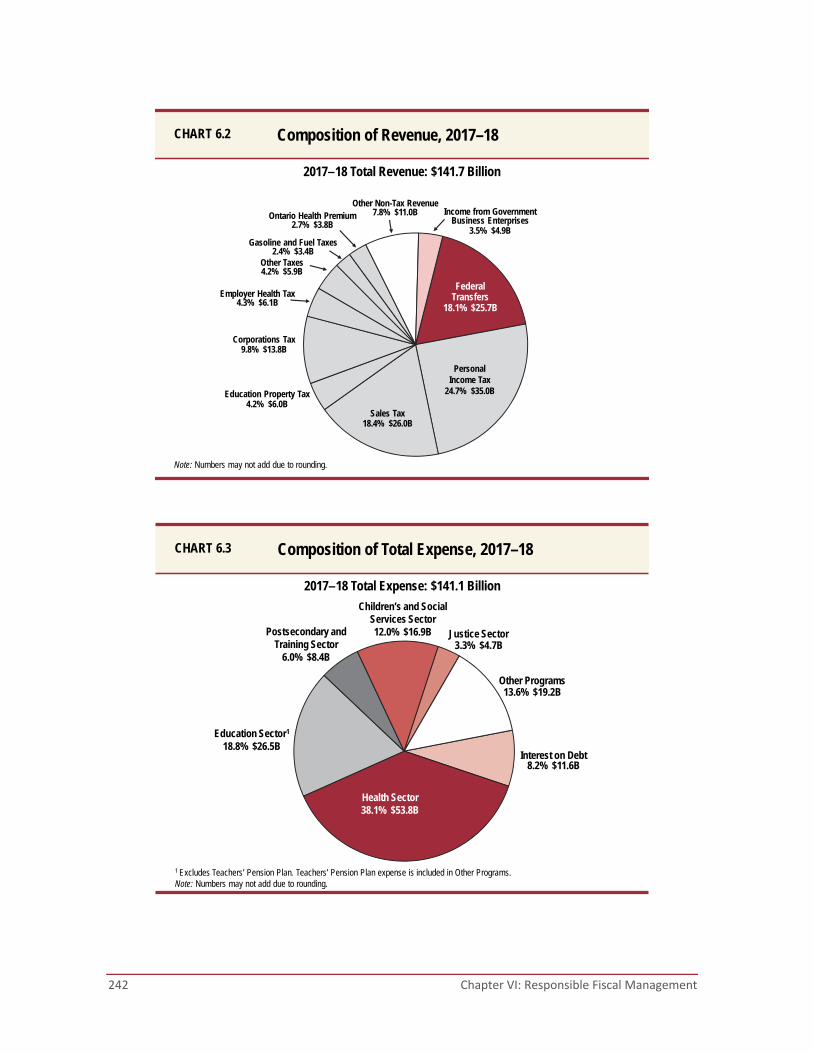
242 Chapter VI: Responsible Fiscal Management
Composition of Revenue, 2017–18CHART 6.2
Note: Numbers may not add due to rounding.
Education Property Tax4.2% $6.0B
Personal Income Tax
24.7% $35.0B
Employer Health Tax4.3% $6.1B
Corporations Tax9.8% $13.8B
Gasoline and Fuel Taxes2.4% $3.4B
Other Taxes4.2% $5.9B
Other Non-Tax Revenue7.8% $11.0B Income from Government
Business Enterprises3.5% $4.9B
Ontario Health Premium2.7% $3.8B
Sales Tax18.4% $26.0B
Federal Transfers
18.1% $25.7B
2017–18 Total Revenue: $141.7 Billion
Composition of Total Expense, 2017–18CHART 6.3
1 Excludes Teachers’ Pension Plan. Teachers’ Pension Plan expense is included in Other Programs.Note: Numbers may not add due to rounding.
Postsecondary and Training Sector
6.0% $8.4B
Interest on Debt8.2% $11.6B
Justice Sector3.3% $4.7B
Children’s and Social Services Sector12.0% $16.9B
Other Programs13.6% $19.2B
Education Sector1
18.8% $26.5B
Health Sector38.1% $53.8B
2017–18 Total Expense: $141.1 Billion
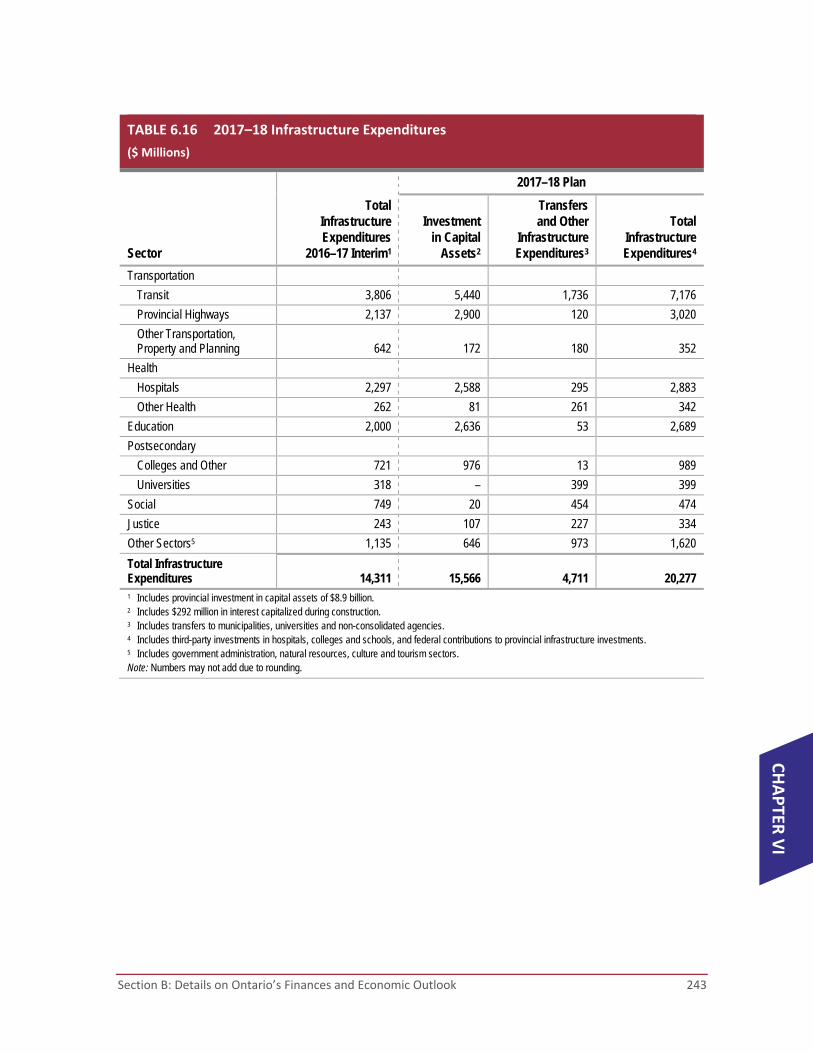
Section B: Details on Ontario’s Finances and Economic Outlook 243
CHAPTER
VI
TABLE 6.16 2017–18 Infrastructure Expenditures
($ Millions)
Sector
Total Infrastructure Expenditures
2016–17 Interim1
2017–18 Plan
Investment in Capital
Assets2
Transfers and Other
Infrastructure Expenditures3
Total Infrastructure Expenditures4
Transportation
Transit 3,806 5,440 1,736 7,176
Provincial Highways 2,137 2,900 120 3,020
Other Transportation, Property and Planning 642 172 180 352
Health
Hospitals 2,297 2,588 295 2,883
Other Health 262 81 261 342
Education 2,000 2,636 53 2,689
Postsecondary
Colleges and Other 721 976 13 989
Universities 318 – 399 399
Social 749 20 454 474
Justice 243 107 227 334
Other Sectors5 1,135 646 973 1,620
Total Infrastructure Expenditures 14,311 15,566 4,711 20,277 1 Includes provincial investment in capital assets of $8.9 billion. 2 Includes $292 million in interest capitalized during construction. 3 Includes transfers to municipalities, universities and non-consolidated agencies. 4 Includes third-party investments in hospitals, colleges and schools, and federal contributions to provincial infrastructure investments. 5 Includes government administration, natural resources, culture and tourism sectors. Note: Numbers may not add due to rounding.

244 Chapter VI: Responsible Fiscal Management
TABLE 6.17 Ten‐Year Review of Selected Financial and Economic Statistics1
($ Millions)
2008–09 2009–102 2010–11
Revenue 97,532 96,313 107,175
Expense
Programs 95,375 106,856 111,706
Interest on Debt3 8,566 8,719 9,480
Total Expense 103,941 115,575 121,186
Reserve – – –
Surplus/(Deficit) (6,409) (19,262) (14,011)
Net Debt4 169,585 193,589 214,511
Accumulated Deficit 113,238 130,957 144,573
Gross Domestic Product (GDP) at Market Prices 608,446 597,882 630,989
Primary Household Income 414,724 412,847 424,251
Population — July (000s) 12,883 12,998 13,135
Net Debt per Capita (dollars) 13,164 14,894 16,331
Household Income per Capita (dollars) 32,193 31,763 32,299
Interest on Debt as a Per Cent of Revenue 8.8 9.1 8.8
Net Debt as a Per Cent of GDP 27.9 32.4 34.0
Accumulated Deficit as a Per Cent of GDP 18.6 21.9 22.9 1 Revenue and expense have been restated to reflect a fiscally neutral accounting change for the revised presentation of education property
taxes, as described in the 2010 Ontario Budget; a fiscally neutral accounting change related to the reclassification of government agencies and organizations, as described in the 2011 Ontario Economic Outlook and Fiscal Review; and a fiscally neutral reclassification of a number of tax measures that are transfers or grants, as described in the 2012 Ontario Budget.
2 Starting in 2009–10, investments in minor tangible capital assets owned by the Province were capitalized and amortized to expense. All capital assets owned by consolidated organizations are being accounted for in a similar manner.
3 Interest on debt is net of interest capitalized during construction of tangible capital assets of $134 million in 2013–14, $202 million in 2014–15, $165 million in 2015–16, $121 million in 2016–17, and $292 million in 2017–18.
4 Starting in 2009–10, Net Debt includes the net debt of hospitals, school boards and colleges, consistent with Public Sector Accounting Board standards. For comparative purposes, Net Debt has been restated in 2008–09 to conform with this revised presentation.
5 The 2015–16 actuals have been restated to reflect recognizing jointly sponsored net pension assets for the Ontario Public Service Employees’ Union Pension Plan and the Ontario Teachers’ Pension Plan on the Province’s financial statements, consistent with the 2016 Budget and as described in the 2016–17 Third Quarter Finances.
Note: Numbers may not add due to rounding. Sources: Statistics Canada and Ontario Ministry of Finance.

Section B: Details on Ontario’s Finances and Economic Outlook 245
CHAPTER
VI
2011–12 2012–13 2013–14 2014–15 Actual
2015–165 Interim
2016–17 Plan
2017–18
109,773 113,369 115,911 118,546 128,377 133,228 141,650
112,660 112,248 115,792 118,225 120,925 123,502 129,469
10,082 10,341 10,572 10,635 10,967 11,250 11,581
122,742 122,589 126,364 128,861 131,891 134,752 141,050
– – – – – – 600
(12,969) (9,220) (10,453) (10,314) (3,514) (1,524) 0
235,582 252,088 267,190 284,576 294,564 301,916 311,921
158,410 167,132 176,634 187,511 192,028 193,544 193,544
659,743 680,084 695,349 727,962 763,276 798,218 832,652
444,076 459,111 472,921 490,023 511,781 532,941 553,587
13,264 13,414 13,556 13,685 13,797 13,983 14,130
17,762 18,793 19,710 20,795 21,350 21,592 22,075
33,481 34,226 34,886 35,807 37,094 38,114 39,177
9.2 9.1 9.1 9.0 8.5 8.4 8.2
35.7 37.1 38.4 39.1 38.6 37.8 37.5
24.0 24.6 25.4 25.8 25.2 24.2 23.2

246 Chapter VI: Responsible Fiscal Management
Economic Outlook Details The Ministry of Finance is forecasting 2.0 per cent average annual growth in Ontario’s real gross
domestic product (GDP) over the 2017–20 period. For prudent fiscal planning, these real GDP
growth projections are slightly below the average of private‐sector forecasts.
TABLE 6.18 Ontario Economic Outlook
(Per Cent)
2014 2015 2016 2017p 2018p 2019p 2020p
Real GDP Growth 2.7 2.5 2.7 2.3 2.1 2.0 1.7
Nominal GDP Growth 4.7 4.9 4.6 4.3 4.1 4.2 3.9
Employment Growth 0.8 0.7 1.1 1.3 1.2 1.1 0.9
CPI Inflation 2.4 1.2 1.8 2.0 2.0 2.0 2.0
p = Ontario Ministry of Finance planning projection. Sources: Statistics Canada and Ontario Ministry of Finance.
Ontario’s economy continues to perform well. A balanced and growing economy in the United
States, low oil prices and a competitive Canadian dollar provide a solid foundation for future
economic growth in Ontario. Rising interest rates and elevated household debt loads pose
downside risks. Heightened global uncertainty and rising global protectionist sentiments could
potentially weigh down future business, consumer and investor confidence.
Exports and business investment are expected to be key drivers of Ontario’s economic growth
over the forecast period. Improving global growth prospects, technological innovation and a
competitive and dynamic economic environment will help drive business investment. In turn,
business investment will continue to be supported by Ontario’s competitive business tax
environment and strategic government actions, such as:
Infrastructure investments under Moving Ontario Forward; and
The government’s five‐year Business Growth Initiative.
See Chapter III: Creating Opportunities and Security for a full discussion of government actions
to support business investment.
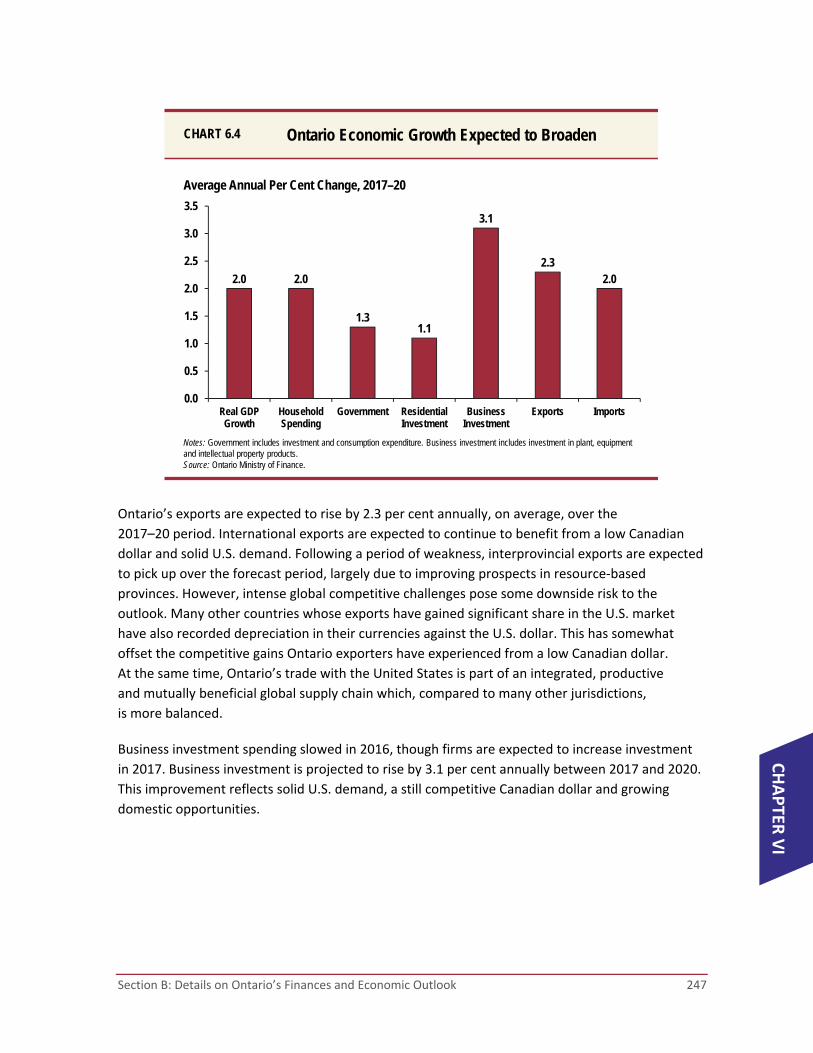
Section B: Details on Ontario’s Finances and Economic Outlook 247
CHAPTER
VI
Ontario’s exports are expected to rise by 2.3 per cent annually, on average, over the
2017–20 period. International exports are expected to continue to benefit from a low Canadian
dollar and solid U.S. demand. Following a period of weakness, interprovincial exports are expected
to pick up over the forecast period, largely due to improving prospects in resource‐based
provinces. However, intense global competitive challenges pose some downside risk to the
outlook. Many other countries whose exports have gained significant share in the U.S. market
have also recorded depreciation in their currencies against the U.S. dollar. This has somewhat
offset the competitive gains Ontario exporters have experienced from a low Canadian dollar.
At the same time, Ontario’s trade with the United States is part of an integrated, productive
and mutually beneficial global supply chain which, compared to many other jurisdictions,
is more balanced.
Business investment spending slowed in 2016, though firms are expected to increase investment
in 2017. Business investment is projected to rise by 3.1 per cent annually between 2017 and 2020.
This improvement reflects solid U.S. demand, a still competitive Canadian dollar and growing
domestic opportunities.
Notes: Government includes investment and consumption expenditure. Business investment includes investment in plant, equipment and intellectual property products.Source: Ontario Ministry of Finance.
2.0 2.0
1.31.1
3.1
2.32.0
0.0
0.5
1.0
1.5
2.0
2.5
3.0
3.5
Real GDPGrowth
HouseholdSpending
Government ResidentialInvestment
BusinessInvestment
Exports Imports
Average Annual Per Cent Change, 2017–20
Ontario Economic Growth Expected to BroadenCHART 6.4
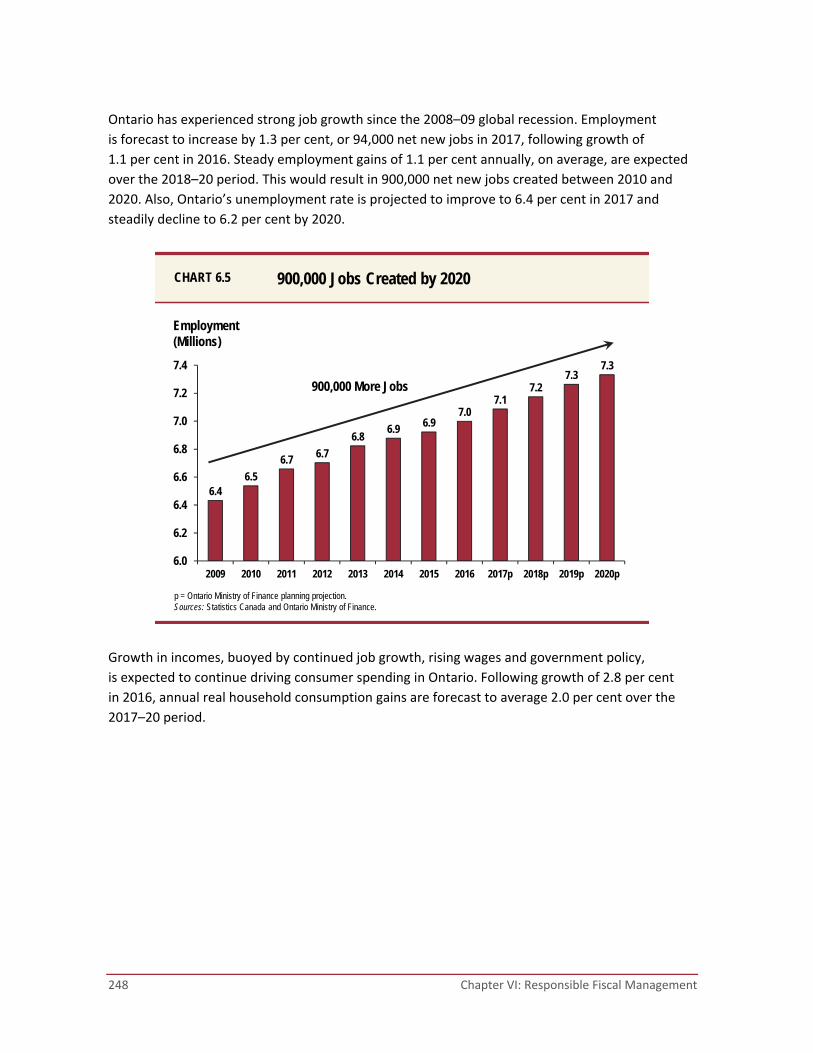
248 Chapter VI: Responsible Fiscal Management
Ontario has experienced strong job growth since the 2008–09 global recession. Employment
is forecast to increase by 1.3 per cent, or 94,000 net new jobs in 2017, following growth of
1.1 per cent in 2016. Steady employment gains of 1.1 per cent annually, on average, are expected
over the 2018–20 period. This would result in 900,000 net new jobs created between 2010 and
2020. Also, Ontario’s unemployment rate is projected to improve to 6.4 per cent in 2017 and
steadily decline to 6.2 per cent by 2020.
Growth in incomes, buoyed by continued job growth, rising wages and government policy,
is expected to continue driving consumer spending in Ontario. Following growth of 2.8 per cent
in 2016, annual real household consumption gains are forecast to average 2.0 per cent over the
2017–20 period.
p = Ontario Ministry of Finance planning projection.Sources: Statistics Canada and Ontario Ministry of Finance.
6.46.5
6.7 6.7
6.86.9 6.9
7.07.1
7.27.3
7.3
6.0
6.2
6.4
6.6
6.8
7.0
7.2
7.4
2009 2010 2011 2012 2013 2014 2015 2016 2017p 2018p 2019p 2020p
Employment(Millions)
900,000 Jobs Created by 2020CHART 6.5
900,000 More Jobs

Section B: Details on Ontario’s Finances and Economic Outlook 249
CHAPTER
VI
The Ontario housing market advanced in 2016, with both resale activity and housing starts
exceeding expectations. Home price appreciation is forecast to moderate as rising interest rates,
historically high valuations and mortgage debt temper healthy demographic‐related demand,
as well as recently introduced policy measures by the Ontario government.
p = projection.Source: Canada Mortgage and Housing Corporation and Ontario Ministry of Finance.
30
35
40
45
50
55
60
65
70
75
80
2012 2013 2014 2015 2016 2017p 2018p 2019p 2020p
Housing Starts Household Formations
(Thousands)
Demographic Fundamentals to Support Housing Starts over the Medium Term
CHART 6.6

250 Chapter VI: Responsible Fiscal Management
External Economic Environment The external environment remains supportive of Ontario’s economic growth, with a competitive
Canadian dollar, low oil prices and stronger U.S. and Canadian growth. Forecasts for key external
factors are summarized in the table below. These are used as the basis for the Ministry of
Finance’s forecast for Ontario’s economic growth.
TABLE 6.19 Outlook for External Factors
2014 2015 2016 2017p 2018p 2019p 2020p
World Real GDP Growth (Per Cent)
3.4 3.2 3.1e 3.4 3.6 3.7 3.7
U.S. Real GDP Growth (Per Cent)
2.4 2.6 1.6 2.3 2.4 2.1 2.0
Canada Real GDP Growth (Per Cent)
2.6 0.9 1.4 2.1 2.0 1.9 1.7
West Texas Intermediate Crude Oil ($US/bbl.)
93 49 43 54 59 62 64
Canadian Dollar (Cents US) 90.5 78.2 75.4 74.5 75.5 78.5 80.0
Three-Month Treasury Bill Rate1
(Per Cent) 0.9 0.5 0.5 0.5 0.8 1.5 1.9
10-Year Government Bond Rate1
(Per Cent) 2.2 1.5 1.3 1.9 2.4 3.0 3.2
e = estimate. p = Ontario Ministry of Finance planning projection based on external sources. 1 Government of Canada interest rates. Sources: IMF World Economic Outlook (October 2016 and January 2017), U.S. Bureau of Economic Analysis, Blue Chip Economic Indicators (March 2017), Statistics Canada, U.S. Energy Information Administration, Bank of Canada, Ontario Ministry of Finance Survey of Forecasters (March 2017) and Ontario Ministry of Finance.
Global real GDP is expected to strengthen from 3.1 per cent in 2016 to 3.4 per cent in 2017,
3.6 per cent in 2018 and 3.7 per cent in both 2019 and 2020. Emerging market economies are
forecast to continue to lead global growth, while advanced economies experience more modest
improvements. U.S. and Canadian economic growth are both projected to pick up. U.S. real GDP
is expected to expand by 2.3 per cent in 2017, boosted by fiscal stimulus. Canada’s real GDP is
forecast to increase from 1.4 per cent in 2016 to 2.1 per cent in 2017, supported by household and
government spending and firming oil prices. In many other advanced economies, including Japan
and Euro member states, growth projections remain modest for 2017 and 2018.

Section B: Details on Ontario’s Finances and Economic Outlook 251
CHAPTER
VI
Oil prices, interest rates and the Canadian dollar are projected to rise moderately over the forecast
period. Oil prices rose in late 2016 and early 2017 following the agreement by the Organization of
the Petroleum Exporting Countries (OPEC), as well as some non‐OPEC countries to lower oil
production. Although recently softened, oil prices are expected to rise over the forecast period,
supporting a gradual appreciation of the Canadian dollar. However, the differing path of U.S.
and Canadian monetary policy will limit near‐term gains of the Canadian dollar. The U.S. Federal
Reserve raised interest rates in March 2017 for the third time since the global financial crisis,
while the Bank of Canada has left its interest rates unchanged. The yield on a three‐month
Canadian treasury bill is expected to be 0.5 per cent in 2017, unchanged from 2015 and 2016.
However, Canadian long‐term interest rates rose in late 2016 following U.S. Treasury yields that
reflect an anticipated fiscal policy boost and additional Federal Reserve rate hikes.
Ontario Economic Outlook Details The following table provides details of the Ministry of Finance’s economic outlook for 2017–20,
so Ontarians can be informed about the state of the province’s economy.
To continue delivering high‐quality data and information, Ontario is modernizing its statistics
services. Currently, Ontario is the only province in Canada without an official statistics entity.
The Province is taking steps to develop business model options for transforming data into useful
information for Ontarians, enabling government to draft and implement policies that will grow the
economy and create jobs.
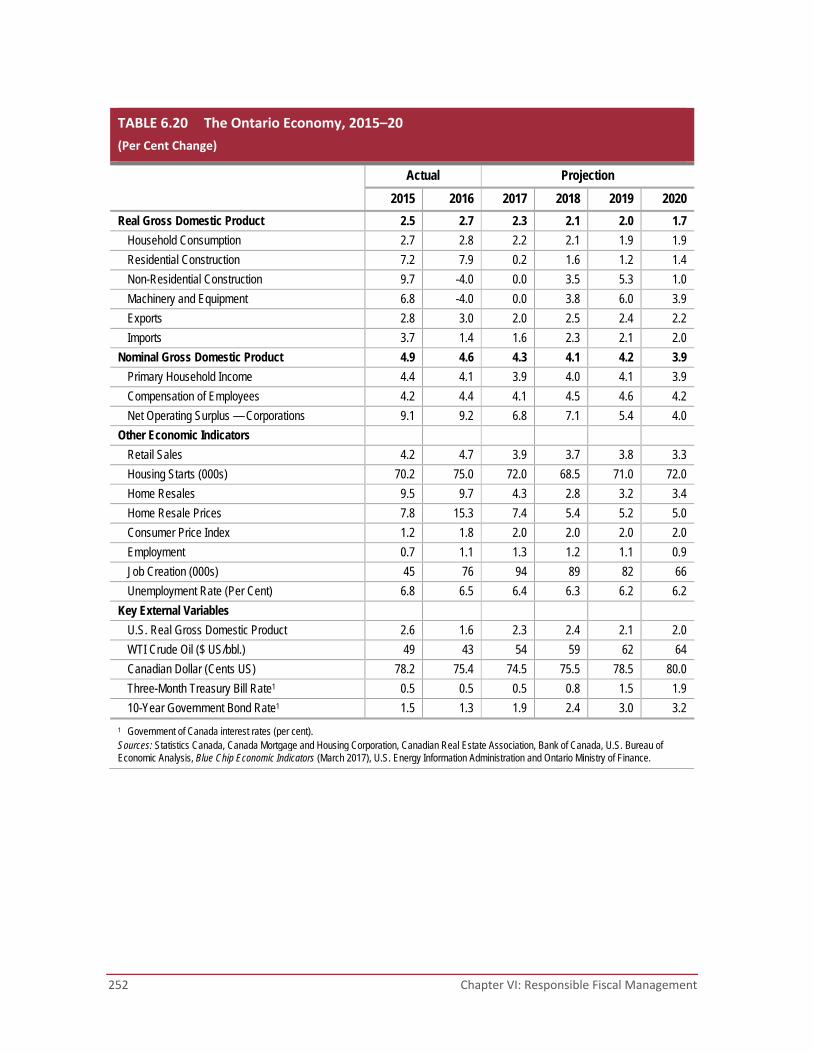
252 Chapter VI: Responsible Fiscal Management
TABLE 6.20 The Ontario Economy, 2015–20
(Per Cent Change)
Actual Projection
2015 2016 2017 2018 2019 2020
Real Gross Domestic Product 2.5 2.7 2.3 2.1 2.0 1.7
Household Consumption 2.7 2.8 2.2 2.1 1.9 1.9
Residential Construction 7.2 7.9 0.2 1.6 1.2 1.4
Non-Residential Construction 9.7 -4.0 0.0 3.5 5.3 1.0
Machinery and Equipment 6.8 -4.0 0.0 3.8 6.0 3.9
Exports 2.8 3.0 2.0 2.5 2.4 2.2
Imports 3.7 1.4 1.6 2.3 2.1 2.0
Nominal Gross Domestic Product 4.9 4.6 4.3 4.1 4.2 3.9
Primary Household Income 4.4 4.1 3.9 4.0 4.1 3.9
Compensation of Employees 4.2 4.4 4.1 4.5 4.6 4.2
Net Operating Surplus — Corporations 9.1 9.2 6.8 7.1 5.4 4.0
Other Economic Indicators
Retail Sales 4.2 4.7 3.9 3.7 3.8 3.3
Housing Starts (000s) 70.2 75.0 72.0 68.5 71.0 72.0
Home Resales 9.5 9.7 4.3 2.8 3.2 3.4
Home Resale Prices 7.8 15.3 7.4 5.4 5.2 5.0
Consumer Price Index 1.2 1.8 2.0 2.0 2.0 2.0
Employment 0.7 1.1 1.3 1.2 1.1 0.9
Job Creation (000s) 45 76 94 89 82 66
Unemployment Rate (Per Cent) 6.8 6.5 6.4 6.3 6.2 6.2
Key External Variables
U.S. Real Gross Domestic Product 2.6 1.6 2.3 2.4 2.1 2.0
WTI Crude Oil ($ US/bbl.) 49 43 54 59 62 64
Canadian Dollar (Cents US) 78.2 75.4 74.5 75.5 78.5 80.0
Three-Month Treasury Bill Rate1 0.5 0.5 0.5 0.8 1.5 1.9
10-Year Government Bond Rate1 1.5 1.3 1.9 2.4 3.0 3.2
1 Government of Canada interest rates (per cent). Sources: Statistics Canada, Canada Mortgage and Housing Corporation, Canadian Real Estate Association, Bank of Canada, U.S. Bureau of Economic Analysis, Blue Chip Economic Indicators (March 2017), U.S. Energy Information Administration and Ontario Ministry of Finance.
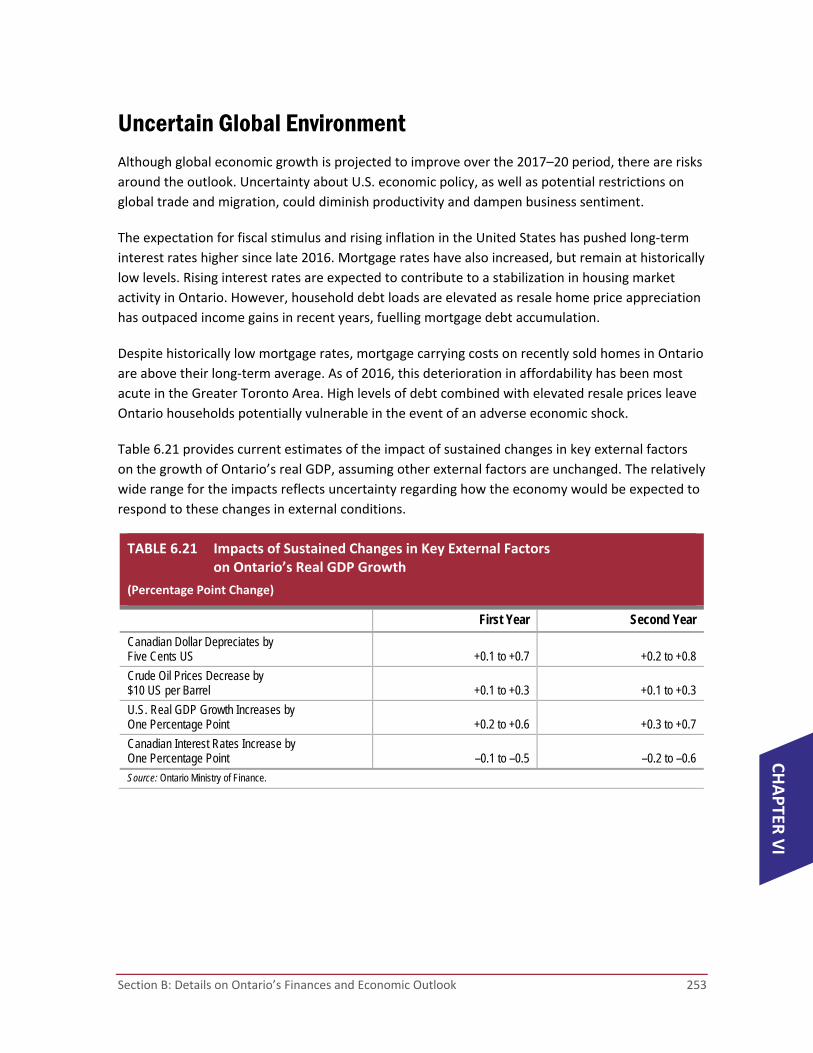
Section B: Details on Ontario’s Finances and Economic Outlook 253
CHAPTER
VI
Uncertain Global Environment Although global economic growth is projected to improve over the 2017–20 period, there are risks
around the outlook. Uncertainty about U.S. economic policy, as well as potential restrictions on
global trade and migration, could diminish productivity and dampen business sentiment.
The expectation for fiscal stimulus and rising inflation in the United States has pushed long‐term
interest rates higher since late 2016. Mortgage rates have also increased, but remain at historically
low levels. Rising interest rates are expected to contribute to a stabilization in housing market
activity in Ontario. However, household debt loads are elevated as resale home price appreciation
has outpaced income gains in recent years, fuelling mortgage debt accumulation.
Despite historically low mortgage rates, mortgage carrying costs on recently sold homes in Ontario
are above their long‐term average. As of 2016, this deterioration in affordability has been most
acute in the Greater Toronto Area. High levels of debt combined with elevated resale prices leave
Ontario households potentially vulnerable in the event of an adverse economic shock.
Table 6.21 provides current estimates of the impact of sustained changes in key external factors
on the growth of Ontario’s real GDP, assuming other external factors are unchanged. The relatively
wide range for the impacts reflects uncertainty regarding how the economy would be expected to
respond to these changes in external conditions.
TABLE 6.21 Impacts of Sustained Changes in Key External Factors on Ontario’s Real GDP Growth
(Percentage Point Change)
First Year Second Year
Canadian Dollar Depreciates by Five Cents US +0.1 to +0.7 +0.2 to +0.8
Crude Oil Prices Decrease by $10 US per Barrel +0.1 to +0.3 +0.1 to +0.3
U.S. Real GDP Growth Increases by One Percentage Point +0.2 to +0.6 +0.3 to +0.7
Canadian Interest Rates Increase by One Percentage Point –0.1 to –0.5 –0.2 to –0.6
Source: Ontario Ministry of Finance.
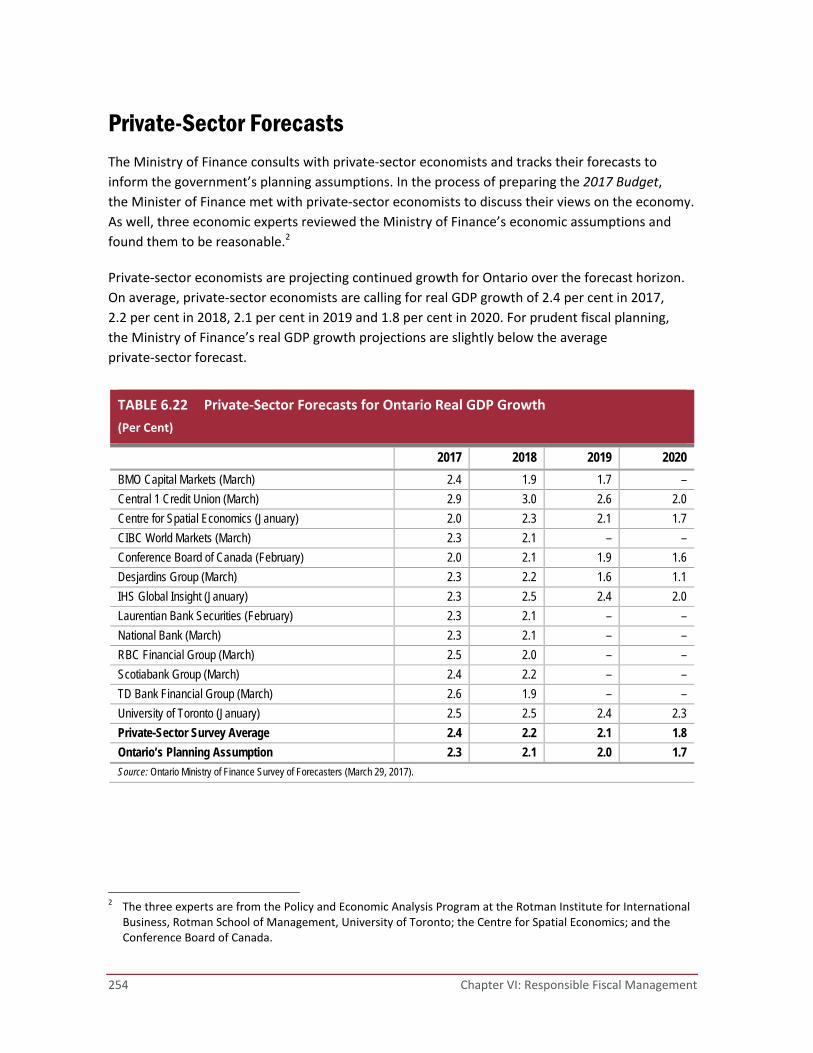
254 Chapter VI: Responsible Fiscal Management
Private-Sector Forecasts The Ministry of Finance consults with private‐sector economists and tracks their forecasts to
inform the government’s planning assumptions. In the process of preparing the 2017 Budget,
the Minister of Finance met with private‐sector economists to discuss their views on the economy.
As well, three economic experts reviewed the Ministry of Finance’s economic assumptions and
found them to be reasonable.2
Private‐sector economists are projecting continued growth for Ontario over the forecast horizon.
On average, private‐sector economists are calling for real GDP growth of 2.4 per cent in 2017,
2.2 per cent in 2018, 2.1 per cent in 2019 and 1.8 per cent in 2020. For prudent fiscal planning,
the Ministry of Finance’s real GDP growth projections are slightly below the average
private‐sector forecast.
TABLE 6.22 Private‐Sector Forecasts for Ontario Real GDP Growth
(Per Cent)
2017 2018 2019 2020
BMO Capital Markets (March) 2.4 1.9 1.7 –
Central 1 Credit Union (March) 2.9 3.0 2.6 2.0
Centre for Spatial Economics (January) 2.0 2.3 2.1 1.7
CIBC World Markets (March) 2.3 2.1 – –
Conference Board of Canada (February) 2.0 2.1 1.9 1.6
Desjardins Group (March) 2.3 2.2 1.6 1.1
IHS Global Insight (January) 2.3 2.5 2.4 2.0
Laurentian Bank Securities (February) 2.3 2.1 – –
National Bank (March) 2.3 2.1 – –
RBC Financial Group (March) 2.5 2.0 – –
Scotiabank Group (March) 2.4 2.2 – –
TD Bank Financial Group (March) 2.6 1.9 – –
University of Toronto (January) 2.5 2.5 2.4 2.3
Private-Sector Survey Average 2.4 2.2 2.1 1.8
Ontario’s Planning Assumption 2.3 2.1 2.0 1.7
Source: Ontario Ministry of Finance Survey of Forecasters (March 29, 2017).
2 The three experts are from the Policy and Economic Analysis Program at the Rotman Institute for International
Business, Rotman School of Management, University of Toronto; the Centre for Spatial Economics; and the Conference Board of Canada.

Section B: Details on Ontario’s Finances and Economic Outlook 255
CHAPTER
VI
Comparison to the 2016 Budget Key changes since the 2016 Budget include:
Higher real GDP growth in 2016, followed by more modest growth in 2017 and 2018;
Higher nominal GDP growth in 2016, but lower growth in 2017 and 2018;
Higher Canadian dollar and lower U.S. real GDP growth in 2016; and
Downward revisions to the Canadian dollar and interest rates over the 2017–19 period.

256 Chapter VI: Responsible Fiscal Management
TABLE 6.23 Changes in Ministry of Finance Key Economic Forecast Assumptions: 2016 Budget Compared with 2017 Budget
(Per Cent Change)
2016 2017p 2018p 2019p
2016 Budget
2017 Budget
2016 Budget
2017 Budget
2016 Budget
2017 Budget
2016 Budget
2017 Budget
Real Gross Domestic Product 2.2 2.7 2.4 2.3 2.2 2.1 2.0 2.0 Nominal Gross Domestic Product 4.0 4.6 4.6 4.3 4.2 4.1 4.0 4.2
Retail Sales 4.8 4.7 3.7 3.9 3.4 3.7 3.2 3.8
Housing Starts (000s) 64.0 75.0 65.0 72.0 68.0 68.5 72.0 71.0
Primary Household Income 4.5 4.1 4.4 3.9 4.2 4.0 4.2 4.1
Compensation of Employees 4.4 4.4 4.5 4.1 4.5 4.5 4.4 4.6 Net Operating Surplus — Corporations 3.7 9.2 8.5 6.8 5.7 7.1 3.9 5.4
Employment 1.1 1.1 1.2 1.3 1.2 1.2 1.1 1.1
Job Creation (000s) 78 76 85 94 82 89 79 82
Consumer Price Index 1.8 1.8 2.0 2.0 2.0 2.0 2.0 2.0
Key External Variables U.S. Real Gross Domestic Product 2.1 1.6 2.4 2.3 2.4 2.4 2.2 2.1 WTI Crude Oil ($ US/bbl.) 42 43 53 54 60 59 67 62 Canadian Dollar (Cents US) 72.0 75.4 75.5 74.5 81.0 75.5 83.0 78.5 Three-Month Treasury Bill Rate1 (Per Cent) 0.5 0.5 0.8 0.5 2.2 0.8 2.8 1.5
10-Year Government Bond Rate1 (Per Cent) 1.6 1.3 2.3 1.9 3.3 2.4 3.6 3.0
p = Ontario Ministry of Finance planning projection. 1 Government of Canada interest rates. Sources: Statistics Canada, Canada Mortgage and Housing Corporation, Bank of Canada, U.S. Energy Information Administration, U.S. Bureau of Economic Analysis, Blue Chip Economic Indicators (March 2017) and Ontario Ministry of Finance.
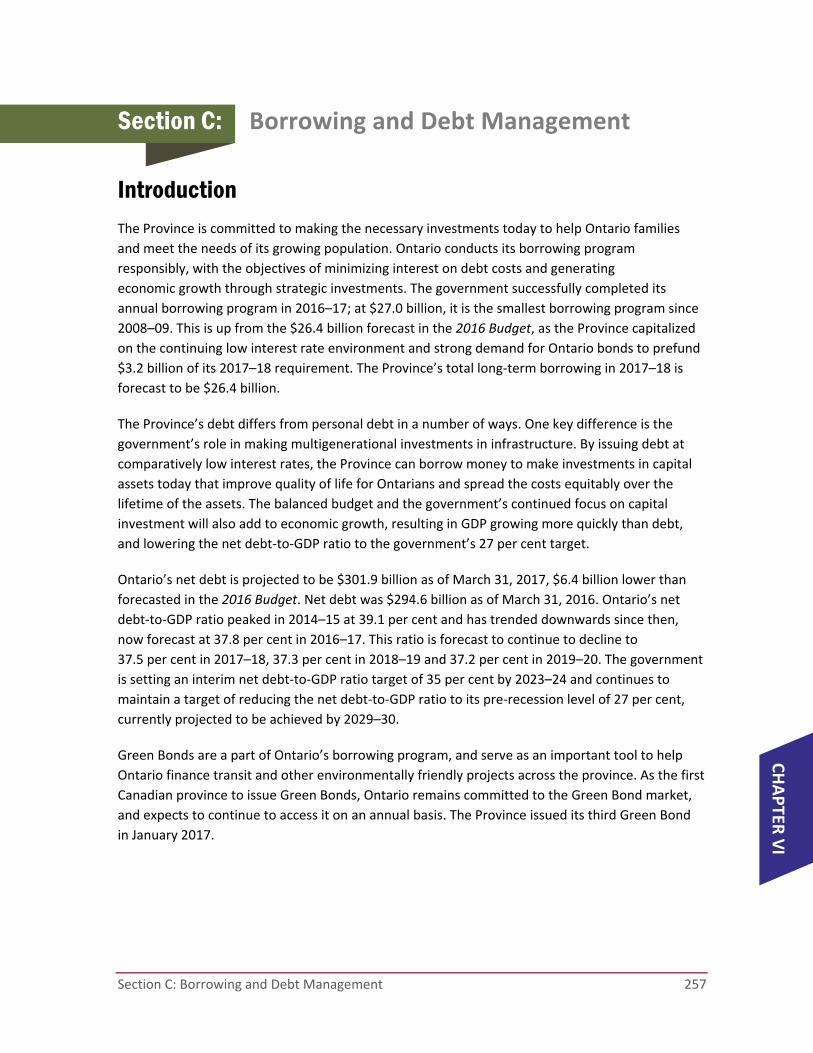
Section C: Borrowing and Debt Management 257
CHAPTER
VI
Section C: Borrowing and Debt Management
Introduction The Province is committed to making the necessary investments today to help Ontario families
and meet the needs of its growing population. Ontario conducts its borrowing program
responsibly, with the objectives of minimizing interest on debt costs and generating
economic growth through strategic investments. The government successfully completed its
annual borrowing program in 2016–17; at $27.0 billion, it is the smallest borrowing program since
2008–09. This is up from the $26.4 billion forecast in the 2016 Budget, as the Province capitalized
on the continuing low interest rate environment and strong demand for Ontario bonds to prefund
$3.2 billion of its 2017–18 requirement. The Province’s total long‐term borrowing in 2017–18 is
forecast to be $26.4 billion.
The Province’s debt differs from personal debt in a number of ways. One key difference is the
government’s role in making multigenerational investments in infrastructure. By issuing debt at
comparatively low interest rates, the Province can borrow money to make investments in capital
assets today that improve quality of life for Ontarians and spread the costs equitably over the
lifetime of the assets. The balanced budget and the government’s continued focus on capital
investment will also add to economic growth, resulting in GDP growing more quickly than debt,
and lowering the net debt‐to‐GDP ratio to the government’s 27 per cent target.
Ontario’s net debt is projected to be $301.9 billion as of March 31, 2017, $6.4 billion lower than
forecasted in the 2016 Budget. Net debt was $294.6 billion as of March 31, 2016. Ontario’s net
debt‐to‐GDP ratio peaked in 2014–15 at 39.1 per cent and has trended downwards since then,
now forecast at 37.8 per cent in 2016–17. This ratio is forecast to continue to decline to
37.5 per cent in 2017–18, 37.3 per cent in 2018–19 and 37.2 per cent in 2019–20. The government
is setting an interim net debt‐to‐GDP ratio target of 35 per cent by 2023–24 and continues to
maintain a target of reducing the net debt‐to‐GDP ratio to its pre‐recession level of 27 per cent,
currently projected to be achieved by 2029–30.
Green Bonds are a part of Ontario’s borrowing program, and serve as an important tool to help
Ontario finance transit and other environmentally friendly projects across the province. As the first
Canadian province to issue Green Bonds, Ontario remains committed to the Green Bond market,
and expects to continue to access it on an annual basis. The Province issued its third Green Bond
in January 2017.

258 Chapter VI: Responsible Fiscal Management
Long-Term Public Borrowing The Province’s deficit for 2016–17 is projected to be $1.5 billion, compared to the 2016 Budget
forecast of $4.3 billion. The total funding requirement for 2016–17 is now forecast at $25.6 billion,
$4.6 billion lower than the 2016 Budget forecast. The Province’s total long‐term borrowing in
2017–18 is forecast to be $26.4 billion, which is $0.6 billion lower than the amount borrowed in
2016–17. To date, $0.6 billion in long‐term public borrowing has been completed for 2017–18.
TABLE 6.24 Borrowing Program and Medium‐Term Outlook
($ Billions)
2016–17
2017–18 2018–19 2019–20 2016
Budget Interim In-Year Change
Deficit/(Surplus) 4.3 1.5 (2.8) 0.0 0.0 0.0
Investment in Capital Assets 11.2 8.9 (2.2) 13.1 15.4 17.1
Non-Cash Adjustments (5.8) (4.8) 1.0 (6.7) (6.9) (7.1)
Loans to Infrastructure Ontario – – – 0.4 0.5 0.6
Other Net Loans/Investments (0.9) (1.0) (0.1) (0.8) 1.4 0.6
Debt Maturities 21.5 20.9 (0.5) 17.5 21.8 27.4
Debt Redemptions 0.1 0.1 – 0.1 0.1 0.1
Total Funding Requirement 30.3 25.6 (4.6) 23.7 32.3 38.7
Canada Pension Plan Borrowing (0.1) (0.1) – – – (0.9)
Decrease/(Increase) in Short-Term Borrowing (1.0) – 1.0 – – –
Increase/(Decrease) in Cash and Cash Equivalents (2.7) 0.3 3.0 6.0 – –
Preborrowing from 2015–16 – (2.0) (2.0) – – –
Preborrowing in 2016–17 for 2017–18 – 3.2 3.2 (3.2) – –
Total Long-Term Public Borrowing 26.4 27.0 0.6 26.4 32.2 37.8
Note: Numbers may not add due to rounding.
The Province plans to borrow $96.5 billion over the three‐year period in the medium‐term
borrowing outlook, up from the forecast of $78.5 billion over the three‐year period contained in
the 2016 Budget. This $18.1 billion increase in borrowing reflects the higher debt maturities,
higher investments in capital assets and the need for higher cash reserves.
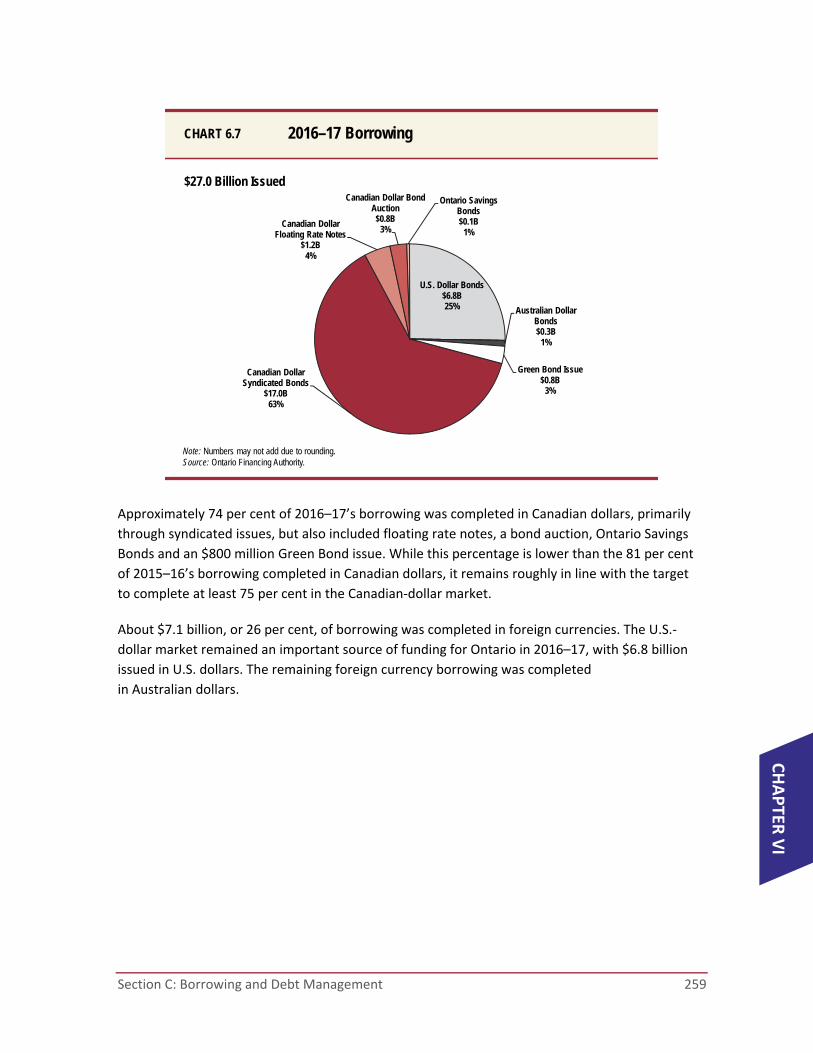
Section C: Borrowing and Debt Management 259
CHAPTER
VI
Approximately 74 per cent of 2016–17’s borrowing was completed in Canadian dollars, primarily
through syndicated issues, but also included floating rate notes, a bond auction, Ontario Savings
Bonds and an $800 million Green Bond issue. While this percentage is lower than the 81 per cent
of 2015–16’s borrowing completed in Canadian dollars, it remains roughly in line with the target
to complete at least 75 per cent in the Canadian‐dollar market.
About $7.1 billion, or 26 per cent, of borrowing was completed in foreign currencies. The U.S.‐
dollar market remained an important source of funding for Ontario in 2016–17, with $6.8 billion
issued in U.S. dollars. The remaining foreign currency borrowing was completed
in Australian dollars.
Note: Numbers may not add due to rounding.Source: Ontario Financing Authority.
2016–17 BorrowingCHART 6.7
Canadian Dollar Syndicated Bonds
$17.0B63%
Canadian Dollar Floating Rate Notes
$1.2B4%
Canadian Dollar Bond Auction$0.8B
3%
Ontario Savings Bonds$0.1B
1%
U.S. Dollar Bonds $6.8B25% Australian Dollar
Bonds$0.3B
1%
Green Bond Issue $0.8B
3%
$27.0 Billion Issued
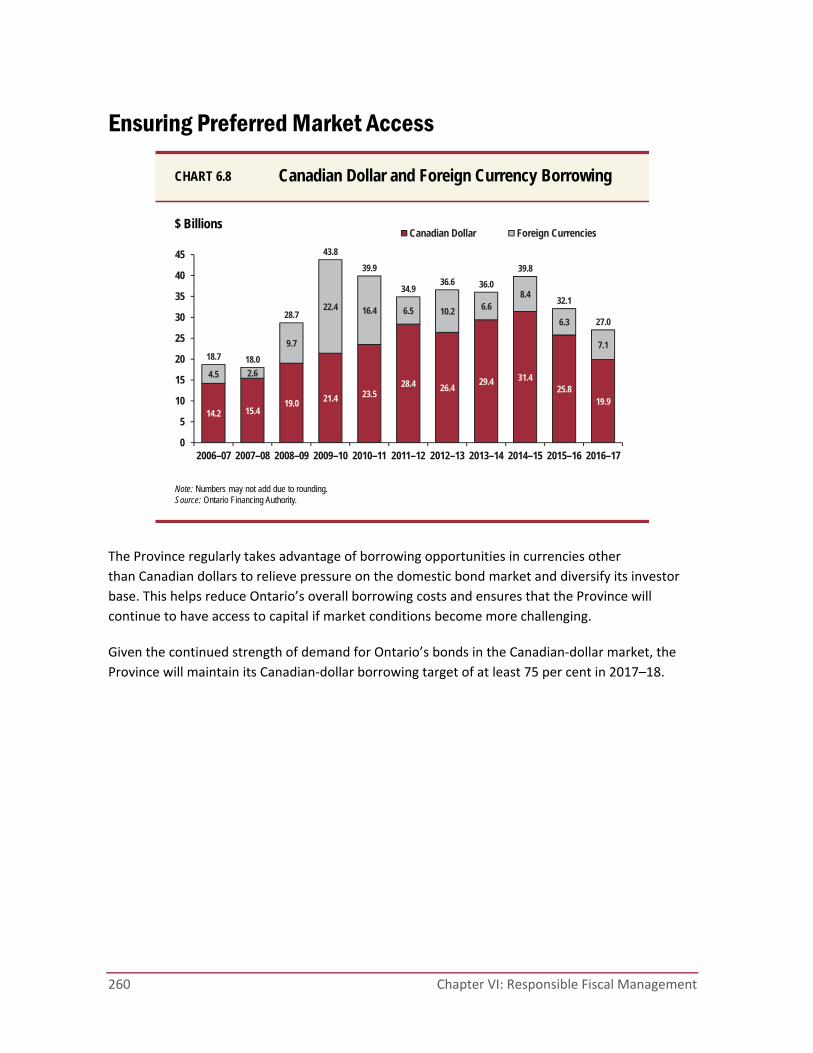
260 Chapter VI: Responsible Fiscal Management
Ensuring Preferred Market Access
The Province regularly takes advantage of borrowing opportunities in currencies other
than Canadian dollars to relieve pressure on the domestic bond market and diversify its investor
base. This helps reduce Ontario’s overall borrowing costs and ensures that the Province will
continue to have access to capital if market conditions become more challenging.
Given the continued strength of demand for Ontario’s bonds in the Canadian‐dollar market, the
Province will maintain its Canadian‐dollar borrowing target of at least 75 per cent in 2017–18.
Note: Numbers may not add due to rounding.Source: Ontario Financing Authority.
Canadian Dollar and Foreign Currency BorrowingCHART 6.8
14.2 15.419.0 21.4 23.5
28.4 26.429.4 31.4
25.819.9
4.5 2.6
9.7
22.4 16.4 6.5 10.2 6.68.4
6.3
7.118.7 18.0
28.7
43.8
39.9
34.936.6 36.0
39.8
32.1
27.0
0
5
10
15
20
25
30
35
40
45
2006–07 2007–08 2008–09 2009–10 2010–11 2011–12 2012–13 2013–14 2014–15 2015–16 2016–17
Canadian Dollar Foreign Currencies$ Billions

Section C: Borrowing and Debt Management 261
CHAPTER
VI
Leading Canadian-Dollar Green Bond Market On January 27, 2017, Ontario successfully launched its third Canadian‐dollar Green Bond of
$800 million.
As the first Canadian province to issue Green Bonds and as the largest and most frequent issuer
in the Canadian‐dollar Green Bond market, Ontario continues to lead the way in establishing and
developing this market with domestic and global investor participation. Since Ontario’s inaugural
issue in 2014, the Province’s Green Bonds have attracted investors from the United States, Europe
and Asia, bringing new international buyers to Ontario’s borrowing program. Ontario remains
committed to the Green Bond market and expects to continue to access it on an annual basis.
Green Bonds are an important tool to help Ontario finance transit and other environmentally
friendly projects across the province. Twelve eligible projects have been selected to receive
funding from the third Green Bond, with an emphasis on clean transportation, and energy
efficiency and conservation.
To date, total Green Bond financing amounts to $2.05 billion, with up to $1.77 billion allocated to
Metrolinx for clean transportation projects. All three Green Bond issues helped fund the Eglinton
Crosstown LRT project in Toronto, one of the largest public transit expansions in the history of
the region.
262 Chapter VI: Responsible Fiscal Management
Extending Term of Borrowing
The global decline in interest rates over the past 25 years cannot continue indefinitely. To limit the
fiscal impact of an increase in interest rates, the Province has continued to extend the term of its
debt. Extending the term to maturity allows the Province to lock in low interest rates for a longer
period, which reduces refinancing risks and helps offset the impact of expected higher interest
rates on the Province’s future interest on debt (IOD) costs.
Since the beginning of fiscal year 2010–11, Ontario has issued $63.0 billion of bonds with terms
of longer than 30 years to lock in low rates. As a result, the weighted‐average term to maturity of
long‐term Provincial debt issued has been extended significantly, from 8.1 years in 2009–10 to
13.9 years in 2016–17.
Source: Ontario Financing Authority.
Years
Weighted-Average Term of Borrowing in YearsCHART 6.9
8.1
12.8 13.012.4
13.6 14.1 14.2 13.9
0
2
4
6
8
10
12
14
16
2009–10 2010–11 2011–12 2012–13 2013–14 2014–15 2015–16 2016–17

Section C: Borrowing and Debt Management 263
CHAPTER
VI
Interest on Debt Savings and Affordability Interest on debt expense is projected to be $11,250 million for 2016–17, which is $506 million
lower than forecast in the 2016 Budget, reflecting lower‐than‐forecast interest rates, the lower
forecast deficit for 2016–17 and cost‐effective debt management. Interest on debt expense is
forecast to be $11,581 million in 2017–18 and $12,035 million in 2018–19 — $872 million and
$1,072 million lower, respectively, than forecasted in the 2016 Budget.
These savings continue a trend that has been in place since 2010, through a combination of lower
deficits and borrowing requirements, and lower‐than‐forecast interest rates. Interest on debt
savings over the period to balance now total $24.0 billion relative to the 2010 Budget forecast.
Note: Numbers may not add due to rounding.Source: Ontario Financing Authority.
Interest on Debt: Budget Forecast versus ActualCHART 6.10
$ Billions
8
9
10
11
12
13
14
15
16
17
2010–11 2011–12 2012–13 2013–14 2014–15 2015–16 2016–17 2017–18
2010 Budget Forecast Actuals 2017 Budget Forecast
$0.5
$1.0
$2.2$2.8
$3.8
$4.5
$4.7$4.6
Total Savings = $24.0 Billion

264 Chapter VI: Responsible Fiscal Management
Chart 6.11 illustrates how the savings on IOD have lowered IOD‐to‐revenue, a key measure of the
affordability of debt. The 2010 Budget forecast that by 2017–18, the Province would need to
spend 11.3 cents of every revenue dollar received on interest. The current forecast is 3.1 cents
lower, at 8.2 cents of interest costs for every dollar of revenue. This ratio is lower than it has been
for the last 25 years, and is forecast to remain lower through the outlook period to 2019–20.
For the 13 years commencing in 1991–92, average IOD‐to‐revenue was 13.6 per cent, declining
to 9.1 per cent over the next 13 years.
7.7
8.8
10.8
13.9
14.5 14.6 14.8
14.2 14.3
15.5 15.0
14.2
12.9 12.9
11.1
9.9
9.1 8.6 8.8
9.1 8.8 9.2 9.1 9.1 9.0
8.5 8.4 8.2 8.3 8.5
7.0
8.0
9.0
10.0
11.0
12.0
13.0
14.0
15.0
16.0
Source: Ontario Financing Authority.
Interest on Debt-to-Revenue RatioCHART 6.11
Per Cent
Onset of Economic Recession
Interim 2016–17
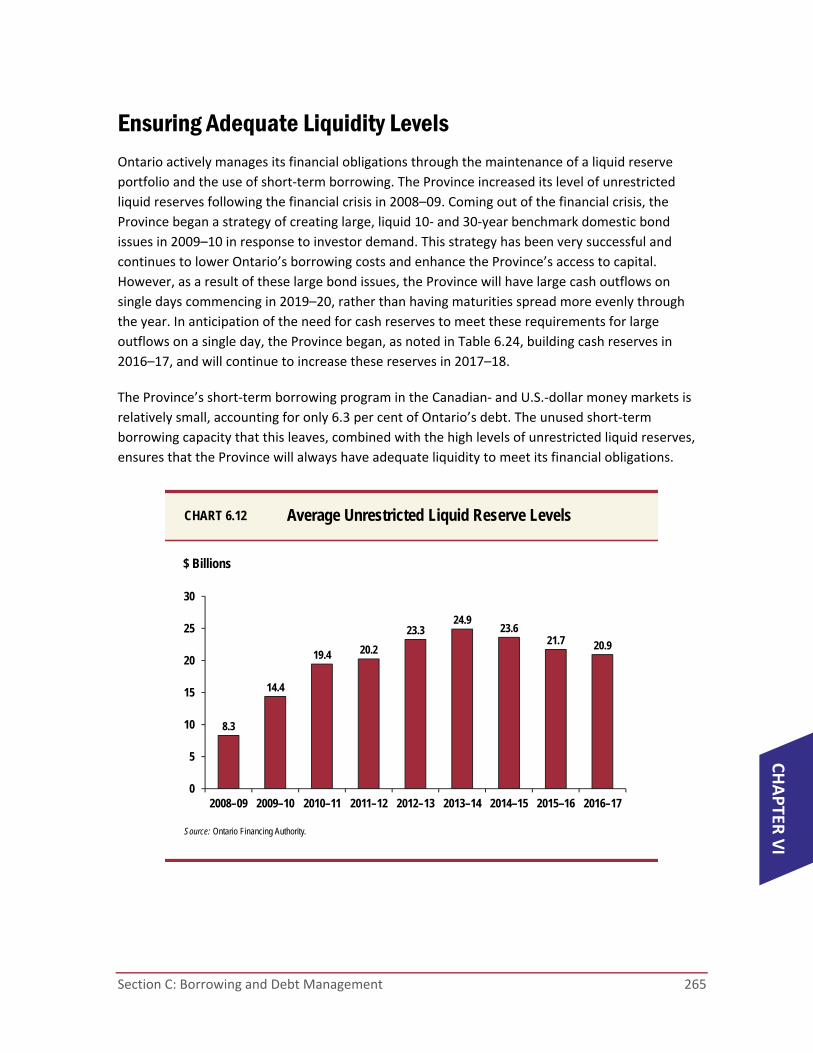
Section C: Borrowing and Debt Management 265
CHAPTER
VI
Ensuring Adequate Liquidity Levels Ontario actively manages its financial obligations through the maintenance of a liquid reserve
portfolio and the use of short‐term borrowing. The Province increased its level of unrestricted
liquid reserves following the financial crisis in 2008–09. Coming out of the financial crisis, the
Province began a strategy of creating large, liquid 10‐ and 30‐year benchmark domestic bond
issues in 2009–10 in response to investor demand. This strategy has been very successful and
continues to lower Ontario’s borrowing costs and enhance the Province’s access to capital.
However, as a result of these large bond issues, the Province will have large cash outflows on
single days commencing in 2019–20, rather than having maturities spread more evenly through
the year. In anticipation of the need for cash reserves to meet these requirements for large
outflows on a single day, the Province began, as noted in Table 6.24, building cash reserves in
2016–17, and will continue to increase these reserves in 2017–18.
The Province’s short‐term borrowing program in the Canadian‐ and U.S.‐dollar money markets is
relatively small, accounting for only 6.3 per cent of Ontario’s debt. The unused short‐term
borrowing capacity that this leaves, combined with the high levels of unrestricted liquid reserves,
ensures that the Province will always have adequate liquidity to meet its financial obligations.
Source: Ontario Financing Authority.
$ Billions
Average Unrestricted Liquid Reserve Levels CHART 6.12
8.3
14.4
19.4 20.2
23.324.9
23.621.7 20.9
0
5
10
15
20
25
30
2008–09 2009–10 2010–11 2011–12 2012–13 2013–14 2014–15 2015–16 2016–17

266 Chapter VI: Responsible Fiscal Management
Reducing Net Debt-to-GDP Ontario’s net debt is the difference between total liabilities and total financial assets.
It is projected to be $301.9 billion as of March 31, 2017, down from the net debt projection
of $308.3 billion in the 2016 Budget.
Accumulated deficit is projected to be $193.5 billion as of March 31, 2017, compared to
a projection of $197.8 billion in the 2016 Budget. The projected difference of $108.4 billion
between net debt and accumulated deficit is due to the Province’s consistent level of investment
in infrastructure.
Ontario's net debt‐to‐GDP ratio peaked in 2014–15 at 39.1 per cent and has trended downwards
since then, now forecast at 37.8 per cent in 2016–17, well below the 39.6 per cent forecast for
2016–17 contained in the 2016 Budget. This ratio is forecast to continue to decline to 37.5 per cent
in 2017–18, 37.3 per cent in 2018–19, and 37.2 per cent in 2019–20. The government is setting an
interim net debt‐to‐GDP ratio target of 35 per cent by 2023–24 and continues to maintain a target
of reducing the net debt‐to‐GDP ratio to its pre‐recession level of 27 per cent, currently projected
to be achieved by 2029–30.
13.4
17.1
21.1
26.728.4
30.231.3
30.629.5
32.1
29.328.2
26.8 27.226.4
27.426.6 26.0
27.9
32.434.0
35.737.1
38.4 39.1 38.637.8 37.5 37.3 37.2 36.9 36.3
35.434.1
32.931.4
30.229.0
27.926.8
25.8
24.0 24.423.6
19.618.5 17.6
18.6
21.922.9
24.0 24.625.4 25.8 25.2
24.223.2
22.321.4
20.619.8
19.118.3
17.6 17.0 16.3 15.7 15.1 14.5 13.9
10
15
20
25
30
35
40
45 Net Debt-to-GDP Accumulated Deficit-to-GDP
Net Debt-to-GDP and Accumulated Deficit-to-GDPCHART 6.13
Notes: Net Debt has been restated to include Broader Public Sector Net Debt, starting in 2005–06. Reaching the interim target of 35 per cent in 2023–24 and 27 per cent in 2029–30 is based on current economic projections. Source: Ontario Ministry of Finance.
Per Cent
Onset of Economic Recession
Interim 2016–17
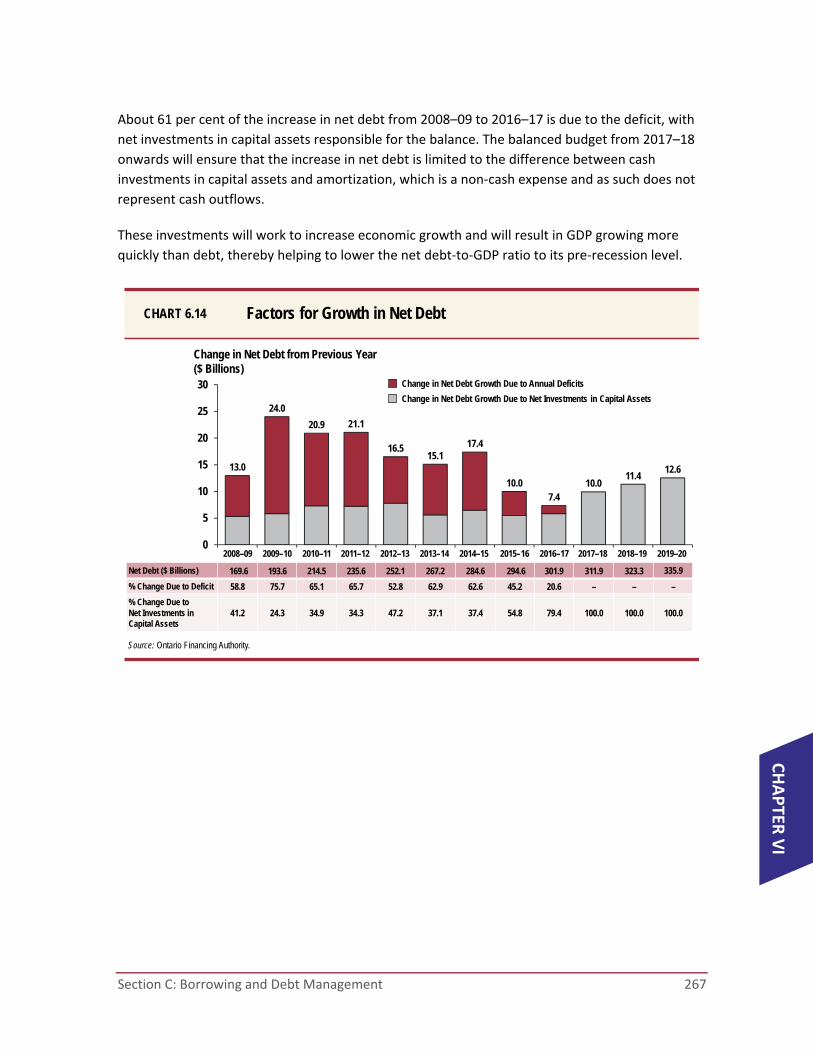
Section C: Borrowing and Debt Management 267
CHAPTER
VI
About 61 per cent of the increase in net debt from 2008–09 to 2016–17 is due to the deficit, with
net investments in capital assets responsible for the balance. The balanced budget from 2017–18
onwards will ensure that the increase in net debt is limited to the difference between cash
investments in capital assets and amortization, which is a non‐cash expense and as such does not
represent cash outflows.
These investments will work to increase economic growth and will result in GDP growing more
quickly than debt, thereby helping to lower the net debt‐to‐GDP ratio to its pre‐recession level.
Source: Ontario Financing Authority.
Change in Net Debt from Previous Year($ Billions)
Factors for Growth in Net DebtCHART 6.14
13.0
24.0
20.9 21.1
16.515.1
17.4
10.07.4
10.011.4
12.6
0
5
10
15
20
25
30
2008–09 2009–10 2010–11 2011–12 2012–13 2013–14 2014–15 2015–16 2016–17 2017–18 2018–19 2019–20
Net Debt ($ Billions) 169.6 193.6 214.5 235.6 252.1 267.2 284.6 294.6 301.9 311.9 323.3 335.9
% Change Due to Deficit 58.8 75.7 65.1 65.7 52.8 62.9 62.6 45.2 20.6 – – –
% Change Due to Net Investments in Capital Assets
41.2 24.3 34.9 34.3 47.2 37.1 37.4 54.8 79.4 100.0 100.0 100.0
Change in Net Debt Growth Due to Annual Deficits
Change in Net Debt Growth Due to Net Investments in Capital Assets

268 Chapter VI: Responsible Fiscal Management
Total Debt Composition Total debt consists of bonds issued in the public capital markets, non‐public debt, treasury bills
and U.S. commercial paper. Total debt, which represents all borrowing without offsetting financial
assets, is projected to be $332.4 billion as of March 31, 2017.
Public debt, as of March 31, 2017, is projected to be $320.8 billion, primarily consisting of bonds
issued in the domestic and international public markets in six currencies. Ontario also has
$11.6 billion outstanding in non‐public debt issued in Canadian dollars. Non‐public debt consists
of debt instruments issued mainly to the Canada Pension Plan Investment Board. This debt is
not marketable and cannot be traded.
Canadian‐dollar denominated debt represents 83 per cent of the total debt projected as of
March 31, 2017.
Note: Numbers may not add due to rounding.Source: Ontario Financing Authority.
$332.4 Billion Outstanding
Total Debt Composition as of March 31, 2017 CHART 6.15
Non-Public Debt $11.6B
4%
Treasury Bills $16.0B
5% U.S. Commercial Paper $4.9B
1%
Foreign Currency Bonds $50.1B
15%Canadian Dollar Public Bonds
$249.7B75% Foreign Currency Bonds
• U.S. Dollars• Euros• Japanese Yen• Swiss Francs• Australian Dollars
Canadian Dollar Public Bonds• Syndicated Bonds• Medium-Term Notes• Floating Rate Notes• Ontario Savings Bonds• Bond Auctions• Real Return Bonds• Green Bonds

Section C: Borrowing and Debt Management 269
CHAPTER
VI
Cost of Debt The interest rate that Ontario pays on its debt has declined steadily since 1990–91, when the
effective interest rate (on a weighted‐average basis) on total debt was 10.9 per cent. As of
March 31, 2017, it is forecast to be 3.5 per cent, lower than the 3.6 per cent from March 31, 2016.
For 2017–18, the impact of a one percentage point change in interest rates on IOD would be
approximately $300 million for the Province.
* Projected to March 31, 2017.Sources: Ontario Public Accounts (1991–2016) and Ontario Financing Authority.
Effective Interest Rate (Weighted Average)on Total Debt
CHART 6.16
Per Cent
10.9 10.710.1
9.5 9.89.4
9.0 9.08.6 8.4 8.2
7.67.2
6.76.4 6.1 6.0 5.8
5.24.6 4.5 4.4 4.1 3.9 3.7 3.6 3.5
0
2
4
6
8
10
12
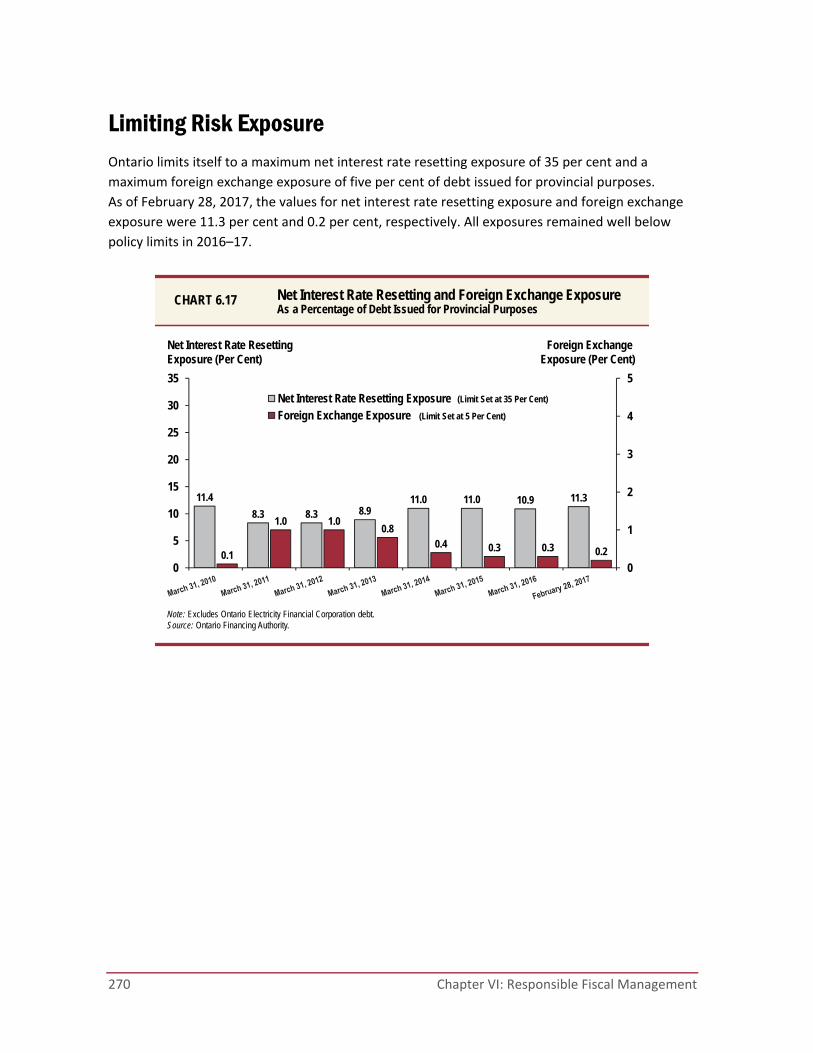
270 Chapter VI: Responsible Fiscal Management
Limiting Risk Exposure Ontario limits itself to a maximum net interest rate resetting exposure of 35 per cent and a
maximum foreign exchange exposure of five per cent of debt issued for provincial purposes.
As of February 28, 2017, the values for net interest rate resetting exposure and foreign exchange
exposure were 11.3 per cent and 0.2 per cent, respectively. All exposures remained well below
policy limits in 2016–17.
11.4
8.3 8.3 8.911.0 11.0 10.9 11.3
0.1
1.0 1.00.8
0.4 0.3 0.3 0.2
0
1
2
3
4
5
0
5
10
15
20
25
30
35
Net Interest Rate Resetting ExposureForeign Exchange Exposure
Net Interest Rate Resetting and Foreign Exchange ExposureAs a Percentage of Debt Issued for Provincial Purposes
CHART 6.17
Note: Excludes Ontario Electricity Financial Corporation debt.Source: Ontario Financing Authority.
Net Interest Rate Resetting Exposure (Per Cent)
Foreign Exchange Exposure (Per Cent)
(Limit Set at 5 Per Cent)
(Limit Set at 35 Per Cent)

Section C: Borrowing and Debt Management 271
CHAPTER
VI
Using Derivatives to Mitigate Risks To seek the most cost‐effective means of meeting its borrowing requirements, Ontario issues fixed
and floating rate debt in both domestic and international markets. To mitigate the risk arising from
foreign exchange and interest rate movements, the Province uses derivatives, a type of financial
contract, to limit its exposure to both of these variables. Foreign currency swaps and forwards are
used to convert foreign currency exposure into Canadian‐dollar exposure, while interest rate
swaps ensure interest payments on the Province’s floating rate debt remain constant.
TABLE 6.25 Consolidated Derivative Portfolio Notional Value1
($ Billions)
Total Interest Rate
Swaps Cross-Currency
Swaps
Forward Foreign Exchange Contracts Swaptions
2015–16 180.0 100.8 47.6 31.0 0.5
Interim 2016–17 160.9 85.0 40.7 35.2 – 1 Notional amounts represent the volume of outstanding derivative contracts and are not indicative of credit risk, market risk or actual cash flows. Note: Numbers may not add due to rounding. Source: Ontario Financing Authority.
272 Chapter VI: Responsible Fiscal Management
Reducing Ontario’s Electricity Sector Stranded Debt Ontario Electricity Financial Corporation (OEFC) interim results for 2016–17 show an estimated
excess of revenue over expense of more than $0.9 billion, which would reduce OEFC’s unfunded
liability (or “stranded debt of the electricity sector”) from $4.4 billion, as of March 31, 2016, to
below $3.5 billion, as of March 31, 2017. This would be the 13th consecutive year of stranded debt
reduction.
Projected 2017–18 OEFC results are an excess of revenue over expense of about $1.1 billion.
The government dedicates revenues it receives from the electricity sector to the OEFC. All OEFC
revenues, including the debt retirement charge (DRC) paid by electricity users, are used to service
and retire its debt and other obligations, as provided for under the Electricity Act, 1998.
Through prudent management of electricity sector debt and other obligations, the government
removed the DRC cost from residential electricity users’ electricity bills beginning January 1, 2016,
and, as announced in the 2015 Ontario Economic Outlook and Fiscal Review, is ending the DRC as
of April 1, 2018, for industrial, business and other electricity users, such as institutions and not‐for‐
profits — nine months earlier than previously estimated.
In addition, OEFC will receive a financial benefit related to the secondary offering of Hydro One
shares in accordance with section 50.3 of the Electricity Act, 1998. This financial benefit will
contribute to paying down stranded debt.

Section C: Borrowing and Debt Management 273
CHAPTER
VI
Consolidated Financial Tables
TABLE 6.26 Net Debt and Accumulated Deficit
($ Millions)
2012–13 2013–14 2014–15 2015–166 Interim
2016–17 Plan
2017–18
Debt1
Publicly Held Debt
Bonds2 245,544 259,933 280,442 293,935 299,257 308,165
Treasury Bills 13,024 12,297 14,631 14,604 16,044 16,044
U.S. Commercial Paper2 6,611 8,657 6,304 6,304 4,864 4,864
Infrastructure Ontario (IO)3 1,909 1,603 950 300 300 300
Other 360 345 317 301 289 279
267,448 282,835 302,644 315,444 320,754 329,652
Non-Public Debt 13,617 12,923 12,316 11,969 11,629 11,406
Total Debt 281,065 295,758 314,960 327,413 332,383 341,058
Cash and Temporary Investments (29,037) (24,303) (24,946) (25,765) (25,765) (28,543)
Total Debt Net of Cash and Temporary Investments
252,028 271,455 290,014 301,648 306,618 312,515
Other Net (Assets)/Liabilities4 (13,839) (18,354) (19,848) (20,945) (17,978) (12,883)
Broader Public Sector (BPS) Net Debt
13,899 14,089 14,410 13,861 13,276 12,289
Net Debt 252,088 267,190 284,576 294,564 301,916 311,921
Non-Financial Assets5 (84,956) (90,556) (97,065) (102,536) (108,372) (118,377)
Accumulated Deficit 167,132 176,634 187,511 192,028 193,544 193,544 1 Includes debt issued by the Province and Government Organizations. 2 All balances are expressed in Canadian dollars. The balances above reflect the effect of related derivative contracts. 3 Infrastructure Ontario’s (IO) interim 2016–17 debt is composed of Infrastructure Renewal Bonds ($300 million). IO’s debt is not guaranteed by
the Province. 4 Other Net (Assets)/Liabilities include accounts receivable, loans receivable, advances and investments in government business enterprises,
accounts payable, accrued liabilities, deferred revenue and capital contributions, pensions and other employee future benefits, and other liabilities.
5 Non-financial assets include the tangible capital assets of the Province and broader public sector. 6 The 2015–16 actuals have been restated to reflect recognizing jointly sponsored net pension assets for the Ontario Public Service Employees’
Union Pension Plan and the Ontario Teachers’ Pension Plan on the Province’s financial statements, consistent with the 2016 Budget. Source: Ontario Ministry of Finance.
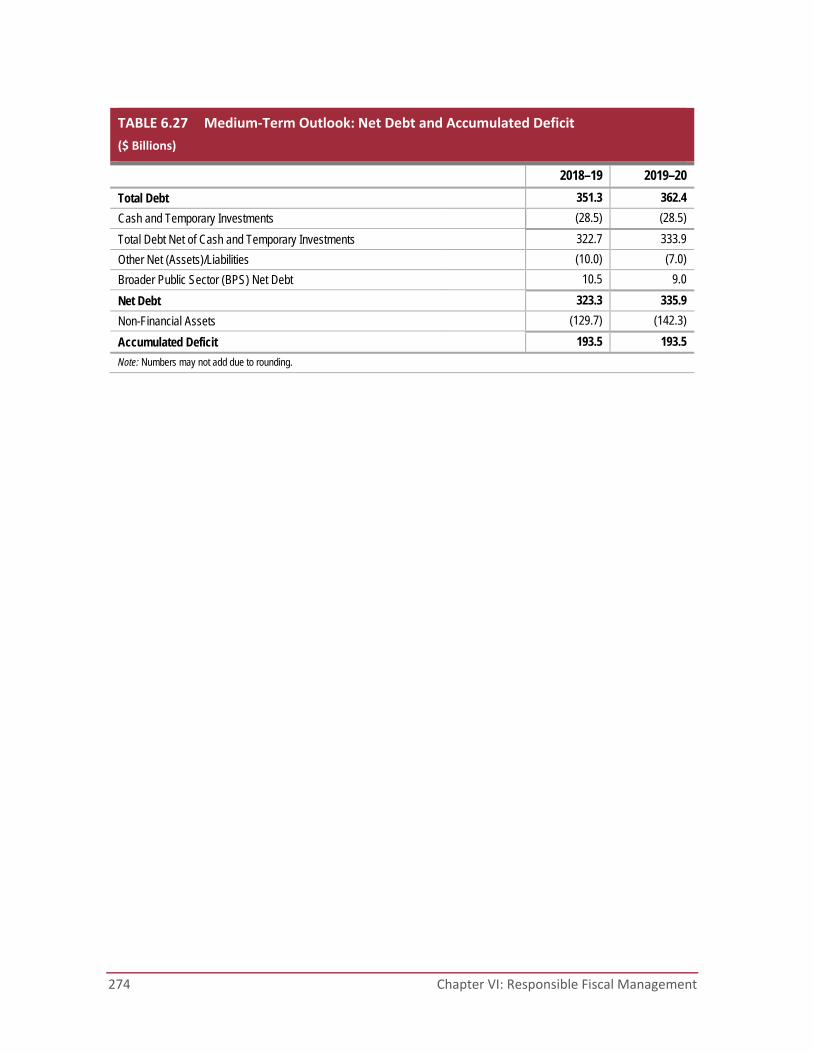
274 Chapter VI: Responsible Fiscal Management
TABLE 6.27 Medium‐Term Outlook: Net Debt and Accumulated Deficit
($ Billions)
2018–19 2019–20
Total Debt 351.3 362.4
Cash and Temporary Investments (28.5) (28.5)
Total Debt Net of Cash and Temporary Investments 322.7 333.9
Other Net (Assets)/Liabilities (10.0) (7.0)
Broader Public Sector (BPS) Net Debt 10.5 9.0
Net Debt 323.3 335.9
Non-Financial Assets (129.7) (142.3)
Accumulated Deficit 193.5 193.5
Note: Numbers may not add due to rounding.
a Fair and sustainaBle tax sYstem
chapter vii


Section A: Taxation 277
CHAPTER
VII
Introduction Ontario’s business taxes have positioned it as an attractive jurisdiction for business investment.
Ontario also has progressive personal income taxes and provides substantial support to low‐ to
moderate‐income individuals and families.
The government is proposing measures to curb tax avoidance, parallel federal tax changes,
and support the climate change action plan. In addition, changes to tobacco tax rates are being
implemented to support key government priorities.
Details of tax measures related to housing affordability can be found in Chapter II: Helping You
and Your Family.
The Province is also working with municipalities, the Municipal Property Assessment Corporation
(MPAC) and taxpayers to enhance the fairness and effectiveness of Ontario’s property tax
and assessment system, which is critical to support local services and adequately fund
Ontario’s schools.
A list of proposed legislative amendments is also included.

278 Chapter VII: A Fair and Sustainable Tax System

Section A: Taxation 279
CHAPTER
VII
Section A: Taxation
Paralleling Federal Measures Clarifying the Treatment of Fertility-Related Expenses under the Medical Expense Tax Credit
In 2015, Ontario announced it would increase access to fertility treatments to help more people
expand their families.
The Ontario Fertility Program provides publicly funded fertility services at 51 fertility clinics across
the province. For example, since its launch in December 2015, the program has helped over
7,200 individuals trying to start or expand their families through in vitro fertilization. The program
is available to eligible Ontarians of any sex, gender, sexual orientation or family status.
The 2017 federal budget proposed to clarify the application of the federal medical expense tax
credit so that individuals who require medical intervention to conceive a child are eligible to claim
the same expenses that would generally be eligible for individuals on account of medical infertility.
These changes will apply to the 2017 and subsequent taxation years.
Ontario’s medical expense tax credit parallels the federal credit. Ontario will adopt the federal
changes once they have been approved by the federal government. This would allow Ontarians to
claim tax relief for eligible fertility treatment costs that are not directly covered by the Province,
giving even more support to help everyone who wants to conceive a child.
280 Chapter VII: A Fair and Sustainable Tax System
Consolidating Tax Credits for Caregivers
In its 2017 budget, the federal government proposed to simplify its existing system of personal
income tax credits for caregivers by creating a new consolidated Canada Caregiver Credit.
This federal credit would be effective beginning in the 2017 taxation year.
Ontario parallels the federal caregiver and infirm dependant tax credits. To simplify and enhance
access to tax relief for caregivers, Ontario proposes to replace the provincial caregiver and infirm
dependant tax credits with a new Ontario Caregiver Tax Credit (OCTC). The following changes
would apply beginning in the 2017 taxation year:
The non‐refundable OCTC, at the rate of 5.05 per cent, would be available in respect of
relatives who are infirm dependants, including adult children of the claimant or of the
claimant’s spouse or common‐law partner.
Dependants would not be required to live with the caregiver claiming the new credit.
The maximum amount received in respect of dependants who do not live with the caregiver
would be increased to remain consistent with the amount that could have been claimed in
respect of dependants under the caregiver tax credit.
For the 2017 taxation year, the maximum amount of taxable income for which this credit
is available would be $4,794. The OCTC would begin phasing out at the dependant’s net
income over $16,401.
The OCTC would not be available in respect of non‐infirm senior parents or grandparents
who reside with their adult children or grandchildren.
For further details on support for caregivers, see Chapter IV, Section A: Strengthening Health Care.
Section A: Taxation 281
CHAPTER
VII
Other Measures Lowering Public Transit Costs for Seniors
As mentioned in Chapter II: Helping You and Your Family, the government is proposing a new
Ontario Seniors’ Public Transit Tax Credit for all Ontarians aged 65 or older, covering eligible public
transit costs as of July 1, 2017.
The credit would be available to claim on the 2017 taxation year returns. Further details about the
credit, including eligibility criteria for public transit costs, will be announced in time for
implementation.
Granting Municipalities the Authority to Levy a Hotel Tax
The City of Toronto Act, 2006 (COTA) gives broad, permissive authority for the City to levy its own
taxes. The authority currently does not allow the City to levy a tax on transient accommodation
(hotel tax). It is proposed the authority in COTA would be amended to remove this exclusion.
The authority to levy a hotel tax would also be extended to single‐tier and lower‐tier municipalities
through proposed amendments to the Municipal Act, 2001.
All municipalities that adopt the hotel tax and that have an existing Destination Marketing Fee
(DMF) program in place would be required to share their hotel tax revenue with the appropriate
not‐for‐profit tourism organization in an amount that matches the total revenue generated by the
existing DMF program. For local municipalities where such a program does not exist, at least
50 per cent of their hotel tax revenue would be shared with the respective Regional Tourism
Organization or a not‐for‐profit tourism organization.

282 Chapter VII: A Fair and Sustainable Tax System
Supporting Renewable Biodiesel in the Coloured Fuel Market
Ontario is committed to addressing climate change, reducing greenhouse gas (GHG) emissions and
transitioning to a low‐carbon economy. In support of these initiatives, the Province is proposing
changes to allow biodiesel, a renewable alternative to fossil fuel, to be more widely available as
part of Ontario’s tax‐exempt coloured fuel program.
Biodiesel may contribute to lower GHG emissions compared to diesel and provide occupational
health and safety benefits, since it is less flammable than diesel. In addition, studies have shown
that biodiesel used in an occupational setting may have positive benefits for air quality compared
to diesel.
Currently, the Province provides certain companies with the authority to colour fuel.
These companies are called registered dyers. Coloured fuel purchased from registered dyers is
tax‐exempt fuel and can only be used for specified purposes defined by the Fuel Tax Act.
To support renewable fuels such as biodiesel, the Province is proposing legislative changes to the
Fuel Tax Act to add a new category of registered dyers who will be permitted to dye biodiesel that
has not been blended, mixed or combined with any other type or grade of fuel. This new category
of registered dyers would be exempt from the fuel transportation requirements currently imposed
on all registered dyers. This would enable more companies to offer coloured biodiesel products
while assisting the Province’s transition to a low‐carbon economy.
Section A: Taxation 283
CHAPTER
VII
Strengthening Ontario’s Tax System
The government is taking action to strengthen the integrity of the tax system and ensure everyone
pays their fair share of taxes. Building on existing initiatives that include actions to combat the
underground economy, the Province will conduct a policy, legislative and administrative review
of all taxes, including those shared with the federal government. This review will seek to identify
and eliminate loopholes, further strengthen administration of existing tax laws and enhance
partnerships with other government entities, such as the Canada Revenue Agency. A review of
revenues from government business enterprises will also be undertaken. This integrated approach
will help promote greater fairness and efficiency and ensure the ongoing integrity of the tax
system.
Income Tax Avoidance
The 2017 federal budget announced a review of tax planning strategies involving private
corporations that inappropriately reduce personal taxes of high‐income earners, such as through
income splitting with family members, holding a passive investment portfolio inside a private
corporation, or converting regular business income to capital gains.
As part of its review to enhance revenue integrity, Ontario is devoting additional expert resources
to identify and address tax loopholes and sophisticated tax planning schemes. The Province will
work closely with the federal government to protect the common tax base and eliminate unfair tax
advantages.
Employer Health Tax Avoidance
The Employer Health Tax Act includes measures that address tax avoidance structures by
incorporating the association rules from the federal Income Tax Act (ITA). As a result of the
application of the association rules, a group of associated entities is treated as a single enterprise
and is required to share the Small Business Deduction (SBD) and the Employer Health Tax (EHT)
exemption. This is intended to address tax avoidance through artificial multiplication of relief
meant for smaller businesses and employers.
The 2016 federal budget introduced new anti‐avoidance measures to prevent multiplication of
the SBD through certain complex structures. As part of its commitment to enhance tax fairness,
the government proposes to parallel one of these measures by eliminating the EHT exemption
for any employer that is a designated member of a partnership, as defined in the ITA. This change
would be effective on a prescribed date no earlier than January 1, 2018, to provide the
opportunity for feedback and consultation.
Ontario will further review other methods and structures by which some employers avoid paying
EHT, to ensure EHT relief is targeted to smaller employers. The public will have the opportunity to
provide feedback on any future changes that may arise as a result of the review.

284 Chapter VII: A Fair and Sustainable Tax System
Technical Measures
Multijurisdictional Tax Filers
The government is proposing amendments to change the way provincial surtax and the Ontario
Tax Reduction (OTR) are calculated for Ontario residents who pay tax to another province,
and non‐residents of Ontario who pay tax to Ontario (referred to as multijurisdictional filers).
These changes are intended to ensure consistency between the surtax and OTR treatment for
multijurisdictional filers and other filers. Currently, the amount of surtax and OTR for
multijurisdictional filers do not properly reflect their total income.
The surtax would be calculated based on the total amount of Ontario tax on taxable income.
The total amount of tax payable, including the surtax, would then be prorated based on the
percentage of income allocated to Ontario. The OTR amounts would also be prorated based on
the percentage of income allocated to the province. These changes would be effective for taxation
years ending after December 31, 2016.

Section B: Tobacco 285
CHAPTER
VII
Section B: Tobacco
Supporting Smoke-Free Ontario Ontario has made significant progress on the Smoke‐Free Ontario Strategy. However, tobacco‐
related diseases remain the number one cause of preventable death and disease in Ontario.
To further accelerate Ontario’s goal of having the lowest smoking rates in Canada, the Province
will be increasing tobacco tax rates by $10 per carton of 200 cigarettes over three years, bringing
Ontario’s rates closer to the national average. Tobacco taxes are a proven method of
encouraging smoking cessation and prevention, and a critical component to achieving results in
tobacco control. This approach will replace the inflation‐based tax increases announced in last
year’s Budget.
These changes will begin with an increase to tobacco tax rates from 15.475 cents to 16.475 cents
per cigarette or gram of tobacco products other than cigars, effective 12:01 a.m., April 28, 2017.
In 2018 and 2019, tobacco taxes will be increased by an additional 2 cents per cigarette or gram
of tobacco each year.
Wholesalers of tobacco products that are not collectors of tobacco tax are required to take an
inventory of all tobacco products (except cigars) that they hold at the end of day, April 27, 2017,
and remit the additional tax on the inventory to the Ministry of Finance.
The government recognizes that tobacco control policies can be undermined by unregulated
tobacco sales, and it will be moving forward with additional measures to help address this issue.
Please see Chapter VI, Section A: Transforming Government for Sustainability and Fairness for
details on addressing unregulated tobacco.

286 Chapter VII: A Fair and Sustainable Tax System
Section C: Strengthening Ontario’s Property Tax and Assessment System 287
CHAPTER
VII
Section C: Strengthening Ontario’s Property Tax and Assessment System
Strengthening the Governance of the Municipal Property Assessment Corporation The government continues to improve board governance for the Municipal Property Assessment
Corporation (MPAC) to support excellence in the delivery of assessment services as well as strong
accountability to stakeholders.
Building on improvements announced in the 2016 Budget, the government proposes to broaden
eligibility for members of the MPAC board of directors by including former municipal officials.
Consistent with best practices in board governance, the government would adjust the size of the
MPAC board from 15 to 13 members.
Going forward, the government will continue to consult on additional opportunities to improve
MPAC board governance.
Property Tax Measures Modernizing Railway Right-of-Way Property Taxation
The 2016 Ontario Economic Outlook and Fiscal Review announced that the Province had initiated
a review of the property taxation of railway rights‐of‐way in response to municipal requests.
As part of the review, the Province has held consultations with municipalities and representatives
of the railway industry. Based on these consultations, the Province is taking action on three key
issues to address concerns related to indexation of rates, variation in rates, and implications for
shortline railways.

288 Chapter VII: A Fair and Sustainable Tax System
TABLE 7.1 Proposed Measures to Modernize Railway Right‐of‐Way Taxation
Key Issues Proposed Measures for 2017
1. Indexation of Rates: Municipalities have expressed concerns that property tax rates on railway rights-of-way have not been updated since the late 1990s.
Beginning in 2017, property tax rates on railway rights-of-way will be updated to reflect the average annual percentage change in taxes on commercial properties. This means that municipal property tax rates will increase by approximately $6 per acre for 2017.
2. Variation in Rates: Municipalities have also expressed concerns about the significant variation in railway rights-of-way property tax rates across the province, with the lowest rates being approximately one-twentieth of the highest rate.
The Province will begin to address rate inequities by adjusting the lowest property tax rates on railway rights-of-way to a minimum of $80 per acre in 2017. Currently, the lowest rate is approximately $35 per acre.
3. Shortline Railways: The railway industry expressed concerns about the impacts of potential property tax increases on shortline railways.
The Province recognizes the challenges faced by shortline railways and will take this concern into account when setting rates.
For 2018 and future years, the government will continue to adjust rates to address these key
issues. The Province is committed to modernizing the property taxation of railway rights‐of‐way
and remains open to further stakeholder input.
Encouraging Small-Scale Agri-Food Business on Farms
As part of Ontario’s efforts to encourage job growth in the agriculture sector and support rural
economies, a review has been undertaken on the property tax treatment of small‐scale
agricultural processing and commercial activities on farms.
Based on discussions with municipal representatives and agricultural organizations, the
government is introducing a legislative framework that would provide municipalities with
flexibility to reduce property tax rates for eligible small‐scale value‐added and commercial
activities on farms. Currently, these operations are taxed at industrial or commercial rates. Under
the proposed changes, a portion of the assessment attributable to the value‐added processing or
commercial activity would be eligible to be taxed by the municipality at a reduced rate.
This measure is intended to provide sustainable property tax treatment to farmers who diversify
their operations by engaging in small‐scale processing or retail activities as a direct extension of
their farming business.
Section C: Strengthening Ontario’s Property Tax and Assessment System 289
CHAPTER
VII
Moving Forward with Provincial Land Tax (PLT) Reform The government remains committed to moving forward with Provincial Land Tax (PLT) reform
and establishing a more equitable and modern PLT system. Building on changes announced in the
2015 Budget and 2016 Ontario Economic Outlook and Fiscal Review, legislative amendments will
be introduced to further support increased equity in taxation and in how services are paid for in
the north.
Ensuring the Ongoing Integrity of Education Property Tax Revenue The 2016 Budget announced a property tax rate calculation adjustment on education property tax
rates that reflects current and historical in‐year assessment changes, such as assessment appeal
losses. This technical adjustment ensures that municipalities and the Province are able to address
any unintended effects of specific in‐year property assessment changes, and supports the ongoing
integrity of education property tax revenue.
Consistent with the announcement in the 2016 Budget, the Province will maintain the adjustment
to education property tax rates for 2017 to support the ongoing integrity of education property
tax revenues, which help to fund Ontario’s elementary and secondary schools.
The share of education expenditures funded by property taxes has decreased from nearly
44 per cent in 1998–99 to 27 per cent currently. Going forward, the Province will continue to
monitor and review education property taxes to ensure that these taxes make an appropriate
contribution to education funding.
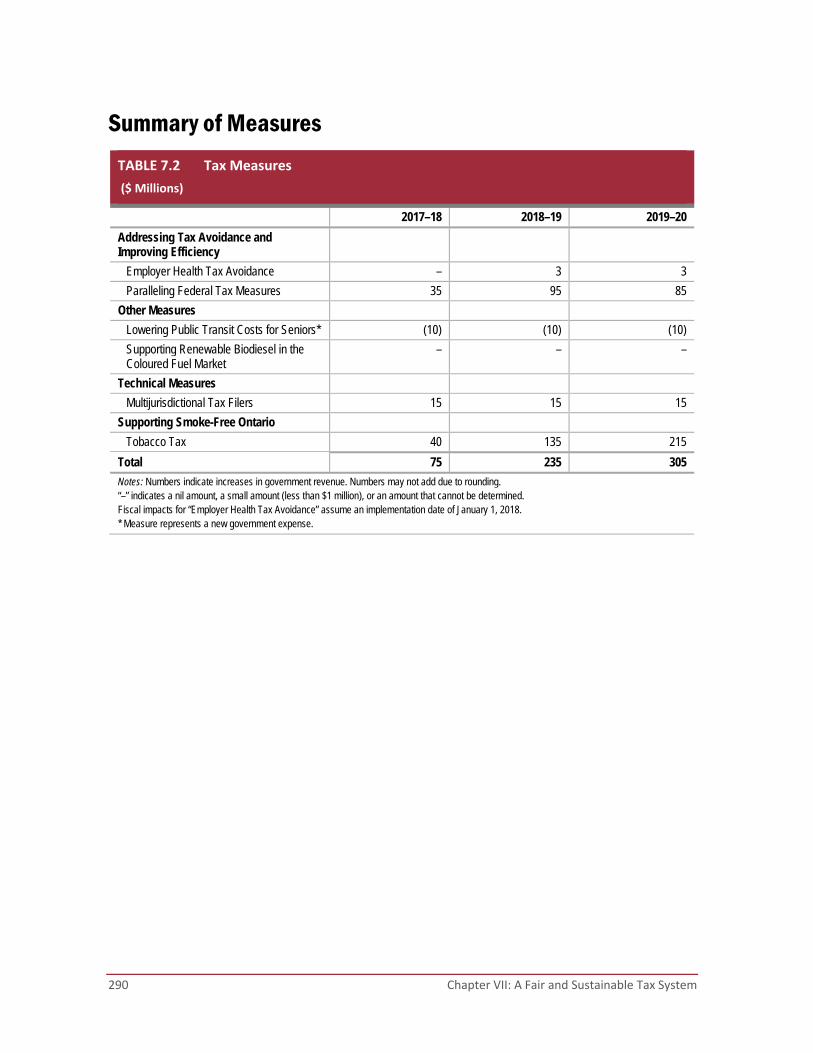
290 Chapter VII: A Fair and Sustainable Tax System
Summary of Measures
TABLE 7.2 Tax Measures
($ Millions)
2017–18 2018–19 2019–20
Addressing Tax Avoidance and Improving Efficiency
Employer Health Tax Avoidance – 3 3
Paralleling Federal Tax Measures 35 95 85
Other Measures
Lowering Public Transit Costs for Seniors* (10) (10) (10)
Supporting Renewable Biodiesel in the Coloured Fuel Market
– – –
Technical Measures
Multijurisdictional Tax Filers 15 15 15
Supporting Smoke-Free Ontario
Tobacco Tax 40 135 215
Total 75 235 305
Notes: Numbers indicate increases in government revenue. Numbers may not add due to rounding. “–” indicates a nil amount, a small amount (less than $1 million), or an amount that cannot be determined. Fiscal impacts for “Employer Health Tax Avoidance” assume an implementation date of January 1, 2018. * Measure represents a new government expense.
Section C: Strengthening Ontario’s Property Tax and Assessment System 291
CHAPTER
VII
Technical Amendments
To improve administrative effectiveness and enforcement, maintain the integrity and equity of
Ontario’s tax and revenue collection system, and enhance legislative clarity and regulatory
flexibility to preserve policy intent, amendments will be proposed to various statutes administered
by the Minister of Finance.
In addition, amendments would be proposed to other statutes to improve administrative
effectiveness and enforcement, and enhance legislative clarity and regulatory flexibility to
preserve policy intent, including:
Alcohol and Gaming Regulation and Public Protection Act, 1996
City of Toronto Act, 2006
Electricity Act, 1998
Family Law Act
Financial Administration Act
Freedom of Information and Protection of Privacy Act
Municipal Act, 2001
Municipal Freedom of Information and Protection of Privacy Act
Nursing Act, 1991
Oil, Gas and Salt Resources Act
Ontario Infrastructure and Lands Corporation Act, 2011
Wine Content and Labelling Act, 2000
292 Chapter VII: A Fair and Sustainable Tax System
Other Legislative Initiatives Additional proposed legislative initiatives include:
An amendment to the Alcohol and Gaming Regulation and Public Protection Act, 1996,
that would remove the provision in the microbrewer definition that prevents a microbrewer
from making beer for a beer manufacturer. Also proposed is a consequential amendment to
clarify that beer made by a microbrewer for a beer manufacturer is subject to the beer
manufacturer’s tax rate.
New legislation that would recognize the merger of three Ontario accounting bodies, which
now operate as Chartered Professional Accountants of Ontario (CPA Ontario). The proposed
legislation would provide the governance and oversight structure for the operation of CPA
Ontario and would repeal the statutes that governed the three previous accounting bodies:
the Certified General Accountants Act, 2010, the Certified Management Accountants Act,
2010, and the Chartered Accountants Act, 2010. Consequential amendments to various
statutes would also be made.
Amendments to update securities laws which would provide a civil cause of action for
whistleblowers where a reprisal is taken against them contrary to securities or commodity
futures law; protect Ontario Securities Commission (OSC) commissioners, management and
staff from being compelled to testify or provide evidence in civil proceedings; authorize
regulation of the operations of information processors; provide authority to require
applications to the OSC under the Ontario Business Corporations Act to be filed
electronically; ensure appropriate regulation of entities carrying on clearing agency
functions; and permit cease trade orders and provide for the mandatory recognition of
clearing agencies under the Commodity Futures Act. The government is also considering
legislative changes to protect the stability of the financial system, including expanding
information collection powers for the purpose of monitoring systemic risk.
Amendments to the Corporations Act to enable Ontario’s farm mutual insurance network’s
reinsurance company to expand and diversify its operations. The amendments, if passed,
would allow the Farm Mutual Reinsurance Plan to insure individuals and businesses in
addition to its reinsurance business.
Amendments to the Crown Employees Collective Bargaining Act, 1993 to reform the
Grievance Settlement Board (GSB) by removing vice‐chairs from the Order‐in‐Council
appointment process and replacing that appointment process with a process for the
establishment of a roster of mediator‐arbitrators to hear matters before the GSB; providing
for the remuneration of the mediator‐arbitrators on the roster at rates to be determined by
the Crown and trade unions; and other related amendments and other amendments to
reflect the current role and operational practices of the GSB.
Amendments to the Electricity Act, 1998 regarding the application of payments in lieu of
federal and provincial tax against a taxpayer’s transfer tax liability.
Section C: Strengthening Ontario’s Property Tax and Assessment System 293
CHAPTER
VII
Amendments to the Financial Administration Act to improve the administration of section
28 of the Act, including providing for potential changes to the application of the section.
Amendments to the Forest Fires Prevention Act to better enable the recovery of costs of
fires from responsible parties, including railway companies. Amendments would also
increase penalties for offences.
An amendment to the Fuel Tax Act to enable the Minister to prescribe alternative
conditions that are required to be met by registered dyer applicants.
Amendments to the Investment Management Corporation of Ontario Act, 2015 to provide
increased flexibility for a new vote allocation structure for members of the Investment
Management Corporation of Ontario and adjust term limits for its directors.
Amendments to the Land Transfer Tax Act to restrict the ability of qualifying purchasers to
claim their spouse’s interest for the first‐time homebuyers refund if the spouse is not a
Canadian citizen or permanent resident of Canada.
Amendments to the Land Transfer Tax Act to repeal all provisions relating to the Ontario
Home Ownership Savings Plan (OHOSP). This would involve the transfer of the “offence”
provision currently under the OHOSP provision to the first‐time homebuyers provision. The
fine amount under the “offence” provision would also be increased from $2,000 to $4,000.
Amendments to the Land Transfer Tax Act to introduce a provision to deem the amount of a
refund or rebate wrongly obtained to be tax payable on the date the refund or rebate was
paid to the taxpayer.
Amendments to the Ministry of Natural Resources Act to replace the adjudicative body
currently known as the Mining and Lands Commissioner, with the renamed Mining and
Lands Tribunal, and consequential amendments to other Acts.
Amendments to the Ministry of Revenue Act to provide consistency in administration,
improve efficiency and help increase recovery of money owing to Ontario. Where debtors
fail to pay or make arrangements to repay their non‐tax debts, the amendments, if passed,
would enable the Province to use enhanced collection tools, such as garnishments, warrants
and liens, against debts, including debts that existed prior to the amendments coming
into force.
Amendments to the Oil, Gas and Salt Resources Act to enable prescribed compressed air
energy storage projects and other prescribed substances that would be injected, stored or
withdrawn into underground formations to be regulated under the Act. Proposed
amendments would also modernize the liability protection offered to Crown employees and
agents of the Crown.
294 Chapter VII: A Fair and Sustainable Tax System
Amendments to the Ontario Infrastructure and Lands Corporation Act, 2011 to enable
Infrastructure Ontario to continue existing loan agreements with Local Distribution
Companies (LDCs) that remain at least 90 per cent municipally owned following an
amalgamation with other LDCs.
Amendments to the Pension Benefits Act to better facilitate mergers for those public sector
employers who would like to merge their single‐employer pension plans with an existing
jointly sponsored pension plan.
Amendments to the Pension Benefits Act relating to U.S. Steel Canada’s funding obligations
under the pension plans it sponsors and to the Pension Benefits Guarantee Fund. The
purpose of the amendments would be to facilitate the restructuring of U.S. Steel Canada
under the Companies’ Creditors Arrangement Act (Canada) to ensure the best possible
outcome for pension members and other stakeholders under the circumstances.
Amendments to the Registered Insurance Brokers Act to ensure that it meets current
standards and adequately protects Ontario consumers, including requiring disciplinary
hearings to be open to the public; allowing for the continuation of disciplinary processes
when a member resigns; and strengthening enforcement, including enabling the Registered
Insurance Brokers of Ontario to impose administrative penalties.
An amendment to clarify the ability of a divorced spouse to qualify for financial support
from a former spouse’s estate under the Succession Law Reform Act following recent
amendments made by the All Families Are Equal Act (Parentage and Related Registrations
Statute Law Amendment), 2016.
An amendment to the Taxation Act, 2007 to parallel changes made to the federal small
business deduction that would reduce a company’s Ontario business limit by the same
amount the federal business limit is reduced. This would apply if the company assigned any
portion of its business limit to another company under certain circumstances.
An amendment to the Taxation Act, 2007 to list excluded productions for the Ontario
Computer Animation and Special Effects Tax Credit directly in legislation, to maintain the
Province’s long‐standing treatment of talk shows as ineligible for the provincial film and
television tax credits, as announced on January 11, 2017.
Amendments to the Workplace Safety and Insurance Act, 1997 with respect to work‐related
chronic mental stress, worker benefits and indexation, and Workplace Safety and Insurance
Board operational compliance and policy‐making authority.
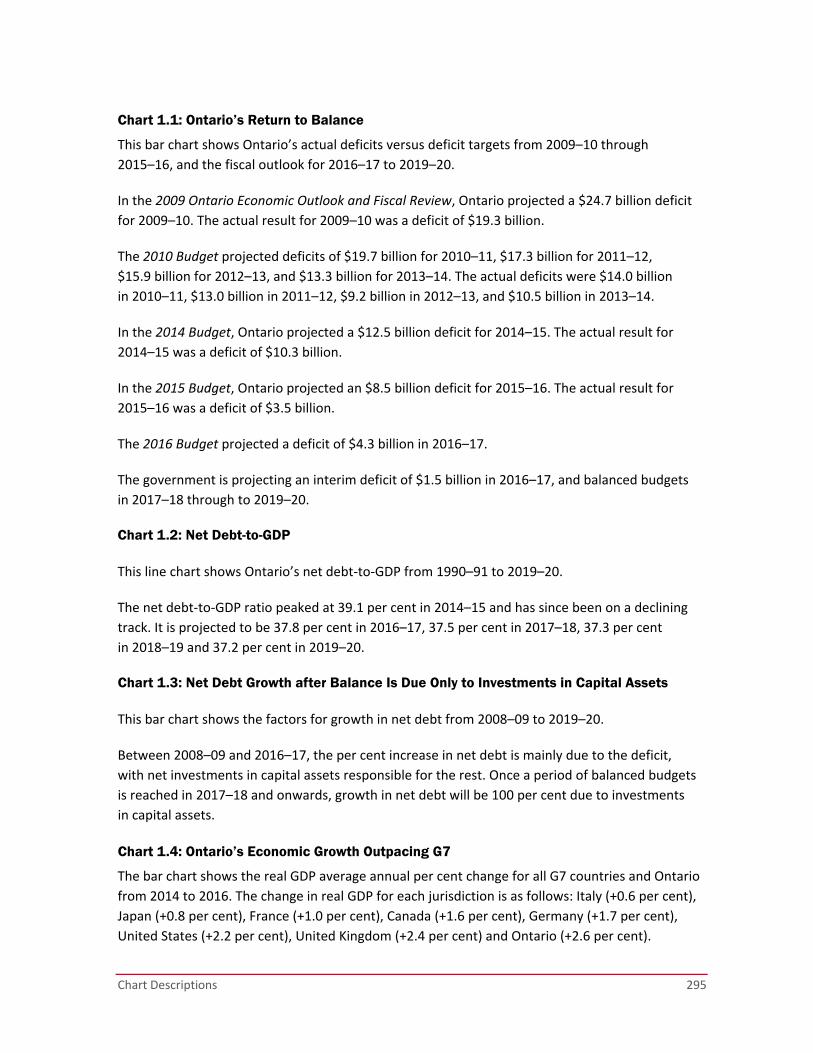
Chart Descriptions 295
Chart 1.1: Ontario’s Return to Balance
This bar chart shows Ontario’s actual deficits versus deficit targets from 2009–10 through
2015–16, and the fiscal outlook for 2016–17 to 2019–20.
In the 2009 Ontario Economic Outlook and Fiscal Review, Ontario projected a $24.7 billion deficit
for 2009–10. The actual result for 2009–10 was a deficit of $19.3 billion.
The 2010 Budget projected deficits of $19.7 billion for 2010–11, $17.3 billion for 2011–12,
$15.9 billion for 2012–13, and $13.3 billion for 2013–14. The actual deficits were $14.0 billion
in 2010–11, $13.0 billion in 2011–12, $9.2 billion in 2012–13, and $10.5 billion in 2013–14.
In the 2014 Budget, Ontario projected a $12.5 billion deficit for 2014–15. The actual result for
2014–15 was a deficit of $10.3 billion.
In the 2015 Budget, Ontario projected an $8.5 billion deficit for 2015–16. The actual result for
2015–16 was a deficit of $3.5 billion.
The 2016 Budget projected a deficit of $4.3 billion in 2016–17.
The government is projecting an interim deficit of $1.5 billion in 2016–17, and balanced budgets
in 2017–18 through to 2019–20.
Chart 1.2: Net Debt-to-GDP
This line chart shows Ontario’s net debt‐to‐GDP from 1990–91 to 2019–20.
The net debt‐to‐GDP ratio peaked at 39.1 per cent in 2014–15 and has since been on a declining
track. It is projected to be 37.8 per cent in 2016–17, 37.5 per cent in 2017–18, 37.3 per cent
in 2018–19 and 37.2 per cent in 2019–20.
Chart 1.3: Net Debt Growth after Balance Is Due Only to Investments in Capital Assets
This bar chart shows the factors for growth in net debt from 2008–09 to 2019–20.
Between 2008–09 and 2016–17, the per cent increase in net debt is mainly due to the deficit,
with net investments in capital assets responsible for the rest. Once a period of balanced budgets
is reached in 2017–18 and onwards, growth in net debt will be 100 per cent due to investments
in capital assets.
Chart 1.4: Ontario’s Economic Growth Outpacing G7
The bar chart shows the real GDP average annual per cent change for all G7 countries and Ontario
from 2014 to 2016. The change in real GDP for each jurisdiction is as follows: Italy (+0.6 per cent),
Japan (+0.8 per cent), France (+1.0 per cent), Canada (+1.6 per cent), Germany (+1.7 per cent),
United States (+2.2 per cent), United Kingdom (+2.4 per cent) and Ontario (+2.6 per cent).

296 Chart Descriptions
Chart 1.5: Employment Gains since June 2009 Concentrated in Full-Time and Private-Sector Positions
The line chart shows employment from 2008 to 2017 in Ontario. Since the recessionary low in June
2009, Ontario has added nearly 700,000 jobs, the majority of which are full‐time and in the private
sector. The pie charts provide greater detail. For example, since the recessionary low in June 2009,
over 676,800 of the jobs created (98 per cent) were full‐time, 503,600 positions (73 per cent) were
added in the private sector and 538,900 jobs (78 per cent) were created in industries that pay
above‐average wages.
Chart 1.6: Ontario Is a Key Export Market for the United States
This graphic highlights the U.S. states for which Ontario was the number one and number two
market for international merchandise exports in 2016. Ontario was the number one export market
for the following 20 states: Alabama, Arkansas, Georgia, Indiana, Kentucky, Maryland, Michigan,
Mississippi, Missouri, New Jersey, New York, North Carolina, North Dakota, Ohio, Oklahoma,
Pennsylvania, Tennessee, Virginia, West Virginia and Wisconsin. In 2016, Ontario was the number
two export market for the following states: Colorado, Illinois, Iowa, Kansas, Minnesota, Nevada,
Rhode Island and South Dakota.
Chart 1.7: Ontario’s Internationally Competitive Corporate Income Tax Rate
This bar chart shows that in 2017, Ontario’s combined federal–provincial general Corporate
Income Tax (CIT) rate of 26.5 per cent is well below the average U.S. federal–state CIT rate of
38.9 per cent and lower than the average CIT rate of G7 member countries of 30.8 per cent.
Ontario’s combined federal–provincial general CIT rate is also lower than the average of Canadian
provinces at 27.0 per cent, and competitive with the average CIT rate of Organisation for Economic
Co‐operation and Development (OECD) countries at 24.6 per cent.
Chart 1.8: Ontario’s Growth to Continue to Outpace Canada
The bar chart shows the real GDP per cent change for Ontario and Canada from 2003 to 2020.
From 2003 to 2013, Ontario’s average annual growth of 1.3 per cent lagged Canada’s average of
1.9 per cent. From 2014 to 2016, Ontario’s estimated average annual growth of 2.6 per cent
surpassed the national average of 1.6 per cent. Based on the private sector average, Ontario’s
projected average annual growth of 2.1 per cent from 2017 to 2020 is expected to continue
to outpace projected Canadian growth of 1.9 per cent over the period.
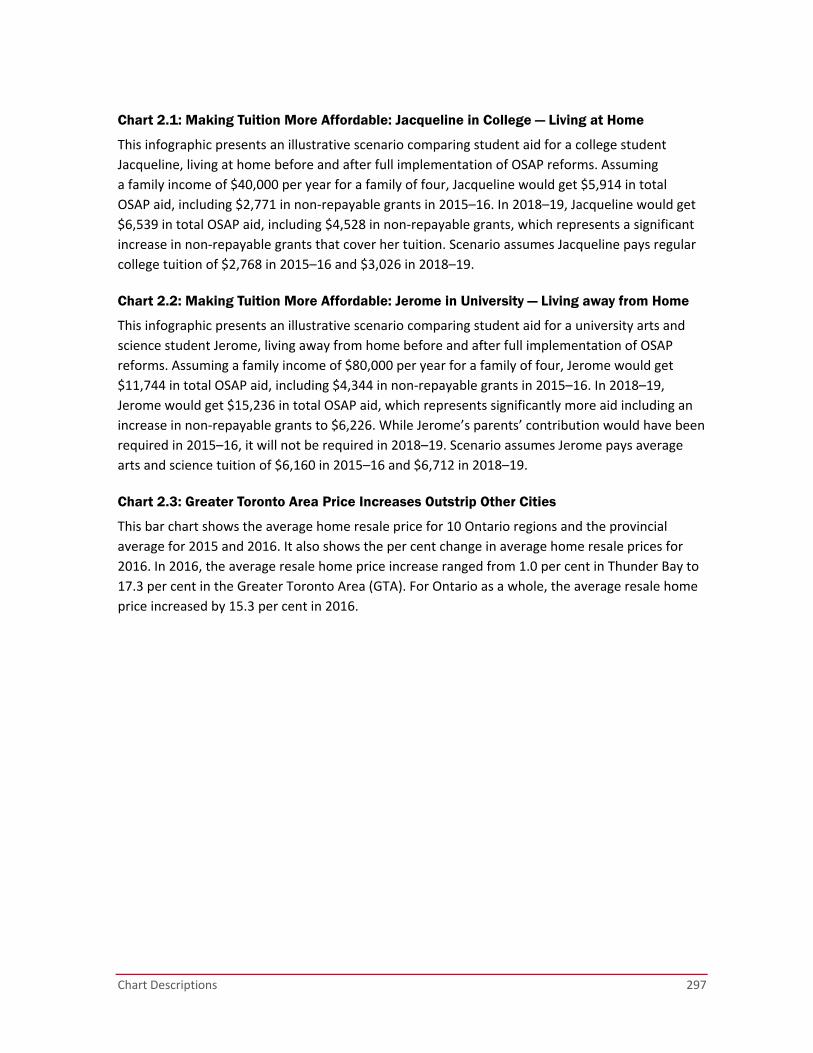
Chart Descriptions 297
Chart 2.1: Making Tuition More Affordable: Jacqueline in College — Living at Home
This infographic presents an illustrative scenario comparing student aid for a college student
Jacqueline, living at home before and after full implementation of OSAP reforms. Assuming
a family income of $40,000 per year for a family of four, Jacqueline would get $5,914 in total
OSAP aid, including $2,771 in non‐repayable grants in 2015–16. In 2018–19, Jacqueline would get
$6,539 in total OSAP aid, including $4,528 in non‐repayable grants, which represents a significant
increase in non‐repayable grants that cover her tuition. Scenario assumes Jacqueline pays regular
college tuition of $2,768 in 2015–16 and $3,026 in 2018–19.
Chart 2.2: Making Tuition More Affordable: Jerome in University — Living away from Home
This infographic presents an illustrative scenario comparing student aid for a university arts and
science student Jerome, living away from home before and after full implementation of OSAP
reforms. Assuming a family income of $80,000 per year for a family of four, Jerome would get
$11,744 in total OSAP aid, including $4,344 in non‐repayable grants in 2015–16. In 2018–19,
Jerome would get $15,236 in total OSAP aid, which represents significantly more aid including an
increase in non‐repayable grants to $6,226. While Jerome’s parents’ contribution would have been
required in 2015–16, it will not be required in 2018–19. Scenario assumes Jerome pays average
arts and science tuition of $6,160 in 2015–16 and $6,712 in 2018–19.
Chart 2.3: Greater Toronto Area Price Increases Outstrip Other Cities
This bar chart shows the average home resale price for 10 Ontario regions and the provincial
average for 2015 and 2016. It also shows the per cent change in average home resale prices for
2016. In 2016, the average resale home price increase ranged from 1.0 per cent in Thunder Bay to
17.3 per cent in the Greater Toronto Area (GTA). For Ontario as a whole, the average resale home
price increased by 15.3 per cent in 2016.
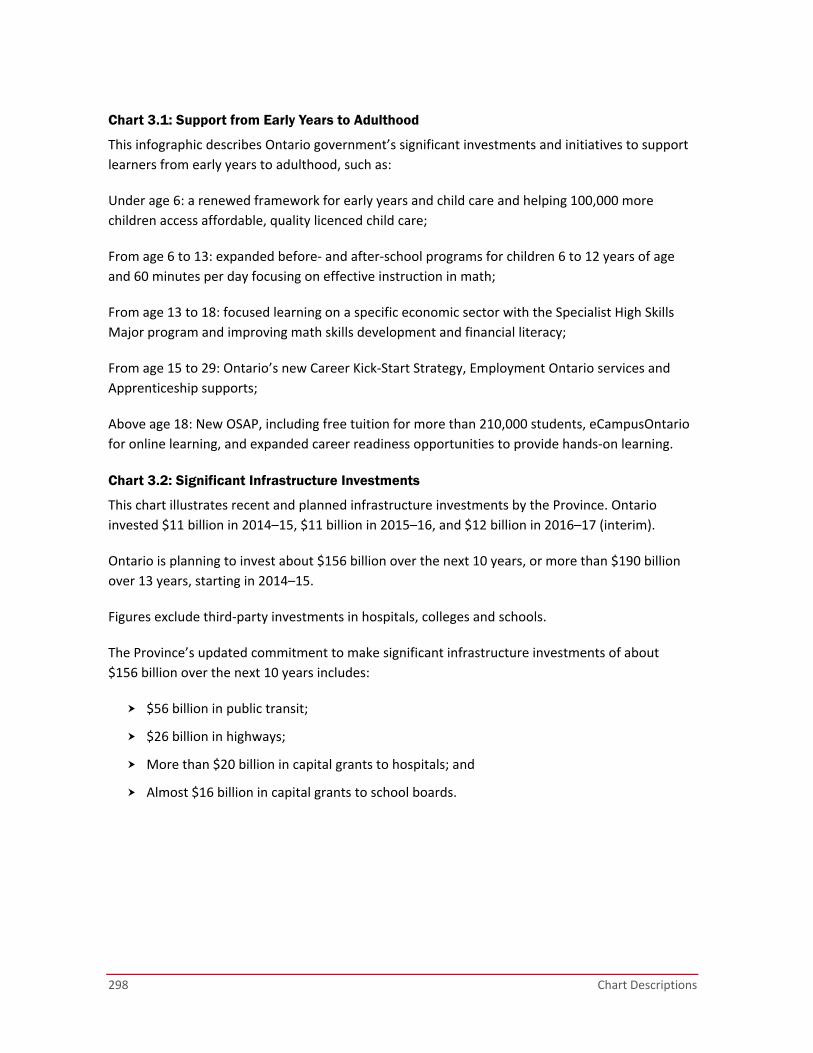
298 Chart Descriptions
Chart 3.1: Support from Early Years to Adulthood
This infographic describes Ontario government’s significant investments and initiatives to support
learners from early years to adulthood, such as:
Under age 6: a renewed framework for early years and child care and helping 100,000 more
children access affordable, quality licenced child care;
From age 6 to 13: expanded before‐ and after‐school programs for children 6 to 12 years of age
and 60 minutes per day focusing on effective instruction in math;
From age 13 to 18: focused learning on a specific economic sector with the Specialist High Skills
Major program and improving math skills development and financial literacy;
From age 15 to 29: Ontario’s new Career Kick‐Start Strategy, Employment Ontario services and
Apprenticeship supports;
Above age 18: New OSAP, including free tuition for more than 210,000 students, eCampusOntario
for online learning, and expanded career readiness opportunities to provide hands‐on learning.
Chart 3.2: Significant Infrastructure Investments
This chart illustrates recent and planned infrastructure investments by the Province. Ontario
invested $11 billion in 2014–15, $11 billion in 2015–16, and $12 billion in 2016–17 (interim).
Ontario is planning to invest about $156 billion over the next 10 years, or more than $190 billion
over 13 years, starting in 2014–15.
Figures exclude third‐party investments in hospitals, colleges and schools.
The Province’s updated commitment to make significant infrastructure investments of about
$156 billion over the next 10 years includes:
$56 billion in public transit;
$26 billion in highways;
More than $20 billion in capital grants to hospitals; and
Almost $16 billion in capital grants to school boards.

Chart Descriptions 299
Chart 3.3: Economic Impact of the Ontario Government’s Infrastructure Plan
This chart illustrates the long‐term economic return resulting from the Province’s 10‐year
infrastructure plan investments from 2016–17 to 2025–26 and ongoing annual post‐plan spending
by the government to maintain service levels of assets built during the 10‐year plan out to 2050.
The impacts are measured in 2015 constant dollars and on a discounted net present value to
ensure comparability over the entire 2016 to 2050 period. Ontario real GDP is estimated to
increase by up to $925 billion over the long term as a result of total infrastructure spending of
$155 billion — which reflects both Ontario’s Infrastructure Plan spending from 2016–17 to
2025–26, as well as ongoing post‐plan spending to maintain service levels of the infrastructure
assets built during the 10‐year plan. This impact estimate assumes businesses are able to obtain
the full productivity benefits resulting from the infrastructure plan.
Chart 3.4: Ontario among the Leaders in Venture Capital Investment
This chart shows the total venture capital (VC) invested in Ontario ($1.8 billion) in 2016. It also
shows total VC investment for the provinces of Quebec ($1.1 billion) and British Columbia
($478 million), and a roll‐up figure for the rest of Canada ($270 million). The chart also includes
VC investment for several states from the United States, including Texas ($1.7 billion), Florida
($1.6 billion), Washington ($1.2 billion) and Illinois ($1.2 billion).
Chart 3.5: Reducing Red Tape for Ontario Businesses is a Key Element of the Government’s Plan to Create Jobs and Grow the Economy
This graphic illustrates the government’s burden reduction initiatives including:
The government‘s introduction of the Burden Reduction Act, 2017, which makes 150
changes to statutes to save businesses up to $31 million and help them avoid costs of up to
$200 million, and
Ontario’s Red Tape Challenge online consultation tool, which over the next two years will
make it easier for businesses to operate in six business sectors: auto parts manufacturing,
food processing, financial services, mining, chemical manufacturing and forestry.
In addition, the Canadian Federation of Independent Business (CFIB) has nominated Ontario for
the Golden Scissors Award three years in a row, recognizing the efforts the Province has taken to
make it an easier place to do business.
Chart 3.6: Ontario’s Exports Expanding to New Markets
The double bar chart shows the share of Ontario’s merchandise exports to the United States,
European Union, Hong Kong, Japan, China and Mexico received in 2006 and 2016. In 2006, the
share of total exports to each country was: 86.5 per cent to the United States, 6.2 per cent to the
European Union, 1.1 per cent to Mexico, 0.7 per cent to China, 0.6 to Japan and 0.3 per cent to
Hong Kong. In 2016, the share of total exports to each country was: 80.9 per cent to the United
States, 9.7 per cent to the European Union, 1.7 per cent to Mexico, 1.4 per cent to China, 0.9 to
Japan, and 0.5 per cent to Hong Kong.

300 Chart Descriptions
Chart 3.7: Planned Use of Carbon Allowance Proceeds
This graphic illustrates how carbon allowance proceeds will be invested.
Proceeds are projected to be $1.8 billion in 2017–18 and $1.4 billion annually, starting in 2018–19.
Consistent with legislation, all proceeds from the quarterly auctions of emissions allowances will
be allocated to initiatives that are reasonably likely to reduce or support the reduction of GHG
emissions.
The priority investment areas that will support the reduction of GHG emissions include:
Supporting homes and businesses with a planned investment of approximately $800 million
in 2017–18;
Promoting electric vehicles with a planned investment of approximately $90 million
in 2017–18;
Engaging governments and strengthening partnerships with a planned investment of
approximately $55 million in 2017–18;
Modernizing transit, active transportation with a planned investment of approximately
$420 million in 2017–18;
Enhancing research and development with a planned investment of approximately
$20 million in 2017–18;
Preserving agriculture, lands and forests with a planned investment of approximately
$5 million in 2017–18; and
Implementing Green Investment Fund initiatives as well as other investments of
approximately $410 million in 2017–18.
Planned investments are subject to the availability of carbon allowance proceeds.
Chart 3.8: Retirement Income from the Canada Pension Plan Enhancement
This chart illustrates the amount of future retirement income that a worker will receive from the
Canada Pension Plan (CPP) enhancement for a given level of daily CPP contributions.
A worker earning $40,000 annually will contribute $1 per day to receive an extra $3,222 annually
in retirement income from the CPP enhancement. This will be in addition to the $9,671 annually
that the worker receives from the current CPP.
The benefit calculation assumes that the worker will pay contributions on steady career earnings
of $40,000 annually (before tax) for at least 40 years, and that the worker will begin collecting
benefits at age 65. All figures are rounded and expressed in 2017 dollars.
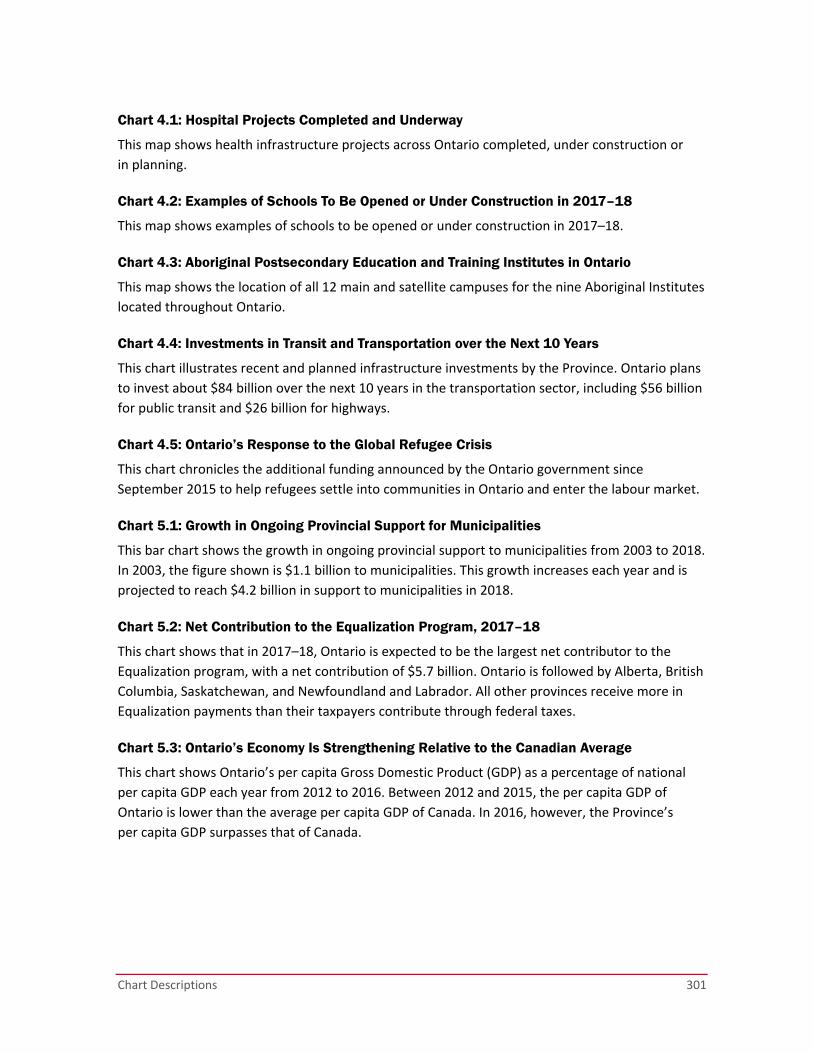
Chart Descriptions 301
Chart 4.1: Hospital Projects Completed and Underway
This map shows health infrastructure projects across Ontario completed, under construction or
in planning.
Chart 4.2: Examples of Schools To Be Opened or Under Construction in 2017–18
This map shows examples of schools to be opened or under construction in 2017–18.
Chart 4.3: Aboriginal Postsecondary Education and Training Institutes in Ontario
This map shows the location of all 12 main and satellite campuses for the nine Aboriginal Institutes
located throughout Ontario.
Chart 4.4: Investments in Transit and Transportation over the Next 10 Years
This chart illustrates recent and planned infrastructure investments by the Province. Ontario plans
to invest about $84 billion over the next 10 years in the transportation sector, including $56 billion
for public transit and $26 billion for highways.
Chart 4.5: Ontario’s Response to the Global Refugee Crisis
This chart chronicles the additional funding announced by the Ontario government since
September 2015 to help refugees settle into communities in Ontario and enter the labour market.
Chart 5.1: Growth in Ongoing Provincial Support for Municipalities
This bar chart shows the growth in ongoing provincial support to municipalities from 2003 to 2018.
In 2003, the figure shown is $1.1 billion to municipalities. This growth increases each year and is
projected to reach $4.2 billion in support to municipalities in 2018.
Chart 5.2: Net Contribution to the Equalization Program, 2017–18
This chart shows that in 2017–18, Ontario is expected to be the largest net contributor to the
Equalization program, with a net contribution of $5.7 billion. Ontario is followed by Alberta, British
Columbia, Saskatchewan, and Newfoundland and Labrador. All other provinces receive more in
Equalization payments than their taxpayers contribute through federal taxes.
Chart 5.3: Ontario’s Economy Is Strengthening Relative to the Canadian Average
This chart shows Ontario’s per capita Gross Domestic Product (GDP) as a percentage of national
per capita GDP each year from 2012 to 2016. Between 2012 and 2015, the per capita GDP of
Ontario is lower than the average per capita GDP of Canada. In 2016, however, the Province’s
per capita GDP surpasses that of Canada.
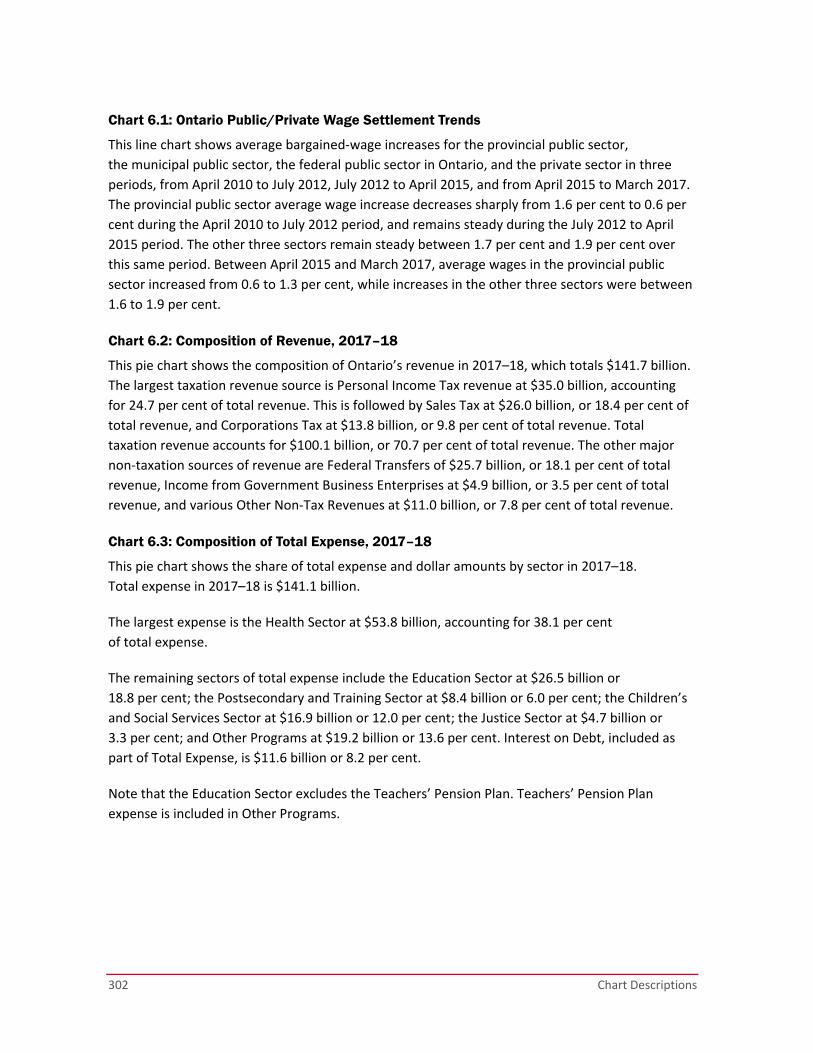
302 Chart Descriptions
Chart 6.1: Ontario Public/Private Wage Settlement Trends
This line chart shows average bargained‐wage increases for the provincial public sector,
the municipal public sector, the federal public sector in Ontario, and the private sector in three
periods, from April 2010 to July 2012, July 2012 to April 2015, and from April 2015 to March 2017.
The provincial public sector average wage increase decreases sharply from 1.6 per cent to 0.6 per
cent during the April 2010 to July 2012 period, and remains steady during the July 2012 to April
2015 period. The other three sectors remain steady between 1.7 per cent and 1.9 per cent over
this same period. Between April 2015 and March 2017, average wages in the provincial public
sector increased from 0.6 to 1.3 per cent, while increases in the other three sectors were between
1.6 to 1.9 per cent.
Chart 6.2: Composition of Revenue, 2017–18
This pie chart shows the composition of Ontario’s revenue in 2017–18, which totals $141.7 billion.
The largest taxation revenue source is Personal Income Tax revenue at $35.0 billion, accounting
for 24.7 per cent of total revenue. This is followed by Sales Tax at $26.0 billion, or 18.4 per cent of
total revenue, and Corporations Tax at $13.8 billion, or 9.8 per cent of total revenue. Total
taxation revenue accounts for $100.1 billion, or 70.7 per cent of total revenue. The other major
non‐taxation sources of revenue are Federal Transfers of $25.7 billion, or 18.1 per cent of total
revenue, Income from Government Business Enterprises at $4.9 billion, or 3.5 per cent of total
revenue, and various Other Non‐Tax Revenues at $11.0 billion, or 7.8 per cent of total revenue.
Chart 6.3: Composition of Total Expense, 2017–18
This pie chart shows the share of total expense and dollar amounts by sector in 2017–18.
Total expense in 2017–18 is $141.1 billion.
The largest expense is the Health Sector at $53.8 billion, accounting for 38.1 per cent
of total expense.
The remaining sectors of total expense include the Education Sector at $26.5 billion or
18.8 per cent; the Postsecondary and Training Sector at $8.4 billion or 6.0 per cent; the Children’s
and Social Services Sector at $16.9 billion or 12.0 per cent; the Justice Sector at $4.7 billion or
3.3 per cent; and Other Programs at $19.2 billion or 13.6 per cent. Interest on Debt, included as
part of Total Expense, is $11.6 billion or 8.2 per cent.
Note that the Education Sector excludes the Teachers’ Pension Plan. Teachers’ Pension Plan
expense is included in Other Programs.
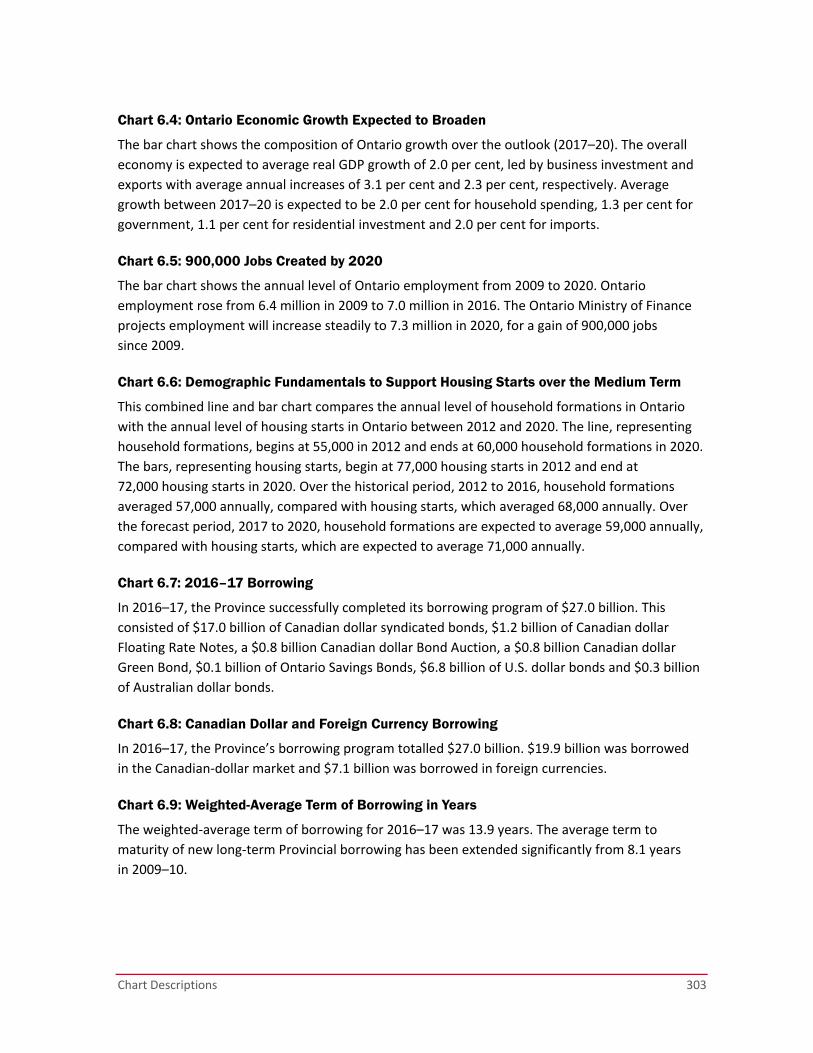
Chart Descriptions 303
Chart 6.4: Ontario Economic Growth Expected to Broaden
The bar chart shows the composition of Ontario growth over the outlook (2017–20). The overall
economy is expected to average real GDP growth of 2.0 per cent, led by business investment and
exports with average annual increases of 3.1 per cent and 2.3 per cent, respectively. Average
growth between 2017–20 is expected to be 2.0 per cent for household spending, 1.3 per cent for
government, 1.1 per cent for residential investment and 2.0 per cent for imports.
Chart 6.5: 900,000 Jobs Created by 2020
The bar chart shows the annual level of Ontario employment from 2009 to 2020. Ontario
employment rose from 6.4 million in 2009 to 7.0 million in 2016. The Ontario Ministry of Finance
projects employment will increase steadily to 7.3 million in 2020, for a gain of 900,000 jobs
since 2009.
Chart 6.6: Demographic Fundamentals to Support Housing Starts over the Medium Term
This combined line and bar chart compares the annual level of household formations in Ontario
with the annual level of housing starts in Ontario between 2012 and 2020. The line, representing
household formations, begins at 55,000 in 2012 and ends at 60,000 household formations in 2020.
The bars, representing housing starts, begin at 77,000 housing starts in 2012 and end at
72,000 housing starts in 2020. Over the historical period, 2012 to 2016, household formations
averaged 57,000 annually, compared with housing starts, which averaged 68,000 annually. Over
the forecast period, 2017 to 2020, household formations are expected to average 59,000 annually,
compared with housing starts, which are expected to average 71,000 annually.
Chart 6.7: 2016–17 Borrowing
In 2016–17, the Province successfully completed its borrowing program of $27.0 billion. This
consisted of $17.0 billion of Canadian dollar syndicated bonds, $1.2 billion of Canadian dollar
Floating Rate Notes, a $0.8 billion Canadian dollar Bond Auction, a $0.8 billion Canadian dollar
Green Bond, $0.1 billion of Ontario Savings Bonds, $6.8 billion of U.S. dollar bonds and $0.3 billion
of Australian dollar bonds.
Chart 6.8: Canadian Dollar and Foreign Currency Borrowing
In 2016–17, the Province’s borrowing program totalled $27.0 billion. $19.9 billion was borrowed
in the Canadian‐dollar market and $7.1 billion was borrowed in foreign currencies.
Chart 6.9: Weighted-Average Term of Borrowing in Years
The weighted‐average term of borrowing for 2016–17 was 13.9 years. The average term to
maturity of new long‐term Provincial borrowing has been extended significantly from 8.1 years
in 2009–10.

304 Chart Descriptions
Chart 6.10: Interest on Debt: Budget Forecast versus Actual
Interest on debt expense in 2016–17 is now forecast to be $4.7 billion lower than the forecast
contained in the 2010 Budget. Interest on debt savings over the period to balance now total
$24.0 billion relative to the 2010 Budget forecast.
Chart 6.11: Interest on Debt-to-Revenue Ratio
Interest on debt‐to‐revenue is forecast to be 8.4 per cent for 2016–17. This ratio is lower than it
was in the 1990s and is forecast to remain lower through the outlook period in 2019–20.
Chart 6.12: Average Unrestricted Liquid Reserve Levels
As of March 31, 2017, the average unrestricted liquid reserve for 2016–17 was $20.9 billion.
Chart 6.13: Net Debt-to-GDP and Accumulated Deficit-to-GDP
Ontario’s net debt‐to‐GDP ratio is forecast at 37.8 per cent in 2016–17, 37.5 per cent in 2017–18,
37.3 per cent in 2018–19, and 37.2 per cent in 2019–20.
Chart 6.14: Factors for Growth in Net Debt
About 61 per cent of the increase in net debt from 2008–09 to 2016–17 is due to the deficit, with
investments in capital assets responsible for the balance. The balanced budget from 2017–18
onwards will ensure that the increase in net debt is limited to the difference between cash
investments in capital assets and amortization, which is a non‐cash expense and as such does not
represent cash outflows.
Chart 6.15: Total Debt Composition as of March 31, 2017
As of March 31, 2017, the Province’s total debt is projected to be $332.4 billion, and consists of
$249.7 billion of Canadian dollar public bonds, $11.6 billion of Canadian dollar non‐public debt,
$16.0 billion of treasury bills, $4.9 billion of U.S.‐dollar commercial paper, and $50.1 billion of
foreign currency bonds.
Chart 6.16: Effective Interest Rate (Weighted Average) on Total Debt
As of March 31, 2017, the effective interest rate (calculated as a weighted average) is forecast
to be 3.5 per cent on the Province’s total debt, compared to the 3.6 per cent in 2015–16.
The effective interest rate has been steadily decreasing from 10.9 per cent in 1990–91.

Chart Descriptions 305
Chart 6.17: Net Interest Rate Resetting and Foreign Exchange Exposure (as a Percentage of Debt Issued for Provincial Purposes)
The Province’s interim net interest rate resetting exposure, calculated as a percentage of the debt
issued for Provincial purposes, was 11.3 per cent as of February 28, 2017. This compares to the
10.9 per cent as of March 31, 2016 and 11.0 per cent as of March 31, 2015. The interest rate
exposure limit is set at 35 per cent. The Province’s interim foreign exchange exposure, calculated
as a percentage of the debt issued for Provincial purposes, was 0.2 per cent as of
February 28, 2017. This is lower than the 0.3 per cent as of March 31, 2016 and 0.3 per cent as of
March 31, 2015. The foreign exchange exposure limit is set at 5 per cent.

ISBN 978-1-4868-0080-3 (PRINT)
ISBN 978-1-4868-0081-0 (HTML)
ISBN 978-1-4868-0082-7 (PDF)
© Queen’s Printer for Ontario, 2017