2017 OECD ECONOMIC SURVEY OF SWITZERLAND · 2017 OECD ECONOMIC SURVEY OF SWITZERLAND ... C FIN SVK...
35
http://www.oecd.org/eco/surveys/economic-survey-switzerland.htm 2017 OECD ECONOMIC SURVEY OF SWITZERLAND Boosting productivity and meeting skills needs Bern, 14 November 2017 @OECD @OECDeconomy
Transcript of 2017 OECD ECONOMIC SURVEY OF SWITZERLAND · 2017 OECD ECONOMIC SURVEY OF SWITZERLAND ... C FIN SVK...

http://www.oecd.org/eco/surveys/economic-survey-switzerland.htm
2017 OECD ECONOMIC
SURVEY OF SWITZERLAND
Boosting productivity and meeting skills needs
Bern, 14 November 2017
@OECD
@OECDeconomy

2
Living standards are high
OECD Better Life Index, 2017
Index scale, 0 (lowest) to 10 (best)
Note: For each dimension indicators are normalised and averaged.
Source: OECD, Better Life Index.
0
2
4
6
8
10Income and wealth
Jobs and earnings
Housing
Work and life balance
Health status
Education and skills
Social connections
Environmental quality
Personal security
Subjective well-being
Switzerland
OECD

3
The economy is growing but only slowly
GDP growth
Source: SECO.
Jul-12
Aug-12
Sep-12
Oct-12
Nov-12
Dec-12
Jan-13
Feb-13
Mar-13
Apr-13
May-13
Jun-13
Jul-13
Aug-13
Sep-13
Oct-13
Nov-13
Dec-13
Jan-14
Feb-14
Mar-14
Apr-14
May-14
Jun-14
Jul-14
Aug-14
Sep-14
Oct-14
Nov-14
Dec-14
Jan-15
-4
-2
0
2
4
6
2006 2008 2010 2012 2014 2016
% y-o-y

4
Employment is high
Source: OECD, Labour Force Statistics database.
Employment-to-population ratio
50
55
60
65
70
75
80
85
2010 2011 2012 2013 2014 2015 2016 2017
Switzerland OECD%

5
Productivity has stalled
Source: OECD, OECD Economic Outlook 102 database, preliminary version.
Trend labour productivity growth
2000 2002 2004 2006 2008 2010 2012 2014 20160.0
0.5
1.0
1.5
2.0
Switzerland OECD
%

-30
-20
-10
0
10
20
30
40
50
GR
C
FIN
SV
K
NLD
LVA
CZ
E
DN
K
HU
N
ITA
ES
T
ES
P
BE
L
DE
U
EU
15
SV
N
IRL
PO
L
PR
T
AU
T
GB
R
FR
A
NO
R
CH
E
SW
E
ISL
LUX
High skill Middle skill Low skill
% pts
6
The demand for skilled workers has been
strong
Contributions to changes in total employment growth over 2000-16
Note: Countries are ordered by the contribution of high-skill employment
Source: Eurostat.

Entrenching the expansion
7

8
Fiscal policy is sound and public debt low
Gross general government debt, % of GDP
Note: The shaded area denotes the 25th to 75th percentile range for OECD countries. OECD is an
unweighted average of data for available countries.
Source: OECD, OECD Economic Outlook 102 database, preliminary version.
0
20
40
60
80
100
120
1995 1997 1999 2001 2003 2005 2007 2009 2011 2013 2015
Switzerland OECD

9
Unconventional monetary policy has
supported growth
Source: Swiss National Bank; Thomson Reuters Datastream; OECD, OECD Economic Outlook 102 database, preliminary version.
Interest rates SNB’s foreign exchange reserves
0
25
50
75
100
125
150
175
200
225
2006 2008 2010 2012 2014 2016
% of imports
CHF/EURceiling
-2
-1
0
1
2
3
4
2006 2008 2010 2012 2014 2016
SNB target range
3-month, CHF LIBOR
%

10
Low interest rates increase risks
Source: OECD, House Price database.
House prices, 2010 = 100
80
90
100
110
120
130
2006 2008 2010 2012 2014 2016
Ratio to consumer prices
Ratio to average household income

11
Household credit is high
Source: OECD, Vulnerability Indicators database.
Household credit, % of GDP, 2017 Q1
0
20
40
60
80
100
120
140
ME
X
TU
R
HU
N
CZ
E
PO
L
ISR
ITA
CH
L
IRL
AU
T
DE
U
JPN
FR
A
BE
L
LUX
GR
C
ES
P
FIN
PR
T
US
A
SW
E
GB
R
KO
R
NZ
L
CA
N
NO
R
NLD
DN
K
AU
S
CH
E

12
Age-related public spending will become
a fiscal burden
Long-term projections for age-related spending, % of GDP
Source: Federal Department of Finance (2016), Report on the Long-term Sustainability of Public Finances in Switzerland.
9
10
11
12
13
14
15
0
5
10
15
20
25
2013 2030 2045
By type of spending
Long-term care Health care
Pensions (AHV/IV) Education
0
5
10
15
20
25
2013 2030 2045
By level of government
Communes Cantons
Social security Confederation

13
The current account surplus is large
Current account balance in OECD countries with a surplus, 2016
Source: OECD, OECD Economic Outlook 102 database, preliminary version.
0
0
0
0
0
0
0
0
0
0
0
0
0
0
0
0
0
0
0
0
0
0
0
0
1
2
3
4
5
6
7
8
9
10
PR
T
CZ
E
LVA
AU
T
ES
T
ES
P
ITA
IRL
ISR
JPN
SW
E
LUX
NO
R
SV
N
HU
N
KO
R
ISL
DN
K
DE
U
NLD
CH
E
% of GDP
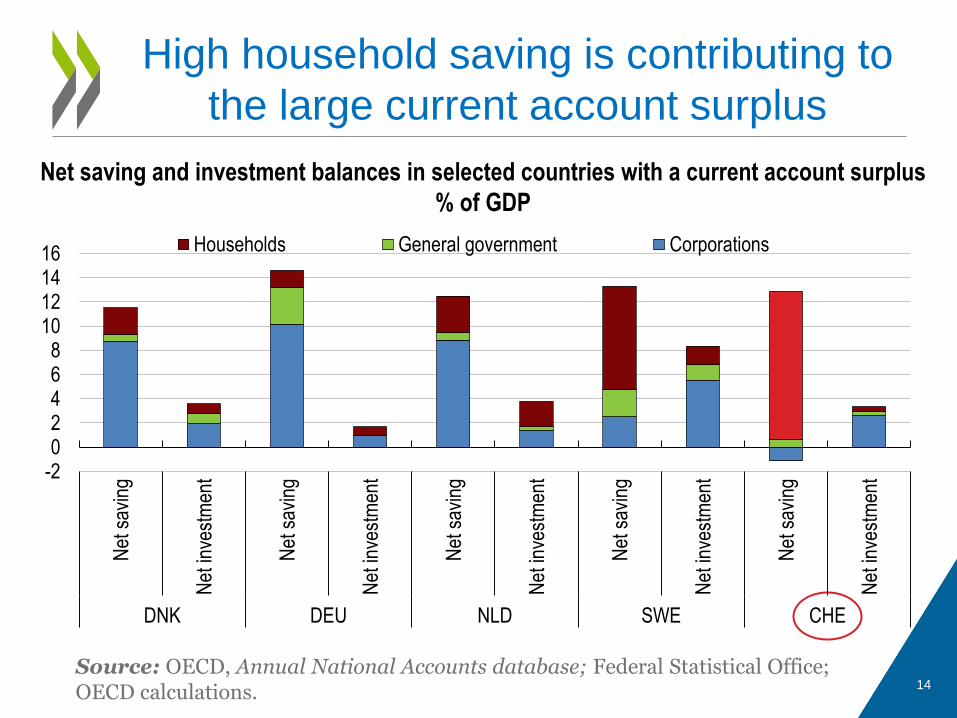
14
High household saving is contributing to
the large current account surplus
Net saving and investment balances in selected countries with a current account surplus
% of GDP
Source: OECD, Annual National Accounts database; Federal Statistical Office; OECD calculations.
-202468
10121416
Net
sav
ing
Net
inve
stm
ent
Net
sav
ing
Net
inve
stm
ent
Net
sav
ing
Net
inve
stm
ent
Net
sav
ing
Net
inve
stm
ent
Net
sav
ing
Net
inve
stm
ent
DNK DEU NLD SWE CHE
Households General government Corporations

To support growth: Avoid persistent budget underspending through better
co-ordinating procedures at federal and sub-national levels.
Reduce agricultural subsidies and pursue efficiency gains in public spending to free up funds for measures that enhance growth and inclusiveness.
To reduce risks: Eliminate remaining explicit cantonal government
guarantees to their public banks.
Establish a formal framework for setting mortgage lending limits that takes affordability into account and is enforced on a comply-or-explain basis.
15
Key fiscal and financial recommendations

To address ageing-related challenges: Fix the retirement age at 65 for both sexes, and
thereafter link it to life expectancy.
Increase financial incentives to work longer before retirement.
Promote programmes to lengthen healthy working lives, including preventative health programmes.
Promote lifelong training, career planning and tailored job-search assistance to enhance workers’ resilience to change.
16
Key fiscal and financial recommendations
(cont.)

Boosting productivity for long-term growth
17

3
4
5
6
7
8
9
10
11
12
13
14
15
-1.0
-0.5
0.0
0.5
1.0
1.5
2.0
2.5
3.0
3.5
GR
CIT
ALU
XF
INA
UT
CH
EM
EX
DE
UG
BR
JPN
BE
LN
LDN
ZL
DN
KF
RA
ES
PC
AN
ISR
PR
TIS
LN
OR
SW
EH
UN
AU
SU
SA
SV
NC
ZE
ES
TIR
LK
OR
SV
KT
UR
PO
LC
HL
%
18
Productivity is high, but sluggish
Average annual rate of trend labour productivity growth over 2006-16
Source: OECD, OECD Economic Outlook 102 database, preliminary version.

19
Switzerland is a leader in R&D and
innovation
Innovation performance indicator
EU average level in 2010 = 100
Source: European Commission (2017), European Innovation Scoreboard 2017.
0
20
40
60
80
100
120
140
160
180
PO
L
LVA
TU
R
HU
N
GR
C
SV
K
ITA
ES
P
ES
T
PR
T
CZ
E
SV
N
EU
28
FR
A
ISR
IRL
NO
R
BE
L
LUX
AU
T
ISL
DE
U
GB
R
NLD FIN
DN
K
SW
E
CH
E
Moderate innovators Strong innovators Innovation leaders

20
The productivity of frontier firms has
diverged from the rest
Labour productivity, 2002 = 100
Note: Markers denote survey years. Labour productivity is calculated as value added per employee.
Source: OECD calculations based on KOF, Swiss Innovation Survey.
0
50
100
150
200
250
2002 2003 2004 2005 2006 2007 2008 2009 2010 2011 2012 2013 2014 2015
Most productive 1% of firms Other firms

21
The administrative burden is heavy
Share of firms that discontinued their business citing bureaucracy as the
main cause, %
Source: Global Entrepreneurship Monitor 2015/2016, Report on Switzerland.
0
10
20
30
40
50
60
KOR NLD AUS NOR DEU PRT ESP GBR ISR BEL FIN USA CAN SWE ITA CHE

22
Regulatory barriers to competition are
high
Product market regulation indicator
Res
tric
tive
nes
s
1. ”Least restrictive countries” is the average of the three countries with the lowest score in each sector. Scores range from 0
to 6 and increase with restrictiveness.
2. Network sectors overall is the unweighted average of transport, communication and energy.
Source: OECD, Product Market Regulation database.
0.0
0.5
1.0
1.5
2.0
2.5
3.0
3.5
Professionalservices
Retaildistribution
Transport Network sectorsoverall²
Communication Energy
Least restrictive countries¹ Euro area Switzerland

23
Barriers to trade inhibit competition and
productivity
Services Trade Restrictiveness Index, for sectors with largest gaps
Res
tric
tive
nes
s
Source: OECD, Services Trade Restrictiveness Index database.
0.00
0.10
0.20
0.30
0.40
0.50
Logi
stic
s st
orag
e an
dw
areh
ouse
Sou
nd r
ecor
ding
Logi
stic
s fr
eigh
tfo
rwar
ding
Eng
inee
ring
Mot
ion
pict
ures
Com
mer
cial
ban
king
Con
stru
ctio
n
Com
pute
r
Bro
adca
stin
g
Cou
rier
Switzerland OECD

24
Most women work part-time
Part-time employment as a share of total
Source: OECD, Labour Force Statistics database.
0
10
20
30
40
50
60
70
80
HU
NS
VK
CZ
EP
OL
LVA
GR
CP
RT
SV
NE
ST
TU
RF
INE
SP
US
AC
AN
CH
LF
RA
SW
EIS
RIT
AM
EX
ISL
NZ
LIR
LLU
XD
NK
JPN
NO
RB
EL
GB
RA
US
DE
UA
UT
CH
EN
LD
Men Women
%

To improve framework conditions: Increase private ownership and remove barriers to
entry in energy, telecommunications and transport.
Remove representatives of economic associations from the competition authority’s board.
Lower restrictions on trade in both goods and services, notably in agricultural products.
Complete the negotiations for free-trade agreements that are underway.
Finalise the virtual one-stop shop for administrative matters.
Establish cantonal physical contact points to improve delivery of advisory services and public financing programmes.
25
Key recommendations to boost
productivity

To better use skills of women and immigrants:
Increase childcare affordability.
Shift income taxation to individual rather than household incomes, or implement equivalent measures.
Facilitate high-skilled immigration from non-EU countries to meet labour market needs.
26
Key recommendations to boost
productivity (cont.)

Ensuring a dynamic skills training and life-long
learning system
27

28
The education and training system is
successful
Youth not in employment, education or training
% of 18-24 year-olds
Source: OECD (2017), Education at a Glance 2017.
0
5
10
15
20
25
30
35
ISL
NLD
DN
KLU
XC
HE
NO
RD
EU
SW
ES
VN
AU
SE
ST
AU
TLT
UB
EL
NZ
LC
AN
GB
RU
SA
SV
KO
EC
DH
UN
LVA
FIN
ISR
PO
LP
RT
IRL
FR
AC
HL
ME
XE
SP
GR
CIT
AT
UR

29
Immigration has helped to meet the rising
demand for skilled workers
Contribution to working-age population growth by education and nationality, % points
Source: Federal Statistical Office.
-4
-2
0
2
4
6
8
10
12
Lowersecondary
Uppersecondary
Tertiary Lowersecondary
Uppersecondary
Tertiary
1997-2007 2007-2017
Swiss citizens Other nationalities

30
High-skill vacancy rates are rising
Sectors with above-average vacancy rates, %
1. IT and Other Information Services is a subsector of IT and Communications.
Source: Federal Statistical Office.
0.0
0.5
1.0
1.5
2.0
2.5
3.0
3.5
Tot
al e
cono
my
Acc
omm
odat
ion
& fo
odse
rvic
es
Man
ufac
ture
of m
etal
prod
ucts
Tra
de a
nd r
epai
r of
mot
or v
ehic
les
Rea
l est
ate
& s
cien
tific
serv
ices
Man
ufac
turin
g of
com
pute
rs &
wat
ches
Man
ufac
ture
of o
ther
spec
ialis
ed m
achi
nery
Fin
ance
& in
sura
nce
IT &
com
mun
icat
ions
IT &
oth
er in
form
atio
nse
rvic
es¹
Average since 2009 Year to 2017Q2

31
Tertiary education should further expand
Entry rates for bachelor’s degree or equivalent¹
1. First-time entry rates, excluding international students. First-time entry rates indicate the share of young adults
expected to enter that type of tertiary education programme during their lifetime.
Source: OECD (2017), Education at a Glance 2017.
0
10
20
30
40
50
60
70
80
LUX
HU
N
AU
T
ME
X
ITA
SW
E
PR
T
ES
P
DE
U
ISR
FIN
SV
K
CZ
E
GB
R
TU
R
CH
E
NLD
NZ
L
ES
T
CH
L
ISL
NO
R
BE
L
DN
K
SV
N
IRL
AU
S
%

32
Participation in life-long learning is high
25-64 year-olds participating in education and training in the preceding four weeks, 2016
Source: Eurostat, Labour Force Survey 2016.
0
5
10
15
20
25
30
35
SV
K
PO
L
GR
C
TU
R
HU
N
IRL
LVA
BE
L
ITA
DE
U
CZ
E
ES
P
PR
T
EU
28 EA
SV
N
GB
R
ES
T
AU
T
LUX
NLD
FR
A
NO
R
ISL
FIN
DN
K
SW
E
CH
E
%

33
Participation in life-long learning is not
broad-based
Difference in participation rates of those with high and low levels of education, 20161
1. 25-64 year-olds participating in education and training in the preceding four weeks. Difference in
participation rate of those with tertiary education and less than upper secondary school.
Source: Eurostat, Labour Force Survey 2016.
0
5
10
15
20
25
30
35
GR
C
IRL
PO
L
BE
L
HU
N
LVA
DE
U
TU
R
NO
R
ES
P
CZ
E
EU
28
GB
R
EA
DN
K
PR
T
ITA
NLD
ES
T
LUX
SV
N
ISL
SW
E
FIN
AU
T
FR
A
CH
E
% pts

Collect more detailed data on skills to facilitate adjustments to education in response to changing labour market needs.
Enhance the effectiveness of pathways between vocational and general streams by increasing the academic component of the vocational curriculum and vice-versa.
Encourage small firms to participate more in apprenticeships by promoting sharing of apprenticeship places between firms and training centres that undertake part of the training.
Strengthen linkages between the vocational education and training system and employer associations in school-based vocational training.
Use subsidies to encourage participation in continuing education and training for groups with low participation rates.
34
Key recommendations for a dynamic skills
training and life-long learning system

For more information
Disclaimers:
The statistical data for Israel are supplied by and under the responsibility of the relevant Israeli authorities. The use of such data by the OECD is without prejudice to the status of
the Golan Heights, East Jerusalem and Israeli settlements in the West Bank under the terms of international law.
This document and any map included herein are without prejudice to the status of or sovereignty over any territory, to the delimitation of international frontiers and boundaries
and to the name of any territory, city or area.
35
http://www.oecd.org/eco/surveys/economic-survey-switzerland.htm
@OECDeconomy
@OECD