2017 Monitoring Network Plan - DNR · PDF fileAir Pollution Control Program . 2017 Monitoring...
124
Missouri Department of Natural Resources Air Pollution Control Program 2017 Monitoring Network Plan July 3, 2017
Transcript of 2017 Monitoring Network Plan - DNR · PDF fileAir Pollution Control Program . 2017 Monitoring...
Missouri Department of Natural Resources Air Pollution Control Program 2017 Monitoring Network Plan
July 3, 2017
2017 Monitoring Network Plan Missouri Department of Natural Resources Rev. 1, July 3, 2017 2
TABLE OF CONTENTS SUMMARY OF PROPOSED CHANGES ..................................................................... 3 HOW TO MAKE PUBLIC COMMENTS CONCERNING THIS PLAN .................. 3
INTRODUCTION............................................................................................................. 3 2017 AMBIENT AIR MONITORING NETWORK, STATE SITES .......................... 7 2017 AMBIENT AIR MONITORING NETWORK, INDUSTRIAL SITES .............. 9 PROPOSED CHANGES TO THE NETWORK ......................................................... 11
1. Lead Monitoring Network ............................................................................11 2. Sulfur Dioxide (SO2) Monitoring Network ..................................................14 3. National Air Toxics Trends Stations (NATTS), and Other Non-Criteria Pollutants Special Purpose Monitoring ...........................20 4. PM2.5 Monitoring Network............................................................................21 5. Ozone Monitoring Network ..........................................................................26 6. PM10 Monitoring Network ............................................................................31 7. Nitrogen Dioxide (NO2) Monitoring Network .............................................33 8. Carbon Monoxide (CO) Monitoring Network ............................................35 9. Photochemical Assessment Monitoring Station Implementation Plan .....36
NETWORK DESCRIPTION/COMPONENTS ........................................................... 42 APPENDIX 1: MISSOURI MONITORING NETWORK DESCRIPTION APPENDIX 2: COMMENTS ON PROPOSED 2017 MONITORING NETWORK PLAN, RESPONSES TO COMMENTS, AND CORRECTIONS

2017 Monitoring Network Plan Missouri Department of Natural Resources Rev. 1, July 3, 2017 3
SUMMARY OF PROPOSED CHANGES Missouri’s Monitoring Network Plan discusses the following recent and proposed changes in detail in the sections below:
• The Pevely lead monitoring site is proposed for discontinuation at the end of calendar year 2017.
• The latitude and longitude coordinates for some of the industrial SO2 sites were adjusted from the preliminary coordinates in the 2016 Monitoring Network Plan. The final coordinates were measured after installation was complete. The name of one of the industrial site operators has changed due to an acquisition.
• Operation of the near real time PM10 Metals Monitor (Xact™ 620) at the Blair Street site as a part of NATTS was discontinued in January 2017.
• A Teledyne API 640x PM2.5 instrument will be installed and operated at the Blair Street site to evaluate its potential future use in the network pending available funds.
• The Foley ozone monitoring site was relocated before the beginning of the 2017 ozone monitoring season to a new site, called Foley West, 1.49 kilometers east of the former site. Relocation was necessitated by a property transfer.
• The Branson ozone monitoring site is proposed for discontinuation at the end of the 2017 ozone monitoring season, October 31, 2017.
• A Photochemical Assessment Monitoring Station (PAMS) Implementation Plan is included as Section 9 of this Monitoring Network Plan. PAMS monitoring will begin at the Blair Street site in June 2019.
HOW TO MAKE PUBLIC COMMENTS CONCERNING THIS PLAN This 2017 Monitoring Network Plan, Revision 0, was posted for comment on June 1, 2017. No comments were received through July 3, 2017. Therefore no response to comments is needed, as noted in Appendix 2. Comments concerning this Monitoring Network Plan were accepted electronically at: [email protected] or in writing at the following address:
Missouri Department of Natural Resources Air Pollution Control Program Air Quality Analysis Section/Air Monitoring Unit P.O. Box 176 Jefferson City, MO 65102
INTRODUCTION The Missouri Department of Natural Resources operates an extensive network of ambient air monitors to comply with the Clean Air Act and its amendments. The Ambient Air Quality Monitoring Network for the State of Missouri consists of State and Local Air Monitoring Stations (SLAMS), Special Purpose Monitoring (SPM) Stations, and National Core (NCore) monitoring consistent with requirements in federal regulation 40 CFR 58.

2017 Monitoring Network Plan Missouri Department of Natural Resources Rev. 1, July 3, 2017 4
40 CFR 58.10 requires that states submit to EPA an annual monitoring network plan including any proposed network changes. A network assessment is required every five years, and the most recent one was completed in 2015. 40 CFR 58.10 also requires that the plan include a statement of whether the operation of each monitor meets the requirements of appendices A, B, C, D, and E of 40 CFR 58 where applicable. All of the monitors in the Missouri air monitoring network, including those operated by the State and those operated by industries under State review meet the applicable requirements of 40 CFR 58. With regard to state and local air monitoring station (SLAMS) changes, approval by the Environmental Protection Agency Regional Administrator is required. The plan must contain the following information for each monitoring station in the network; most of this information is listed for each site in Appendix 1; number 5 is addressed in the body of this document: 1. The Air Quality System site identification number for existing stations. 2. The location, including the street address and geographical coordinates, for each monitoring
station. 3. The sampling and analysis method used for each measured parameter. 4. The operating schedule for each monitor. 5. Any proposal to remove or move a monitoring station within a period of eighteen months
following the plan submittal. 6. The monitoring objective and spatial scale of representativeness for each monitor. 7. The identification of any sites that are or are not suitable for comparison against the annual
PM2.5 National Ambient Air Quality Standard (NAAQS). 8. The metropolitan statistical area, core-based statistical area, combined statistical area or other
area represented by the monitor. Network Design Federal regulation (40 CFR Part 58) establishes the design criteria for the ambient air monitoring network. The network is designed to meet three general objectives:
• Provide air pollution data to the public in a timely manner. • Support compliance with ambient air quality standards and emissions strategy
development. • Support air pollution research studies.
Specific objectives for the monitoring sites are to determine the highest pollution concentrations in an area, to measure typical concentrations in areas of high population density, to determine the impact of significant sources or source categories, to determine general background levels and to determine the extent of regional pollutant transport among populated areas. Minimum site requirements are provided for ozone, sulfur dioxide, CO, NO2, PM10 and PM2.5 based on Core Based Statistical Area (CBSA) population. Appendix E to Part 58 establishes the specific requirements for monitor/probe siting to ensure the ambient data represents the stated objectives and spatial scale. The requirements are
2017 Monitoring Network Plan Missouri Department of Natural Resources Rev. 1, July 3, 2017 5
pollutant/scale specific and involve horizontal/vertical placement. Periodically, department staff visit and evaluate each monitoring site to ensure that each site continues to meet the requirements of 40 CFR 58 Appendix E. Any issues related to probe siting, such as growth of trees or other vegetation, are addressed by taking appropriate action following the site visits. Documentation of these reviews is maintained on file. Additional details concerning the sites may be found in Appendix 1. There is only one PM2.5 monitor in Missouri that is not applicable for comparison to the annual NAAQS. The Branch Street site is a middle-scale site focused on a group of sources in the industrial riverfront area and is not representative of neighborhood or larger spatial scale for PM2.5 monitoring. The PM2.5 monitors deployed to collocate with the near-roadway NO2 monitors are micro-scale monitors, but EPA has indicated in 40 CFR 58 Appendix D, 4.7.1(c)(2) that “…In many situations, monitoring sites that are representative of microscale or middle-scale impacts are not unique and are representative of many similar situations. This can occur along traffic corridors or other locations in a residential district. In this case, one location is representative of a number of small scale sites and is appropriate for evaluation of long-term or chronic effects.” these monitors may be considered by EPA to be representative of larger areas near roadways and comparable to the annual PM2.5 NAAQS consistent with 40 CFR 58.30. Unanticipated Network Modifications Changes to the monitoring network may occur outside the annual monitoring network planning process due to unforeseen circumstances resulting from severe weather, natural events, changes in property ownership, or other situations that occur after the monitoring plan has been posted for public inspection and approved by the EPA Regional Administrator. Changes to the monitoring network may also be necessary because of financial constraints resulting from changes in federal funding or changes in funding available from air emission fees from industrial facilities. Any changes to the network that result due to conditions outside the state’s logistical control and not included in the current monitoring network plan will be communicated in writing to EPA Region VII staff and identified in the subsequent annual monitoring network plan. Special Purpose Monitors (SPM) Consistent with 40 CFR 58.20 (a) “An SPM is defined as any monitor included in an agency's monitoring network that the agency has designated as a special purpose monitor in its annual monitoring network plan and in AQS, and which the agency does not count when showing compliance with the minimum requirements of this subpart for the number and siting of monitors of various types.” Special purpose monitors may be established for many different purposes, including but not limited to, NAAQS compliance evaluation, air quality research and characterization, air quality investigation, and monitoring method evaluation. The department includes SPMs in the annual monitoring network plan required by 40 CFR 58.10. The department installs and approves the installation of these monitors consistent with 40 CFR 58.20 (f). In addition, the department removes, or allows removal of these monitors,
2017 Monitoring Network Plan Missouri Department of Natural Resources Rev. 1, July 3, 2017 6
following federal guidelines. There is more description of each SPM later in the document. The Missouri Monitoring Network Description, Appendix 1, identifies which monitors are SPM and which are SLAMS. Industrial Monitors Ambient air monitoring sites classified as Industrial in this plan indicate that the ambient air monitoring at that site is being conducted by the industrial source or its contractor under an approved industrial monitoring Quality Assurance Project Plan (QAPP) and departmental Quality Management Plan (QMP). Department staff conducts quality assurance audits of these monitoring sites consistent with the approved QAPP. For decades Missouri has overseen ambient air monitoring sites operated by industrial sources for NAAQS compliance. The department has incorporated these Industrial sites in the annual Monitoring Network Plans. Currently, industrial monitoring for some lead and SO2 sites is incorporated in the ambient air monitoring network. Some industrial monitoring sites in the lead network are classified in AQS as non-regulatory due to the sites having transitioned to non-ambient status. However, the department has required continued monitoring at these locations in agreements with the industrial source for trends analysis or other purposes.
2017 Monitoring Network Plan Missouri Department of Natural Resources Rev. 1, July 3, 2017 7
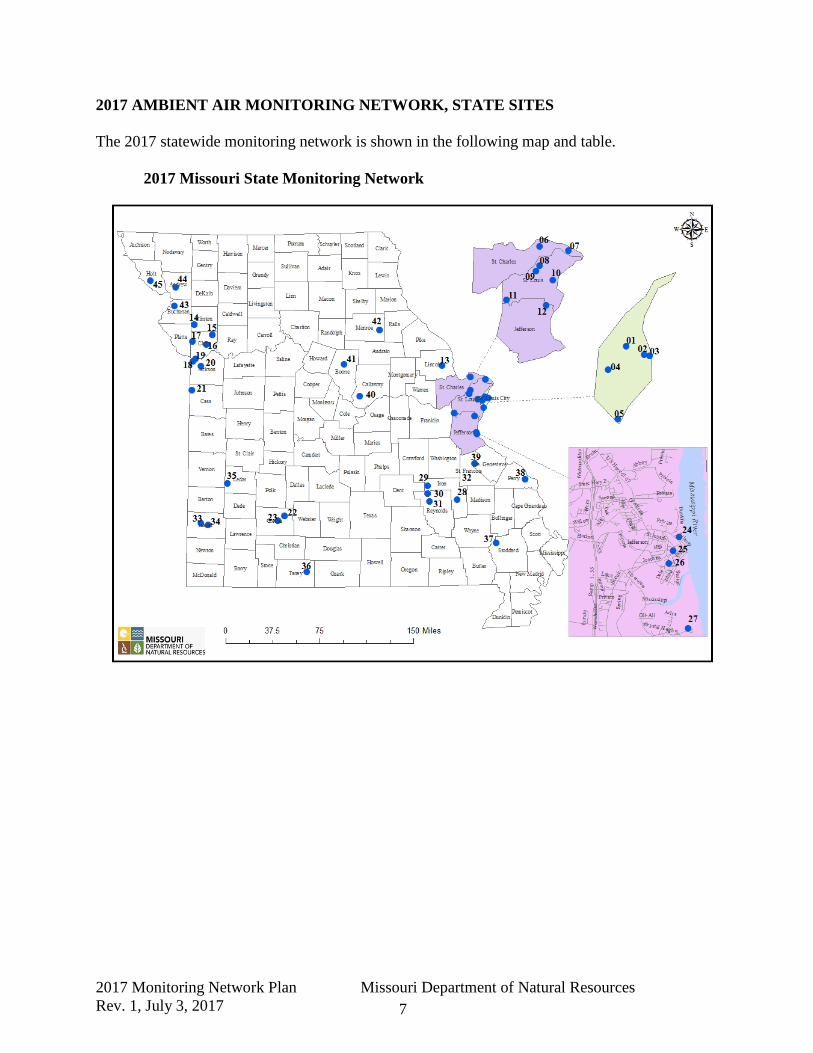
2017 AMBIENT AIR MONITORING NETWORK, STATE SITES The 2017 statewide monitoring network is shown in the following map and table. 2017 Missouri State Monitoring Network
2017 Monitoring Network Plan Missouri Department of Natural Resources Rev. 1, July 3, 2017 8
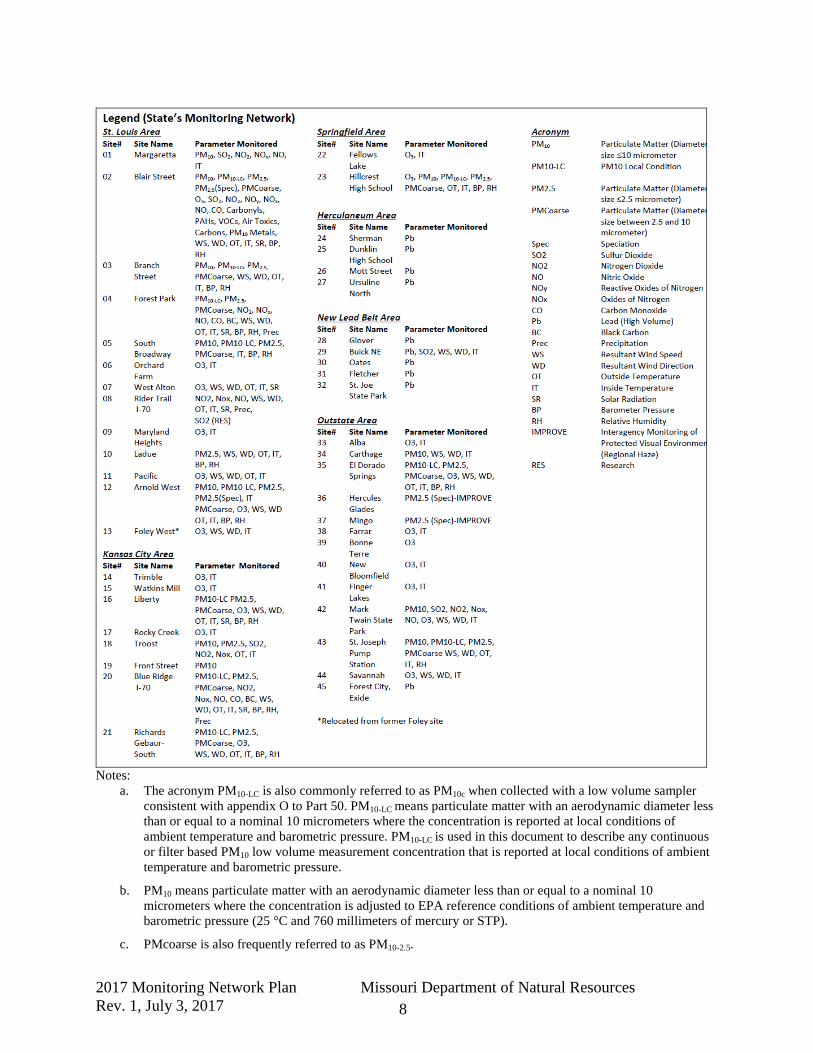
Notes:
a. The acronym PM10-LC is also commonly referred to as PM10c when collected with a low volume sampler consistent with appendix O to Part 50. PM10-LC means particulate matter with an aerodynamic diameter less than or equal to a nominal 10 micrometers where the concentration is reported at local conditions of ambient temperature and barometric pressure. PM10-LC is used in this document to describe any continuous or filter based PM10 low volume measurement concentration that is reported at local conditions of ambient temperature and barometric pressure.
b. PM10 means particulate matter with an aerodynamic diameter less than or equal to a nominal 10 micrometers where the concentration is adjusted to EPA reference conditions of ambient temperature and barometric pressure (25 °C and 760 millimeters of mercury or STP).
c. PMcoarse is also frequently referred to as PM10-2.5.
2017 Monitoring Network Plan Missouri Department of Natural Resources Rev. 1, July 3, 2017 9
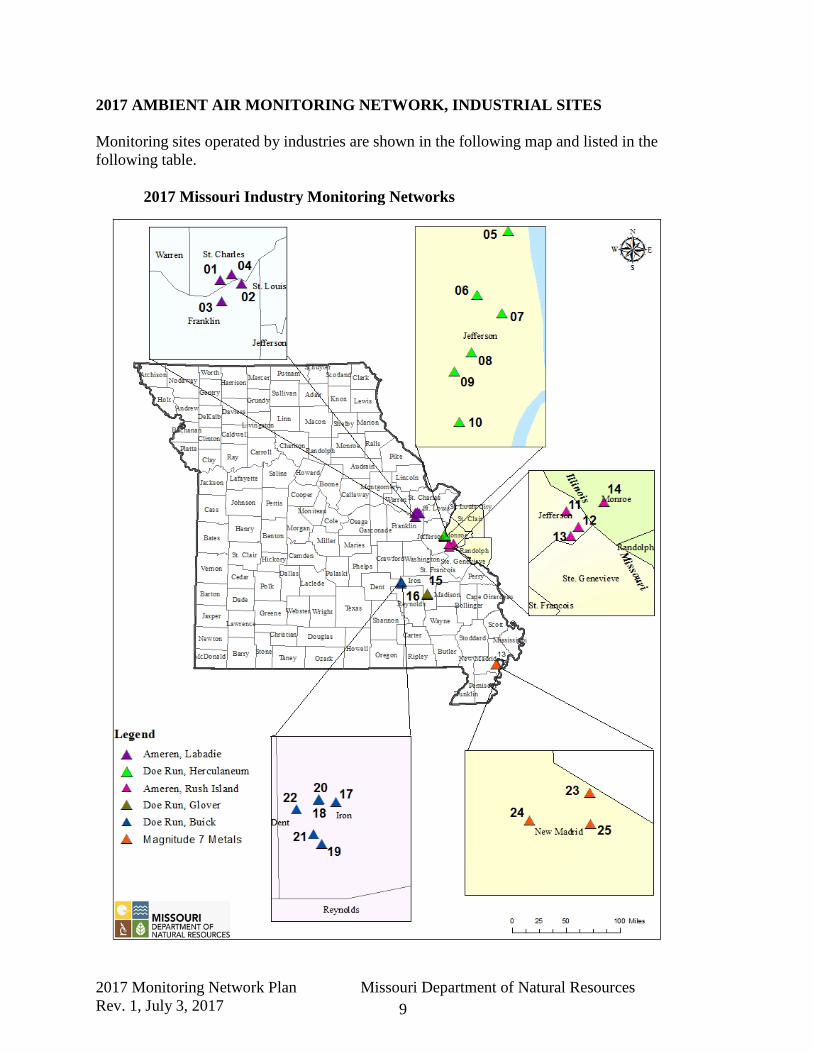
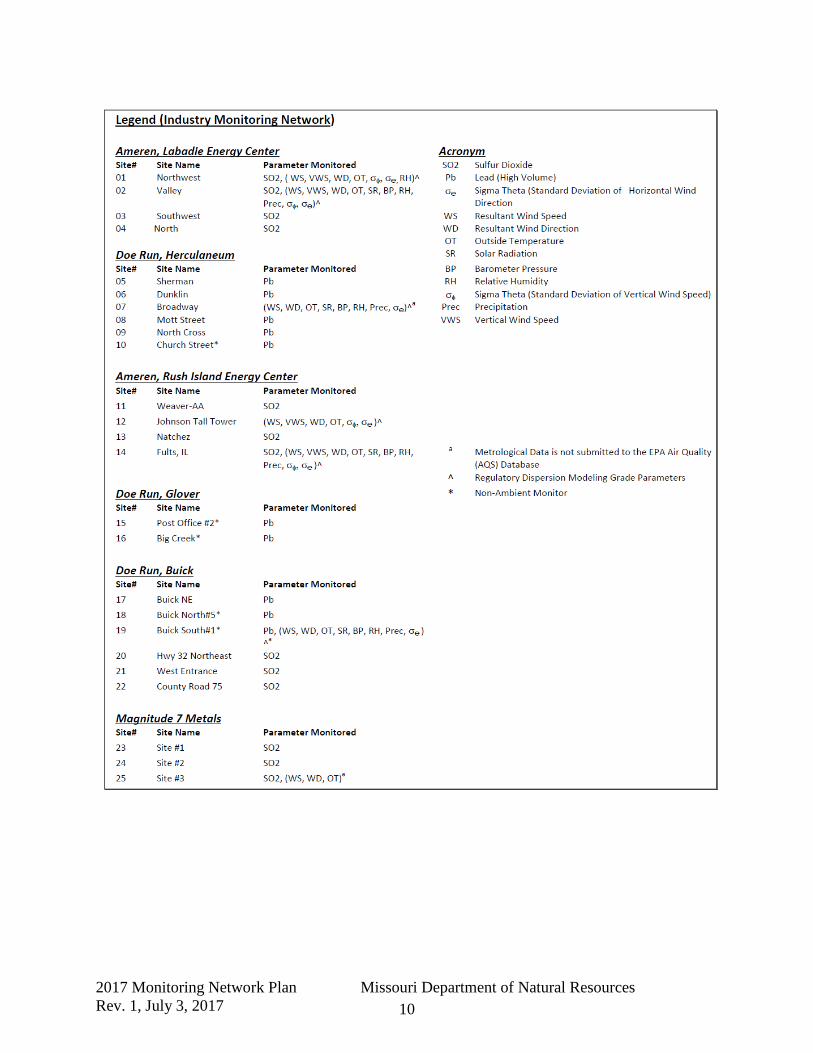
2017 AMBIENT AIR MONITORING NETWORK, INDUSTRIAL SITES Monitoring sites operated by industries are shown in the following map and listed in the following table. 2017 Missouri Industry Monitoring Networks
2017 Monitoring Network Plan Missouri Department of Natural Resources Rev. 1, July 3, 2017 10
2017 Monitoring Network Plan Missouri Department of Natural Resources Rev. 1, July 3, 2017 11
PROPOSED CHANGES TO THE NETWORK 1. Lead Monitoring Network Changes to airborne lead monitoring requirements were published in the Federal Register: December 27, 2010 (Volume 75, Number 247). The new rules require a plan for monitoring lead sources emitting 0.50 tons per year or more, revised from the previous requirement for monitoring sources emitting one ton per year or more. Airports are specifically exempted from these requirements except for a special study being conducted at specific airports, none of which are in Missouri. Department staff reviewed the 2014 reported lead emissions and identified only one source not previously identified, NorthStar Battery plant number 1 in Springfield, as emitting greater than 0.50 ton of lead per year and for which ambient air monitoring is not currently being conducted or where EPA has not already granted a modeling waiver consistent with 40 CFR 58 Appendix D, 4.5 (a) (ii). However, the most recent revised construction permit (no. 122016-001, issued in December 2016) for that facility limits its lead emissions to not more than 0.25 ton per year. Therefore, monitoring adjacent to this facility is not required. A review of quality-assured 2015 emissions data and preliminary 2016 emissions data did not identify any additional sources emitting greater than 0.50 ton per year. 1.1 Forest City, Exide Monitoring Site The 2013 Monitoring Network Plan identified the resumption of lead TSP monitoring at a location near the Exide Secondary Lead Smelter in Forest City, MO. The monitoring method initially deployed, as described in the 2012 Monitoring Network Plan, utilized the low volume PM10 sampler and Pb-PM10 analysis performed by X-ray Fluorescence (XRF) following specifications and procedures in 40 CFR part 50 Appendix Q. Since the deployment of the Pb-PM10 FRM, as a Special Purpose Monitor, in March of 2012, three month rolling averages of airborne lead were monitored at concentrations greater than 0.15 micrograms per cubic meter (µg/m3). As a result a Pb-TSP sampler was deployed in August 2012 for subsequent attainment determination. The department discontinued the Pb-PM10 FRM in December 2013 but the Pb-TSP sampler continues to monitor lead at the site. As a result of changes in operations at that facility, including addition of pollution control equipment, an exceedance of the lead NAAQS has not been monitored at that site since October-December 2013. Discontinuing the Forest City monitor may be proposed in future monitoring network plans if this trend continues. 1.2 Doe Run Operated Sites 1.2.1 Doe Run Lead Sites Doe Run operates lead monitoring sites in the vicinity of their industrial facilities in Herculaneum, Glover, and Boss. Operation of some of these sites is required by Consent Judgments or Agreements with the department, and operation of other sites is voluntary.

2017 Monitoring Network Plan Missouri Department of Natural Resources Rev. 1, July 3, 2017 12
1.2.2 Doe Run Meteorological Sites Doe Run Herculaneum also operates one ten meter tower meteorological monitoring site as per language set forth under the 2011 Consent Judgment. Doe Run Herculaneum discontinued the 40 meter tower at Broad Street as per the Consent Judgment. 1.3 Department’s Lead Monitoring Network in Herculaneum Monitoring at the Pevely North site was discontinued in January 2017 as proposed in the 2016 Monitoring Network Plan and approved by US EPA. With the cessation of primary lead smelting at the Doe Run facility in Herculaneum, the department also proposes discontinuing monitoring at the Pevely site at the end of calendar year (CY) 2017. That site has not shown an exceedance of the lead NAAQS since September-November 2012, and has averaged 0.013 µg/m3 since smelting operations at Herculaneum were discontinued at the end of 2013. The Pevely site meets the conditions in 40 CFR Part 58.14 (c) (1) for discontinuation; if the site continues to show attainment, it will have shown attainment for five years by the end of November 2017, it has a probability of less than 10 percent of exceeding 80 percent of the NAAQS based on recent monitored concentrations, it is not required by an attainment or maintenance plan, and there are other monitors in the Herculaneum area with higher design values that will remain in operation. The department continues to carefully evaluate the lead data monitored at its sites in Herculaneum and may consider additional modification in the future, particularly sampling schedules at the Dunklin, Sherman, and Mott sites. 1.4 St. Joe State Park Monitoring Site The department has reduced the frequency of sampling at the Special Purpose lead monitoring site at St. Joe State Park from every third day to every sixth day. The St. Joe State Park site was intended to monitor airborne lead concentrations during remediation activities involving old lead mining waste in the Federal Mine Tailings. The bulk of the remediation activity was completed as of late July/early August of 2014. The three-month rolling average has not exceeded the lead standard, 0.15 μg/m3
, since the site began monitoring lead on July 1, 2010. The highest three-month rolling average airborne lead concentration at that site was 0.14 μg/m3
in July-September 2011. This elevated lead concentration was attributable to remediation activities near the monitor. Since that time the three-month average lead concentration at that site has not exceeded 0.13 μg/m3. 1.5 Bills Creek Lead Monitor Monitoring at the Bills Creek site was discontinued at the end of January 2017 as proposed in the 2016 Monitoring Network Plan and approved by US EPA.

2017 Monitoring Network Plan Missouri Department of Natural Resources Rev. 1, July 3, 2017 13
The 2017 lead monitoring network is shown in the map below. 2017 Missouri Lead Monitoring Network*, NAAQS=0.15µg/m3 (3 month)
*The Pevely site is proposed for discontinuation at the end of CY 2017. No other changes are proposed in this plan.
2017 Monitoring Network Plan Missouri Department of Natural Resources Rev. 1, July 3, 2017 14
2. Sulfur Dioxide (SO2) Monitoring Network On June 2, 2010, the US EPA revised the primary SO2 standard by establishing a 1-hour standard at the level of 75 parts per billion (ppb). The EPA revoked the two previous primary standards of 140 ppb evaluated over 24-hrs and 30 ppb evaluated over an entire year. The 2011 Monitoring Network Plan1 identified the minimum network monitoring required by the Population Weighted Emissions Index (PWEI). This analysis has been updated using 2010 census data and 2011 NEI emissions. The required numbers of monitoring sites based on the PWEI (2 sites each in the St. Louis and Kansas City CBSAs) did not change. The department’s 2017 SO2 monitoring network is shown in the map below. In May 2014 US EPA published proposed data requirements regulations related to SO2 air quality monitoring and air quality dispersion modeling near emission sources. These requirements were finalized in the SO2 Data Requirements Rule (DRR) published in the Federal Register on August 21, 2015. This final rule requires that air agencies must characterize air quality, either by monitoring or modeling, around sources that emit 2,000 tons per year (tpy) or more of SO2. The requirement for air quality characterization near a source may be avoided by adopting enforceable emission limits that ensure that the source will not emit more than 2,000 tpy of SO2. On January 15, 2016 the department submitted a final list identifying the sources in the state around which SO2 air quality will be characterized. That submittal may be found at https://www3.epa.gov/airquality/sulfurdioxide/drr/mo.pdf. The Ameren Labadie Energy Center and the Noranda Aluminum (now known as Magnitude 7 Metals) facility (both discussed below) were included on that list. The Doe Run Buick Resource Recycling Facility (also discussed below) reported emissions less than 2,000 tpy but was also included on the list because emissions from that facility were uncertain and under review at the time of the January 2016 submittal. The Ameren Rush Island Energy Center was not included in the list, because it is within a previously-designated nonattainment area (designated as nonattainment due to emissions from another facility). Monitoring in the area around that Rush Island is being conducted on an accelerated schedule (compared to the DRR timeline) by agreement between the department and Ameren associated with the plan for the Jefferson County nonattainment area submitted to EPA in May 2015. For each facility listed in the January 2016 submittal, the state was required to identify by July 1, 2016, the approach (ambient monitoring or air quality modeling) that would be used to characterize air quality or identify sources whose emissions will be limited to less than 2,000 tpy by an enforceable agreement. For source areas that were to be evaluated through ambient monitoring, the air agency was required to submit information on monitoring sites to the EPA by July 1, 2016, as part of its annual monitoring network plan. This SO2 monitoring to meet the DRR was required to begin by January 1, 2017. Monitoring near these sources in Missouri is discussed in the following sections. This monitoring is being conducted by the industries operating the sources, but the monitoring must be conducted in accordance with the SLAMS requirements in 40 CFR Part 58, and the department reviewed and approved the siting of the monitors based on federal regulations and oversaw the operation of the monitors. To meet the requirements of the DRR, these monitors will need a minimum of three years of monitoring data. 1 http://dnr.mo.gov/env/apcp/docs/2011monitoringnetwork.pdf
2017 Monitoring Network Plan Missouri Department of Natural Resources Rev. 1, July 3, 2017 15
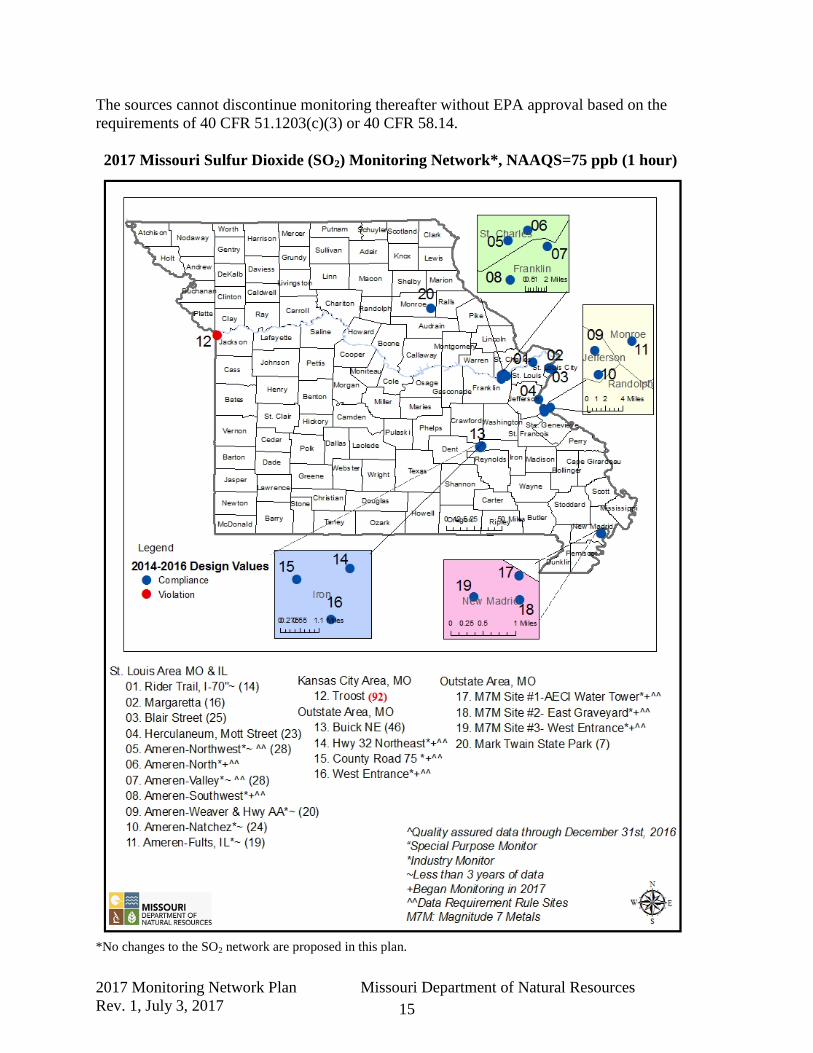
The sources cannot discontinue monitoring thereafter without EPA approval based on the requirements of 40 CFR 51.1203(c)(3) or 40 CFR 58.14. 2017 Missouri Sulfur Dioxide (SO2) Monitoring Network*, NAAQS=75 ppb (1 hour)
*No changes to the SO2 network are proposed in this plan.

2017 Monitoring Network Plan Missouri Department of Natural Resources Rev. 1, July 3, 2017 16
2.1 Industrial SO2 & Meteorological Monitoring near the Labadie and Rush Island Energy Centers As indicated in the Missouri 2015 Monitoring Network Plan, two SO2 ambient Air Monitoring networks were deployed around the Labadie and Rush Island power pants. At the time that plan was posted for public inspection, EPA had not promulgated the SO2 DRR or revisions to the monitoring requirements in 40 CFR 58. The SO2 DRR and revisions to 40 CFR 58 were published in the Federal Register on August 21, 2015 and March 28, 2016, respectively. The revised quality assurance requirements of 40 CFR 58 Appendix A, indicate in section 1.1 (a) that “This appendix specifies the minimum quality system requirements applicable to SLAMS and other monitor types whose data are intended to be used to determine compliance with the NAAQS (e.g., SPMs, tribal, CASTNET, NCore, industrial, etc.),…” This revision supports states using monitors with any of these classifications to satisfy the DRR monitoring requirements in 40 CFR 51.1203 (c) so long as these monitors are operated in a manner equivalent to SLAMS. Both SLAMS and industrial NAAQS compliance monitoring networks in Missouri are operated under a department approved QAPP consistent with the departmental Quality Management Plan (QMP) that has been approved by EPA Region VII. EPA Region VII indicated in a January 25, 2016 letter approving our 2015 Monitoring Network Plan that they did not evaluate the Labadie and Rush Island SO2 monitoring networks described in detail in that plan due to our classification of those monitors as Special Purpose Monitors (SPM). After reviewing the revisions to 40 CFR 58 against monitor classifications as they apply to NAAQS compliance monitoring, we classified the Labadie and Rush Island SO2 monitors as industrial SO2 monitors. This is consistent with how we handle industrial monitors used for NAAQS compliance in both our SO2 and lead ambient air monitoring networks. The following sections describe the current status of the Labadie and Rush Island SO2 monitoring networks based on the 2016 Monitoring Network Plan. 2.1.1 Labadie Energy Center On March 20, 2015 EPA updated implementation guidance as a result of the March 2, 2015 U.S. District Court for the Northern District of California accepting an enforceable order and agreement between the EPA and Sierra Club and Natural Resources Defense Council. This agreement is intended to resolve litigation related to the deadline for completing the 1-hour SO2 NAAQS designations process. Since proposing the first two SO2 monitors near the Labadie Energy Center in our 2015 Monitoring Network Plan, EPA promulgated the SO2 DRR. Consistent with the DRR definitions section, 40 CFR 51.1200, the area designation status with respect to the one-hour SO2 NAAQS determines if this area is subject to the DRR. The DRR applies if the area around the Labadie Energy Center is not designated as a nonattainment area. On June 30, 2016, EPA designated that area as unclassifiable (Federal Register, volume 81, number 133, July 12, 2016).
2017 Monitoring Network Plan Missouri Department of Natural Resources Rev. 1, July 3, 2017 17
Therefore, the DRR applies to this area and to the monitoring network as proposed in the 2016 Monitoring Network Plan and approved by EPA. The department will continue to work with Ameren to collect quality assured SO2 ambient air quality data and meteorological data near the Labadie Energy Center to provide quantifiable and useful technical information to meet the DRR requirements and supplement the ongoing 1-hour SO2 NAAQS implementation process. Two industrial SO2 ambient air monitoring sites and a meteorological monitoring station began operation in April 2015 in the area around the Ameren Labadie Energy Center, located at 226 Labadie Power Plant Road in Franklin County, Missouri. Two additional industrial SO2 monitoring sites southwest and north of the Labadie Energy Center were installed and began operation on January 1, 2017. The location of those sites was determined on the basis of dispersion modeling as discussed in the 2017 Monitoring Network Plan. Also, meteorological monitoring using a 10 meter tower was added at the Northwest site, and the SODAR instrument was relocated from the Valley site to the Northwest site in February 2017. These monitoring sites (see the following table) are operated by Ameren under a department-approved Quality Assurance Project Plan (QAPP). The rationale for site selection based on modeling results is discussed extensively in the 2015 and 2016 Monitoring Network Plans. Summary of Labadie area Industrial Monitoring Stations: Monitoring Objective: Source Oriented Spatial Scale of representativeness: Middle Scale (100m2 to 0.5 km2) Labadie Northwest -SO2, 10 Meter Meteorological Station and Sound Detection and Ranging (SODAR). (Lat: 38.5818 Long: -90.865528) Labadie Valley -SO2, 10 Meter Meteorological Station. (Lat: 38.572522 Long: -90.796911) Labadie Southwest -SO2, (Lat: 38.52825 Long: -90.86301; Labadie North –SO2, (Lat: 38.59557 Long: -90.82864; 2.1.2 Rush Island Energy Center On March 23, 2015 the department and Ameren entered into a Consent Agreement (Appendix 3 of the 2015 Monitoring Network Plan) which included Ameren installing and operating an SO2 monitoring network around the Rush Island Energy Center under department oversight. The siting of these monitors was consistent with the technical process described in the SO2 DRR. Although the primary objective of the Rush Island ambient air monitoring project is to satisfy the terms of the aforementioned Consent Agreement, it is possible that the quality assured monitoring data may be used for other future purposes depending on the final outcome of EPA’s national implementation strategy for the 2010 1-hour SO2 NAAQS and the Jefferson County Nonattainment area implementation process. The department will continued to work with Ameren to collect quality assured SO2 ambient air quality data and meteorological data near the Rush Island power station to provide quantifiable and useful information to supplement the ongoing 1-hour SO2 NAAQS implementation process.

2017 Monitoring Network Plan Missouri Department of Natural Resources Rev. 1, July 3, 2017 18
The Rush Island monitoring network design was based on evaluation of dispersion modeling, as described in the 2015 and 2016 Monitoring Network Plans. This network began operation in December 2015. Summary of Rush Island area Industrial Monitoring Stations: Monitoring Objective: Source Oriented Spatial Scale of representativeness: Middle Scale (100m2 to 0.5 km2) Weaver-AA -SO2. (Lat: 38.144529 Long: -90.304726) Natchez -SO2, (Lat: 38.10525 Long: -90.29842) Fults, IL, -SO2, 10 Meter Meteorological Station (Lat: 38.15908 Long: -90.22728) Johnson Tall Tower -Meteorological Station Only, anemometers at 62.5m and 132.5m levels (Lat: 38.11999 Long: -90.28214) 2.2 Industrial SO2 & Meteorological Monitoring near the Doe Run Buick Resource Recycling Facility The Doe Run Company began SO2 monitoring at three sites in the area around the Buick Resource Recovery Facility near Boss, Missouri starting January 1, 2017 to meet the requirements of the SO2 Data Requirements Rule, as described above. Meteorological monitoring is already being conducted at the Buick South lead monitoring site, south of the facility. These sites are being operated under a department-approved QAPP, which includes performance evaluations (audits) by department staff. Locations of these ambient SO2 monitoring sites was determined on the basis of air quality modeling of the impact of facility emissions, as described in the 2016 Monitoring Network Plan. Summary of Doe Run Buick area Industrial Monitoring Stations: Monitoring Objective: Source Oriented Spatial Scale of representativeness: Middle Scale (100m2 to 0.5 km2) West Entrance -SO2. (Lat: 37.63211 Long: -91.13565) County Road 75 -SO2, (Lat: 37.64876 Long: -91.14890) Hwy 32 Northeast (Former PSD site) -SO2, (Lat: 37.65319 Long: 91.12795) 2.3 Industrial SO2 & Meteorological Monitoring near the Magnitude 7 Metals (formerly Noranda Aluminum) Facility Magnitude 7 Metals is conducting SO2 monitoring at three sites and meteorological monitoring at one site in the area around their facility near New Madrid, Missouri. Monitoring at these sites started in January, 2017 to meet the requirements of the SO2 Data Requirements Rule, as described above. These sites are being operated under a department-approved QAPP, which includes performance evaluations (audits) by department staff. Locations for these ambient SO2 monitoring sites were determined on the basis of air quality modeling of the impact of facility emissions, and the potential area for meteorological monitoring was determined on the basis of an analysis by a department meteorologist. These evaluations are described in the 2016 Monitoring Network Plan.

2017 Monitoring Network Plan Missouri Department of Natural Resources Rev. 1, July 3, 2017 19
Summary of Magnitude 7 Metals area Industrial Monitoring Stations: Monitoring Objective: Source Oriented Spatial Scale of representativeness: Middle Scale (100m2 to 0.5 km2) Site 1 -SO2, (Lat: 36.51361 Long: -89.56111) Site 2 -SO2, (Lat: 36.50861 Long: -89.56083) Site 3 -SO2 and Meteorology, (Lat: 36.50889 Long: -89.57083) 2.4 Rider Trail I-70 Site The department added a sulfur dioxide air monitor to the existing Rider Trail I-70 monitoring site in May 2016. The addition of a sulfur dioxide monitor at this site is to evaluate sulfur dioxide levels in the general area. Any sulfur dioxide concentrations monitored at this site may be due to several emissions sources in the area. If the monitor records sulfur dioxide at levels of concern, the department will gather additional information to try to determine which sources are causing or contributing to the levels of concern. Since the site was installed the fourth highest daily 1-hour SO2 concentration monitored in 2016 was 14 ppb. The fourth highest daily 1-hour SO2 concentration monitored in 2017 through 5/22/17 is 10 ppb. Since the monitor is located in the near-roadway environment and there are several SO2 sources in the area, the department is initially classifying the spatial scale of representativeness of the SO2 measurements as middle-scale. This classification may be reevaluated if trends in the monitoring data and other analysis warrant increasing the spatial scale of representativeness. The monitoring objective for this monitor is to measure population exposure.
2017 Monitoring Network Plan Missouri Department of Natural Resources Rev. 1, July 3, 2017 20
3. National Air Toxics Trends Stations (NATTS), and Other Non-Criteria Pollutant Special Purpose Monitoring 3.1 National Air Toxics Trends Stations Monitoring Routine NATTS monitoring will continue at Blair Street. Operation of the near real time PM10 Metals Monitor (Xact™ 620) at the Blair Street site was discontinued in January 2017 due to lack of funds for extensive repairs to the instrument. 3.2 Organic and Elemental Carbon Monitor Evaluation Project The EPA Office of Air Quality Planning and Standards (OAQPS) contacted the EPA Regional Office and the state of Missouri about participating in a three year monitor evaluation study which began in the summer/fall of 2011. EPA provided the monitor and certain related components in exchange for the state providing in-kind staff time to operate and report data to the EPA Air Quality System (AQS) from the instrument. The location for the study is the Blair St. site, since the site is currently part of the NCore, NATTS and Chemical Speciation monitoring programs. The data from the Blair Street site is used extensively in various health and air pollution studies. Since elemental and organic carbon account for a significant amount of the particulate matter mass measured at this site at various times, understanding the temporal variation in carbon species relative to the 24-hr integrated filter based carbon data will be useful in understanding the local source contributions and diurnal variation in the carbon concentrations. This project will be useful in supplementing ambient air monitoring data objectives addressed in EPA’s multi-pollutant monitoring strategy. Currently, the preliminary near real-time monitoring data for this monitor is being reported each hour to the State of Missouri web page and is being uploaded to AQS. Continued operation of this instrument is dependent on the availability of funds. 3.3 Black Carbon As part of the condition of receiving one time section 103 Grant funds to implement certain sites for the near-roadway monitoring network, the department will continue to conduct special purpose PM2.5 black carbon monitoring at the Forest Park and Blue Ridge I-70 near roadway NO2 sites as well as at the Blair Street NATTS site using aethalometers.
2017 Monitoring Network Plan Missouri Department of Natural Resources Rev. 1, July 3, 2017 21
4. PM2.5 Monitoring Network 4.1 PM2.5 SLAMS Network The TEOM-1405-DF is the primary instrument being used in the state network for PM2.5 measurement. The EPA has also designated the TEOM-1405-DF, operating with firmware version 1.70 and later, as a Federal Equivalent Method (FEM) on November 12, 2013 for PM10 and PM10-2.5, (http://www.gpo.gov/fdsys/pkg/FR-2013-11-12/pdf/2013-27016.pdf). The Thermo-Fisher 1.71 firmware version has been integrated into the TEOM-1405-DF monitors, and the department is evaluating the performance of the instruments with this firmware for PM10 measurement. Until this evaluation is completed, the PM10 FEM channels from the TEOM-1405-DF instruments are not being reported to AQS. Once the instruments are determined to be successfully operating for these channels, the PM10c and PM10 parameters will provide more temporal and spatial coverage for PM10 in the network. Network PM2.5 collocated FRM requirements were previously satisfied at the Blair Street NCore site in St. Louis and the Troost site in Kansas City. The following page reports the FRM/FEM Comparability statistics (Class III performance criteria of 40 CFR Part 53) for three years of the TEOM-1405-DF (EQPM-0609-182) operating at the Blair Street, St. Louis NCore site. The additive and multiplicative bias meets the Class III performance criteria of 40 CFR Part 53. The “Revisions to Ambient Monitoring Quality Assurance and Other Requirements; Final Rule,” Federal Register volume 81, number 59 (March 28, 2016), effective April 27, 2016, removed the requirement for collocated monitoring for PM10-2.5 at NCore sites from 40 CFR Part 58. Therefore, operation of the collocated set of filter samplers used for measurement of PM10-2.5 filter samplers was discontinued at the Blair Street site. At the same time, the TEOM-1405-DF FEM was re-designated as the primary PM2.5 instrument at this site. The FRM PM2.5 sampler at Blair Street was re-designated as the collocated reporting FRM sampler for the state network, and also provides PM2.5 for the calculation of PM10-2.5 and reporting FRM PM2.5 for the NCore site. This change allowed the collocated FRM PM2.5 sampler at the Troost site to be discontinued. Two FRM PM10 samplers remain at Blair Street: one used to report both PM10c (at local conditions) for calculation of PM10-2.5 and PM10 at standard conditions, and a second one which provides collocation for the PM10 measurement. The current PM2.5 network is summarized in the table below. Two TEOM-1405-DF instruments are operated at the St. Joseph Pump Station site, one designated as primary, and one as collocated to satisfy the collocation requirement for that FEM method. The department will continue to operate a 1405-F PM2.5 instrument and a collocated FRM at Ladue in part to evaluate the 1405-F for possible additional future use in the network. The department also plans to operate a Teledyne API 640x instrument at Blair Street to evaluate this instrument, which measures airborne particulate concentration using light scattering, for possible future use in the network. Procurement and operation of this instrument is subject to availability of funds.

2017 Monitoring Network Plan Missouri Department of Natural Resources Rev. 1, July 3, 2017 22
Class III Performance Criteria of 40 CFR Part 53 Blair Street St. Louis Air Quality System # 29-510-0085
TEOM-1405-DF, EQPM-0609-182 (PM2.5) January 2013 through December 2015
Source: EPA AirData PM2.5 Continuous Monitor Comparability Assessments

2017 Monitoring Network Plan Missouri Department of Natural Resources Rev. 1, July 3, 2017 23
2017 Missouri PM2.5 Monitoring Network*, NAAQS=35 µg/m3 (24 hours), 12 µg/m3 (1 year)
*A Teledyne API 640 x will be added at Blair St. No other changes to the PM2.5 network are proposed in this plan.

2017 Monitoring Network Plan Missouri Department of Natural Resources Rev. 1, July 3, 2017 24
4.2 PM2.5 Chemical Speciation Network (CSN) PM2.5 speciation sampling is currently being conducted at two locations: Blair Street in St. Louis and Arnold West. The sampling schedule at Arnold West was modified to every six days in February 2015. Sampling continues to be done every three days at Blair Street. 4.3 PM2.5 Section 103 Federal Funding The department is not proposing any changes to the PM2.5 monitoring network. However, this is contingent on EPA providing 100% of the federal Section 103 grant funds at historical levels which are used to operate and maintain the PM2.5 monitoring network as established. EPA has issued only 65% of the historical Section 103 grant funding levels as of the drafting of this plan. If historical federal section 103 grant funding is not received, the plan will be modified to bring operating expenses in line with the available revenue.
40 CFR 58.14 (c) indicates that “State, or where appropriate, local agency requests for SLAMS monitor station discontinuation, subject to the review of the Regional Administrator, will be approved if any of the following criteria are met and if the requirements of appendix D to this part, if any, continue to be met. Other requests for discontinuation may also be approved on a case-by-case basis if discontinuance does not compromise data collection needed for implementation of a NAAQS and if the requirements of appendix D to this part, if any, continue to be met.” If necessary the following monitors will be considered for discontinuation in accordance with 40 CFR 58.14 (c) in this order proportionally to the amount of funding reduced: Liberty PM2.5: The monitor meets the removal criteria of 40 CFR 58.14 and has the lowest design value in the Kansas City Missouri network. The minimum PM2.5 monitoring requirement of 40 CFR 58 Appendix D is satisfied in the Kansas City area without this monitor. Discontinuance of this monitor would not compromise data collection needed for implementation of the PM2.5 NAAQS. Richards Gebaur South PM2.5: The monitor meets all but one of the removal criteria of 40 CFR 58.14. The Kansas City area minimum PM2.5 monitoring requirement of 40 CFR 58 Appendix D is satisfied without this monitor. Although the monitor has greater than 10 percent chance of exceeding 80% of the NAAQS, the monitor has lower annual PM2.5 averages over the last three years than monitors in metropolitan areas that have only one PM2.5 monitor (e.g. Springfield and St. Joseph). Discontinuance of this monitor would not compromise data collection needed for implementation of the PM2.5 NAAQS.
If federal funding reductions are significant and permanent, other cost reduction measures will be evaluated. These include but are not limited to: Additional PM2.5 monitor reductions, changes to equipment replacement plans, not evaluating the Teledyne API 640x monitoring method, and reconfiguration of hourly continuous monitoring vs. every six day filter based sampling at some sites. Consistent with 40 CFR 58.14(b) if these reductions become necessary the department will provide written communication describing the network changes to the Regional Administrator for review and approval.

2017 Monitoring Network Plan Missouri Department of Natural Resources Rev. 1, July 3, 2017 25
2017 Missouri PM2.5 Monitoring Network
2017 Monitoring Network Plan Missouri Department of Natural Resources Rev. 1, July 3, 2017 26
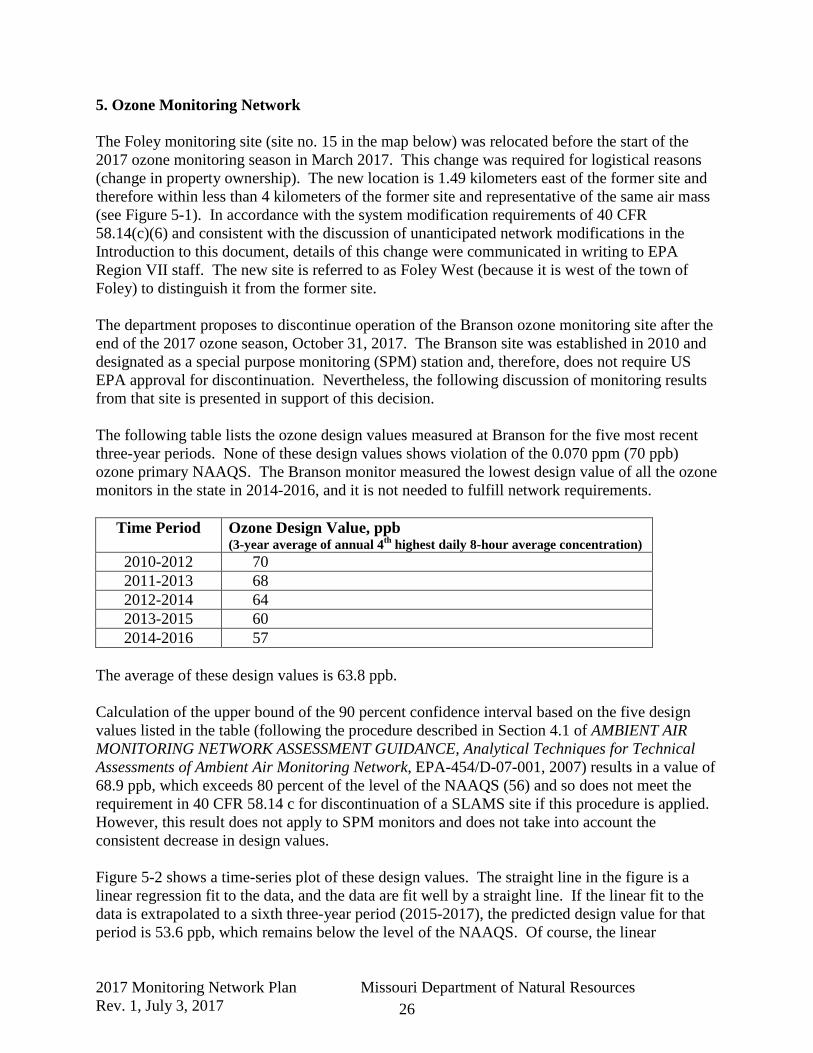
5. Ozone Monitoring Network The Foley monitoring site (site no. 15 in the map below) was relocated before the start of the 2017 ozone monitoring season in March 2017. This change was required for logistical reasons (change in property ownership). The new location is 1.49 kilometers east of the former site and therefore within less than 4 kilometers of the former site and representative of the same air mass (see Figure 5-1). In accordance with the system modification requirements of 40 CFR 58.14(c)(6) and consistent with the discussion of unanticipated network modifications in the Introduction to this document, details of this change were communicated in writing to EPA Region VII staff. The new site is referred to as Foley West (because it is west of the town of Foley) to distinguish it from the former site. The department proposes to discontinue operation of the Branson ozone monitoring site after the end of the 2017 ozone season, October 31, 2017. The Branson site was established in 2010 and designated as a special purpose monitoring (SPM) station and, therefore, does not require US EPA approval for discontinuation. Nevertheless, the following discussion of monitoring results from that site is presented in support of this decision. The following table lists the ozone design values measured at Branson for the five most recent three-year periods. None of these design values shows violation of the 0.070 ppm (70 ppb) ozone primary NAAQS. The Branson monitor measured the lowest design value of all the ozone monitors in the state in 2014-2016, and it is not needed to fulfill network requirements.
Time Period Ozone Design Value, ppb (3-year average of annual 4th highest daily 8-hour average concentration)
2010-2012 70 2011-2013 68 2012-2014 64 2013-2015 60 2014-2016 57
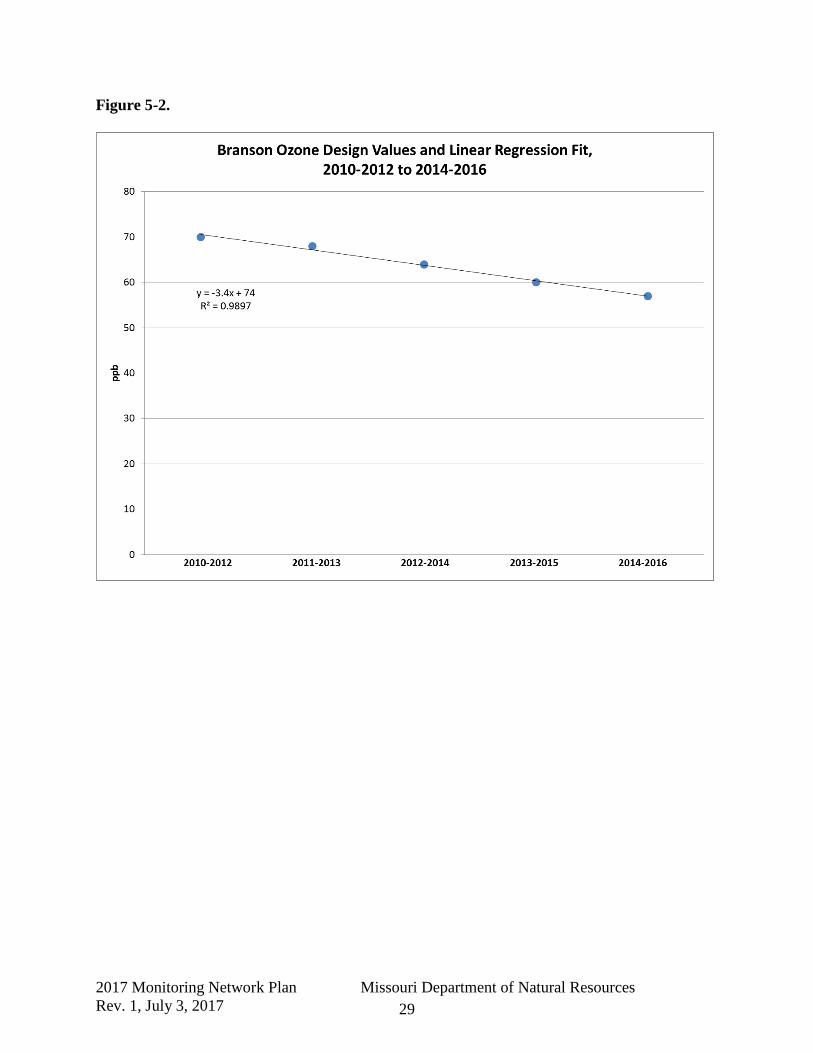
The average of these design values is 63.8 ppb. Calculation of the upper bound of the 90 percent confidence interval based on the five design values listed in the table (following the procedure described in Section 4.1 of AMBIENT AIR MONITORING NETWORK ASSESSMENT GUIDANCE, Analytical Techniques for Technical Assessments of Ambient Air Monitoring Network, EPA-454/D-07-001, 2007) results in a value of 68.9 ppb, which exceeds 80 percent of the level of the NAAQS (56) and so does not meet the requirement in 40 CFR 58.14 c for discontinuation of a SLAMS site if this procedure is applied. However, this result does not apply to SPM monitors and does not take into account the consistent decrease in design values. Figure 5-2 shows a time-series plot of these design values. The straight line in the figure is a linear regression fit to the data, and the data are fit well by a straight line. If the linear fit to the data is extrapolated to a sixth three-year period (2015-2017), the predicted design value for that period is 53.6 ppb, which remains below the level of the NAAQS. Of course, the linear

2017 Monitoring Network Plan Missouri Department of Natural Resources Rev. 1, July 3, 2017 27
decreasing trend cannot continue indefinitely, but the monotonically decreasing design values suggest that the decreasing trend will continue for some time, and the design value at this site would be expected to remain below the level of the NAAQS. Also, the excellent linear fit suggests that the width of the 90 percent confidence interval would be considerably less than that estimated above that only considers the average and does not take into account the decreasing trend. There are no other planned changes to the ozone monitoring network, and ozone monitoring will continue to be conducted all year at the Mark Twain State Park (MTSP) site to collect ozone background concentrations need for PSD modeling projects and at Blair Street to meet the NCore ozone monitoring requirement. The current monitoring network is based on the current ozone standard and ground-level ozone air quality monitoring network design requirements. The current ozone monitoring network meets the population-based requirements in 40 CFR 58 Appendix D, which requires a minimum of two sites each in the St. Louis, Kansas City, and Springfield areas. The ozone monitoring requirement for the Fayetteville-Springdale-Rogers CBSA is met by two ozone monitoring sites in Arkansas, which is reasonable, since 96 percent of the population of that CBSA is in Arkansas and only 4 percent in Missouri. Reduction of the ozone NAAQS to 70 ppb was published in the Federal Register in October 2015, effective in December 2015. That change also included extension of the ozone monitoring season in Missouri to include the month of March and a requirement for photochemical assessment monitoring stations (PAMS) at NCore sites in nonattainment areas starting in 2019. See Section 9 below for the PAMS implementation plan.

2017 Monitoring Network Plan Missouri Department of Natural Resources Rev. 1, July 3, 2017 28
Figure 5-1. Aerial photograph showing the locations of the former (west end of line) and current (east end of line) Foley monitoring sites.
2017 Monitoring Network Plan Missouri Department of Natural Resources Rev. 1, July 3, 2017 29
Figure 5-2.

2017 Monitoring Network Plan Missouri Department of Natural Resources Rev. 1, July 3, 2017 30
2017 Missouri Ozone (O3) Monitoring Network*, NAAQS=70 ppb (8 hour)
*Foley was relocated to Foley West before the start of 2017 O3 monitoring. Branson is proposed for discontinuation at the end of the 2017 O3 season. No other changes to the O3 network are proposed in this plan.
2017 Monitoring Network Plan Missouri Department of Natural Resources Rev. 1, July 3, 2017 31
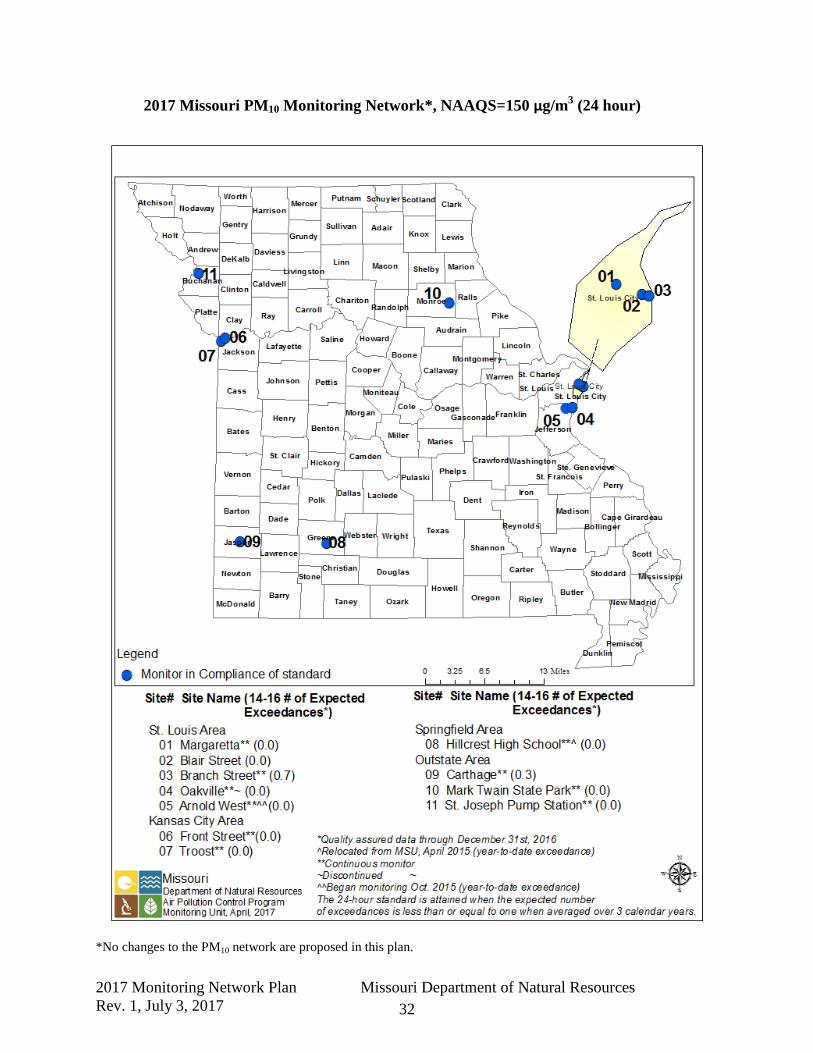
6. PM10 Monitoring Network As discussed in Section 4, the TEOM-1405-DF monitor has the capability of reporting PM10 along with the PM2.5 FEM measurements. The 1.71 firmware version has been integrated into the TEOM-1405-DF instruments, and the department is evaluating the performance of the monitors for PM10 measurement through data analysis. Once the PM10 data from these instruments is determined to be acceptable, the number of continuous PM10 monitors comparable to the NAAQS will increase by three (3) sites to include Blair Street, Ladue, and South Broadway in the St. Louis area. This will bolster the count of PM10 monitors in this CBSA to a total count of nine (9) monitors, more than enough to meet the minimum monitoring requirements specified in 40 CFR 58 Appendix D §4.6 (not including the microscale Forest Park site). The PM10 minimum monitoring requirement in the Kansas City CBSA is also being met currently by the Troost and Front Street sites in Missouri and the JFK site in Kansas. Pending successful integration of the 1.71 firmware into the TEOM 1405 DF’s, the TEOM 1405 DF PM10 FEM channel can also be used for PM10 NAAQS compliance reporting at Hillcrest, Troost, St. Joseph Pump Station, Arnold West, and Branch Street. This would allow us to eventually replace the TEOM-1400ab instruments at Hillcrest, Branch St., and Arnold West and the TEOM 1405 instruments at Troost and St. Joseph Pump Station. The 2016 estimated population of the Fayetteville-Springdale-Rogers CBSA is 525,032, but only 4 percent of this population (22,620) is in Missouri. Therefore, the PM10 monitoring requirement for this area should be met by establishment of a monitoring site in Arkansas, and we understand through correspondence from the Arkansas Department of Environmental Quality that such a site has been established as of January 1, 2017. A collocated PM10 TEOM-1400ab monitor was installed at the Carthage site in April 2016. The PM10 low volume samplers at Troost and St. Joseph Pump Station have been replaced with TEOM 1405 instruments. This leaves only the Blair Street site with a low-volume filter-based PM10 sampler and a collocated low-volume filter-based PM10 sampler, which meets the collocation requirement.
2017 Monitoring Network Plan Missouri Department of Natural Resources Rev. 1, July 3, 2017 32
2017 Missouri PM10 Monitoring Network*, NAAQS=150 µg/m3 (24 hour)
*No changes to the PM10 network are proposed in this plan.

2017 Monitoring Network Plan Missouri Department of Natural Resources Rev. 1, July 3, 2017 33
7. Nitrogen Dioxide (NO2) Monitoring Network Requirements for near-roadway NO2 monitoring are being met in the St. Louis area by the Forest Park I-40/64 and Rider Trail 1-70 monitoring sites. The requirement for near roadway NO2 monitoring in the Kansas City area is being met by the Blue Ridge I-70 site. The community-wide monitoring network requirement of 40 CFR 58 Appendix D, 4.3.3(a) is satisfied by the existing Troost and Margaretta monitoring sites. EPA has identified the Margaretta NO2 site as one of the minimum of forty additional NO2 monitoring stations nationwide in any area, inside or outside of CBSAs, above the minimum monitoring requirements, with a primary focus on siting these monitors in locations to protect susceptible and vulnerable populations. This requirement is the responsibility of the respective Regional Administrators working with their respective states consistent with 40 CFR 58 Appendix D, 4.3.4(a). For additional information about this topic consult the following EPA website resource: http://www.epa.gov/ttn/amtic/svpop.html The department added, in 2013, photolytic NO2 monitors at the Blair Street NCore site and the Forest Park near-roadway site in St. Louis. Now that the evaluation project is complete, the photolytic NO2 instrument from Forest Park has been moved to Blair Street and is the primary instrument. The Blair instrument is now a backup to the primary. Photolytic NO2 monitoring is identified in EPA’s long term monitoring strategy, and this monitoring supplement the required NOy monitoring being conducted at the NCore site. 7.1 NO2 Near-Roadway Monitoring The final rule published in 2010 revising the NAAQS to add the 1-hour standard of 100 ppb (3-year average of annual 98th percentile) requires near-road NO2 monitoring at two sites in the St. Louis CBSA (population 2.8 million) and one site in the Kansas City CBSA (population 2.0 million), based on population and traffic count. Sites were to be identified in the 2012 air monitoring network plan and begin operation by 1/1/2013. The schedule was revised in a rulemaking published in 2013 that required the first St. Louis area near-road site to begin operation in January 2014, the Kansas City area site to begin operation in January 2014, and the second St. Louis area site to begin operation in January 2015. Due in part to receipt of EPA funding for establishment of near-road sites, the department established the first St. Louis area site in January 2013, and the Kansas City area site was established in July 2013. The second near-roadway site in the St. Louis area was established in January 2015. The site selection process was described in the 2013 Monitoring Network Plan, http://dnr.mo.gov/env/apcp/2013monitoringnetworkplan.pdf. The first St. Louis area near-roadway site, Forest Park, is located adjacent to I-64 west of downtown St. Louis. Air monitoring results at that site are consistent with commuter traffic, heaviest on weekday mornings. The second St. Louis area site, called Rider Trail S. I-70, is adjacent to Interstate 70 just west of Interstate 270. Interstate 70 extends across the United States and carries through traffic in addition to commuter traffic and other local traffic. Therefore, the fleet mix and congestion patterns relative to time of day and day of the week are expected to be different than at the first site.

2017 Monitoring Network Plan Missouri Department of Natural Resources Rev. 1, July 3, 2017 34
2017 Missouri Nitrogen Dioxide (NO2) Monitoring Network*, NAAQS=100 ppb (1 hour) (2014-2016 Design Values)
*No changes to the NO2 network are proposed in this plan.

2017 Monitoring Network Plan Missouri Department of Natural Resources Rev. 1, July 3, 2017 35
8. Carbon Monoxide (CO) Monitoring Network On August 12, 2011, the EPA issued a decision to retain the existing NAAQS for CO. A final rule published on August 31, 2013 requires near-road CO monitoring at one site in the St. Louis CBSA by 1/2015 and one site in the Kansas City CBSA by 1/2017. The department established CO monitoring sites at the same time as the NO2 monitoring sites at the Forest Park I-40/64 and Blue Ridge I-70 near-roadway monitoring sites. No changes to the CO monitoring network are proposed in this plan. 2017 Missouri Carbon Monoxide (CO) Monitoring Network*, NAAQS=35 ppm (1 hour, 9 ppm (8 hour)
*No changes to the CO network are proposed in this plan.

2017 Monitoring Network Plan Missouri Department of Natural Resources Rev. 1, July 3, 2017 36
9. Photochemical Assessment Monitoring Station Implementation Plan 9.1 Introduction: Regulatory Requirements and Guidance Documents The “National Ambient Air Quality Standards for Ozone; Final Rule,” Federal Register, 80, 206 (October 26, 2015), included amendment of 40 CFR, Part 58, Appendix D (5) to include the following:
“5. NETWORK DESIGN FOR PHOTOCHEMICAL ASSESSMENT MONITORING STATIONS (PAMS) AND ENHANCED OZONE MONITORING (a) State and local monitoring agencies are required to collect and report PAMS
measurements at each NCore site required under paragraph 3(a) of this appendix located in a CBSA with a population of 1,000,000 or more, based on the latest available census figures.
(b) PAMS measurements include:
(1) Hourly averaged speciated volatile organic compounds (VOCs); (2) Three 8-hour averaged carbonyl samples per day on a 1 in 3 day schedule, or hourly averaged formaldehyde; (3) Hourly averaged O3; (4) Hourly averaged nitrogen oxide (NO), true nitrogen dioxide (NO2), and total reactive nitrogen (NOy); (5) Hourly averaged ambient temperature; (6) Hourly vector-averaged wind direction; (7) Hourly vector-averaged wind speed; (8) Hourly average atmospheric pressure; (9) Hourly averaged relative humidity; (10) Hourly precipitation; (11) Hourly averaged mixing-height; (12) Hourly averaged solar radiation; and (13) Hourly averaged ultraviolet radiation… (g) At a minimum, the monitoring agency shall collect the required PAMS measurements during the months of June, July, and August.”
The same rule included amendment of 40 CFR, Part 58.10 (a) (10) to include the following:
“A plan for making Photochemical Assessment Monitoring Stations (PAMS) measurements, if applicable, in accordance with the requirements of appendix D paragraph 5(a) of this part shall be submitted to the EPA Regional Administrator no later than July 1, 2018. The plan shall provide for the required PAMS measurements to begin by June 1, 2019.”
2017 Monitoring Network Plan Missouri Department of Natural Resources Rev. 1, July 3, 2017 37
The US EPA has published a guidance document entitled “PAMS Required Sites Quality Assurance Implementation Plan [QAIP],” October 2016, https://www3.epa.gov/ttn/amtic/files/ambient/pams/PAMS%20Quality%20Assurance%20Implementation%20Plan_092716_V4.0.pdf. The QAIP provides guidance for both US EPA and monitoring organizations in implementation of the above-referenced PAMS requirements. The QAIP includes the following recommendations:
“Monitoring organization PAMS Implementation Plan: The monitoring organization Implementation Plan document will specify how the monitoring organization will perform the measurements for the Required Network. The plan will include details on activities such as monitoring site location, costs, and schedule of events, among other information. The plan will also include any waivers to siting or monitoring methods.” (page 13) “Monitoring organizations should have their PAMS waivers and Required Network Implementation Plans finalized by July 2017 and must have them completed by the end of October 2017.20 20 The regulation requires that monitoring organization Required Network IPs be developed in their Annual Network Plans due July 2018. However, in order to be operational by June 2019, it would be beneficial to have plans finalized by the end of October 2017.” (page 21)
US EPA is also developing additional guidance including a PAMS Technical Assistance Document (TAD), standard operating procedures for some of the instrument systems, and either a national Quality Assurance Project Plan (QAPP) or model QAPP for monitoring organizations. US EPA also conducts monthly conference calls to disseminate information and guidance on PAMS monitoring.
This section of the 2017 Monitoring Network Plan is intended to fulfill the regulatory requirement in 40 CFR, Part 58.10 (a) (10) for submittal of a PAMS implementation plan by July 2018 and to meet the recommended schedule in the QAIP for submittal of the plan by July 2017 in advance of the regulatory requirement. An updated version of this plan will also be included in the 2018 Monitoring Network Plan. That plan will include any changes resulting from revision in regulatory requirements, additional guidance or planning documents from US EPA, and other additional developments in preparation and planning for PAMS monitoring during the year between Monitoring Network Plans. 9.2 PAMS Measurements MoDNR will conduct PAMS monitoring at the Blair Street Station in St. Louis. The Blair Street Station is an NCore site in a CBSA with a population of greater than 1,000,000. The NCore site in the Kansas City CBSA is in Kansas City, Kansas. Accordingly, we expect that PAMS monitoring in the Kansas City CBSA will be conducted by the state or local agency responsible for operation of that site.

2017 Monitoring Network Plan Missouri Department of Natural Resources Rev. 1, July 3, 2017 38
PAMS monitoring will begin at Blair Street in June 2019 and will be conducted during the months of June, July, and August each year as long as the regulatory requirements are in place and funding is available to support this activity. MoDNR does not plan to request any of the waivers from US EPA described in 40 CFR, Part 58, Appendix D (5) (c) through (f). Each of the required measurements in 40 CFR, Part 58, Appendix D (5) (b) is discussed below. 1. Hourly averaged speciated volatile organic compounds (VOCs). US EPA has evaluated several gas chromatographs (GC) designed to measure concentrations of hourly average speciated VOCs. US EPA plans to develop national contracts with up to three of the vendors of these GC systems and provide an instrument from one of the vendors to each monitoring organization that is required to conduct PAMS monitoring. Based on information available at this time, MoDNR expects to select either the Markes Unity-XR Thermal Desorber with Agilent 7890B Auto-Gas Chromatograph with Flame Ionization Detection or the Consolidated Analytical Systems (CAS)/Chromatotec AirmOzone Auto-Gas Chromatograph with Flame Ionization Detection. Use of either of these systems will also require procurement and installation of additional equipment and supplies, including a sampling manifold, zero air supply, gas dilution calibrator, calibration gas and associated regulators, and data logger. This list will be refined and become more detailed as more information becomes available and after the specific VOC instrument system is selected. This element of the required PAMS measurements is clearly the one that will require the most planning and preparation and will be the most labor-intensive during each summer measurement season. The table below lists target compounds for this measurement (carbonyl compounds included in the table will be measured in samples described under 2 below). 2. Three 8-hour averaged carbonyl samples per day on a 1 in 3 day schedule, or hourly averaged formaldehyde. We will procure, install, and utilize a sampler capable of collecting multiple 8-hour samples using derivatized sorbent tubes according to EPA method TO-11A. An example of such a sampler is the ATEC 8000 series. We are not aware of an instrument currently available at reasonable cost that reliably measures hourly-averaged formaldehyde; this requirement was likely written into the regulation in anticipation of future instrument development. We expect that analysis of TO-11A samples for the carbonyls listed in the table below (identified by footnote c) will be made available by US EPA using their national contract analytical laboratory.

2017 Monitoring Network Plan Missouri Department of Natural Resources Rev. 1, July 3, 2017 39
PAMS Target Compound List
Priority Compounds Optional Compounds 1 1,2,3-trimethylbenzene a 1 1,3,5-trimethylbenzene 2 1,2,4-trimethylbenzene a 2 1-pentene 3 1-butene 3 2,2-dimethylbutane 4 2,2,4-trimethylpentane b 4 2,3,4-trimethylpentane 5 acetaldehyde b,c 5 2,3-dimethylbutane 6 acetone c,d 6 2,3-dimethylpentane 7 benzene a,b 7 2,4-dimethylpentane 8 c-2-butene 8 2-methylheptane 9 ethane d 9 2-methylhexane
10 ethylbenzene a,b 10 2-methylpentane 11 ethylene 11 3-methylheptane 12 formaldehyde b,c 12 3-methylhexane 13 isobutane 13 3-methylpentane 14 isopentane 14 acetylene 15 isoprene 15 c-2-pentene 16 m&p-xylenes a,b 16 cyclohexane 17 m-ethyltoluene a 17 cyclopentane 18 n-butane 18 isopropylbenzene b 19 n-hexane b 19 m-diethlybenzene 20 n-pentane 20 methylcyclohexane 21 o-ethyltoluene a 21 methylcyclopentane 22 o-xylene a,b 22 n-decane 23 p-ethyltoluene a 23 n-heptane 24 propane 24 n-nonane 25 propylene 25 n-octane 26 styrene a,b 26 n-propylbenzene a 27 toluene a,b 27 n-undecane 28 t-2-butene 28 p-diethylbenzene 29 t-2-pentene 30 α/β-pinene 31 1,3 butadiene b 32 benzaldehyde c 33 carbon tetrachloride b 34 ethanol 35 tetrachloroethylene b
Source: Revisions to the Photochemical Assessment Monitoring Stations Compound Target List, US EPA, November 20, 2013
a Important SOAP (Secondary Organic Aerosols Precursor) Compounds b HAP (Hazardous Air Pollutant) Compounds c Carbonyl compounds d Non-reactive compounds, not considered to be VOC for regulatory purposes
2017 Monitoring Network Plan Missouri Department of Natural Resources Rev. 1, July 3, 2017 40
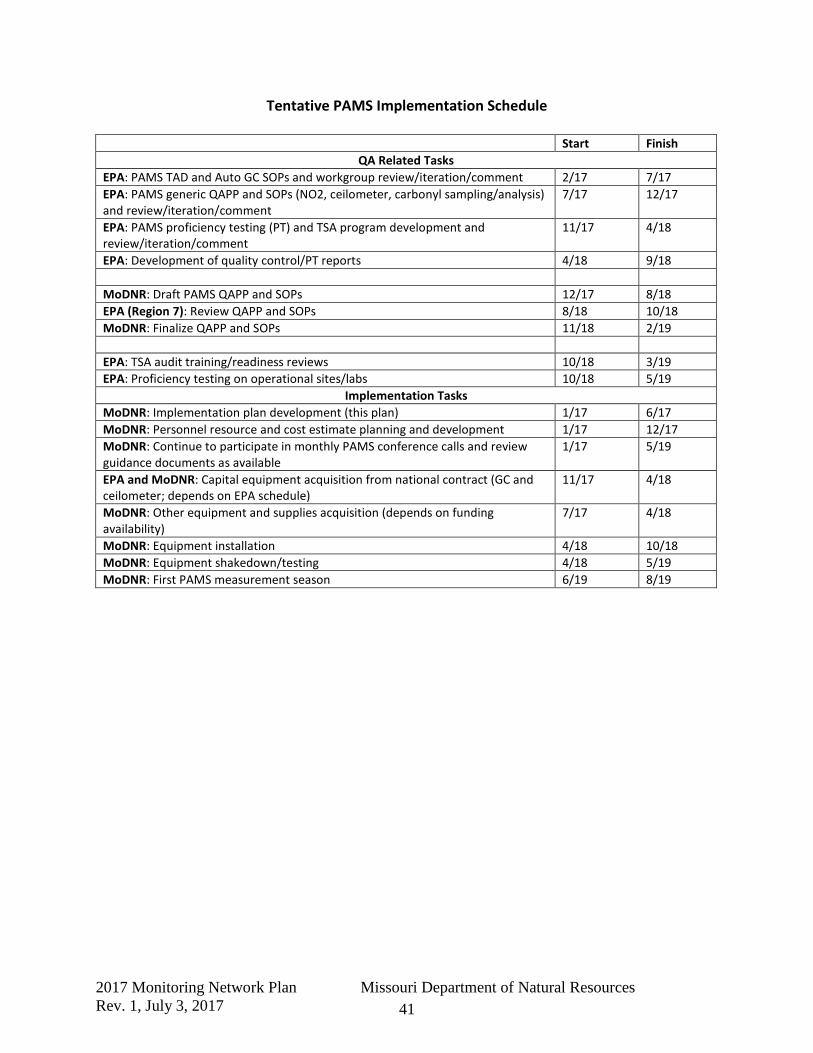
3. Hourly Averaged O3. Hourly averaged ozone is already measured at Blair Street as a part of the NCore requirements and will continue. 4. Hourly averaged nitrogen oxide (NO), true nitrogen dioxide (NO2), and total reactive nitrogen (NOy). NO and NOy are already measured at Blair Street as a part of the NCore requirements and will continue. True NO2 is already measured at Blair Street using an analyzer with a photolytic NO2 converter; this measurement will also continue. 5. -10. Hourly averaged ambient temperature, hourly vector-averaged wind direction, hourly vector-averaged wind speed, hourly average atmospheric pressure, hourly averaged relative humidity, and hourly precipitation. Temperature, wind direction, wind speed, atmospheric pressure, and relative humidity are already measured at Blair Street and will continue. We will procure, install, and utilize a precipitation measurement instrument. 11. Hourly averaged mixing height. US EPA plans to develop a national contract with one or more vendors of ceilometers, which are instruments using a laser to measure mixing height, and provide an instrument to each monitoring organization that is required to conduct PAMS monitoring. Based on information available at this time, MoDNR expects that the ceilometer to be installed and utilized is likely to be a Vaisala CL-51 with appropriate software. 12. Hourly averaged solar radiation. Solar radiation is already measured at Blair Street and will continue. 13. Hourly averaged ultraviolet radiation. We will procure, install, and utilize an ultraviolet radiation measurement instrument. 9.3 PAMS Implementation Schedule and Resource Requirements The following table lists some of the major schedule elements associated with implementation of PAMS measurement and tentative starting and ending dates (month and year) for each activity. It is based on the QAIP referenced above and associated information from US EPA, and includes relevant activities planned by US EPA. As noted in the table, timing of some of the schedule elements, especially capital equipment acquisition, depends on availability of funding and/or availability of instrumentation from national contracts; if the availability of funding or of instrumentation from national contracts is delayed, other schedule elements will be delayed, and startup of sampling in June 2019 could be jeopardized. Personnel resource and cost estimates for this activity are being developed by MoDNR and will be communicated separately to US EPA Region 7 staff.
2017 Monitoring Network Plan Missouri Department of Natural Resources Rev. 1, July 3, 2017 41
Tentative PAMS Implementation Schedule
Start Finish QA Related Tasks
EPA: PAMS TAD and Auto GC SOPs and workgroup review/iteration/comment 2/17 7/17 EPA: PAMS generic QAPP and SOPs (NO2, ceilometer, carbonyl sampling/analysis) and review/iteration/comment
7/17 12/17
EPA: PAMS proficiency testing (PT) and TSA program development and review/iteration/comment
11/17 4/18
EPA: Development of quality control/PT reports 4/18 9/18 MoDNR: Draft PAMS QAPP and SOPs 12/17 8/18 EPA (Region 7): Review QAPP and SOPs 8/18 10/18 MoDNR: Finalize QAPP and SOPs 11/18 2/19 EPA: TSA audit training/readiness reviews 10/18 3/19 EPA: Proficiency testing on operational sites/labs 10/18 5/19
Implementation Tasks MoDNR: Implementation plan development (this plan) 1/17 6/17 MoDNR: Personnel resource and cost estimate planning and development 1/17 12/17 MoDNR: Continue to participate in monthly PAMS conference calls and review guidance documents as available
1/17 5/19
EPA and MoDNR: Capital equipment acquisition from national contract (GC and ceilometer; depends on EPA schedule)
11/17 4/18
MoDNR: Other equipment and supplies acquisition (depends on funding availability)
7/17 4/18
MoDNR: Equipment installation 4/18 10/18 MoDNR: Equipment shakedown/testing 4/18 5/19 MoDNR: First PAMS measurement season 6/19 8/19
2017 Monitoring Network Plan Missouri Department of Natural Resources Rev. 1, July 3, 2017 42
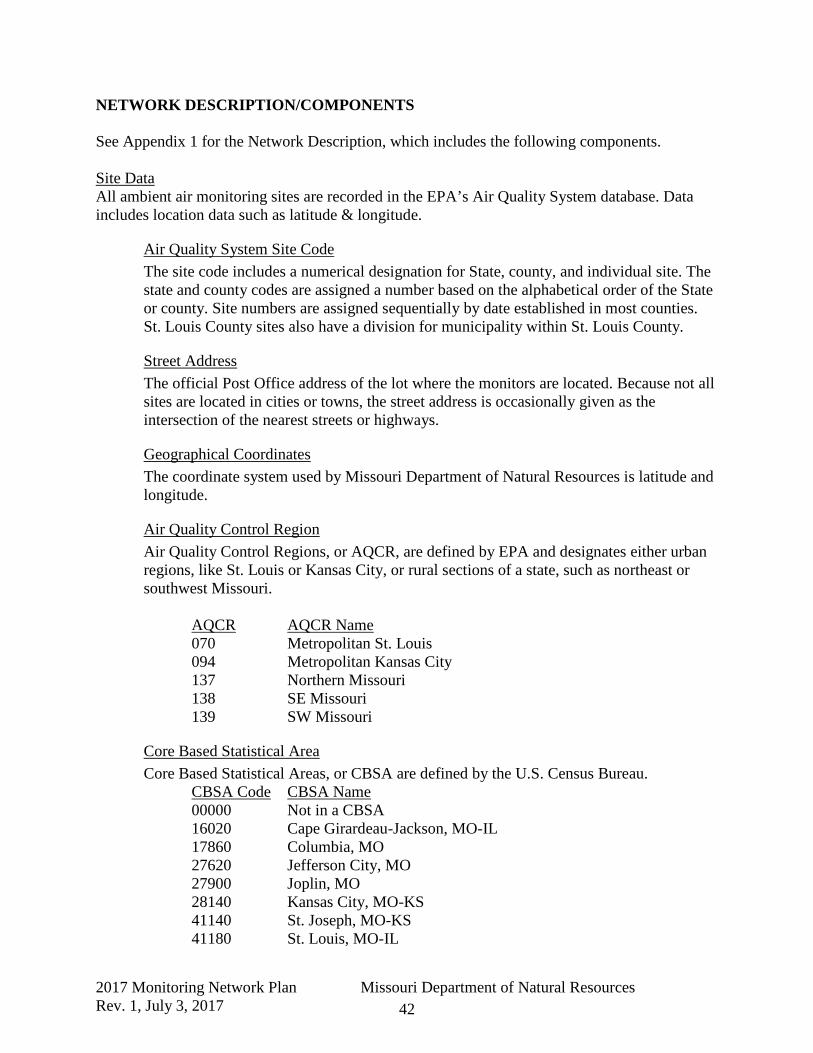
NETWORK DESCRIPTION/COMPONENTS See Appendix 1 for the Network Description, which includes the following components. Site Data All ambient air monitoring sites are recorded in the EPA’s Air Quality System database. Data includes location data such as latitude & longitude.
Air Quality System Site Code The site code includes a numerical designation for State, county, and individual site. The state and county codes are assigned a number based on the alphabetical order of the State or county. Site numbers are assigned sequentially by date established in most counties. St. Louis County sites also have a division for municipality within St. Louis County.
Street Address The official Post Office address of the lot where the monitors are located. Because not all sites are located in cities or towns, the street address is occasionally given as the intersection of the nearest streets or highways.
Geographical Coordinates The coordinate system used by Missouri Department of Natural Resources is latitude and longitude.
Air Quality Control Region Air Quality Control Regions, or AQCR, are defined by EPA and designates either urban regions, like St. Louis or Kansas City, or rural sections of a state, such as northeast or southwest Missouri.
AQCR AQCR Name 070 Metropolitan St. Louis 094 Metropolitan Kansas City 137 Northern Missouri 138 SE Missouri 139 SW Missouri
Core Based Statistical Area Core Based Statistical Areas, or CBSA are defined by the U.S. Census Bureau.
CBSA Code CBSA Name 00000 Not in a CBSA 16020 Cape Girardeau-Jackson, MO-IL 17860 Columbia, MO 27620 Jefferson City, MO 27900 Joplin, MO 28140 Kansas City, MO-KS 41140 St. Joseph, MO-KS 41180 St. Louis, MO-IL
2017 Monitoring Network Plan Missouri Department of Natural Resources Rev. 1, July 3, 2017 43
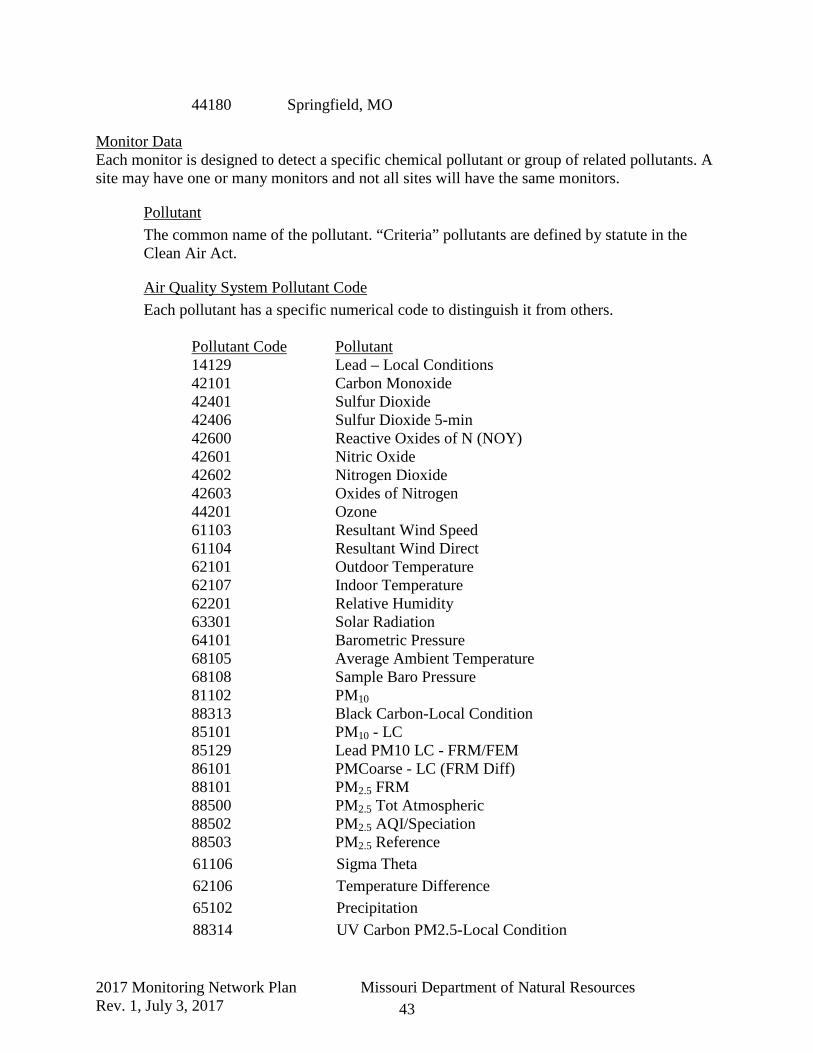
44180 Springfield, MO
Monitor Data Each monitor is designed to detect a specific chemical pollutant or group of related pollutants. A site may have one or many monitors and not all sites will have the same monitors.
Pollutant The common name of the pollutant. “Criteria” pollutants are defined by statute in the Clean Air Act.
Air Quality System Pollutant Code Each pollutant has a specific numerical code to distinguish it from others.
Pollutant Code Pollutant 14129 Lead – Local Conditions 42101 Carbon Monoxide 42401 Sulfur Dioxide 42406 Sulfur Dioxide 5-min 42600 Reactive Oxides of N (NOY) 42601 Nitric Oxide 42602 Nitrogen Dioxide 42603 Oxides of Nitrogen 44201 Ozone 61103 Resultant Wind Speed 61104 Resultant Wind Direct 62101 Outdoor Temperature 62107 Indoor Temperature 62201 Relative Humidity 63301 Solar Radiation 64101 Barometric Pressure 68105 Average Ambient Temperature 68108 Sample Baro Pressure 81102 PM10 88313 Black Carbon-Local Condition 85101 PM10 - LC 85129 Lead PM10 LC - FRM/FEM 86101 PMCoarse - LC (FRM Diff) 88101 PM2.5 FRM 88500 PM2.5 Tot Atmospheric 88502 PM2.5 AQI/Speciation 88503 PM2.5 Reference 61106 Sigma Theta 62106 Temperature Difference 65102 Precipitation 88314 UV Carbon PM2.5-Local Condition
2017 Monitoring Network Plan Missouri Department of Natural Resources Rev. 1, July 3, 2017 44
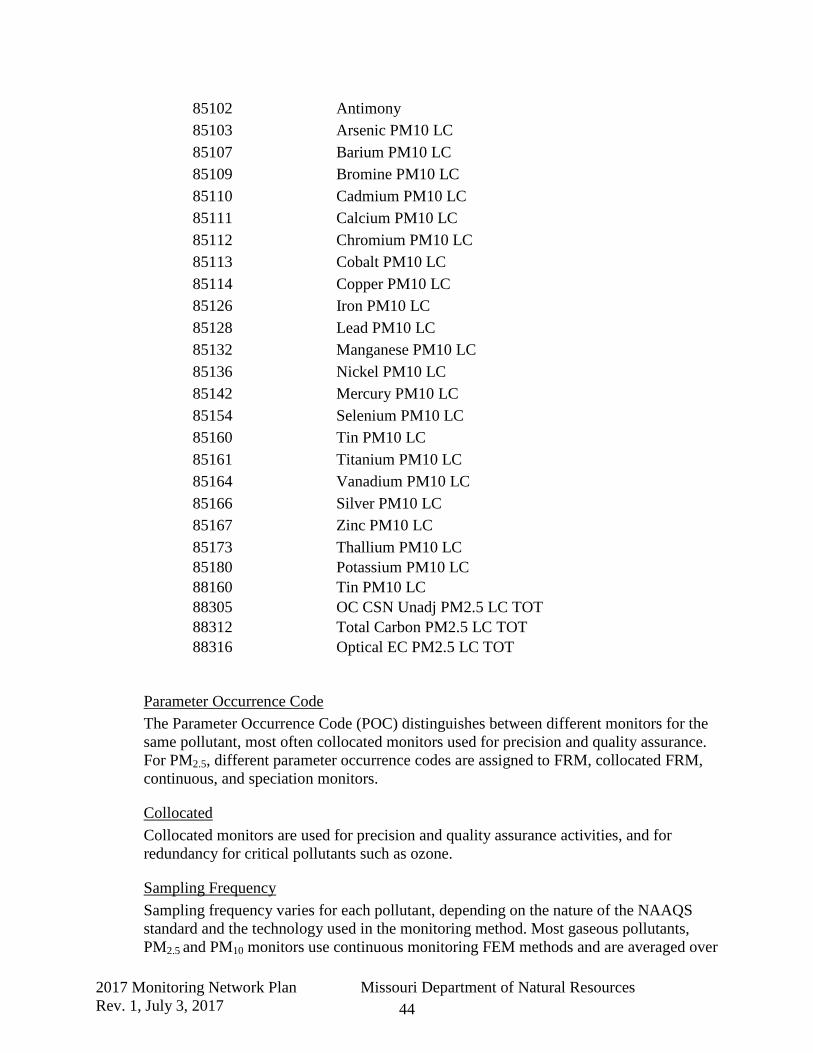
85102 Antimony 85103 Arsenic PM10 LC 85107 Barium PM10 LC 85109 Bromine PM10 LC 85110 Cadmium PM10 LC 85111 Calcium PM10 LC 85112 Chromium PM10 LC 85113 Cobalt PM10 LC 85114 Copper PM10 LC 85126 Iron PM10 LC 85128 Lead PM10 LC 85132 Manganese PM10 LC 85136 Nickel PM10 LC 85142 Mercury PM10 LC 85154 Selenium PM10 LC 85160 Tin PM10 LC 85161 Titanium PM10 LC 85164 Vanadium PM10 LC 85166 Silver PM10 LC 85167 Zinc PM10 LC 85173 Thallium PM10 LC 85180 Potassium PM10 LC 88160 Tin PM10 LC 88305 OC CSN Unadj PM2.5 LC TOT 88312 Total Carbon PM2.5 LC TOT 88316 Optical EC PM2.5 LC TOT
Parameter Occurrence Code The Parameter Occurrence Code (POC) distinguishes between different monitors for the same pollutant, most often collocated monitors used for precision and quality assurance. For PM2.5, different parameter occurrence codes are assigned to FRM, collocated FRM, continuous, and speciation monitors.
Collocated Collocated monitors are used for precision and quality assurance activities, and for redundancy for critical pollutants such as ozone.
Sampling Frequency Sampling frequency varies for each pollutant, depending on the nature of the NAAQS standard and the technology used in the monitoring method. Most gaseous pollutants, PM2.5 and PM10 monitors use continuous monitoring FEM methods and are averaged over
2017 Monitoring Network Plan Missouri Department of Natural Resources Rev. 1, July 3, 2017 45
one hour. Some particulate pollutants are filter-based FRM methods and averaged over one day.
Scale of Representation Each monitor is intended to represent an area with similar pollutant concentration. The scales range from only a few meters to many kilometers.
MIC Microscale - defines the concentration in air volumes associated with area dimensions ranging from several meters up to about 100 meters.
MID Middle - defines the concentration typical of areas up to several city blocks in size with dimensions ranging from about 100 meters to 0.5 kilometers.
NBR Neighborhood - defines concentrations within an extended area of a city that has relatively uniform land use with dimensions in the 0.5 to 4.0 kilometers.
URB Urban - defines an overall citywide condition with dimensions on the order of 4 to 50 kilometers. REG Regional - defines air quality levels over areas having dimensions of 50 to hundreds of kilometers.
Monitor Type The monitor's administrative classification as determined by the purpose for the monitor in the agency sampling strategy. Assignment of monitor types “NCORE” and “PAMS” is limited to EPA Headquarters and is done only after a complete review and approval is done for all site/monitor metadata.
Code Description IMPROVE IMPROVE or IMPROVE Protocol INDEX SITE (not currently used by MO) INDUSTRIAL Used to indicate sites operated by an industry Primary
Quality Assurance Organization (PQAO) NATTS National Air Toxics Trends Station NON-EPA FEDERAL (not currently used by MO) NON-REGULATORY Not used for NAAQS Compliance PAMS (not currently used by MO) PROPOSED NCORE QA COLLOCATED Collocated to Satisfy 40 CFR Part 58, Appendix A SLAMS State or Local Air Monitoring Station SPECIAL PURPOSE Special Purpose Monitoring Station (SPM or SPMS) SUPLMNTL SPECIATION TRENDS SPECIATION TRIBAL MONITORS (not currently used by MO) UNOFFICIAL PAMS (not currently used by MO)

2017 Monitoring Network Plan Missouri Department of Natural Resources Rev. 1, July 3, 2017 46
State Monitoring Objective Each monitor has a distinct objective such as providing real-time data for public awareness or use in determining compliance with regulations. The state monitoring objective provides more information about the purpose of the monitoring in addition to the monitor objective required of 40 CFR 58.10(a)(6).
State Objective Code Objective AQI Public Information COM NAAQS Compliance MET Meteorological Data RES Research STA State Standard
Units The physical terms used to quantify the pollutant concentration, such as parts per million or micrograms per cubic meter.
Unit Code Unit Description 001 µg/m3 007 parts per million 008 parts per billion 011 meters per second 012 miles per hour 013 knots 014 degree, compass 015 degree Fahrenheit 016 millbars 017 degree Celsius 018 Langleys 019 percent humidity 021 inches 022 inches Mercury 025 Langleys per minute 059 Millimeter (Mercury) 073 Liters/minute STP-Flow 077 Micrograms 079 Watts/m2
083 Cubic meter/minute 105 µg/m3 LC 106 Minutes 107 Percent 118 Liters/minute LC-Flow 119 Cubic meters/minute LC-Flow 121 parts per trillion
2017 Monitoring Network Plan Missouri Department of Natural Resources Rev. 1, July 3, 2017 47
Monitoring/Analytical Method Each monitor relies on a scientific principle to determine the pollutant concentration, which is described by the sampling method. Each method code is specific for a particular pollutant; therefore a three numeral code may be used for different methods for different pollutants. This is required of 40 CFR 58.10(a)(3). Monitoring Objective This is the primary monitoring objective(s) for the monitoring parameter required of 40 CFR 58.10(a)(6). The monitoring Objective is specific to the pollutant. Some sites may have more than one monitoring objective, but the primary objective is listed first.

APPENDIX 1: MISSOURI MONITORING NETWORK DESCRIPTION

Missouri Ambient Air Monitoring Network
MIC Microscale Several meters up to about 100 meters MID Middle 100 meters to 0.5 kilometer NBR Neighborhood 0.5 to 4.0 kilometers range URB Urban 4 to 50 kilometers REG Regional Tens to hundreds of kilometersCOM National Ambient Air Quality Standards (NAAQS) Compliance MET Meteorological Data N/A Not Applicable NCore National Multi-Pollutant Monitoring Stations NON-A Non-Ambient Site NON-R Non-Regulatory PQAO Primary Quality Assurance Organization RES Research SLAMS State and Local Monitoring Stations SIP State Implementation PlanSPEC Speciation STA State Standard SPM Special Purpose Monitoring SPP Special Purpose ProjectKeep Monitor under performance evaluation. Data is not reported to EPA Air Quality System (AQS)
Thursday, June 01, 2017 Page 1 of 74

Ameren Missouri (PQAO - 1440)
Labadie, North AQS Site Number
Latitude:
Longitude:
AQS CodePollutant
AQSPOC Keep
AQS MethodCode
AQSUnit-Code
38.59557
-90.82864
29-183-9004
AQCR: 070 Metropolitan St. Louis
Elevation (ft): 816
AQS Freq
MSA: 7040 St. Louis, MO-IL
~150 ft. north of Terry Rd and ~200 ft. Kingfisher Ct, Augusta, MO 63332
State-Obj
AQSScale
AQS Method
AQS Unit
AQS Monitor Type
AQS Monitor Objective
42401Sulfur Dioxide 1000081 ppb1 Ultra-violet Fluorescence
COMMIDIndustrial Source Oriented
42406Sulfur Dioxide Max 5-min Avg
1000081 ppb1 Ultra-violet Fluorescence
COMMIDIndustrial Source Oriented
Labadie, Northwest AQS Site Number
Latitude:
Longitude:
AQS CodePollutant
AQSPOC Keep
AQS MethodCode
AQSUnit-Code
38.5818
-90.865528
29-183-9002
AQCR: 070 Metropolitan St. Louis
Elevation (ft): 550
AQS Freq
MSA: 7040 St. Louis, MO-IL
Rt. 94, Augusta, MO 63332 near the intersection with Schluersburg Road
State-Obj
AQSScale
AQS Method
AQS Unit
AQS Monitor Type
AQS Monitor Objective
62101Outdoor Temperature 0400172 deg C1 Electronic Averaging
METN/AIndustrial Other (10m Probe Height)
62101Outdoor Temperature 0400173 deg C1 Electronic Averaging
METN/AIndustrial Other (2m Probe Height)
Thursday, June 01, 2017 Page 2 of 74

62106Outdoor Temperature Diff 0411161 Temp Diff deg C
1 Instrumental: Elect or Mach Avg Lev 2-Lev1
METN/AIndustrial Other (10m - 2m Probe Heights)
42401Sulfur Dioxide 1000081 ppb1 Ultra-violet Fluorescence
COMMIDIndustrial Source Oriented
42406Sulfur Dioxide Max 5-min Avg
1000081 ppb1 Ultra-violet Fluorescence
COMMIDIndustrial Source Oriented
61107WD - Sigma Theta (Vertical)
0200141 deg1 Arithmetic Standard Deviation
METN/AIndustrial Other (10m Tower)
61104Wind Direction - Resultant 0200141 deg1 Vector Summation
METN/AIndustrial Other (10m Tower)
61102Wind Direction - Scalar 0630141 deg1 ClimatronicsMETN/AIndustrial Other (10m Tower)
61103Wind Speed - Resultant 0200111 m/s1 Vector Summation
METN/AIndustrial Other (10m Tower)
61101Wind Speed - Scalar 0630111 m/s1 ClimatronicsMETN/AIndustrial Other (10m Tower)
61109Wind Speed - Vertical 0200111 m/s1 Electronic Averaging
METN/AIndustrial Other (10m Tower)
Thursday, June 01, 2017 Page 3 of 74
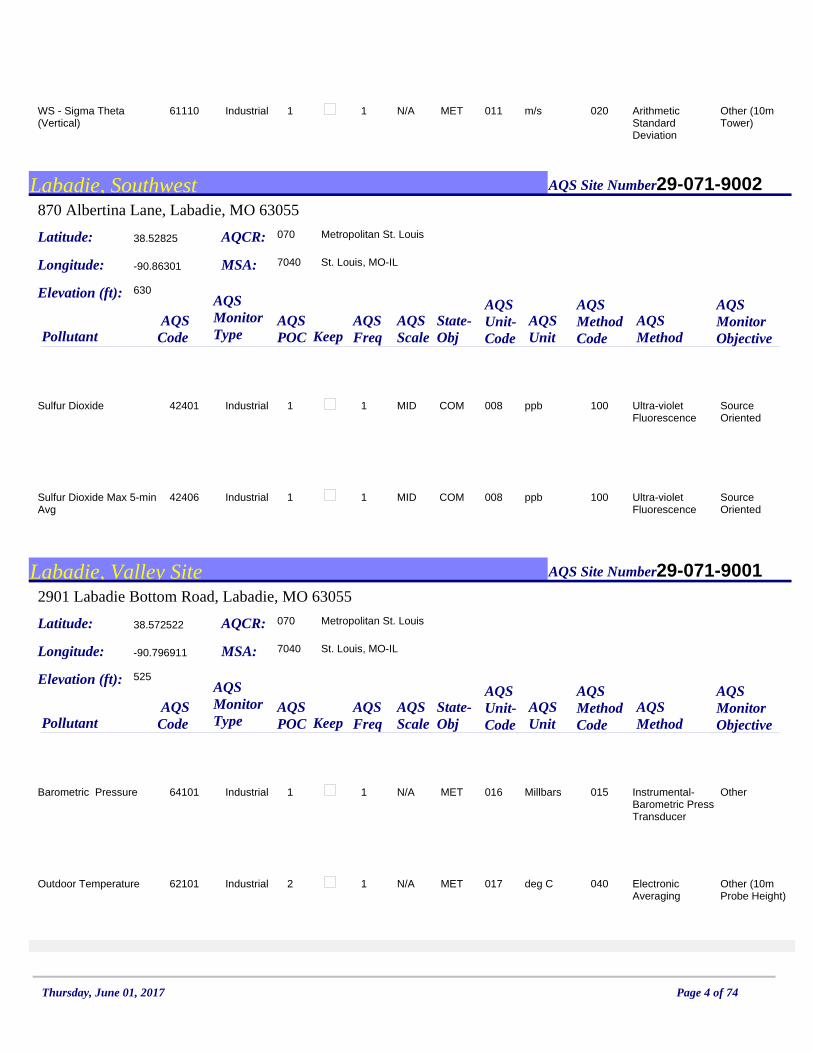
61110WS - Sigma Theta (Vertical)
0200111 m/s1 Arithmetic Standard Deviation
METN/AIndustrial Other (10m Tower)
Labadie, Southwest AQS Site Number
Latitude:
Longitude:
AQS CodePollutant
AQSPOC Keep
AQS MethodCode
AQSUnit-Code
38.52825
-90.86301
29-071-9002
AQCR: 070 Metropolitan St. Louis
Elevation (ft): 630
AQS Freq
MSA: 7040 St. Louis, MO-IL
870 Albertina Lane, Labadie, MO 63055
State-Obj
AQSScale
AQS Method
AQS Unit
AQS Monitor Type
AQS Monitor Objective
42401Sulfur Dioxide 1000081 ppb1 Ultra-violet Fluorescence
COMMIDIndustrial Source Oriented
42406Sulfur Dioxide Max 5-min Avg
1000081 ppb1 Ultra-violet Fluorescence
COMMIDIndustrial Source Oriented
Labadie, Valley Site AQS Site Number
Latitude:
Longitude:
AQS CodePollutant
AQSPOC Keep
AQS MethodCode
AQSUnit-Code
38.572522
-90.796911
29-071-9001
AQCR: 070 Metropolitan St. Louis
Elevation (ft): 525
AQS Freq
MSA: 7040 St. Louis, MO-IL
2901 Labadie Bottom Road, Labadie, MO 63055
State-Obj
AQSScale
AQS Method
AQS Unit
AQS Monitor Type
AQS Monitor Objective
64101Barometric Pressure 0150161 Millbars1 Instrumental-Barometric Press Transducer
METN/AIndustrial Other
62101Outdoor Temperature 0400172 deg C1 Electronic Averaging
METN/AIndustrial Other (10m Probe Height)
Thursday, June 01, 2017 Page 4 of 74
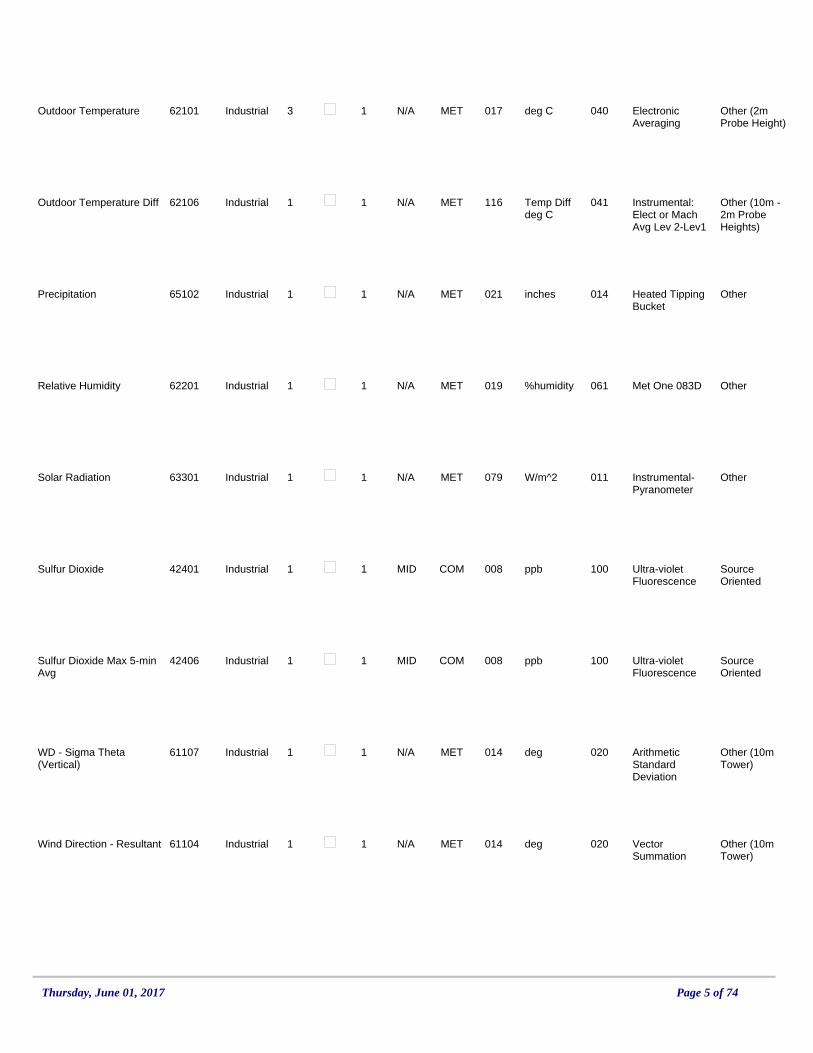
62101Outdoor Temperature 0400173 deg C1 Electronic Averaging
METN/AIndustrial Other (2m Probe Height)
62106Outdoor Temperature Diff 0411161 Temp Diff deg C
1 Instrumental: Elect or Mach Avg Lev 2-Lev1
METN/AIndustrial Other (10m - 2m Probe Heights)
65102Precipitation 0140211 inches1 Heated Tipping Bucket
METN/AIndustrial Other
62201Relative Humidity 0610191 %humidity1 Met One 083DMETN/AIndustrial Other
63301Solar Radiation 0110791 W/m^21 Instrumental-Pyranometer
METN/AIndustrial Other
42401Sulfur Dioxide 1000081 ppb1 Ultra-violet Fluorescence
COMMIDIndustrial Source Oriented
42406Sulfur Dioxide Max 5-min Avg
1000081 ppb1 Ultra-violet Fluorescence
COMMIDIndustrial Source Oriented
61107WD - Sigma Theta (Vertical)
0200141 deg1 Arithmetic Standard Deviation
METN/AIndustrial Other (10m Tower)
61104Wind Direction - Resultant 0200141 deg1 Vector Summation
METN/AIndustrial Other (10m Tower)
Thursday, June 01, 2017 Page 5 of 74

61102Wind Direction - Scalar 0630141 deg1 ClimatronicsMETN/AIndustrial Other (10m Tower)
61103Wind Speed - Resultant 0200111 m/s1 Vector Summation
METN/AIndustrial Other (10m Tower)
61101Wind Speed - Scalar 0630111 m/s1 ClimatronicsMETN/AIndustrial Other (10m Tower)
61109Wind Speed - Vertical 0200111 m/s1 Electronic Averaging
METN/AIndustrial Other (10m Tower)
61110WS - Sigma Theta (Vertical)
0200111 m/s1 Arithmetic Standard Deviation
METN/AIndustrial Other (10m Tower)
Rush Island, Fults-Site, IL AQS Site Number
Latitude:
Longitude:
AQS CodePollutant
AQSPOC Keep
AQS MethodCode
AQSUnit-Code
38.15908
-90.22728
17-133-9001
AQCR: 138 SE Missouri
Elevation (ft): 446
AQS Freq
MSA: 0000 Not in a MSA
Off Ivy Road, Fults, IL 62244
State-Obj
AQSScale
AQS Method
AQS Unit
AQS Monitor Type
AQS Monitor Objective
64101Barometric Pressure 0150161 Millbars1 Instrumental-Barometric Press Transducer
METN/AIndustrial Other
62101Outdoor Temperature 0400172 deg C1 Electronic Averaging
METN/AIndustrial Other (10m Probe Height)
Thursday, June 01, 2017 Page 6 of 74
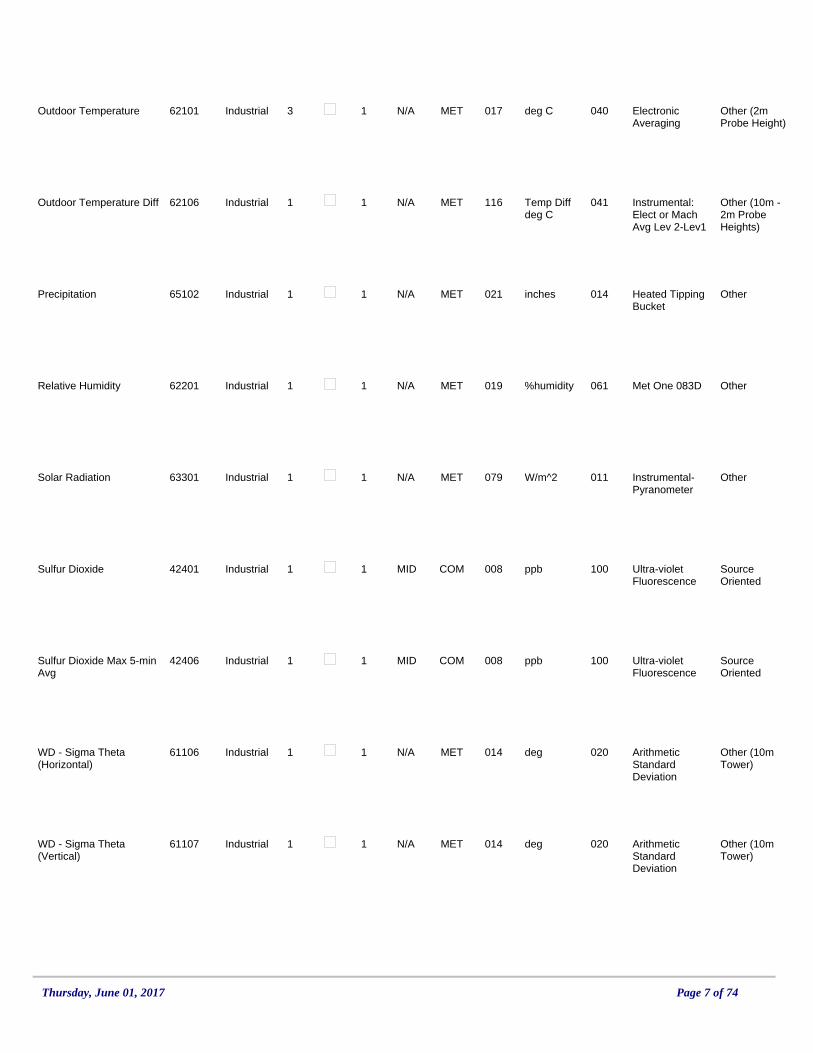
62101Outdoor Temperature 0400173 deg C1 Electronic Averaging
METN/AIndustrial Other (2m Probe Height)
62106Outdoor Temperature Diff 0411161 Temp Diff deg C
1 Instrumental: Elect or Mach Avg Lev 2-Lev1
METN/AIndustrial Other (10m - 2m Probe Heights)
65102Precipitation 0140211 inches1 Heated Tipping Bucket
METN/AIndustrial Other
62201Relative Humidity 0610191 %humidity1 Met One 083DMETN/AIndustrial Other
63301Solar Radiation 0110791 W/m^21 Instrumental-Pyranometer
METN/AIndustrial Other
42401Sulfur Dioxide 1000081 ppb1 Ultra-violet Fluorescence
COMMIDIndustrial Source Oriented
42406Sulfur Dioxide Max 5-min Avg
1000081 ppb1 Ultra-violet Fluorescence
COMMIDIndustrial Source Oriented
61106WD - Sigma Theta (Horizontal)
0200141 deg1 Arithmetic Standard Deviation
METN/AIndustrial Other (10m Tower)
61107WD - Sigma Theta (Vertical)
0200141 deg1 Arithmetic Standard Deviation
METN/AIndustrial Other (10m Tower)
Thursday, June 01, 2017 Page 7 of 74

61104Wind Direction - Resultant 0200141 deg1 Vector Summation
METN/AIndustrial Other (10m Tower)
61102Wind Direction - Scalar 0630141 deg1 ClimatronicsMETN/AIndustrial Other (10m Tower)
61103Wind Speed - Resultant 0200111 m/s1 Vector Summation
METN/AIndustrial Other (10m Tower)
61101Wind Speed - Scalar 0630111 m/s1 ClimatronicsMETN/AIndustrial Other (10m Tower)
61109Wind Speed - Vertical 0200111 m/s1 Electronic Averaging
METN/AIndustrial Other (10m Tower)
61110WS - Sigma Theta (Vertical)
0200111 m/s1 Arithmetic Standard Deviation
METN/AIndustrial Other (10m Tower)
Rush Island, Johnson Tall Tower AQS Site Number
Latitude:
Longitude:
AQS CodePollutant
AQSPOC Keep
AQS MethodCode
AQSUnit-Code
38.11999
-90.28214
29-099-9008
AQCR: 070 Metropolitan St. Louis
Elevation (ft): 656
AQS Freq
MSA: 7040 St. Louis, MO-IL
600 Johnson Rd., Festus, MO 63028
State-Obj
AQSScale
AQS Method
AQS Unit
AQS Monitor Type
AQS Monitor Objective
62101Outdoor Temperature 0400172 deg C1 Electronic Averaging
METN/AIndustrial Other (62.5m Probe Height)
Thursday, June 01, 2017 Page 8 of 74

62101Outdoor Temperature 0400173 deg C1 Electronic Averaging
METN/AIndustrial Other (132.5m Probe Height)
62106Outdoor Temperature Diff 0411161 Temp Diff deg C
1 Instrumental: Elect or Mach Avg Lev 2-Lev1
METN/AIndustrial Other (132.5m- 62.5m Probe Heights)
61106WD - Sigma Theta (Horizontal)
0200141 deg1 Arithmetic Standard Deviation
METN/AIndustrial Other (132.5m Probe Height)
61106WD - Sigma Theta (Horizontal)
0200142 deg1 Arithmetic Standard Deviation
METN/AIndustrial Other (62.5m Probe Height)
61106WD - Sigma Theta (Horizontal)
0200143 deg1 Arithmetic Standard Deviation
METN/AIndustrial Other (62.5m Probe Height)
61106WD - Sigma Theta (Horizontal)
0200144 deg1 Arithmetic Standard Deviation
METN/AIndustrial Other (62.5m Probe Height)
61106WD - Sigma Theta (Horizontal)
0200145 deg1 Arithmetic Standard Deviation
METN/AIndustrial Other (62.5m Probe Height)
61106WD - Sigma Theta (Horizontal)
0200146 deg1 Arithmetic Standard Deviation
METN/AIndustrial Other (62.5m Probe Height)
61107WD - Sigma Theta (Vertical)
0200141 deg1 Arithmetic Standard Deviation
METN/AIndustrial Other (132.5m Probe Height)
61107WD - Sigma Theta (Vertical)
0200142 deg1 Arithmetic Standard Deviation
METN/AIndustrial Other (62.5m Probe Height)
Thursday, June 01, 2017 Page 9 of 74

61107WD - Sigma Theta (Vertical)
0200143 deg1 Arithmetic Standard Deviation
METN/AIndustrial Other (132.5m Probe Height)
61107WD - Sigma Theta (Vertical)
0200144 deg1 Arithmetic Standard Deviation
METN/AIndustrial Other (132.5m Probe Height)
61107WD - Sigma Theta (Vertical)
0200145 deg1 Arithmetic Standard Deviation
METN/AIndustrial Other (132.5m Probe Height)
61107WD - Sigma Theta (Vertical)
0200146 deg1 Arithmetic Standard Deviation
METN/AIndustrial Other (132.5m Probe Height)
61104Wind Direction - Resultant 0200141 deg1 Vector Summation
METN/AIndustrial Other (132.5m Probe Height)
61104Wind Direction - Resultant 0200142 deg1 Vector Summation
METN/AIndustrial Other (62.5m Probe Height)
61104Wind Direction - Resultant 0200143 deg1 Vector Summation
METN/AIndustrial Other (62.5m Probe Height)
61102Wind Direction - Scalar 0630141 deg1 ClimatronicsMETN/AIndustrial Other (132.5m Probe Height)
61102Wind Direction - Scalar 0630142 deg1 ClimatronicsMETN/AIndustrial Other (62.5m Probe Height)
61102Wind Direction - Scalar 0630143 deg1 ClimatronicsMETN/AIndustrial Other (62.5m Probe Height)
Thursday, June 01, 2017 Page 10 of 74

61103Wind Speed - Resultant 0200111 m/s1 Vector Summation
METN/AIndustrial Other (132.5m Probe Height)
61103Wind Speed - Resultant 0200112 m/s1 Vector Summation
METN/AIndustrial Other (62.5m Probe Height)
61103Wind Speed - Resultant 0200113 m/s1 Vector Summation
METN/AIndustrial Other (62.5m Probe Height)
61101Wind Speed - Scalar 0630111 m/s1 ClimatronicsMETN/AIndustrial Other (132.5m Probe Height)
61101Wind Speed - Scalar 0630112 m/s1 ClimatronicsMETN/AIndustrial Other (62.5m Probe Height)
61101Wind Speed - Scalar 0630113 m/s1 ClimatronicsMETN/AIndustrial Other (62.5m Probe Height)
61109Wind Speed - Vertical 0200111 m/s1 Electronic Averaging
METN/AIndustrial Other (132.5m Probe Height)
61109Wind Speed - Vertical 0200112 m/s1 Electronic Averaging
METN/AIndustrial Other (62.5m Probe Height)
61109Wind Speed - Vertical 0200113 m/s1 Electronic Averaging
METN/AIndustrial Other (62.5m Probe Height)
61110WS - Sigma Theta (Vertical)
0200111 m/s1 Arithmetic Standard Deviation
METN/AIndustrial Other (132.5m Probe Height)
Thursday, June 01, 2017 Page 11 of 74

61110WS - Sigma Theta (Vertical)
0200112 m/s1 Arithmetic Standard Deviation
METN/AIndustrial Other (62.5m Probe Height)
61110WS - Sigma Theta (Vertical)
0200113 m/s1 Arithmetic Standard Deviation
METN/AIndustrial Other (62.5m Probe Height)
Rush Island, Natchez AQS Site Number
Latitude:
Longitude:
AQS CodePollutant
AQSPOC Keep
AQS MethodCode
AQSUnit-Code
38.10525
-90.29842
29-099-9009
AQCR: 070 Metropolitan St. Louis
Elevation (ft): 505
AQS Freq
MSA: 7040 St. Louis, MO-IL
917 Natchez Trace Drive, Bloomsdale, MO 63627
State-Obj
AQSScale
AQS Method
AQS Unit
AQS Monitor Type
AQS Monitor Objective
42401Sulfur Dioxide 1000081 ppb1 Ultra-violet Fluorescence
COMMIDIndustrial Source Oriented
42406Sulfur Dioxide Max 5-min Avg
1000081 ppb1 Ultra-violet Fluorescence
COMMIDIndustrial Source Oriented
Rush Island, Weaver Road & Highway AA AQS Site Number
Latitude:
Longitude:
AQS CodePollutant
AQSPOC Keep
AQS MethodCode
AQSUnit-Code
38.144972
-90.304783
29-099-9007
AQCR: 070 Metropolitan St. Louis
Elevation (ft): 502
AQS Freq
MSA: 7040 St. Louis, MO-IL
802 Weaver Road, Festus, MO 63028
State-Obj
AQSScale
AQS Method
AQS Unit
AQS Monitor Type
AQS Monitor Objective
42401Sulfur Dioxide 1000081 ppb1 Ultra-violet Fluorescence
COMMIDIndustrial Source Oriented
Thursday, June 01, 2017 Page 12 of 74

42406Sulfur Dioxide Max 5-min Avg
1000081 ppb1 Ultra-violet Fluorescence
COMMIDIndustrial Source Oriented
Thursday, June 01, 2017 Page 13 of 74
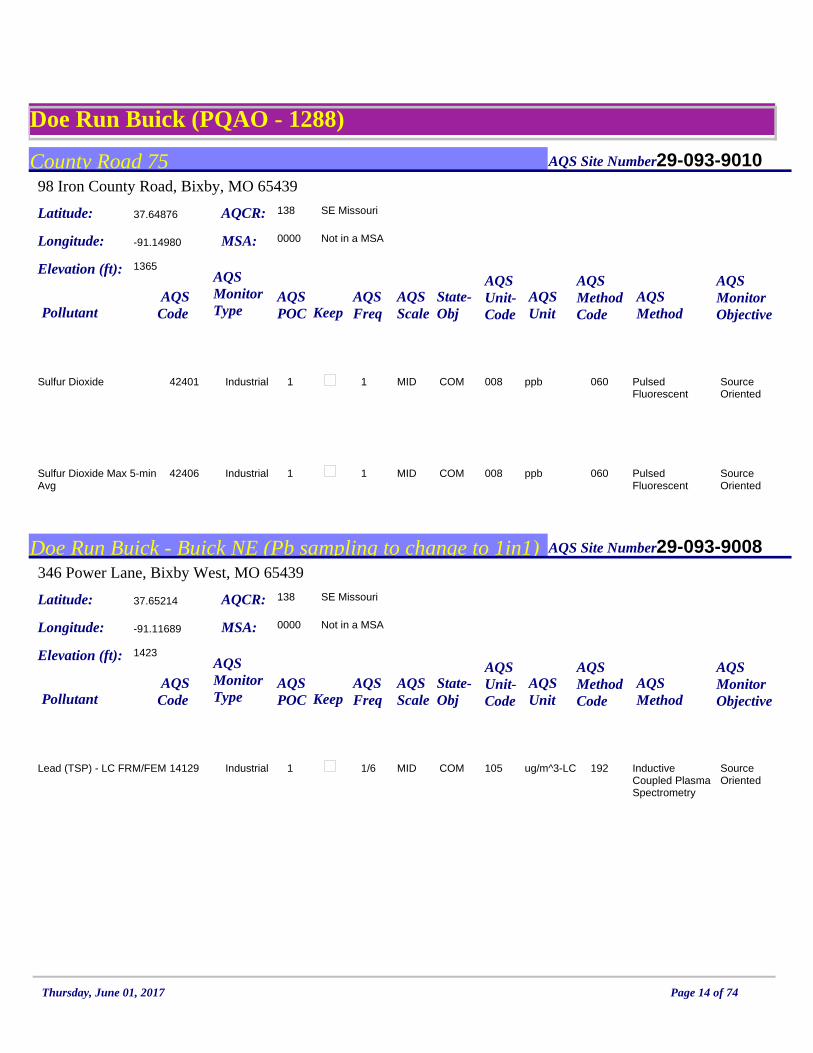
Doe Run Buick (PQAO - 1288)
County Road 75 AQS Site Number
Latitude:
Longitude:
AQS CodePollutant
AQSPOC Keep
AQS MethodCode
AQSUnit-Code
37.64876
-91.14980
29-093-9010
AQCR: 138 SE Missouri
Elevation (ft): 1365
AQS Freq
MSA: 0000 Not in a MSA
98 Iron County Road, Bixby, MO 65439
State-Obj
AQSScale
AQS Method
AQS Unit
AQS Monitor Type
AQS Monitor Objective
42401Sulfur Dioxide 0600081 ppb1 Pulsed Fluorescent
COMMIDIndustrial Source Oriented
42406Sulfur Dioxide Max 5-min Avg
0600081 ppb1 Pulsed Fluorescent
COMMIDIndustrial Source Oriented
Doe Run Buick - Buick NE (Pb sampling to change to 1in1) AQS Site Number
Latitude:
Longitude:
AQS CodePollutant
AQSPOC Keep
AQS MethodCode
AQSUnit-Code
37.65214
-91.11689
29-093-9008
AQCR: 138 SE Missouri
Elevation (ft): 1423
AQS Freq
MSA: 0000 Not in a MSA
346 Power Lane, Bixby West, MO 65439
State-Obj
AQSScale
AQS Method
AQS Unit
AQS Monitor Type
AQS Monitor Objective
14129Lead (TSP) - LC FRM/FEM 1921051 ug/m^3-LC1/6 Inductive Coupled Plasma Spectrometry
COMMIDIndustrial Source Oriented
Thursday, June 01, 2017 Page 14 of 74
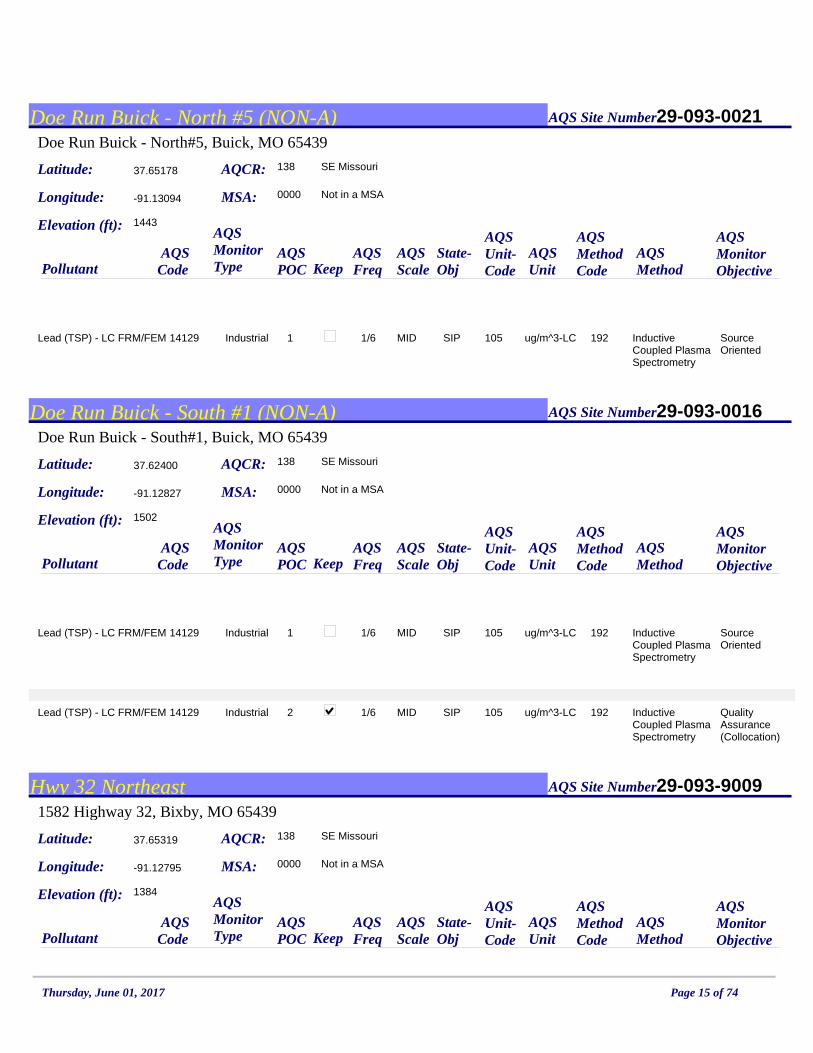
Doe Run Buick - North #5 (NON-A) AQS Site Number
Latitude:
Longitude:
AQS CodePollutant
AQSPOC Keep
AQS MethodCode
AQSUnit-Code
37.65178
-91.13094
29-093-0021
AQCR: 138 SE Missouri
Elevation (ft): 1443
AQS Freq
MSA: 0000 Not in a MSA
Doe Run Buick - North#5, Buick, MO 65439
State-Obj
AQSScale
AQS Method
AQS Unit
AQS Monitor Type
AQS Monitor Objective
14129Lead (TSP) - LC FRM/FEM 1921051 ug/m^3-LC1/6 Inductive Coupled Plasma Spectrometry
SIPMIDIndustrial Source Oriented
Doe Run Buick - South #1 (NON-A) AQS Site Number
Latitude:
Longitude:
AQS CodePollutant
AQSPOC Keep
AQS MethodCode
AQSUnit-Code
37.62400
-91.12827
29-093-0016
AQCR: 138 SE Missouri
Elevation (ft): 1502
AQS Freq
MSA: 0000 Not in a MSA
Doe Run Buick - South#1, Buick, MO 65439
State-Obj
AQSScale
AQS Method
AQS Unit
AQS Monitor Type
AQS Monitor Objective
14129Lead (TSP) - LC FRM/FEM 1921051 ug/m^3-LC1/6 Inductive Coupled Plasma Spectrometry
SIPMIDIndustrial Source Oriented
14129Lead (TSP) - LC FRM/FEM 1921052 ug/m^3-LC1/6 Inductive Coupled Plasma Spectrometry
SIPMIDIndustrial Quality Assurance (Collocation)
Hwy 32 Northeast AQS Site Number
Latitude:
Longitude:
AQS CodePollutant
AQSPOC Keep
AQS MethodCode
AQSUnit-Code
37.65319
-91.12795
29-093-9009
AQCR: 138 SE Missouri
Elevation (ft): 1384
AQS Freq
MSA: 0000 Not in a MSA
1582 Highway 32, Bixby, MO 65439
State-Obj
AQSScale
AQS Method
AQS Unit
AQS Monitor Type
AQS Monitor Objective
Thursday, June 01, 2017 Page 15 of 74
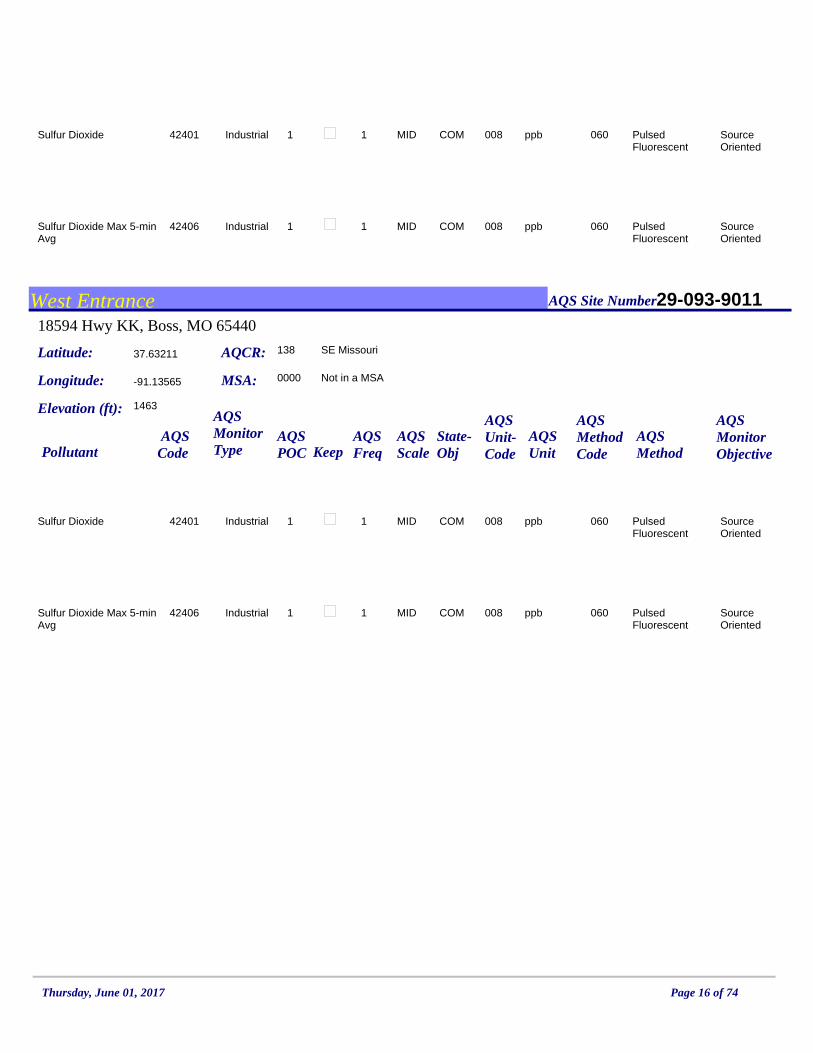
42401Sulfur Dioxide 0600081 ppb1 Pulsed Fluorescent
COMMIDIndustrial Source Oriented
42406Sulfur Dioxide Max 5-min Avg
0600081 ppb1 Pulsed Fluorescent
COMMIDIndustrial Source Oriented
West Entrance AQS Site Number
Latitude:
Longitude:
AQS CodePollutant
AQSPOC Keep
AQS MethodCode
AQSUnit-Code
37.63211
-91.13565
29-093-9011
AQCR: 138 SE Missouri
Elevation (ft): 1463
AQS Freq
MSA: 0000 Not in a MSA
18594 Hwy KK, Boss, MO 65440
State-Obj
AQSScale
AQS Method
AQS Unit
AQS Monitor Type
AQS Monitor Objective
42401Sulfur Dioxide 0600081 ppb1 Pulsed Fluorescent
COMMIDIndustrial Source Oriented
42406Sulfur Dioxide Max 5-min Avg
0600081 ppb1 Pulsed Fluorescent
COMMIDIndustrial Source Oriented
Thursday, June 01, 2017 Page 16 of 74

Doe Run Glover (PQAO - 1289)
Doe Run Glover - Big Creek #5 (NON-A) AQS Site Number
Latitude:
Longitude:
AQS CodePollutant
AQSPOC Keep
AQS MethodCode
AQSUnit-Code
37.47211
-90.68919
29-093-0029
AQCR: 138 SE Missouri
Elevation (ft): 836
AQS Freq
MSA: 0000 Not in a MSA
Doe Run Glover - Big Creek #5, Hwy 49 Glover, MO 65439
State-Obj
AQSScale
AQS Method
AQS Unit
AQS Monitor Type
AQS Monitor Objective
14129Lead (TSP) - LC FRM/FEM 1891051 ug/m^3-LC1/6 Inter-Mountain Lab, Inc Mass Spectra ICAP
SIPMIDIndustrial Source Oriented
Doe Run Glover - Post Office #2 (NON-A) AQS Site Number
Latitude:
Longitude:
AQS CodePollutant
AQSPOC Keep
AQS MethodCode
AQSUnit-Code
37.48532
-90.68991
29-093-0027
AQCR: 138 SE Missouri
Elevation (ft): 831
AQS Freq
MSA: 0000 Not in a MSA
Doe Run Glover - Post Office #2, Hwy 49 Glover, MO 65439
State-Obj
AQSScale
AQS Method
AQS Unit
AQS Monitor Type
AQS Monitor Objective
14129Lead (TSP) - LC FRM/FEM 1891051 ug/m^3-LC1/6 Inter-Mountain Lab, Inc Mass Spectra ICAP
SIPMIDIndustrial Source Oriented
14129Lead (TSP) - LC FRM/FEM 1891052 ug/m^3-LC1/6 Inter-Mountain Lab, Inc Mass Spectra ICAP
SIPMIDIndustrial Quality Assurance (Collocation)
Thursday, June 01, 2017 Page 17 of 74
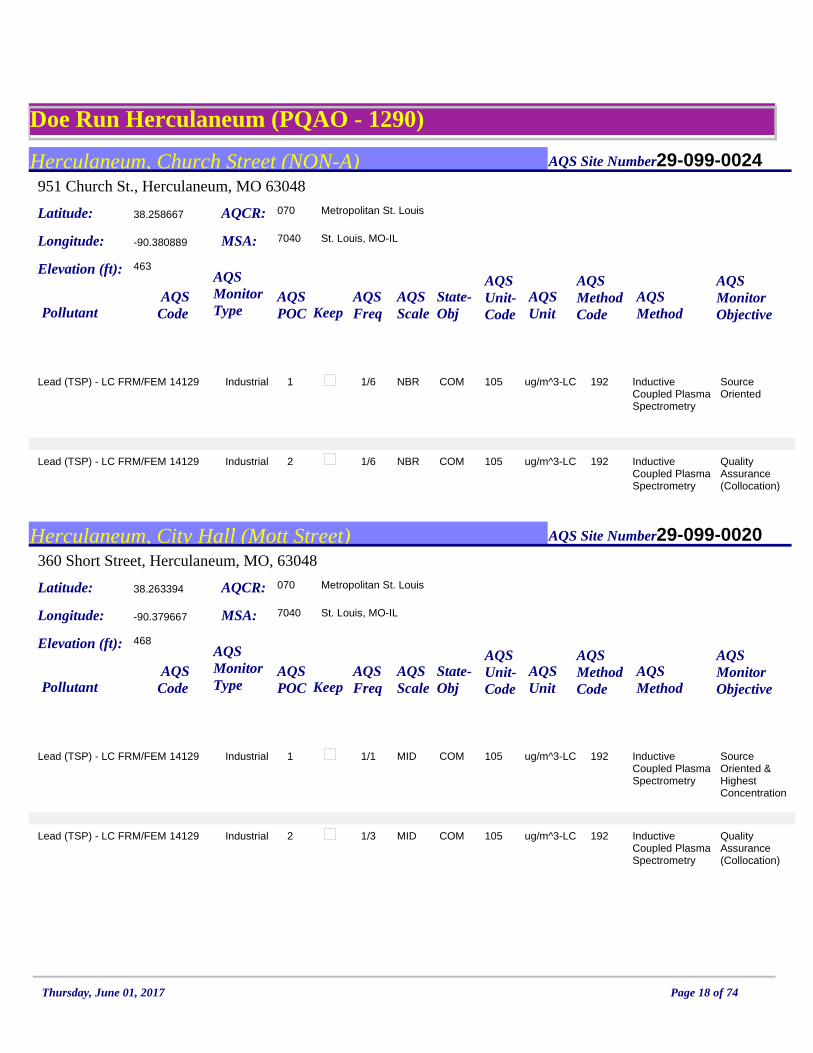
Doe Run Herculaneum (PQAO - 1290)
Herculaneum, Church Street (NON-A) AQS Site Number
Latitude:
Longitude:
AQS CodePollutant
AQSPOC Keep
AQS MethodCode
AQSUnit-Code
38.258667
-90.380889
29-099-0024
AQCR: 070 Metropolitan St. Louis
Elevation (ft): 463
AQS Freq
MSA: 7040 St. Louis, MO-IL
951 Church St., Herculaneum, MO 63048
State-Obj
AQSScale
AQS Method
AQS Unit
AQS Monitor Type
AQS Monitor Objective
14129Lead (TSP) - LC FRM/FEM 1921051 ug/m^3-LC1/6 Inductive Coupled Plasma Spectrometry
COMNBRIndustrial Source Oriented
14129Lead (TSP) - LC FRM/FEM 1921052 ug/m^3-LC1/6 Inductive Coupled Plasma Spectrometry
COMNBRIndustrial Quality Assurance (Collocation)
Herculaneum, City Hall (Mott Street) AQS Site Number
Latitude:
Longitude:
AQS CodePollutant
AQSPOC Keep
AQS MethodCode
AQSUnit-Code
38.263394
-90.379667
29-099-0020
AQCR: 070 Metropolitan St. Louis
Elevation (ft): 468
AQS Freq
MSA: 7040 St. Louis, MO-IL
360 Short Street, Herculaneum, MO, 63048
State-Obj
AQSScale
AQS Method
AQS Unit
AQS Monitor Type
AQS Monitor Objective
14129Lead (TSP) - LC FRM/FEM 1921051 ug/m^3-LC1/1 Inductive Coupled Plasma Spectrometry
COMMIDIndustrial Source Oriented & Highest Concentration
14129Lead (TSP) - LC FRM/FEM 1921052 ug/m^3-LC1/3 Inductive Coupled Plasma Spectrometry
COMMIDIndustrial Quality Assurance (Collocation)
Thursday, June 01, 2017 Page 18 of 74
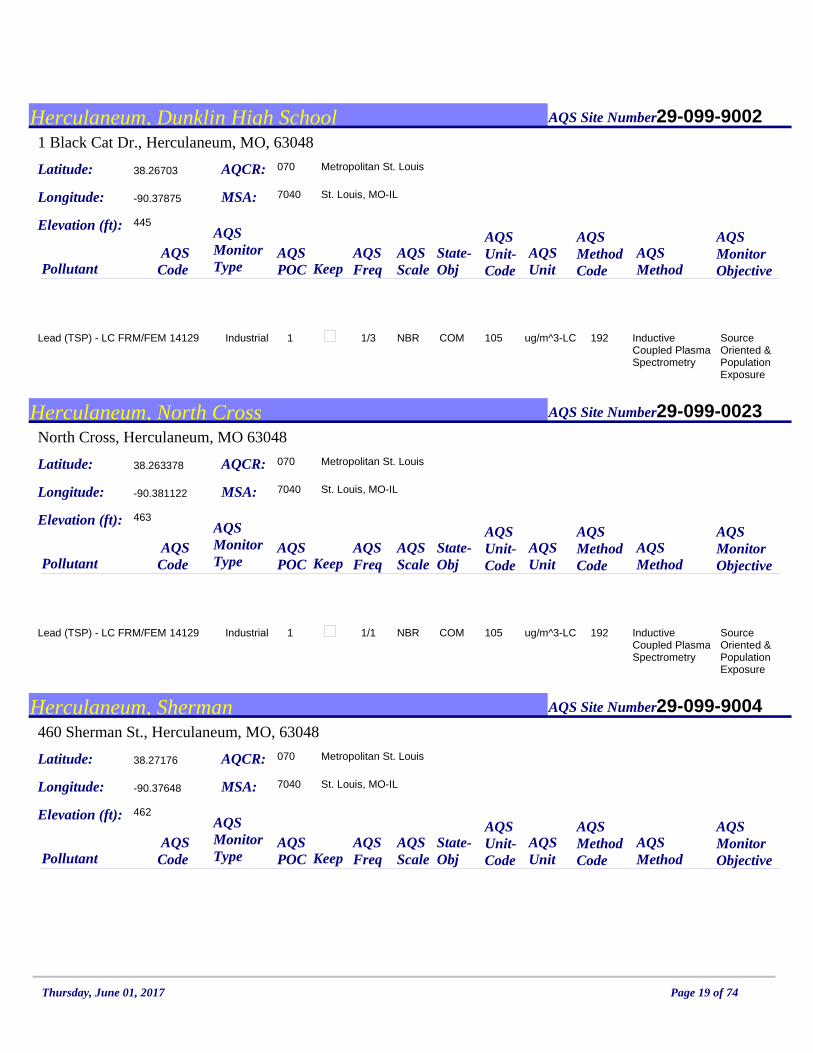
Herculaneum, Dunklin High School AQS Site Number
Latitude:
Longitude:
AQS CodePollutant
AQSPOC Keep
AQS MethodCode
AQSUnit-Code
38.26703
-90.37875
29-099-9002
AQCR: 070 Metropolitan St. Louis
Elevation (ft): 445
AQS Freq
MSA: 7040 St. Louis, MO-IL
1 Black Cat Dr., Herculaneum, MO, 63048
State-Obj
AQSScale
AQS Method
AQS Unit
AQS Monitor Type
AQS Monitor Objective
14129Lead (TSP) - LC FRM/FEM 1921051 ug/m^3-LC1/3 Inductive Coupled Plasma Spectrometry
COMNBRIndustrial Source Oriented & Population Exposure
Herculaneum, North Cross AQS Site Number
Latitude:
Longitude:
AQS CodePollutant
AQSPOC Keep
AQS MethodCode
AQSUnit-Code
38.263378
-90.381122
29-099-0023
AQCR: 070 Metropolitan St. Louis
Elevation (ft): 463
AQS Freq
MSA: 7040 St. Louis, MO-IL
North Cross, Herculaneum, MO 63048
State-Obj
AQSScale
AQS Method
AQS Unit
AQS Monitor Type
AQS Monitor Objective
14129Lead (TSP) - LC FRM/FEM 1921051 ug/m^3-LC1/1 Inductive Coupled Plasma Spectrometry
COMNBRIndustrial Source Oriented & Population Exposure
Herculaneum, Sherman AQS Site Number
Latitude:
Longitude:
AQS CodePollutant
AQSPOC Keep
AQS MethodCode
AQSUnit-Code
38.27176
-90.37648
29-099-9004
AQCR: 070 Metropolitan St. Louis
Elevation (ft): 462
AQS Freq
MSA: 7040 St. Louis, MO-IL
460 Sherman St., Herculaneum, MO, 63048
State-Obj
AQSScale
AQS Method
AQS Unit
AQS Monitor Type
AQS Monitor Objective
Thursday, June 01, 2017 Page 19 of 74

14129Lead (TSP) - LC FRM/FEM 1921051 ug/m^3-LC1/6 Inductive Coupled Plasma Spectrometry
COMNBRIndustrial Source Oriented
Thursday, June 01, 2017 Page 20 of 74

Environmental Services Program (ESP) [PQAO - 0588]
Alba AQS Site Number
Latitude:
Longitude:
AQS CodePollutant
AQSPOC Keep
AQS MethodCode
AQSUnit-Code
37.2385
-94.42468
29-097-0004
AQCR: 139 SW Missouri
Elevation (ft): 965
AQS Freq
MSA: 3710 Joplin, MO
20400 Millwood Rd., Alba, MO 64755
State-Obj
AQSScale
AQS Method
AQS Unit
AQS Monitor Type
AQS Monitor Objective
62107Indoor Temperature 0130171 deg C1 Electronic Averaging
METN/ASPM Other
44201Ozone 0470071 ppm1 Ultraviolet Photometric
COMNBRSLAMS Max Ozone Concentration& Population Exposure
44201Ozone 0470072 ppm1 Ultraviolet Photometric
COMNBRSLAMS -
Arnold West: PM10-FEM not submitting AQS data AQS Site Number
Latitude:
Longitude:
AQS CodePollutant
AQSPOC Keep
AQS MethodCode
AQSUnit-Code
38.44862
-90.3958
29-099-0019
AQCR: 070 Metropolitan St. Louis
Elevation (ft): 639
AQS Freq
MSA: 7040 St. Louis, MO-IL
1709 Lonedell Dr., Arnold, MO 63010
State-Obj
AQSScale
AQS Method
AQS Unit
AQS Monitor Type
AQS Monitor Objective
88301Ammonium Ion PM2.5 LC 8121056 ug/m^3-LC1/6 Met One SASS Nylon
RESNBRSLAMS Population Exposure (UC-Davis)
Thursday, June 01, 2017 Page 21 of 74
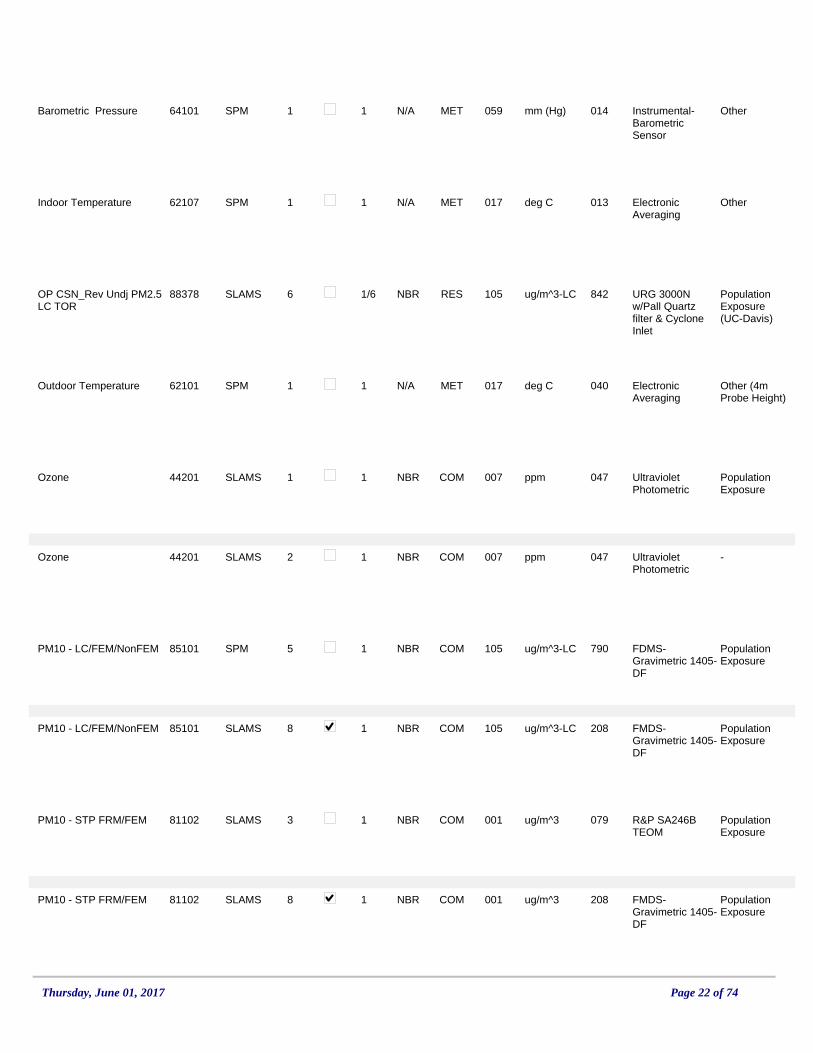
64101Barometric Pressure 0140591 mm (Hg)1 Instrumental-Barometric Sensor
METN/ASPM Other
62107Indoor Temperature 0130171 deg C1 Electronic Averaging
METN/ASPM Other
88378OP CSN_Rev Undj PM2.5 LC TOR
8421056 ug/m^3-LC1/6 URG 3000N w/Pall Quartz filter & Cyclone Inlet
RESNBRSLAMS Population Exposure (UC-Davis)
62101Outdoor Temperature 0400171 deg C1 Electronic Averaging
METN/ASPM Other (4m Probe Height)
44201Ozone 0470071 ppm1 Ultraviolet Photometric
COMNBRSLAMS Population Exposure
44201Ozone 0470072 ppm1 Ultraviolet Photometric
COMNBRSLAMS -
85101PM10 - LC/FEM/NonFEM 7901055 ug/m^3-LC1 FDMS-Gravimetric 1405-DF
COMNBRSPM Population Exposure
85101PM10 - LC/FEM/NonFEM 2081058 ug/m^3-LC1 FMDS-Gravimetric 1405-DF
COMNBRSLAMS Population Exposure
81102PM10 - STP FRM/FEM 0790013 ug/m^31 R&P SA246B TEOM
COMNBRSLAMS Population Exposure
81102PM10 - STP FRM/FEM 2080018 ug/m^31 FMDS-Gravimetric 1405-DF
COMNBRSLAMS Population Exposure
Thursday, June 01, 2017 Page 22 of 74

88101PM2.5 - LC FRM/FEM 1821054 ug/m^3-LC1 FMDS-Gravimetric 1405-DF
COMNBRSLAMS Population Exposure
88500PM2.5 Tot Atmospheric 7901051 ug/m^3-LC1 FDMS-Gravimetric 1405-DF
AQINBRSPM Population Exposure
88503PM2.5 Volatile Channel 7901051 ug/m^3-LC1 FDMS-Gravimetric 1405-DF
AQINBRSPM Population Exposure
86101PMCoarse - LC FRM/FEM 2071058 ug/m^3-LC1 FMDS-Gravimetric 1405-DF
COMNBRSLAMS Population Exposure
62201Relative Humidity 0200191 %humidity1 Instrumental-Computed (Indirect)
METN/ASPM Other
61104Wind Direction - Resultant 0670141 deg1 Instrumental: RM Young Model 05103
METN/ASPM Other (10m Tower)
61103Wind Speed - Resultant 0670121 mph1 Instrumental: RM Young Model 05103
METN/ASPM Other (10m Tower)
Blair Street: PM10-FEM not submitting AQS data AQS Site Number
Latitude:
Longitude:
AQS CodePollutant
AQSPOC Keep
AQS MethodCode
AQSUnit-Code
38.65638
-90.19825
29-510-0085
AQCR: 070 Metropolitan St. Louis
Elevation (ft): 492
AQS Freq
MSA: 7040 St. Louis, MO-IL
3247 Blair Street, St. Louis, MO 63107
State-Obj
AQSScale
AQS Method
AQS Unit
AQS Monitor Type
AQS Monitor Objective
Thursday, June 01, 2017 Page 23 of 74

88301Ammonium Ion PM2.5 LC 8121056 ug/m^3-LC1/3 Met One SASS Nylon
RESNBRSLAMS Highest Concentration (UC-Davis)
64101Barometric Pressure 0140591 mm (Hg)1 Instrumental-Barometric Sensor
METN/ASLAMS Other
88313Black Carbon PM2.5 LC 8941051 ug/m^3-LC1 Magee Scientific TAPI M633 Aethalometer
RESNBRSLAMS Population Exposure
42101Carbon Monoxide 0550071 ppm1 Gas Filter Corr Thermo Electron 48C-TL
COMNBRNCORE Population Exposure
62107Indoor Temperature 0130171 deg C1 Electronic Averaging
METN/ASLAMS Other (Large Shelter)
62107Indoor Temperature 0130172 deg C1 Electronic Averaging
METN/ASLAMS Other (Small Shelter)
85129Lead PM10 LC - FRM/FEM 9071086 ng/m^3-LC1/6 R&P Partisol 2025 Teflon
RESNBRSLAMS Population Exposure (ERG)
85129Lead PM10 LC - FRM/FEM 9071087 ng/m^3-LC1/6 R&P Partisol 2025 Teflon
RESNBRSLAMS Population Exposure (ERG)
42601Nitric Oxide 6990081 ppb1 Teledyne API 200 EU/501
COMNBRNCORE Population Exposure
42601Nitric Oxide 2000082 ppb1 Teledyne API T200UP Photolytic
COMNBRSPM Population Exposure
Thursday, June 01, 2017 Page 24 of 74
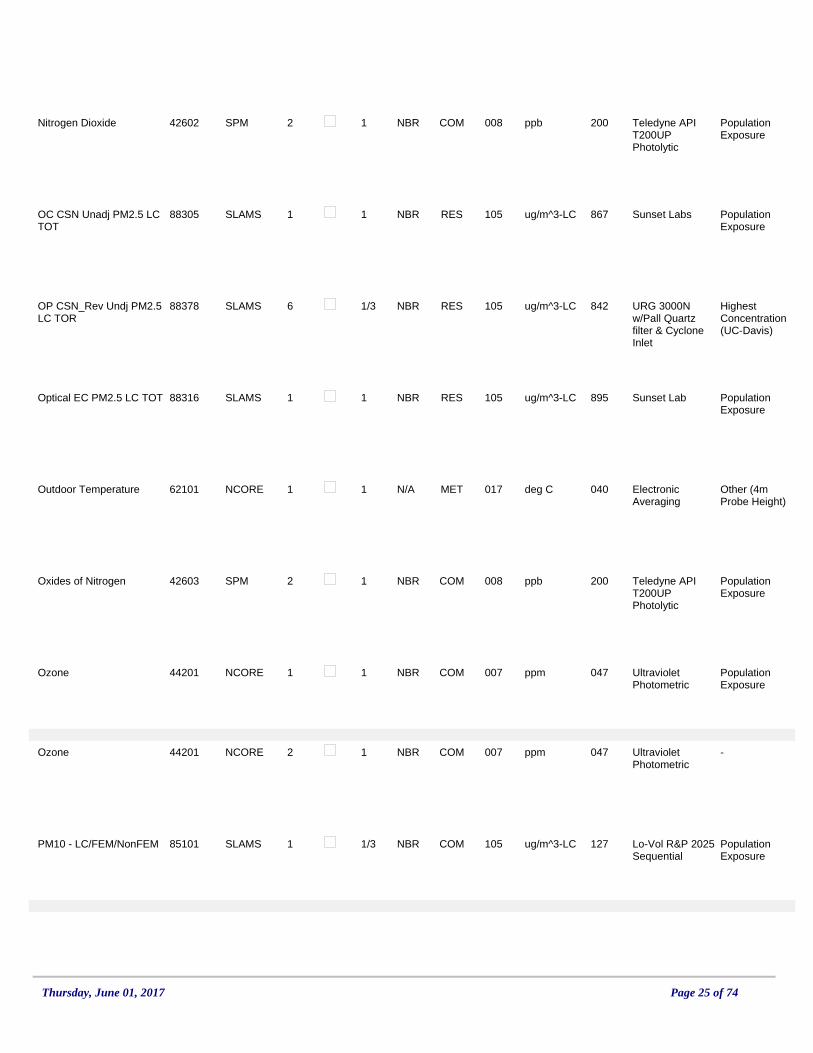
42602Nitrogen Dioxide 2000082 ppb1 Teledyne API T200UP Photolytic
COMNBRSPM Population Exposure
88305OC CSN Unadj PM2.5 LC TOT
8671051 ug/m^3-LC1 Sunset LabsRESNBRSLAMS Population Exposure
88378OP CSN_Rev Undj PM2.5 LC TOR
8421056 ug/m^3-LC1/3 URG 3000N w/Pall Quartz filter & Cyclone Inlet
RESNBRSLAMS Highest Concentration (UC-Davis)
88316Optical EC PM2.5 LC TOT 8951051 ug/m^3-LC1 Sunset LabRESNBRSLAMS Population Exposure
62101Outdoor Temperature 0400171 deg C1 Electronic Averaging
METN/ANCORE Other (4m Probe Height)
42603Oxides of Nitrogen 2000082 ppb1 Teledyne API T200UP Photolytic
COMNBRSPM Population Exposure
44201Ozone 0470071 ppm1 Ultraviolet Photometric
COMNBRNCORE Population Exposure
44201Ozone 0470072 ppm1 Ultraviolet Photometric
COMNBRNCORE -
85101PM10 - LC/FEM/NonFEM 1271051 ug/m^3-LC1/3 Lo-Vol R&P 2025 Sequential
COMNBRSLAMS Population Exposure
Thursday, June 01, 2017 Page 25 of 74
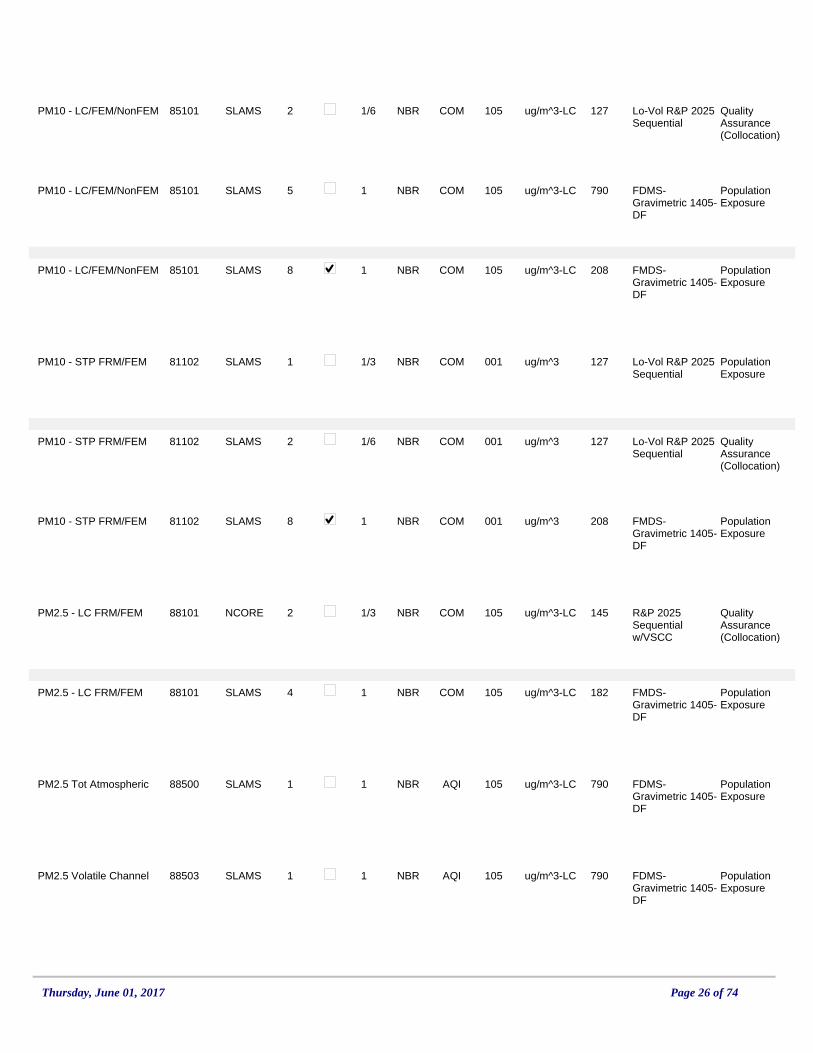
85101PM10 - LC/FEM/NonFEM 1271052 ug/m^3-LC1/6 Lo-Vol R&P 2025 Sequential
COMNBRSLAMS Quality Assurance (Collocation)
85101PM10 - LC/FEM/NonFEM 7901055 ug/m^3-LC1 FDMS-Gravimetric 1405-DF
COMNBRSLAMS Population Exposure
85101PM10 - LC/FEM/NonFEM 2081058 ug/m^3-LC1 FMDS-Gravimetric 1405-DF
COMNBRSLAMS Population Exposure
81102PM10 - STP FRM/FEM 1270011 ug/m^31/3 Lo-Vol R&P 2025 Sequential
COMNBRSLAMS Population Exposure
81102PM10 - STP FRM/FEM 1270012 ug/m^31/6 Lo-Vol R&P 2025 Sequential
COMNBRSLAMS Quality Assurance (Collocation)
81102PM10 - STP FRM/FEM 2080018 ug/m^31 FMDS-Gravimetric 1405-DF
COMNBRSLAMS Population Exposure
88101PM2.5 - LC FRM/FEM 1451052 ug/m^3-LC1/3 R&P 2025 Sequential w/VSCC
COMNBRNCORE Quality Assurance (Collocation)
88101PM2.5 - LC FRM/FEM 1821054 ug/m^3-LC1 FMDS-Gravimetric 1405-DF
COMNBRSLAMS Population Exposure
88500PM2.5 Tot Atmospheric 7901051 ug/m^3-LC1 FDMS-Gravimetric 1405-DF
AQINBRSLAMS Population Exposure
88503PM2.5 Volatile Channel 7901051 ug/m^3-LC1 FDMS-Gravimetric 1405-DF
AQINBRSLAMS Population Exposure
Thursday, June 01, 2017 Page 26 of 74

86101PMCoarse - LC FRM/FEM 1761051 ug/m^3-LC1/3 Thermo 2025 Sequential PM10-PM2.5
COMNBRSLAMS Population Exposure
86101PMCoarse - LC FRM/FEM 2071058 ug/m^3-LC1 FMDS-Gravimetric 1405-DF
COMNBRSLAMS Population Exposure
42600Reactive Oxides of N (NOY)
6990081 ppb1 Teledyne API 200 EU/501
COMNBRNCORE Population Exposure
62201Relative Humidity 0140191 %humidity1 Instrumental-Hygromer C94 Probe
METN/ANCORE Other
63301Solar Radiation 0110791 W/m^21 Instrumental-Pyranometer
METN/ASLAMS Other
42401Sulfur Dioxide 6000081 ppb1 Ultraviolet Fluorenscence API 100 EU
COMNBRNCORE Population Exposure
42406Sulfur Dioxide Max 5-min Avg
6000081 ppb1 Ultraviolet Fluorenscence API 100 EU
COMNBRNCORE Population Exposure
88312Total Carbon PM2.5 LC TOT
8671051 ug/m^3-LC1 Sunset LabsRESNBRSLAMS Population Exposure
88314UV Carbon PM2.5 LC 8941051 ug/m^3-LC1 Magee Scientific TAPI M633 Aethalometer
RESNBRSLAMS Population Exposure
Thursday, June 01, 2017 Page 27 of 74
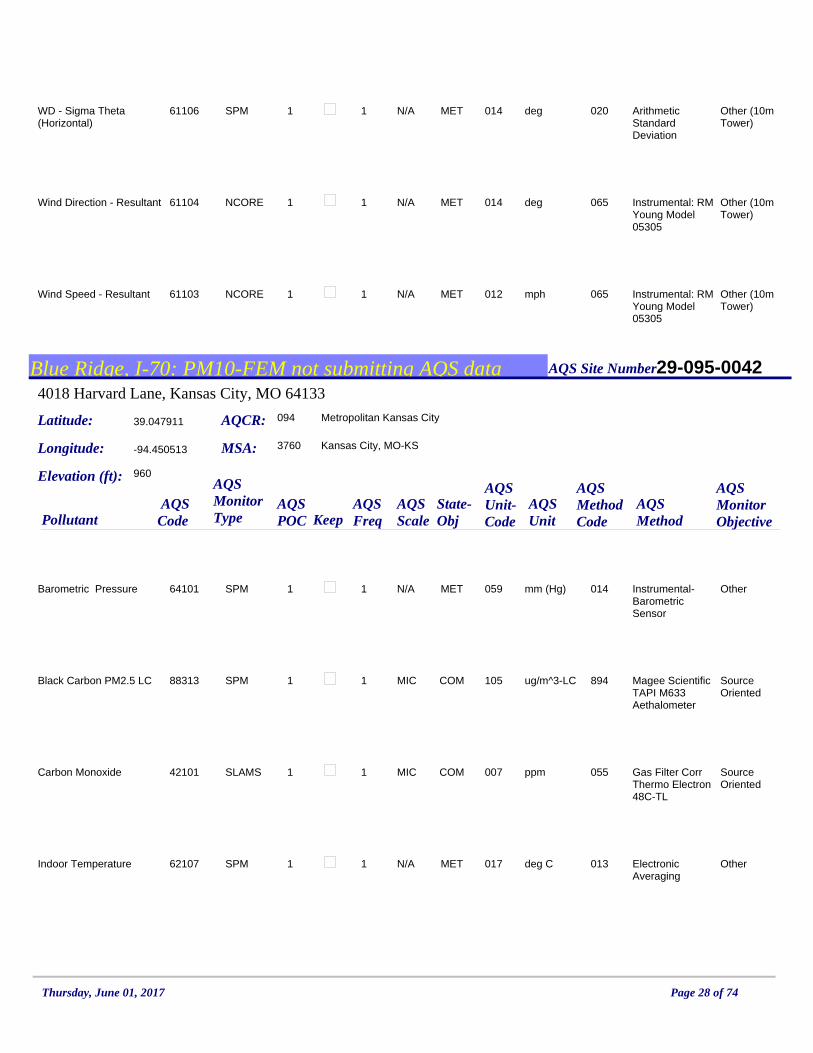
61106WD - Sigma Theta (Horizontal)
0200141 deg1 Arithmetic Standard Deviation
METN/ASPM Other (10m Tower)
61104Wind Direction - Resultant 0650141 deg1 Instrumental: RM Young Model 05305
METN/ANCORE Other (10m Tower)
61103Wind Speed - Resultant 0650121 mph1 Instrumental: RM Young Model 05305
METN/ANCORE Other (10m Tower)
Blue Ridge, I-70: PM10-FEM not submitting AQS data AQS Site Number
Latitude:
Longitude:
AQS CodePollutant
AQSPOC Keep
AQS MethodCode
AQSUnit-Code
39.047911
-94.450513
29-095-0042
AQCR: 094 Metropolitan Kansas City
Elevation (ft): 960
AQS Freq
MSA: 3760 Kansas City, MO-KS
4018 Harvard Lane, Kansas City, MO 64133
State-Obj
AQSScale
AQS Method
AQS Unit
AQS Monitor Type
AQS Monitor Objective
64101Barometric Pressure 0140591 mm (Hg)1 Instrumental-Barometric Sensor
METN/ASPM Other
88313Black Carbon PM2.5 LC 8941051 ug/m^3-LC1 Magee Scientific TAPI M633 Aethalometer
COMMICSPM Source Oriented
42101Carbon Monoxide 0550071 ppm1 Gas Filter Corr Thermo Electron 48C-TL
COMMICSLAMS Source Oriented
62107Indoor Temperature 0130171 deg C1 Electronic Averaging
METN/ASPM Other
Thursday, June 01, 2017 Page 28 of 74
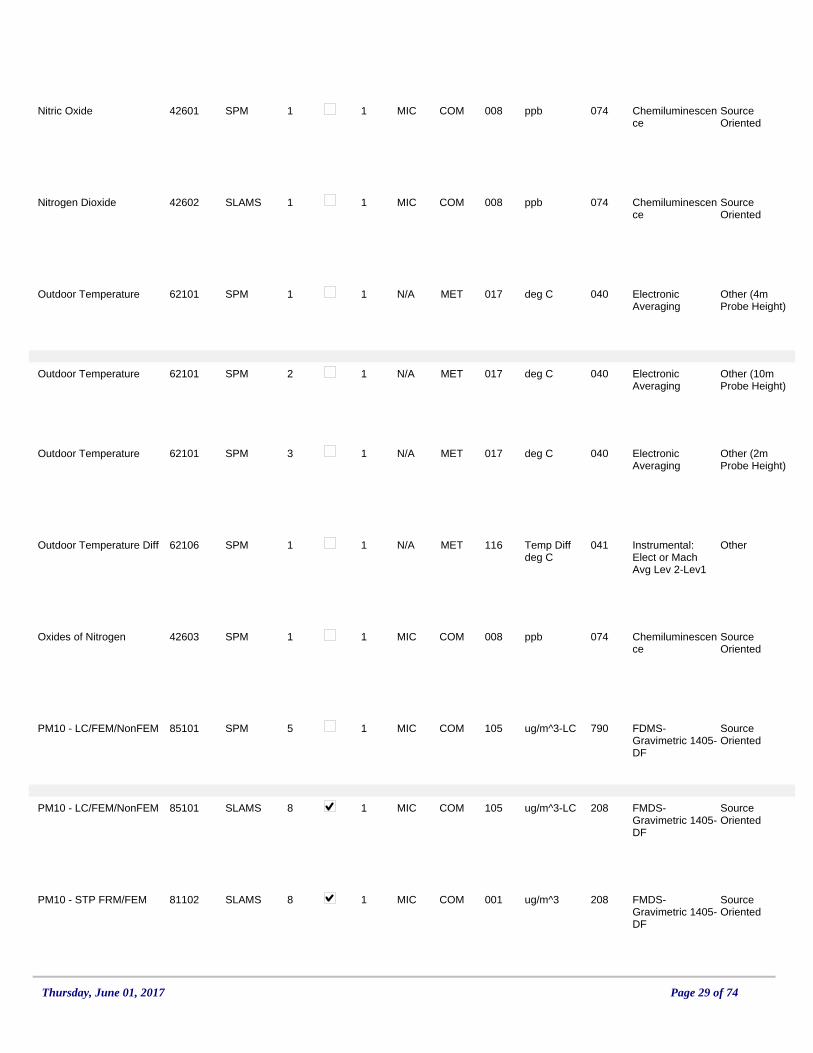
42601Nitric Oxide 0740081 ppb1 Chemiluminescence
COMMICSPM Source Oriented
42602Nitrogen Dioxide 0740081 ppb1 Chemiluminescence
COMMICSLAMS Source Oriented
62101Outdoor Temperature 0400171 deg C1 Electronic Averaging
METN/ASPM Other (4m Probe Height)
62101Outdoor Temperature 0400172 deg C1 Electronic Averaging
METN/ASPM Other (10m Probe Height)
62101Outdoor Temperature 0400173 deg C1 Electronic Averaging
METN/ASPM Other (2m Probe Height)
62106Outdoor Temperature Diff 0411161 Temp Diff deg C
1 Instrumental: Elect or Mach Avg Lev 2-Lev1
METN/ASPM Other
42603Oxides of Nitrogen 0740081 ppb1 Chemiluminescence
COMMICSPM Source Oriented
85101PM10 - LC/FEM/NonFEM 7901055 ug/m^3-LC1 FDMS-Gravimetric 1405-DF
COMMICSPM Source Oriented
85101PM10 - LC/FEM/NonFEM 2081058 ug/m^3-LC1 FMDS-Gravimetric 1405-DF
COMMICSLAMS Source Oriented
81102PM10 - STP FRM/FEM 2080018 ug/m^31 FMDS-Gravimetric 1405-DF
COMMICSLAMS Source Oriented
Thursday, June 01, 2017 Page 29 of 74

88101PM2.5 - LC FRM/FEM 1821054 ug/m^3-LC1 FMDS-Gravimetric 1405-DF
COMMICSLAMS Source Oriented
88500PM2.5 Tot Atmospheric 7901051 ug/m^3-LC1 FDMS-Gravimetric 1405-DF
AQIMICSPM Source Oriented
88503PM2.5 Volatile Channel 7901051 ug/m^3-LC1 FDMS-Gravimetric 1405-DF
AQIMICSPM Source Oriented
86101PMCoarse - LC FRM/FEM 2071058 ug/m^3-LC1 FMDS-Gravimetric 1405-DF
COMMICSLAMS Source Oriented
65102Precipitation 0140211 inches1 Heated Tipping Bucket
METN/ASPM Other
62201Relative Humidity 0200191 %humidity1 Instrumental-Computed (Indirect)
METN/ASPM Other
63301Solar Radiation 0110791 W/m^21 Instrumental-Pyranometer
METN/ASPM Other
88314UV Carbon PM2.5 LC 8941051 ug/m^3-LC1 Magee Scientific TAPI M633 Aethalometer
COMMICSPM Source Oriented
61106WD - Sigma Theta (Horizontal)
0200141 deg1 Arithmetic Standard Deviation
METN/ASPM Other (10m Tower)
Thursday, June 01, 2017 Page 30 of 74

61104Wind Direction - Resultant 0650141 deg1 Instrumental: RM Young Model 05305
METN/ASPM Other (10m Tower)
61103Wind Speed - Resultant 0650121 mph1 Instrumental: RM Young Model 05305
METN/ASPM Other (10m Tower)
Bonne Terre AQS Site Number
Latitude:
Longitude:
AQS CodePollutant
AQSPOC Keep
AQS MethodCode
AQSUnit-Code
37.90084
-90.42388
29-186-0005
AQCR: 138 SE Missouri
Elevation (ft): 840
AQS Freq
MSA: 0000 Not in a MSA
15797 Highway D, Bonne Terre, MO 63628
State-Obj
AQSScale
AQS Method
AQS Unit
AQS Monitor Type
AQS Monitor Objective
62107Indoor Temperature 0130171 deg C1 Electronic Averaging
METN/ASPM Other
44201Ozone 0470071 ppm1 Ultraviolet Photometric
COMREGSLAMS Regional Transport
44201Ozone 0470072 ppm1 Ultraviolet Photometric
COMREGSLAMS -
63301Solar Radiation 0110791 W/m^21 Instrumental-Pyranometer
METN/ASPM Other
61104Wind Direction - Resultant 0670141 deg1 Instrumental: RM Young Model 05103
METN/ASPM Other (5.5 meters)
Thursday, June 01, 2017 Page 31 of 74

61103Wind Speed - Resultant 0670121 mph1 Instrumental: RM Young Model 05103
METN/ASPM Other (5.5 meters)
Branch Street: PM10-FEM not submitting AQS data AQS Site Number
Latitude:
Longitude:
AQS CodePollutant
AQSPOC Keep
AQS MethodCode
AQSUnit-Code
38.65643
-90.18977
29-510-0093
AQCR: 070 Metropolitan St. Louis
Elevation (ft): 429
AQS Freq
MSA: 7040 St. Louis, MO-IL
100 Branch St., St. Louis, MO 63102
State-Obj
AQSScale
AQS Method
AQS Unit
AQS Monitor Type
AQS Monitor Objective
64101Barometric Pressure 0140591 mm (Hg)1 Instrumental-Barometric Sensor
METN/ASPM Other
62107Indoor Temperature 0130171 deg C1 Electronic Averaging
METN/ASPM Other
62101Outdoor Temperature 0400171 deg C1 Electronic Averaging
METN/ASPM Other (4m Probe Height)
85101PM10 - LC/FEM/NonFEM 7901055 ug/m^3-LC1 FDMS-Gravimetric 1405-DF
COMMIDSPM Source Oriented
85101PM10 - LC/FEM/NonFEM 2081058 ug/m^3-LC1 FMDS-Gravimetric 1405-DF
COMMIDSLAMS Source Oriented
81102PM10 - STP FRM/FEM 0790013 ug/m^31 R&P SA246B TEOM
COMMIDSLAMS Source Oriented
Thursday, June 01, 2017 Page 32 of 74
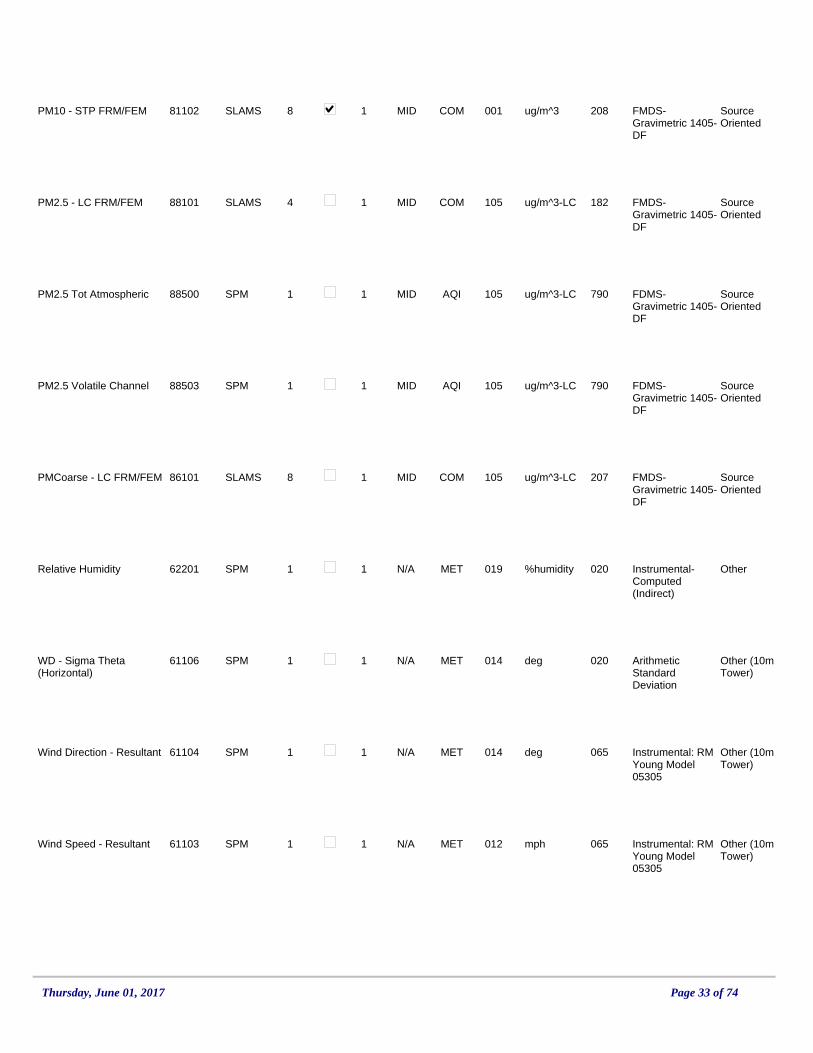
81102PM10 - STP FRM/FEM 2080018 ug/m^31 FMDS-Gravimetric 1405-DF
COMMIDSLAMS Source Oriented
88101PM2.5 - LC FRM/FEM 1821054 ug/m^3-LC1 FMDS-Gravimetric 1405-DF
COMMIDSLAMS Source Oriented
88500PM2.5 Tot Atmospheric 7901051 ug/m^3-LC1 FDMS-Gravimetric 1405-DF
AQIMIDSPM Source Oriented
88503PM2.5 Volatile Channel 7901051 ug/m^3-LC1 FDMS-Gravimetric 1405-DF
AQIMIDSPM Source Oriented
86101PMCoarse - LC FRM/FEM 2071058 ug/m^3-LC1 FMDS-Gravimetric 1405-DF
COMMIDSLAMS Source Oriented
62201Relative Humidity 0200191 %humidity1 Instrumental-Computed (Indirect)
METN/ASPM Other
61106WD - Sigma Theta (Horizontal)
0200141 deg1 Arithmetic Standard Deviation
METN/ASPM Other (10m Tower)
61104Wind Direction - Resultant 0650141 deg1 Instrumental: RM Young Model 05305
METN/ASPM Other (10m Tower)
61103Wind Speed - Resultant 0650121 mph1 Instrumental: RM Young Model 05305
METN/ASPM Other (10m Tower)
Thursday, June 01, 2017 Page 33 of 74

Branson (Proposed for discontinuation) AQS Site Number
Latitude:
Longitude:
AQS CodePollutant
AQSPOC Keep
AQS MethodCode
AQSUnit-Code
36.70765
-93.22181
29-213-0004
AQCR: 139 SW Missouri
Elevation (ft): 1052
AQS Freq
MSA: 0000 Not in a MSA
251 SW. Outer Rd., Branson, MO 65616
State-Obj
AQSScale
AQS Method
AQS Unit
AQS Monitor Type
AQS Monitor Objective
62107Indoor Temperature 0130171 deg C1 Electronic Averaging
METN/ASPM Other
44201Ozone 0470071 ppm1 Ultraviolet Photometric
COMNBRSPM Max Ozone Concentration& Population Exposure
44201Ozone 0470072 ppm1 Ultraviolet Photometric
COMNBRSPM -
61104Wind Direction - Resultant 0670141 deg1 Instrumental: RM Young Model 05103
METN/ASPM Other (5.5 meters)
61103Wind Speed - Resultant 0670121 mph1 Instrumental: RM Young Model 05103
METN/ASPM Other (5.5 meters)
Buick NE AQS Site Number
Latitude:
Longitude:
AQS CodePollutant
AQSPOC Keep
AQS MethodCode
AQSUnit-Code
37.65212
-91.11653
29-093-0034
AQCR: 138 SE Missouri
Elevation (ft): 1423
AQS Freq
MSA: 0000 Not in a MSA
346 Power Lane, Bixby West, MO 65439
State-Obj
AQSScale
AQS Method
AQS Unit
AQS Monitor Type
AQS Monitor Objective
Thursday, June 01, 2017 Page 34 of 74

62107Indoor Temperature 0130171 deg C1 Electronic Averaging
METN/ASPM Other
14129Lead (TSP) - LC FRM/FEM 8131051 ug/m^3-LC1/6 Inductively Coupled Plasma Mass Spectroscopy
COMMIDSLAMS Source Oriented & Highest Concentration
14129Lead (TSP) - LC FRM/FEM 8131052 ug/m^3-LC1/6 Inductively Coupled Plasma Mass Spectroscopy
COMMIDSLAMS Quality Assurance (Collocation)
42401Sulfur Dioxide 0600081 ppb1 Pulsed Fluorescent
COMMIDSPM Source Oriented
42406Sulfur Dioxide Max 5-min Avg
0600081 ppb1 Pulsed Fluorescent
COMMIDSPM Source Oriented
61104Wind Direction - Resultant 0670141 deg1 Instrumental: RM Young Model 05103
METN/ASPM Other (6 meters)
61103Wind Speed - Resultant 0670121 mph1 Instrumental: RM Young Model 05103
METN/ASPM Other (6 meters)
Carthage AQS Site Number
Latitude:
Longitude:
AQS CodePollutant
AQSPOC Keep
AQS MethodCode
AQSUnit-Code
37.19822
-94.31702
29-097-0003
AQCR: 139 SW Missouri
Elevation (ft): 986
AQS Freq
MSA: 3710 Joplin, MO
530 Juniper, Carthage, MO 64836
State-Obj
AQSScale
AQS Method
AQS Unit
AQS Monitor Type
AQS Monitor Objective
Thursday, June 01, 2017 Page 35 of 74
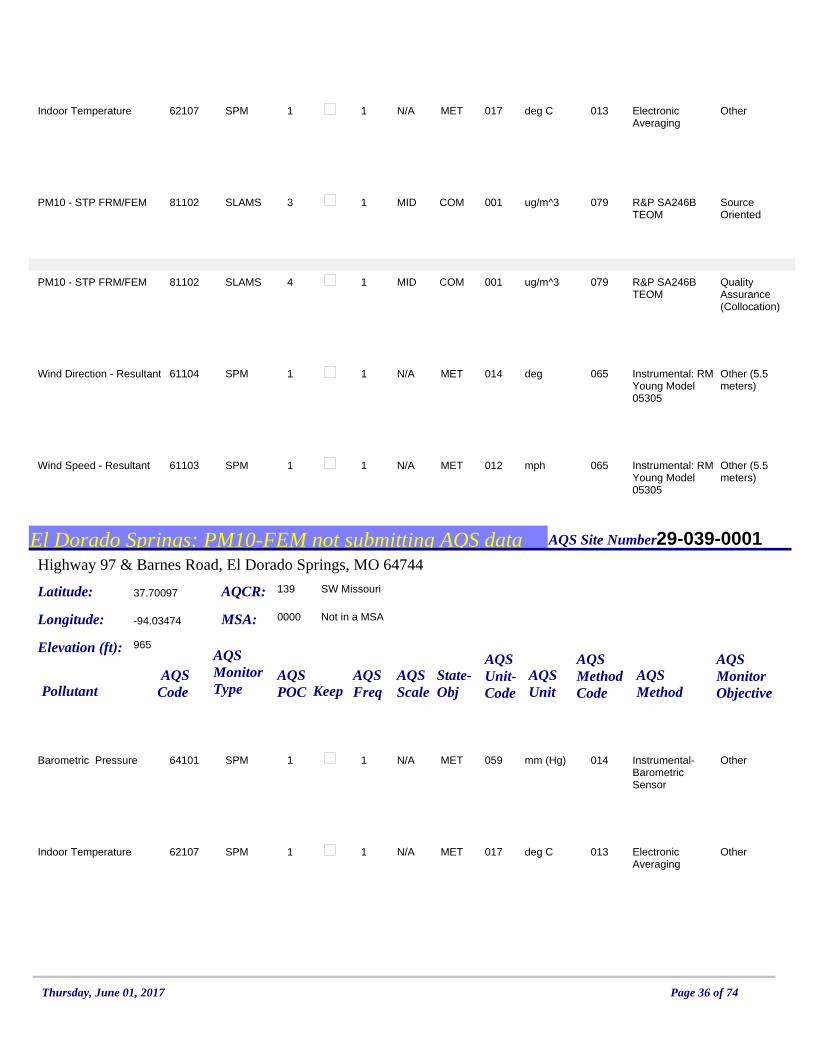
62107Indoor Temperature 0130171 deg C1 Electronic Averaging
METN/ASPM Other
81102PM10 - STP FRM/FEM 0790013 ug/m^31 R&P SA246B TEOM
COMMIDSLAMS Source Oriented
81102PM10 - STP FRM/FEM 0790014 ug/m^31 R&P SA246B TEOM
COMMIDSLAMS Quality Assurance (Collocation)
61104Wind Direction - Resultant 0650141 deg1 Instrumental: RM Young Model 05305
METN/ASPM Other (5.5 meters)
61103Wind Speed - Resultant 0650121 mph1 Instrumental: RM Young Model 05305
METN/ASPM Other (5.5 meters)
El Dorado Springs: PM10-FEM not submitting AQS data AQS Site Number
Latitude:
Longitude:
AQS CodePollutant
AQSPOC Keep
AQS MethodCode
AQSUnit-Code
37.70097
-94.03474
29-039-0001
AQCR: 139 SW Missouri
Elevation (ft): 965
AQS Freq
MSA: 0000 Not in a MSA
Highway 97 & Barnes Road, El Dorado Springs, MO 64744
State-Obj
AQSScale
AQS Method
AQS Unit
AQS Monitor Type
AQS Monitor Objective
64101Barometric Pressure 0140591 mm (Hg)1 Instrumental-Barometric Sensor
METN/ASPM Other
62107Indoor Temperature 0130171 deg C1 Electronic Averaging
METN/ASPM Other
Thursday, June 01, 2017 Page 36 of 74
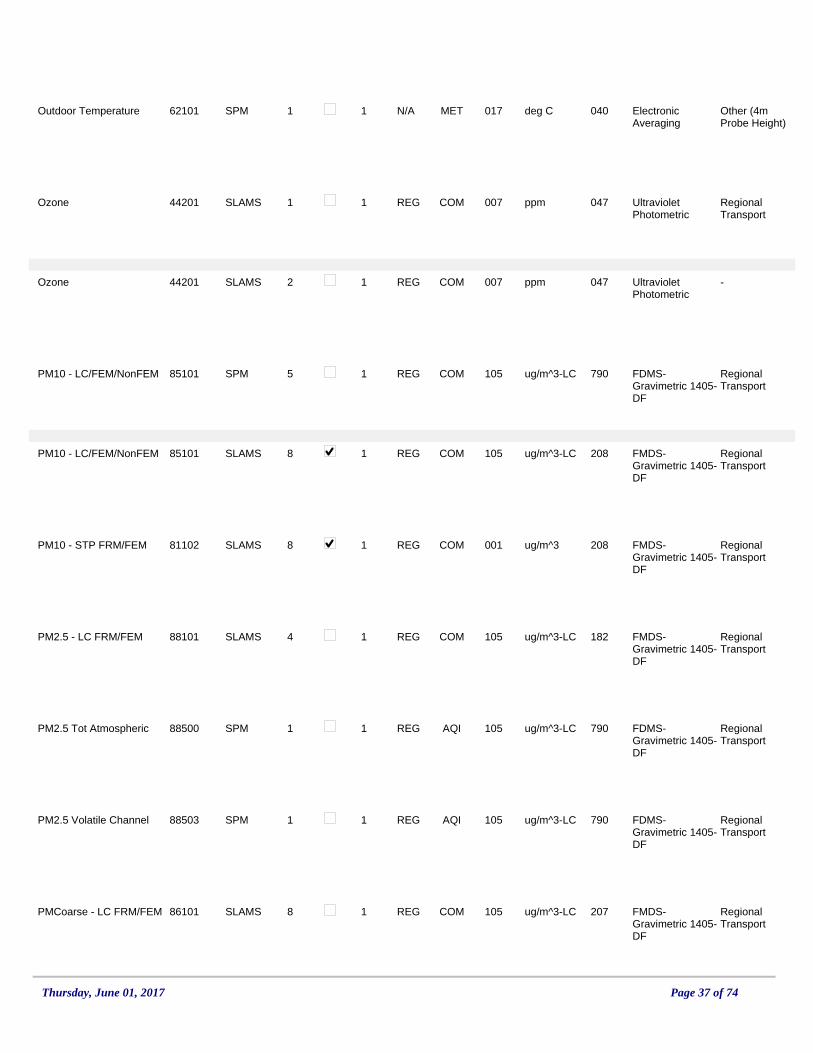
62101Outdoor Temperature 0400171 deg C1 Electronic Averaging
METN/ASPM Other (4m Probe Height)
44201Ozone 0470071 ppm1 Ultraviolet Photometric
COMREGSLAMS Regional Transport
44201Ozone 0470072 ppm1 Ultraviolet Photometric
COMREGSLAMS -
85101PM10 - LC/FEM/NonFEM 7901055 ug/m^3-LC1 FDMS-Gravimetric 1405-DF
COMREGSPM Regional Transport
85101PM10 - LC/FEM/NonFEM 2081058 ug/m^3-LC1 FMDS-Gravimetric 1405-DF
COMREGSLAMS Regional Transport
81102PM10 - STP FRM/FEM 2080018 ug/m^31 FMDS-Gravimetric 1405-DF
COMREGSLAMS Regional Transport
88101PM2.5 - LC FRM/FEM 1821054 ug/m^3-LC1 FMDS-Gravimetric 1405-DF
COMREGSLAMS Regional Transport
88500PM2.5 Tot Atmospheric 7901051 ug/m^3-LC1 FDMS-Gravimetric 1405-DF
AQIREGSPM Regional Transport
88503PM2.5 Volatile Channel 7901051 ug/m^3-LC1 FDMS-Gravimetric 1405-DF
AQIREGSPM Regional Transport
86101PMCoarse - LC FRM/FEM 2071058 ug/m^3-LC1 FMDS-Gravimetric 1405-DF
COMREGSLAMS Regional Transport
Thursday, June 01, 2017 Page 37 of 74
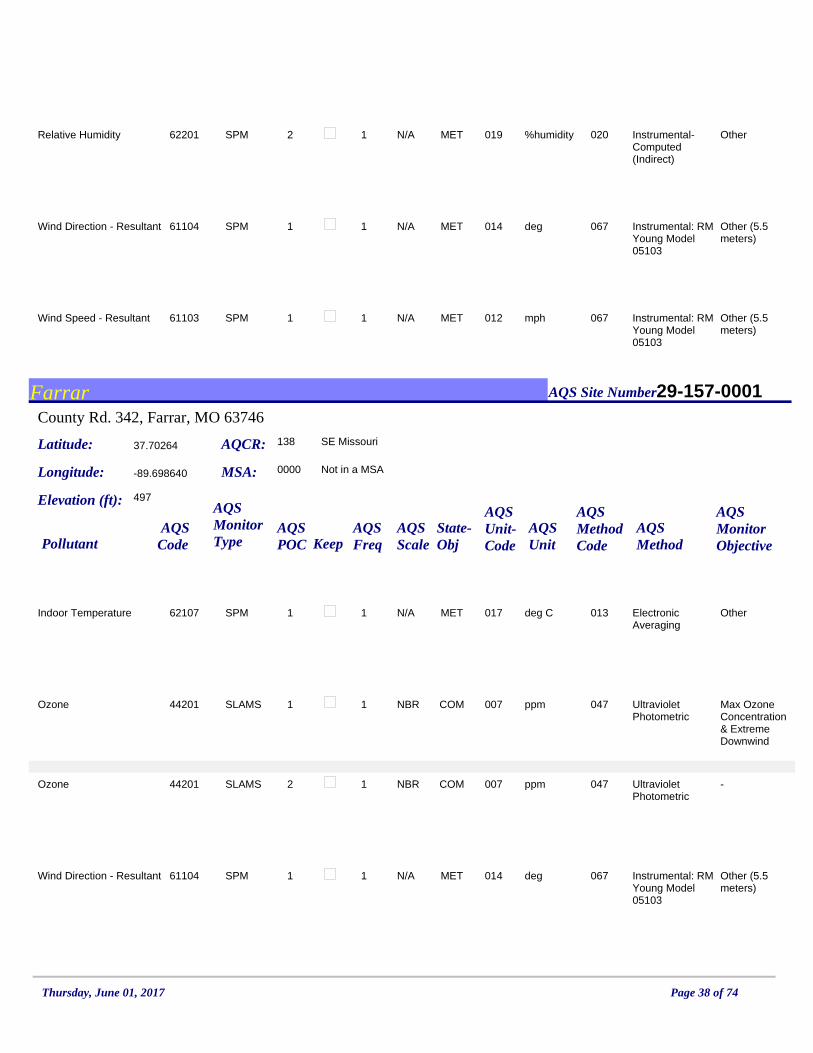
62201Relative Humidity 0200192 %humidity1 Instrumental-Computed (Indirect)
METN/ASPM Other
61104Wind Direction - Resultant 0670141 deg1 Instrumental: RM Young Model 05103
METN/ASPM Other (5.5 meters)
61103Wind Speed - Resultant 0670121 mph1 Instrumental: RM Young Model 05103
METN/ASPM Other (5.5 meters)
Farrar AQS Site Number
Latitude:
Longitude:
AQS CodePollutant
AQSPOC Keep
AQS MethodCode
AQSUnit-Code
37.70264
-89.698640
29-157-0001
AQCR: 138 SE Missouri
Elevation (ft): 497
AQS Freq
MSA: 0000 Not in a MSA
County Rd. 342, Farrar, MO 63746
State-Obj
AQSScale
AQS Method
AQS Unit
AQS Monitor Type
AQS Monitor Objective
62107Indoor Temperature 0130171 deg C1 Electronic Averaging
METN/ASPM Other
44201Ozone 0470071 ppm1 Ultraviolet Photometric
COMNBRSLAMS Max Ozone Concentration& Extreme Downwind
44201Ozone 0470072 ppm1 Ultraviolet Photometric
COMNBRSLAMS -
61104Wind Direction - Resultant 0670141 deg1 Instrumental: RM Young Model 05103
METN/ASPM Other (5.5 meters)
Thursday, June 01, 2017 Page 38 of 74

61103Wind Speed - Resultant 0670121 mph1 Instrumental: RM Young Model 05103
METN/ASPM Other (5.5 meters)
Fellows Lake AQS Site Number
Latitude:
Longitude:
AQS CodePollutant
AQSPOC Keep
AQS MethodCode
AQSUnit-Code
37.319444
-93.204444
29-077-0042
AQCR: 139 SW Missouri
Elevation (ft): 1346
AQS Freq
MSA: 7920 Springfield, MO
4208 E. Farm Rd. 66, Springfield, MO 65803
State-Obj
AQSScale
AQS Method
AQS Unit
AQS Monitor Type
AQS Monitor Objective
62107Indoor Temperature 0130171 deg C1 Electronic Averaging
METN/ASPM Other
44201Ozone 0470071 ppm1 Ultraviolet Photometric
COMURBSLAMS Max Ozone Concentration& Population Exposure
44201Ozone 0470072 ppm1 Ultraviolet Photometric
COMURBSLAMS -
Finger Lakes AQS Site Number
Latitude:
Longitude:
AQS CodePollutant
AQSPOC Keep
AQS MethodCode
AQSUnit-Code
39.07803
-92.31632
29-019-0011
AQCR: 137 Northern Missouri
Elevation (ft): 726
AQS Freq
MSA: 1740 Columbia, MO
1505 E. Peabody Road, Columbia, MO 65202
State-Obj
AQSScale
AQS Method
AQS Unit
AQS Monitor Type
AQS Monitor Objective
62107Indoor Temperature 0130171 deg C1 Electronic Averaging
METN/ASPM Other
Thursday, June 01, 2017 Page 39 of 74

44201Ozone 0470071 ppm1 Ultraviolet Photometric
COMNBRSLAMS Max Ozone Concentration& Population Exposure
44201Ozone 0470072 ppm1 Ultraviolet Photometric
COMNBRSLAMS -
Fletcher AQS Site Number
Latitude:
Longitude:
AQS CodePollutant
AQSPOC Keep
AQS MethodCode
AQSUnit-Code
37.46889
-91.08847
29-179-0002
AQCR: 138 SE Missouri
Elevation (ft): 1256
AQS Freq
MSA: 0000 Not in a MSA
Forest Rd. 2236, Westfork, MO 64498
State-Obj
AQSScale
AQS Method
AQS Unit
AQS Monitor Type
AQS Monitor Objective
14129Lead (TSP) - LC FRM/FEM 8131051 ug/m^3-LC1/6 Inductively Coupled Plasma Mass Spectroscopy
COMNBRSLAMS Source Oriented
Foley West AQS Site Number
Latitude:
Longitude:
AQS CodePollutant
AQSPOC Keep
AQS MethodCode
AQSUnit-Code
39.04577
-90.84927
29-113-0004
AQCR: 137 Northern Missouri
Elevation (ft): 715
AQS Freq
MSA: 7040 St. Louis, MO-IL
2100 Highway Y Foley, MO 63347
State-Obj
AQSScale
AQS Method
AQS Unit
AQS Monitor Type
AQS Monitor Objective
62107Indoor Temperature 0130171 deg C1 Electronic Averaging
METN/ASPM Other
44201Ozone 0470071 ppm1 Ultraviolet Photometric
COMNBRSLAMS Extreme Downwind
Thursday, June 01, 2017 Page 40 of 74

44201Ozone 0470072 ppm1 Ultraviolet Photometric
COMNBRSLAMS -
61104Wind Direction - Resultant 0670141 deg1 Instrumental: RM Young Model 05103
METN/ASPM Other (5.5 meters)
61103Wind Speed - Resultant 0670121 mph1 Instrumental: RM Young Model 05103
METN/ASPM Other (5.5 meters)
Forest City, Exide Levee AQS Site Number
Latitude:
Longitude:
AQS CodePollutant
AQSPOC Keep
AQS MethodCode
AQSUnit-Code
40.027222
-95.235833
29-087-0008
AQCR: 137 Northern Missouri
Elevation (ft): 904
AQS Freq
MSA: 0000 Not in a MSA
300 S. Washington St., Oregon MO, 64473
State-Obj
AQSScale
AQS Method
AQS Unit
AQS Monitor Type
AQS Monitor Objective
14129Lead (TSP) - LC FRM/FEM 8131051 ug/m^3-LC1/6 Inductively Coupled Plasma Mass Spectroscopy
COMMIDSLAMS Source Oriented
Forest Park: PM10-FEM not submitting AQS data AQS Site Number
Latitude:
Longitude:
AQS CodePollutant
AQSPOC Keep
AQS MethodCode
AQSUnit-Code
38.63114
-90.28115
29-510-0094
AQCR: 070 Metropolitan St. Louis
Elevation (ft): 551
AQS Freq
MSA: 7040 St. Louis, MO-IL
5600 Clayton Avenue, St. Louis, MO 63110
State-Obj
AQSScale
AQS Method
AQS Unit
AQS Monitor Type
AQS Monitor Objective
64101Barometric Pressure 0140591 mm (Hg)1 Instrumental-Barometric Sensor
METN/ASPM Other
Thursday, June 01, 2017 Page 41 of 74

88313Black Carbon PM2.5 LC 8941051 ug/m^3-LC1 Magee Scientific TAPI M633 Aethalometer
COMMICSPM Source Oriented
42101Carbon Monoxide 0550071 ppm1 Gas Filter Corr Thermo Electron 48C-TL
COMMICSLAMS Source Oriented
62107Indoor Temperature 0130171 deg C1 Electronic Averaging
METN/ASPM Other
42601Nitric Oxide 0740081 ppb1 Chemiluminescence
COMMICSPM Source Oriented
42602Nitrogen Dioxide 0740081 ppb1 Chemiluminescence
COMMICSLAMS Source Oriented
62101Outdoor Temperature 0400171 deg C1 Electronic Averaging
METN/ASPM Other (4m Probe Height)
62101Outdoor Temperature 0400172 deg C1 Electronic Averaging
METN/ASPM Other (10m Probe Height)
62101Outdoor Temperature 0400173 deg C1 Electronic Averaging
METN/ASPM Other (2m Probe Height)
62106Outdoor Temperature Diff 0411161 Temp Diff deg C
1 Instrumental: Elect or Mach Avg Lev 2-Lev1
METN/ASPM Other (10m - 2m Probe Height)
42603Oxides of Nitrogen 0740081 ppb1 Chemiluminescence
COMMICSPM Source Oriented
Thursday, June 01, 2017 Page 42 of 74
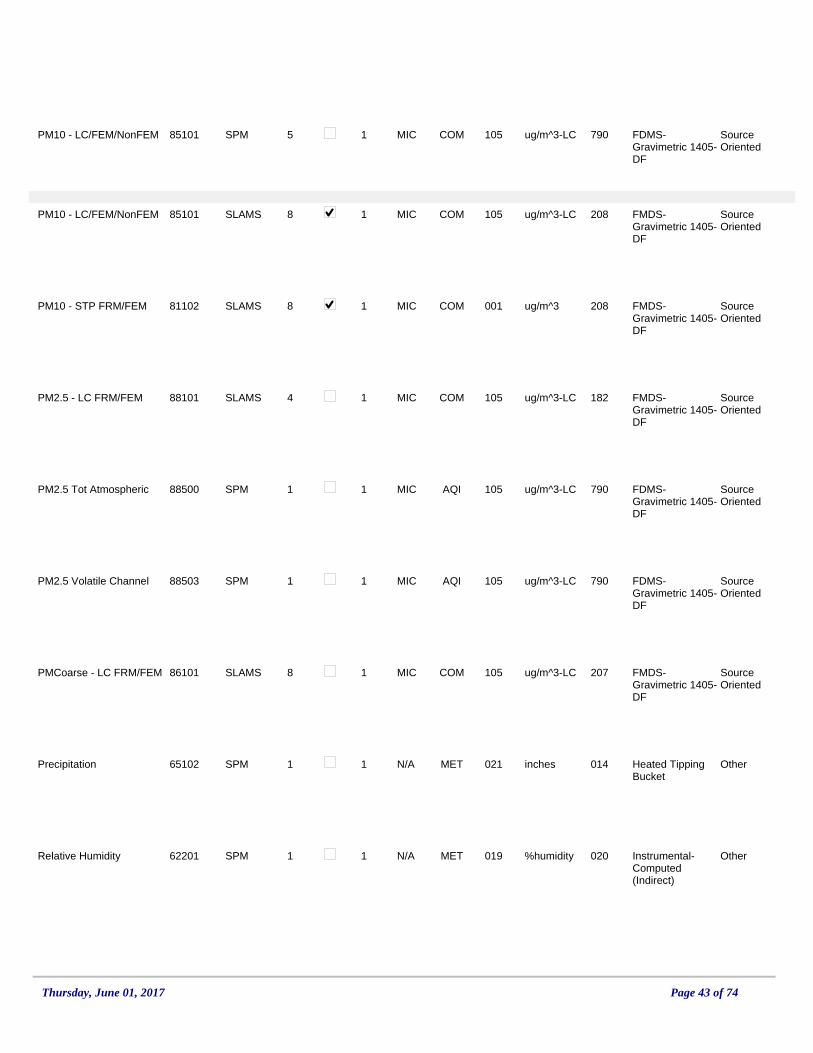
85101PM10 - LC/FEM/NonFEM 7901055 ug/m^3-LC1 FDMS-Gravimetric 1405-DF
COMMICSPM Source Oriented
85101PM10 - LC/FEM/NonFEM 2081058 ug/m^3-LC1 FMDS-Gravimetric 1405-DF
COMMICSLAMS Source Oriented
81102PM10 - STP FRM/FEM 2080018 ug/m^31 FMDS-Gravimetric 1405-DF
COMMICSLAMS Source Oriented
88101PM2.5 - LC FRM/FEM 1821054 ug/m^3-LC1 FMDS-Gravimetric 1405-DF
COMMICSLAMS Source Oriented
88500PM2.5 Tot Atmospheric 7901051 ug/m^3-LC1 FDMS-Gravimetric 1405-DF
AQIMICSPM Source Oriented
88503PM2.5 Volatile Channel 7901051 ug/m^3-LC1 FDMS-Gravimetric 1405-DF
AQIMICSPM Source Oriented
86101PMCoarse - LC FRM/FEM 2071058 ug/m^3-LC1 FMDS-Gravimetric 1405-DF
COMMICSLAMS Source Oriented
65102Precipitation 0140211 inches1 Heated Tipping Bucket
METN/ASPM Other
62201Relative Humidity 0200191 %humidity1 Instrumental-Computed (Indirect)
METN/ASPM Other
Thursday, June 01, 2017 Page 43 of 74

63301Solar Radiation 0110791 W/m^21 Instrumental-Pyranometer
METN/ASLAMS Other
88314UV Carbon PM2.5 LC 8941051 ug/m^3-LC1 Magee Scientific TAPI M633 Aethalometer
COMMICSPM Source Oriented
61106WD - Sigma Theta (Horizontal)
0200141 deg1 Arithmetic Standard Deviation
METN/ASPM Other (10m Tower)
61104Wind Direction - Resultant 0650141 deg1 Instrumental: RM Young Model 05305
METN/ASPM Other (10m Tower)
61103Wind Speed - Resultant 0650121 mph1 Instrumental: RM Young Model 05305
METN/ASPM Other (10m Tower)
Front Street AQS Site Number
Latitude:
Longitude:
AQS CodePollutant
AQSPOC Keep
AQS MethodCode
AQSUnit-Code
39.13198
-94.53128
29-095-0018
AQCR: 094 Metropolitan Kansas City
Elevation (ft): 728
AQS Freq
MSA: 3760 Kansas City, MO-KS
1331 N. Jackson, Kansas City, MO 64120
State-Obj
AQSScale
AQS Method
AQS Unit
AQS Monitor Type
AQS Monitor Objective
62107Indoor Temperature 0130171 deg C1 Electronic Averaging
METN/ASPM Other
81102PM10 - STP FRM/FEM 0790013 ug/m^31 R&P SA246B TEOM
COMNBRSLAMS Highest Concentration& Population Exposure
Thursday, June 01, 2017 Page 44 of 74
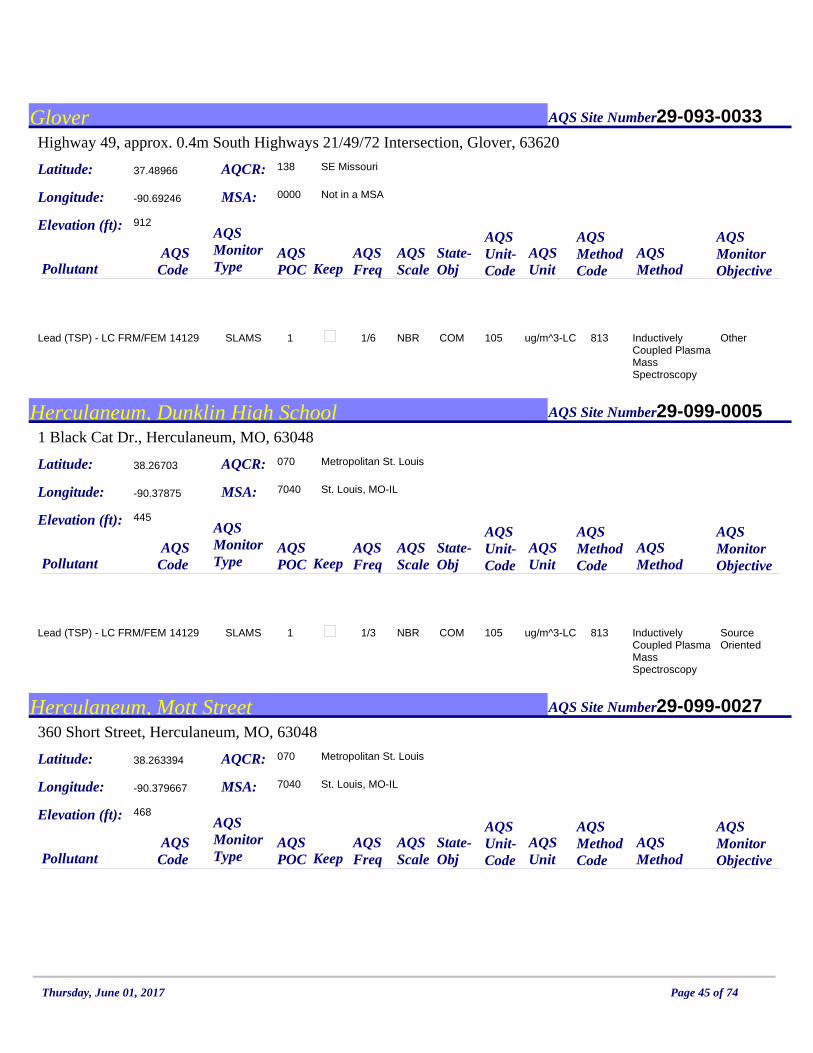
Glover AQS Site Number
Latitude:
Longitude:
AQS CodePollutant
AQSPOC Keep
AQS MethodCode
AQSUnit-Code
37.48966
-90.69246
29-093-0033
AQCR: 138 SE Missouri
Elevation (ft): 912
AQS Freq
MSA: 0000 Not in a MSA
Highway 49, approx. 0.4m South Highways 21/49/72 Intersection, Glover, 63620
State-Obj
AQSScale
AQS Method
AQS Unit
AQS Monitor Type
AQS Monitor Objective
14129Lead (TSP) - LC FRM/FEM 8131051 ug/m^3-LC1/6 Inductively Coupled Plasma Mass Spectroscopy
COMNBRSLAMS Other
Herculaneum, Dunklin High School AQS Site Number
Latitude:
Longitude:
AQS CodePollutant
AQSPOC Keep
AQS MethodCode
AQSUnit-Code
38.26703
-90.37875
29-099-0005
AQCR: 070 Metropolitan St. Louis
Elevation (ft): 445
AQS Freq
MSA: 7040 St. Louis, MO-IL
1 Black Cat Dr., Herculaneum, MO, 63048
State-Obj
AQSScale
AQS Method
AQS Unit
AQS Monitor Type
AQS Monitor Objective
14129Lead (TSP) - LC FRM/FEM 8131051 ug/m^3-LC1/3 Inductively Coupled Plasma Mass Spectroscopy
COMNBRSLAMS Source Oriented
Herculaneum, Mott Street AQS Site Number
Latitude:
Longitude:
AQS CodePollutant
AQSPOC Keep
AQS MethodCode
AQSUnit-Code
38.263394
-90.379667
29-099-0027
AQCR: 070 Metropolitan St. Louis
Elevation (ft): 468
AQS Freq
MSA: 7040 St. Louis, MO-IL
360 Short Street, Herculaneum, MO, 63048
State-Obj
AQSScale
AQS Method
AQS Unit
AQS Monitor Type
AQS Monitor Objective
Thursday, June 01, 2017 Page 45 of 74

62107Indoor Temperature 0130171 deg C1 Electronic Averaging
METN/ASPM Other
14129Lead (TSP) - LC FRM/FEM 8131051 ug/m^3-LC1/1 Inductively Coupled Plasma Mass Spectroscopy
COMMIDSLAMS Source Oriented & Highest Concentration
14129Lead (TSP) - LC FRM/FEM 8131052 ug/m^3-LC1/2 Inductively Coupled Plasma Mass Spectroscopy
COMMIDSLAMS Quality Assurance (Collocation)
42401Sulfur Dioxide 0600081 ppb1 Pulsed Fluorescent
COMMIDSLAMS Source Oriented & Highest Concentration
42406Sulfur Dioxide Max 5-min Avg
0600081 ppb1 Pulsed Fluorescent
COMMIDSPM Source Oriented & Highest Concentration
61104Wind Direction - Resultant 0670141 deg1 Instrumental: RM Young Model 05103
METN/ASPM Other (5.5 meters)
61103Wind Speed - Resultant 0670121 mph1 Instrumental: RM Young Model 05103
METN/ASPM Other (5.5 meters)
Herculaneum, Sherman AQS Site Number
Latitude:
Longitude:
AQS CodePollutant
AQSPOC Keep
AQS MethodCode
AQSUnit-Code
38.27176
-90.37648
29-099-0013
AQCR: 070 Metropolitan St. Louis
Elevation (ft): 462
AQS Freq
MSA: 7040 St. Louis, MO-IL
460 Sherman St., Herculaneum, MO, 63048
State-Obj
AQSScale
AQS Method
AQS Unit
AQS Monitor Type
AQS Monitor Objective
Thursday, June 01, 2017 Page 46 of 74
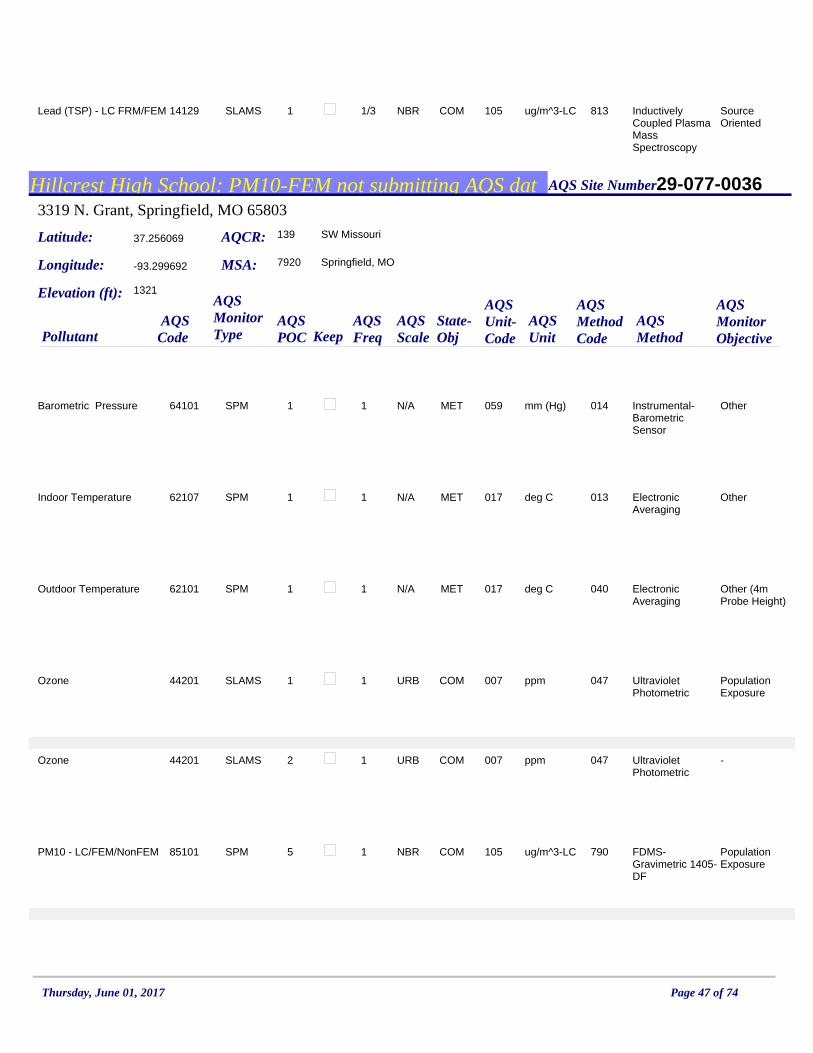
14129Lead (TSP) - LC FRM/FEM 8131051 ug/m^3-LC1/3 Inductively Coupled Plasma Mass Spectroscopy
COMNBRSLAMS Source Oriented
Hillcrest High School: PM10-FEM not submitting AQS dat AQS Site Number
Latitude:
Longitude:
AQS CodePollutant
AQSPOC Keep
AQS MethodCode
AQSUnit-Code
37.256069
-93.299692
29-077-0036
AQCR: 139 SW Missouri
Elevation (ft): 1321
AQS Freq
MSA: 7920 Springfield, MO
3319 N. Grant, Springfield, MO 65803
State-Obj
AQSScale
AQS Method
AQS Unit
AQS Monitor Type
AQS Monitor Objective
64101Barometric Pressure 0140591 mm (Hg)1 Instrumental-Barometric Sensor
METN/ASPM Other
62107Indoor Temperature 0130171 deg C1 Electronic Averaging
METN/ASPM Other
62101Outdoor Temperature 0400171 deg C1 Electronic Averaging
METN/ASPM Other (4m Probe Height)
44201Ozone 0470071 ppm1 Ultraviolet Photometric
COMURBSLAMS Population Exposure
44201Ozone 0470072 ppm1 Ultraviolet Photometric
COMURBSLAMS -
85101PM10 - LC/FEM/NonFEM 7901055 ug/m^3-LC1 FDMS-Gravimetric 1405-DF
COMNBRSPM Population Exposure
Thursday, June 01, 2017 Page 47 of 74

85101PM10 - LC/FEM/NonFEM 2081058 ug/m^3-LC1 FMDS-Gravimetric 1405-DF
COMNBRSLAMS Population Exposure
81102PM10 - STP FRM/FEM 0790013 ug/m^31 R&P SA246B TEOM
COMNBRSLAMS Population Exposure
81102PM10 - STP FRM/FEM 2080018 ug/m^31 FMDS-Gravimetric 1405-DF
COMNBRSLAMS Population Exposure
88101PM2.5 - LC FRM/FEM 1821054 ug/m^3-LC1 FMDS-Gravimetric 1405-DF
COMNBRSLAMS Population Exposure
88500PM2.5 Tot Atmospheric 7901051 ug/m^3-LC1 FDMS-Gravimetric 1405-DF
AQINBRSPM Population Exposure
88503PM2.5 Volatile Channel 7901051 ug/m^3-LC1 FDMS-Gravimetric 1405-DF
AQINBRSPM Population Exposure
86101PMCoarse - LC FRM/FEM 2071058 ug/m^3-LC1 FMDS-Gravimetric 1405-DF
COMNBRSLAMS Population Exposure
62201Relative Humidity 0200191 %humidity1 Instrumental-Computed (Indirect)
METN/ASPM Other
Thursday, June 01, 2017 Page 48 of 74
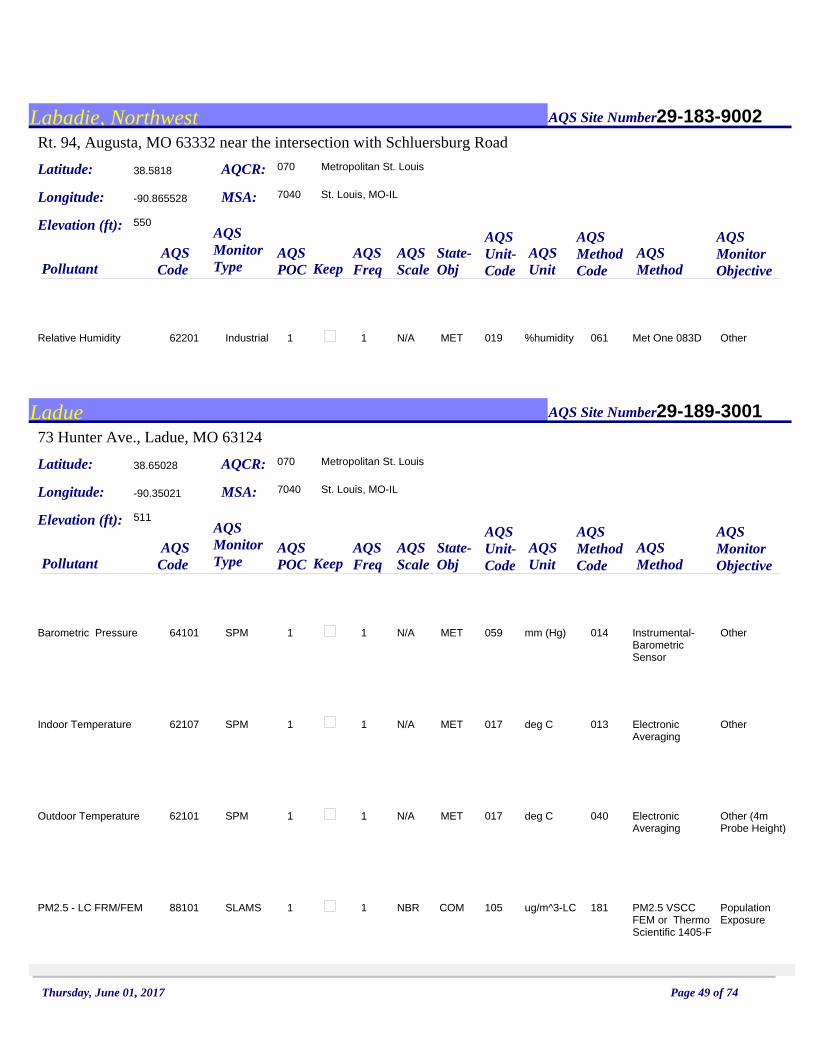
Labadie, Northwest AQS Site Number
Latitude:
Longitude:
AQS CodePollutant
AQSPOC Keep
AQS MethodCode
AQSUnit-Code
38.5818
-90.865528
29-183-9002
AQCR: 070 Metropolitan St. Louis
Elevation (ft): 550
AQS Freq
MSA: 7040 St. Louis, MO-IL
Rt. 94, Augusta, MO 63332 near the intersection with Schluersburg Road
State-Obj
AQSScale
AQS Method
AQS Unit
AQS Monitor Type
AQS Monitor Objective
62201Relative Humidity 0610191 %humidity1 Met One 083DMETN/AIndustrial Other
Ladue AQS Site Number
Latitude:
Longitude:
AQS CodePollutant
AQSPOC Keep
AQS MethodCode
AQSUnit-Code
38.65028
-90.35021
29-189-3001
AQCR: 070 Metropolitan St. Louis
Elevation (ft): 511
AQS Freq
MSA: 7040 St. Louis, MO-IL
73 Hunter Ave., Ladue, MO 63124
State-Obj
AQSScale
AQS Method
AQS Unit
AQS Monitor Type
AQS Monitor Objective
64101Barometric Pressure 0140591 mm (Hg)1 Instrumental-Barometric Sensor
METN/ASPM Other
62107Indoor Temperature 0130171 deg C1 Electronic Averaging
METN/ASPM Other
62101Outdoor Temperature 0400171 deg C1 Electronic Averaging
METN/ASPM Other (4m Probe Height)
88101PM2.5 - LC FRM/FEM 1811051 ug/m^3-LC1 PM2.5 VSCC FEM or Thermo Scientific 1405-F
COMNBRSLAMS Population Exposure
Thursday, June 01, 2017 Page 49 of 74
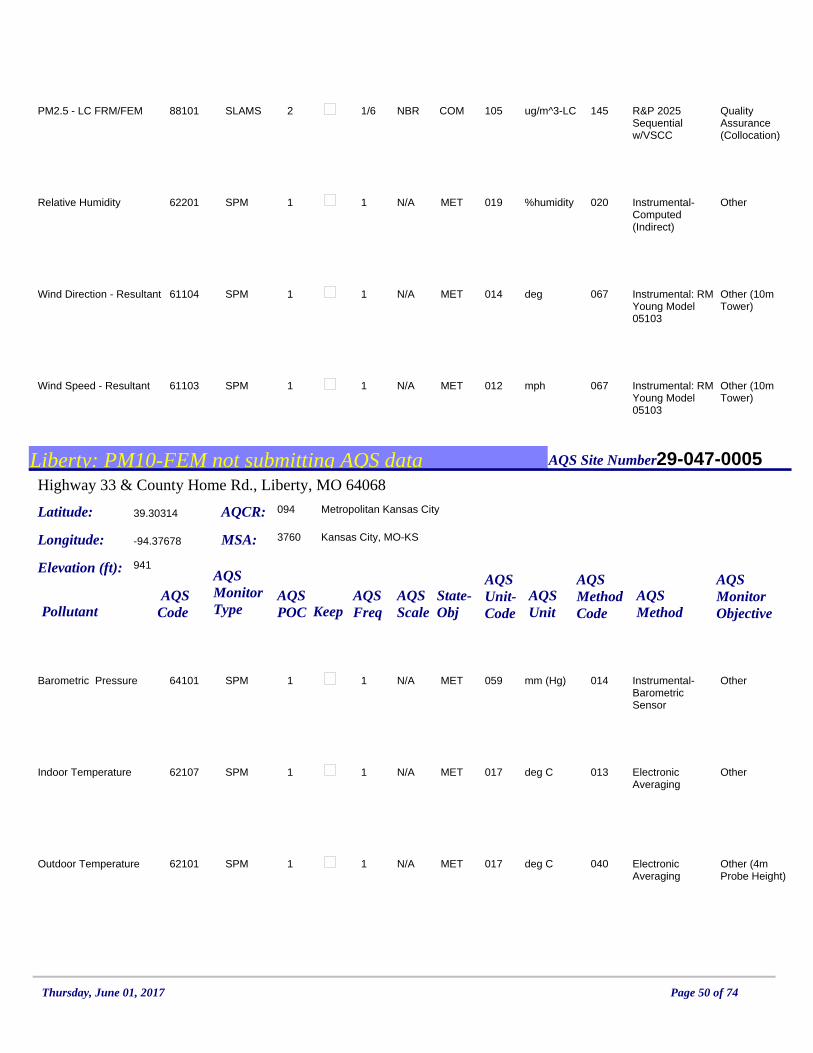
88101PM2.5 - LC FRM/FEM 1451052 ug/m^3-LC1/6 R&P 2025 Sequential w/VSCC
COMNBRSLAMS Quality Assurance (Collocation)
62201Relative Humidity 0200191 %humidity1 Instrumental-Computed (Indirect)
METN/ASPM Other
61104Wind Direction - Resultant 0670141 deg1 Instrumental: RM Young Model 05103
METN/ASPM Other (10m Tower)
61103Wind Speed - Resultant 0670121 mph1 Instrumental: RM Young Model 05103
METN/ASPM Other (10m Tower)
Liberty: PM10-FEM not submitting AQS data AQS Site Number
Latitude:
Longitude:
AQS CodePollutant
AQSPOC Keep
AQS MethodCode
AQSUnit-Code
39.30314
-94.37678
29-047-0005
AQCR: 094 Metropolitan Kansas City
Elevation (ft): 941
AQS Freq
MSA: 3760 Kansas City, MO-KS
Highway 33 & County Home Rd., Liberty, MO 64068
State-Obj
AQSScale
AQS Method
AQS Unit
AQS Monitor Type
AQS Monitor Objective
64101Barometric Pressure 0140591 mm (Hg)1 Instrumental-Barometric Sensor
METN/ASPM Other
62107Indoor Temperature 0130171 deg C1 Electronic Averaging
METN/ASPM Other
62101Outdoor Temperature 0400171 deg C1 Electronic Averaging
METN/ASPM Other (4m Probe Height)
Thursday, June 01, 2017 Page 50 of 74

44201Ozone 0470071 ppm1 Ultraviolet Photometric
COMNBRSLAMS Population Exposure
44201Ozone 0470072 ppm1 Ultraviolet Photometric
COMNBRSLAMS -
85101PM10 - LC/FEM/NonFEM 7901055 ug/m^3-LC1 FDMS-Gravimetric 1405-DF
COMNBRSPM Population Exposure
85101PM10 - LC/FEM/NonFEM 2081058 ug/m^3-LC1 FMDS-Gravimetric 1405-DF
COMNBRSLAMS Population Exposure
81102PM10 - STP FRM/FEM 2080018 ug/m^31 FMDS-Gravimetric 1405-DF
COMNBRSLAMS Population Exposure
88101PM2.5 - LC FRM/FEM 1821054 ug/m^3-LC1 FMDS-Gravimetric 1405-DF
COMNBRSLAMS Population Exposure
88500PM2.5 Tot Atmospheric 7901051 ug/m^3-LC1 FDMS-Gravimetric 1405-DF
AQINBRSPM Population Exposure
88503PM2.5 Volatile Channel 7901051 ug/m^3-LC1 FDMS-Gravimetric 1405-DF
AQINBRSPM Population Exposure
86101PMCoarse - LC FRM/FEM 2071058 ug/m^3-LC1 FMDS-Gravimetric 1405-DF
COMNBRSLAMS Population Exposure
62201Relative Humidity 0200191 %humidity1 Instrumental-Computed (Indirect)
METN/ASPM Other
Thursday, June 01, 2017 Page 51 of 74

63301Solar Radiation 0110791 W/m^21 Instrumental-Pyranometer
METN/ASPM Other
61104Wind Direction - Resultant 0670141 deg1 Instrumental: RM Young Model 05103
METN/ASPM Other (5.5 meters)
61103Wind Speed - Resultant 0670121 mph1 Instrumental: RM Young Model 05103
METN/ASPM Other (5.5 meters)
Margaretta AQS Site Number
Latitude:
Longitude:
AQS CodePollutant
AQSPOC Keep
AQS MethodCode
AQSUnit-Code
38.673172
-90.239086
29-510-0086
AQCR: 070 Metropolitan St. Louis
Elevation (ft): 514
AQS Freq
MSA: 7040 St. Louis, MO-IL
4520 Margaretta, St. Louis, MO 63105
State-Obj
AQSScale
AQS Method
AQS Unit
AQS Monitor Type
AQS Monitor Objective
62107Indoor Temperature 0130171 deg C1 Electronic Averaging
METN/ASPM Other
42601Nitric Oxide 0740081 ppb1 Chemiluminescence
COMNBRSPM Population Exposure
42602Nitrogen Dioxide 0740081 ppb1 Chemiluminescence
COMNBRSLAMS Population Exposure
42603Oxides of Nitrogen 0740081 ppb1 Chemiluminescence
COMNBRSPM Population Exposure
Thursday, June 01, 2017 Page 52 of 74

81102PM10 - STP FRM/FEM 0790013 ug/m^31 R&P SA246B TEOM
COMMIDSLAMS Population Exposure
42401Sulfur Dioxide 0600081 ppb1 Pulsed Fluorescent
COMNBRSLAMS Population Exposure
42406Sulfur Dioxide Max 5-min Avg
0600081 ppb1 Pulsed Fluorescent
COMNBRSLAMS Population Exposure
Mark Twain State Park AQS Site Number
Latitude:
Longitude:
AQS CodePollutant
AQSPOC Keep
AQS MethodCode
AQSUnit-Code
39.47510
-91.78899
29-137-0001
AQCR: 137 Northern Missouri
Elevation (ft): 710
AQS Freq
MSA: 0000 Not in a MSA
20057 State Park Office Rd., Stoutsville, MO 65283
State-Obj
AQSScale
AQS Method
AQS Unit
AQS Monitor Type
AQS Monitor Objective
62107Indoor Temperature 0130171 deg C1 Electronic Averaging
METN/ASPM Other
42601Nitric Oxide 0740081 ppb1 Chemiluminescence
COMREGSPM General/Background
42602Nitrogen Dioxide 0740081 ppb1 Chemiluminescence
COMREGSPM General/Background
42603Oxides of Nitrogen 0740081 ppb1 Chemiluminescence
COMREGSPM General/Background
Thursday, June 01, 2017 Page 53 of 74
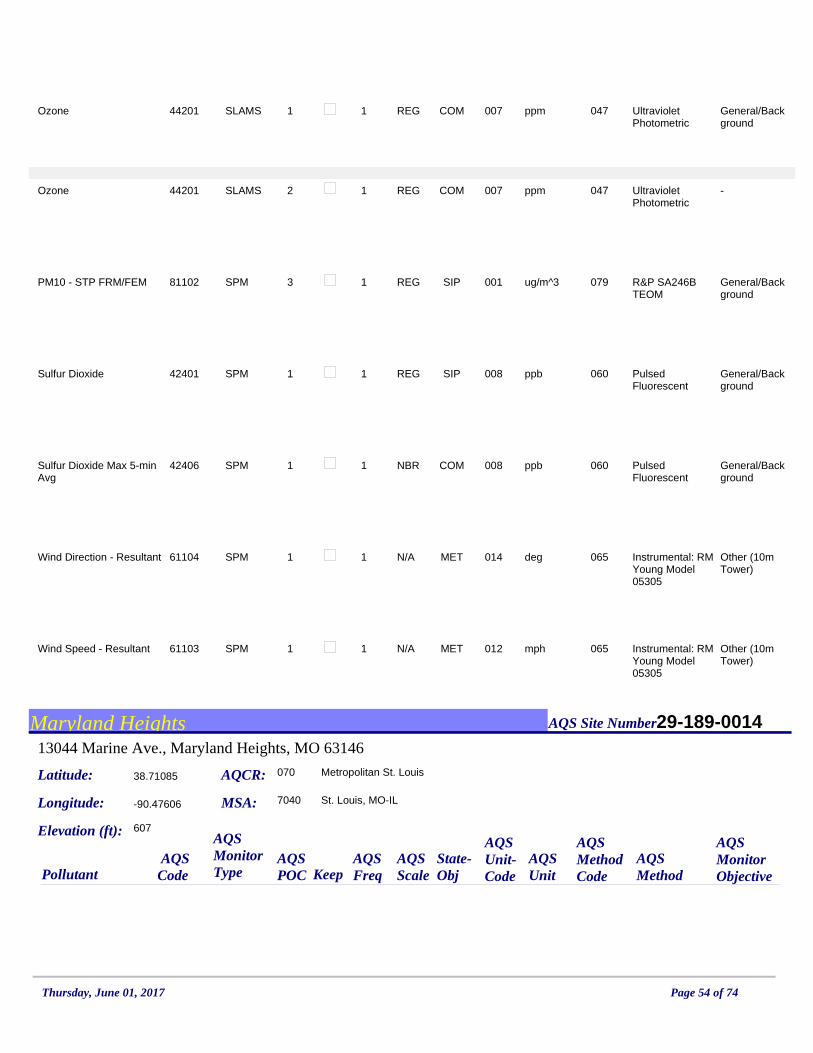
44201Ozone 0470071 ppm1 Ultraviolet Photometric
COMREGSLAMS General/Background
44201Ozone 0470072 ppm1 Ultraviolet Photometric
COMREGSLAMS -
81102PM10 - STP FRM/FEM 0790013 ug/m^31 R&P SA246B TEOM
SIPREGSPM General/Background
42401Sulfur Dioxide 0600081 ppb1 Pulsed Fluorescent
SIPREGSPM General/Background
42406Sulfur Dioxide Max 5-min Avg
0600081 ppb1 Pulsed Fluorescent
COMNBRSPM General/Background
61104Wind Direction - Resultant 0650141 deg1 Instrumental: RM Young Model 05305
METN/ASPM Other (10m Tower)
61103Wind Speed - Resultant 0650121 mph1 Instrumental: RM Young Model 05305
METN/ASPM Other (10m Tower)
Maryland Heights AQS Site Number
Latitude:
Longitude:
AQS CodePollutant
AQSPOC Keep
AQS MethodCode
AQSUnit-Code
38.71085
-90.47606
29-189-0014
AQCR: 070 Metropolitan St. Louis
Elevation (ft): 607
AQS Freq
MSA: 7040 St. Louis, MO-IL
13044 Marine Ave., Maryland Heights, MO 63146
State-Obj
AQSScale
AQS Method
AQS Unit
AQS Monitor Type
AQS Monitor Objective
Thursday, June 01, 2017 Page 54 of 74
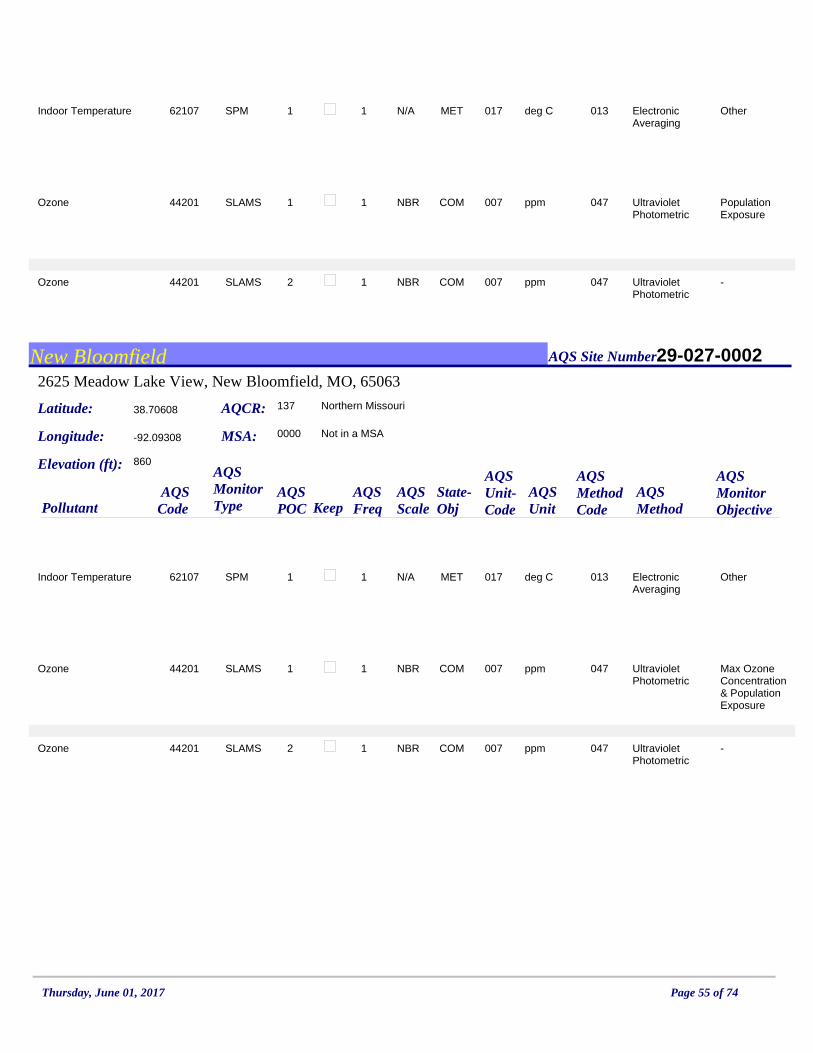
62107Indoor Temperature 0130171 deg C1 Electronic Averaging
METN/ASPM Other
44201Ozone 0470071 ppm1 Ultraviolet Photometric
COMNBRSLAMS Population Exposure
44201Ozone 0470072 ppm1 Ultraviolet Photometric
COMNBRSLAMS -
New Bloomfield AQS Site Number
Latitude:
Longitude:
AQS CodePollutant
AQSPOC Keep
AQS MethodCode
AQSUnit-Code
38.70608
-92.09308
29-027-0002
AQCR: 137 Northern Missouri
Elevation (ft): 860
AQS Freq
MSA: 0000 Not in a MSA
2625 Meadow Lake View, New Bloomfield, MO, 65063
State-Obj
AQSScale
AQS Method
AQS Unit
AQS Monitor Type
AQS Monitor Objective
62107Indoor Temperature 0130171 deg C1 Electronic Averaging
METN/ASPM Other
44201Ozone 0470071 ppm1 Ultraviolet Photometric
COMNBRSLAMS Max Ozone Concentration& Population Exposure
44201Ozone 0470072 ppm1 Ultraviolet Photometric
COMNBRSLAMS -
Thursday, June 01, 2017 Page 55 of 74

Oates AQS Site Number
Latitude:
Longitude:
AQS CodePollutant
AQSPOC Keep
AQS MethodCode
AQSUnit-Code
37.56485
-91.11423
29-179-0034
AQCR: 138 SE Missouri
Elevation (ft): 1134
AQS Freq
MSA: 0000 Not in a MSA
13155 Highway KK, Boss, MO 65440
State-Obj
AQSScale
AQS Method
AQS Unit
AQS Monitor Type
AQS Monitor Objective
14129Lead (TSP) - LC FRM/FEM 8131051 ug/m^3-LC1/6 Inductively Coupled Plasma Mass Spectroscopy
COMNBRSLAMS Source Oriented
Orchard Farm AQS Site Number
Latitude:
Longitude:
AQS CodePollutant
AQSPOC Keep
AQS MethodCode
AQSUnit-Code
38.8994
-90.44917
29-183-1004
AQCR: 070 Metropolitan St. Louis
Elevation (ft): 441
AQS Freq
MSA: 7040 St. Louis, MO-IL
2165 Highway V, St. Charles, MO 63301
State-Obj
AQSScale
AQS Method
AQS Unit
AQS Monitor Type
AQS Monitor Objective
62107Indoor Temperature 0130171 deg C1 Electronic Averaging
METN/ASPM Other
44201Ozone 0470071 ppm1 Ultraviolet Photometric
COMURBSLAMS Extreme Downwind
44201Ozone 0470072 ppm1 Ultraviolet Photometric
COMURBSLAMS -
Thursday, June 01, 2017 Page 56 of 74
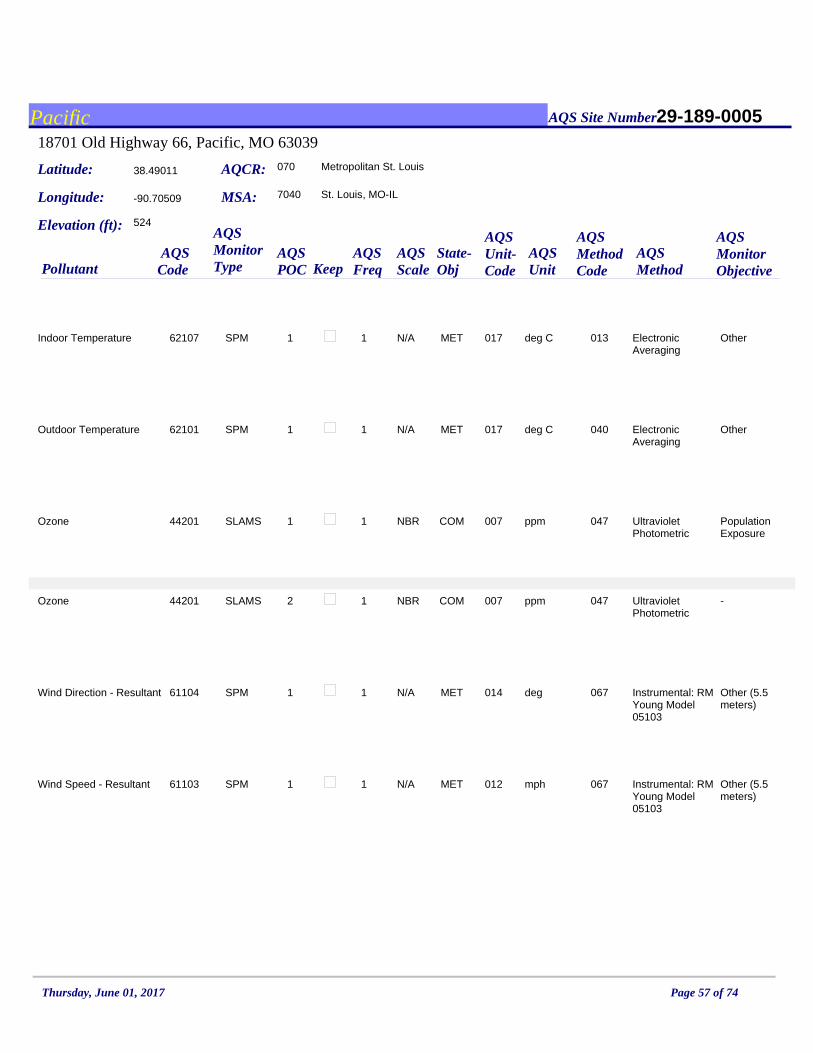
Pacific AQS Site Number
Latitude:
Longitude:
AQS CodePollutant
AQSPOC Keep
AQS MethodCode
AQSUnit-Code
38.49011
-90.70509
29-189-0005
AQCR: 070 Metropolitan St. Louis
Elevation (ft): 524
AQS Freq
MSA: 7040 St. Louis, MO-IL
18701 Old Highway 66, Pacific, MO 63039
State-Obj
AQSScale
AQS Method
AQS Unit
AQS Monitor Type
AQS Monitor Objective
62107Indoor Temperature 0130171 deg C1 Electronic Averaging
METN/ASPM Other
62101Outdoor Temperature 0400171 deg C1 Electronic Averaging
METN/ASPM Other
44201Ozone 0470071 ppm1 Ultraviolet Photometric
COMNBRSLAMS Population Exposure
44201Ozone 0470072 ppm1 Ultraviolet Photometric
COMNBRSLAMS -
61104Wind Direction - Resultant 0670141 deg1 Instrumental: RM Young Model 05103
METN/ASPM Other (5.5 meters)
61103Wind Speed - Resultant 0670121 mph1 Instrumental: RM Young Model 05103
METN/ASPM Other (5.5 meters)
Thursday, June 01, 2017 Page 57 of 74
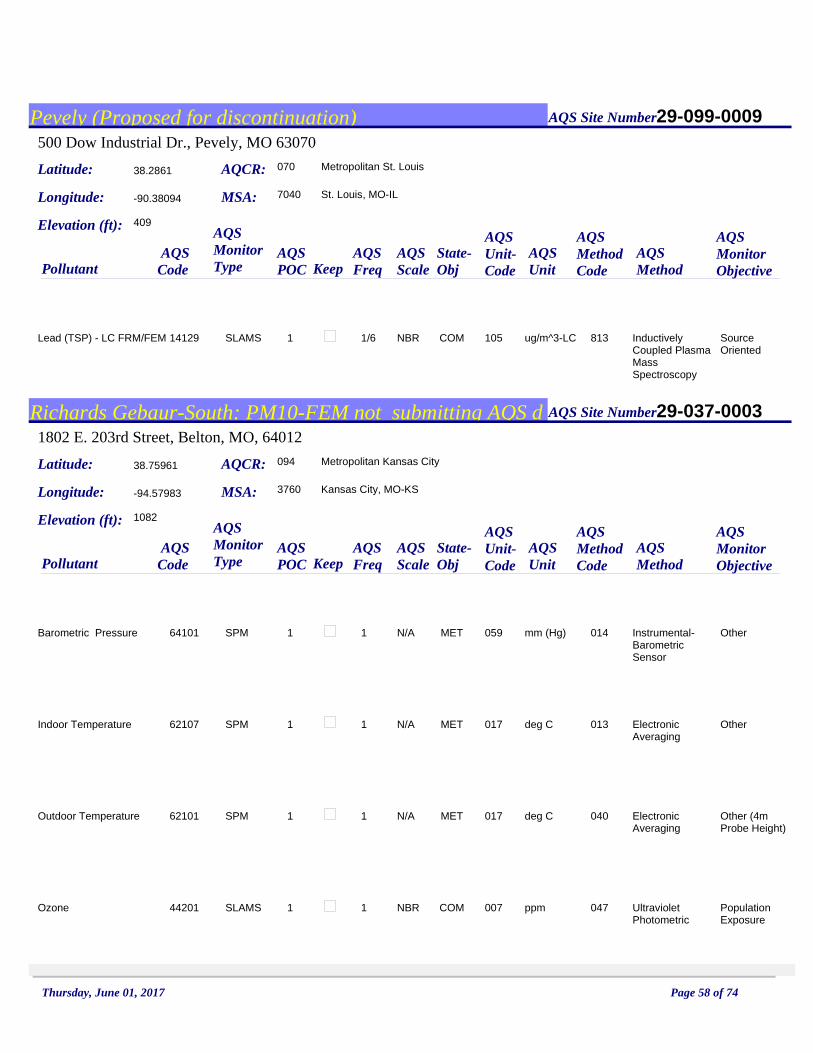
Pevely (Proposed for discontinuation) AQS Site Number
Latitude:
Longitude:
AQS CodePollutant
AQSPOC Keep
AQS MethodCode
AQSUnit-Code
38.2861
-90.38094
29-099-0009
AQCR: 070 Metropolitan St. Louis
Elevation (ft): 409
AQS Freq
MSA: 7040 St. Louis, MO-IL
500 Dow Industrial Dr., Pevely, MO 63070
State-Obj
AQSScale
AQS Method
AQS Unit
AQS Monitor Type
AQS Monitor Objective
14129Lead (TSP) - LC FRM/FEM 8131051 ug/m^3-LC1/6 Inductively Coupled Plasma Mass Spectroscopy
COMNBRSLAMS Source Oriented
Richards Gebaur-South: PM10-FEM not submitting AQS d AQS Site Number
Latitude:
Longitude:
AQS CodePollutant
AQSPOC Keep
AQS MethodCode
AQSUnit-Code
38.75961
-94.57983
29-037-0003
AQCR: 094 Metropolitan Kansas City
Elevation (ft): 1082
AQS Freq
MSA: 3760 Kansas City, MO-KS
1802 E. 203rd Street, Belton, MO, 64012
State-Obj
AQSScale
AQS Method
AQS Unit
AQS Monitor Type
AQS Monitor Objective
64101Barometric Pressure 0140591 mm (Hg)1 Instrumental-Barometric Sensor
METN/ASPM Other
62107Indoor Temperature 0130171 deg C1 Electronic Averaging
METN/ASPM Other
62101Outdoor Temperature 0400171 deg C1 Electronic Averaging
METN/ASPM Other (4m Probe Height)
44201Ozone 0470071 ppm1 Ultraviolet Photometric
COMNBRSLAMS Population Exposure
Thursday, June 01, 2017 Page 58 of 74
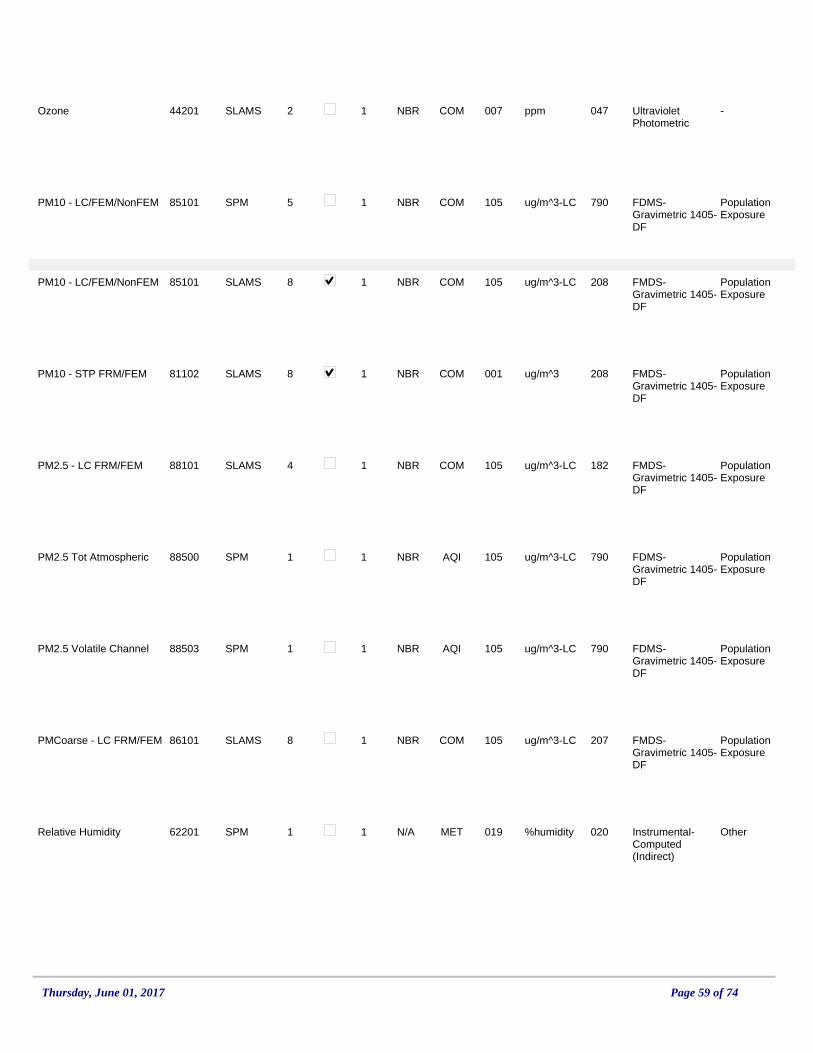
44201Ozone 0470072 ppm1 Ultraviolet Photometric
COMNBRSLAMS -
85101PM10 - LC/FEM/NonFEM 7901055 ug/m^3-LC1 FDMS-Gravimetric 1405-DF
COMNBRSPM Population Exposure
85101PM10 - LC/FEM/NonFEM 2081058 ug/m^3-LC1 FMDS-Gravimetric 1405-DF
COMNBRSLAMS Population Exposure
81102PM10 - STP FRM/FEM 2080018 ug/m^31 FMDS-Gravimetric 1405-DF
COMNBRSLAMS Population Exposure
88101PM2.5 - LC FRM/FEM 1821054 ug/m^3-LC1 FMDS-Gravimetric 1405-DF
COMNBRSLAMS Population Exposure
88500PM2.5 Tot Atmospheric 7901051 ug/m^3-LC1 FDMS-Gravimetric 1405-DF
AQINBRSPM Population Exposure
88503PM2.5 Volatile Channel 7901051 ug/m^3-LC1 FDMS-Gravimetric 1405-DF
AQINBRSPM Population Exposure
86101PMCoarse - LC FRM/FEM 2071058 ug/m^3-LC1 FMDS-Gravimetric 1405-DF
COMNBRSLAMS Population Exposure
62201Relative Humidity 0200191 %humidity1 Instrumental-Computed (Indirect)
METN/ASPM Other
Thursday, June 01, 2017 Page 59 of 74

61104Wind Direction - Resultant 0650141 deg1 Instrumental: RM Young Model 05305
METN/ASPM Other (10m Tower)
61103Wind Speed - Resultant 0650121 mph1 Instrumental: RM Young Model 05305
METN/ASPM Other (10m Tower)
Rider Trail, I-70 AQS Site Number
Latitude:
Longitude:
AQS CodePollutant
AQSPOC Keep
AQS MethodCode
AQSUnit-Code
38.75264
-90.44884
29-189-0016
AQCR: 070 Metropolitan St. Louis
Elevation (ft): 515
AQS Freq
MSA: 7040 St. Louis, MO-IL
13080 Hollenberg Drive, Bridgeton, MO 63044
State-Obj
AQSScale
AQS Method
AQS Unit
AQS Monitor Type
AQS Monitor Objective
62107Indoor Temperature 0130171 deg C1 Electronic Averaging
METN/ASPM Other
42601Nitric Oxide 0740081 ppb1 Chemiluminescence
COMMICSPM Source Oriented
42602Nitrogen Dioxide 0740081 ppb1 Chemiluminescence
COMMICSLAMS Source Oriented
62101Outdoor Temperature 0400172 deg C1 Electronic Averaging
METN/ASPM Other (10m Probe Height)
62101Outdoor Temperature 0400173 deg C1 Electronic Averaging
METN/ASPM Other (2m Probe Height)
Thursday, June 01, 2017 Page 60 of 74

62106Outdoor Temperature Diff 0411161 Temp Diff deg C
1 Instrumental: Elect or Mach Avg Lev 2-Lev1
METN/ASPM Other (10m - 2m Probe Height)
42603Oxides of Nitrogen 0740081 ppb1 Chemiluminescence
COMMICSPM Source Oriented
65102Precipitation 0140211 inches1 Heated Tipping Bucket
METN/ASPM Other
62201Relative Humidity 0200191 %humidity1 Instrumental-Computed (Indirect)
METN/ASPM Other
63301Solar Radiation 0110791 W/m^21 Instrumental-Pyranometer
METN/ASPM Other
42401Sulfur Dioxide 0600081 ppb1 Pulsed Fluorescent
SPPMIDSPM Population Exposure
42406Sulfur Dioxide Max 5-min Avg
0600081 ppb1 Pulsed Fluorescent
SPPMIDSPM Population Exposure
61106WD - Sigma Theta (Horizontal)
0200141 deg1 Arithmetic Standard Deviation
METN/ASPM Other (10m Tower)
61104Wind Direction - Resultant 0650141 deg1 Instrumental: RM Young Model 05305
METN/ASPM Other (10m Tower)
Thursday, June 01, 2017 Page 61 of 74

61103Wind Speed - Resultant 0650121 mph1 Instrumental: RM Young Model 05305
METN/ASPM Other (10m Tower)
Rocky Creek AQS Site Number
Latitude:
Longitude:
AQS CodePollutant
AQSPOC Keep
AQS MethodCode
AQSUnit-Code
39.33188
-94.58069
29-047-0006
AQCR: 094 Metropolitan Kansas City
Elevation (ft): 990
AQS Freq
MSA: 3760 Kansas City, MO-KS
13131 Highway 169, Kansas City, MO 64165
State-Obj
AQSScale
AQS Method
AQS Unit
AQS Monitor Type
AQS Monitor Objective
62107Indoor Temperature 0130171 deg C1 Electronic Averaging
METN/ASPM Other
44201Ozone 0470071 ppm1 Ultraviolet Photometric
COMNBRSLAMS Population Exposure
44201Ozone 0470072 ppm1 Ultraviolet Photometric
COMNBRSLAMS -
Savannah AQS Site Number
Latitude:
Longitude:
AQS CodePollutant
AQSPOC Keep
AQS MethodCode
AQSUnit-Code
39.9544
-94.849
29-003-0001
AQCR: 137 Northern Missouri
Elevation (ft): 1120
AQS Freq
MSA: 7000 St. Joseph, MO
11796 Highway 71, Savannah, MO 64485
State-Obj
AQSScale
AQS Method
AQS Unit
AQS Monitor Type
AQS Monitor Objective
62107Indoor Temperature 0130171 deg C1 Electronic Averaging
METN/ASPM Other
Thursday, June 01, 2017 Page 62 of 74

44201Ozone 0470071 ppm1 Ultraviolet Photometric
COMNBRSLAMS Population Exposure
44201Ozone 0470072 ppm1 Ultraviolet Photometric
COMNBRSLAMS -
South Broadway: PM10-FEM not submitting AQS data AQS Site Number
Latitude:
Longitude:
AQS CodePollutant
AQSPOC Keep
AQS MethodCode
AQSUnit-Code
38.5425
-90.263611
29-510-0007
AQCR: 070 Metropolitan St. Louis
Elevation (ft): 452
AQS Freq
MSA: 7040 St. Louis, MO-IL
8227 South Broadway, St. Louis, MO 63111
State-Obj
AQSScale
AQS Method
AQS Unit
AQS Monitor Type
AQS Monitor Objective
64101Barometric Pressure 0140591 mm (Hg)1 Instrumental-Barometric Sensor
METN/ASLAMS Other
62107Indoor Temperature 0130171 deg C1 Electronic Averaging
METN/ASPM Other
62101Outdoor Temperature 0400171 deg C1 Electronic Averaging
METN/ASPM Other (4m Probe Height)
85101PM10 - LC/FEM/NonFEM 7901055 ug/m^3-LC1 FDMS-Gravimetric 1405-DF
COMNBRSPM Population Exposure
85101PM10 - LC/FEM/NonFEM 2081058 ug/m^3-LC1 FMDS-Gravimetric 1405-DF
COMNBRSLAMS Population Exposure
Thursday, June 01, 2017 Page 63 of 74
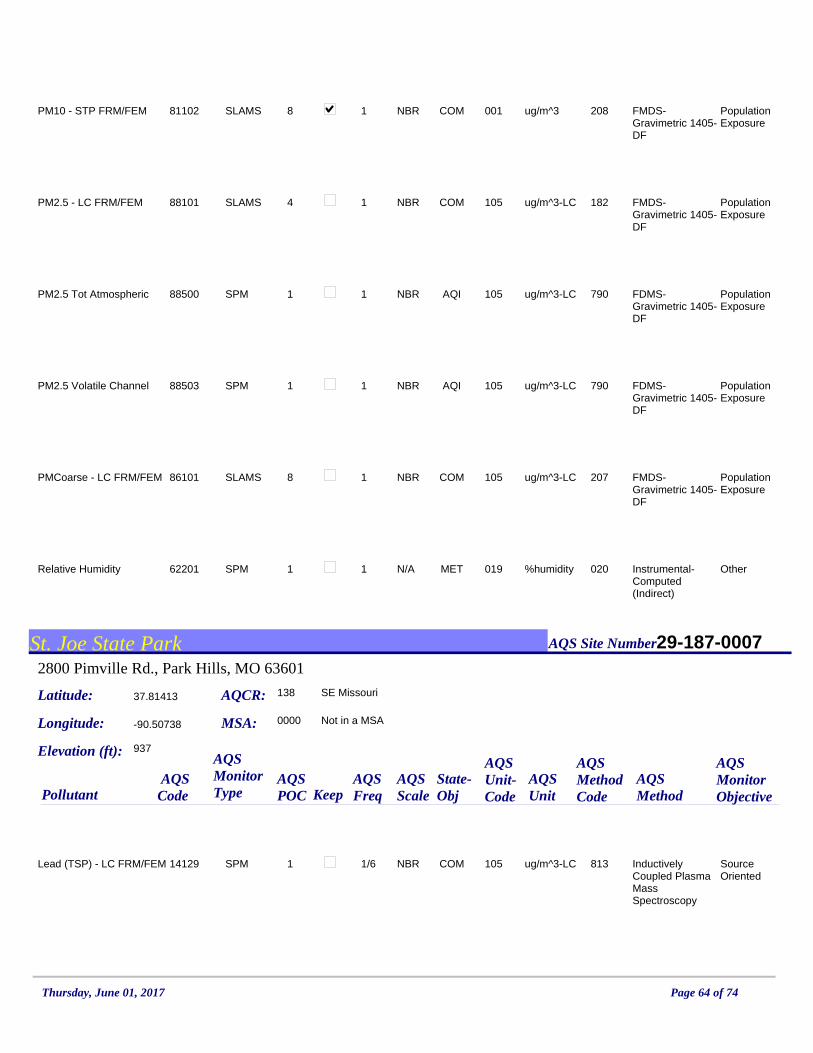
81102PM10 - STP FRM/FEM 2080018 ug/m^31 FMDS-Gravimetric 1405-DF
COMNBRSLAMS Population Exposure
88101PM2.5 - LC FRM/FEM 1821054 ug/m^3-LC1 FMDS-Gravimetric 1405-DF
COMNBRSLAMS Population Exposure
88500PM2.5 Tot Atmospheric 7901051 ug/m^3-LC1 FDMS-Gravimetric 1405-DF
AQINBRSPM Population Exposure
88503PM2.5 Volatile Channel 7901051 ug/m^3-LC1 FDMS-Gravimetric 1405-DF
AQINBRSPM Population Exposure
86101PMCoarse - LC FRM/FEM 2071058 ug/m^3-LC1 FMDS-Gravimetric 1405-DF
COMNBRSLAMS Population Exposure
62201Relative Humidity 0200191 %humidity1 Instrumental-Computed (Indirect)
METN/ASPM Other
St. Joe State Park AQS Site Number
Latitude:
Longitude:
AQS CodePollutant
AQSPOC Keep
AQS MethodCode
AQSUnit-Code
37.81413
-90.50738
29-187-0007
AQCR: 138 SE Missouri
Elevation (ft): 937
AQS Freq
MSA: 0000 Not in a MSA
2800 Pimville Rd., Park Hills, MO 63601
State-Obj
AQSScale
AQS Method
AQS Unit
AQS Monitor Type
AQS Monitor Objective
14129Lead (TSP) - LC FRM/FEM 8131051 ug/m^3-LC1/6 Inductively Coupled Plasma Mass Spectroscopy
COMNBRSPM Source Oriented
Thursday, June 01, 2017 Page 64 of 74
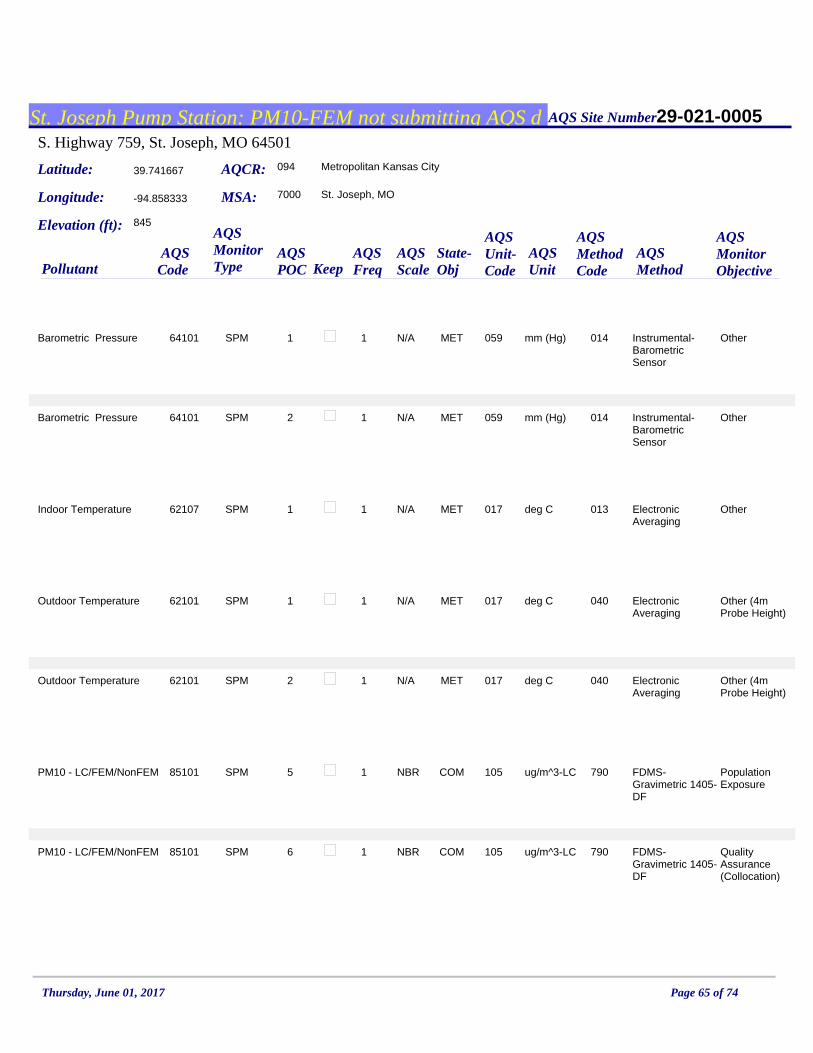
St. Joseph Pump Station: PM10-FEM not submitting AQS d AQS Site Number
Latitude:
Longitude:
AQS CodePollutant
AQSPOC Keep
AQS MethodCode
AQSUnit-Code
39.741667
-94.858333
29-021-0005
AQCR: 094 Metropolitan Kansas City
Elevation (ft): 845
AQS Freq
MSA: 7000 St. Joseph, MO
S. Highway 759, St. Joseph, MO 64501
State-Obj
AQSScale
AQS Method
AQS Unit
AQS Monitor Type
AQS Monitor Objective
64101Barometric Pressure 0140591 mm (Hg)1 Instrumental-Barometric Sensor
METN/ASPM Other
64101Barometric Pressure 0140592 mm (Hg)1 Instrumental-Barometric Sensor
METN/ASPM Other
62107Indoor Temperature 0130171 deg C1 Electronic Averaging
METN/ASPM Other
62101Outdoor Temperature 0400171 deg C1 Electronic Averaging
METN/ASPM Other (4m Probe Height)
62101Outdoor Temperature 0400172 deg C1 Electronic Averaging
METN/ASPM Other (4m Probe Height)
85101PM10 - LC/FEM/NonFEM 7901055 ug/m^3-LC1 FDMS-Gravimetric 1405-DF
COMNBRSPM Population Exposure
85101PM10 - LC/FEM/NonFEM 7901056 ug/m^3-LC1 FDMS-Gravimetric 1405-DF
COMNBRSPM Quality Assurance (Collocation)
Thursday, June 01, 2017 Page 65 of 74

85101PM10 - LC/FEM/NonFEM 2081058 ug/m^3-LC1 FMDS-Gravimetric 1405-DF
COMNBRSLAMS Population Exposure
85101PM10 - LC/FEM/NonFEM 2081059 ug/m^3-LC1 FMDS-Gravimetric 1405-DF
COMNBRSLAMS Quality Assurance (Collocation)
81102PM10 - STP FRM/FEM 0790013 ug/m^31 R&P SA246B TEOM
COMNBRSLAMS Population Exposure
81102PM10 - STP FRM/FEM 2080018 ug/m^31 FMDS-Gravimetric 1405-DF
COMNBRSLAMS Population Exposure
81102PM10 - STP FRM/FEM 2080019 ug/m^31 FMDS-Gravimetric 1405-DF
COMNBRSLAMS Quality Assurance (Collocation)
88101PM2.5 - LC FRM/FEM 1821054 ug/m^3-LC1 FMDS-Gravimetric 1405-DF
COMNBRSLAMS Population Exposure
88101PM2.5 - LC FRM/FEM 1821055 ug/m^3-LC1 FMDS-Gravimetric 1405-DF
COMNBRSLAMS Quality Assurance (Collocation)
88500PM2.5 Tot Atmospheric 7901051 ug/m^3-LC1 FDMS-Gravimetric 1405-DF
AQINBRSPM Population Exposure
88500PM2.5 Tot Atmospheric 7901052 ug/m^3-LC1 FDMS-Gravimetric 1405-DF
AQINBRSPM Quality Assurance (Collocation)
88503PM2.5 Volatile Channel 7901051 ug/m^3-LC1 FDMS-Gravimetric 1405-DF
AQINBRSPM Population Exposure
Thursday, June 01, 2017 Page 66 of 74
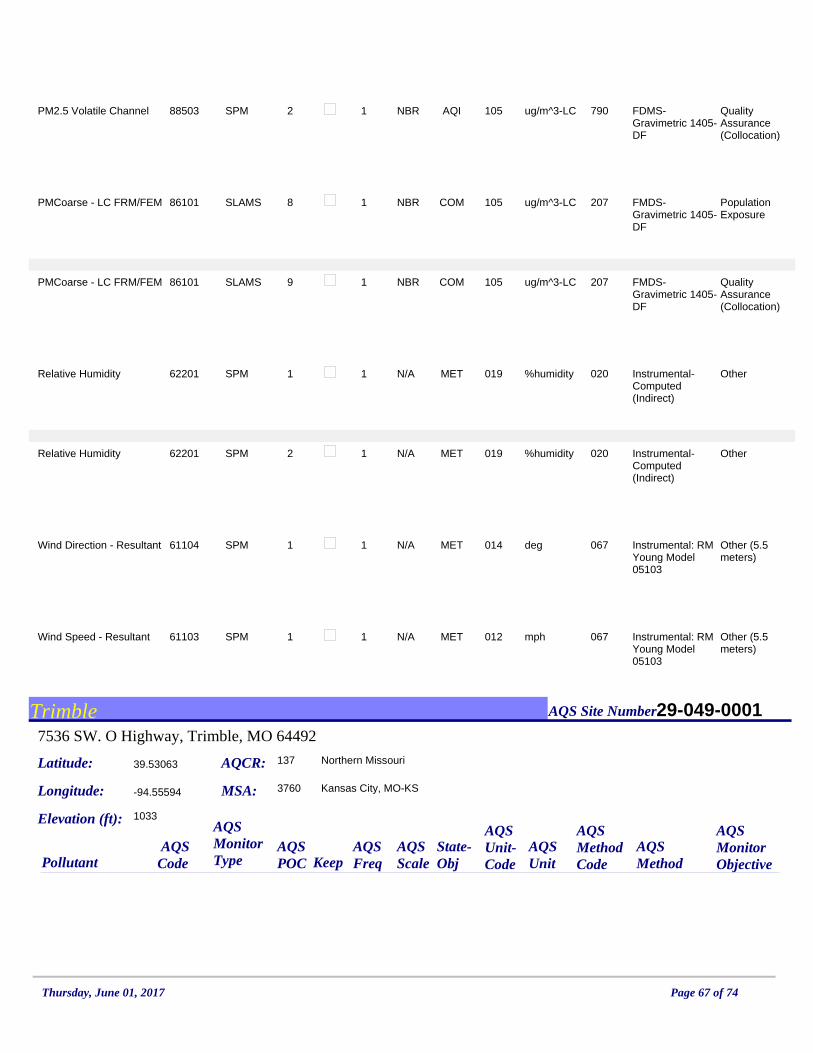
88503PM2.5 Volatile Channel 7901052 ug/m^3-LC1 FDMS-Gravimetric 1405-DF
AQINBRSPM Quality Assurance (Collocation)
86101PMCoarse - LC FRM/FEM 2071058 ug/m^3-LC1 FMDS-Gravimetric 1405-DF
COMNBRSLAMS Population Exposure
86101PMCoarse - LC FRM/FEM 2071059 ug/m^3-LC1 FMDS-Gravimetric 1405-DF
COMNBRSLAMS Quality Assurance (Collocation)
62201Relative Humidity 0200191 %humidity1 Instrumental-Computed (Indirect)
METN/ASPM Other
62201Relative Humidity 0200192 %humidity1 Instrumental-Computed (Indirect)
METN/ASPM Other
61104Wind Direction - Resultant 0670141 deg1 Instrumental: RM Young Model 05103
METN/ASPM Other (5.5 meters)
61103Wind Speed - Resultant 0670121 mph1 Instrumental: RM Young Model 05103
METN/ASPM Other (5.5 meters)
Trimble AQS Site Number
Latitude:
Longitude:
AQS CodePollutant
AQSPOC Keep
AQS MethodCode
AQSUnit-Code
39.53063
-94.55594
29-049-0001
AQCR: 137 Northern Missouri
Elevation (ft): 1033
AQS Freq
MSA: 3760 Kansas City, MO-KS
7536 SW. O Highway, Trimble, MO 64492
State-Obj
AQSScale
AQS Method
AQS Unit
AQS Monitor Type
AQS Monitor Objective
Thursday, June 01, 2017 Page 67 of 74

62107Indoor Temperature 0130171 deg C1 Electronic Averaging
METN/ASPM Other
44201Ozone 0470071 ppm1 Ultraviolet Photometric
COMNBRSLAMS Max Ozone Concentration
44201Ozone 0470072 ppm1 Ultraviolet Photometric
COMNBRSLAMS -
Troost: PM10-FEM not submitting AQS data AQS Site Number
Latitude:
Longitude:
AQS CodePollutant
AQSPOC Keep
AQS MethodCode
AQSUnit-Code
39.10465
-94.57055
29-095-0034
AQCR: 094 Metropolitan Kansas City
Elevation (ft): 941
AQS Freq
MSA: 3760 Kansas City, MO-KS
724 Troost (Rear), Kansas City, MO 64106
State-Obj
AQSScale
AQS Method
AQS Unit
AQS Monitor Type
AQS Monitor Objective
64101Barometric Pressure 0140591 mm (Hg)1 Instrumental-Barometric Sensor
METN/ASPM Other
62107Indoor Temperature 0130171 deg C1 Electronic Averaging
METN/ASPM Other
42601Nitric Oxide 0740081 ppb1 Chemiluminescence
COMURBSPM Population Exposure
42602Nitrogen Dioxide 0740081 ppb1 Chemiluminescence
COMURBSLAMS Population Exposure
Thursday, June 01, 2017 Page 68 of 74
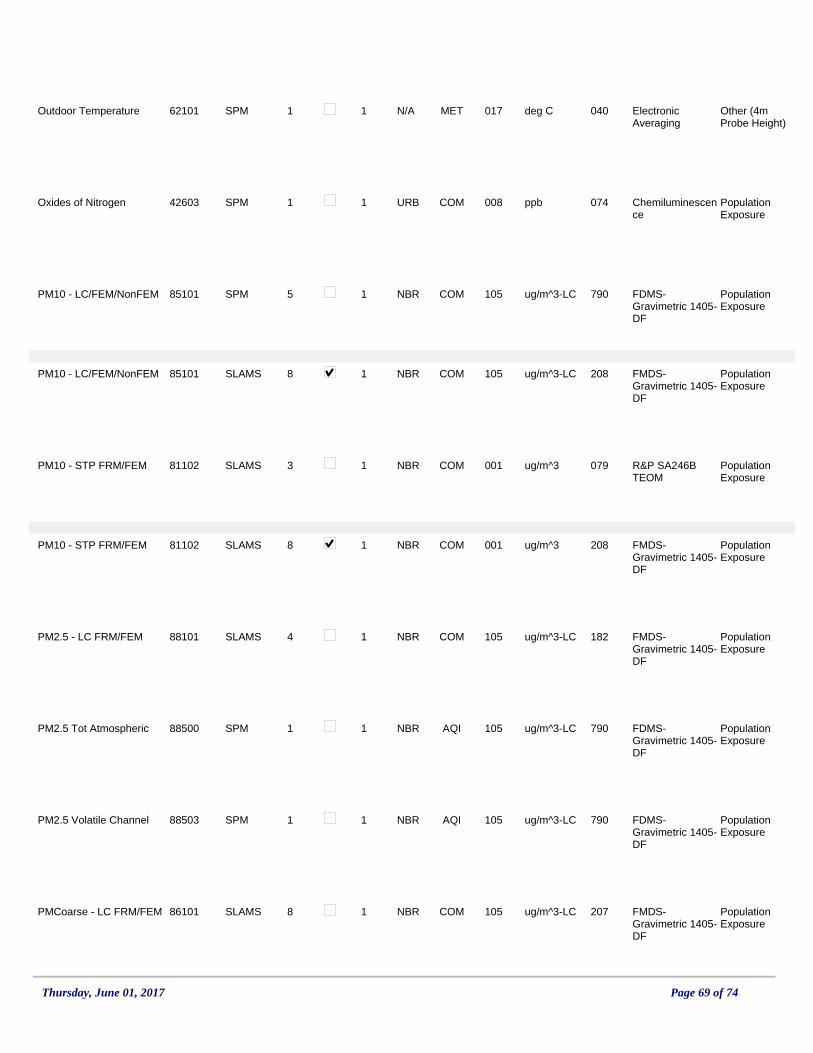
62101Outdoor Temperature 0400171 deg C1 Electronic Averaging
METN/ASPM Other (4m Probe Height)
42603Oxides of Nitrogen 0740081 ppb1 Chemiluminescence
COMURBSPM Population Exposure
85101PM10 - LC/FEM/NonFEM 7901055 ug/m^3-LC1 FDMS-Gravimetric 1405-DF
COMNBRSPM Population Exposure
85101PM10 - LC/FEM/NonFEM 2081058 ug/m^3-LC1 FMDS-Gravimetric 1405-DF
COMNBRSLAMS Population Exposure
81102PM10 - STP FRM/FEM 0790013 ug/m^31 R&P SA246B TEOM
COMNBRSLAMS Population Exposure
81102PM10 - STP FRM/FEM 2080018 ug/m^31 FMDS-Gravimetric 1405-DF
COMNBRSLAMS Population Exposure
88101PM2.5 - LC FRM/FEM 1821054 ug/m^3-LC1 FMDS-Gravimetric 1405-DF
COMNBRSLAMS Population Exposure
88500PM2.5 Tot Atmospheric 7901051 ug/m^3-LC1 FDMS-Gravimetric 1405-DF
AQINBRSPM Population Exposure
88503PM2.5 Volatile Channel 7901051 ug/m^3-LC1 FDMS-Gravimetric 1405-DF
AQINBRSPM Population Exposure
86101PMCoarse - LC FRM/FEM 2071058 ug/m^3-LC1 FMDS-Gravimetric 1405-DF
COMNBRSLAMS Population Exposure
Thursday, June 01, 2017 Page 69 of 74

62201Relative Humidity 0200191 %humidity1 Instrumental-Computed (Indirect)
METN/ASPM Other
42401Sulfur Dioxide 0600081 ppb1 Pulsed Fluorescent
COMMIDSLAMS Source Oriented
42406Sulfur Dioxide Max 5-min Avg
0600081 ppb1 Pulsed Fluorescent
COMMIDSLAMS Source Oriented
Ursuline North AQS Site Number
Latitude:
Longitude:
AQS CodePollutant
AQSPOC Keep
AQS MethodCode
AQSUnit-Code
38.243
-90.37372
29-099-0025
AQCR: 070 Metropolitan St. Louis
Elevation (ft): 578
AQS Freq
MSA: 7040 St. Louis, MO-IL
210 Glennon Heights Rd., Crystal City, MO 63019
State-Obj
AQSScale
AQS Method
AQS Unit
AQS Monitor Type
AQS Monitor Objective
14129Lead (TSP) - LC FRM/FEM 8131051 ug/m^3-LC1/6 Inductively Coupled Plasma Mass Spectroscopy
COMNBRSLAMS Source Oriented & Upwind Background
Watkins Mill State Park AQS Site Number
Latitude:
Longitude:
AQS CodePollutant
AQSPOC Keep
AQS MethodCode
AQSUnit-Code
39.407419
-94.265142
29-047-0003
AQCR: 094 Metropolitan Kansas City
Elevation (ft): 1009
AQS Freq
MSA: 3760 Kansas City, MO-KS
Watkins Mill Road, Lawson, MO 64062
State-Obj
AQSScale
AQS Method
AQS Unit
AQS Monitor Type
AQS Monitor Objective
62107Indoor Temperature 0130171 deg C1 Electronic Averaging
METN/ASPM Other
Thursday, June 01, 2017 Page 70 of 74

44201Ozone 0470071 ppm1 Ultraviolet Photometric
COMURBSLAMS Extreme Downwind
44201Ozone 0470072 ppm1 Ultraviolet Photometric
COMURBSLAMS -
West Alton AQS Site Number
Latitude:
Longitude:
AQS CodePollutant
AQSPOC Keep
AQS MethodCode
AQSUnit-Code
38.8725
-90.226389
29-183-1002
AQCR: 070 Metropolitan St. Louis
Elevation (ft): 425
AQS Freq
MSA: 7040 St. Louis, MO-IL
General Elecric Store, Highway 94, West Alton, MO 63386
State-Obj
AQSScale
AQS Method
AQS Unit
AQS Monitor Type
AQS Monitor Objective
62107Indoor Temperature 0130171 deg C1 Electronic Averaging
METN/ASPM Other
62101Outdoor Temperature 0400171 deg C1 Electronic Averaging
METN/ASPM Other
44201Ozone 0470071 ppm1 Ultraviolet Photometric
COMURBSLAMS Max Ozone Concentration& Population Exposure
44201Ozone 0470072 ppm1 Ultraviolet Photometric
COMURBSLAMS -
62201Relative Humidity 0200191 %humidity1 Instrumental-Computed (Indirect)
METN/ASPM Other
Thursday, June 01, 2017 Page 71 of 74
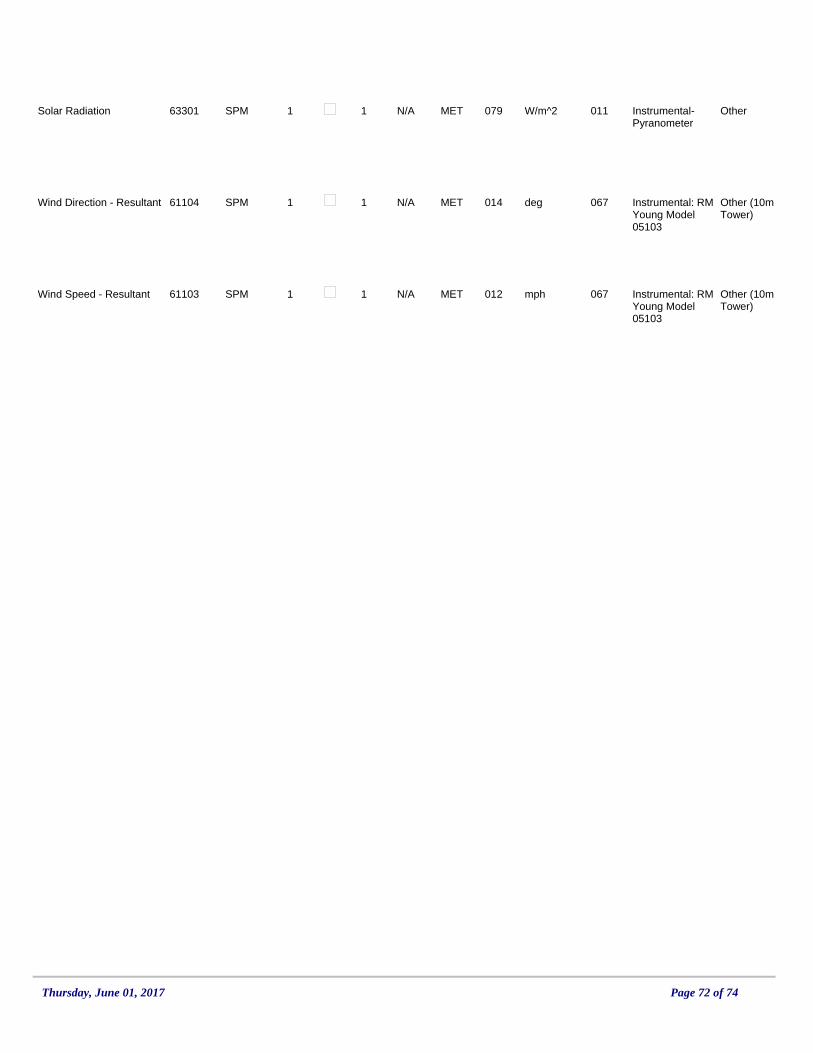
63301Solar Radiation 0110791 W/m^21 Instrumental-Pyranometer
METN/ASPM Other
61104Wind Direction - Resultant 0670141 deg1 Instrumental: RM Young Model 05103
METN/ASPM Other (10m Tower)
61103Wind Speed - Resultant 0670121 mph1 Instrumental: RM Young Model 05103
METN/ASPM Other (10m Tower)
Thursday, June 01, 2017 Page 72 of 74
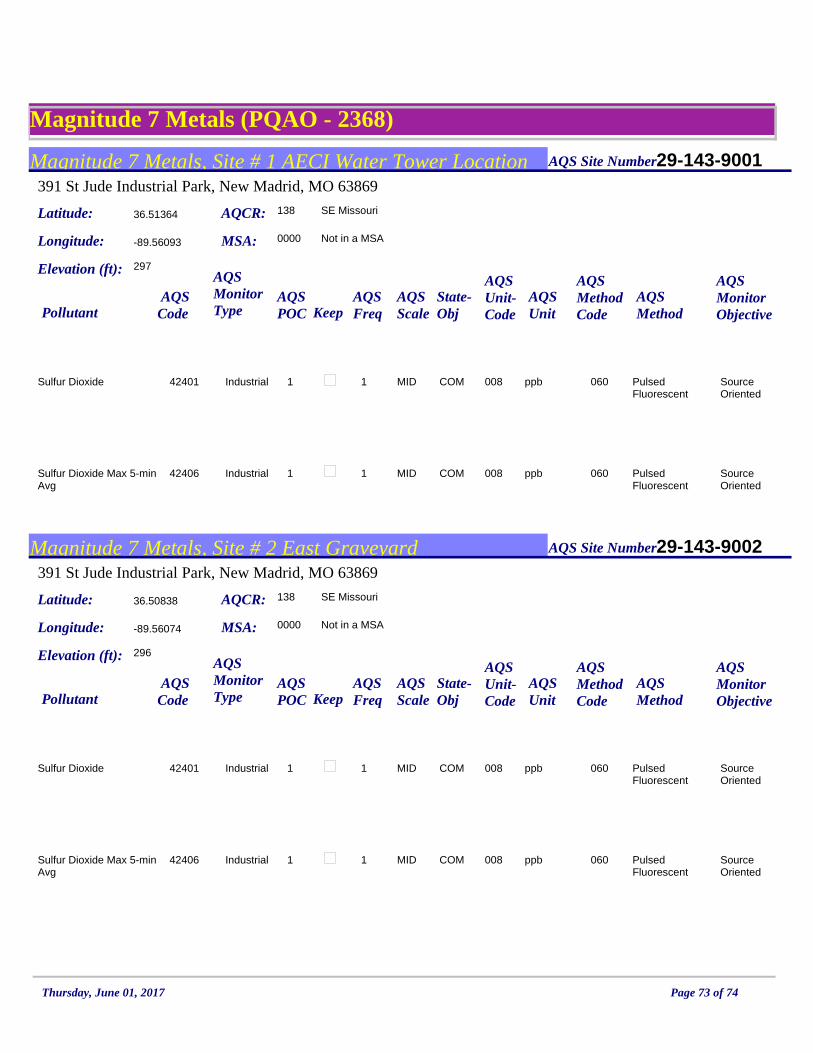
Magnitude 7 Metals (PQAO - 2368)
Magnitude 7 Metals, Site # 1 AECI Water Tower Location AQS Site Number
Latitude:
Longitude:
AQS CodePollutant
AQSPOC Keep
AQS MethodCode
AQSUnit-Code
36.51364
-89.56093
29-143-9001
AQCR: 138 SE Missouri
Elevation (ft): 297
AQS Freq
MSA: 0000 Not in a MSA
391 St Jude Industrial Park, New Madrid, MO 63869
State-Obj
AQSScale
AQS Method
AQS Unit
AQS Monitor Type
AQS Monitor Objective
42401Sulfur Dioxide 0600081 ppb1 Pulsed Fluorescent
COMMIDIndustrial Source Oriented
42406Sulfur Dioxide Max 5-min Avg
0600081 ppb1 Pulsed Fluorescent
COMMIDIndustrial Source Oriented
Magnitude 7 Metals, Site # 2 East Graveyard AQS Site Number
Latitude:
Longitude:
AQS CodePollutant
AQSPOC Keep
AQS MethodCode
AQSUnit-Code
36.50838
-89.56074
29-143-9002
AQCR: 138 SE Missouri
Elevation (ft): 296
AQS Freq
MSA: 0000 Not in a MSA
391 St Jude Industrial Park, New Madrid, MO 63869
State-Obj
AQSScale
AQS Method
AQS Unit
AQS Monitor Type
AQS Monitor Objective
42401Sulfur Dioxide 0600081 ppb1 Pulsed Fluorescent
COMMIDIndustrial Source Oriented
42406Sulfur Dioxide Max 5-min Avg
0600081 ppb1 Pulsed Fluorescent
COMMIDIndustrial Source Oriented
Thursday, June 01, 2017 Page 73 of 74

Magnitude 7 Metals, Site # 3 West Entrance AQS Site Number
Latitude:
Longitude:
AQS CodePollutant
AQSPOC Keep
AQS MethodCode
AQSUnit-Code
36.50899
-89.57099
29-143-9003
AQCR: 138 SE Missouri
Elevation (ft): 298
AQS Freq
MSA: 0000 Not in a MSA
391 St Jude Industrial Park, New Madrid, MO 63869
State-Obj
AQSScale
AQS Method
AQS Unit
AQS Monitor Type
AQS Monitor Objective
42401Sulfur Dioxide 0600081 ppb1 Pulsed Fluorescent
COMMIDIndustrial Source Oriented
42406Sulfur Dioxide Max 5-min Avg
0600081 ppb1 Pulsed Fluorescent
COMMIDIndustrial Source Oriented
Thursday, June 01, 2017 Page 74 of 74

APPENDIX 2: COMMENTS ON PROPOSED 2017 MONITORING NETWORK PLAN, RESPONSES TO COMMENTS, AND CORRECTIONS
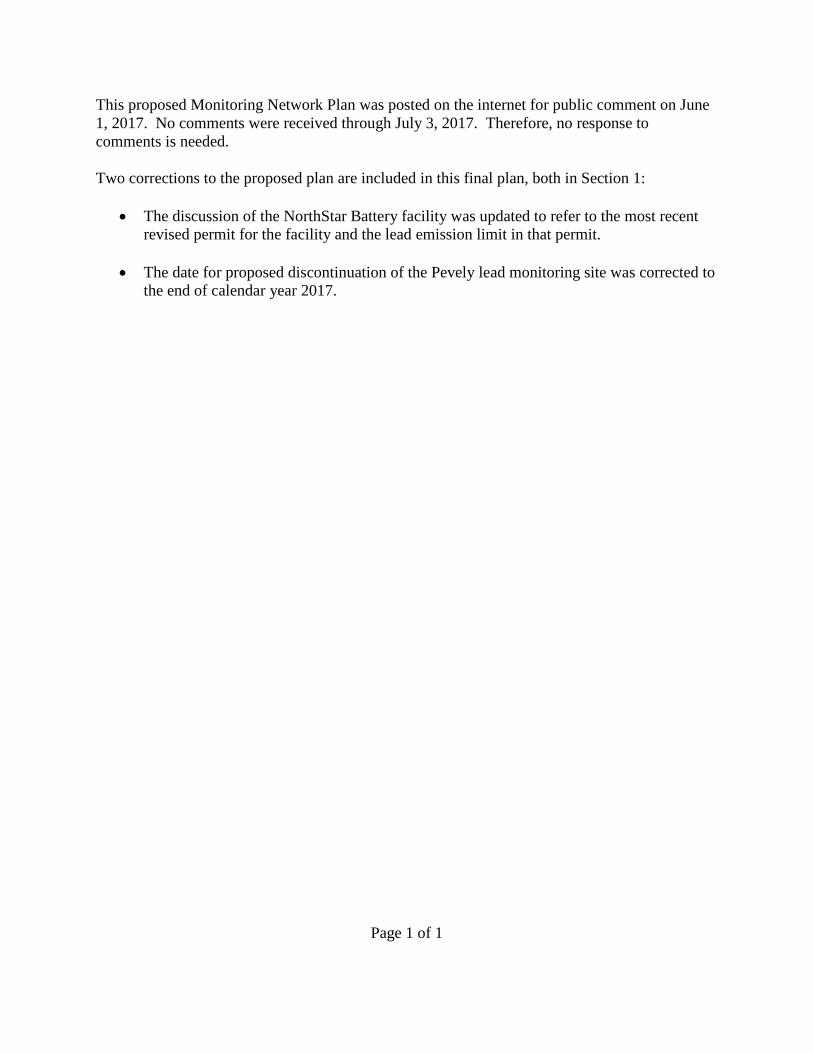
This proposed Monitoring Network Plan was posted on the internet for public comment on June 1, 2017. No comments were received through July 3, 2017. Therefore, no response to comments is needed. Two corrections to the proposed plan are included in this final plan, both in Section 1:
• The discussion of the NorthStar Battery facility was updated to refer to the most recent revised permit for the facility and the lead emission limit in that permit.
• The date for proposed discontinuation of the Pevely lead monitoring site was corrected to
the end of calendar year 2017.
Page 1 of 1