2017 - HBM Healthcare · Quarterly Report December 2017 A strong third quarter further extended HBM...
20
2017 Quarterly Report December
Transcript of 2017 - HBM Healthcare · Quarterly Report December 2017 A strong third quarter further extended HBM...
2017Quarterly Report
December
2
HB
M H
ealth
care
Inve
stm
ents
Ltd
/ Q
uart
erly
Rep
ort
Dec
embe
r 20
17
At a GlanceProfile and Portfolio
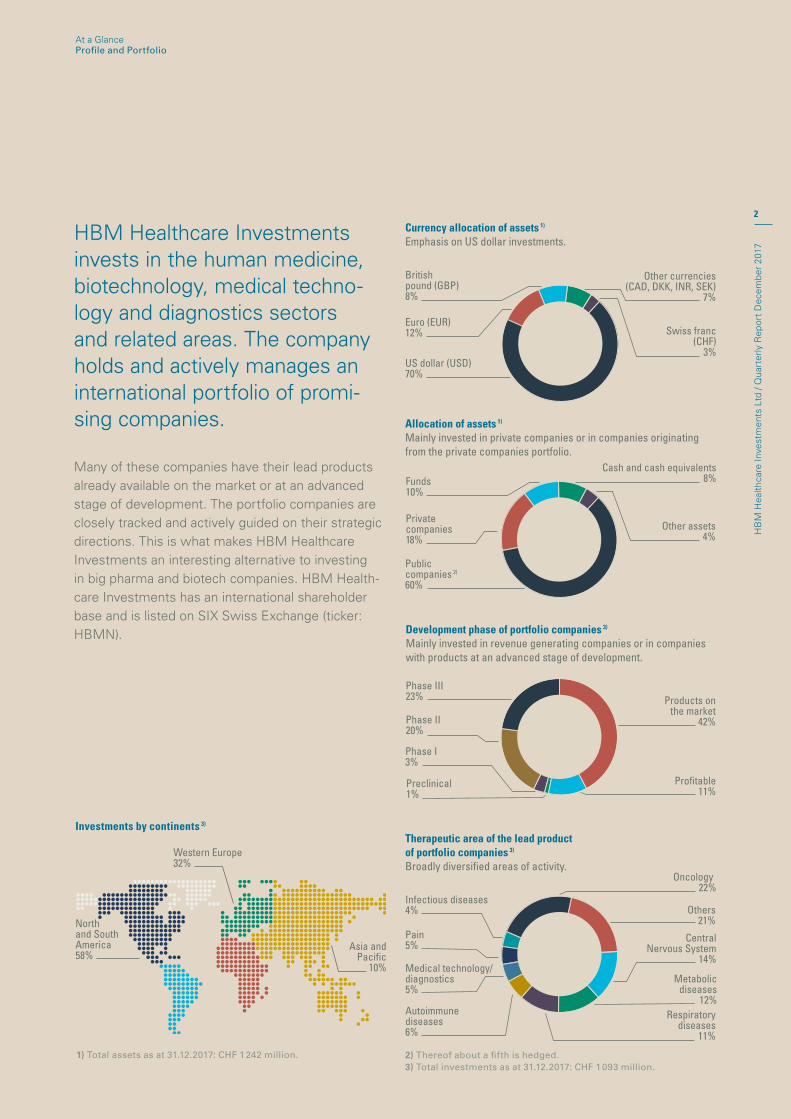
HBM Healthcare Investments invests in the human medicine, biotechnology, medical techno-logy and diagnostics sectors and related areas. The company holds and actively manages an international portfolio of promi-sing companies.
Many of these companies have their lead products already available on the market or at an advanced stage of development. The portfolio companies are closely tracked and actively guided on their strategic directions. This is what makes HBM Healthcare Investments an interesting alternative to investing in big pharma and biotech companies. HBM Health-care Investments has an international shareholder base and is listed on SIX Swiss Exchange (ticker: HBMN).
Currency allocation of assets 1)
Emphasis on US dollar investments.
Therapeutic area of the lead productof portfolio companies 3)
Broadly diversified areas of activity.
Investments by continents 3)
Western Europe32%
Asia and Pacific
10%
Allocation of assets 1)
Mainly invested in private companies or in companies originating from the private companies portfolio.
North and South America58%
1) Total assets as at 31.12.2017: CHF 1 242 million. 2) Thereof about a fifth is hedged.3) Total investments as at 31.12.2017: CHF 1 093 million.
Development phase of portfolio companies 3)
Mainly invested in revenue generating companies or in companies with products at an advanced stage of development.
PMS 634
100/0/9/40
7/6/11/0
100/90/45/54
PMS 518
70/100/55/25
62/29/52/12
62/29/52/12
PMS 1255
0/27/100/34
7/0/100/49
0/60/55/5
PMS 833
100/83/46/13
97/66/41/36
75/0/10/0
Swiss franc (CHF)
3%
Euro (EUR) 12%
British pound (GBP) 8%
US dollar (USD)70%
Other currencies (CAD, DKK, INR, SEK)
7%
PMS 634
100/0/9/40
7/6/11/0
100/90/45/54
PMS 518
70/100/55/25
62/29/52/12
62/29/52/12
PMS 1255
0/27/100/34
7/0/100/49
0/60/55/5
PMS 833
100/83/46/13
97/66/41/36
75/0/10/0
Funds10%
Private companies18%
Other assets 4%
Cash and cash equivalents 8%
Public companies 2)
60%
Products on the market
42%
Profitable 11%
Phase III23%
PM
S 6
3410
0/0/
9/40
7/6/
11/0
100/
90/4
5/54
PM
S 5
1870
/100
/55/
25
62/2
9/52
/12
62/2
9/52
/12
PM
S 1
255
0/27
/100
/34
7/0/
100/
49
0/60
/55/
5
PM
S 8
3310
0/83
/46/
13
97/6
6/41
/36
75/0
/10/
0
Phase I 3%
Preclinical 1%
Phase II20%
PMS
634
100/
0/9/
40
7/6/
11/0
100/
90/4
5/54
PMS
518
70/1
00/5
5/25
62/2
9/52
/12
62/2
9/52
/12
PMS
125
50/
27/1
00/3
4
7/0/
100/
49
0/60
/55/
5
PMS
833
100/
83/4
6/13
97/6
6/41
/36
75/0
/10/
0
Oncology22%
Medical technology/ diagnostics 5%
Infectious diseases4%
Pain5%
Autoimmune diseases 6%
Central Nervous System
14%
Respiratory diseases
11%
Others21%
Metabolic diseases
12%

3
HB
M H
ealth
care
Inve
stm
ents
Ltd
/ Q
uart
erly
Rep
ort
Dec
embe
r 20
17
Key Figures 31.12.2017 31.3.2017restated 31.3.2016
restated 31.3.2015 31.3.2014
Net assets CHF million 1 128.2 1 095.8 1 034.8 1 086.6 920.3 Investments in private companies and funds 352.7 274.3 299.5 273.4 218.8 Investments in public companies 740.6 813.6 677.0 748.1 630.5 Cash and cash equivalents 247.8 210.0 104.8 140.4 46.5
Net result for the period CHF million 85.6 136.8 23.8 257.5 353.5 Basic earnings per share CHF 12.21 18.96 3.11 32.47 40.98
Net asset value (NAV) per share CHF 162.07 155.09 139.41 140.12 108.76 Share price CHF 133.30 111.40 99.45 108.00 75.50 Discount % – 17.8 – 28.2 – 28.7 – 22.9 – 30.6
Distribution per share CHF 5.80 5.50 5.50 3.00Distribution yield % 5.2 5.1 5.1 4.0
Shares issued Registered shares (m) 7.0 7.3 7.7 8.0 8.9 Shares outstanding Registered shares (m) 7.0 7.1 7.4 7.8 8.5
Performance (including distributions)2017/2018
(9 months) 2016/2017 2015/2016 2014/2015 2013/2014
Net asset value (NAV) % 8.2 15.2 3.4 31.6 61.3Registered share HBMN % 24.9 17.5 – 2.8 47.0 50.0
At a GlanceKey Figures and Performance
Net asset value (NAV) and share price versus MSCI World Health Care Index in CHF, indexed (12.7.2001 = 100)
1.1.2013 31.12.2013 31.12.2014 31.12.2015 31.12.2016 31.12.2017
180
160
140
120
100
80
60
40
20
0
HBM Healthcare Investments NAV
HBM Healthcare Investments Aktie
MSCI World Health Care Index
4
HB
M H
ealth
care
Inve
stm
ents
Ltd
/ Q
uart
erly
Rep
ort
Dec
embe
r 20
17
A strong third quarter further extended HBM Healthcare Investments’ profit for the first nine months of the 2017/2018 financial year to a total of CHF 85.6 million. Net asset value (NAV) per share rose by 8.2 percent while the share price even surged by 24.9 percent during the same period. The acquisition of Advanced Accelerator Applications by Novartis demonstrated once again the sure-footedness of HBM Healthcare Investments’ selections. Beginning in 2014, we invested just under CHF 40 million in the then-private company. The CHF 200 million realised profit is HBM Healthcare Investments’ highest-ever return on a single investment.
Dear ShareholdersHBM Healthcare Investments closed the third quarter of the 2017/2018 financial year, as at 31 December 2017, with a profit of CHF 72.0 million. This takes profit for the first nine months of the financial year to a total of CHF 85.6 million. Net asset value (NAV) per share rose by 8.2 percent, and the share price by 24.9 percent, during the same period.
Significant portfolio developmentsThe stand-out event during the quarter under review was, without a doubt, Novartis’s takeover offer for Advanced Accelerator Applications, the largest holding in our portfolio (quarterly profit of CHF 36 million). HBM Healthcare Investments first took an interest in the then-private company in 2014, and went on to invest a total of just under CHF 40 million before its IPO. After the takeover offer had been announced, the holding was sold in full via the stock exch-ange at close to the takeover price. The CHF 200 million profit that this realised is HBM Health-care Investments’ highest-ever return on a single investment.
There were two other major contributors to the strong result for the quarter, however. Encoura-ging data from a clinical phase IIa trial of a drug to treat dermatitis multiplied the market value of AnaptysBio (quarterly profit of CHF 29 million). The company also originates from the portfolio of private companies.
Management Report1 April to 31 December 2017

5
HB
M H
ealth
care
Inve
stm
ents
Ltd
/ Q
uart
erly
Rep
ort
Dec
embe
r 20
17
Meanwhile, in December Dutch-based public company Argenx presented phase II results for a compound to treat an autoimmune disorder. This substantially increased the company’s valuation (quarterly profit of CHF 17 million).
In addition, private Canadian company Vitaeris reported that it had successfully agreed a strategic alliance with CSL, a public company from Australia. Under the terms of the partner-ship, CSL will fund clinical trials of Vitaeris’s clazakizumab antibody (anti-IL6 MAb) as a treat-ment to address kidney transplant rejection. CSL also received an option to acquire Vitaeris. As one of its founding shareholders, HBM Healthcare Investments took a USD 3 million stake in Vitaeris, and holds 20 percent of the company. In line with our prudent valuation policy, the deal will not be reflected immediately in reported NAV. However, there should be a significant increase in value if the clinical trials proceed successfully and CSL exercises its purchase option.
New investmentsHBM Healthcare Investments made its first investment, of USD 6.5 million, in private US company Aptinyx during the reporting period. Aptinyx has a platform for discovering promising molecules that can be used to treat disorders of the central nervous system. Its most advanced clinical development programme is conducting phase II trials of a compound to treat neuropa-thic pain.
The existing portfolio of private companies received follow-on financing totalling CHF 11.5 million. As part of this, contractually agreed investment tranches went to Amicus (EUR 4.0 million), Neurelis (USD 2.7 million) and Vascular Dynamics (USD 1.0 million). In addition, US-Danish portfolio company Y-mAbs raised its financing round by USD 30 million to a total of USD 80 million in response to strong demand. HBM Healthcare Investments used this opportunity to boost its existing investment by USD 3.2 million.
As part of the strategy to continue increasing investment exposure to Asia, HBM Healthcare Investments took on a new investment commitment of USD 25 million to the 6 Dimensions Capital investment fund, paying an initial tranche of USD 4.8 million during the quarter just ended. A variety of other holdings in the portfolio of public companies were also extended, and a number of new investments made.
Management Report1 April to 31 December 2017
6
HB
M H
ealth
care
Inve
stm
ents
Ltd
/ Q
uart
erly
Rep
ort
Dec
embe
r 20
17
Dr Andreas Wicki Erwin TroxlerCEO CFO
OutlookThe HBM Healthcare Investments portfolio remains in an excellent position in calendar 2018. We expect Vectura, our largest portfolio company, to report in the coming months on talks with the FDA, and further requirements for the approval of the generic version of Advair.
Pacira, our second-largest holding, will participate in February in an Advisory Committee meeting at the FDA to discuss extending approval for its Exparel® pain relief drug for the nerve block indication. The FDA’s decision on approval is set for the beginning of April.
Furthermore, over the next 12 months a series of companies representing significant portfolio holdings – AnaptysBio, Esperion, Nabriva and ObsEva – will be releasing clinical study data which, if positive, should produce the corresponding increase in the value of our investments.
We are also expecting further value-generating events over the coming year to 18 months, such as financing rounds, IPOs and acquisitions. In our experience, this will release the added value contained within the holdings in question.
We owe a debt of thanks to you, our shareholders, for the confidence that you have placed in us.
Management Report1 April to 31 December 2017

7
HB
M H
ealth
care
Inve
stm
ents
Ltd
/ Q
uart
erly
Rep
ort
Dec
embe
r 20
17
Group Financial Statements IFRSBalance Sheet
Balance sheet (CHF 000) Notes 31.12.2017 31.3.2017
AssetsCurrent assetsCash and cash equivalents 7 700 6 115 Receivables 35 51 Total current assets 7 735 6 166
Non-current assetsInvestment in subsidiary (3) 1 281 595 1 192 834 Total non-current assets 1 281 595 1 192 834
Total assets 1 289 330 1 199 000
LiabilitiesCurrent liabilitiesLiability to subsidiary 60 000 0Liability from performance fee 0 1 413 Other liabilities 1 886 2 754 Total current liabilities 61 886 4 167
Non-current liabilitiesFinancial liabilities (4) 99 195 99 072 Total non-current liabilities 99 195 99 072
Shareholders’ equityShare capital (5.1) 411 840 427 050 Treasury shares (5.2) – 9 468 – 23 563 Capital reserve (5.1) 185 318 237 362 Retained earnings 540 559 454 912 Total shareholders’ equity 1 128 249 1 095 761
Total liabilities and shareholders’ equity 1 289 330 1 199 000
Number of outstanding shares (in 000) 6 961 7 066 Net asset value (NAV) per share (CHF) 162.07 155.09

8
HB
M H
ealth
care
Inve
stm
ents
Ltd
/ Q
uart
erly
Rep
ort
Dec
embe
r 20
17
Group Financial Statements IFRSComprehensive Income
Statement of comprehensive income for the period 1 April to 31 December (CHF 000) Notes
Quarter ended
31.12.2017
restated Quarter
ended31.12.2016
9-month period ended
31.12.2017
restated 9-month
period ended 31.12.2016
Net change in value of investment in subsidiary (3) 73 153 – 43 702 88 761 – 16 862
Result from investment activities 73 153 – 43 702 88 761 – 16 862
Personnel expenses – 238 – 212 – 641 – 623Other operating expenses – 248 – 142 – 640 – 523
Result before interest and taxes 72 667 – 44 056 87 480 – 18 008
Financial expenses (4) – 620 – 607 – 1 834 – 1824Financial income 1 0 1 0Income taxes 0 0 0 0
Net result for the period 72 048 – 44 663 85 647 – 19 832
Comprehensive result 72 048 – 44 663 85 647 – 19 832
Number of outstanding shares, time-weighted (in 000) 6 981 7 168 7 014 7 480 Basic earnings per share (CHF) 10.32 – 6.23 12.21 – 2.65
As the Company does not have options or similar instruments outstanding, diluted earnings per share are identical to basic earnings per share.

9
HB
M H
ealth
care
Inve
stm
ents
Ltd
/ Q
uart
erly
Rep
ort
Dec
embe
r 20
17
Group Financial Statements IFRSStatement of Cash FlowsChanges in Equity
Statement of cash flows for the period 1 April to 31 December (CHF 000)
9-month period ended
31.12.2017
restated 9-month
period ended31.12.2016
Other expenses paid (personnel and other operating expenses) – 2 876 – 1 497
Net cash flow from operating activities – 2 876 – 1 497
Interest payments paid – 2 273 – 2 264 Loan from subsidiary 60 000 70 000 Cash distribution from capital reserve – 40 783 – 40 040 Purchase of treasury shares – 12 484 – 30 170
Net cash flow from financing activities 4 460 – 2 474
Currency translation differences 1 0
Net change in cash and cash equivalents 1 585 – 3 971
Cash and cash equivalents at beginning of period 6 115 6 606 Cash and cash equivalents at end of period 7 700 2 635
Statement of changes in equity (CHF 000) Share capitalTreasury
sharesCapital
reserveRetained earnings
Total shareholders'
equity
Balance 31 March 2016 (restated) 450 450 – 27 298 293 535 318 140 1 034 827
Comprehensive result – 19 832 – 19 832Purchase of treasury shares – 29 484 – 29 484 Distribution from capital reserve (30.6.2016) – 40 040 – 40 040 Capital reduction (2.9.2016) – 23 400 39 533 – 16 133 0
Balance 31 December 2016 (restated) 427 050 – 17 249 237 362 298 308 945 471
Comprehensive result 156 604 156 604 Purchase of treasury shares – 6 314 – 6 314
Balance 31 March 2017 427 050 – 23 563 237 362 454 912 1 095 761
Comprehensive result 85 647 85 647 Purchase of treasury shares – 12 376 – 12 376 Distribution from capital reserve (30.6.2017) – 40 783 – 40 783 Capital reduction (14.9.2017) – 15 210 26 471 – 11 261 0
Balance 31 December 2017 411 840 – 9 468 185 318 540 559 1 128 249
10
HB
M H
ealth
care
Inve
stm
ents
Ltd
/ Q
uart
erly
Rep
ort
Dec
embe
r 20
17
Group Financial Statements IFRSNotes
General Statements
1. Information about the Company and its businessHBM Healthcare Investments Ltd (HBM Healthcare or Company) is a SIX Swiss Exchange-listed holding company domiciled at Bundesplatz 1, Zug (Switzer-land). The purpose of the Company is the acquisition, holding and sale of positions in other companies as well as the management and financing of such positi-ons in the human medicine, biotechnology, medical technology and diagnostics sectors, and related areas.
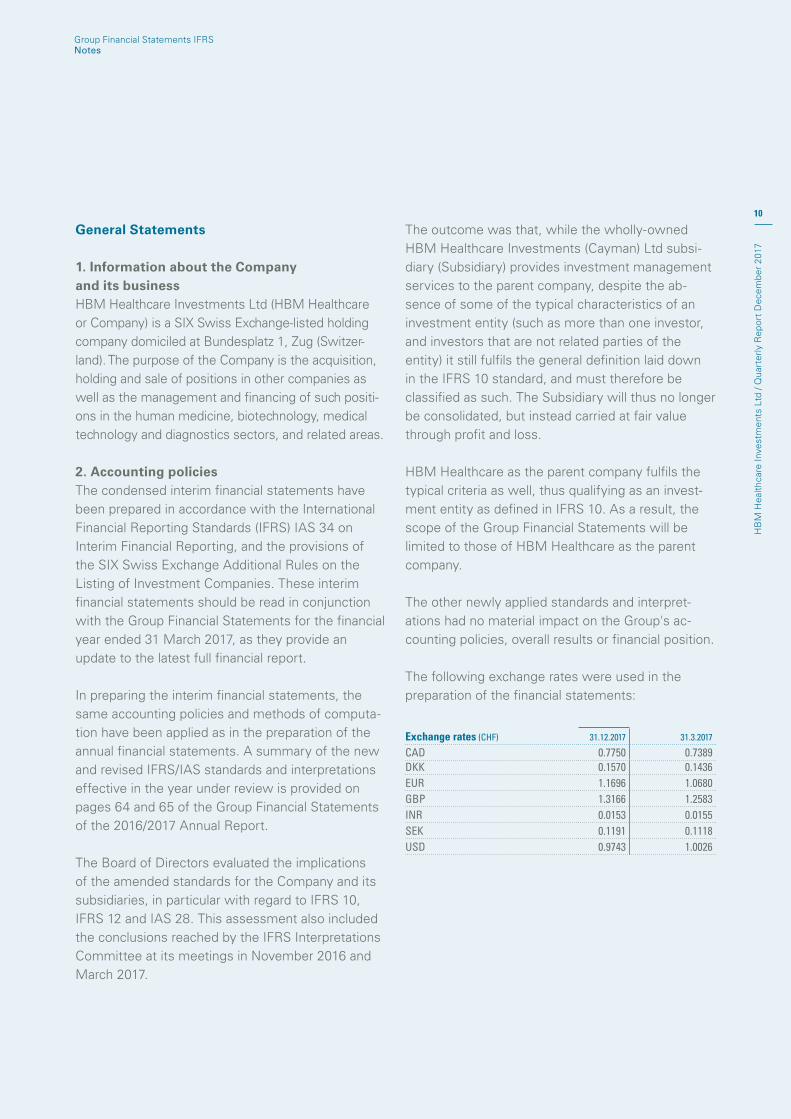
2. Accounting policiesThe condensed interim financial statements have been prepared in accordance with the Inter national Financial Reporting Standards (IFRS) IAS 34 on Interim Financial Reporting, and the provisions of the SIX Swiss Exchange Additional Rules on the Listing of Investment Companies. These interim financial statements should be read in conjunction with the Group Financial Statements for the financial year ended 31 March 2017, as they provide an update to the latest full financial report.
In preparing the interim financial statements, the same accounting policies and methods of computa-tion have been applied as in the preparation of the annual financial statements. A summary of the new and revised IFRS/IAS standards and interpretations effective in the year under review is provided on pages 64 and 65 of the Group Financial Statements of the 2016/2017 Annual Report.
The Board of Directors evaluated the implications of the amended standards for the Company and its subsidiaries, in particular with regard to IFRS 10, IFRS 12 and IAS 28. This assessment also included the conclusions reached by the IFRS Interpretations Committee at its meetings in November 2016 and March 2017.
The outcome was that, while the wholly-owned HBM Healthcare Investments (Cayman) Ltd subsi-diary (Subsidiary) provides investment management services to the parent company, despite the ab-sence of some of the typical characteristics of an investment entity (such as more than one investor, and investors that are not related parties of the entity) it still fulfils the general definition laid down in the IFRS 10 standard, and must therefore be classified as such. The Subsidiary will thus no longer be consolidated, but instead carried at fair value through profit and loss.
HBM Healthcare as the parent company fulfils the typical criteria as well, thus qualifying as an invest-ment entity as defined in IFRS 10. As a result, the scope of the Group Financial Statements will be limited to those of HBM Healthcare as the parent company.
The other newly applied standards and interpret-ations had no material impact on the Group's ac-counting policies, overall results or financial position.
The following exchange rates were used in the preparation of the financial statements:
Exchange rates (CHF) 31.12.2017 31.3.2017
CAD 0.7750 0.7389 DKK 0.1570 0.1436 EUR 1.1696 1.0680 GBP 1.3166 1.2583 INR 0.0153 0.0155 SEK 0.1191 0.1118 USD 0.9743 1.0026

11
HB
M H
ealth
care
Inve
stm
ents
Ltd
/ Q
uart
erly
Rep
ort
Dec
embe
r 20
17
Notes to the Balance Sheet and Statement of Income
3. Investment in SubsidiaryThe fair value of the investment in the subsidiary HBM Healthcare Investments (Cayman) Ltd developed as follows in the period under review:
Net assets of the investment in the Subsidiary comprised the following as at the balance sheet date:
Group Financial Statements IFRSNotes
Development fair value investment (CHF 000)
9-month period ended
31.12.2017
9-month period ended
31.12.2016
Fair value at the beginning of period 1 192 834 1 130 421 Change in value, gross 88 761 – 16 862
Fair value at the end of period 1 281 595 1 113 559
Composition net assets (CHF 000) 31.12.2017 31.3.2017 31.12.2016
Cash and cash equivalents 240 080 203 890 73 156 Receivables 235 363 676 Loan to parent company 60 000 0 70 000 Investments
Private companies 229 093 122 491 150 360 Funds 123 586 151 762 145 640 Public companies 740 613 813 569 628 765
Shares of parent company 10 201 8 879 14 830 Financial instruments 1 995 9 001 4 669 Other financial assets 31 098 39 002 26 104
Total assets 1 436 901 1 348 957 1 114 200 Financial instruments – 142 874 – 132 991 – 249 Liability from performance fee – 11 615 – 22 135 0 Other current liabilities – 817 – 997 – 392
Total net assets at fair value 1 281 595 1 192 834 1 113 559

12
HB
M H
ealth
care
Inve
stm
ents
Ltd
/ Q
uart
erly
Rep
ort
Dec
embe
r 20
17
Group Financial Statements IFRSNotes
During the reporting period, the net assets of the investment in the Subsidiary have developed as follows:
3.1 InvestmentsDuring the reporting period, the investments held by the Subsidiary comprised the following and they performed as follows:
Development of investments (CHF 000) Private
companies FundsPublic
companiesTotal
investments
Fair value 31 March 2017 122 491 151 762 813 569 1 087 822
Purchases 116 102 13 790 311 184 441 076 Sales – 21 969 – 50 864 – 504 632 – 577 465
Realised gains 10 002 33 057 289 829 332 888 Realised losses – 17 042 – 439 – 15 496 – 32 977 Changes in unrealised gains / losses 19 509 – 23 720 – 153 841 – 158 052
Net result on investments 12 469 8 898 120 492 141 859
Fair value 31 December 2017 229 093 123 586 740 613 1 093 292
Details on investments can be found on pages 13 and 14.
Change in net assets at fair value (CHF 000)
9-month period ended
31.12.2017
9-month period ended
31.12.2016
Net result on investments 141 859 – 22 761 Dividend income 108 108 Net result from financial instruments – 30 033 4 716 Net result from other financial assets – 1 449 11 007 Net result from shares of parent company 1 317 604
Result from investing activities 111 802 – 6 326
Management fee – 10 374 – 9 580 Performance fee – 11 615 0 Personnel and other operating expenses – 1 064 – 841 Financial result 12 – 115
Change in value, gross 88 761 – 16 862
Net change in value of investment 88 761 – 16 862
For details of individual items of net assets (balance and change) please refer to the following explanations.
13
HB
M H
ealth
care
Inve
stm
ents
Ltd
/ Q
uart
erly
Rep
ort
Dec
embe
r 20
17
Group Financial Statements IFRSNotes
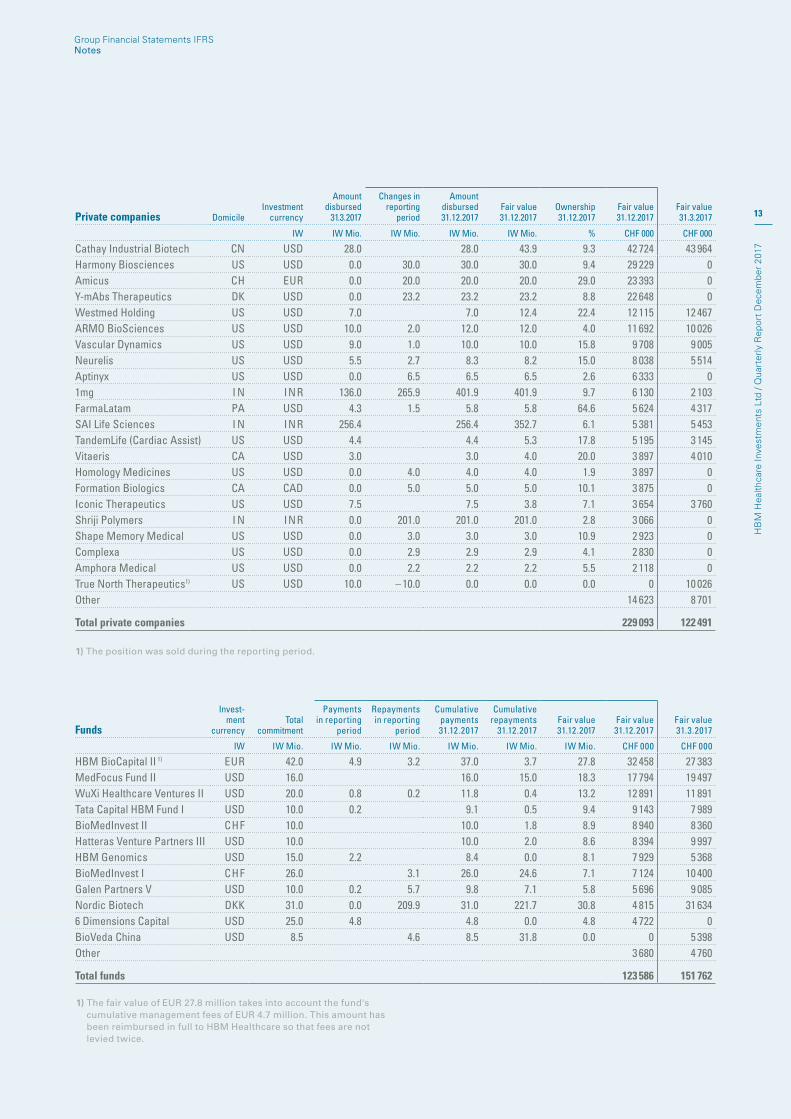
1) The position was sold during the reporting period.
Private companies DomicileInvestment
currency
Amount disbursed
31.3.2017
Changes in reporting
period
Amount disbursed 31.12.2017
Fair value31.12.2017
Ownership 31.12.2017
Fair value31.12.2017
Fair value31.3.2017
IW IW Mio. IW Mio. IW Mio. IW Mio. % CHF 000 CHF 000
Cathay Industrial Biotech CN USD 28.0 28.0 43.9 9.3 42 724 43 964 Harmony Biosciences US USD 0.0 30.0 30.0 30.0 9.4 29 229 0 Amicus CH EUR 0.0 20.0 20.0 20.0 29.0 23 393 0 Y-mAbs Therapeutics DK USD 0.0 23.2 23.2 23.2 8.8 22 648 0 Westmed Holding US USD 7.0 7.0 12.4 22.4 12 115 12 467 ARMO BioSciences US USD 10.0 2.0 12.0 12.0 4.0 11 692 10 026 Vascular Dynamics US USD 9.0 1.0 10.0 10.0 15.8 9 708 9 005 Neurelis US USD 5.5 2.7 8.3 8.2 15.0 8 038 5 514 Aptinyx US USD 0.0 6.5 6.5 6.5 2.6 6 333 0 1mg I N INR 136.0 265.9 401.9 401.9 9.7 6 130 2 103 FarmaLatam PA USD 4.3 1.5 5.8 5.8 64.6 5 624 4 317 SAI Life Sciences I N INR 256.4 256.4 352.7 6.1 5 381 5 453 TandemLife (Cardiac Assist) US USD 4.4 4.4 5.3 17.8 5 195 3 145 Vitaeris CA USD 3.0 3.0 4.0 20.0 3 897 4 010 Homology Medicines US USD 0.0 4.0 4.0 4.0 1.9 3 897 0 Formation Biologics CA CAD 0.0 5.0 5.0 5.0 10.1 3 875 0 Iconic Therapeutics US USD 7.5 7.5 3.8 7.1 3 654 3 760 Shriji Polymers I N INR 0.0 201.0 201.0 201.0 2.8 3 066 0 Shape Memory Medical US USD 0.0 3.0 3.0 3.0 10.9 2 923 0 Complexa US USD 0.0 2.9 2.9 2.9 4.1 2 830 0 Amphora Medical US USD 0.0 2.2 2.2 2.2 5.5 2 118 0 True North Therapeutics1) US USD 10.0 – 10.0 0.0 0.0 0.0 0 10 026 Other 14 623 8 701
Total private companies 229 093 122 491
Funds
Invest-ment
currencyTotal
commitment
Payments in reporting
period
Repayments in reporting
period
Cumulative payments
31.12.2017
Cumulative repayments
31.12.2017Fair value31.12.2017
Fair value31.12.2017
Fair value31.3.2017
IW IW Mio. IW Mio. IW Mio. IW Mio. IW Mio. IW Mio. CHF 000 CHF 000
HBM BioCapital II 1) EUR 42.0 4.9 3.2 37.0 3.7 27.8 32 458 27 383 MedFocus Fund II USD 16.0 16.0 15.0 18.3 17 794 19 497 WuXi Healthcare Ventures II USD 20.0 0.8 0.2 11.8 0.4 13.2 12 891 11 891 Tata Capital HBM Fund I USD 10.0 0.2 9.1 0.5 9.4 9 143 7 989 BioMedInvest II CHF 10.0 10.0 1.8 8.9 8 940 8 360 Hatteras Venture Partners III USD 10.0 10.0 2.0 8.6 8 394 9 997 HBM Genomics USD 15.0 2.2 8.4 0.0 8.1 7 929 5 368 BioMedInvest I CHF 26.0 3.1 26.0 24.6 7.1 7 124 10 400 Galen Partners V USD 10.0 0.2 5.7 9.8 7.1 5.8 5 696 9 085 Nordic Biotech DKK 31.0 0.0 209.9 31.0 221.7 30.8 4 815 31 634 6 Dimensions Capital USD 25.0 4.8 4.8 0.0 4.8 4 722 0 BioVeda China USD 8.5 4.6 8.5 31.8 0.0 0 5 398 Other 3 680 4 760
Total funds 123 586 151 762
1) The fair value of EUR 27.8 million takes into account the fund's cumulative management fees of EUR 4.7 million. This amount has been reimbursed in full to HBM Healthcare so that fees are not levied twice.

14
HB
M H
ealth
care
Inve
stm
ents
Ltd
/ Q
uart
erly
Rep
ort
Dec
embe
r 20
17
Group Financial Statements IFRSNotes
P) The position originates from the private companies portfolio.1) The company was acquired during the reporting period. HBM
Healthcare sold all of its shares.
Public companiesInvestment
currencyBalance
31.3.2017Changes 9 months
Changes3 months
Balance31.12.2017
Ownership 31.12.2017
Fair value31.12.2017
Fair value31.3.2017
ICNumber
of sharesNumber
of sharesNumber
of sharesNumber
of shares % CHF 000 CHF 000
Vectura Group GBP 67 991 719 – 855 368 870 892 67 136 351 9.9 104 035 130 637 Pacira Pharmaceuticals P) USD 1 100 000 0 0 1 100 000 2.7 48 924 50 290 Esperion Therapeutics USD 634 407 – 53 659 748 580 748 2.2 37 254 22 459 Neurocrine Biosciences USD 529 500 – 116 500 0 413 000 0.5 31 221 22 987 Argenx EUR 255 000 – 5 000 0 250 000 0.8 15 357 4 507 Argenx (ADS) USD 0 212 222 87 222 212 222 0.7 13 055 0 Genmab DKK 182 800 – 22 800 0 160 000 0.3 25 844 35 248 Acadia Pharmaceuticals USD 144 990 730 010 725 000 875 000 0.7 25 669 4 998 Galapagos EUR 156 000 94 000 50 000 250 000 0.5 23 095 13 591 Celgene USD 11 000 216 000 227 000 227 000 0.0 23 081 1 372 Incyte USD 205 000 45 000 250 000 250 000 0.1 23 069 27 474 Ultragenyx Pharmaceutical USD 384 257 115 743 14 272 500 000 1.2 22 594 26 113 AnaptysBio P) USD 942 835 –713 408 – 420 573 229 427 0.4 22 514 26 232 ObsEva P) USD 2 319 780 0 0 2 319 780 6.3 22 059 24 212 Immunomedics USD 0 1 400 000 475 786 1 400 000 0.6 22 043 0 Nicox EUR 1 184 941 528 372 153 313 1 713 313 5.8 20 320 12 418 Tesaro USD 152 750 97 250 50 000 250 000 0.5 20 185 23 565 Eagle Pharmaceuticals USD 198 279 182 352 0 380 631 2.6 19 811 16 488 Ascendis Pharma USD 235 000 165 000 100 000 400 000 1.1 15 612 6 597 Paratek Pharmaceuticals P) USD 1 200 000 – 305 000 70 000 895 000 3.2 15 609 23 160 Clovis USD 0 230 105 40 105 230 105 0.5 15 245 0 Zogenix USD 0 365 814 365 814 365 814 1.1 14 274 0 Nabriva Therapeutics P) USD 2 968 980 – 634 973 0 2 334 007 6.4 13 599 35 720 Avexis USD 62 000 33 000 – 40 000 95 000 0.3 10 243 4 726 Divis Laboratories INR 608 000 0 0 608 000 0.2 10 186 5 864 Puma Biotechnology USD 0 100 000 50 000 100 000 0.3 9 631 0 Erytech Pharma EUR 200 000 240 000 100 000 440 000 2.5 9 521 6 002 Retrophin USD 0 433 952 433 952 433 952 1.1 8 908 0 Bioarctic SWE 0 2 653 773 2 653 773 2 653 773 3.6 8 215 0 Eiger BioPharmaceuticals P) USD 603 819 –23 819 0 580 000 5.5 7 883 6 932 Regenxbio USD 546 000 –304 305 241 695 241 695 0.8 7 830 10 565 Intercept Pharmaceuticals USD 76 250 48 813 0 125 063 0.5 7 118 8 646 Acclerate Diagnostics USD 0 250 000 125 000 250 000 0.5 6 382 0 Claris Lifesciences INR 1 076 025 66 038 49 705 1 142 063 2.1 6 207 5 332 Probiodrug P) EUR 497 910 –54 035 – 5 169 443 875 5.4 5 503 8 391 Apellis Pharmaceuticals USD 0 250 000 250 000 250 000 0.5 5 286 0 Coherus Biosciences USD 582 442 – 5 000 0 577 442 1.0 4 951 12 351 Amicus Therapeutics USD 1 186 604 – 841 820 344 784 344 784 0.2 4 834 8 482 Alimera Sciences USD 3 250 000 250 000 0 3 500 000 5.1 4 535 4 562 Laurus Labs INR 501 698 0 0 501 698 0.5 4 155 4 004 Cellectis USD 0 143 390 143 390 143 390 0.4 4 072 0 Antares Pharma USD 3 740 732 –1 989 222 0 1 751 510 1.1 3 396 10 651 Corium International USD 118 404 215 919 21 266 334 323 0.9 3 130 496 Advanced Accelerator Applications 1) P) USD 3 300 000 – 3 300 000 –2 400 000 0 0.0 0 131 880 Other 14 158 76 617
Total public companies 740 613 813 569
Total investments 1 093 292 1 087 822
15
HB
M H
ealth
care
Inve
stm
ents
Ltd
/ Q
uart
erly
Rep
ort
Dec
embe
r 20
17
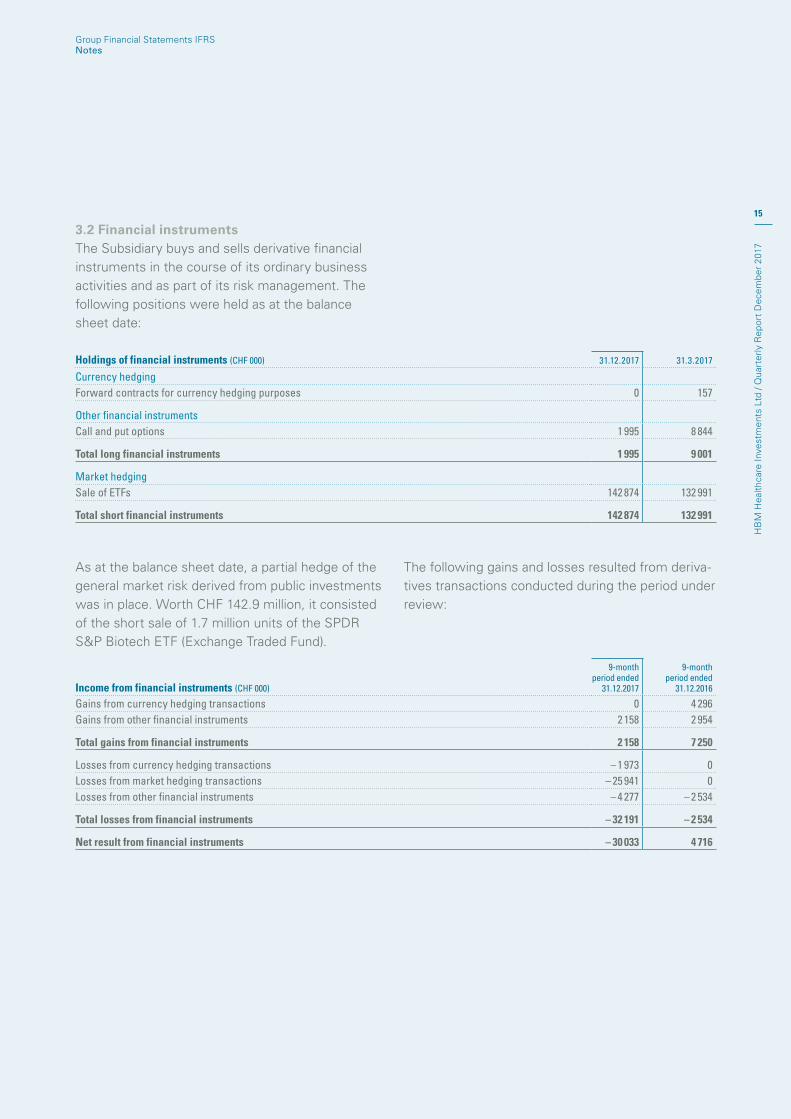
3.2 Financial instrumentsThe Subsidiary buys and sells derivative financial instruments in the course of its ordinary business activities and as part of its risk management. The following positions were held as at the balance sheet date:
Holdings of financial instruments (CHF 000) 31.12.2017 31.3.2017
Currency hedgingForward contracts for currency hedging purposes 0 157
Other financial instrumentsCall and put options 1 995 8 844
Total long financial instruments 1 995 9 001
Market hedgingSale of ETFs 142 874 132 991
Total short financial instruments 142 874 132 991
Group Financial Statements IFRSNotes
Income from financial instruments (CHF 000)
9-month period ended
31.12.2017
9-month period ended
31.12.2016
Gains from currency hedging transactions 0 4 296 Gains from other financial instruments 2 158 2 954
Total gains from financial instruments 2 158 7 250
Losses from currency hedging transactions – 1 973 0Losses from market hedging transactions – 25 941 0Losses from other financial instruments – 4 277 – 2 534
Total losses from financial instruments – 32 191 – 2 534
Net result from financial instruments – 30 033 4 716
As at the balance sheet date, a partial hedge of the general market risk derived from public investments was in place. Worth CHF 142.9 million, it consisted of the short sale of 1.7 million units of the SPDR S&P Biotech ETF (Exchange Traded Fund).
The following gains and losses resulted from deriva-tives transactions conducted during the period under review:
16
HB
M H
ealth
care
Inve
stm
ents
Ltd
/ Q
uart
erly
Rep
ort
Dec
embe
r 20
17
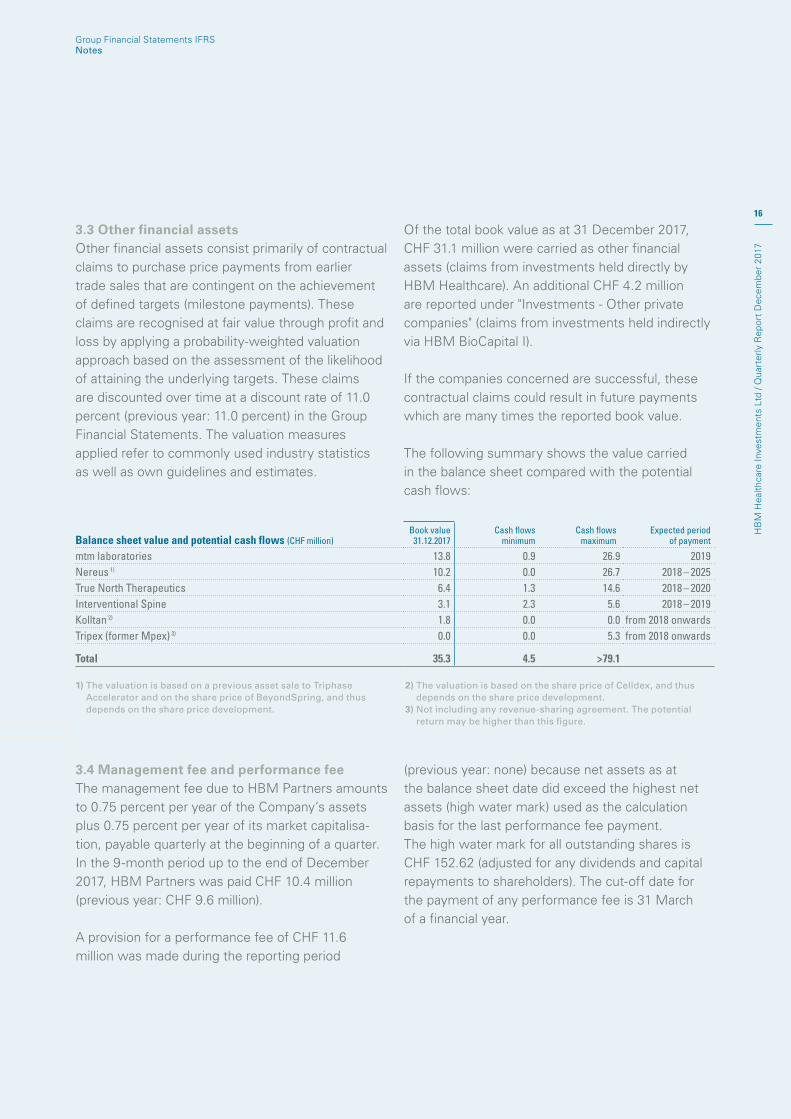
3.3 Other financial assetsOther financial assets consist primarily of contractual claims to purchase price payments from earlier trade sales that are contingent on the achievement of defined targets (milestone payments). These claims are recognised at fair value through profit and loss by applying a probability-weighted valuation approach based on the assessment of the likelihood of attaining the underlying targets. These claims are discounted over time at a discount rate of 11.0 percent (previous year: 11.0 percent) in the Group Financial Statements. The valuation measures applied refer to commonly used industry statistics as well as own guidelines and estimates.
Of the total book value as at 31 December 2017, CHF 31.1 million were carried as other financial assets (claims from investments held directly by HBM Healthcare). An additional CHF 4.2 million are reported under "Investments - Other private companies" (claims from investments held indirectly via HBM BioCapital I).
If the companies concerned are successful, these contractual claims could result in future payments which are many times the reported book value.
The following summary shows the value carried in the balance sheet compared with the potential cash flows:
Balance sheet value and potential cash flows (CHF million) Book value
31.12.2017Cash flows
minimumCash flows
maximumExpected period
of payment
mtm laboratories 13.8 0.9 26.9 2019Nereus 1) 10.2 0.0 26.7 2018 – 2025True North Therapeutics 6.4 1.3 14.6 2018 – 2020Interventional Spine 3.1 2.3 5.6 2018 – 2019Kolltan 2) 1.8 0.0 0.0 from 2018 onwardsTripex (former Mpex) 3) 0.0 0.0 5.3 from 2018 onwards
Total 35.3 4.5 >79.1
1) The valuation is based on a previous asset sale to Triphase Accelerator and on the share price of BeyondSpring, and thus depends on the share price development.
2) The valuation is based on the share price of Celldex, and thus depends on the share price development.
3) Not including any revenue-sharing agreement. The potential return may be higher than this figure.
Group Financial Statements IFRSNotes
3.4 Management fee and performance feeThe management fee due to HBM Partners amounts to 0.75 percent per year of the Company’s assets plus 0.75 percent per year of its market capitalisa-tion, payable quarterly at the beginning of a quarter. In the 9-month period up to the end of December 2017, HBM Partners was paid CHF 10.4 million (previous year: CHF 9.6 million).
A provision for a performance fee of CHF 11.6 million was made during the reporting period
(previous year: none) because net assets as at the balance sheet date did exceed the highest net assets (high water mark) used as the calculation basis for the last performance fee payment. The high water mark for all outstanding shares is CHF 152.62 (adjusted for any dividends and capital repayments to shareholders). The cut-off date for the payment of any performance fee is 31 March of a financial year.
17
HB
M H
ealth
care
Inve
stm
ents
Ltd
/ Q
uart
erly
Rep
ort
Dec
embe
r 20
17
Group Financial Statements IFRSNotes
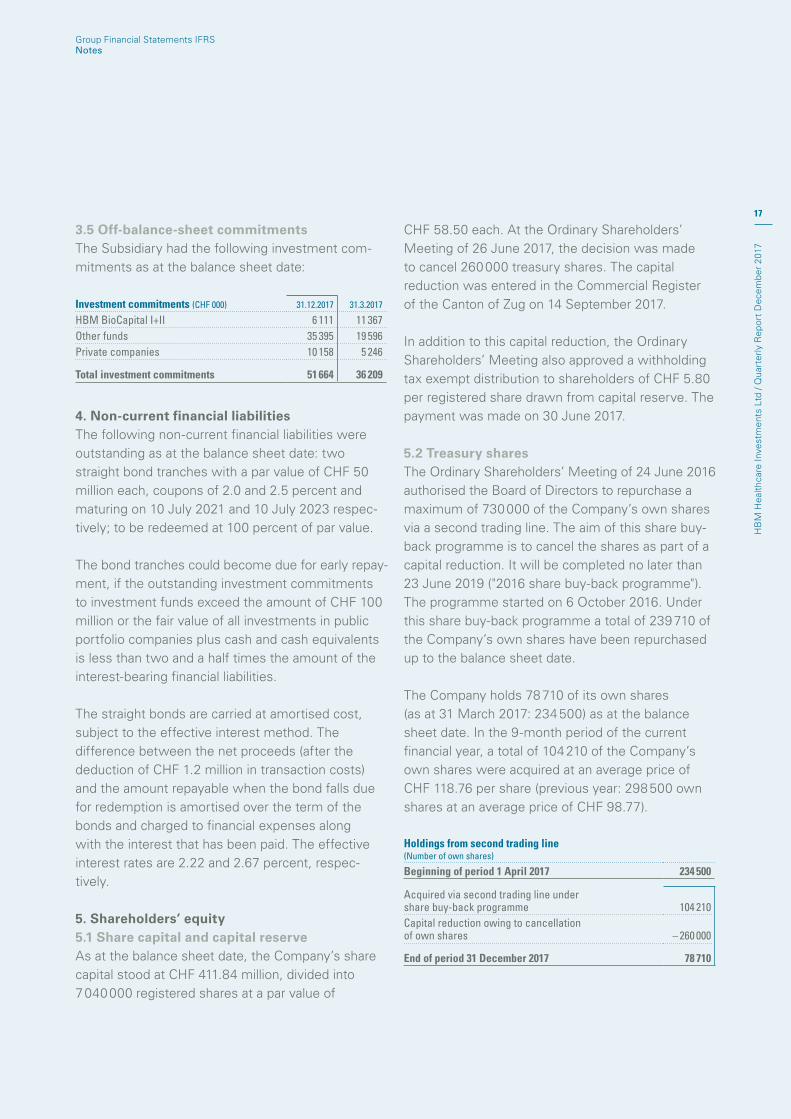
3.5 Off-balance-sheet commitmentsThe Subsidiary had the following investment com-mitments as at the balance sheet date:
Investment commitments (CHF 000) 31.12.2017 31.3.2017
HBM BioCapital I+II 6 111 11 367 Other funds 35 395 19 596 Private companies 10 158 5 246
Total investment commitments 51 664 36 209
4. Non-current financial liabilitiesThe following non-current financial liabilities were outstanding as at the balance sheet date: two straight bond tranches with a par value of CHF 50 million each, coupons of 2.0 and 2.5 percent and maturing on 10 July 2021 and 10 July 2023 respec-tively; to be redeemed at 100 percent of par value.
The bond tranches could become due for early repay- ment, if the outstanding investment commitments to investment funds exceed the amount of CHF 100 million or the fair value of all investments in public portfolio companies plus cash and cash equivalents is less than two and a half times the amount of the interest-bearing financial liabilities.
The straight bonds are carried at amortised cost, subject to the effective interest method. The difference between the net proceeds (after the deduction of CHF 1.2 million in transaction costs) and the amount repayable when the bond falls due for redemption is amortised over the term of the bonds and charged to financial expenses along with the interest that has been paid. The effective interest rates are 2.22 and 2.67 percent, respec-tively.
5. Shareholders’ equity5.1 Share capital and capital reserveAs at the balance sheet date, the Company’s share capital stood at CHF 411.84 million, divided into 7 040 000 registered shares at a par value of
CHF 58.50 each. At the Ordinary Shareholders’ Meeting of 26 June 2017, the decision was made to cancel 260 000 treasury shares. The capital reduction was entered in the Commercial Register of the Canton of Zug on 14 September 2017.
In addition to this capital reduction, the Ordinary Shareholders’ Meeting also approved a withholding tax exempt distribution to shareholders of CHF 5.80 per registered share drawn from capital reserve. The payment was made on 30 June 2017.
5.2 Treasury sharesThe Ordinary Shareholders’ Meeting of 24 June 2016 authorised the Board of Directors to repurchase a maximum of 730 000 of the Company’s own shares via a second trading line. The aim of this share buy-back programme is to cancel the shares as part of a capital reduction. It will be completed no later than 23 June 2019 ("2016 share buy-back programme"). The programme started on 6 October 2016. Under this share buy-back programme a total of 239 710 of the Company’s own shares have been repurchased up to the balance sheet date.
The Company holds 78 710 of its own shares (as at 31 March 2017: 234 500) as at the balance sheet date. In the 9-month period of the current financial year, a total of 104 210 of the Company’s own shares were acquired at an average price of CHF 118.76 per share (previous year: 298 500 own shares at an average price of CHF 98.77).
Holdings from second trading line (Number of own shares)
Beginning of period 1 April 2017 234 500
Acquired via second trading line under share buy-back programme 104 210 Capital reduction owing to cancellation of own shares – 260 000
End of period 31 December 2017 78 710
18
HB
M H
ealth
care
Inve
stm
ents
Ltd
/ Q
uart
erly
Rep
ort
Dec
embe
r 20
17
Group Financial Statements IFRSNotes
In addition, the subsidiary HBM Healthcare Invest-ments (Cayman) Ltd holds 76 529 treasury shares (as at 31 March 2017: 79 699), acquired via the regular trading line. During the 9-month period the Subsidiary acquired a total of 378 510 treasury shares via the regular trading line at an average price of CHF 117.53 per share (previous year: 216 295 shares at CHF 98.35) and sold 381 680 treasury shares at an average price of CHF 116.50 (previous year: 216 247 shares at CHF 97.59).
6. Transactions with related partiesHBM Healthcare holds an investment in the Hatteras Venture Partners III fund, where Board member Robert A. Ingram serves as General Partner. For details on the investment commitment, paid-in capital and valuation of this investment, please refer to the overview of funds on page 13.
19
HB
M H
ealth
care
Inve
stm
ents
Ltd
/ Q
uart
erly
Rep
ort
Dec
embe
r 20
17
At a GlanceInvestor Information
CreditsEditorial HBM Healthcare Investments LtdConcept and realisation Weber-Thedy Strategic CommunicationDesign Küng Art DirectionLayout Bader + Niederöst AGCopyright © 2018 HBM Healthcare Investments LtdPublished in English and German. The German version is binding in all matters of interpretation.
Board of Directors and Management
Hans Peter Hasler, ChairmanProf. Dr Dr h.c. mult. Heinz Riesenhuber, Vice ChairmanMario G. Giuliani, MemberDr Eduard E. Holdener, MemberRobert A. Ingram, MemberDr Rudolf Lanz, MemberDr Benedikt Suter, Secretary
Dr Andreas Wicki, Chief Executive OfficerErwin Troxler, Chief Financial Officer
Investment Advisor
HBM Partners Ltd, Zug www.hbmpartners.com
Fees
Management fee (paid quarterly):0.75% p.a. of Company assets plus 0.75% p.a. of the Company’s market capitalisationPerformance fee (paid annually):15% on increase in value above the high water mark High water mark (per share for all outstanding shares): NAV of CHF 152.62
Significant shareholdersBased on the notifications received by the Company, the following shareholders reported equity holdings in HBM Healthcare Investments Ltd of three percent or more as at 31 December 2017:
Information on shares
Swiss security number 1.262.725German security number 984345ISIN CH 0012627250CUSIP H 3553X112Telekurs 126,126272SIX Swiss Exchange Ticker HBMNInternet www.hbmhealthcare.com
HBMNSIX Swiss Exchange Ticker
hbmhealthcare.com
Shareholding
15 – 20 % Nogra Pharma Invest S.à.r.l., Luxembourg

HBM Healthcare Investments LtdBundesplatz 1, 6300 Zug/SwitzerlandPhone +41 41 710 75 77www.hbmhealthcare.com