2017 FOURTH QUARTER AND FULL YEAR · PDF fileThe adjusted effective tax rate (adjusted...
23
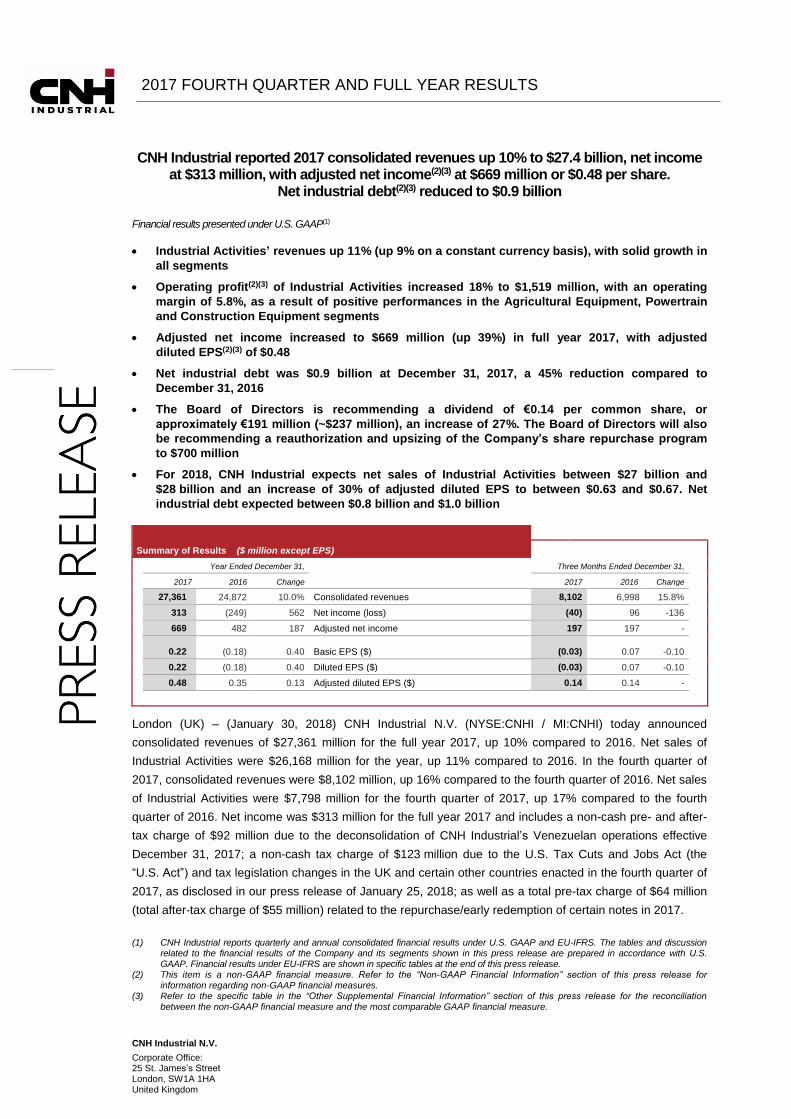
2017 FOURTH QUARTER AND FULL YEAR RESULTS (1) CNH Industrial reports quarterly and annual consolidated financial results under U.S. GAAP and EU-IFRS. The tables and discussion related to the financial results of the Company and its segments shown in this press release are prepared in accordance with U.S. GAAP. Financial results under EU-IFRS are shown in specific tables at the end of this press release. (2) This item is a non-GAAP financial measure. Refer to the “Non-GAAP Financial Information” section of this press release for information regarding non-GAAP financial measures. (3) Refer to the specific table in the “Other Supplemental Financial Information” section of this press release for the reconciliation between the non-GAAP financial measure and the most comparable GAAP financial measure. CNH Industrial N.V. Corporate Office: 25 St. James’s Street London, SW1A 1HA United Kingdom CNH Industrial reported 2017 consolidated revenues up 10% to $27.4 billion, net income at $313 million, with adjusted net income (2)(3) at $669 million or $0.48 per share. Net industrial debt (2)(3) reduced to $0.9 billion Financial results presented under U.S. GAAP (1) Industrial Activities’ revenues up 11% (up 9% on a constant currency basis), with solid growth in all segments Operating profit (2)(3) of Industrial Activities increased 18% to $1,519 million, with an operating margin of 5.8%, as a result of positive performances in the Agricultural Equipment, Powertrain and Construction Equipment segments Adjusted net income increased to $669 million (up 39%) in full year 2017, with adjusted diluted EPS (2)(3) of $0.48 Net industrial debt was $0.9 billion at December 31, 2017, a 45% reduction compared to December 31, 2016 The Board of Directors is recommending a dividend of €0.14 per common share, or approximately €191 million (~$237 million), an increase of 27%. The Board of Directors will also be recommending a reauthorization and upsizing of the Company’s share repurchase program to $700 million For 2018, CNH Industrial expects net sales of Industrial Activities between $27 billion and $28 billion and an increase of 30% of adjusted diluted EPS to between $0.63 and $0.67. Net industrial debt expected between $0.8 billion and $1.0 billion Summary of Results ($ million except EPS) Year Ended December 31, Three Months Ended December 31, 2017 2016 Change 2017 2016 Change 27,361 24,872 10.0% Consolidated revenues 8,102 6,998 15.8% 313 (249) 562 Net income (loss) (40) 96 -136 669 482 187 Adjusted net income 197 197 - 0.22 (0.18) 0.40 Basic EPS ($) (0.03) 0.07 -0.10 0.22 (0.18) 0.40 Diluted EPS ($) (0.03) 0.07 -0.10 0.48 0.35 0.13 Adjusted diluted EPS ($) 0.14 0.14 - London (UK) – (January 30, 2018) CNH Industrial N.V. (NYSE:CNHI / MI:CNHI) today announced consolidated revenues of $27,361 million for the full year 2017, up 10% compared to 2016. Net sales of Industrial Activities were $26,168 million for the year, up 11% compared to 2016. In the fourth quarter of 2017, consolidated revenues were $8,102 million, up 16% compared to the fourth quarter of 2016. Net sales of Industrial Activities were $7,798 million for the fourth quarter of 2017, up 17% compared to the fourth quarter of 2016. Net income was $313 million for the full year 2017 and includes a non-cash pre- and after- tax charge of $92 million due to the deconsolidation of CNH Industrial’s Venezuelan operations effective December 31, 2017; a non-cash tax charge of $123 million due to the U.S. Tax Cuts and Jobs Act (the “U.S. Act”) and tax legislation changes in the UK and certain other countries enacted in the fourth quarter of 2017, as disclosed in our press release of January 25, 2018; as well as a total pre-tax charge of $64 million (total after-tax charge of $55 million) related to the repurchase/early redemption of certain notes in 2017.
Transcript of 2017 FOURTH QUARTER AND FULL YEAR · PDF fileThe adjusted effective tax rate (adjusted...
2017 FOURTH QUARTER AND FULL YEAR RESULTS
(1) CNH Industrial reports quarterly and annual consolidated financial results under U.S. GAAP and EU-IFRS. The tables and discussion related to the financial results of the Company and its segments shown in this press release are prepared in accordance with U.S. GAAP. Financial results under EU-IFRS are shown in specific tables at the end of this press release.
(2) This item is a non-GAAP financial measure. Refer to the “Non-GAAP Financial Information” section of this press release for information regarding non-GAAP financial measures.
(3) Refer to the specific table in the “Other Supplemental Financial Information” section of this press release for the reconciliation between the non-GAAP financial measure and the most comparable GAAP financial measure.
CNH Industrial N.V.
Corporate Office: 25 St. James’s Street London, SW1A 1HA United Kingdom
CNH Industrial reported 2017 consolidated revenues up 10% to $27.4 billion, net income at $313 million, with adjusted net income(2)(3) at $669 million or $0.48 per share.
Net industrial debt(2)(3) reduced to $0.9 billion
Financial results presented under U.S. GAAP(1)
Industrial Activities’ revenues up 11% (up 9% on a constant currency basis), with solid growth in
all segments
Operating profit(2)(3) of Industrial Activities increased 18% to $1,519 million, with an operating
margin of 5.8%, as a result of positive performances in the Agricultural Equipment, Powertrain
and Construction Equipment segments
Adjusted net income increased to $669 million (up 39%) in full year 2017, with adjusted
diluted EPS(2)(3) of $0.48
Net industrial debt was $0.9 billion at December 31, 2017, a 45% reduction compared to
December 31, 2016
The Board of Directors is recommending a dividend of €0.14 per common share, or
approximately €191 million (~$237 million), an increase of 27%. The Board of Directors will also
be recommending a reauthorization and upsizing of the Company’s share repurchase program
to $700 million
For 2018, CNH Industrial expects net sales of Industrial Activities between $27 billion and
$28 billion and an increase of 30% of adjusted diluted EPS to between $0.63 and $0.67. Net
industrial debt expected between $0.8 billion and $1.0 billion
Summary of Results ($ million except EPS)
Year Ended December 31, Three Months Ended December 31,
2017 2016 Change 2017 2016 Change
27,361 24,872 10.0% Consolidated revenues 8,102 6,998 15.8%
313 (249) 562 Net income (loss) (40) 96 -136
669 482 187 Adjusted net income 197 197 -
0.22 (0.18) 0.40 Basic EPS ($) (0.03) 0.07 -0.10
0.22 (0.18) 0.40 Diluted EPS ($) (0.03) 0.07 -0.10
0.48 0.35 0.13 Adjusted diluted EPS ($) 0.14 0.14 -
London (UK) – (January 30, 2018) CNH Industrial N.V. (NYSE:CNHI / MI:CNHI) today announced
consolidated revenues of $27,361 million for the full year 2017, up 10% compared to 2016. Net sales of
Industrial Activities were $26,168 million for the year, up 11% compared to 2016. In the fourth quarter of
2017, consolidated revenues were $8,102 million, up 16% compared to the fourth quarter of 2016. Net sales
of Industrial Activities were $7,798 million for the fourth quarter of 2017, up 17% compared to the fourth
quarter of 2016. Net income was $313 million for the full year 2017 and includes a non-cash pre- and after-
tax charge of $92 million due to the deconsolidation of CNH Industrial’s Venezuelan operations effective
December 31, 2017; a non-cash tax charge of $123 million due to the U.S. Tax Cuts and Jobs Act (the
“U.S. Act”) and tax legislation changes in the UK and certain other countries enacted in the fourth quarter of
2017, as disclosed in our press release of January 25, 2018; as well as a total pre-tax charge of $64 million
(total after-tax charge of $55 million) related to the repurchase/early redemption of certain notes in 2017.
2017 FOURTH QUARTER AND FULL YEAR RESULTS
(1) This item is a non-GAAP financial measure. Refer to the “Non-GAAP Financial Information” section of this press release for information regarding non-GAAP financial measures.
(2) Refer to the specific table in the “Other Supplemental Financial Information” section of this press release for the reconciliation between the non-GAAP financial measure and the most comparable GAAP financial measure.
2
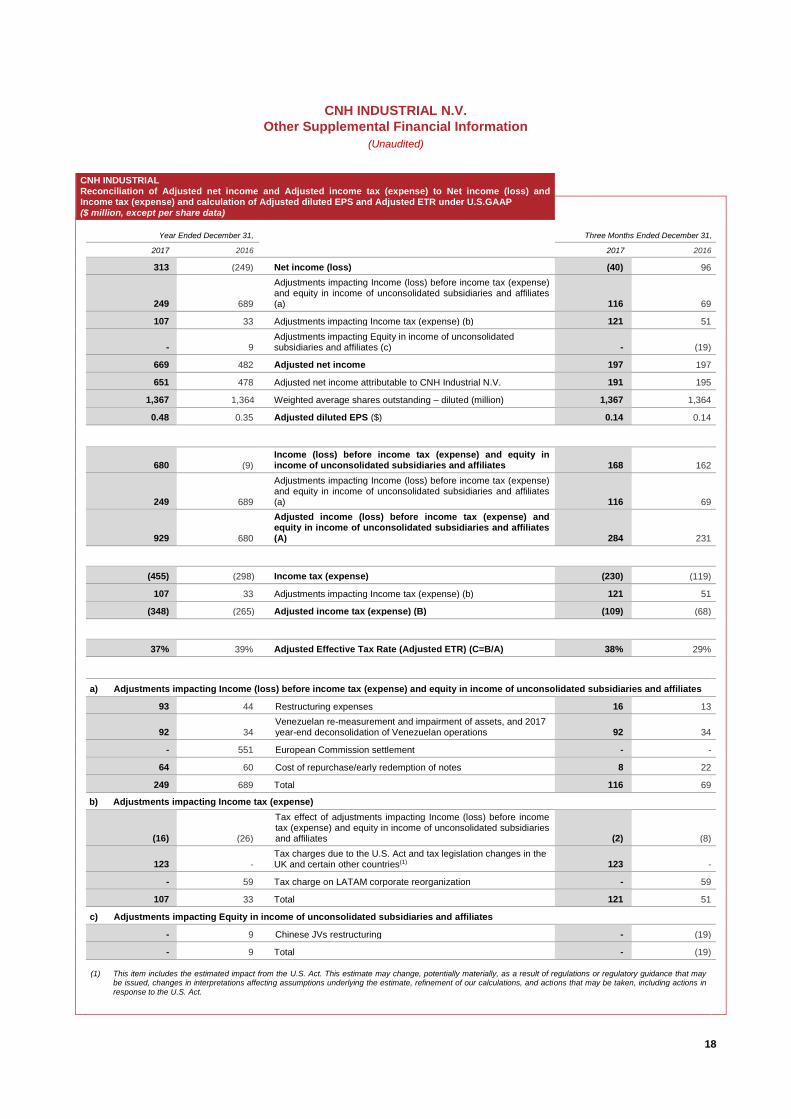
Adjusted net income was $669 million for the full year 2017 compared to $482 million in 2016. Adjusted diluted
EPS in 2017 was $0.48, up 37% compared to 2016. For the fourth quarter of 2017, net loss was $40 million
and, as mentioned above, was affected by the $92 million charge for Venezuelan operations deconsolidation,
the $123 million charge due to the U.S. Act and other tax legislation changes, as well as a $8 million charge
on early redemption of notes. The adjusted net income was $197 million for the quarter, flat compared to the
fourth quarter of 2016. Adjusted diluted EPS in the fourth quarter of 2017 was $0.14, flat compared to the
fourth quarter of 2016.
Operating profit of Industrial Activities was $1,519 million for the full year 2017 compared to $1,291 million in
2016, with an operating margin of 5.8%, up 0.3 percentage points (“p.p.”) compared to 2016. In the fourth
quarter of 2017, operating profit of Industrial Activities was $468 million, compared to $412 million in the fourth
quarter of 2016, with an operating margin of 6.0% (6.2% in 2016).
For the full year 2017, income taxes were $455 million ($298 million in 2016), including the $123 million non-
cash tax charge. Adjusted income taxes(1)(2) for the full year 2017 were $348 million ($265 million in 2016).
The adjusted effective tax rate (adjusted ETR)(1)(2) improved by 2 p.p. to 37%, when compared to 2016. For
2018, we expect the adjusted ETR to be in the range of 30% to 32%, reflecting the positive impact of the
recently enacted rate reductions in the U.S. and several other jurisdictions.
Net industrial debt was reduced to $0.9 billion at December 31, 2017, down $1.7 billion and $0.7 billion
compared to September 30, 2017, and December 31, 2016, respectively, as a result of strong cash flow
performance mainly arising from reduced working capital levels. Total debt was $25.9 billion at December 31,
2017, up $0.6 billion compared to December 31, 2016, with third party debt in Industrial Activities down $0.2
billion from December 31, 2016 to $6.5 billion (or down $0.8 billion at constant currency). At December 31,
2017, available liquidity(1)(2) was $9.4 billion, up $0.6 billion compared to December 31, 2016.
During the quarter, CNH Industrial N.V. issued $500 million in aggregate principal amount of 3.850% Notes
due 2027. This was the first bond issued after the Company’s securities became eligible for the main
investment grade indices in the U.S. market (following the assignment of the investment grade rating from
Fitch and the upgrade to investment grade from S&P). This is the first 10-year term public bond ever issued by
the Company.

2017 FOURTH QUARTER AND FULL YEAR RESULTS
3
Segment Results
Agricultural Equipment’s net sales increased 10% for the full year 2017 compared to 2016 (up 8% on a
constant currency basis). In LATAM, the increase was mainly due to higher industry volume, market share
gains, a favorable mix of higher horsepower products and net price realization. Net sales increased in APAC
mainly driven by favorable volume in Australia, Russia and South East Asia. In EMEA, net sales increased
due to higher industry volume, a favorable product mix and net price realization. In NAFTA, net sales
decreased as a result of de-stocking actions in our dealer network, primarily with the high horsepower tractors
and the hay and forage product lines. NAFTA industry volumes were flat overall, with the row crop sector
higher, offset by lower livestock sector volumes. In the fourth quarter of 2017, Agricultural Equipment’s net
sales increased 15% compared to the fourth quarter of 2016 (up 11% on a constant currency basis). Net sales
CNH INDUSTRIAL Revenues by Segment ($ million)
Year Ended December 31, Three Months Ended December 31,
2017 2016 % change
% change excl. FX(1)
2017 2016 % change
% change excl. FX(1)
11,130 10,120 10.0 8.0 Agricultural Equipment 3,240 2,829 14.5 10.9
2,626 2,304 14.0 12.8 Construction Equipment 785 578 35.8 33.4
10,415 9,553 9.0 7.0 Commercial Vehicles 3,212 2,799 14.8 8.0
4,372 3,707 17.9 15.9 Powertrain 1,159 952 21.7 13.1
(2,375) (2,015) - - Eliminations and other (598) (476) - -
26,168 23,669 10.6 8.6 Total Industrial Activities 7,798 6,682 16.7 11.6
1,625 1,570 3.5 1.3 Financial Services 420 397 5.8 3.0
(432) (367) - - Eliminations and other (116) (81) - -
27,361 24,872 10.0 8.1 Total 8,102 6,998 15.8 10.8
(1) “Change excl. FX” or “constant currency” is a non-GAAP financial measure. Refer to the “Non-GAAP Financial Information” section of this press release
for information regarding non-GAAP financial measures.
CNH INDUSTRIAL Operating Profit (loss)(1) by Segment ($ million)
Year Ended December 31, Three Months Ended December 31,
2017 Profit
2016 Profit
$ change
2017 Margin
2016 Margin
2017 Profit
2016 Profit
$ change
2017 Margin
2016 Margin
949 818 131 8.5% 8.1% Agricultural Equipment 279 272 7 8.6% 9.6%
21 2 19 0.8% 0.1% Construction Equipment 13 (30) 43 1.7% (5.2)%
272 333 -61 2.6% 3.5% Commercial Vehicles 94 131 -37 2.9% 4.7%
362 232 130 8.3% 6.3% Powertrain 102 61 41 8.8% 6.4%
(85) (94) 9 - - Eliminations and other (20) (22) 2 - -
1,519 1,291 228 5.8% 5.5%
Total Industrial Activities 468 412 56 6.0% 6.2%
479 478 1 29.5% 30.4% Financial Services 114 115 -1 27.1% 29.0%
(336) (330) -6 - - Eliminations and other (88) (86) -2 - -
1,662 1,439 223 6.1% 5.8% Total 494 441 53 6.1% 6.3%
(1) Operating profit of Industrial Activities (a non-GAAP financial measure) is defined as net sales less cost of goods sold, selling, general and administrative expenses, and research and development expenses. Operating profit of Financial Services (a non-GAAP financial measure) is defined as revenues less selling, general and administrative expenses, interest expense and certain other operating expenses.
2017 FOURTH QUARTER AND FULL YEAR RESULTS
4
increased in EMEA, primarily driven by higher combine sales in preparation of the 2018 season and positive
price realization. Net sales also increased in APAC and in LATAM. In NAFTA, net sales were flat.
Full year 2017 operating profit was $949 million, a 16% increase compared to $818 million in 2016, mainly due
to the favorable volume and product mix in all regions except NAFTA. One percent net price realization more
than offset increases in raw material cost and unfavorable foreign exchange fluctuations. Agricultural
Equipment also increased spending in research and development, primarily related to our new precision
farming solutions, and in selling, general and administrative expenses, primarily associated with the increased
sales activity. Operating margin increased 0.4 p.p. to 8.5%. In the fourth quarter of 2017, operating profit was
$279 million ($272 million in the fourth quarter of 2016), with an operating margin of 8.6% (operating margin of
9.6% in the fourth quarter of 2016). Favorable volume, net price realization and lower warranty costs were
partially offset by an unfavorable product mix, higher manufacturing costs in EMEA as a result of the transition
to new regulatory requirements and an overall increase in research and development spending.
Construction Equipment’s net sales increased 14% in the full year 2017 compared to 2016 (up 13% on a
constant currency basis), due to higher industry volume in all regions except EMEA, and net price realization,
primarily in NAFTA and LATAM. In the fourth quarter of 2017, net sales increased 36% compared to the fourth
quarter of 2016 (up 33% on a constant currency basis), driven by market growth in all regions.
Full year 2017 operating profit was $21 million compared to $2 million in 2016, with an operating margin of
0.8% (up 0.7 p.p. compared to 2016). The increase was due to higher volume including a positive overhead
absorption and net price realization, partially offset by increases in raw material cost, unfavorable foreign
exchange impacts on product components, and increased production costs. In the fourth quarter of 2017,
operating profit was $13 million compared to an operating loss of $30 million in the fourth quarter of 2016.
Higher industry volume and positive price realization, partially offset by ramp-up costs to accommodate
increased production (up more than 50% in the quarter compared to the fourth quarter of 2016), to meet retail
sales in the quarter, led to these improved results. Operating margin increased 6.9 p.p. to 1.7%. The global
order book in Construction Equipment remains solid with an increase year-over-year of over 30%.
Commercial Vehicles’ net sales increased 9% in the full year 2017 compared to 2016 (up 7% on a constant
currency basis) as result of higher truck and bus sales in EMEA, higher volume and mix in APAC, and
recovering truck sales in LATAM, mainly in Argentina. In the fourth quarter of 2017, net sales increased 15%
compared to the fourth quarter of 2016 (up 8% on a constant currency basis). In EMEA and APAC, net sales
increased primarily as a result of higher volume and favorable mix. In LATAM, net sales were flat.
Full year 2017 operating profit was $272 million compared to $333 million in 2016, with an operating margin of
2.6% (down 0.9 p.p. compared to 2016). Operating profit increased in LATAM and APAC, mainly due to higher
volume and favorable pricing. In EMEA, operating profit decreased as favorable volumes were more than
offset by unfavorable mix, primarily associated with fleet-related channel sales, Euro 6 emission content costs,
and the negative impact of the British pound devaluation. Increased spending in research and development on
new product programs was more than offset by favorable manufacturing efficiencies. In the fourth quarter of
2017, operating profit was $94 million ($131 million in the fourth quarter of 2016), with an operating margin of
2.9% (down 1.8 p.p. compared to the fourth quarter of 2016). Favorable volume was more than offset by
unfavorable mix, primarily associated with fleet-related channel sales, increases in product content costs and
2017 FOURTH QUARTER AND FULL YEAR RESULTS
5
new product introductions, higher spending in research and development, and the unfavorable impact of the
British pound devaluation.
Powertrain’s net sales increased 18% in the full year 2017 compared to 2016 (up 16% on a constant currency
basis), due to higher volumes. Sales to external customers accounted for 48% of total net sales (47% in
2016). In the fourth quarter of 2017, net sales increased 22% compared to the fourth quarter of 2016 (up 13%
on a constant currency basis), due to higher sales volumes to both captive and external customers.
Full year 2017 operating profit was $362 million, a $130 million increase compared to 2016, with an operating
margin of 8.3%, up 2.0 p.p. compared to 2016. The improvement was due to higher volumes and
manufacturing efficiencies. In the fourth quarter of 2017, operating profit was $102 million, a $41 million
increase compared to the fourth quarter of 2016, as result of higher volumes, favorable mix and manufacturing
efficiencies. Operating margin increased 2.4 p.p. to 8.8%, the highest quarterly margin ever reported in
Powertrain’s history, reflecting the profitability of a well-balanced portfolio of engine applications.
Financial Services’ revenues totaled $1,625 million in the full year 2017, an increase of 4% compared to
2016 (up 1% on a constant currency basis), due to higher activity in all regions except NAFTA. In the fourth
quarter of 2017, revenues totaled $420 million, an increase of 6% compared to the fourth quarter of 2016 (up
3% on a constant currency basis).
In 2017, retail loan originations (including unconsolidated joint ventures) were $9.1 billion, flat compared to
2016. The managed portfolio (including unconsolidated joint ventures) of $26.8 billion as of December 31,
2017 (of which retail was 61% and wholesale 39%) increased $2.0 billion compared to December 31, 2016.
Excluding the impact of currency translation, the managed portfolio increased $0.6 billion compared to 2016.
Full year 2017 net income was $452 million, a $118 million increase compared to 2016 primarily attributable to
an improvement in income taxes as a result of the revaluation of deferred tax liabilities following the U.S. Act
enactment. Excluding the favorable tax impact, net income was flat compared to 2016, as stronger
performances in the EMEA, LATAM and APAC regions were offset by a weaker result in NAFTA. In the fourth
quarter of 2017, net income was $192 million, an increase of $109 million compared to the fourth quarter of
2016, mainly attributable to the revaluation of the U.S. deferred tax liabilities.
Dividends and Share Buy-back
The Board of Directors of CNH Industrial N.V. intends to recommend to the Company’s shareholders a
dividend of €0.14 per common share, representing an increase of 27% over the prior year dividend, and
totaling approximately €191 million ($237 million). Subject to the approval of the upcoming Annual General
Meeting (expected on April 13, 2018), the ex-dividend date would be set at April 23, 2018.
The Board of Directors also intends to recommend to the Company’s shareholders the renewal of the
authorization to repurchase up to a maximum of 10% of the Company’s issued common shares. After such
authorization and subject to general and market conditions, the Company intends to launch a buy-back
program up to $700 million, representing an increase of $400 million versus the current program.
Neither the renewal of the authorization, nor the launch of the program obliges the Company to repurchase
any common shares and the program may be suspended, discontinued or modified at any time for any reason
and without previous notice, in accordance with applicable laws and regulations.

2017 FOURTH QUARTER AND FULL YEAR RESULTS
(1) Outlook is not provided on diluted EPS, the most comparable GAAP financial measure of this non-GAAP financial measure, as the income or expense excluded from the calculation of adjusted diluted EPS and instead included in the calculation of diluted EPS are, by
definition, not predictable and uncertain.
6
2018 Outlook
Worldwide demand for agricultural equipment is expected to improve with all regions flat to up 5% on average.
Farm incomes are expected to remain stable, leading to no significant changes in planted acreage.
Construction equipment demand is forecasted to be up 5-10% in LATAM and APAC while remaining relatively
flat to up slightly in EMEA and NAFTA. Commercial vehicle demand is expected to be up about 15% in
LATAM and flat to slightly down in EMEA and APAC.
As a result of the forecasted improvement in product demand conditions, and the positive impact of changes
in the Company’s capital structure, the Company is setting its full year 2018 guidance as follows:
Net sales of Industrial Activities of $27 billion to $28 billion;
Adjusted diluted EPS(1) of $0.63 to $0.67;
Net industrial debt at the end of 2018 at $0.8 billion to $1.0 billion.
2017 FOURTH QUARTER AND FULL YEAR RESULTS
7
About CNH Industrial
CNH Industrial N.V. (NYSE: CNHI /MI: CNHI) is a global leader in the capital goods sector with established industrial
experience, a wide range of products and a worldwide presence. Each of the individual brands belonging to the Company
is a major international force in its specific industrial sector: Case IH, New Holland Agriculture and Steyr for tractors and
agricultural machinery; Case and New Holland Construction for earth moving equipment; Iveco for commercial vehicles;
Iveco Bus and Heuliez Bus for buses and coaches; Iveco Astra for quarry and construction vehicles; Magirus for
firefighting vehicles; Iveco Defence Vehicles for defence and civil protection; and FPT Industrial for engines and
transmissions. More information can be found on the corporate website: www.cnhindustrial.com
Additional Information
Today, at 4:00 p.m. CET / 3:00 p.m. GMT / 10:00 a.m. EST, management will hold a conference call to present 2017
fourth quarter and full year results. The call can be followed live online at: http://bit.ly/CNH_Industrial_FY_Q4_2017 and a
recording will be available later on the Company’s website (www.cnhindustrial.com). A presentation will be made available
on the CNH Industrial website prior to the conference call.
Non-GAAP Financial Information
CNH Industrial monitors its operations through the use of several non-GAAP financial measures. CNH Industrial’s
management believes that these non-GAAP financial measures provide useful and relevant information regarding its
results and allow management and investors to assess CNH Industrial’s operating trends, financial performance and
financial position. Management uses these non-GAAP measures to identify operational trends, as well as make decisions
regarding future spending, resource allocations and other operational decisions as they provide additional transparency
with respect to our core operations. These non-GAAP financial measures have no standardized meaning presented in
U.S. GAAP or EU-IFRS and are unlikely to be comparable to other similarly titled measures used by other companies due
to potential differences between the companies in calculations. As a result, the use of these non-GAAP measures has
limitations and they should not be considered as substitutes for measures of financial performance and financial position
as prepared in accordance with U.S. GAAP and/or EU-IFRS.
CNH Industrial non-GAAP financial measures are defined as follows:
Operating Profit under U.S. GAAP: Operating Profit of Industrial Activities is defined as net sales less cost of goods
sold, selling, general and administrative expenses, and research and development expenses. Operating Profit of
Financial Services is defined as revenues less selling, general and administrative expenses, interest expense and
certain other operating expenses.
Trading Profit under EU-IFRS: Trading Profit is derived from financial information prepared in accordance with EU-
IFRS and is defined as net revenues less cost of sales, selling, general and administrative costs, research and
development costs, and other operating income and expenses.
Operating Profit under EU-IFRS: Operating Profit under EU-IFRS is computed starting from Trading Profit under EU-
IFRS plus/minus restructuring costs, other income (expenses) that are unusual in the ordinary course of business
(such as gains and losses on the disposal of investments and other unusual items arising from infrequent external
events or market conditions).
Adjusted Net Income (Loss): is defined as net income (loss), less restructuring charges and non-recurring items, after
tax. In particular, non-recurring items are specifically disclosed items that management considers rare or discrete
events that are infrequent in nature and not reflective of on-going operational activities.
Adjusted Diluted EPS: is computed by dividing Adjusted Net Income (loss) attributable to CNH Industrial N.V. by a
weighted-average number of common shares outstanding during the period that takes into consideration potential
common shares outstanding deriving from the CNH Industrial share-based payment awards, when inclusion is not
anti-dilutive. When we provide guidance for adjusted diluted EPS, we do not provide guidance on an earnings per

2017 FOURTH QUARTER AND FULL YEAR RESULTS
8
share basis because the GAAP measure will include potentially significant items that have not yet occurred and are
difficult to predict with reasonable certainty prior to year-end.
Adjusted Income Taxes: is defined as income taxes less the tax effect of restructuring expenses and non-recurring
items and non-recurring tax charges.
Adjusted Effective Tax Rate (Adjusted ETR): is computed by dividing a) adjusted income taxes by b) income (loss)
before income taxes and equity in income of unconsolidated subsidiaries and affiliates, less restructuring expenses
and non-recurring items.
Net Debt and Net Debt of Industrial Activities (or Net Industrial Debt): Net Debt is defined as total debt less
intersegment notes receivable, cash and cash equivalents, restricted cash and derivative hedging debt. CNH
Industrial provides the reconciliation of Net Debt to Total Debt, which is the most directly comparable measure
included in the consolidated balance sheets. Due to different sources of cash flows used for the repayment of the debt
between Industrial Activities and Financial Services (by cash from operations for Industrial Activities and by collection
of financing receivables for Financial Services), management separately evaluates the cash flow performance of
Industrial Activities using Net Debt of Industrial Activities.
Available Liquidity: is defined as cash and cash equivalents plus restricted cash and undrawn committed facilities.
Change excl. FX or Constant Currency: CNH Industrial discusses the fluctuations in revenues on a constant currency
basis by applying the prior year average exchange rates to current year’s revenues expressed in local currency in
order to eliminate the impact of foreign exchange rate fluctuations.
The tables attached to this press release provide reconciliations of the non-GAAP measures used in this press release to
the most directly comparable GAAP measures.
Forward-looking statements
All statements other than statements of historical fact contained in this earning release including statements regarding our
competitive strengths; business strategy; future financial position or operating results; budgets; projections with respect to
revenue, income, earnings (or loss) per share, capital expenditures, dividends, capital structure or other financial items;
costs; and plans and objectives of management regarding operations and products, are forward-looking statements.
These statements may include terminology such as “may”, “will”, “expect”, “could”, “should”, “intend”, “estimate”,
“anticipate”, “believe”, “outlook”, “continue”, “remain”, “on track”, “design”, “target”, “objective”, “goal”, “forecast”,
“projection”, “prospects”, “plan”, or similar terminology. Forward-looking statements are not guarantees of future
performance. Rather, they are based on current views and assumptions and involve known and unknown risks,
uncertainties and other factors, many of which are outside our control and are difficult to predict. If any of these risks and
uncertainties materialize or other assumptions underlying any of the forward-looking statements prove to be incorrect, the
actual results or developments may differ materially from any future results or developments expressed or implied by the
forward-looking statements. Factors, risks and uncertainties that could cause actual results to differ materially from those
contemplated by the forward-looking statements include, among others: the many interrelated factors that affect consumer
confidence and worldwide demand for capital goods and capital goods-related products; general economic conditions in
each of our markets; changes in government policies regarding banking, monetary and fiscal policies; legislation,
particularly relating to capital goods-related issues such as agriculture, the environment, debt relief and subsidy program
policies, trade and commerce and infrastructure development; government policies on international trade and investment,
including sanctions, import quotas, capital controls and tariffs; actions of competitors in the various industries in which we
compete; development and use of new technologies and technological difficulties; the interpretation of, or adoption of new,
compliance requirements with respect to engine emissions, safety or other aspects of our products; production difficulties,
including capacity and supply constraints and excess inventory levels; labor relations; interest rates and currency
exchange rates; inflation and deflation; energy prices; prices for agricultural commodities; housing starts and other
construction activity; our ability to obtain financing or to refinance existing debt; a decline in the price of used vehicles; the
resolution of pending litigation and investigations on a wide range of topics, including dealer and supplier litigation, follow-
on private litigation in various jurisdictions after the settlement of the EU antitrust investigation announced on July 19,
2016, intellectual property rights disputes, product warranty and defective product claims, and emissions and/or fuel
economy regulatory and contractual issues; our pension plans and other post-employment obligations; political and civil
unrest; volatility and deterioration of capital and financial markets, including further deterioration of the Eurozone
2017 FOURTH QUARTER AND FULL YEAR RESULTS
9
sovereign debt crisis, possible effects of “Brexit”, terror attacks in Europe and elsewhere, and other similar risks and
uncertainties and our success in managing the risks involved in the foregoing. Further information concerning factors,
risks, and uncertainties that could materially affect the Company’s financial results is included in our annual report on
Form 20-F for the year ended December 31, 2016, prepared in accordance with U.S. GAAP, and in the Company’s EU
Annual Report at December 31, 2016, prepared in accordance with EU-IFRS. Investors should refer to and consider the
incorporated information on risks, factors, and uncertainties in addition to the information presented here.
Forward-looking statements are based upon assumptions relating to the factors described in this earnings release, which
are sometimes based upon estimates and data received from third parties. Such estimates and data are often revised.
Our actual results could differ materially from those anticipated in such forward-looking statements. Forward-looking
statements speak only as of the date on which such statements are made, and we undertake no obligation to update or
revise publicly our forward-looking statements. Further information concerning CNH Industrial and its businesses,
including factors that potentially could materially affect CNH Industrial’s financial results, is included in CNH Industrial’s
reports and filings with the U.S. Securities and Exchange Commission (“SEC”), the Autoriteit Financiële Markten (“AFM”)
and Commissione Nazionale per le Società e la Borsa (“CONSOB”).
All future written and oral forward-looking statements by CNH Industrial or persons acting on the behalf of CNH Industrial
are expressly qualified in their entirety by the cautionary statements contained herein or referred to above.
Contacts Media Inquiries Investor Relations United Kingdom United Kingdom Richard Gadeselli Federico Donati Tel: +44 207 7660 346 Tel: +44 207 7660 386 Laura Overall United States Tel: +44 207 7660 338 Noah Weiss Tel: +1 630 887 3745 E-mail: [email protected]
www.cnhindustrial.com
10
CNH INDUSTRIAL N.V.
Condensed Consolidated Statements of Operations
For The Three Months and The Years Ended December 31, 2017 and 2016
(Unaudited)
(U.S. GAAP)
($ million)
Three Months Ended December 31, Years Ended December 31,
2017 2016 2017 2016
Revenues
Net sales 7,798
6,682 26,168 23,669
Finance and interest income 304
316 1,193 1,203
TOTAL REVENUES 8,102
6,998 27,361 24,872
Costs and Expenses
Cost of goods sold 6,455
5,525 21,621 19,539
Selling, general and administrative expenses 654
575 2,330 2,262
Research and development expenses 295
241 957 860
Restructuring expenses 16
13 93 44
Interest expense(1) 230
285 942 1,028
Other, net(2) 284
197 738 1,148
TOTAL COSTS AND EXPENSES 7,934
6,836 26,681 24,881
INCOME (LOSS) BEFORE INCOME TAXES AND EQUITY IN INCOME OF UNCONSOLIDATED SUBSIDIARIES AND AFFILIATES 168
162 680
(9)
Income tax (expense)(3) (230)
(119) (455) (298)
Equity in income of unconsolidated subsidiaries and affiliates(4) 22
53 88 58
NET INCOME (LOSS) (40)
96 313 (249)
Net income (loss) attributable to noncontrolling interests 6
1 18 3
NET INCOME (LOSS) ATTRIBUTABLE TO CNH INDUSTRIAL N.V. (46)
95 295
(252)
(in $)
Earnings (loss) per share attributable to common shareholders
Basic (0.03)
0.07 0.22 (0.18)
Diluted (0.03)
0.07 0.22 (0.18)
Cash dividends declared per common share - - 0.118
0.148
Notes: (1) In the three months and year ended December 31, 2017, Interest expense includes the charge of $8 million and $64 million, respectively, related to
the repurchase/early redemption of notes. In the three months and year ended December 31, 2016, this item included the charge of $22 million and $60 million, respectively, related to the repurchase of notes.
(2) In the three months and year ended December 31, 2017, Other, net includes a non-cash charge of $92 million due to the deconsolidation of the Venezuelan operations effective December 31, 2017. In the three months and year ended December 31, 2016, this item included the non-recurring charge of $34 million due to the re-measurement and impairment of certain assets in Venezuela. In the year ended December 31, 2016, Other, net also included the non-recurring charge of $551 million related to the European Commission settlement.
(3) In the three months and year ended December 31, 2017, Income tax (expense) includes a non-cash tax charge of $123 million due to the U.S. Act and tax legislation changes in the UK and certain other countries. In the three months and year ended December 31, 2016, this item included a non-cash tax charge of $59 million accounted for in connection with the reorganization of Latin American operations, intended to simplify corporate structure and promote operational efficiencies, and including changes in valuation allowances recorded against deferred tax assets in the region.
(4) In the three months and year ended December 31, 2016, Equity in income of unconsolidated subsidiaries and affiliates included a net positive impact of $19 million and a net negative impact of $9 million, respectively, due to restructuring of our joint ventures in China.
11
CNH INDUSTRIAL N.V.
Condensed Consolidated Balance Sheets
As of December 31, 2017 and 2016
(Unaudited)
(U.S. GAAP)
($ million)
December 31, 2017
December 31, 2016
ASSETS
Cash and cash equivalents 5,430 5,017
Restricted cash 770 837
Financing receivables, net 19,842 18,662
Inventories, net 6,280 5,609
Property, plant and equipment, net and Equipment under operating leases
8,848 8,304
Intangible assets, net 3,264 3,236
Other receivables and assets 3,841 3,882
TOTAL ASSETS 48,275 45,547
LIABILITIES AND EQUITY
Debt 25,895 25,276
Other payables and liabilities 17,955 15,799
Total Liabilities
43,850 41,075
Redeemable noncontrolling interest
25 21
Equity attributable to CNH Industrial N.V.
4,390 4,444
Noncontrolling interests
10 7
Equity
4,400 4,451
TOTAL LIABILITIES AND EQUITY 48,275 45,547
12
CNH INDUSTRIAL N.V.
Condensed Consolidated Statements of Cash Flows
For The Years Ended December 31, 2017 and 2016
(Unaudited)
(U.S. GAAP)
($ million)
2017 2016
Net income (loss) 313 (249)
Adjustments to reconcile net income (loss) to net cash provided by operating activities 1,702 2,357
NET CASH PROVIDED BY OPERATING ACTIVITIES 2,015 2,108
NET CASH USED IN INVESTING ACTIVITIES (932) (921)
NET CASH USED IN FINANCING ACTIVITIES (1,045) (1,538)
Effect of foreign exchange rate changes on cash and cash equivalents 375 (16)
INCREASE (DECREASE) IN CASH AND CASH EQUIVALENTS 413 (367)
CASH AND CASH EQUIVALENTS, BEGINNING OF YEAR 5,017 5,384
CASH AND CASH EQUIVALENTS, END OF YEAR 5,430 5,017
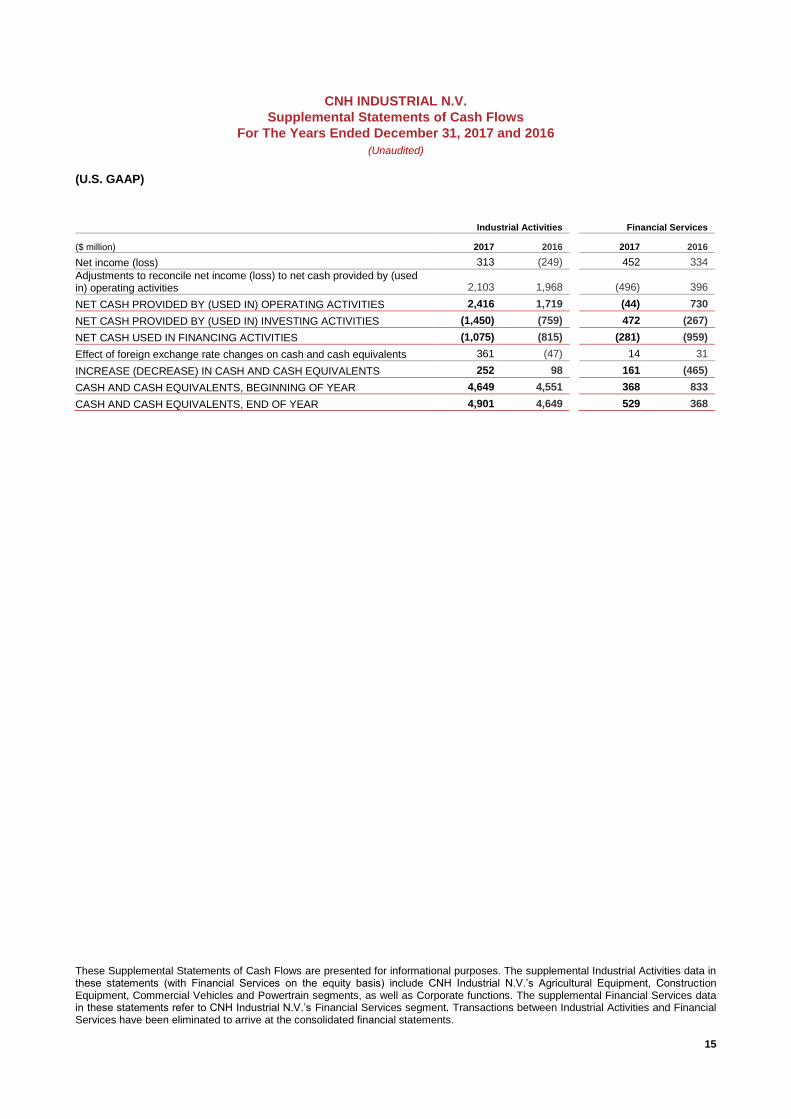
These Supplemental Statements of Operations are presented for informational purposes. The supplemental Industrial Activities data in these statements (with Financial Services on the equity basis) include CNH Industrial N.V.’s Agricultural Equipment, Construction Equipment, Commercial Vehicles and Powertrain segments, as well as Corporate functions. The supplemental Financial Services data in these statements refer to CNH Industrial N.V.’s Financial Services segment. Transactions between Industrial Activities and Financial Services have been eliminated to arrive at the consolidated financial statements.
13
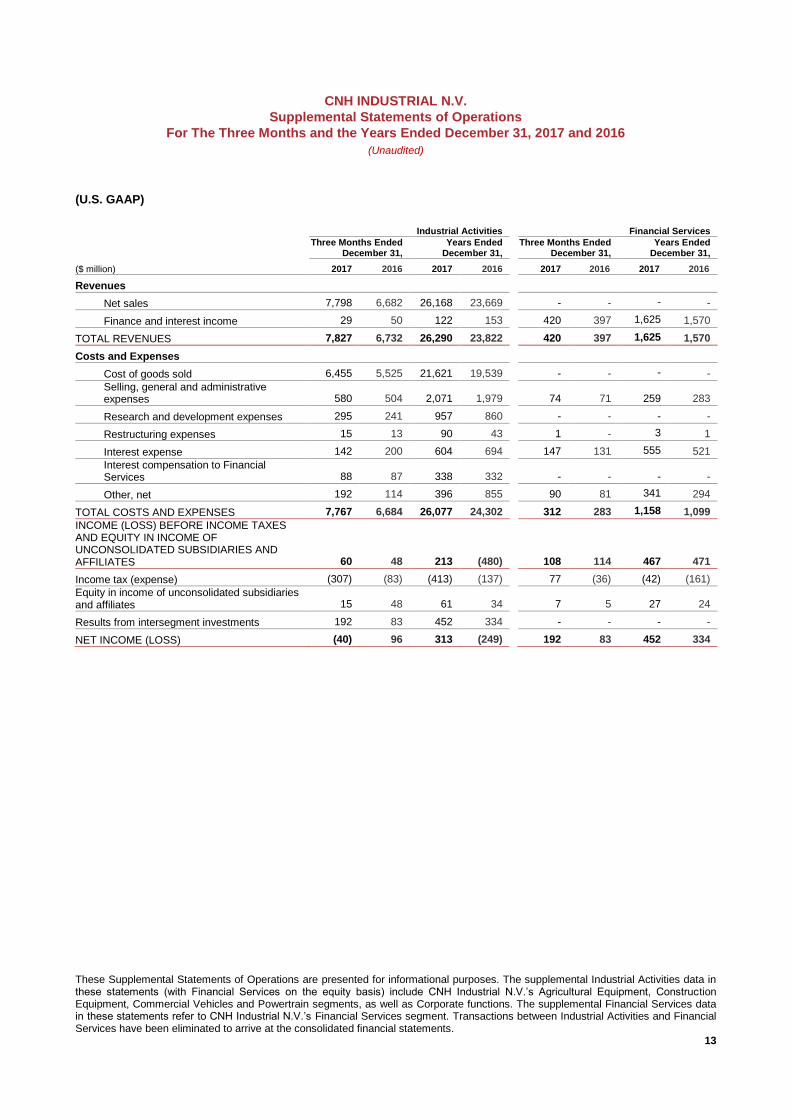
CNH INDUSTRIAL N.V.
Supplemental Statements of Operations
For The Three Months and the Years Ended December 31, 2017 and 2016
(Unaudited)
(U.S. GAAP)
Industrial Activities Financial Services
($ million)
Three Months Ended December 31,
Years Ended December 31,
Three Months Ended December 31,
Years Ended December 31,
2017 2016 2017 2016 2017 2016 2017 2016
Revenues
Net sales 7,798 6,682 26,168 23,669 - - - -
Finance and interest income 29 50 122 153 420 397 1,625 1,570
TOTAL REVENUES 7,827 6,732 26,290 23,822 420 397 1,625 1,570
Costs and Expenses
Cost of goods sold 6,455 5,525 21,621 19,539 - - - -
Selling, general and administrative expenses 580 504 2,071 1,979
74 71 259 283
Research and development expenses 295 241 957 860 - - - -
Restructuring expenses 15 13 90 43 1 - 3 1
Interest expense 142 200 604 694 147 131 555 521
Interest compensation to Financial Services 88 87 338 332
- - - -
Other, net 192 114 396 855 90 81 341 294
TOTAL COSTS AND EXPENSES 7,767 6,684 26,077 24,302 312 283 1,158 1,099
INCOME (LOSS) BEFORE INCOME TAXES AND EQUITY IN INCOME OF UNCONSOLIDATED SUBSIDIARIES AND AFFILIATES 60 48 213 (480)
108 114 467 471
Income tax (expense) (307) (83) (413) (137) 77 (36) (42) (161)
Equity in income of unconsolidated subsidiaries and affiliates 15 48 61 34
7 5 27 24
Results from intersegment investments 192 83 452 334 - - - -
NET INCOME (LOSS) (40) 96 313 (249) 192 83 452 334

These Supplemental Balance Sheets are presented for informational purposes. The supplemental Industrial Activities data in these statements (with Financial Services on the equity basis) include CNH Industrial N.V.’s Agricultural Equipment, Construction Equipment, Commercial Vehicles and Powertrain segments, as well as Corporate functions. The supplemental Financial Services data in these statements refer to CNH Industrial N.V.’s Financial Services segment. Transactions between Industrial Activities and Financial Services have been eliminated to arrive at the consolidated financial statements.
14
CNH INDUSTRIAL N.V.
Supplemental Balance Sheets
As of December 31, 2017 and 2016
(Unaudited)
(U.S. GAAP)
Industrial Activities Financial Services
($ million) December 31,
2017 December 31,
2016 December 31,
2017 December 31,
2016
ASSETS
Cash and cash equivalents 4,901 4,649 529 368
Restricted cash - - 770 837
Financing receivables, net 1,718 1,592 20,699 19,546
Inventories, net 6,064 5,396 216 213
Property, plant and equipment, net and Equipment under operating leases 7,036 6,412
1,812 1,892
Intangible assets, net 3,095 3,068 169 168
Other receivables and assets 6,277 6,145 828 789
TOTAL ASSETS 29,091 27,262 25,023 23,813
LIABILITIES AND EQUITY
Debt 7,396 7,691 21,075 20,061
Other payables and liabilities 17,270 15,099 1,134 1,200
Total Liabilities 24,666 22,790 22,209 21,261
Redeemable noncontrolling interest 25 21 - -
Equity 4,400 4,451 2,814 2,552
TOTAL LIABILITIES AND EQUITY 29,091 27,262 25,023 23,813
These Supplemental Statements of Cash Flows are presented for informational purposes. The supplemental Industrial Activities data in these statements (with Financial Services on the equity basis) include CNH Industrial N.V.’s Agricultural Equipment, Construction Equipment, Commercial Vehicles and Powertrain segments, as well as Corporate functions. The supplemental Financial Services data in these statements refer to CNH Industrial N.V.’s Financial Services segment. Transactions between Industrial Activities and Financial Services have been eliminated to arrive at the consolidated financial statements.
15
CNH INDUSTRIAL N.V.
Supplemental Statements of Cash Flows
For The Years Ended December 31, 2017 and 2016
(Unaudited)
(U.S. GAAP)
Industrial Activities Financial Services
($ million) 2017 2016
2017 2016
Net income (loss) 313 (249) 452 334
Adjustments to reconcile net income (loss) to net cash provided by (used in) operating activities 2,103 1,968
(496) 396
NET CASH PROVIDED BY (USED IN) OPERATING ACTIVITIES 2,416 1,719 (44) 730
NET CASH PROVIDED BY (USED IN) INVESTING ACTIVITIES (1,450) (759) 472 (267)
NET CASH USED IN FINANCING ACTIVITIES (1,075) (815) (281) (959)
Effect of foreign exchange rate changes on cash and cash equivalents 361 (47) 14 31
INCREASE (DECREASE) IN CASH AND CASH EQUIVALENTS 252 98 161 (465)
CASH AND CASH EQUIVALENTS, BEGINNING OF YEAR 4,649 4,551 368 833
CASH AND CASH EQUIVALENTS, END OF YEAR 4,901 4,649 529 368

16
CNH INDUSTRIAL N.V.
Other Supplemental Financial Information
(Unaudited)
CNH INDUSTRIAL Reconciliation of Operating Profit to Net Income (loss) under U.S. GAAP ($ million)
Year Ended December 31, Three Months Ended December 31,
2017 2016 2017 2016
1,662 1,439 Total Operating Profit 494 441
93 44 Restructuring expenses 16 13
484 543 Interest expenses of Industrial Activities, net of interest income and eliminations(1) 114 151
(405) (861) Other, net(2) (196) (115)
680 (9) Income (loss) before income taxes and equity in income of unconsolidated subsidiaries and affiliates 168 162
(455) (298) Income tax (expense)(3) (230) (119)
88 58 Equity in income of unconsolidated subsidiaries and affiliates(4) 22 53
313 (249) Net income (loss) (40) 96
(1) In the year ended December 31, 2017, Interest expenses includes the charge of $56 million related to the repurchase/early redemption of notes. In the three months and
year ended December 31, 2016, this item included the charge of $22 million and $60 million, respectively, related to the repurchase of notes. (2) In the three months and year ended December 31, 2017, Other, net includes a non-cash charge of $92 million due to the deconsolidation of Venezuelan operations
effective December 31, 2017. In the three months and year ended December 31, 2016, this item included the non-recurring charge of $34 million due to the re-measurement and impairment of certain assets in Venezuela. In the year ended December 31, 2016, Other, net also included the non-recurring charge of $551 million related to the European Commission settlement.
(3) In the three months and year ended December 31, 2017, Income tax (expense) includes a non-cash tax charge of $123 million due to the U.S. Act and tax legislation changes in the UK and certain other countries. In the three months and year ended December 31, 2016, Income tax (expense) included a non-cash tax charge of $59 million accounted for in connection with the reorganization of Latin American operations, intended to simplify corporate structure and promote operational efficiencies, and including changes in valuation allowances recorded against deferred tax assets in the region.
(4) In the three months and year ended December 31, 2016, Equity in income of unconsolidated subsidiaries and affiliates included a net positive impact of $19 million and a net negative impact of $9 million, respectively, due to the restructuring of our joint ventures in China.
CNH INDUSTRIAL Reconciliation of Total Debt to Net debt under U.S. GAAP ($ million)
\
Consolidated Industrial Activities Financial Activities
December 31, 2017
December 31, 2016
December 31, 2017
December 31, 2016
December 31, 2017
December 31, 2016
Third party debt 25,895 25,276
6,461 6,694
19,434 18,582
Intersegment notes payable - -
935 997
1,641 1,479
Total Debt(1) 25,895 25,276
7,396 7,691
21,075 20,061
Less: Cash and cash equivalents 5,430 5,017
4,901 4,649
529 368
Restricted cash 770 837 - - 770 837
Intersegment notes receivable - -
1,641 1,479
935 997
Derivatives hedging debt (7) 2
(7) 2
- -
Net debt (cash)(2) 19,702 19,420
861 1,561
18,841 17,859
(1) Total Debt of Industrial Activities includes Intersegment notes payable to Financial Services of $935 million and $997 million as of December 31, 2017 and 2016, respectively. Total Debt of Financial Services includes Intersegment notes payable to Industrial Activities of $1,641 million and $1,479 million as of December 31, 2017 and 2016, respectively.
(2) The net intersegment receivable/payable balance owed by Financial Services to Industrial Activities was $706 million and $482 million as of December 31, 2017 and 2016, respectively.
CNH INDUSTRIAL Reconciliation of Cash and cash equivalents to Available liquidity under U.S. GAAP ($ million)
December 31, 2017
December 31, 2016
Cash and cash equivalents 5,430 5,017
Restricted cash 770 837
Undrawn committed facilities 3,180 2,890
Available liquidity 9,380 8,744
17
CNH INDUSTRIAL N.V.
Other Supplemental Financial Information
(Unaudited)
CNH INDUSTRIAL Change in Net industrial debt under U.S. GAAP ($ million)
Year Ended December 31,
Three Months Ended December 31,
2017 2016
2017 2016
(1,561) (1,578) Net industrial (debt)/cash at beginning of period (2,575) (2,673)
313 (249) Net income (loss) (40) 96
- 551 Add back European Commission settlement(1) - -
56 60 Add back cost of repurchase/early redemption of notes(1) - 22
720 710 Amortization and depreciation(2) 184 177
485 194 Changes in provisions and similar(3) 418 91
130 330 Change in working capital 1,274 1,319
(488) (501) Investments in property, plant and equipment, and intangible assets(2) (211) (211)
73 (50) Other changes 59 50
1,289 1,045 Net industrial cash flow 1,684 1,544
(193) (221) Capital increases and dividends(4) (11) (2)
(396) (807) Currency translation differences and other(5) 41 (430)
700 17 Change in Net industrial debt 1,714 1,112
(861) (1,561) Net industrial (debt)/cash at end of period (861) (1,561)
(1) Add back item to be excluded from the calculation of net industrial cash flow. (2) Excluding assets sold under buy-back commitments and assets under operating leases. (3) This item also includes changes in items related to assets sold under buy-back commitments, and assets under operating leases. In the three months ended
December 31, 2016, this item excluded the funds utilization due to the payment of the $551 million following European Commission settlement. (4) This item also includes share buy-back transactions. (5) In the year ended December 31, 2017, this item includes the charge of $56 million related to the repurchase/early redemption of notes. In the three months and year
ended December 31, 2016, this item included the charge of $22 million and $60 million, respectively, related to the repurchase of notes. In the year ended December 31, 2016, this item also included the payment of the European Commission settlement.
18
CNH INDUSTRIAL N.V.
Other Supplemental Financial Information
(Unaudited)
CNH INDUSTRIAL Reconciliation of Adjusted net income and Adjusted income tax (expense) to Net income (loss) and Income tax (expense) and calculation of Adjusted diluted EPS and Adjusted ETR under U.S.GAAP ($ million, except per share data)
Year Ended December 31,
Three Months Ended December 31,
2017 2016 2017 2016
313 (249) Net income (loss) (40) 96
249 689
Adjustments impacting Income (loss) before income tax (expense) and equity in income of unconsolidated subsidiaries and affiliates (a) 116 69
107 33 Adjustments impacting Income tax (expense) (b) 121 51
- 9 Adjustments impacting Equity in income of unconsolidated
subsidiaries and affiliates (c) - (19)
669 482 Adjusted net income 197 197
651 478 Adjusted net income attributable to CNH Industrial N.V. 191 195
1,367 1,364 Weighted average shares outstanding – diluted (million) 1,367 1,364
0.48 0.35 Adjusted diluted EPS ($) 0.14 0.14
680 (9) Income (loss) before income tax (expense) and equity in
income of unconsolidated subsidiaries and affiliates 168 162
249 689
Adjustments impacting Income (loss) before income tax (expense) and equity in income of unconsolidated subsidiaries and affiliates (a) 116 69
929 680
Adjusted income (loss) before income tax (expense) and equity in income of unconsolidated subsidiaries and affiliates (A) 284 231
(455) (298) Income tax (expense) (230) (119)
107 33 Adjustments impacting Income tax (expense) (b) 121 51
(348) (265) Adjusted income tax (expense) (B) (109) (68)
37% 39% Adjusted Effective Tax Rate (Adjusted ETR) (C=B/A) 38% 29%
a) Adjustments impacting Income (loss) before income tax (expense) and equity in income of unconsolidated subsidiaries and affiliates
93 44 Restructuring expenses 16 13
92 34 Venezuelan re-measurement and impairment of assets, and 2017
year-end deconsolidation of Venezuelan operations 92 34
- 551 European Commission settlement - -
64 60 Cost of repurchase/early redemption of notes 8 22
249 689 Total 116 69
b) Adjustments impacting Income tax (expense)
(16) (26)
Tax effect of adjustments impacting Income (loss) before income tax (expense) and equity in income of unconsolidated subsidiaries and affiliates (2) (8)
123 - Tax charges due to the U.S. Act and tax legislation changes in the
UK and certain other countries(1) 123 -
- 59 Tax charge on LATAM corporate reorganization - 59
107 33 Total 121 51
c) Adjustments impacting Equity in income of unconsolidated subsidiaries and affiliates
- 9 Chinese JVs restructuring - (19)
- 9 Total - (19)
(1) This item includes the estimated impact from the U.S. Act. This estimate may change, potentially materially, as a result of regulations or regulatory guidance that may be issued, changes in interpretations affecting assumptions underlying the estimate, refinement of our calculations, and actions that may be taken, including actions in response to the U.S. Act.
19
CNH INDUSTRIAL N.V.
Other Supplemental Financial Information
(Unaudited)
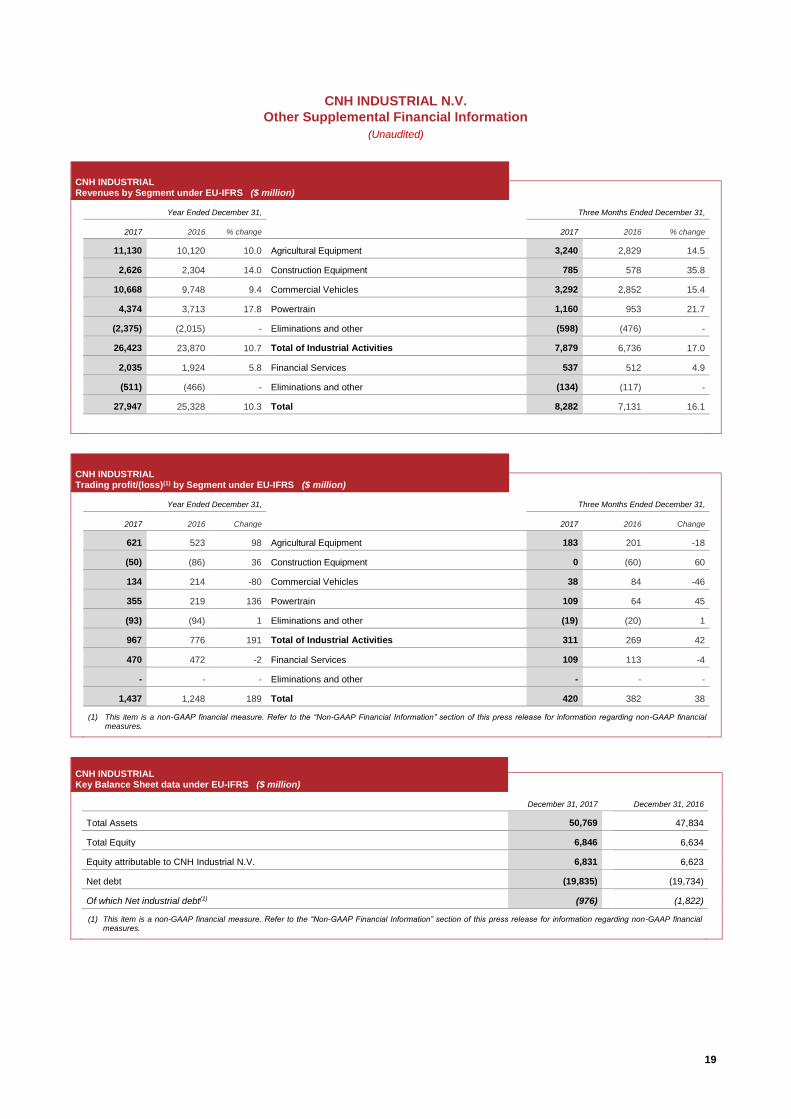
CNH INDUSTRIAL Revenues by Segment under EU-IFRS ($ million)
Year Ended December 31, Three Months Ended December 31,
2017 2016 % change 2017 2016 % change
11,130 10,120 10.0 Agricultural Equipment 3,240 2,829 14.5
2,626 2,304 14.0 Construction Equipment 785 578 35.8
10,668 9,748 9.4 Commercial Vehicles 3,292 2,852 15.4
4,374 3,713 17.8 Powertrain 1,160 953 21.7
(2,375) (2,015) - Eliminations and other (598) (476) -
26,423 23,870 10.7 Total of Industrial Activities 7,879 6,736 17.0
2,035 1,924 5.8 Financial Services 537 512 4.9
(511) (466) - Eliminations and other (134) (117) -
27,947 25,328 10.3 Total 8,282 7,131 16.1
CNH INDUSTRIAL Trading profit/(loss)(1) by Segment under EU-IFRS ($ million)
Year Ended December 31, Three Months Ended December 31,
2017 2016 Change 2017 2016 Change
621 523 98 Agricultural Equipment 183 201 -18
(50) (86) 36 Construction Equipment 0 (60) 60
134 214 -80 Commercial Vehicles 38 84 -46
355 219 136 Powertrain 109 64 45
(93) (94) 1 Eliminations and other (19) (20) 1
967 776 191 Total of Industrial Activities 311 269 42
470 472 -2 Financial Services 109 113 -4
- - - Eliminations and other - - -
1,437 1,248 189 Total 420 382 38
(1) This item is a non-GAAP financial measure. Refer to the “Non-GAAP Financial Information” section of this press release for information regarding non-GAAP financial measures.
CNH INDUSTRIAL Key Balance Sheet data under EU-IFRS ($ million)
December 31, 2017 December 31, 2016
Total Assets 50,769 47,834
Total Equity 6,846 6,634
Equity attributable to CNH Industrial N.V. 6,831 6,623
Net debt (19,835) (19,734)
Of which Net industrial debt(1) (976) (1,822)
(1) This item is a non-GAAP financial measure. Refer to the “Non-GAAP Financial Information” section of this press release for information regarding non-GAAP financial measures.
20
CNH INDUSTRIAL N.V.
Other Supplemental Financial Information
(Unaudited)
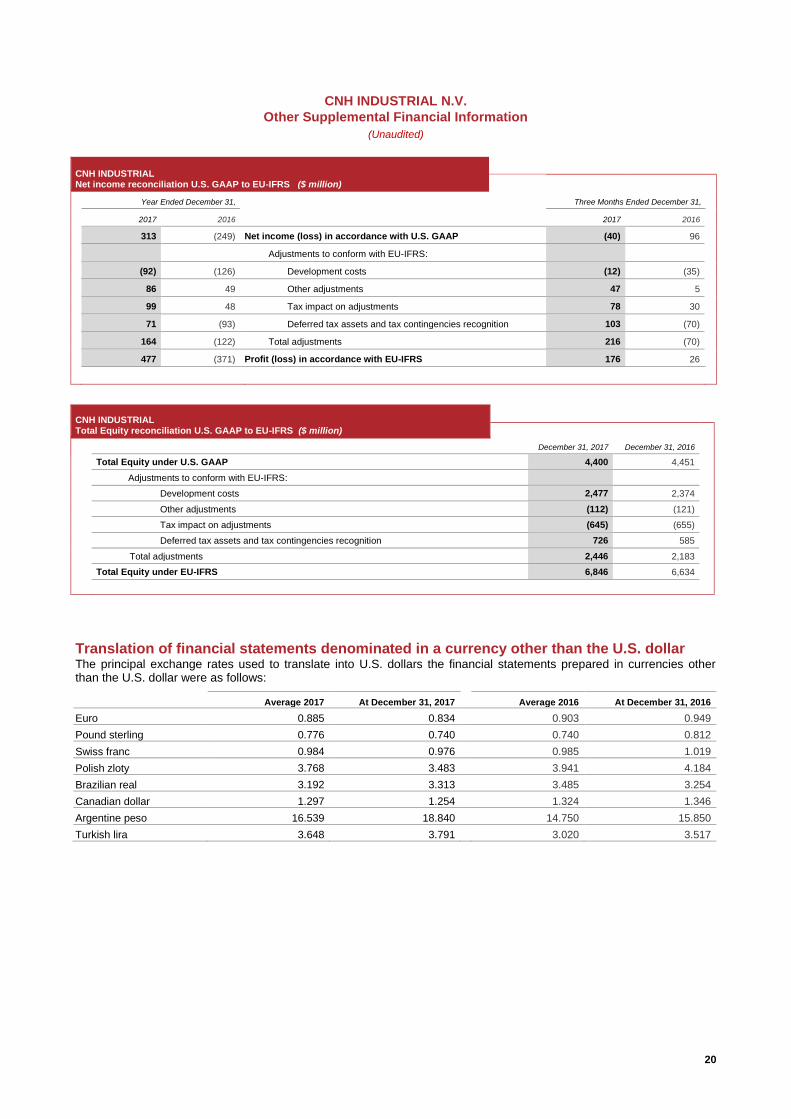
CNH INDUSTRIAL Net income reconciliation U.S. GAAP to EU-IFRS ($ million)
Year Ended December 31, Three Months Ended December 31,
2017 2016 2017 2016
313 (249) Net income (loss) in accordance with U.S. GAAP (40) 96
Adjustments to conform with EU-IFRS:
(92) (126) Development costs (12) (35)
86 49 Other adjustments 47 5
99 48 Tax impact on adjustments 78 30
71 (93) Deferred tax assets and tax contingencies recognition 103 (70)
164 (122) Total adjustments 216 (70)
477 (371) Profit (loss) in accordance with EU-IFRS 176 26
CNH INDUSTRIAL Total Equity reconciliation U.S. GAAP to EU-IFRS ($ million)
December 31, 2017 December 31, 2016
Total Equity under U.S. GAAP 4,400 4,451
Adjustments to conform with EU-IFRS:
Development costs 2,477 2,374
Other adjustments (112) (121)
Tax impact on adjustments (645) (655)
Deferred tax assets and tax contingencies recognition 726 585
Total adjustments 2,446 2,183
Total Equity under EU-IFRS 6,846 6,634
Translation of financial statements denominated in a currency other than the U.S. dollar The principal exchange rates used to translate into U.S. dollars the financial statements prepared in currencies other than the U.S. dollar were as follows:
Average 2017 At December 31, 2017 Average 2016 At December 31, 2016
Euro 0.885 0.834 0.903 0.949
Pound sterling 0.776 0.740 0.740 0.812
Swiss franc 0.984 0.976 0.985 1.019
Polish zloty 3.768 3.483 3.941 4.184
Brazilian real 3.192 3.313 3.485 3.254
Canadian dollar 1.297 1.254 1.324 1.346
Argentine peso 16.539 18.840 14.750 15.850
Turkish lira 3.648 3.791 3.020 3.517

21
CNH INDUSTRIAL N.V.
Condensed Consolidated Income Statement
For The Three Months and The Years Ended December 31, 2017 and 2016
(Unaudited)
(EU-IFRS)
Three Months Ended December 31, Years Ended December 31,
($ million) 2017 2016 2017 2016
Net revenues 8,282 7,131 27,947 25,328
Cost of sales(1) 6,859 5,900 23,064 20,866
Selling, general and administrative costs 621 541 2,230 2,129
Research and development costs 338 292 1,098 1,017
Other income/(expenses) (44) (16) (118) (68)
TRADING PROFIT/(LOSS) 420 382 1,437 1,248
Gains/(losses) on the disposal of investments - 1 - 1
Restructuring costs 15 12 91 43
Other unusual income/(expenses)(2) (63) (8) (55) (568)
OPERATING PROFIT/(LOSS) 342 363 1,291 638
Financial income/(expenses)(3) (143) (230) (626) (713)
Result from investments(4): 26 52 97 47
Share of the profit/(loss) of investees accounted for using the equity method 26 58 97 53
Other income/(expenses) from investments - (6) - (6)
PROFIT/(LOSS) BEFORE TAXES 225 185 762 (28)
Income tax (expense)(5) (49) (159) (285) (343)
PROFIT/(LOSS) FROM CONTINUING OPERATIONS 176 26 477 (371)
PROFIT/(LOSS) 176 26 477 (371)
PROFIT/(LOSS) ATTRIBUTABLE TO:
Owners of the parent 170 26 460 (373)
Non-controlling interests 6 - 17 2
(in $)
BASIC EARNINGS/(LOSS) PER COMMON SHARE 0.13 0.02 0.34 (0.27)
DILUTED EARNINGS/(LOSS) PER COMMON SHARE 0.13 0.02 0.34 (0.27)
Notes:
(1) In the three months and year ended December 31, 2017, Cost of sales includes the charge of $8 million related to the early redemption of notes. (2) In the three months and year ended December 31, 2017, Other unusual income/(expenses) includes a non-cash charge of $50 million due to the
deconsolidation of the Venezuelan operations effective December 31, 2017. In the year ended December 31, 2016, this item included the non-recurring charge of $551 million related to the European Commission settlement.
(3) In the year ended December 31, 2017, Financial income/(expenses) includes the charge of $56 million related to the repurchase/early redemption of notes. In the three months and year ended December 31, 2016, this item included the charge of $22 million and $60 million, respectively,
related to the repurchase of notes, as well as the non-recurring charge of $34 million due to the re-measurement and impairment of certain assets in Venezuela.
(4) In the three months and year ended December 31, 2016, Result from investments included a net positive impact of $15 million and a net negative impact of $27 million, respectively, due to the restructuring of our joint ventures in China.
(5) In the three months and year ended December 31, 2017, Income tax (expense) includes a non-cash tax benefit of $22 million due to the U.S. Act and tax legislation changes in the UK and certain other countries. In the three months and year ended December 31, 2016, this item included a non-cash tax charge of $74 million accounted for in connection with the reorganization of Latin American operations, intended to simplify corporate structure and promote operational efficiencies, and including changes in valuation allowances recorded against deferred tax assets in the region.
22
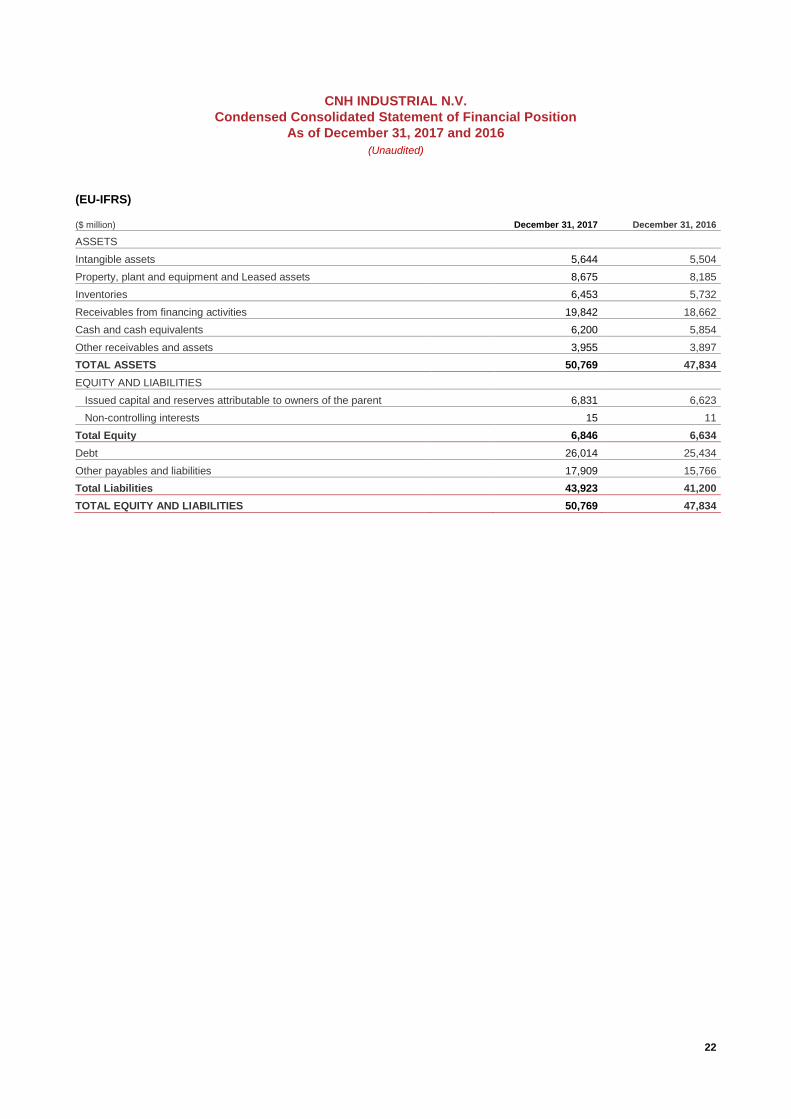
CNH INDUSTRIAL N.V.
Condensed Consolidated Statement of Financial Position
As of December 31, 2017 and 2016
(Unaudited)
(EU-IFRS)
($ million) December 31, 2017 December 31, 2016
ASSETS
Intangible assets 5,644 5,504
Property, plant and equipment and Leased assets 8,675 8,185
Inventories 6,453 5,732
Receivables from financing activities 19,842 18,662
Cash and cash equivalents 6,200 5,854
Other receivables and assets 3,955 3,897
TOTAL ASSETS 50,769 47,834
EQUITY AND LIABILITIES
Issued capital and reserves attributable to owners of the parent 6,831 6,623
Non-controlling interests 15 11
Total Equity 6,846 6,634
Debt 26,014 25,434
Other payables and liabilities 17,909 15,766
Total Liabilities 43,923 41,200
TOTAL EQUITY AND LIABILITIES 50,769 47,834
23
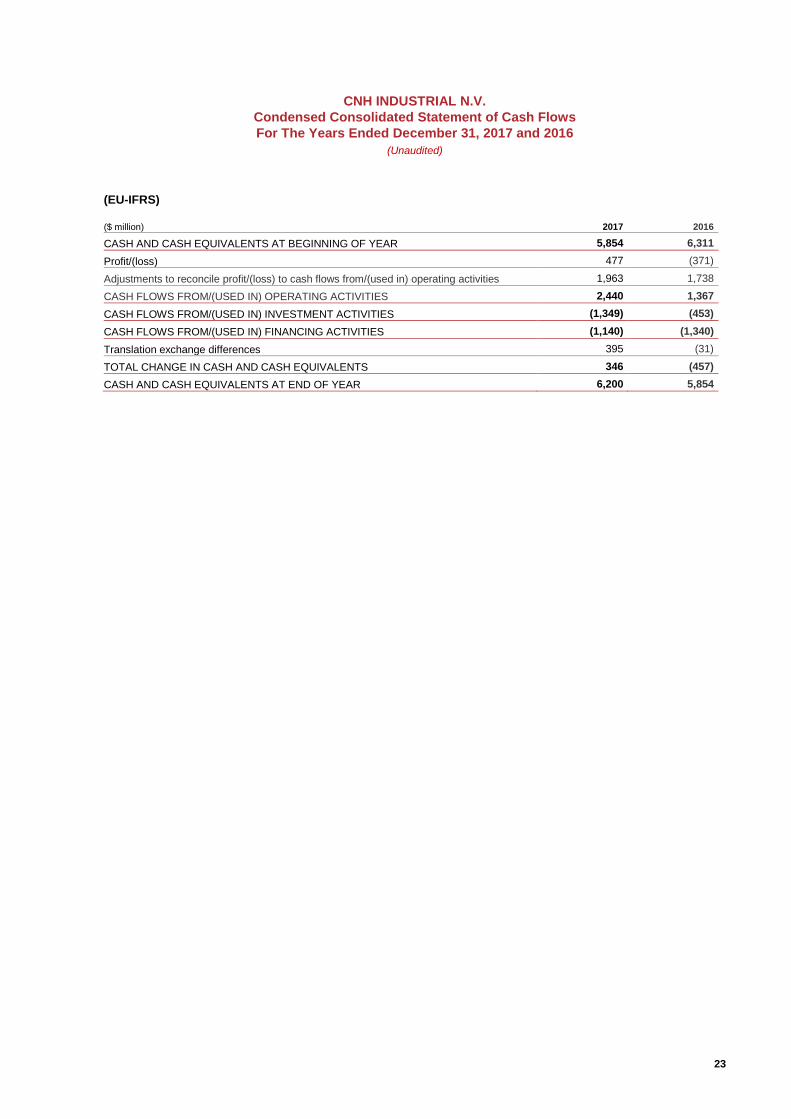
CNH INDUSTRIAL N.V.
Condensed Consolidated Statement of Cash Flows
For The Years Ended December 31, 2017 and 2016
(Unaudited)
(EU-IFRS)
($ million) 2017 2016
CASH AND CASH EQUIVALENTS AT BEGINNING OF YEAR 5,854 6,311
Profit/(loss) 477 (371)
Adjustments to reconcile profit/(loss) to cash flows from/(used in) operating activities 1,963 1,738
CASH FLOWS FROM/(USED IN) OPERATING ACTIVITIES 2,440 1,367
CASH FLOWS FROM/(USED IN) INVESTMENT ACTIVITIES (1,349) (453)
CASH FLOWS FROM/(USED IN) FINANCING ACTIVITIES (1,140) (1,340)
Translation exchange differences 395 (31)
TOTAL CHANGE IN CASH AND CASH EQUIVALENTS 346 (457)
CASH AND CASH EQUIVALENTS AT END OF YEAR 6,200 5,854