2017 EU-wide Transparency Exercise · Round_3 Master_version_2015 TRA Templates 26102015Bank Name...
16
ound_3 5 TRA Bank Name Banco Bilbao Vizcaya Argentaria, SA LEI Code K8MS7FD7N5Z2WQ51AZ71 Country Code ES Ba 2017 EU-wide Transparency Exercise
Transcript of 2017 EU-wide Transparency Exercise · Round_3 Master_version_2015 TRA Templates 26102015Bank Name...

Round_3
Master_version_2015 TRA Templates 26102015Bank Name Banco Bilbao Vizcaya Argentaria, SA
LEI Code K8MS7FD7N5Z2WQ51AZ71
Country Code ES
Ba
2017 EU-wide Transparency Exercise

201612 201706
(mln EUR, %)As of 31/12/2016 As of 30/06/2017 COREP CODE REGULATION
A OWN FUNDS 58,893 57,835 C 01.00 (r010,c010) Articles 4(118) and 72 of CRR
A.1COMMON EQUITY TIER 1 CAPITAL (net of deductions and after applying
transitional adjustments)47,370 43,888 C 01.00 (r020,c010) Article 50 of CRR
A.1.1Capital instruments eligible as CET1 Capital (including share premium and net own capital
instruments)26,993 26,936 C 01.00 (r030,c010) Articles 26(1) points (a) and (b), 27 to 29, 36(1) point (f) and 42 of CRR
A.1.2 Retained earnings 22,859 21,269 C 01.00 (r130,c010) Articles 26(1) point (c), 26(2) and 36 (1) points (a) and (l) of CRR
A.1.3 Accumulated other comprehensive income -2,700 -1,486 C 01.00 (r180,c010) Articles 4(100), 26(1) point (d) and 36 (1) point (l) of CRR
A.1.4 Other Reserves 0 0 C 01.00 (r200,c010) Articles 4(117) and 26(1) point (e) of CRR
A.1.5 Funds for general banking risk 0 0 C 01.00 (r210,c010) Articles 4(112), 26(1) point (f) and 36 (1) point (l) of CRR
A.1.6 Minority interest given recognition in CET1 capital 6,328 5,215 C 01.00 (r230,c010) Article 84 of CRR
A.1.7 Adjustments to CET1 due to prudential filters -452 -485 C 01.00 (r250,c010) Articles 32 to 35 of and 36 (1) point (l) of CRR
A.1.8 (-) Intangible assets (including Goodwill) -9,459 -8,768 C 01.00 (r300,c010) + C 01.00 (r340,c010) Articles 4(113), 36(1) point (b) and 37 of CRR. Articles 4(115), 36(1) point (b) and 37 point (a) of
CCR
A.1.9(-) DTAs that rely on future profitability and do not arise from temporary differences net of
associated DTLs -1,093 -1,189 C 01.00 (r370,c010) Articles 36(1) point (c) and 38 of CRR
A.1.10 (-) IRB shortfall of credit risk adjustments to expected losses 0 0 C 01.00 (r380,c010) Articles 36(1) point (d), 40 and 159 of CRR
A.1.11 (-) Defined benefit pension fund assets 0 0 C 01.00 (r390,c010) Articles 4(109), 36(1) point (e) and 41 of CRR
A.1.12 (-) Reciprocal cross holdings in CET1 Capital 0 0 C 01.00 (r430,c010) Articles 4(122), 36(1) point (g) and 44 of CRR
A.1.13 (-) Excess deduction from AT1 items over AT1 Capital 0 0 C 01.00 (r440,c010) Article 36(1) point (j) of CRR
A.1.14 (-) Deductions related to assets which can alternatively be subject to a 1.250% risk weight -78 -66C 01.00 (r450,c010) + C 01.00 (r460,c010) +
C 01.00 (r470,c010) + C 01.00 (r471,c010)+
C 01.00 (r472,c010)
Articles 4(36), 36(1) point (k) (i) and 89 to 91 of CRR; Articles 36(1) point (k) (ii), 243(1) point (b),
244(1) point (b) and 258 of CRR; Articles 36(1) point k) (iii) and 379(3) of CRR; Articles 36(1)
point k) (iv) and 153(8) of CRR and Articles 36(1) point k) (v) and 155(4) of CRR.
A.1.14.1 Of which: from securitisation positions (-) -62 -50 C 01.00 (r460,c010) Articles 36(1) point (k) (ii), 243(1) point (b), 244(1) point (b) and 258 of CRR
A.1.15(-) Holdings of CET1 capital instruments of financial sector entities where the institiution does
not have a significant investment0 0 C 01.00 (r480,c010) Articles 4(27), 36(1) point (h); 43 to 46, 49 (2) and (3) and 79 of CRR
A.1.16 (-) Deductible DTAs that rely on future profitability and arise from temporary differences 0 0 C 01.00 (r490,c010) Articles 36(1) point (c) and 38; Articles 48(1) point (a) and 48(2) of CRR
A.1.17(-) Holdings of CET1 capital instruments of financial sector entities where the institiution has a
significant investment0 0 C 01.00 (r500,c010) Articles 4(27); 36(1) point (i); 43, 45; 47; 48(1) point (b); 49(1) to (3) and 79 of CRR
A.1.18 (-) Amount exceding the 17.65% threshold 0 0 C 01.00 (r510,c010) Article 48 of CRR
A.1.19 (-) Additional deductions of CET1 Capital due to Article 3 CRR 0 0 C 01.00 (r524,c010) Article 3 CRR
A.1.20 CET1 capital elements or deductions - other 0 0 C 01.00 (r529,c010) -
A.1.21 Transitional adjustments 4,971 2,463 CA1 {1.1.1.6 + 1.1.1.8 + 1.1.1.26} -
A.1.21.1 Transitional adjustments due to grandfathered CET1 Capital instruments (+/-) 0 0 C 01.00 (r220,c010) Articles 483(1) to (3), and 484 to 487 of CRR
A.1.21.2 Transitional adjustments due to additional minority interests (+/-) 642 305 C 01.00 (r240,c010) Articles 479 and 480 of CRR
A.1.21.3 Other transitional adjustments to CET1 Capital (+/-) 4,329 2,158 C 01.00 (r520,c010) Articles 469 to 472, 478 and 481 of CRR
A.2 ADDITIONAL TIER 1 CAPITAL (net of deductions and after transitional adjustments) 2,713 4,596 C 01.00 (r530,c010) Article 61 of CRR
A.2.1 Additional Tier 1 Capital instruments 6,061 6,307 C 01.00 (r540,c010) + C 01.00 (r670,c010)
A.2.2 (-) Excess deduction from T2 items over T2 capital 0 0 C 01.00 (r720,c010)
A.2.3 Other Additional Tier 1 Capital components and deductions 0 0C 01.00 (r690,c010) + C 01.00 (r700,c010) +
C 01.00 (r710,c010) + C 01.00 (r740,c010) +
C 01.00 (r744,c010) + C 01.00 (r748,c010)
A.2.4 Additional Tier 1 transitional adjustments -3,347 -1,711C 01.00 (r660,c010) + C 01.00 (r680,c010) +
C 01.00 (r730,c010)
A.3 TIER 1 CAPITAL (net of deductions and after transitional adjustments) 50,083 48,484 C 01.00 (r015,c010) Article 25 of CRR
A.4 TIER 2 CAPITAL (net of deductions and after transitional adjustments) 8,810 9,351 C 01.00 (r750,c010) Article 71 of CRR
A.4.1 Tier 2 Capital instruments 8,200 8,514 C 01.00 (r760,c010) + C 01.00 (r890,c010)
A.4.2 Other Tier 2 Capital components and deductions 538 609
C 01.00 (r910,c010) + C 01.00 (r920,c010) +
C 01.00 (r930,c010) + C 01.00 (r940,c010) +
C 01.00 (r950,c010) + C 01.00 (r970,c010) +
C 01.00 (r974,c010) + C 01.00 (r978,c010)
A.4.3 Tier 2 transitional adjustments 71 229C 01.00 (r880,c010) + C 01.00 (r900,c010) +
C 01.00 (r960,c010)
B TOTAL RISK EXPOSURE AMOUNT 388,951 373,265 C 02.00 (r010,c010) Articles 92(3), 95, 96 and 98 of CRR
B.1 Of which: Transitional adjustments included 0 0 C 05.01 (r010;c040)
C.1 COMMON EQUITY TIER 1 CAPITAL RATIO (transitional period) 12.18% 11.76% CA3 {1} -
C.2 TIER 1 CAPITAL RATIO (transitional period) 12.88% 12.99% CA3 {3} -
C.3 TOTAL CAPITAL RATIO (transitional period) 15.14% 15.49% CA3 {5} -
CET1 Capital
Fully loadedD COMMON EQUITY TIER 1 CAPITAL (fully loaded) 42,398 41,425
[A.1-A.1.13-A.1.21+MIN(A.2+A.1.13-
A.2.2-A.2.4+MIN(A.4+A.2.2-A.4.3,0),0)]-
CET1 RATIO (%)
Fully loaded1 E COMMON EQUITY TIER 1 CAPITAL RATIO (fully loaded) 10.90% 11.10% [D.1]/[B-B.1] -
(1) Fully loaded CET1 capital ratio estimation based on the formulae stated in column “COREP CODE”
2017 EU-wide Transparency Exercise
Capital
Banco Bilbao Vizcaya Argentaria, SA
OWN FUNDS
Transitional period
OWN FUNDS
REQUIREMENTS
CAPITAL RATIOS (%)
Transitional period

201612 201706
(mln EUR, %)
As of
31/12/2016
As of
30/06/2017COREP CODE REGULATION
A.1 Tier 1 capital - transitional definition 50,083 48,484 C 47.00 (r320,c010)
A.2 Tier 1 capital - fully phased-in definition 48,459 47,733 C 47.00 (r310,c010)
B.1 Total leverage ratio exposures - using a transitional definition of Tier 1 capital 747,216 711,011 C 47.00 (r300,c010)
B.2 Total leverage ratio exposures - using a fully phased-in definition of Tier 1 capital 746,706 710,625 C 47.00 (r290,c010)
C.1 Leverage ratio - using a transitional definition of Tier 1 capital 6.7% 6.8% C 47.00 (r340,c010)
C.2 Leverage ratio - using a fully phased-in definition of Tier 1 capital 6.5% 6.7% C 47.00 (r330,c010)
2017 EU-wide Transparency ExerciseLeverage ratio
Banco Bilbao Vizcaya Argentaria, SA
Article 429 of the CRR; Delegated Regulation (EU) 2015/62 of 10 October 2014 amending
CRR

201612 201706
(mln EUR)
As of
31/12/2016as of 30/06/2017
Risk exposure amounts for credit risk 335,937 321,139
Risk exposure amount for securitisation and re-securitisations in the banking book 1,477 1,951
Risk exposure amount for contributions to the default fund of a CCP 93 65
Risk exposure amount Other credit risk 334,367 319,124
Risk exposure amount for position, foreign exchange and commodities (Market risk) 16,370 16,810
of which: Risk exposure amount for securitisation and re-securitisations in the trading book1 81 115
Risk exposure amount for Credit Valuation Adjustment 2,321 2,101
Risk exposure amount for operational risk 34,323 33,215
Other risk exposure amounts 0 0
Total Risk Exposure Amount 388,951 373,265
(1)
May include hedges, which are not securitisation positions, as per Article 338.3 of CRR
2017 EU-wide Transparency Exercise
Risk exposure amounts
Banco Bilbao Vizcaya Argentaria, SA
201612 201706
(mln EUR)
Interest income 27,489 14,057
Of which debt securities income 4,590 2,055
Of which loans and advances income 22,010 11,494
Interest expenses 10,786 5,441
(Of which deposits expenses) 7,367 3,796
(Of which debt securities issued expenses) 2,351 1,115
(Expenses on share capital repayable on demand) 0 0
Dividend income 461 209
Net Fee and commission income 5,033 2,567
Gains or (-) losses on derecognition of financial assets and liabilities not measured at fair value through profit or loss, and of non financial
assets, net1,317 637
Gains or (-) losses on financial assets and liabilities held for trading, net 268 138
Gains or (-) losses on financial assets and liabilities designated at fair value through profit or loss, net 93 -97
Gains or (-) losses from hedge accounting, net -84 -193
Exchange differences [gain or (-) loss], net 466 541
Net other operating income /(expenses) -874 -379
TOTAL OPERATING INCOME, NET 23,382 12,039
(Administrative expenses) 11,176 5,485
(Depreciation) 1,393 697
(Provisions or (-) reversal of provisions) 1,181 351
(Commitments and guarantees given) 64 -81
(Other provisions) 1,116 432
Of which pending legal issues and tax litigation1 80
Of which restructuring1 0
(Impairment or (-) reversal of impairment on financial assets not measured at fair value through profit or loss) 3,811 1,942
(Loans and receivables) 3,596 1,950
(Held to maturity investments, AFS assets and financial assets measured at cost) 214 -7
(Impairment or (-) reversal of impairment of investments in subsidaries, joint ventures and associates and on non-financial assets) 510 53
(of which Goodwill) 0 4
Negative goodwill recognised in profit or loss 0 0
Share of the profit or (-) loss of investments in subsidaries, joint ventures and associates 1,038 456
Profit or (-) loss from non-current assets and disposal groups classified as held for sale not qualifying as discontinued operations -45 -19
PROFIT OR (-) LOSS BEFORE TAX FROM CONTINUING OPERATIONS 6,305 3,947
PROFIT OR (-) LOSS AFTER TAX FROM CONTINUING OPERATIONS 4,694 2,865
Profit or (-) loss after tax from discontinued operations 0 0
PROFIT OR (-) LOSS FOR THE YEAR 4,694 2,865
Of which attributable to owners of the parent 3,486 2,263 (1)
Information available only as of end of the year
2017 EU-wide Transparency ExerciseP&L
Banco Bilbao Vizcaya Argentaria, SA
As of 31/12/2016As of
30/06/2017
201612 201706 201612 201612 201612 201612 201612 201612 201612 201612 201612 201612 201706 201706 201706 201706 201706 201706 201706 201706 201706 201706
As of
31/12/2016
As of
30/06/2017
(mln EUR)
MULTIPLICATION
FACTOR (mc) x
AVERAGE OF
PREVIOUS 60
WORKING DAYS
(VaRavg)
PREVIOUS
DAY (VaRt-1)
MULTIPLICATION
FACTOR (ms) x
AVERAGE OF
PREVIOUS 60
WORKING DAYS
(SVaRavg)
LATEST
AVAILABLE
(SVaRt-1)
12 WEEKS
AVERAGE
MEASURE
LAST
MEASUREFLOOR
12 WEEKS
AVERAGE
MEASURE
LAST
MEASURE
MULTIPLICATION
FACTOR (mc) x
AVERAGE OF
PREVIOUS 60
WORKING DAYS
(VaRavg)
PREVIOUS
DAY (VaRt-1)
MULTIPLICATION
FACTOR (ms) x
AVERAGE OF
PREVIOUS 60
WORKING DAYS
(SVaRavg)
LATEST
AVAILABLE
(SVaRt-1)
12 WEEKS
AVERAGE
MEASURE
LAST
MEASUREFLOOR
12 WEEKS
AVERAGE
MEASURE
LAST
MEASURE
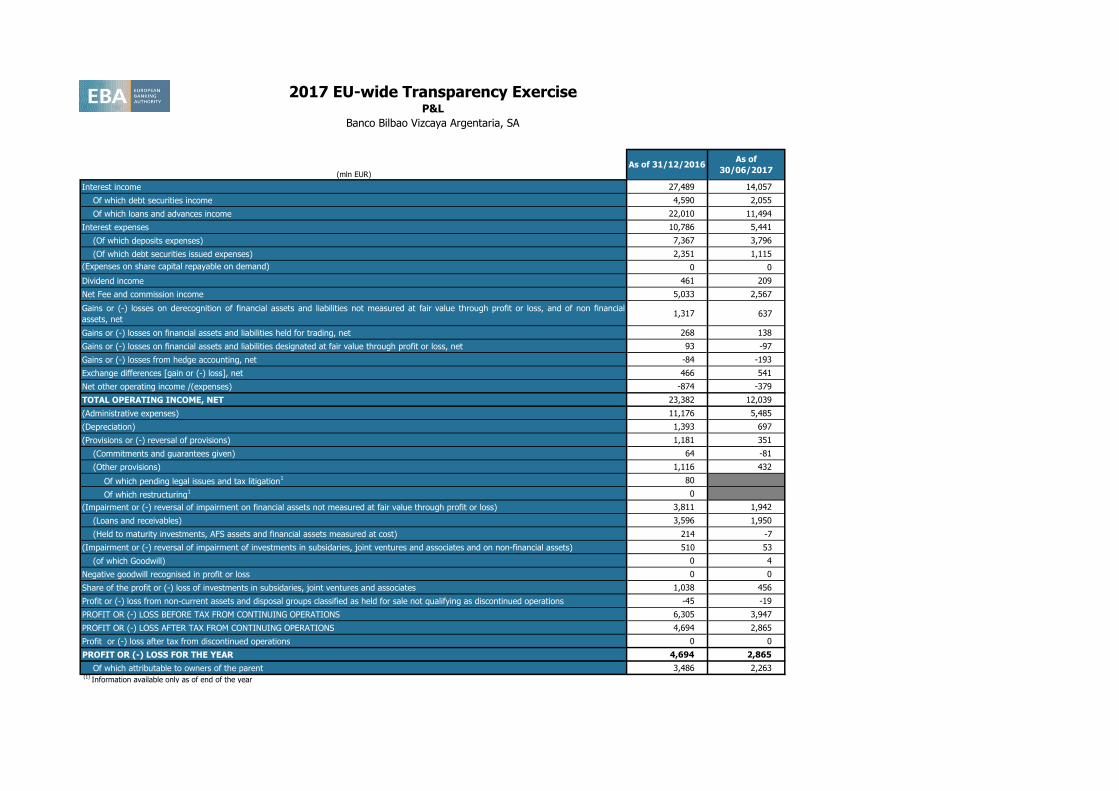
Traded Debt Instruments 2,718 2,722 217 81 359 106 211 75 351 112
Of which: General risk 2,370 2,218 152 63 275 87 159 56 223 67
Of which: Specific risk 348 504 65 18 84 19 52 18 129 45
Equities 177 82 132 50 165 53 168 43 224 68
Of which: General risk 99 47 132 50 165 53 168 43 224 68
Of which: Specific risk 78 35 0 0 0 0 0 0 0 0
Foreign exchange risk 4,041 5,999 64 15 68 17 76 23 85 26
Commodities risk 118 35 0 0 0 0 0 0 0 0
Total 7,054 8,839 240 84 353 115 147 124 0 0 0 9,258 192 64 323 98 111 120 0 0 0 7,935
2017 EU-wide Transparency ExerciseMarket Risk
Banco Bilbao Vizcaya Argentaria, SA
SA IM IM
TOTAL RISK
EXPOSURE
AMOUNT
TOTAL RISK
EXPOSURE
AMOUNT
VaR (Memorandum item)STRESSED VaR (Memorandum
item)
INCREMENTAL
DEFAULT AND
MIGRATION RISK
CAPITAL CHARGE
STRESSED VaR (Memorandum
item)
INCREMENTAL
DEFAULT AND
MIGRATION RISK
CAPITAL CHARGE
ALL PRICE RISKS CAPITAL
CHARGE FOR CTP
TOTAL RISK
EXPOSURE
AMOUNT
As of 31/12/2016 As of 30/06/2017
ALL PRICE RISKS CAPITAL
CHARGE FOR CTP
TOTAL RISK
EXPOSURE
AMOUNT
VaR (Memorandum item)
201612 201612 201612 201612 201706 201706 201706 201706
(mln EUR, %)
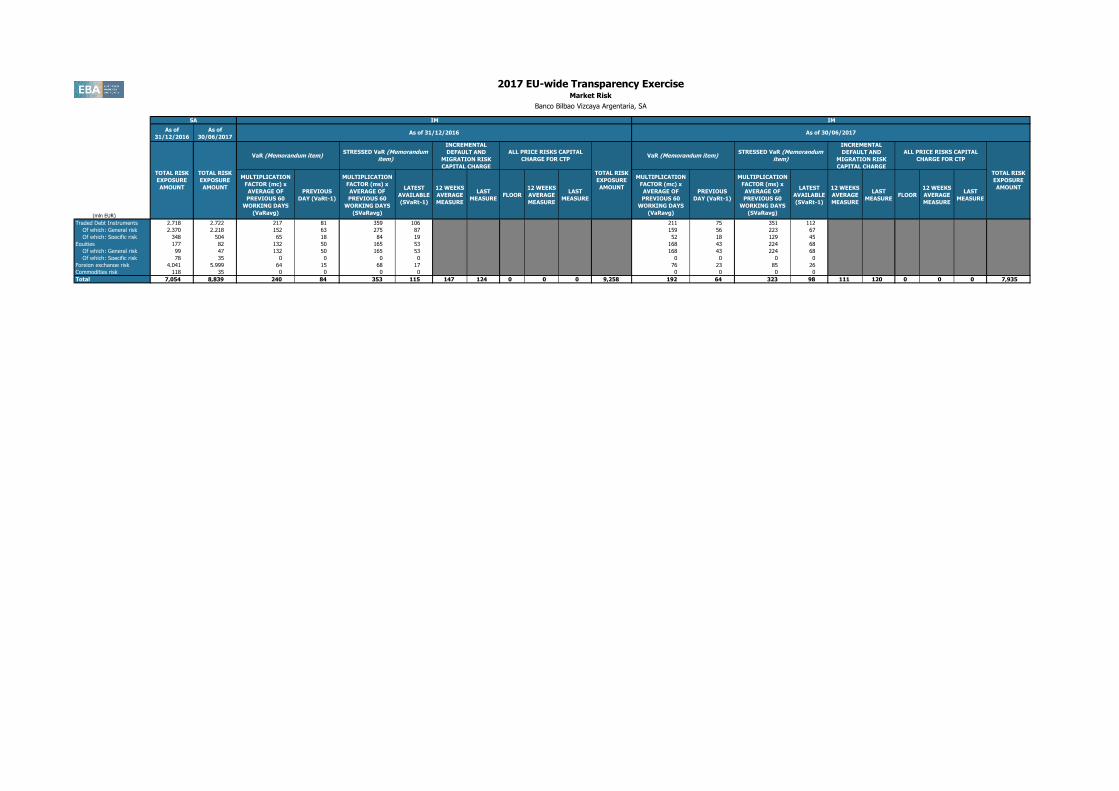
Central governments or central banks 112,153 133,925 30,106 121,540 139,279 31,880
Regional governments or local authorities 5,290 5,074 989 7,352 4,762 893
Public sector entities 5,474 3,097 941 2,462 2,556 828
Multilateral Development Banks 59 59 33 111 253 28
International Organisations 6 5 0 2 2 0
Institutions 34,785 19,136 6,370 28,419 17,261 5,622
Corporates 143,236 106,126 103,761 131,494 97,877 95,983
of which: SME 25,722 21,204 18,744 22,713 19,236 17,638
Retail 80,221 58,042 40,821 82,664 56,251 39,534
of which: SME 23,134 16,747 9,971 24,137 18,676 9,664
Secured by mortgages on immovable property 55,296 54,048 21,276 53,893 52,346 21,126
of which: SME 8,750 8,596 1,970 9,680 9,487 1,996
Exposures in default 10,112 4,991 5,807 4,906 9,991 4,640 5,551 5,005
Items associated with particularly high risk 1,678 1,462 2,193 2,698 2,641 3,962
Covered bonds 0 0 0 0 0 0
Claims on institutions and corporates with a ST credit assessment 406 406 87 240 238 52
Collective investments undertakings (CIU) 444 140 140 82 37 37
Equity 0 0 0 0 0 0
Securitisation 5,183 5,183 1,144 4,641 4,641 996
Other exposures 26,124 41,609 15,463 20,659 33,477 12,181
Standardised Total 480,465 433,302 229,131 9,130 466,251 416,261 218,673 9,172(1)
Original exposure, unlike Exposure value, is reported before taking into account any effect due to credit conversion factors or credit risk mitigation techniques (e.g. substitution effects).
1 (mln EUR, %)
Central governments or central banks 55,701 74,888 12,605 62,589 74,140 12,115
Regional governments or local authorities 694 692 71 585 567 0
Public sector entities 42 41 3 118 122 15
Multilateral Development Banks 0 0 0 0 143 0
International Organisations 0 0 0 0 0 0
Institutions 7,798 650 30 1,921 744 77
Corporates 6,797 6,000 5,695 9,032 10,009 9,755
of which: SME 1,521 1,217 1,073 1,491 2,388 956
Retail 13,508 6,750 4,582 13,851 6,569 4,381
of which: SME 6,194 4,785 2,390 6,570 5,042 2,554
Secured by mortgages on immovable property 6,957 6,806 2,622 6,157 6,026 2,656
of which: SME 3,745 3,661 811 3,939 4,073 357
Exposures in default 4,156 1,592 1,882 0 3,571 1,598 2,000 0
Items associated with particularly high risk 419 202 303 270 230 345
Covered bonds 0 0 0 0 0 0
Claims on institutions and corporates with a ST credit assessment 171 171 37 4 2 2
Collective investments undertakings (CIU) 96 18 18 27 2 2
Equity 0 0 0 0 0 0
Securitisation
Other exposures 12,047 12,174 8,319 5,022 4,960 3,530
Standardised Total2 2,834 2,700
(1) Original exposure, unlike Exposure value, is reported before taking into account any effect due to credit conversion factors or credit risk mitigation techniques (e.g. substitution effects).
(2) Total value adjustments and provisions per country of counterparty does not include Securistisation exposures
2 (mln EUR, %)
Central governments or central banks 11,552 14,826 1,867 12,763 16,289 2,050
Regional governments or local authorities 44 14 0 2,375 22 2
Public sector entities 2,513 182 37 42 22 9
Multilateral Development Banks 0 0 0 0 0 0
International Organisations 0 0 0 0 0 0
Institutions 7,939 3,083 802 10,801 3,432 1,048
Corporates 13,308 5,112 4,522 12,003 3,721 3,249
of which: SME 1,747 1,160 1,159 154 76 76
Retail 9,135 8,557 6,371 13,291 9,436 7,023
of which: SME 345 333 205 318 300 181
Secured by mortgages on immovable property 9,508 8,678 3,202 10,428 9,592 3,480
of which: SME 23 0 0 0 0 0
Exposures in default 628 419 419 0 921 436 445 0
Items associated with particularly high risk 444 444 666 480 480 721
Covered bonds 0 0 0 0 0 0
Claims on institutions and corporates with a ST credit assessment 0 0 0 0 0 0
Collective investments undertakings (CIU) 0 0 0 0 0 0
Equity 0 0 0 0 0 0
Securitisation
Other exposures 5,261 16,256 2,920 6,030 15,171 2,901
Standardised Total2 881 919
(1) Original exposure, unlike Exposure value, is reported before taking into account any effect due to credit conversion factors or credit risk mitigation techniques (e.g. substitution effects).
(2) Total value adjustments and provisions per country of counterparty does not include Securistisation exposures
3 (mln EUR, %)
Central governments or central banks 6,836 7,513 881 7,372 8,014 740
Regional governments or local authorities 4,304 4,160 832 4,115 3,959 792
Public sector entities 1,778 2,043 406 1,484 1,701 336
Multilateral Development Banks 3 3 0 13 13 0
International Organisations 0 0 0 0 0 0
Institutions 2,971 2,367 500 2,429 1,958 283
Corporates 52,877 39,370 39,016 45,755 34,913 34,669
of which: SME 6,516 5,301 5,301 4,762 4,139 4,139
Retail 15,601 8,487 5,993 14,816 7,949 5,617
of which: SME 3,021 1,505 1,128 2,860 1,406 1,054
Secured by mortgages on immovable property 11,355 11,321 4,222 10,251 10,220 3,825
of which: SME 2 2 1 1 1 1
Exposures in default 1,025 783 1,009 0 970 566 687 0
Items associated with particularly high risk 0 0 0 1,109 1,109 1,663
Covered bonds 0 0 0 0 0 0
Claims on institutions and corporates with a ST credit assessment 0 0 0 0 0 0
Collective investments undertakings (CIU) 287 63 63 48 28 28
Equity 0 0 0 0 0 0
Securitisation
Other exposures 1,872 2,073 1,368 1,733 1,879 1,331
Standardised Total2 925 801
(1) Original exposure, unlike Exposure value, is reported before taking into account any effect due to credit conversion factors or credit risk mitigation techniques (e.g. substitution effects).
(2) Total value adjustments and provisions per country of counterparty does not include Securistisation exposures
2017 EU-wide Transparency Exercise
Credit Risk - Standardised Approach
Banco Bilbao Vizcaya Argentaria, SA
Standardised Approach
As of 31/12/2016 As of 30/06/2017
Risk exposure
amount
Value
adjustments and
provisions
Consolidated data
Standardised Approach
As of 31/12/2016 As of 30/06/2017
Original
Exposure1
Exposure
Value1
Risk exposure
amount
Value
adjustments and
provisions
Original
Exposure1
Exposure
Value1
Risk exposure
amount
Value
adjustments and
provisions2
SPAIN
Standardised Approach
As of 31/12/2016 As of 30/06/2017
Original
Exposure1
Exposure
Value1
Risk exposure
amount
Value
adjustments and
provisions2
Original
Exposure1
Exposure
Value1
Risk exposure
amount
Value
adjustments and
provisions2
MEXICO
Standardised Approach
As of 31/12/2016 As of 30/06/2017
Original
Exposure1
Exposure
Value1
Risk exposure
amount
Value
adjustments and
provisions2
Original
Exposure1
Exposure
Value1
Risk exposure
amount
Value
adjustments and
provisions2
UNITED STATES
Original
Exposure1
Exposure
Value1
Risk exposure
amount
Value
adjustments and
provisions2
Original
Exposure1
Exposure
Value1

2017 EU-wide Transparency Exercise
Credit Risk - Standardised Approach
Banco Bilbao Vizcaya Argentaria, SA
4 (mln EUR, %)
Central governments or central banks 16,482 16,480 7,306 18,616 21,464 9,919
Regional governments or local authorities 6 0 0 6 0 0
Public sector entities 14 8 7 63 56 40
Multilateral Development Banks 0 0 0 0 0 0
International Organisations 0 0 0 0 0 0
Institutions 2,695 2,803 2,142 3,330 3,396 2,035
Corporates 36,262 30,303 29,884 32,967 25,997 25,643
of which: SME 10,731 9,238 6,924 10,602 8,027 7,866
Retail 19,707 16,781 11,346 20,306 15,916 10,801
of which: SME 9,342 6,942 3,967 10,255 8,800 3,634
Secured by mortgages on immovable property 9,676 9,670 4,343 10,400 10,056 4,724
of which: SME 4,236 4,232 823 5,093 4,801 1,347
Exposures in default 1,402 373 419 0 1,538 263 307 0
Items associated with particularly high risk 180 180 270 166 166 249
Covered bonds 0 0 0 0 0 0
Claims on institutions and corporates with a ST credit assessment 0 0 0 1 1 1
Collective investments undertakings (CIU) 0 0 0 0 0 0
Equity 0 0 0 0 0 0
Securitisation
Other exposures 2,177 2,747 1,345 1,900 2,455 1,252
Standardised Total2 2,050 2,236
(1) Original exposure, unlike Exposure value, is reported before taking into account any effect due to credit conversion factors or credit risk mitigation techniques (e.g. substitution effects).
(2) Total value adjustments and provisions per country of counterparty does not include Securistisation exposures
5 (mln EUR, %)
Central governments or central banks 153 160 54 82 82 2
Regional governments or local authorities 34 34 21 54 54 41
Public sector entities 0 6 0 0 7 0
Multilateral Development Banks 0 0 0 0 0 0
International Organisations 0 0 0 0 0 0
Institutions 2,614 1,786 323 1,871 1,123 259
Corporates 1,005 1,035 990 0 0 0
of which: SME 7 4 4 0 0 0
Retail 49 38 29 27 16 12
of which: SME 0 0 0 1 1 0
Secured by mortgages on immovable property 68 68 25 13 13 5
of which: SME 0 0 0 0 0 0
Exposures in default 0 0 0 0 0 0 0 0
Items associated with particularly high risk 0 0 0 0 0 0
Covered bonds 0 0 0 0 0 0
Claims on institutions and corporates with a ST credit assessment 0 0 0 0 0 0
Collective investments undertakings (CIU) 2 0 0 0 0 0
Equity 0 0 0 0 0 0
Securitisation
Other exposures 337 609 5 2,196 2,413 806
Standardised Total2 51 72
(1) Original exposure, unlike Exposure value, is reported before taking into account any effect due to credit conversion factors or credit risk mitigation techniques (e.g. substitution effects).
(2) Total value adjustments and provisions per country of counterparty does not include Securistisation exposures
6 (mln EUR, %)
Central governments or central banks 5,637 3,761 1,817 4,738 3,376 1,587
Regional governments or local authorities 34 34 17 36 35 18
Public sector entities 358 274 88 309 247 132
Multilateral Development Banks 16 15 17 31 30 15
International Organisations 0 0 0 0 0 0
Institutions 942 934 296 17 267 52
Corporates 9,260 7,941 7,829 7,938 6,791 6,649
of which: SME 2,100 1,877 1,877 1,709 1,493 1,493
Retail 3,969 3,258 2,205 3,634 2,983 2,024
of which: SME 1,834 1,336 1,002 1,651 1,196 897
Secured by mortgages on immovable property 4,377 4,253 1,749 4,287 4,165 1,702
of which: SME 0 0 0 0 0 0
Exposures in default 649 333 380 0 680 337 419 0
Items associated with particularly high risk 195 195 292 99 87 130
Covered bonds 0 0 0 0 0 0
Claims on institutions and corporates with a ST credit assessment 1 1 0 7 7 2
Collective investments undertakings (CIU) 0 0 0 0 0 0
Equity 0 0 0 0 0 0
Securitisation
Other exposures 1,154 1,400 359 1,140 1,221 463
Standardised Total2 680 707
(1) Original exposure, unlike Exposure value, is reported before taking into account any effect due to credit conversion factors or credit risk mitigation techniques (e.g. substitution effects).
(2) Total value adjustments and provisions per country of counterparty does not include Securistisation exposures
7 (mln EUR, %)
Central governments or central banks 991 1,008 454 1,119 1,138 364
Regional governments or local authorities 6 6 1 5 5 1
Public sector entities 155 122 24 78 72 14
Multilateral Development Banks 0 0 0 0 0 0
International Organisations 0 0 0 0 0 0
Institutions 2,143 2,126 417 1,844 1,832 356
Corporates 6,969 5,245 5,193 6,741 4,895 4,812
of which: SME 1,713 1,455 1,455 2,303 1,870 1,870
Retail 4,790 3,134 2,270 4,694 3,078 2,232
of which: SME 708 453 339 674 425 318
Secured by mortgages on immovable property 5,736 5,736 2,158 5,490 5,490 2,120
of which: SME 56 56 22 53 53 20
Exposures in default 677 579 764 0 608 510 709 0
Items associated with particularly high risk 175 175 263 256 256 384
Covered bonds 0 0 0 0 0 0
Claims on institutions and corporates with a ST credit assessment 216 216 46 210 210 44
Collective investments undertakings (CIU) 0 0 0 0 0 0
Equity 0 0 0 0 0 0
Securitisation
Other exposures 429 450 170 428 586 146
Standardised Total2 268 256
(1) Original exposure, unlike Exposure value, is reported before taking into account any effect due to credit conversion factors or credit risk mitigation techniques (e.g. substitution effects).
(2) Total value adjustments and provisions per country of counterparty does not include Securistisation exposures
Standardised Approach
As of 31/12/2016 As of 30/06/2017
Risk exposure
amount
Value
adjustments and
provisions2
TURKEY
Standardised Approach
As of 31/12/2016 As of 30/06/2017
Original
Exposure1
Exposure
Value1
Risk exposure
amount
Value
adjustments and
provisions2
Original
Exposure1
Exposure
Value1
Risk exposure
amount
Value
adjustments and
provisions2
FRANCE
Standardised Approach
As of 31/12/2016 As of 30/06/2017
Original
Exposure1
Exposure
Value1
Risk exposure
amount
Value
adjustments and
provisions2
Original
Exposure1
Exposure
Value1
Risk exposure
amount
Value
adjustments and
provisions2
PERU
Standardised Approach
As of 31/12/2016 As of 30/06/2017
Original
Exposure1
Exposure
Value1
Risk exposure
amount
Value
adjustments and
provisions2
Original
Exposure1
Exposure
Value1
Risk exposure
amount
Value
adjustments and
provisions2
CHILE
Original
Exposure1
Exposure
Value1
Risk exposure
amount
Value
adjustments and
provisions2
Original
Exposure1
Exposure
Value1

2017 EU-wide Transparency Exercise
Credit Risk - Standardised Approach
Banco Bilbao Vizcaya Argentaria, SA
8 (mln EUR, %)
Central governments or central banks 0 0 0 0 0 0
Regional governments or local authorities 0 0 0 0 0 0
Public sector entities 3 5 2 2 5 2
Multilateral Development Banks 0 0 0 12 12 0
International Organisations 0 0 0 0 0 0
Institutions 4,111 2,309 601 2,955 1,698 367
Corporates 690 572 529 1,246 1,060 1,058
of which: SME 31 25 25 554 505 505
Retail 224 213 178 222 212 159
of which: SME 1 1 1 2 1 1
Secured by mortgages on immovable property 150 150 64 152 151 69
of which: SME 8 8 3 8 8 3
Exposures in default 35 19 25 0 32 18 18 0
Items associated with particularly high risk 0 0 0 0 0 0
Covered bonds 0 0 0 0 0 0
Claims on institutions and corporates with a ST credit assessment 0 0 0 0 0 0
Collective investments undertakings (CIU) 0 0 0 0 0 0
Equity 0 0 0 0 0 0
Securitisation
Other exposures 1 1,766 0 0 1,272 0
Standardised Total2 32 32
(1) Original exposure, unlike Exposure value, is reported before taking into account any effect due to credit conversion factors or credit risk mitigation techniques (e.g. substitution effects).
(2) Total value adjustments and provisions per country of counterparty does not include Securistisation exposures
9 (mln EUR, %)
Central governments or central banks 1,267 1,655 840 1,498 1,859 912
Regional governments or local authorities 0 0 0 0 0 0
Public sector entities 270 267 230 243 233 197
Multilateral Development Banks 0 0 0 0 0 0
International Organisations 0 0 0 0 0 0
Institutions 428 401 47 469 441 121
Corporates 3,687 3,098 3,093 4,207 3,283 3,281
of which: SME 83 25 25 47 10 10
Retail 6,496 4,668 3,443 5,103 3,948 2,909
of which: SME 378 254 191 337 232 174
Secured by mortgages on immovable property 3,622 3,571 1,334 3,100 3,058 1,098
of which: SME 0 0 0 0 0 0
Exposures in default 455 338 347 0 641 424 473 0
Items associated with particularly high risk 266 266 399 318 314 470
Covered bonds 0 0 0 0 0 0
Claims on institutions and corporates with a ST credit assessment 0 0 0 0 0 0
Collective investments undertakings (CIU) 0 0 0 0 0 0
Equity 0 0 0 0 0 0
Securitisation
Other exposures 881 975 146 731 808 120
Standardised Total2 474 552
(1) Original exposure, unlike Exposure value, is reported before taking into account any effect due to credit conversion factors or credit risk mitigation techniques (e.g. substitution effects).
(2) Total value adjustments and provisions per country of counterparty does not include Securistisation exposures
10 (mln EUR, %)
Central governments or central banks 7,566 7,564 32 7,311 7,377 15
Regional governments or local authorities 0 0 0 0 0 0
Public sector entities 0 1 0 0 1 0
Multilateral Development Banks 0 0 0 0 0 0
International Organisations 0 0 0 0 0 0
Institutions 311 105 52 293 101 42
Corporates 90 75 75 160 149 149
of which: SME 54 49 49 122 116 116
Retail 3 3 2 3 2 2
of which: SME 0 0 0 0 0 0
Secured by mortgages on immovable property 10 10 4 9 9 4
of which: SME 0 0 0 0 0 0
Exposures in default 2 0 0 0 2 0 0 0
Items associated with particularly high risk 0 0 0 0 0 0
Covered bonds 0 0 0 0 0 0
Claims on institutions and corporates with a ST credit assessment 0 0 0 0 0 0
Collective investments undertakings (CIU) 0 0 0 0 0 0
Equity 0 0 0 0 0 0
Securitisation
Other exposures 8 87 8 8 81 745
Standardised Total2 5 6
(1) Original exposure, unlike Exposure value, is reported before taking into account any effect due to credit conversion factors or credit risk mitigation techniques (e.g. substitution effects).
(2) Total value adjustments and provisions per country of counterparty does not include Securistisation exposures
Standardised Approach
As of 31/12/2016 As of 30/06/2017
Risk exposure
amount
Value
adjustments and
provisions2
UNITED KINGDOM
Standardised Approach
As of 31/12/2016 As of 30/06/2017
Original
Exposure1
Exposure
Value1
Risk exposure
amount
Value
adjustments and
provisions2
Original
Exposure1
Exposure
Value1
Risk exposure
amount
Value
adjustments and
provisions2
COLOMBIA
Standardised Approach
As of 31/12/2016 As of 30/06/2017
Original
Exposure1
Exposure
Value1
Risk exposure
amount
Value
adjustments and
provisions2
Original
Exposure1
Exposure
Value1
Risk exposure
amount
Value
adjustments and
provisions2
ITALY
Original
Exposure1
Exposure
Value1
Risk exposure
amount
Value
adjustments and
provisions2
Original
Exposure1
Exposure
Value1

201612 201612 201612 201612 201612 201612 201706 201706 201706 201706 201706 201706
(mln EUR, %)
Of which:
defaulted
Of which:
defaulted
Of which:
defaulted
Of which:
defaulted
Central banks and central governments 5,580 309 6,606 552 7 78 5,163 115 6,037 705 1 12
Institutions 96,639 249 74,199 6,114 29 61 85,290 237 62,785 5,545 25 64
Corporates 141,294 8,415 109,707 60,983 2,167 5,279 136,792 7,918 105,249 58,059 2,004 4,801
Corporates - Of Which: Specialised Lending 11,186 290 10,677 9,710 0 166 10,461 327 10,080 9,244 0 158
Corporates - Of Which: SME 20,956 4,609 18,420 12,061 1,417 2,745 18,254 4,253 15,533 10,107 1,252 2,327
Retail 119,533 5,138 103,291 22,091 989 2,577 119,720 5,404 102,563 20,658 1,054 2,297
Retail - Secured on real estate property 88,849 4,423 83,894 10,690 924 1,595 85,997 4,598 81,671 8,794 977 1,171
Retail - Secured on real estate property - Of Which: SME 1 0 1 0 0 0 1 0 1 0 0 0
Retail - Secured on real estate property - Of Which: non-
SME
88,848 4,423 83,893 10,690 924 1,595 85,996 4,598 81,670 8,794 977 1,171
Retail - Qualifying Revolving 20,322 146 9,302 7,376 6 512 22,320 170 9,833 7,761 9 578
Retail - Other Retail 10,362 569 10,095 4,026 59 470 11,403 635 11,059 4,104 68 549
Retail - Other Retail - Of Which: SME 3,303 196 3,040 1,503 34 137 3,289 242 2,954 1,364 41 146
Retail - Other Retail - Of Which: non-SME 7,059 373 7,055 2,523 25 333 8,114 393 8,105 2,739 27 403
Equity 8,213 0 8,213 16,639 0 8,276 0 8,276 16,480 0
Securitisation 858 858 332 17 3,560 3,560 954 5
Other non credit-obligation assets 0 0
IRB Total 106,713 102,401(1)
Original exposure, unlike Exposure value, is reported before taking into account any effect due to credit conversion factors or credit risk mitigation techniques (e.g. substitution effects).
1 (mln EUR, %)
Of which:
defaulted
Of which:
defaulted
Of which:
defaulted
Of which:
defaulted
Central banks and central governments 755 7 799 164 0 0 990 0 610 309 0 0
Institutions 43,119 249 21,784 3,237 29 52 39,425 237 18,413 2,903 25 55
Corporates 62,750 8,046 50,455 29,160 2,125 4,932 61,628 7,154 47,043 28,672 1,915 4,297
Corporates - Of Which: Specialised Lending 3,790 118 3,605 3,462 0 145 3,800 107 3,634 3,569 0 103
Corporates - Of Which: SME 18,193 4,608 15,953 10,378 1,416 2,708 16,986 4,248 14,377 9,366 1,251 2,322
Retail 104,024 4,990 95,799 14,670 962 1,982 103,224 5,241 94,904 12,923 1,017 1,640
Retail - Secured on real estate property 88,197 4,401 83,263 10,465 902 1,591 85,354 4,576 81,046 8,606 948 1,166
Retail - Secured on real estate property - Of Which: SME 1 0 1 0 0 0 1 0 1 0 0 0
Retail - Secured on real estate property - Of Which: non-
SME
88,197 4,401 83,262 10,464 902 1,591 85,353 4,576 81,046 8,606 948 1,166
Retail - Qualifying Revolving 5,490 21 2,466 189 2 20 6,494 31 2,826 218 3 29
Retail - Other Retail 10,337 568 10,070 4,016 58 372 11,376 634 11,031 4,099 66 445
Retail - Other Retail - Of Which: SME 3,296 196 3,033 1,499 34 40 3,280 242 2,946 1,363 41 42
Retail - Other Retail - Of Which: non-SME 7,041 372 7,037 2,517 24 332 8,095 392 8,086 2,734 26 402
Equity 5,504 0 5,504 9,781 0 0 5,926 0 5,926 10,626 0 0
Securitisation
Other non credit-obligation assets
IRB Total(1)
Original exposure, unlike Exposure value, is reported before taking into account any effect due to credit conversion factors or credit risk mitigation techniques (e.g. substitution effects).
2 (mln EUR, %)
Of which:
defaulted
Of which:
defaulted
Of which:
defaulted
Of which:
defaulted
Central banks and central governments 780 0 860 151 0 1 662 0 586 121 0 2
Institutions 7 0 3 1 0 0 5 0 3 1 0 0
Corporates 18,380 152 16,533 10,039 37 114 21,023 183 18,817 11,416 49 144
Corporates - Of Which: Specialised Lending 2 0 2 1 0 0 2 0 2 1 0 0
Corporates - Of Which: SME 2,424 0 2,201 1,394 0 8 982 0 895 510 0 4
Retail 14,798 125 6,833 7,189 4 492 15,785 139 7,001 7,544 6 548
Retail - Secured on real estate property 12 0 12 3 0 0 12 0 12 3 0 0
Retail - Secured on real estate property - Of Which: SME 0 0 0 0 0 0 0 0 0 0 0 0
Retail - Secured on real estate property - Of Which: non-
SME
12 0 12 3 0 0 12 0 12 3 0 0
Retail - Qualifying Revolving 14,784 125 6,819 7,186 4 492 15,771 139 6,987 7,541 6 548
Retail - Other Retail 2 0 2 0 0 0 2 0 2 0 0 0
Retail - Other Retail - Of Which: SME 0 0 0 0 0 0 0 0 0 0 0 0
Retail - Other Retail - Of Which: non-SME 2 0 2 0 0 0 2 0 2 0 0 0
Equity 887 0 887 2,104 0 0 1,002 0 1,002 2,383 0 0
Securitisation
Other non credit-obligation assets
IRB Total(1)
Original exposure, unlike Exposure value, is reported before taking into account any effect due to credit conversion factors or credit risk mitigation techniques (e.g. substitution effects).
3 (mln EUR, %)
Of which:
defaulted
Of which:
defaulted
Of which:
defaulted
Of which:
defaulted
Central banks and central governments 2,255 0 2,363 30 0 0 2,097 0 2,163 19 0 0
Institutions 1,640 0 1,497 339 0 5 2,761 0 2,473 423 0 6
Corporates 13,530 0 9,165 4,049 0 63 11,119 96 7,367 2,857 8 74
Corporates - Of Which: Specialised Lending 392 0 355 368 0 2 343 9 338 318 0 3
Corporates - Of Which: SME 3 0 1 0 0 0 37 0 20 38 0 0
Retail 38 0 34 6 0 0 40 1 36 9 1 0
Retail - Secured on real estate property 33 0 32 6 0 0 35 0 33 8 1 0
Retail - Secured on real estate property - Of Which: SME 0 0 0 0 0 0 0 0 0 0 0 0
Retail - Secured on real estate property - Of Which: non-
SME
33 0 32 6 0 0 35 0 33 8 1 0
Retail - Qualifying Revolving 3 0 1 0 0 0 4 0 1 0 0 0
Retail - Other Retail 2 0 2 0 0 0 1 0 1 0 0 0
Retail - Other Retail - Of Which: SME 0 0 0 0 0 0 0 0 0 0 0 0
Retail - Other Retail - Of Which: non-SME 2 0 2 0 0 0 1 0 1 0 0 0
Equity 163 0 163 411 0 0 198 0 198 483 0 0
Securitisation
Other non credit-obligation assets
IRB Total(1)
Original exposure, unlike Exposure value, is reported before taking into account any effect due to credit conversion factors or credit risk mitigation techniques (e.g. substitution effects).
2017 EU-wide Transparency Exercise
Credit Risk - IRB Approach
Banco Bilbao Vizcaya Argentaria, SA
IRB Approach
As of 31/12/2016 As of 30/06/2017
Risk exposure amount Value
adjustments
and
provisions
Consolidated data
IRB Approach
As of 31/12/2016 As of 30/06/2017
Original Exposure1
Exposure
Value1
Risk exposure amount Value
adjustments
and
provisions
Original Exposure1
Exposure
Value1
Risk exposure amount Value
adjustments
and
provisions
SPAIN
IRB Approach
As of 31/12/2016 As of 30/06/2017
Original Exposure1
Exposure
Value1
Risk exposure amount Value
adjustments
and
provisions
Original Exposure1
Exposure
Value1
Risk exposure amount Value
adjustments
and
provisions
MEXICO
IRB Approach
As of 31/12/2016 As of 30/06/2017
Original Exposure1
Exposure
Value1
Risk exposure amount Value
adjustments
and
provisions
Original Exposure1
Exposure
Value1
Risk exposure amount Value
adjustments
and
provisions
UNITED STATES
Original Exposure1
Exposure
Value1
Risk exposure amount Value
adjustments
and
provisions
Original Exposure1
Exposure
Value1

2017 EU-wide Transparency Exercise
Credit Risk - IRB Approach
Banco Bilbao Vizcaya Argentaria, SA
4 (mln EUR, %)
Of which:
defaulted
Of which:
defaulted
Of which:
defaulted
Of which:
defaulted
Central banks and central governments 1 0 212 3 0 0 0 0 183 3 0 0
Institutions 16 0 8 5 0 0 14 0 7 4 0 0
Corporates 620 0 370 278 0 1 538 0 538 266 0 0
Corporates - Of Which: Specialised Lending 278 0 241 209 0 0 256 0 234 202 0 0
Corporates - Of Which: SME 18 0 1 0 0 0 0 0 0 0 0 0
Retail 1 0 0 1 0 0 1 0 0 0 0 0
Retail - Secured on real estate property 0 0 0 1 0 0 0 0 0 0 0 0
Retail - Secured on real estate property - Of Which: SME 0 0 0 0 0 0 0 0 0 0 0 0
Retail - Secured on real estate property - Of Which: non-
SME
0 0 0 1 0 0 0 0 0 0 0 0
Retail - Qualifying Revolving 0 0 0 0 0 0 0 0 0 0 0 0
Retail - Other Retail 0 0 0 0 0 0 0 0 0 0 0 0
Retail - Other Retail - Of Which: SME 0 0 0 0 0 0 0 0 0 0 0 0
Retail - Other Retail - Of Which: non-SME 0 0 0 0 0 0 0 0 0 0 0 0
Equity 160 0 160 386 0 0 163 0 163 396 0 0
Securitisation
Other non credit-obligation assets
IRB Total(1)
Original exposure, unlike Exposure value, is reported before taking into account any effect due to credit conversion factors or credit risk mitigation techniques (e.g. substitution effects).
5 (mln EUR, %)
Of which:
defaulted
Of which:
defaulted
Of which:
defaulted
Of which:
defaulted
Central banks and central governments 29 0 92 9 0 0 25 0 89 8 0 0
Institutions 24,518 0 24,228 448 0 3 16,851 0 16,439 376 0 2
Corporates 7,148 30 5,035 2,800 4 28 6,739 30 4,798 2,462 4 27
Corporates - Of Which: Specialised Lending 1,724 0 1,587 1,199 0 1 1,398 0 1,286 985 0 1
Corporates - Of Which: SME 140 1 131 157 1 2 63 1 63 61 0 1
Retail 42 2 37 13 2 0 42 2 38 13 2 0
Retail - Secured on real estate property 35 2 33 12 2 0 34 2 33 12 2 0
Retail - Secured on real estate property - Of Which: SME 0 0 0 0 0 0 0 0 0 0 0 0
Retail - Secured on real estate property - Of Which: non-
SME
35 2 33 12 2 0 34 2 33 12 2 0
Retail - Qualifying Revolving 4 0 2 0 0 0 5 0 2 0 0 0
Retail - Other Retail 2 0 2 1 0 0 3 0 3 1 0 0
Retail - Other Retail - Of Which: SME 0 0 0 0 0 0 1 0 1 0 0 0
Retail - Other Retail - Of Which: non-SME 2 0 2 1 0 0 2 0 2 0 0 0
Equity 34 0 34 185 0 0 63 0 63 171 0 0
Securitisation
Other non credit-obligation assets
IRB Total(1)
Original exposure, unlike Exposure value, is reported before taking into account any effect due to credit conversion factors or credit risk mitigation techniques (e.g. substitution effects).
6 (mln EUR, %)
Of which:
defaulted
Of which:
defaulted
Of which:
defaulted
Of which:
defaulted
Central banks and central governments 1 0 156 11 0 0 1 0 141 10 0 0
Institutions 11 0 6 2 0 0 12 0 6 2 0 0
Corporates 750 3 496 592 0 2 732 116 722 560 12 1
Corporates - Of Which: Specialised Lending 237 0 236 484 0 1 211 0 210 433 0 0
Corporates - Of Which: SME 6 0 6 3 0 0 10 3 9 5 0 0
Retail 3 0 3 1 0 0 5 0 4 1 0 0
Retail - Secured on real estate property 2 0 2 0 0 0 4 0 4 1 0 0
Retail - Secured on real estate property - Of Which: SME 0 0 0 0 0 0 0 0 0 0 0 0
Retail - Secured on real estate property - Of Which: non-
SME
2 0 2 0 0 0 4 0 4 1 0 0
Retail - Qualifying Revolving 0 0 0 0 0 0 0 0 0 0 0 0
Retail - Other Retail 0 0 0 0 0 0 0 0 0 0 0 0
Retail - Other Retail - Of Which: SME 0 0 0 0 0 0 0 0 0 0 0 0
Retail - Other Retail - Of Which: non-SME 0 0 0 0 0 0 0 0 0 0 0 0
Equity 14 0 14 39 0 0 13 0 13 35 0 0
Securitisation
Other non credit-obligation assets
IRB Total(1)
Original exposure, unlike Exposure value, is reported before taking into account any effect due to credit conversion factors or credit risk mitigation techniques (e.g. substitution effects).
7 (mln EUR, %)
Of which:
defaulted
Of which:
defaulted
Of which:
defaulted
Of which:
defaulted
Central banks and central governments 30 0 32 17 0 0 0 0 1 0 0 0
Institutions 77 0 75 5 0 0 92 0 90 2 0 0
Corporates 854 0 656 313 0 1 534 0 407 165 0 0
Corporates - Of Which: Specialised Lending 0 0 0 0 0 0 0 0 0 0 0 0
Corporates - Of Which: SME 1 0 0 0 0 0 1 0 1 1 0 0
Retail 3 0 3 0 0 0 4 0 3 0 0 0
Retail - Secured on real estate property 2 0 2 0 0 0 2 0 2 0 0 0
Retail - Secured on real estate property - Of Which: SME 0 0 0 0 0 0 0 0 0 0 0 0
Retail - Secured on real estate property - Of Which: non-
SME
2 0 2 0 0 0 2 0 2 0 0 0
Retail - Qualifying Revolving 1 0 0 0 0 0 1 0 0 0 0 0
Retail - Other Retail 1 0 1 0 0 0 1 0 1 0 0 0
Retail - Other Retail - Of Which: SME 0 0 0 0 0 0 0 0 0 0 0 0
Retail - Other Retail - Of Which: non-SME 1 0 1 0 0 0 1 0 1 0 0 0
Equity 104 0 104 259 0 0 86 0 86 214 0 0
Securitisation
Other non credit-obligation assets
IRB Total(1)
Original exposure, unlike Exposure value, is reported before taking into account any effect due to credit conversion factors or credit risk mitigation techniques (e.g. substitution effects).
IRB Approach
As of 31/12/2016 As of 30/06/2017
Risk exposure amount Value
adjustments
and
provisions
TURKEY
IRB Approach
As of 31/12/2016 As of 30/06/2017
Original Exposure1
Exposure
Value1
Risk exposure amount Value
adjustments
and
provisions
Original Exposure1
Exposure
Value1
Risk exposure amount Value
adjustments
and
provisions
FRANCE
IRB Approach
As of 31/12/2016 As of 30/06/2017
Original Exposure1
Exposure
Value1
Risk exposure amount Value
adjustments
and
provisions
Original Exposure1
Exposure
Value1
Risk exposure amount Value
adjustments
and
provisions
PERU
IRB Approach
As of 31/12/2016 As of 30/06/2017
Original Exposure1
Exposure
Value1
Risk exposure amount Value
adjustments
and
provisions
Original Exposure1
Exposure
Value1
Risk exposure amount Value
adjustments
and
provisions
CHILE
Original Exposure1
Exposure
Value1
Risk exposure amount Value
adjustments
and
provisions
Original Exposure1
Exposure
Value1

2017 EU-wide Transparency Exercise
Credit Risk - IRB Approach
Banco Bilbao Vizcaya Argentaria, SA
8 (mln EUR, %)
Of which:
defaulted
Of which:
defaulted
Of which:
defaulted
Of which:
defaulted
Central banks and central governments 0 0 28 1 0 0 0 0 27 1 0 0
Institutions 12,039 0 12,020 488 0 1 11,873 0 11,826 474 0 0
Corporates 4,515 4 3,563 1,950 1 6 5,357 3 3,807 1,820 0 5
Corporates - Of Which: Specialised Lending 990 0 956 712 0 0 907 0 884 688 0 0
Corporates - Of Which: SME 39 0 31 20 0 0 35 0 29 15 0 0
Retail 208 7 199 77 7 1 198 8 190 56 11 2
Retail - Secured on real estate property 200 7 195 76 7 1 190 8 186 55 11 2
Retail - Secured on real estate property - Of Which: SME 0 0 0 0 0 0 0 0 0 0 0 0
Retail - Secured on real estate property - Of Which: non-
SME
200 7 195 76 7 1 190 8 186 55 11 2
Retail - Qualifying Revolving 5 0 2 0 0 0 6 0 2 0 0 0
Retail - Other Retail 2 0 2 1 0 0 2 0 2 1 0 0
Retail - Other Retail - Of Which: SME 0 0 0 0 0 0 0 0 0 0 0 0
Retail - Other Retail - Of Which: non-SME 2 0 2 1 0 0 2 0 2 1 0 0
Equity 50 0 50 206 0 0 49 0 49 123 0 0
Securitisation
Other non credit-obligation assets
IRB Total(1)
Original exposure, unlike Exposure value, is reported before taking into account any effect due to credit conversion factors or credit risk mitigation techniques (e.g. substitution effects).
9 (mln EUR, %)
Of which:
defaulted
Of which:
defaulted
Of which:
defaulted
Of which:
defaulted
Central banks and central governments 0 0 0 0 0 0 0 0 0 0 0 0
Institutions 154 0 153 91 0 0 158 0 156 89 0 0
Corporates 690 0 687 373 0 1 360 0 360 173 0 1
Corporates - Of Which: Specialised Lending 145 0 143 100 0 0 128 0 127 89 0 0
Corporates - Of Which: SME 3 0 3 1 0 0 3 0 3 2 0 0
Retail 4 0 4 2 0 0 4 0 3 2 0 0
Retail - Secured on real estate property 3 0 3 2 0 0 3 0 3 1 0 0
Retail - Secured on real estate property - Of Which: SME 0 0 0 0 0 0 0 0 0 0 0 0
Retail - Secured on real estate property - Of Which: non-
SME
3 0 3 2 0 0 3 0 3 1 0 0
Retail - Qualifying Revolving 1 0 0 0 0 0 1 0 0 0 0 0
Retail - Other Retail 0 0 0 0 0 0 1 0 1 0 0 0
Retail - Other Retail - Of Which: SME 0 0 0 0 0 0 0 0 0 0 0 0
Retail - Other Retail - Of Which: non-SME 0 0 0 0 0 0 1 0 1 0 0 0
Equity 239 0 239 580 0 0 229 0 229 555 0 0
Securitisation
Other non credit-obligation assets
IRB Total(1)
Original exposure, unlike Exposure value, is reported before taking into account any effect due to credit conversion factors or credit risk mitigation techniques (e.g. substitution effects).
10 (mln EUR, %)
Of which:
defaulted
Of which:
defaulted
Of which:
defaulted
Of which:
defaulted
Central banks and central governments 9 8 43 1 1 6 9 8 39 1 1 6
Institutions 2,086 0 2,047 115 0 0 1,234 0 1,127 88 0 0
Corporates 6,482 22 4,256 2,009 0 15 6,463 22 4,138 1,826 0 12
Corporates - Of Which: Specialised Lending 345 18 341 278 0 10 289 18 285 228 0 7
Corporates - Of Which: SME 0 0 0 0 0 0 14 0 10 13 0 0
Retail 15 0 14 4 0 0 14 0 13 4 0 0
Retail - Secured on real estate property 14 0 14 4 0 0 12 0 12 3 0 0
Retail - Secured on real estate property - Of Which: SME 0 0 0 0 0 0 0 0 0 0 0 0
Retail - Secured on real estate property - Of Which: non-
SME
14 0 14 4 0 0 12 0 12 3 0 0
Retail - Qualifying Revolving 1 0 0 0 0 0 1 0 0 0 0 0
Retail - Other Retail 0 0 0 0 0 0 1 0 1 0 0 0
Retail - Other Retail - Of Which: SME 0 0 0 0 0 0 1 0 1 0 0 0
Retail - Other Retail - Of Which: non-SME 0 0 0 0 0 0 0 0 0 0 0 0
Equity 13 0 13 79 0 0 8 0 8 22 0 0
Securitisation
Other non credit-obligation assets
IRB Total(1)
Original exposure, unlike Exposure value, is reported before taking into account any effect due to credit conversion factors or credit risk mitigation techniques (e.g. substitution effects).
IRB Approach
As of 31/12/2016 As of 30/06/2017
Risk exposure amount Value
adjustments
and
provisions
UNITED KINGDOM
IRB Approach
As of 31/12/2016 As of 30/06/2017
Original Exposure1
Exposure
Value1
Risk exposure amount Value
adjustments
and
provisions
Original Exposure1
Exposure
Value1
Risk exposure amount Value
adjustments
and
provisions
COLOMBIA
IRB Approach
As of 31/12/2016 As of 30/06/2017
Original Exposure1
Exposure
Value1
Risk exposure amount Value
adjustments
and
provisions
Original Exposure1
Exposure
Value1
Risk exposure amount Value
adjustments
and
provisions
ITALY
Original Exposure1
Exposure
Value1
Risk exposure amount Value
adjustments
and
provisions
Original Exposure1
Exposure
Value1

201612 201612 201612 201612 201612 201612 201612 201612 201612 201612 201612 201612 201612 201612 201612 201612 201612 201612
2017 EU-wide Transparency Exercise
Sovereign Exposure
Banco Bilbao Vizcaya Argentaria, SA
(mln EUR)
of which:
loans and
advances
of which:
debt
securities
of which:
Loans and
advances
of which:
Debt
securities
of which:
Loans and
advances
of which:
Debt
securities
of which:
Loans and
advances
of which:
Debt
securities
of which:
Loans and
advances
of which:
Debt
securities
of which:
Loans and
advances
of which:
Debt
securities
TOTAL - ALL COUNTRIES 118,071.3 34,820.2 83,251.0 22,715.9 0.0 22,715.9 0.0 0.0 0.0 39,913.7 0.0 39,913.7 39,477.9 34,820.2 4,657.7 16,049.3 0.0 16,049.3
Austria 2.8 0.0 2.8
Belgium 242.4 31.7 210.7
Bulgaria 8.5 0.0 8.5
Croatia 0.0 0.0 0.0
Cyprus 0.0 0.0 0.0
Czech Republic 0.0 0.0 0.0
Denmark 0.0 0.0 0.0
Estonia 0.0 0.0 0.0
Finland 14.3 0.0 14.3
France 440.1 27.5 412.5
Germany 504.4 0.0 504.4
Greece 0.0 0.0 0.0
Hungary 0.0 0.0 0.0
Ireland 0.0 0.0 0.0
Italy 11,223.7 59.7 11,164.0
Latvia 0.0 0.0 0.0
Lithuania 0.0 0.0 0.0
Luxembourg 0.0 0.0 0.0
Malta 0.0 0.0 0.0
Netherlands 104.9 0.0 104.9
Poland 44.3 0.0 44.3
Portugal 584.1 285.1 299.0
Romania 369.4 3.4 366.0
Slovakia 0.0 0.0 0.0
Slovenia 0.0 0.0 0.0
Spain 51,529.1 20,710.7 30,818.4
Sweden 0.0 0.0 0.0
United Kingdom 15.8 15.8 0.0
Iceland 0.0 0.0 0.0
Liechtenstein 0.0 0.0 0.0
Norway 0.0 0.0 0.0
Switzerland 0.0 0.0 0.0
Australia 0.0 0.0 0.0
Canada 0.0 0.0 0.0
China 0.0 0.0 0.0
Hong Kong 104.5 0.0 104.5
Japan 9.2 0.1 9.1
U.S. 16,013.6 4,592.9 11,420.7
Other advanced economies non EEA 8.5 0.0 8.5
Other Central and eastern Europe countries non EEA 10,472.1 216.6 10,255.5
Middle East 0.0 0.0 0.0
Latin America and the Caribbean 26,034.6 8,625.2 17,409.3
Africa 13.2 13.2 0.0
Others 331.7 238.2 93.6
Note:
The information reported covers all exposures to “General governments” as defined in paragraph 41 (b) of Annex V of ITS on Supervisory reporting: “central governments, state or regional governments, and local governments, including administrative bodies and non-commercial undertakings, but excluding public companies and private companies held by
these administrations that have a commercial activity (which shall be reported under “non-financial corporations”); social security funds; and international organisations, such as the European Community, the International Monetary Fund and the Bank for International Settlements.
Regions:
Other advanced non EEA: Israel, Korea, New Zealand, Russia, San Marino, Singapore and Taiwan.
Other CEE non EEA: Albania, Bosnia and Herzegovina, FYR Macedonia, Montenegro, Serbia and Turkey.
Middle East: Bahrain, Djibouti, Iran, Iraq, Jordan, Kuwait, Lebanon, Libya, Mauritania, Oman, Qatar, Saudi Arabia, Sudan, Syria, United Arab Emirates and Yemen.
Latin America: Argentina, Belize, Bolivia, Brazil, Chile, Colombia, Costa Rica, Dominica, Dominican Republic, Ecuador, El Salvador, Grenada, Guatemala, Guyana, Haiti, Honduras, Jamaica, Mexico, Nicaragua, Panama, Paraguay, Peru, St. Kitts and Nevis, St. Lucia, St. Vincent and the Grenadines, Suriname, Trinidad and Tobago, Uruguay, Venezuela.
Africa: Algeria, Egypt, Morocco, South Africa and Tunisia.
(1) Includes "Trading financial assets" portfolio for banks reporting under GAAP(2) Includes "Non-trading non-derivative financial assets measured at fair value through profit or loss" portfolio for banks reporting under GAAP(3) Includes "Non-trading non-derivative financial assets measured at fair value to equity" portfolio for banks reporting under GAAP(4) Includes "Non-trading debt instruments measured at a cost-based method" and "Other non-trading non-derivative financial assets" portfolio for banks reporting under GAAP
As of 31/12/2016
Country / Region
Financial assets: Carrying Amount
Memo: breakdown by accounting portfolio
Held for
trading1
Designated at
fair value
through profit
or loss2
Available-for-
sale3
Loans and
Receivables4
Held-to-
maturity
investments
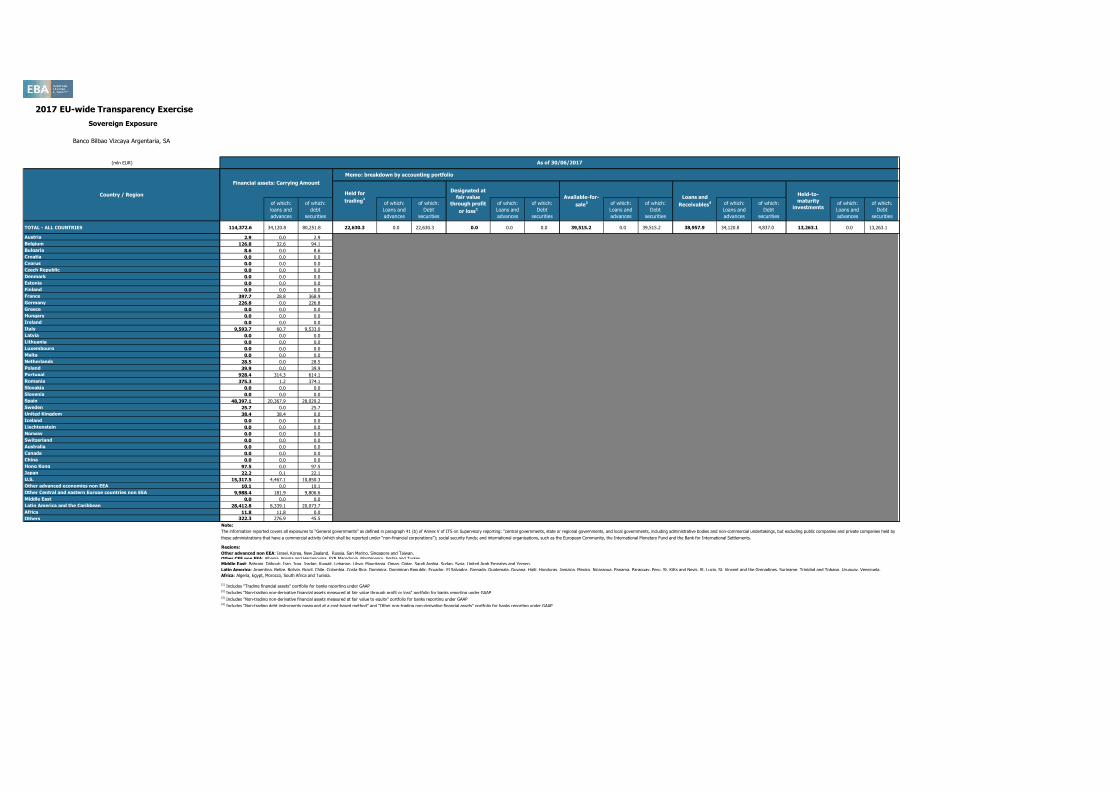
2017 EU-wide Transparency Exercise
Sovereign Exposure
Banco Bilbao Vizcaya Argentaria, SA
(mln EUR)
TOTAL - ALL COUNTRIES
Austria
Belgium
Bulgaria
Croatia
Cyprus
Czech Republic
Denmark
Estonia
Finland
France
Germany
Greece
Hungary
Ireland
Italy
Latvia
Lithuania
Luxembourg
Malta
Netherlands
Poland
Portugal
Romania
Slovakia
Slovenia
Spain
Sweden
United Kingdom
Iceland
Liechtenstein
Norway
Switzerland
Australia
Canada
China
Hong Kong
Japan
U.S.
Other advanced economies non EEA
Other Central and eastern Europe countries non EEA
Middle East
Latin America and the Caribbean
Africa
Others
Country / Region
201706 201706 201706 201706 201706 201706 201706 201706 201706 201706 201706 201706 201706 201706 201706 201706 201706 201706
of which:
loans and
advances
of which:
debt
securities
of which:
Loans and
advances
of which:
Debt
securities
of which:
Loans and
advances
of which:
Debt
securities
of which:
Loans and
advances
of which:
Debt
securities
of which:
Loans and
advances
of which:
Debt
securities
of which:
Loans and
advances
of which:
Debt
securities
114,372.6 34,120.8 80,251.8 22,630.3 0.0 22,630.3 0.0 0.0 0.0 39,515.2 0.0 39,515.2 38,957.9 34,120.8 4,837.0 13,263.1 0.0 13,263.1
2.9 0.0 2.9
126.8 32.6 94.1
8.6 0.0 8.6
0.0 0.0 0.0
0.0 0.0 0.0
0.0 0.0 0.0
0.0 0.0 0.0
0.0 0.0 0.0
0.0 0.0 0.0
397.7 28.8 368.9
226.8 0.0 226.8
0.0 0.0 0.0
0.0 0.0 0.0
0.0 0.0 0.0
9,593.7 60.7 9,533.0
0.0 0.0 0.0
0.0 0.0 0.0
0.0 0.0 0.0
0.0 0.0 0.0
28.5 0.0 28.5
39.9 0.0 39.9
928.4 314.3 614.1
375.3 1.2 374.1
0.0 0.0 0.0
0.0 0.0 0.0
48,397.1 20,367.9 28,029.2
25.7 0.0 25.7
38.4 38.4 0.0
0.0 0.0 0.0
0.0 0.0 0.0
0.0 0.0 0.0
0.0 0.0 0.0
0.0 0.0 0.0
0.0 0.0 0.0
0.0 0.0 0.0
97.5 0.0 97.5
22.2 0.1 22.1
15,317.5 4,467.1 10,850.3
10.1 0.0 10.1
9,988.4 181.9 9,806.6
0.0 0.0 0.0
28,412.8 8,339.1 20,073.7
11.8 11.8 0.0
322.3 276.9 45.5
Note:
The information reported covers all exposures to “General governments” as defined in paragraph 41 (b) of Annex V of ITS on Supervisory reporting: “central governments, state or regional governments, and local governments, including administrative bodies and non-commercial undertakings, but excluding public companies and private companies held by
these administrations that have a commercial activity (which shall be reported under “non-financial corporations”); social security funds; and international organisations, such as the European Community, the International Monetary Fund and the Bank for International Settlements.
Regions:
Other advanced non EEA: Israel, Korea, New Zealand, Russia, San Marino, Singapore and Taiwan.
Other CEE non EEA: Albania, Bosnia and Herzegovina, FYR Macedonia, Montenegro, Serbia and Turkey.
Middle East: Bahrain, Djibouti, Iran, Iraq, Jordan, Kuwait, Lebanon, Libya, Mauritania, Oman, Qatar, Saudi Arabia, Sudan, Syria, United Arab Emirates and Yemen.
Latin America: Argentina, Belize, Bolivia, Brazil, Chile, Colombia, Costa Rica, Dominica, Dominican Republic, Ecuador, El Salvador, Grenada, Guatemala, Guyana, Haiti, Honduras, Jamaica, Mexico, Nicaragua, Panama, Paraguay, Peru, St. Kitts and Nevis, St. Lucia, St. Vincent and the Grenadines, Suriname, Trinidad and Tobago, Uruguay, Venezuela.
Africa: Algeria, Egypt, Morocco, South Africa and Tunisia.
(1) Includes "Trading financial assets" portfolio for banks reporting under GAAP(2) Includes "Non-trading non-derivative financial assets measured at fair value through profit or loss" portfolio for banks reporting under GAAP(3) Includes "Non-trading non-derivative financial assets measured at fair value to equity" portfolio for banks reporting under GAAP(4) Includes "Non-trading debt instruments measured at a cost-based method" and "Other non-trading non-derivative financial assets" portfolio for banks reporting under GAAP
As of 30/06/2017
Financial assets: Carrying Amount
Memo: breakdown by accounting portfolio
Held-to-
maturity
investments
Held for
trading1
Designated at
fair value
through profit
or loss2
Available-for-
sale3
Loans and
Receivables4

201612 201612 201612 201612 201612 201612 201612 201706 201706 201706 201706 201706 201706 201706
(mln EUR, %)
Of which:
defaulted
Of which:
defaulted
Debt securities (including at amortised cost and fair value) 83,330 0 272 272 44 144 0 75,972 0 207 207 24 107 0
Central banks 1,710 0 0 0 0 0 0 2,271 0 0 0 0 0 0
General governments 60,622 0 0 0 6 0 0 57,618 0 0 0 5 0 0
Credit institutions 3,412 0 18 18 13 15 0 2,445 0 17 17 11 14 0
Other financial corporations 11,114 0 66 66 2 26 0 10,077 0 63 63 5 27 0
Non-financial corporations 6,473 0 188 188 24 103 0 3,561 0 127 127 3 66 0
Loans and advances(including at amortised cost and fair value) 504,118 1,492 22,924 22,924 5,211 10,784 9,112 491,047 1,383 21,739 21,739 5,101 10,227 8,480
Central banks 37,566 0 0 0 0 0 0 35,859 0 0 0 0 0 0
General governments 34,873 2 295 295 13 39 190 34,183 4 225 225 8 54 68
Credit institutions 34,855 82 10 10 36 7 0 29,922 114 10 10 22 5 0
Other financial corporations 17,663 28 34 34 56 25 3 17,000 71 13 13 49 9 1
Non-financial corporations 187,100 475 13,783 13,783 2,776 7,393 4,400 184,196 420 12,477 12,477 2,931 6,854 3,761
of which: small and medium-sized enterprises at amortised cost 57,743 286 7,890 7,890 1,296 3,967 2,894 66,075 205 7,104 7,104 1,502 3,716 2,635
Households 192,062 905 8,802 8,802 2,331 3,319 4,520 189,889 775 9,014 9,014 2,091 3,305 4,651
DEBT INSTRUMENTS other than HFT 587,448 1,492 23,196 23,196 5,255 10,928 9,112 567,019 1,383 21,947 21,947 5,125 10,334 8,480
OFF-BALANCE SHEET EXPOSURES 167,413 1,091 1,091 573 377 198 150,862 1,245 1,245 458 392 148
(1) For the definition of non-performing exposures please refer to COMMISSION IMPLEMENTING REGULATION (EU) 2015/227 of 9 January 2015, ANNEX V, Part 2-Template related instructions, subtitle 29(2) Insitutions report here collective allowances for incurrred but not reported losses (instruments at amortised cost) and changes in fair value of performing exposures due to credit risk and provisions (instruments at fair value other than HFT)(3) Insitutions report here specific allowances for financial assets, individually and collectively estimated (instruments at amortised cost) and changes in fair value of NPE due to credit risk and provisions (instruments at fair value other than HFT)
2017 EU-wide Transparency ExercisePerforming and non-performing exposures
Banco Bilbao Vizcaya Argentaria, SA
As of 31/12/2016 As of 30/06/2017
On non-
performing
exposures3
Collaterals and
financial
guarantees
received on non-
performing
exposures
Of which
performing but
past due >30
days and <=90
days
Of which non-performing1
On performing
exposures2
On non-
performing
exposures3
Of which
performing but
past due >30
days and <=90
days
Of which non-performing1
On performing
exposures2
Gross carrying amount
Accumulated impairment,
accumulated changes in fair
value due to credit risk and
provisionsCollaterals and
financial
guarantees
received on non-
performing
exposures
Gross carrying amount
Accumulated impairment,
accumulated changes in fair
value due to credit risk and
provisions

201612 201612 201612 201612 201612 201706 201706 201706 201706 201706
(mln EUR, %)
Debt securities (including at amortised cost and fair value) 0 0 0 0 0 0 0 0 0 0
Central banks 0 0 0 0 0 0 0 0 0 0
General governments 0 0 0 0 0 0 0 0 0 0
Credit institutions 0 0 0 0 0 0 0 0 0 0
Other financial corporations 0 0 0 0 0 0 0 0 0 0
Non-financial corporations 0 0 0 0 0 0 0 0 0 0
Loans and advances (including at amortised cost and fair value) 26,289 14,870 6,798 6,281 14,050 24,377 14,263 6,374 5,975 12,004
Central banks 0 0 0 0 0 0 0 0 0 0
General governments 719 40 6 4 682 697 88 13 13 86
Credit institutions 0 0 0 0 0 0 0 0 0 0
Other financial corporations 53 8 5 4 33 48 7 5 5 29
Non-financial corporations 14,107 9,461 5,164 4,847 5,296 12,976 8,628 4,782 4,549 4,632
of which: small and medium-sized enterprises at amortised cost 8,039 5,573 2,875 2,673 3,934 7,327 5,002 2,579 2,455 3,452
Households 11,410 5,361 1,622 1,426 8,038 10,656 5,540 1,573 1,409 7,256
DEBT INSTRUMENTS other than HFT 26,289 14,870 6,798 6,281 14,050 24,377 14,263 6,374 5,975 12,004
Loan commitments given 327 171 49 48 49 289 154 35 35 42
(1) For the definition of forborne exposures please refer to COMMISSION IMPLEMENTING REGULATION (EU) 2015/227 of 9 January 2015, ANNEX V, Part 2-Template related instructions, subtitle 30
2017 EU-wide Transparency ExerciseForborne exposures
Banco Bilbao Vizcaya Argentaria, SA
As of 31/12/2016 As of 30/06/2017
Collateral and
financial
guarantees
received on
exposures with
forbearance
measures
Of which non-
performing
exposures with
forbearance
measures
Of which on non-
performing
exposures with
forbearance
measures
Of which non-
performing
exposures with
forbearance
measures
Of which on non-
performing
exposures with
forbearance
measures
Gross carrying amount of
exposures with forbearance
measures
Accumulated impairment,
accumulated changes in fair value
due to credit risk and provisions
for exposures with forbearance
measures
Collateral and
financial
guarantees
received on
exposures with
forbearance
measures
Gross carrying amount of
exposures with forbearance
measures
Accumulated impairment,
accumulated changes in fair value
due to credit risk and provisions
for exposures with forbearance
measures