
2017 ANNUAL REPORT Citibank Nigeria Limited · What You Can Expect from Us and What We Expect from...
162
2017 ANNUAL REPORT Citibank Nigeria Limited
Transcript of 2017 ANNUAL REPORT Citibank Nigeria Limited · What You Can Expect from Us and What We Expect from...

© 2017 Citibank, N.A. All rights reserved. Citi and Arc Design is a trademark and service mark of Citigroup Inc., used and registered throughout the world.
GRA00000 00/00
CIT
IBA
NK
NIG
ER
IA L
IMIT
ED
| 20
17 A
nn
ua
l Re
po
rt
2017 ANNUAL REPORT Citibank Nigeria Limited
Citi’s Value Proposition: A Mission of Enabling Growth and Progress
What You Can Expect from Us and What We Expect from Ourselves
Citi’s mission is to serve as a trusted partner to its clients by responsibly providing financial services that enable growth and economic progress. Our core activities are safeguarding assets, lending money, making payments and accessing the capital markets on behalf of our clients. We have 200 years of experience in helping our clients meet the world’s toughest challenges and embrace its greatest opportunities. We are Citi, the global bank — an institution connecting millions of people across hundreds of countries and cities.
We protect people’s savings and help them make the purchases — from everyday transactions to buying a home — that improve the quality of their lives. We advise people on how to invest for future needs, such as their children’s education and their own retirement, and help them buy securities, such as stocks and bonds.
We work with companies to optimise their daily operations, whether they need working capital to make payroll or export their goods overseas. By lending to companies large and small, we help them grow, creating jobs and real economic value at home and in communities around the world. We provide financing and support to governments at all levels so they can build sustainable infrastructure, such as housing, transportation, schools and other vital public works.
These capabilities create an obligation to act responsibly, do everything possible to create the best outcomes and prudently manage risk. If we fall short, we will take decisive action and learn from our experience.
We strive to earn and maintain the public’s trust by constantly adhering to the highest ethical standards. We ask our colleagues to ensure that their decisions pass three tests: they are in our clients’ interests, create economic value and are always systemically responsible. When we do these things well, we make a positive financial and social impact in the communities we serve and show what a global bank can do.
2017 ANNUAL REPORT
1
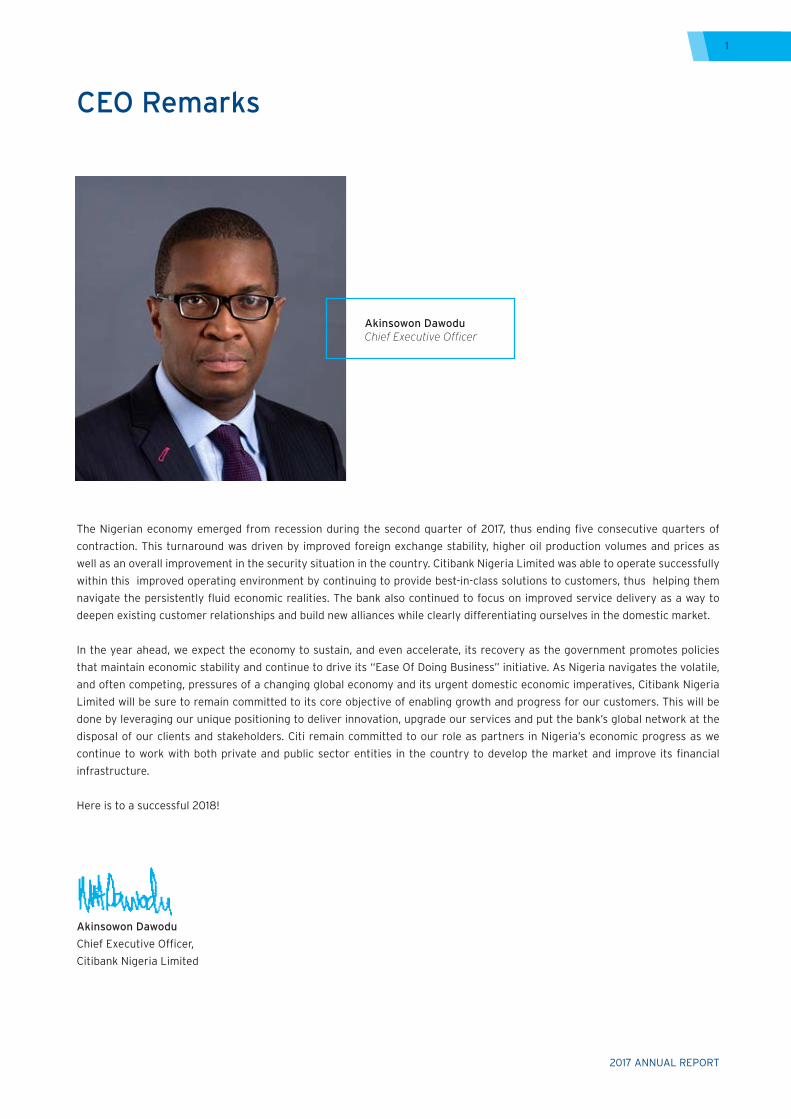
CEO Remarks
The Nigerian economy emerged from recession during the second quarter of 2017, thus ending five consecutive quarters of
contraction. This turnaround was driven by improved foreign exchange stability, higher oil production volumes and prices as
well as an overall improvement in the security situation in the country. Citibank Nigeria Limited was able to operate successfully
within this improved operating environment by continuing to provide best-in-class solutions to customers, thus helping them
navigate the persistently fluid economic realities. The bank also continued to focus on improved service delivery as a way to
deepen existing customer relationships and build new alliances while clearly differentiating ourselves in the domestic market.
In the year ahead, we expect the economy to sustain, and even accelerate, its recovery as the government promotes policies
that maintain economic stability and continue to drive its “Ease Of Doing Business” initiative. As Nigeria navigates the volatile,
and often competing, pressures of a changing global economy and its urgent domestic economic imperatives, Citibank Nigeria
Limited will be sure to remain committed to its core objective of enabling growth and progress for our customers. This will be
done by leveraging our unique positioning to deliver innovation, upgrade our services and put the bank’s global network at the
disposal of our clients and stakeholders. Citi remain committed to our role as partners in Nigeria’s economic progress as we
continue to work with both private and public sector entities in the country to develop the market and improve its financial
infrastructure.
Here is to a successful 2018!
Akinsowon Dawodu
Chief Executive Officer,
Citibank Nigeria Limited
Akinsowon DawoduChief Executive Officer
2017 ANNUAL REPORT
2
CEO’s Remarks
Table of Contents
Board of Directors
Management Committee
Annual General Meeting Notice
Chairman’s Statement
Sustainability Report
Business Report
Corporate and Investment Banking
Risk Management
Treasury and Trade Solutions
Global Subsidiaries Group
Direct Custody and Clearing
Operations and Technology
Human Resources
Markets
Employee of the Year
Financial Report
2017 in Pictures
1
2
3
4
5
6
14
18
20
22
24
26
28
30
32
34
35
36
156
Contents

2017 ANNUAL REPORT
3
Olayemi CardosoChairman
Dr. Daphne Dafinone Mr. Oyesoji Oyeleke
Mr. Akin Dawodu
Mr. Peter McCarthy
Dr. Shamsudeen Usman
Mrs. Ireti Samuel-Ogbu
Ms. Diane Evans
Dr. Hilary Onyiuke
Mr. Fatai Karim Mrs. Nneka EnwerejiMrs. Funmi Ogunlesi
Mr. Oluwole Awotundun Mrs. Olusola FagbureCompany Secretaryand Legal Adviser
Board of Directors
2017 ANNUAL REPORT
3

2017 ANNUAL REPORT
4
Mr. Akin Dawodu Managing Director and CEO
Mr. Oluwole Awotundun Executive Director and Country Risk Manager, Nigeria, West and Central Africa
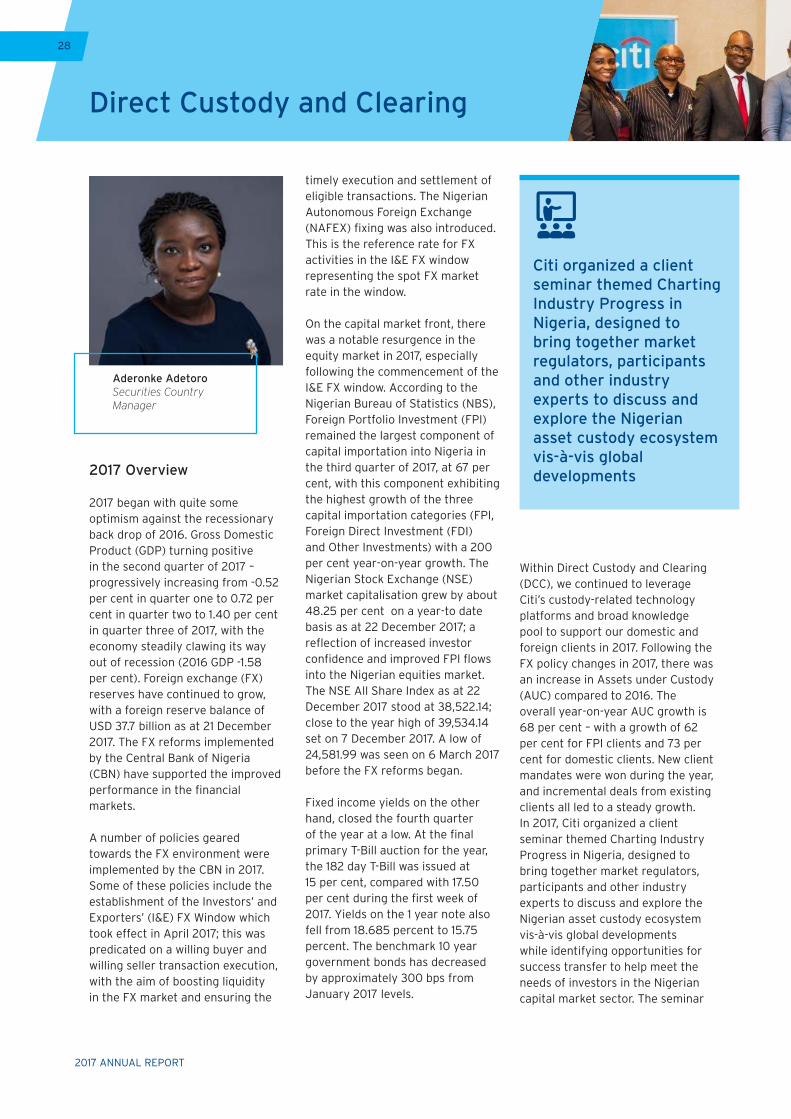
Mrs. Aderonke Adetoro Securities Country Manager
Mr. Gboyega Oloyede Country Human Resources Officer
Mrs. Funmi Ogunlesi Executive Director and Head of Treasury and Trade Solutions Public Sector, Africa
Mr. Segun Adaramola Head of Treasury and Trade Solutions
Mr. Sharaf Muhammed Chief Finance Officer and Head of Strategy & Sustainability
Ms. Chidinma Ohajunwa Head of Operational Risk Management
Mr. Fatai Karim Executive Director and Head of Treasury and Trade Solutions Client Operations SSA
Mr. Bayo Adeyemo Country Treasurer and Head of Markets
Mrs. Ngozi Omoke-Enyi Head of Operations and Technology
Mrs. Sola Fagbure Country Counsel and Company Secretary
Mr. Bolaji Ajao Head of Internal Audit
Mrs. Lola Oyeka Country Public Affairs Officer
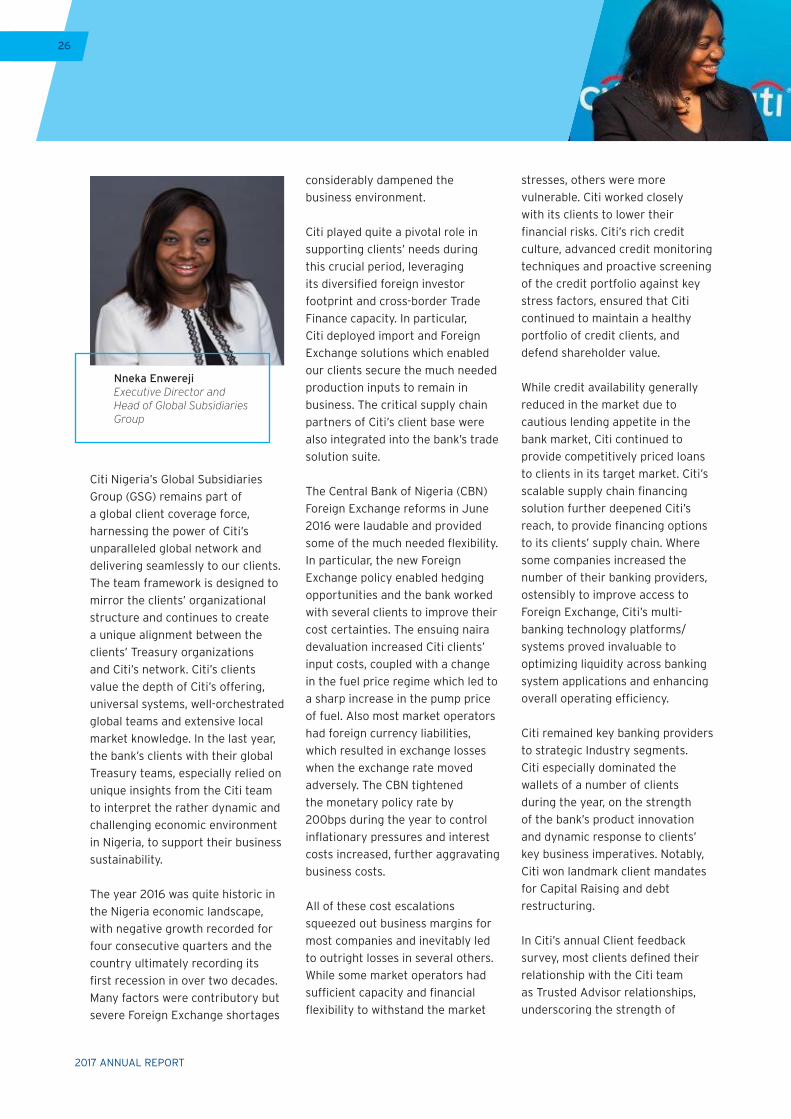
Mrs. Nneka Enwereji Executive Director and Head of Global Subsidiaries Group
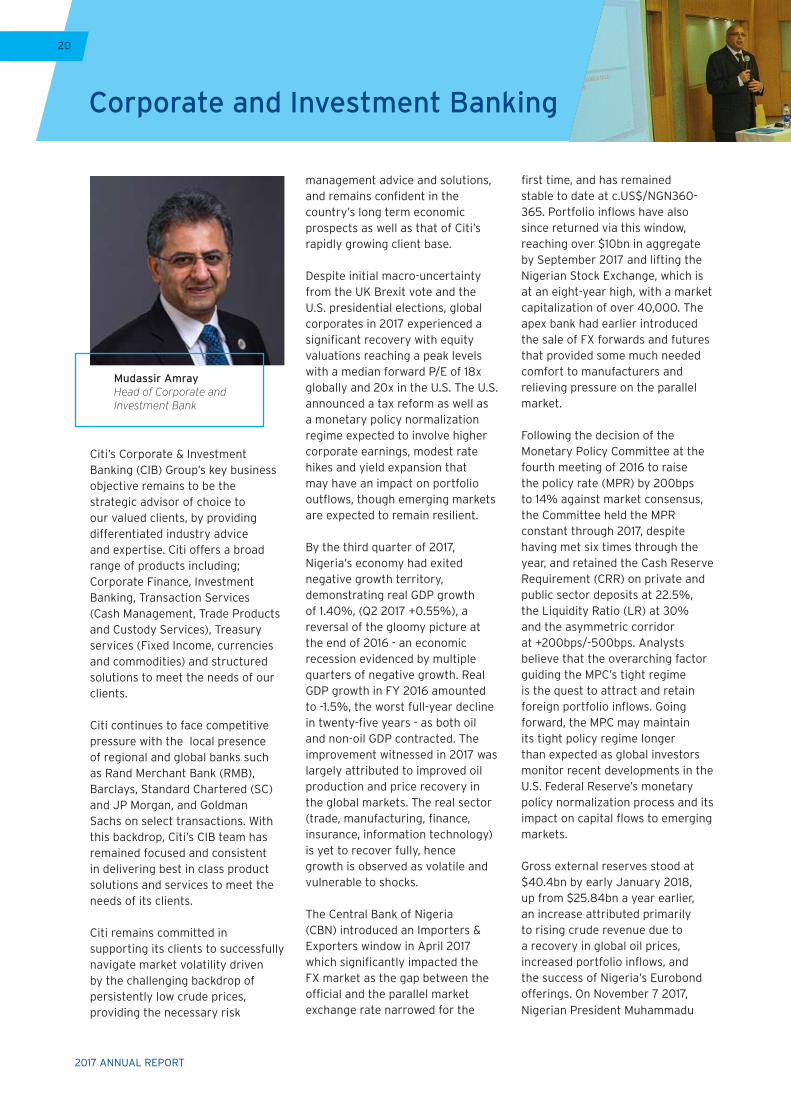
Mr. Mudassir Amray Head of Corporate and Investment Bank
Ms. Shola Phillips Country Compliace Officer
Management Committee
2017 ANNUAL REPORT
4
2017 ANNUAL REPORT
5
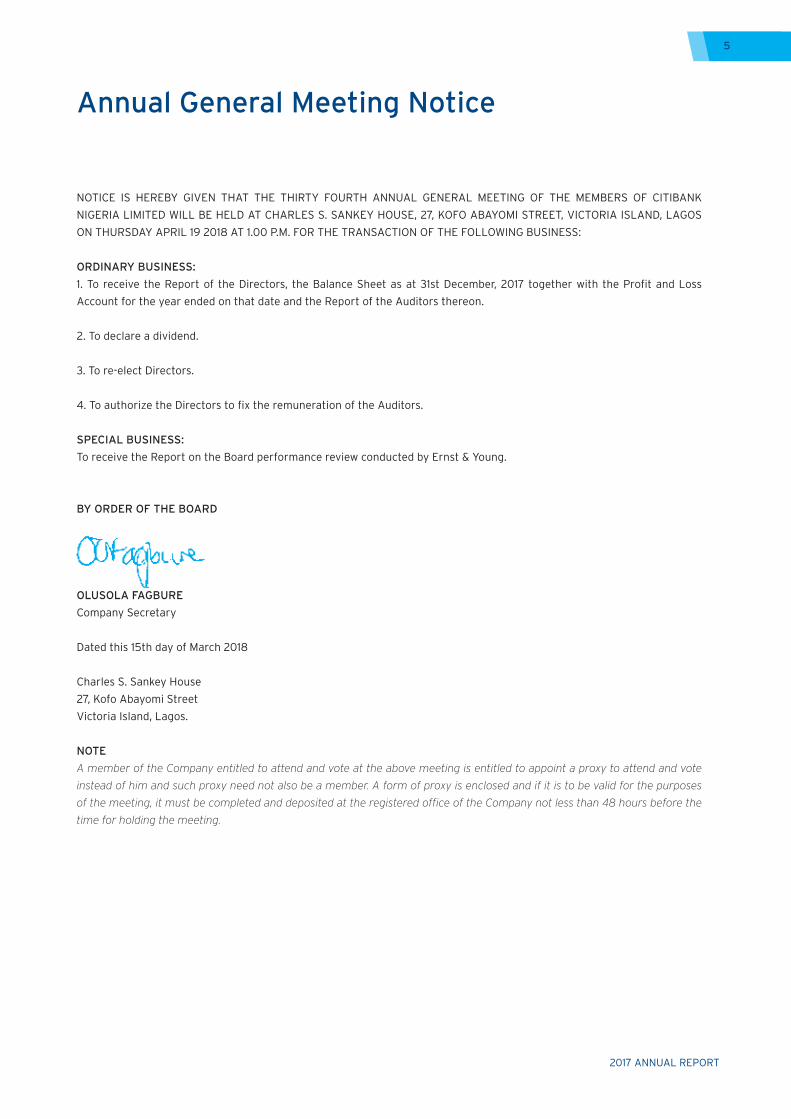
Annual General Meeting Notice
NOTICE IS HEREBY GIVEN THAT THE THIRTY FOURTH ANNUAL GENERAL MEETING OF THE MEMBERS OF CITIBANK
NIGERIA LIMITED WILL BE HELD AT CHARLES S. SANKEY HOUSE, 27, KOFO ABAYOMI STREET, VICTORIA ISLAND, LAGOS
ON THURSDAY APRIL 19 2018 AT 1.00 P.M. FOR THE TRANSACTION OF THE FOLLOWING BUSINESS:
ORDINARY BUSINESS:
1. To receive the Report of the Directors, the Balance Sheet as at 31st December, 2017 together with the Profit and Loss
Account for the year ended on that date and the Report of the Auditors thereon.
2. To declare a dividend.
3. To re-elect Directors.
4. To authorize the Directors to fix the remuneration of the Auditors.
SPECIAL BUSINESS:
To receive the Report on the Board performance review conducted by Ernst & Young.
BY ORDER OF THE BOARD
OLUSOLA FAGBURE
Company Secretary
Dated this 15th day of March 2018
Charles S. Sankey House
27, Kofo Abayomi Street
Victoria Island, Lagos.
NOTE
A member of the Company entitled to attend and vote at the above meeting is entitled to appoint a proxy to attend and vote
instead of him and such proxy need not also be a member. A form of proxy is enclosed and if it is to be valid for the purposes
of the meeting, it must be completed and deposited at the registered office of the Company not less than 48 hours before the
time for holding the meeting.

2017 ANNUAL REPORT
6
Chairman’s Statement
Macroeconomic Overview
World EconomyThe pace of global economic growth picked up in 2017 with the world economy growing by about 3.6% compared to a growth of 3.2% in 2016. This momentum was driven by a combination of sustained growth in advanced economies and a continued recovery in emerging market economies that had previously been affected by the slump in commodity prices and various fiscal pressures.
Across advanced economies, stronger than expected domestic demand and supportive external demand led to stronger than expected growth in 2017. In the US, a weakness in consumption in the first quarter of the year proved to be temporary as consumption and business investment recovered
substantially for the rest of the year. Overall, the US economy grew by about 2.2% in 2017 compared to a growth of 1.5% in 2016. Similarly, economic growth in the Euro Area, despite Brexit negotiations, was also stronger at 2.1% in 2017. Much of this growth was led by a combination of stronger consumption and rising external demand for exports. The ongoing Quantitative Easing program and negative interest rate environment also remained vital clogs in the growth catalyst for the Euro Area. Similarly the Bank of Japan’s negative interest rate, continuing Quantitative Easing program and cap on long-term interest rates helped spur GDP growth in Japan to 1.5% in 2017 from 1.0% in 2016. Overall, advanced economies contributed significantly to the uptick in global growth in 2017.
Growth in emerging and developing economies was supported by a resilient Chinese economy and recoveries in key emerging economies including Brazil and Russia that had begun the year in recessions. China, after a slowdown in growth in 2016, grew by about 6.8% in 2017 driven by rapidly accelerating household consumption. Despite concerns about fiscal instability, high government debt and government transparency, growth in the Chinese economy remains ahead of most expectations. Meanwhile, Brazil finally came out of its longest and deepest recession on record following rising exports and growing domestic demand spurred by aggressive interest rate cuts by its central bank. The political turmoil in Brazil is however likely to weigh on more rapid growth in
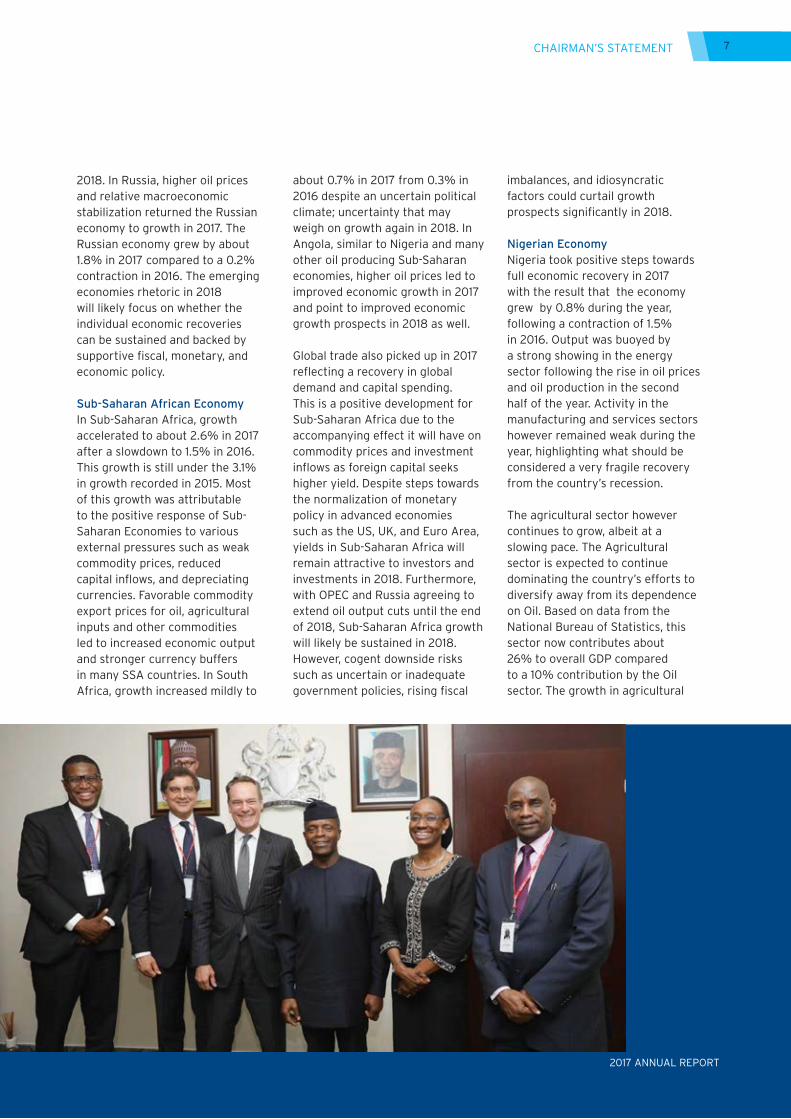
Citibank Nigeria Limited and present to you its financial results and key achievements during the year 2017. Citibank Nigeria Limited continues to grow and make progress by creating sustained value for customers, employees, and shareholders of the bank.
Olayemi CardosoChairman
Fellow shareholders, members of the board of directors, distinguished ladies and gentlemen.
I am pleased to welcome you to the 34th Annual General Meeting of
2017 ANNUAL REPORT
7
2018. In Russia, higher oil prices and relative macroeconomic stabilization returned the Russian economy to growth in 2017. The Russian economy grew by about 1.8% in 2017 compared to a 0.2% contraction in 2016. The emerging economies rhetoric in 2018 will likely focus on whether the individual economic recoveries can be sustained and backed by supportive fiscal, monetary, and economic policy.
Sub-Saharan African EconomyIn Sub-Saharan Africa, growth accelerated to about 2.6% in 2017 after a slowdown to 1.5% in 2016. This growth is still under the 3.1% in growth recorded in 2015. Most of this growth was attributable to the positive response of Sub-Saharan Economies to various external pressures such as weak commodity prices, reduced capital inflows, and depreciating currencies. Favorable commodity export prices for oil, agricultural inputs and other commodities led to increased economic output and stronger currency buffers in many SSA countries. In South Africa, growth increased mildly to
about 0.7% in 2017 from 0.3% in 2016 despite an uncertain political climate; uncertainty that may weigh on growth again in 2018. In Angola, similar to Nigeria and many other oil producing Sub-Saharan economies, higher oil prices led to improved economic growth in 2017 and point to improved economic growth prospects in 2018 as well.
Global trade also picked up in 2017 reflecting a recovery in global demand and capital spending. This is a positive development for Sub-Saharan Africa due to the accompanying effect it will have on commodity prices and investment inflows as foreign capital seeks higher yield. Despite steps towards the normalization of monetary policy in advanced economies such as the US, UK, and Euro Area, yields in Sub-Saharan Africa will remain attractive to investors and investments in 2018. Furthermore, with OPEC and Russia agreeing to extend oil output cuts until the end of 2018, Sub-Saharan Africa growth will likely be sustained in 2018. However, cogent downside risks such as uncertain or inadequate government policies, rising fiscal
imbalances, and idiosyncratic factors could curtail growth prospects significantly in 2018.
Nigerian EconomyNigeria took positive steps towards full economic recovery in 2017 with the result that the economy grew by 0.8% during the year, following a contraction of 1.5% in 2016. Output was buoyed by a strong showing in the energy sector following the rise in oil prices and oil production in the second half of the year. Activity in the manufacturing and services sectors however remained weak during the year, highlighting what should be considered a very fragile recovery from the country’s recession.
The agricultural sector however continues to grow, albeit at a slowing pace. The Agricultural sector is expected to continue dominating the country’s efforts to diversify away from its dependence on Oil. Based on data from the National Bureau of Statistics, this sector now contributes about 26% to overall GDP compared to a 10% contribution by the Oil sector. The growth in agricultural
CHAIRMAN’S STATEMENT
2017 ANNUAL REPORT
2017 ANNUAL REPORT
8 CHAIRMAN’S STATEMENT
sector has been sustained by favorable government policies that have enhanced access to credit, fertilizers, and consumer markets. In addition the sector has benefited from the increasing focus on import substitution which has helped bolster agricultural production.
As at December 2017, Nigeria’s foreign currency reserves had increased by 52% to USD 38 billion from USD 25 billion in 2016. This increase in reserves was driven by the significant external borrowing undertaken in 2017 and rising oil export revenue. The Federal Government raised $4.8 billion in external debt via bonds in 2017, in line with its strategy to substitute expensive domestic borrowing for cheaper foreign debt. The increase in reserves helped enable a more stable management of foreign currency domestically for trade. This development, in combination with the introduction of the Importers and Exporters NAFEX window in April helped to stabilize the exchange rate and played a part in the eventual economic recovery. However, despite the short-term
positive effects, there are concerns about the sustainability of Nigeria’s debt profile as debt servicing costs represents an increasing proportion of government revenues.
Inflation moderated in 2017, slowing to an average of 15.8% compared to an average of 18.6% in 2016. Part of this moderation should be attributed to the already high base prices in 2016, however the slowdown is welcome overall. Despite the moderating inflation, the CBN maintained its key monetary benchmark rate at 14.0% throughout the year, retaining an asymmetric corridor of +2%/-5% around the MPR. Other monetary policy tools were also kept constant with the apex bank prioritizing a stable monetary policy environment. Looking forward, five members of the current Monetary Policy Committee are set to leave their positions at the start of 2018. These changes, amidst a general clamor for easing monetary policy in 2018, introduce further uncertainty regarding the direction of monetary policy in 2018.
In terms of regulation, the introduction of an Investors’ and Exporters’ foreign exchange Window and revised import and export documentation guidelines are some examples of regulatory changes that affected the foreign exchange and trade markets. Other key regulations introduced in 2017 include an Agri-Business/Small and Medium Enterprises Investment Scheme (AGSMEIS) into which all Banks are required to contribute 5% of their annual profits, and the ongoing implementation of IFRS 9 (Financial Instruments) for enhanced reporting. Citibank Nigeria Limited continues to comply with all relevant directives.
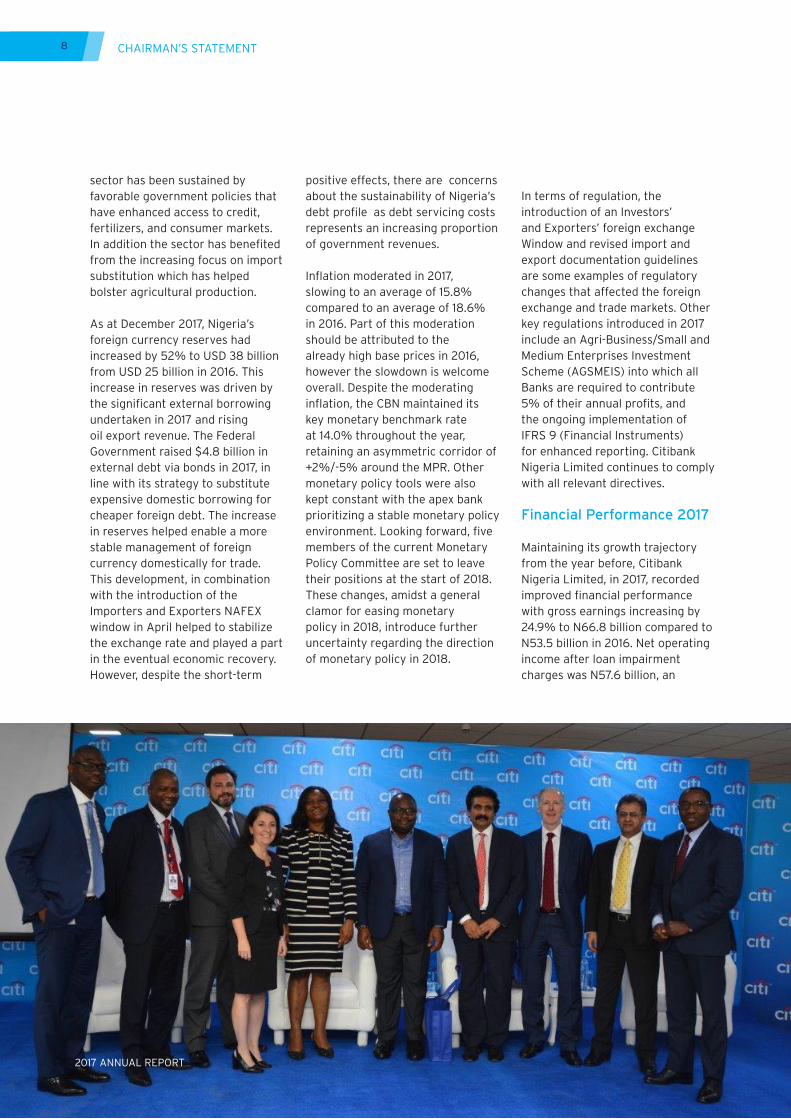
Financial Performance 2017
Maintaining its growth trajectory from the year before, Citibank Nigeria Limited, in 2017, recorded improved financial performance with gross earnings increasing by 24.9% to N66.8 billion compared to N53.5 billion in 2016. Net operating income after loan impairment charges was N57.6 billion, an
2017 ANNUAL REPORT
2017 ANNUAL REPORT
9CHAIRMAN’S STATEMENT
increase of 26.9% from N45.4 billion in 2016, while operating expenses increased by 27.3% to N16.8 billion from N13.2 billion recorded in the prior year. Overall, profit before tax for the year rose by 26.9% to N41.0 billion from N32.3 billion the prior year, while profit after tax increased by 26.0% to N32.0 billion compared to N25.4 billion in 2016. Another year of strong profit growth reflects not only our increased efforts to be the partner of choice for our clients, but also a proactive risk management focus that enabled us minimize credit impairments during a difficult economic year. The total assets on our balance sheet closed the year 2017 at N596 billion compared to N604 billion in the prior year. The Return on Assets and Return on Equity increased in 2017 to 5.4% (2016: 4.2%) and 39.7% (2015:35.2%) respectively.
Citibank Nigeria Limited is in compliance with the Central Bank of Nigeria Basel II regulatory capital guidelines of the CBN and remains well capitalized with a Capital Adequacy Ratio of 28.3%, which is
significantly above the minimum regulatory requirement of 10.0%. Our Liquidity ratio of 76.5% at the end of 2017 was also well above the CBNs minimum requirement of 30.0%.
The 2017 financial results reflect the significant dedication and efforts of all employees and stakeholders of the bank to respond in a gradually improving economic environment. These are very commendable results as Citibank Nigeria Limited has shown improvement across major business segments. Overall, Citibank Nigeria Limited is adequately capitalized and well positioned to take advantage of opportunities to support business expansion, deepen relationships and provide tailored advice for its customers in the year ahead.
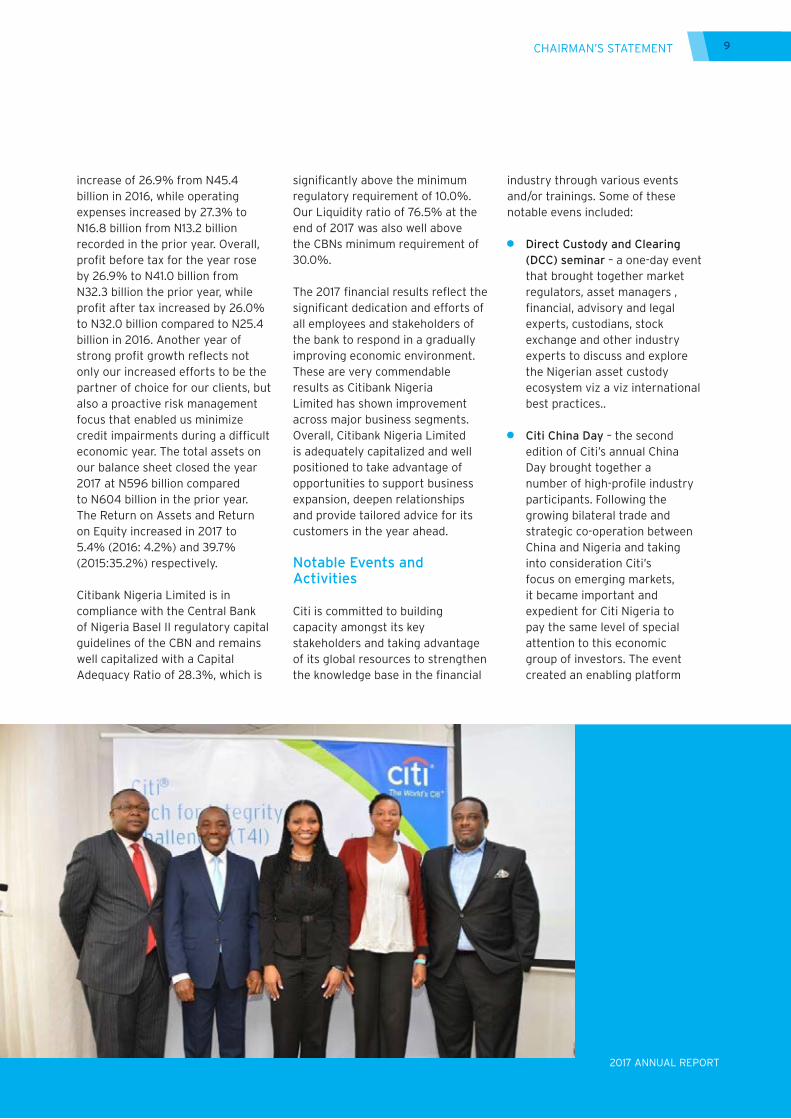
Notable Events and Activities
Citi is committed to building capacity amongst its key stakeholders and taking advantage of its global resources to strengthen the knowledge base in the financial
industry through various events and/or trainings. Some of these notable evens included:
Direct Custody and Clearing (DCC) seminar – a one-day event that brought together market regulators, asset managers , financial, advisory and legal experts, custodians, stock exchange and other industry experts to discuss and explore the Nigerian asset custody ecosystem viz a viz international best practices..
Citi China Day – the second edition of Citi’s annual China Day brought together a number of high-profile industry participants. Following the growing bilateral trade and strategic co-operation between China and Nigeria and taking into consideration Citi’s focus on emerging markets, it became important and expedient for Citi Nigeria to pay the same level of special attention to this economic group of investors. The event created an enabling platform
2017 ANNUAL REPORT
2017 ANNUAL REPORT
10 CHAIRMAN’S STATEMENT
for Chinese corporations to get a better understanding of the Nigerian business environment, recent regulatory changes, macroeconomic developments and government policy direction. It also created an opportunity for the Chinese business community in Nigeria to engage with economic and banking thought leaders and imbibe best practices that Citi has deployed globally.
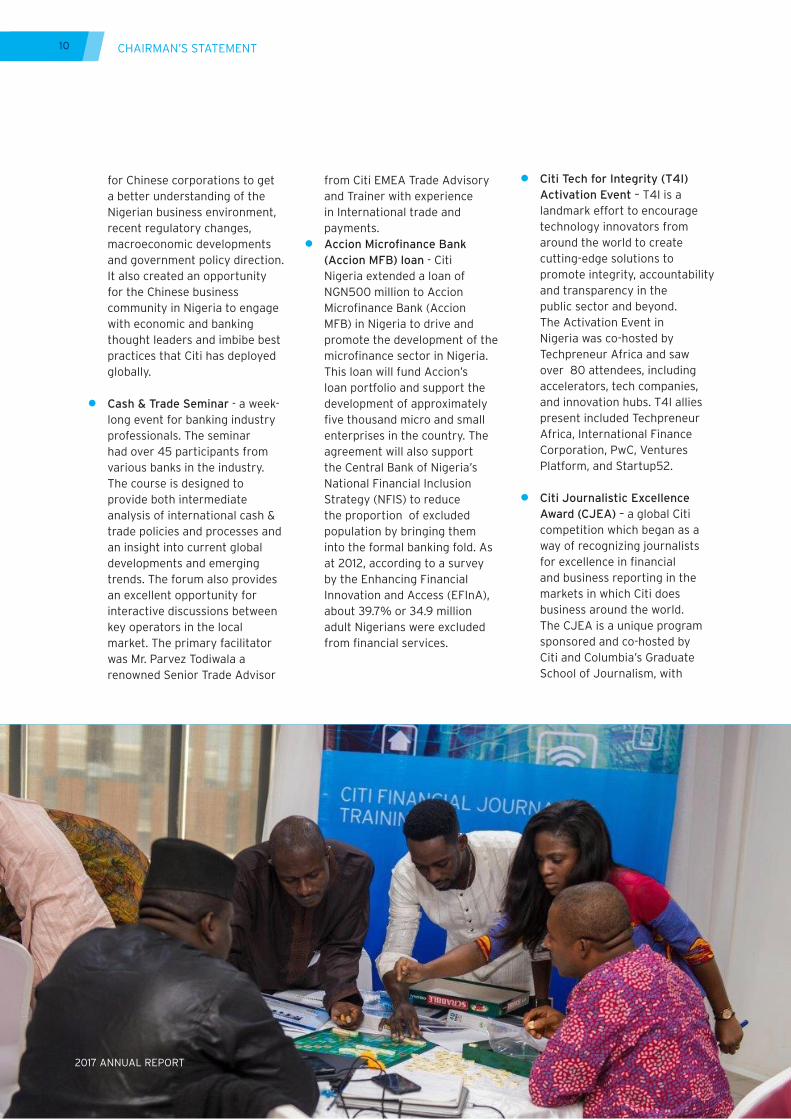
Cash & Trade Seminar - a week-long event for banking industry professionals. The seminar had over 45 participants from various banks in the industry. The course is designed to provide both intermediate analysis of international cash & trade policies and processes and an insight into current global developments and emerging trends. The forum also provides an excellent opportunity for interactive discussions between key operators in the local market. The primary facilitator was Mr. Parvez Todiwala a renowned Senior Trade Advisor
from Citi EMEA Trade Advisory and Trainer with experience in International trade and payments.
Accion Microfinance Bank (Accion MFB) loan - Citi Nigeria extended a loan of NGN500 million to Accion Microfinance Bank (Accion MFB) in Nigeria to drive and promote the development of the microfinance sector in Nigeria. This loan will fund Accion’s loan portfolio and support the development of approximately five thousand micro and small enterprises in the country. The agreement will also support the Central Bank of Nigeria’s National Financial Inclusion Strategy (NFIS) to reduce the proportion of excluded population by bringing them into the formal banking fold. As at 2012, according to a survey by the Enhancing Financial Innovation and Access (EFInA), about 39.7% or 34.9 million adult Nigerians were excluded from financial services.
Citi Tech for Integrity (T4I) Activation Event – T4I is a landmark effort to encourage technology innovators from around the world to create cutting-edge solutions to promote integrity, accountability and transparency in the public sector and beyond. The Activation Event in Nigeria was co-hosted by Techpreneur Africa and saw over 80 attendees, including accelerators, tech companies, and innovation hubs. T4I allies present included Techpreneur Africa, International Finance Corporation, PwC, Ventures Platform, and Startup52.
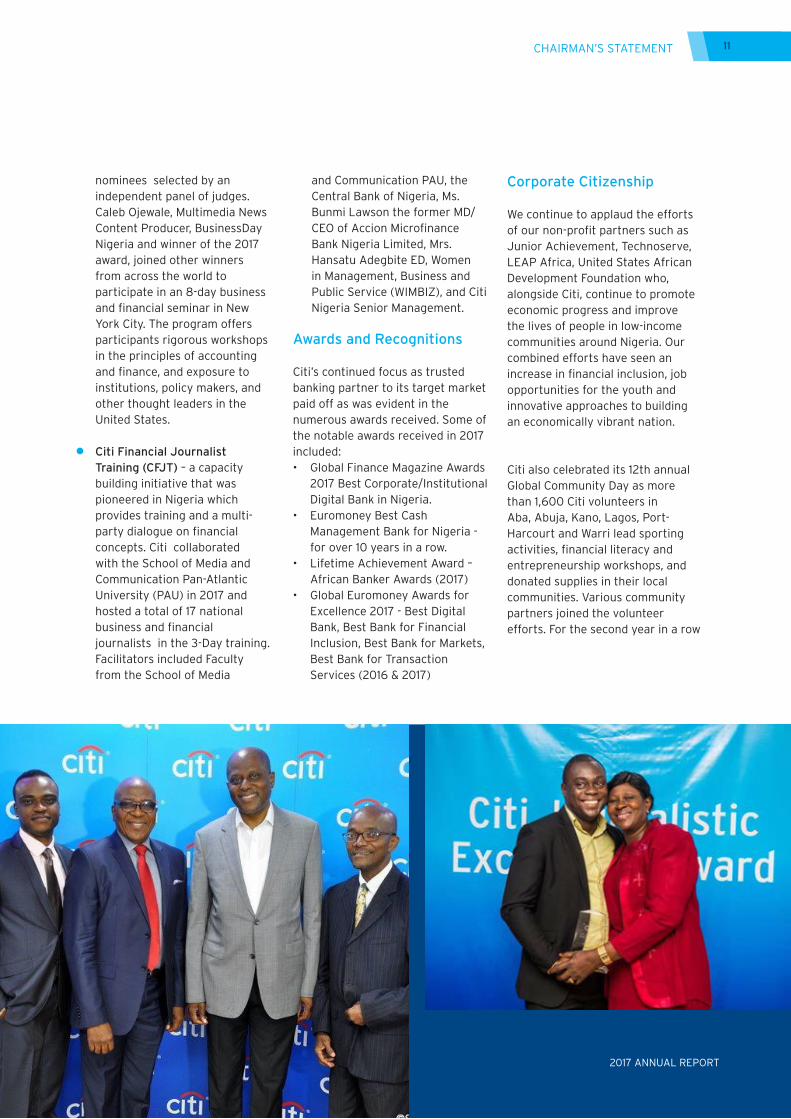
Citi Journalistic Excellence Award (CJEA) – a global Citi competition which began as a way of recognizing journalists for excellence in financial and business reporting in the markets in which Citi does business around the world. The CJEA is a unique program sponsored and co-hosted by Citi and Columbia’s Graduate School of Journalism, with
2017 ANNUAL REPORT
2017 ANNUAL REPORT
11CHAIRMAN’S STATEMENT
nominees selected by an independent panel of judges. Caleb Ojewale, Multimedia News Content Producer, BusinessDay Nigeria and winner of the 2017 award, joined other winners from across the world to participate in an 8-day business and financial seminar in New York City. The program offers participants rigorous workshops in the principles of accounting and finance, and exposure to institutions, policy makers, and other thought leaders in the United States.
Citi Financial Journalist Training (CFJT) – a capacity building initiative that was pioneered in Nigeria which provides training and a multi-party dialogue on financial concepts. Citi collaborated with the School of Media and Communication Pan-Atlantic University (PAU) in 2017 and hosted a total of 17 national business and financial journalists in the 3-Day training. Facilitators included Faculty from the School of Media
and Communication PAU, the Central Bank of Nigeria, Ms. Bunmi Lawson the former MD/CEO of Accion Microfinance Bank Nigeria Limited, Mrs. Hansatu Adegbite ED, Women in Management, Business and Public Service (WIMBIZ), and Citi Nigeria Senior Management.
Awards and Recognitions
Citi’s continued focus as trusted banking partner to its target market paid off as was evident in the numerous awards received. Some of the notable awards received in 2017 included:• GlobalFinanceMagazineAwards
2017 Best Corporate/Institutional Digital Bank in Nigeria.
• EuromoneyBestCashManagement Bank for Nigeria - for over 10 years in a row.
• LifetimeAchievementAward–African Banker Awards (2017)
• GlobalEuromoneyAwardsforExcellence 2017 - Best Digital Bank, Best Bank for Financial Inclusion, Best Bank for Markets, Best Bank for Transaction Services (2016 & 2017)
Corporate Citizenship
We continue to applaud the efforts of our non-profit partners such as Junior Achievement, Technoserve, LEAP Africa, United States African Development Foundation who, alongside Citi, continue to promote economic progress and improve the lives of people in low-income communities around Nigeria. Our combined efforts have seen an increase in financial inclusion, job opportunities for the youth and innovative approaches to building an economically vibrant nation.
Citi also celebrated its 12th annual Global Community Day as more than 1,600 Citi volunteers in Aba, Abuja, Kano, Lagos, Port-Harcourt and Warri lead sporting activities, financial literacy and entrepreneurship workshops, and donated supplies in their local communities. Various community partners joined the volunteer efforts. For the second year in a row
2017 ANNUAL REPORT
2017 ANNUAL REPORT
12
IHS Nigeria, a Citi client, Bloomberg Media Initiative Africa (BMIA) alumni and Junior Achievement Nigeria (JAN) joined the Lagos events.
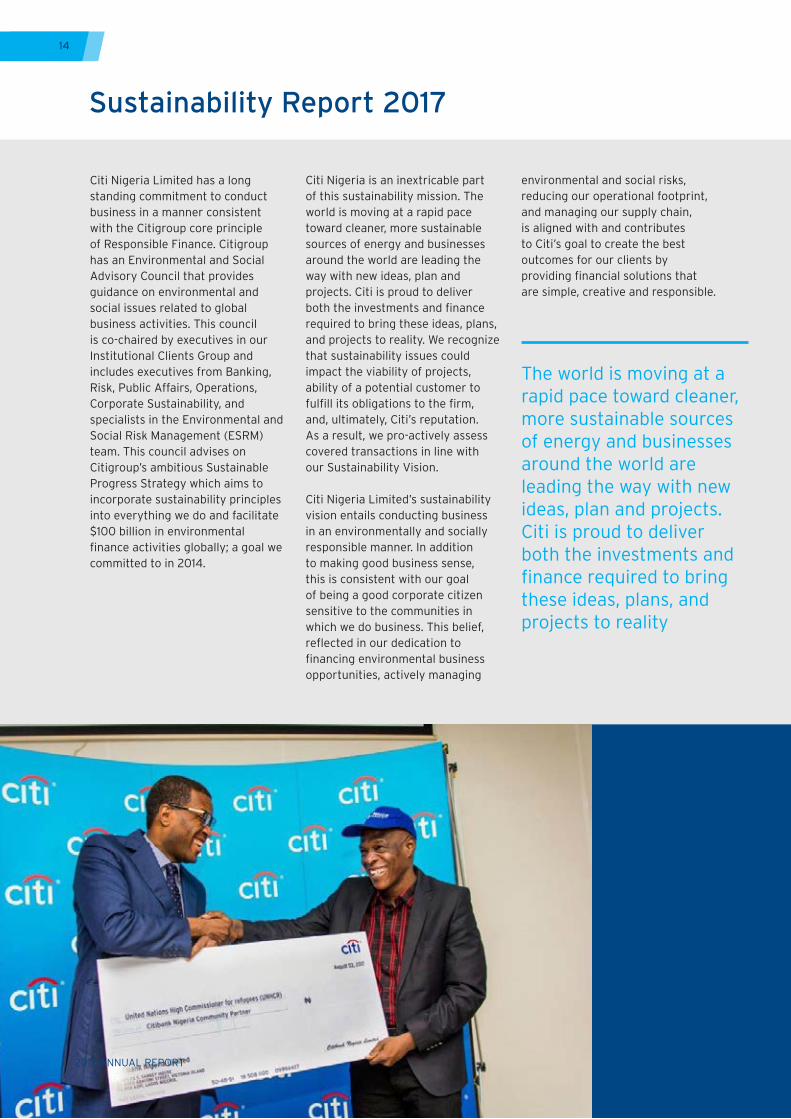
Citibank Nigeria Limited hosted its Community Partner (Cheque) Presentation in Lagos to honour the 18 Community Partners in Lagos. Attendees at the Lagos event included SOS Children’s Village, Down Syndrome Association of Nigeria Atunda Olu School (For Physically Handicapped Children), Bethesda Child Support Agency, The Book Trust Wesley School 1 and 2 for the deaf, Pacelli School for the blind, Care Organization Public Enlightenment (COPE), Sickle Cell Foundation, Heart of Gold Children’s Hospice, Nigerian Red Cross Society and the Office of the United Nations High Commissioner for Refugees (UNHCR).
A new partnership was launched between the Citi Foundation and the International Rescue Committee (IRC) that will provide young people displaced within their own countries
and vulnerable youth from the communities hosting them with support to help them generate a reliable income and contribute to their local economy. Throughout the two-year project, Rescuing Futures, young people in Yola, Nigeria, will be supported to start their own businesses.
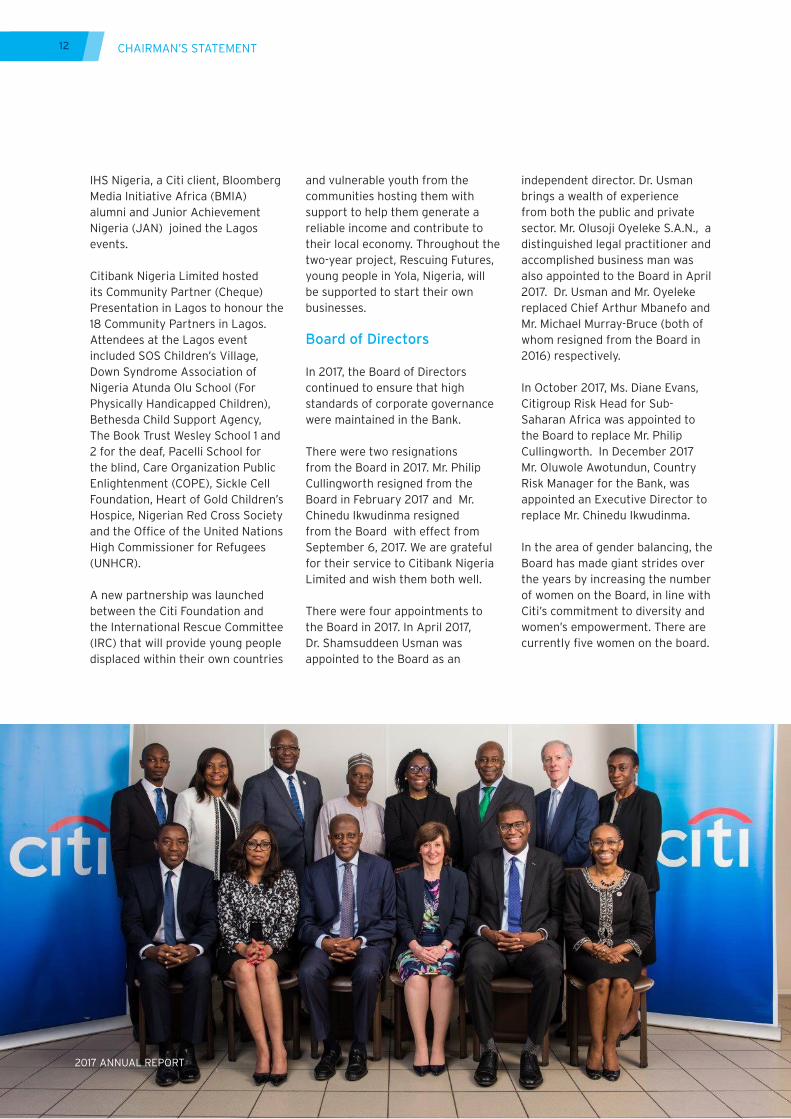
Board of Directors
In 2017, the Board of Directors continued to ensure that high standards of corporate governance were maintained in the Bank.
There were two resignations from the Board in 2017. Mr. Philip Cullingworth resigned from the Board in February 2017 and Mr. Chinedu Ikwudinma resigned from the Board with effect from September 6, 2017. We are grateful for their service to Citibank Nigeria Limited and wish them both well.
There were four appointments to the Board in 2017. In April 2017, Dr. Shamsuddeen Usman was appointed to the Board as an
independent director. Dr. Usman brings a wealth of experience from both the public and private sector. Mr. Olusoji Oyeleke S.A.N., a distinguished legal practitioner and accomplished business man was also appointed to the Board in April 2017. Dr. Usman and Mr. Oyeleke replaced Chief Arthur Mbanefo and Mr. Michael Murray-Bruce (both of whom resigned from the Board in 2016) respectively.
In October 2017, Ms. Diane Evans, Citigroup Risk Head for Sub-Saharan Africa was appointed to the Board to replace Mr. Philip Cullingworth. In December 2017 Mr. Oluwole Awotundun, Country Risk Manager for the Bank, was appointed an Executive Director to replace Mr. Chinedu Ikwudinma.
In the area of gender balancing, the Board has made giant strides over the years by increasing the number of women on the Board, in line with Citi’s commitment to diversity and women’s empowerment. There are currently five women on the board.
Arument ut apienis eos erit, illuptatem quaeper oribus sinimincim esci asitat. Sum aut ipiet, volupta sendand andaest. Musciume il magni conse corpostiores eaque
Arument ut apienis eos erit, illuptatem quaeper oribus sinimincim esci asitat. Sum aut ipiet, volupta sendand andaest. Musciume il magni conse corpostiores eaque
CHAIRMAN’S STATEMENT
2017 ANNUAL REPORT

2017 ANNUAL REPORT
13
Conclusion
Please permit me to extend, on your behalf, our heartfelt appreciation to the management and staff for their continued commitment to Citibank Nigeria Limited and for another year of growth.
I also wish to express my appreciation to the shareholders of Citibank Nigeria Limited for their constant support and encouragement over the course of the last year. Your contributions are highly valuable and have played a major role in the continued success of our bank.
In conclusion, I offer my gratitude to
my colleagues and fellow members of the Board of Directors. Your cooperation, wisdom, loyalty and hard work have immeasurably contributed to the success and continued development of Citibank Nigeria Limited. As we look to the future, I say congratulations to all of you on another excellent year.
Olayemi CardosoChairman
CHAIRMAN’S STATEMENT
2017 ANNUAL REPORT
2017 ANNUAL REPORT
14
Sustainability Report 2017
Citi Nigeria Limited has a long standing commitment to conduct business in a manner consistent with the Citigroup core principle of Responsible Finance. Citigroup has an Environmental and Social Advisory Council that provides guidance on environmental and social issues related to global business activities. This council is co-chaired by executives in our Institutional Clients Group and includes executives from Banking, Risk, Public Affairs, Operations, Corporate Sustainability, and specialists in the Environmental and Social Risk Management (ESRM) team. This council advises on Citigroup’s ambitious Sustainable Progress Strategy which aims to incorporate sustainability principles into everything we do and facilitate $100 billion in environmental finance activities globally; a goal we committed to in 2014.
Citi Nigeria is an inextricable part of this sustainability mission. The world is moving at a rapid pace toward cleaner, more sustainable sources of energy and businesses around the world are leading the way with new ideas, plan and projects. Citi is proud to deliver both the investments and finance required to bring these ideas, plans, and projects to reality. We recognize that sustainability issues could impact the viability of projects, ability of a potential customer to fulfill its obligations to the firm, and, ultimately, Citi’s reputation. As a result, we pro-actively assess covered transactions in line with our Sustainability Vision.
Citi Nigeria Limited’s sustainability vision entails conducting business in an environmentally and socially responsible manner. In addition to making good business sense, this is consistent with our goal of being a good corporate citizen sensitive to the communities in which we do business. This belief, reflected in our dedication to financing environmental business opportunities, actively managing
environmental and social risks, reducing our operational footprint, and managing our supply chain, is aligned with and contributes to Citi’s goal to create the best outcomes for our clients by providing financial solutions that are simple, creative and responsible.
The world is moving at a rapid pace toward cleaner, more sustainable sources of energy and businesses around the world are leading the way with new ideas, plan and projects. Citi is proud to deliver both the investments and finance required to bring these ideas, plans, and projects to reality
2017 ANNUAL REPORT
2017 ANNUAL REPORT
15
Citi Environmental and Social Policy Framework Citi Nigeria’s Environmental and Social Policy Framework includes categorization requirements and, as appropriate, environmental due diligence and elevated review and approval requirements for corporate and government loans, project finance transactions, acquisition finance, letters of credit, bid bonds, performance bonds, and project finance advisory mandates. This framework reinforces Citi’s commitment to managing environmental and social risks in a rigorous and effective manner.
In developing this framework, Citi adopted the external principles and standards listed below, which help to inform our approach to sustainability and risk management;
Equator Principles Green Bond Principles International Labour Organization’s Declaration on Fundamental Principles and Rights at Work
Natural Capital Declaration United Nations Environment
Program Finance Initiative (UNEP FI)
United Nations Global Compact United Nations Guiding Principles on Business and Human Rights
United Nations Universal declaration of Human Rights
These principles guide Citi’s Environmental and Social Policy Framework which covers all business units within the firm, with the objective of ensuring that all of Citi’s businesses effectively assess and manage the environmental and social risk associated with business. The Pillars of Citi’s Environmental and Social Policy are outlined below;
I. Environmental FinanceCiti, through its global business activities, seeks to use its skills and assets to accelerate capital markets solutions to major environmental problems. We do this through specific business units dedicated to developing environmental finance products as well as by identifying opportunities through our traditional businesses. In 2015 as part of our Sustainable Progress
Strategy, Citi announced a ten-year, $100 billion environmental finance goal to lend, invest and facilitate $100 billion to environmental and climate solutions.
II. Environmental and Social Risk ManagementCiti lends and mobilizes billions of dollars of capital towards a variety of companies and projects, including sectors that may be associated with environmental and social impacts and risks. Before making a financing decision, we carefully assess the extent of these impacts and work with our clients to apply a clearly defined set of environmentally and socially responsible policies consistent with leading international standards and good practice.
Citi’s Environmental and Social Risk Management (ESRM) Policy is outlined below;
A. Firm-Wide Prohibitions Citi does not directly or indirectly
finance the following types of projects or activities;• Production or activities
involving harmful or exploitative forms of forced labor
• Production or activities involving harmful or exploitative forms of child labor
• Illegal logging• Production or trade in any
product or activity deemed illegal under country laws or regulations
• Production or trade in wildlife or products regulated under CITES (the Convention on International Trade in Engendered Species of Wild Fauna and Flora or activity deemed illegal under country laws or regulations
2017 ANNUAL REPORT
SUSTAINABILITY REPORT 2017
2017 ANNUAL REPORT
16
• Drift net fishing in the marine environment using nets in excess of 2.5 km in length
B. Areas of High Caution and Special Focus
Consistent with the precautionary principle of “do no harm,” Citi recognizes that there are certain “areas of high caution” that require special attention, focus and respect. Utilizing the relevant International Finance Corporation (IFC) Performance Standards and national laws, Citi only proceeds with investments that impact these areas after a thorough and judicious assessment of impacts and risks, and confirmation that mitigation measures have been or will be designed to comply with Citi’s policies and standards.
C. Firm-Wide Sector Standards Citi recognizes that there are
a number of important areas that require increased attention via sector-specific policy or guidance not available through the IFC Performance Standards, IFC Environmental Health and Safety (EHS) Guidelines, or national or internationally accepted standards. To address this, Citi’s ESRM Policy incorporates several sector-specific standards for the sectors below;• Coal Mining• Forestry• Nuclear• Oil Sands• Palm Oil• Shale Oil and Gas
D. ESRM Screening and Categorization Criteria
As part of the review of a transaction’s environmental and social risks, Citi uses a system of categorization based on
IFC’s environmental and social screening criteria to characterize the magnitude of impacts understood as a result of the assessment. Categories include
• CATEGORY A – use of proceeds are likely to have potential significant adverse social or environmental impacts that are diverse, irreversible or unprecedented;
• CATEGORY B – use of proceeds is likely to have potential limited adverse social or environmental impacts that are few in number, generally site-specific, largely reversible and readily addressed through mitigation measures;
• CATEGORY C – use of proceeds expected to have minimal or no social or environmental impacts; and
• CATEGORY GR – “general review,” use of proceeds are directed to multiple projects with varying risk levels
The screening and categorization criteria above are supplemented by a focus on a number of broad, high-level issues as framed by the IFC Performance Standards. The Performance Standards include;
• PS 1 – Assessment and Management of Environmental and Social Risks and Impacts
• PS 2 – Labor and Working Conditions
• PS 3 – Resource Efficiency and Pollution Prevention
• PS 4 – Community Health, Safety and Security
• PS 5 – Land Acquisition and Involuntary Resettlement
• PS 6 – Biodiversity Conservation and Sustainable Management of Living Natural Resources
• PS 7 – Indigenous People• PS 8 – Cultural Heritage
E. Independent Review All Category A and certain
Category B Equator Principles-covered project finance transactions, and any Equator Principles-covered project related corporate loans that trigger Equator Principle 7 “high risk impacts” require review by an independent environmental and/or social expert not associated directly with the borrower. Independent review may be required of other ESRM Covered Category A transactions in “areas of high caution” (see above) or of transactions subject to certain ESRM sector standards (as described on pp. 5-7), as deemed appropriate by Citi Independent Risk.
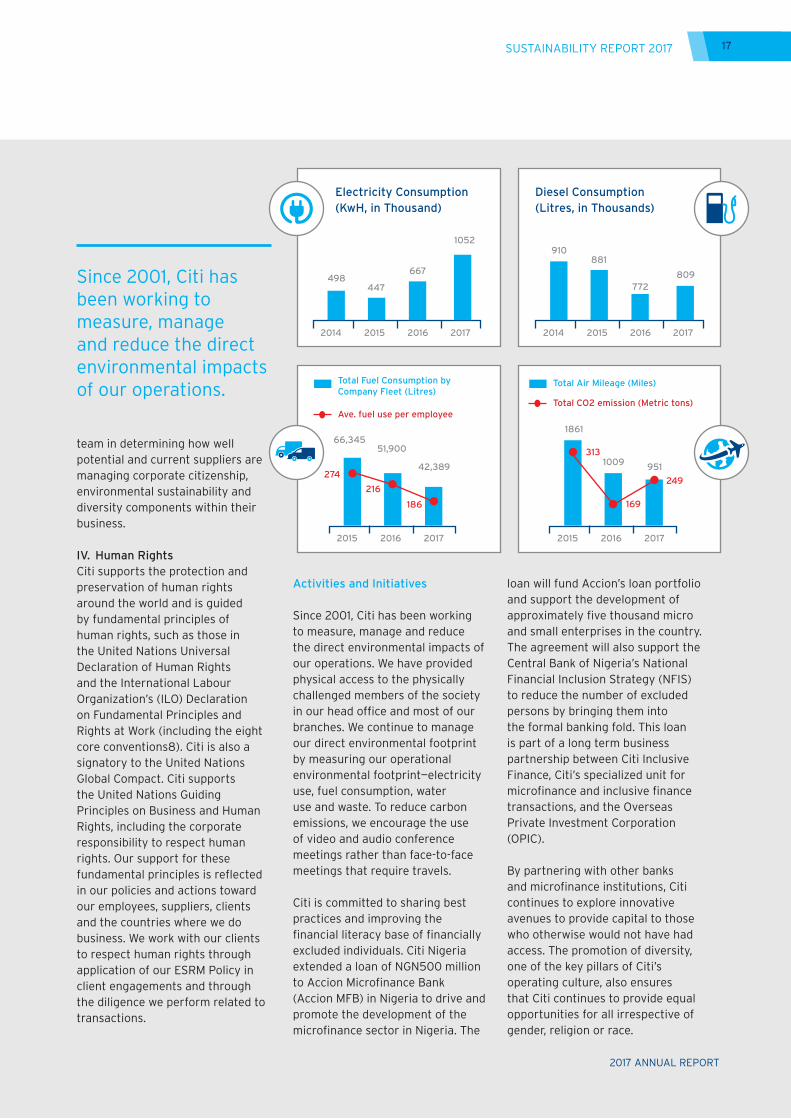
III. Operations and Supply ChainSince 2001, Citi has been working to measure, manage and reduce the direct environmental impacts of our operations. Our efforts reduce costs, enhance work environments and productivity, and enable us to speak from a position of experience when our clients need support.
The two key elements of Citi’s Supply Chain Diversity and Sustainability Program are i) Citi’s Statement of Supplier Principles, and ii) the Corporate Responsibility Questionnaire. Citi’s Statement of Supplier Principles communicates our values related to ethics, sustainability and human rights. The principles have been circulated to our top approved suppliers and continue to be socialized and communicated internally and externally. Citi also engages suppliers through its Corporate Responsibility Questionnaire (CRQ). This tool assists the procurement
2017 ANNUAL REPORT
SUSTAINABILITY REPORT 2017
2017 ANNUAL REPORT
17
team in determining how well potential and current suppliers are managing corporate citizenship, environmental sustainability and diversity components within their business.
IV. Human RightsCiti supports the protection and preservation of human rights around the world and is guided by fundamental principles of human rights, such as those in the United Nations Universal Declaration of Human Rights and the International Labour Organization’s (ILO) Declaration on Fundamental Principles and Rights at Work (including the eight core conventions8). Citi is also a signatory to the United Nations Global Compact. Citi supports the United Nations Guiding Principles on Business and Human Rights, including the corporate responsibility to respect human rights. Our support for these fundamental principles is reflected in our policies and actions toward our employees, suppliers, clients and the countries where we do business. We work with our clients to respect human rights through application of our ESRM Policy in client engagements and through the diligence we perform related to transactions.
Activities and Initiatives
Since 2001, Citi has been working to measure, manage and reduce the direct environmental impacts of our operations. We have provided physical access to the physically challenged members of the society in our head office and most of our branches. We continue to manage our direct environmental footprint by measuring our operational environmental footprint—electricity use, fuel consumption, water use and waste. To reduce carbon emissions, we encourage the use of video and audio conference meetings rather than face-to-face meetings that require travels.
Citi is committed to sharing best practices and improving the financial literacy base of financially excluded individuals. Citi Nigeria extended a loan of NGN500 million to Accion Microfinance Bank (Accion MFB) in Nigeria to drive and promote the development of the microfinance sector in Nigeria. The
loan will fund Accion’s loan portfolio and support the development of approximately five thousand micro and small enterprises in the country. The agreement will also support the Central Bank of Nigeria’s National Financial Inclusion Strategy (NFIS) to reduce the number of excluded persons by bringing them into the formal banking fold. This loan is part of a long term business partnership between Citi Inclusive Finance, Citi’s specialized unit for microfinance and inclusive finance transactions, and the Overseas Private Investment Corporation (OPIC).
By partnering with other banks and microfinance institutions, Citi continues to explore innovative avenues to provide capital to those who otherwise would not have had access. The promotion of diversity, one of the key pillars of Citi’s operating culture, also ensures that Citi continues to provide equal opportunities for all irrespective of gender, religion or race.
Electricity Consumption (KwH, in Thousand)
Diesel Consumption (Litres, in Thousands)
498447
667
1052
2014 2015 2016 2017
910881
772809
2014 2015 2016 2017
66,345
274
216
186
51,900
42,389
2015 2016 2017
1861
313
169
249
1009 951
2015 2016 2017
Total Fuel Consumption by Company Fleet (Litres)
Ave. fuel use per employee
Total Air Mileage (Miles)
Total CO2 emission (Metric tons)
Since 2001, Citi has been working to measure, manage and reduce the direct environmental impacts of our operations.
2017 ANNUAL REPORT
SUSTAINABILITY REPORT 2017

2017 ANNUAL REPORT
18

2017 ANNUAL REPORT
19
Business Report
2017 ANNUAL REPORT
20
Corporate and Investment Banking
Citi’s Corporate & Investment Banking (CIB) Group’s key business objective remains to be the strategic advisor of choice to our valued clients, by providing differentiated industry advice and expertise. Citi offers a broad range of products including; Corporate Finance, Investment Banking, Transaction Services (Cash Management, Trade Products and Custody Services), Treasury services (Fixed Income, currencies and commodities) and structured solutions to meet the needs of our clients.
Citi continues to face competitive pressure with the local presence of regional and global banks such as Rand Merchant Bank (RMB), Barclays, Standard Chartered (SC) and JP Morgan, and Goldman Sachs on select transactions. With this backdrop, Citi’s CIB team has remained focused and consistent in delivering best in class product solutions and services to meet the needs of its clients.
Citi remains committed in supporting its clients to successfully navigate market volatility driven by the challenging backdrop of persistently low crude prices, providing the necessary risk
management advice and solutions, and remains confident in the country’s long term economic prospects as well as that of Citi’s rapidly growing client base.
Despite initial macro-uncertainty from the UK Brexit vote and the U.S. presidential elections, global corporates in 2017 experienced a significant recovery with equity valuations reaching a peak levels with a median forward P/E of 18x globally and 20x in the U.S. The U.S. announced a tax reform as well as a monetary policy normalization regime expected to involve higher corporate earnings, modest rate hikes and yield expansion that may have an impact on portfolio outflows, though emerging markets are expected to remain resilient.
By the third quarter of 2017, Nigeria’s economy had exited negative growth territory, demonstrating real GDP growth of 1.40%, (Q2 2017 +0.55%), a reversal of the gloomy picture at the end of 2016 - an economic recession evidenced by multiple quarters of negative growth. Real GDP growth in FY 2016 amounted to -1.5%, the worst full-year decline in twenty-five years - as both oil and non-oil GDP contracted. The improvement witnessed in 2017 was largely attributed to improved oil production and price recovery in the global markets. The real sector (trade, manufacturing, finance, insurance, information technology) is yet to recover fully, hence growth is observed as volatile and vulnerable to shocks.
The Central Bank of Nigeria (CBN) introduced an Importers & Exporters window in April 2017 which significantly impacted the FX market as the gap between the official and the parallel market exchange rate narrowed for the
first time, and has remained stable to date at c.US$/NGN360-365. Portfolio inflows have also since returned via this window, reaching over $10bn in aggregate by September 2017 and lifting the Nigerian Stock Exchange, which is at an eight-year high, with a market capitalization of over 40,000. The apex bank had earlier introduced the sale of FX forwards and futures that provided some much needed comfort to manufacturers and relieving pressure on the parallel market.
Following the decision of the Monetary Policy Committee at the fourth meeting of 2016 to raise the policy rate (MPR) by 200bps to 14% against market consensus, the Committee held the MPR constant through 2017, despite having met six times through the year, and retained the Cash Reserve Requirement (CRR) on private and public sector deposits at 22.5%, the Liquidity Ratio (LR) at 30% and the asymmetric corridor at +200bps/-500bps. Analysts believe that the overarching factor guiding the MPC’s tight regime is the quest to attract and retain foreign portfolio inflows. Going forward, the MPC may maintain its tight policy regime longer than expected as global investors monitor recent developments in the U.S. Federal Reserve’s monetary policy normalization process and its impact on capital flows to emerging markets.
Gross external reserves stood at $40.4bn by early January 2018, up from $25.84bn a year earlier, an increase attributed primarily to rising crude revenue due to a recovery in global oil prices, increased portfolio inflows, and the success of Nigeria’s Eurobond offerings. On November 7 2017, Nigerian President Muhammadu
Mudassir AmrayHead of Corporate and Investment Bank
20
2017 ANNUAL REPORT
21
Citi remains focused on being the trusted advisor to its clients, making the bank their first port of call and ensuring that Citi delivers the best possible products and services to them in a seamless manner.
Buhari presented a record budget to lawmakers to boost the nation’s spending by 18% in 2018 in a bid to further stimulate growth in an economy that had just reversed a full-year contraction for the first time in over two decades. Buhari asked lawmakers to allow his government to spend NGN8.63tn ($283bn) in 2018 in a proposal based on a projected oil price of $45.00 per barrel, and daily oil production of 2.3mn barrels. The administration is also continuing the theme of recovery through infrastructure spending, allocating 28% (NGN 2.42tn) to this, focusing on Power, Transportation, & Agriculture. Non-oil revenue of NGN4.17tn ($13.7bn) is to account for almost double oil revenue NGN2.44tn.
Citi continues to dialogue closely with its clients providing creative solutions to their businesses while financing their needs in conjunction with the bank’s product partners. Citi also leveraged on its global network to support Nigerian corporates as they expand their businesses in the region and other locations.
Global economic activity is projected to pick up pace in 2018 (3.7% growth estimate over 3.6% in 2017 according to the IMF), especially in emerging market and developing economies, with a 4.5% target according to the World Bank, relative to 2.2% in advanced economies. According to a Reuters poll, China is expected to grow at 6.4% in 2018 (down from 6.8% in 2017), while India is expected to grow at 7.3% in 2018 (up from 7% in 2017).
Capital inflows are expected to remain at sustained levels in emerging markets, due to strong
recovering economic growth in the west and sustained growth outlook in China and India, despite recent property and debt shocks. Sub-Saharan Africa continues to offer a mixed picture; whilst economies like Cote D’Ivoire and Tanzania’s have continued to grow at a pace faster than most in the continent, both have shown signs of slowing; Cote d’Ivoire due to a slump in cocoa prices, mutiny and workers’ strikes. Angola, Ghana, Nigeria and other commodity dependent economies have experienced a tepid recovery from recession largely due to the recent oil-price recovery in global markets. They seek to attract continuous offshore inflows through internal monetary policies while implementing internal reforms aimed at revenue base diversification.
The Nigerian economy is expected to witness sustained recovery in 2018 with a growth estimate of 2.5% according to the World Bank with promising prospects from the non-oil sector which remains relatively buoyant, particularly in agricultural production and infrastructure development. Crude oil prices are expected to remain at the recent levels above US$60 a barrel (Brent futures reaching $67.12, levels unprecedented since May 2015), as markets gauge the long term effects of production cuts by OPEC and Russia, and anti-government rallies in Iran.
Nigeria weathered macroeconomic headwinds in 2017 that led to a recovery of GDP growth, and has arguably begun to witness the fruit of its drive to improve non-oil revenue generation while focusing on infrastructure spending. Within this backdrop, there are some opportunities for us to create value for our clients, across equity
capital markets (rights issues and primary equity offerings within an improved valuation environment), debt capital markets (sustained interest among FIs on the back of multiple successful sovereign & FI issuances), and advisory (corporates seeking foreign strategic partnerships to bring in some much needed capital). Citi continues to be a trusted advisor to many of its clients, as we always would be side by side with our clients providing our advice, our reach and resources to support their growth plans.
Citi remains focused on being the trusted advisor to its clients, making the bank their first port of call and ensuring that Citi delivers the best possible products and services to them in a seamless manner. In this regard, the team has continued to surpass expectations, working with Citi’s product partners across electronic banking, cash, liability management, mergers & acquisitions, equity & debt capital markets, trade and treasury. Citi is committed to the continuous growth and development of talent, as this remains the key differentiator for Citi.
2017 ANNUAL REPORT
22
Risk Management
The year 2017 started on an insipid note, as the economy, which had plunged into recession in 2016 remained characterized by foreign exchange crisis cum capital controls, declining foreign exchange reserves and elevated inflation. However, there was a slight turnaround in the country’s economic metrics in the second half of the year – with positive GDP growth of 0.55% in Q2 ’17, and the country closing the year with annual positive growth of 0.44%. The growth was driven by driven by improved access to foreign exchange – occasioned by improved liquidity in the foreign exchange markets and the accretion to the foreign exchange reserves; the game changer was the introduction of Investors’ and Exporters’ (I&E) Forex Window by the Central Bank of Nigeria in April 2017.
The decision by OPEC and major non-OPEC oil producers to cut oil output in December 2016 for an initial period of 6months till June 2017 to address the glut that had characterized the markets provided the support for the turnaround in the prices of crude. The agreement by the OPEC and
non-OPEC members to extend the deal till end of 2018, along with spontaneous geopolitical tension, provided sufficient support for crude prices – with Brent crude firming above the $60pb in November 2017 – the highest level since 2014. Nigeria continues to benefit from the output cut that was agreed in December 2016 – as it was exempted from the production cap; hence, it remains one of the major beneficiaries of the price recovery, given the stability in its oil production as the ongoing engagement with the Niger Delta stakeholders has ensured limited disruptions to oil installations in the region.
The country’s economic metrics remained on the positive trajectory in the second half of the year – with strong traction in the key economic metrics – specifically with respect to foreign exchange markets, CPI, foreign reserves and crude output and prices. The stability in the country’s oil output, in addition to its exemption from OPEC’s production cap, and the recovery of prices at the international market resulted in strong accretion to the reserves, which provided the support for Central Bank’s spontaneous interventions in the foreign exchange markets. This, together with the sustained inflows by portfolio investors into the I&E’s FX Window, resulted in marked improvement in foreign exchange liquidity in the markets – and the contraction in past due trade obligations across the banking industry. Of particular note is that Nigeria’s exemption from OPEC’s output restriction provided a significant upside for the country’s revenues – as the crude price remained significantly above the budget benchmark.
The Federal Government’s pace at addressing the structural weakness in the economy through its Economic Recovery and Growth Plan (ERGP) remained much slower than anticipated. The government’s significant reliance on oil to drive its exports and growth remains a key challenge. Whilst the recovery of the oil price and the uptick in oil production have led to the oil revenues outperforming the government’s budget, and to an overall improvement in the country’s metrics, the damage to the economy occasioned by the oil shock of the past two years is yet to be undone, and the weakness is expected to extend into medium term.
Though the government made some progress at increasing non-oil revenues through the broadening of tax base and enforcement of compliance, the impact has been limited – with tax revenues still at less than 20% of the country’s total. The challenges on the diversification of the revenues continue to negatively impact potential growth.The relatively high non-performing loans of Nigerian banking industry on account of the macro issues that have characterized the economy between 2014 and 2016 remain a challenge for the regulators and the players. While the issue was exacerbated by the increased borrowing costs in the second half of the year, the recovery in the crude, the accretion to the foreign reserves and the return of the economy to positive growth trajectory provide some potential upside in the industry’s prognosis. Furthermore, some of the industry’s oil & gas exposure are likely to start “performing”, if the strong recovery in crude price that has
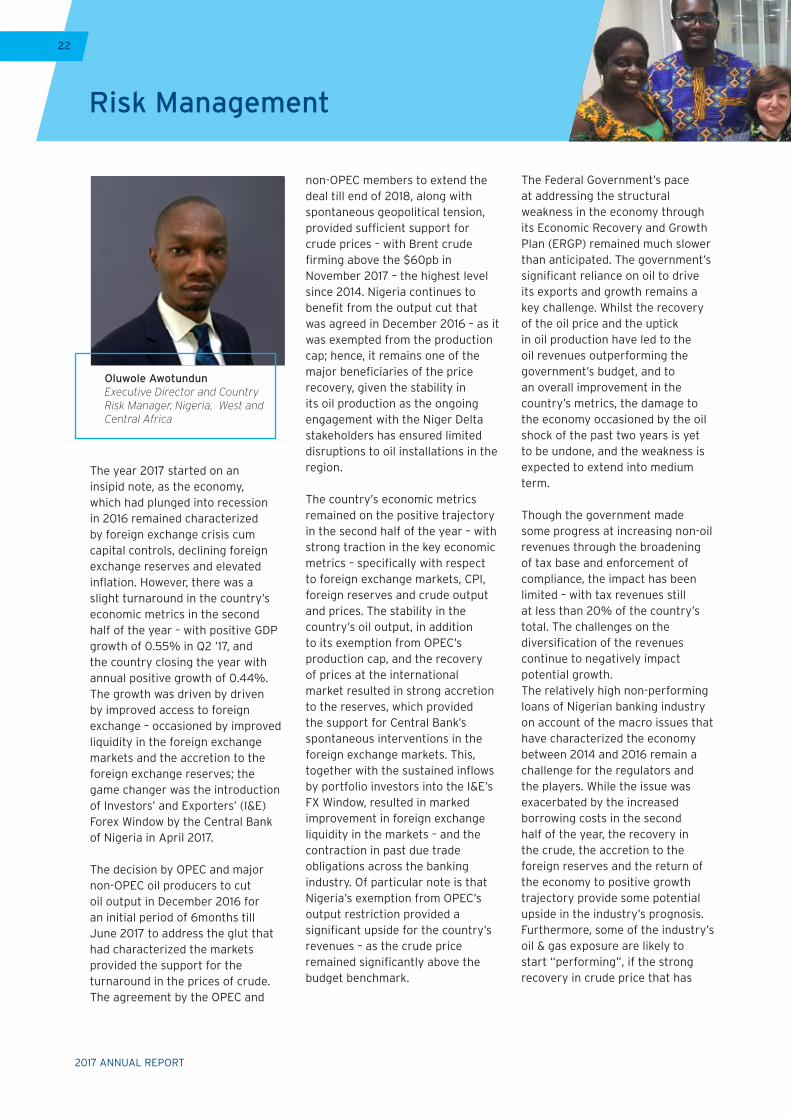
Oluwole AwotundunExecutive Director and Country Risk Manager, Nigeria, West and Central Africa
22
2017 ANNUAL REPORT
23
characterized the markets in the past few months is sustained.
Despite the slight uptick in the country’s GDP in the second half of the year, corporate performance remained constrained on account of the legacy macro issues, which was partly exacerbated by the monetary tightening – as sales were constrained by the absence of liquidity to support effective demand.
On the outlook for 2018; the expectation is that the ongoing recovery in the Nigerian economy will be sustained. However, political risks may likely depress the growth momentum in the second half of the year – as politics upstages policy implementation, in addition to potential regression in investments by local and foreign investors. Furthermore, the government’s significant reliance on oil to drive its exports and growth also presents a significant downside to the country’s prognosis.
With growths normalizing in a number of developed economies,
there are risks of potential monetary tightening by central banks as there are indications they may proceed with the unwinding of some of the financial crisis-era support – given the uptick in the key metrics and the strong growths that have been recorded in most of the economies. We expect the likely spike in interest rates to exacerbate the likely reduction in foreign flows as political risk heightens in the run-up to the 2019 general elections. Whilst we expect the positive traction that we observed in the economy in the second half of the year with respect to some of the key indicators to continue in the near term, the economy would remain vulnerable to the residual macro challenges, which continue to hunt some of the corporates and financials. Citi Nigeria’s portfolio is not immune to these challenges, as we have observed some weaknesses in the profiles of some of its obligors. However, the bank has taken measures to manage its exposure to these clients.
Overall, Citi portfolio is expected to remain relatively stable – as the bank would continue to operate in line with its target market definitions and portfolio strategy. We will continue to keep a tab on the dynamics in both the local and global politics and economics – making adjustments to our risk appetite and assets creation – as necessary.
On the outlook for 2018;
the expectation is that
the ongoing recovery in
the Nigerian economy
will be sustained.
2017 ANNUAL REPORT
2017 ANNUAL REPORT
24
Citi’s award winning e-banking platform CitiDirect, alongside its mobile tablet version (CitiDirect BE Mobile) remains Citi’s single channel for connecting and enabling clients to access payment products in the payments system.
Treasury and Trade Solutions
Cash ManagementCiti’s Liquidity Management Solutions, enhanced by Host–to-Host connectivity for improved operating efficiency, remains a defining differentiator with Citi’s clients and in the market place. Citi’s broad proposition is to enable channel innovation for clients to perform their liquidity and balance sheet management activities efficiently, supported by Citi’s global proprietary platforms. Citi is well positioned to partner with Treasurers to maximize the power of their balance sheets for improvement in profitability.
Citi continues to build on the successes of the payment system reforms in improving the risk architecture around delivery channels and products, while enhancing the capacity of the market to support bulk payments for instant delivery through the clearing system. Citi implemented the NIBSS Automated Payments System (NAPS) and completely cut-over from NIBSS Electronic Funds Transfer (NEFT), deriving the benefits of the NIBSS Instant Payment (NIP) product for the bulk / batch processing option. Citi effectively enhanced its capacity for bulk payment to near instant
delivery across the bank’s MassPay platform.
The managed liberalized FX market environment in the year 2016 which persisted till the earlier months of 2017 was not without its challenges as distortions to the flow of liquidity in the system generated significant volatilities in the pricing of liquidity at the short end of the yield curve. This further accentuated the need for a more nimble payments infrastructure for just-in-time movement of liquidity to settle obligations as well as access FX opportunities across the financial system. The achievements in the payments system from an infrastructure perspective enabled Treasurers operate in a more nimble and flexible manner to meet the exigencies of business requirements.
Citi’s award winning e-banking platform CitiDirect, alongside its mobile tablet version (CitiDirect BE Mobile) remains Citi’s single channel for connecting and enabling clients to access payment products in the payments system. The aim is to continue to draw on the strength of Citi’s infrastructure and digitization drive to develop solutions and leverage market infrastructure to maintain the bank’s competitive edge in the market.
Trade Products In 2017, Citi focused on the delivery of customized Trade Services Products - Letters of Credit, Bills for Collection and Guarantees as well as Official Agency Supported Financing. In the face of the FX challenges witnessed during the first half of 2017, Citi continued to support clients with structured products that enabled continued operations. During the year Citi arranged ECA-backed financing to support the CAPEX needs of its
client. Such loans have significant impact in developing markets such as Nigeria and provide a template for other borrowers both in Nigeria and in the African region. They also increase the visibility and credibility of Nigerian corporates in the international financing market.
Citi engaged clients to commence the initiation of Letters of Credit on Citi’s proprietary-customer Trade front-end platform - CitiDirect for Trade, putting them in the forefront of digitization. Citi’s best-in-class working capital solution - Supply Chain Finance (SCF) program enabled the bank’s clients to benefit from balance sheet optimization and increased access to alternative funding, while also accessing the efficiency benefits of Citi’s fully automated processing platform.
With relative stability in FX availability, envisaged increase in trade activity in 2018 and the backward integration focus of the Federal Government in a pre-election year, Citibank Nigeria is well positioned and adequately armed with trade solutions to ease the process for its clients, as the country
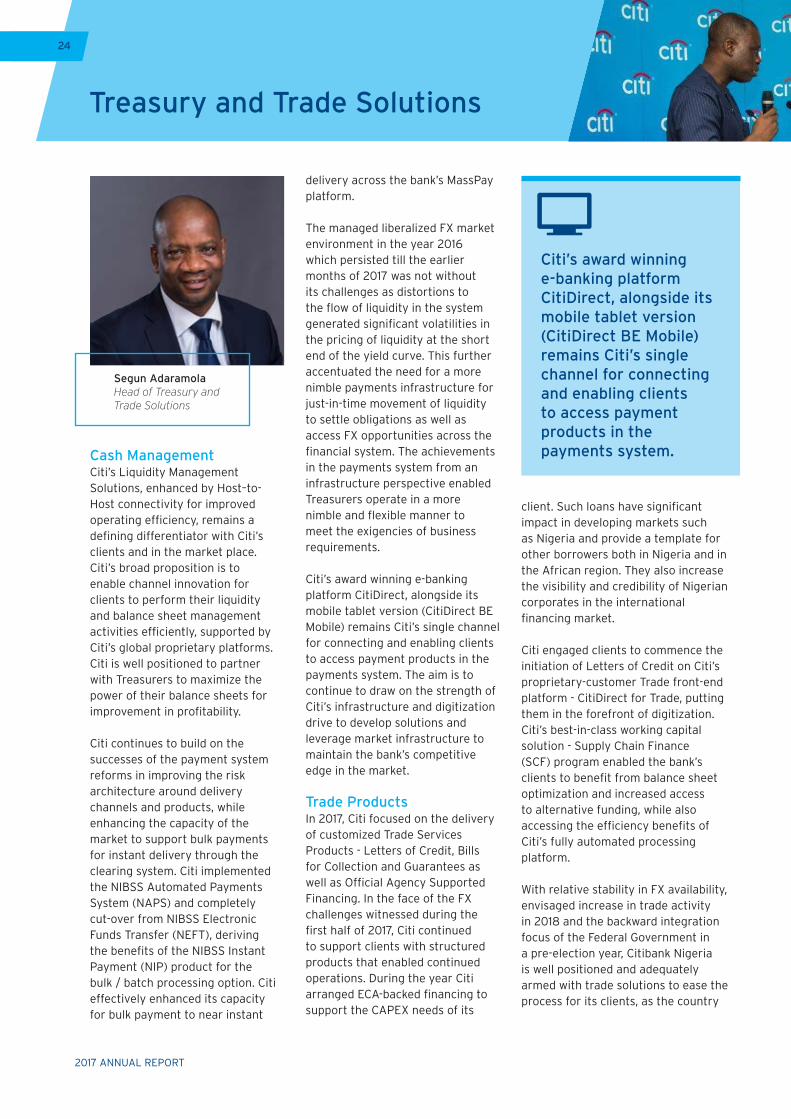
Segun AdaramolaHead of Treasury and Trade Solutions
24
2017 ANNUAL REPORT
25
moves towards import substitution and export promotion.
Solution SalesPositive macroeconomic trends helped in restoring some confidence in the Nigerian economy. This led to re-invigoration of activities and surfacing of opportunities for further investment in the country. Engagement with clients improved from prior year as the restriction on business activity, which had been imposed by the earlier FX scarcity, became more relaxed with the improved availability of FX. Citi also witnessed a number of clients centralizing their operations for efficiency.
Citi actively engaged with clients and organized a number of thought leadership events, which included a Digitization event, a Cybersecurity Roadshow for Public & Private Sector clients, a Liquidity Management seminar, a Tax event and an Electronic Banking practical workshop, among others. In 2017, Citi Nigeria won the Euromoney Cash Management Award for “Best Domestic Cash Manager in Nigeria” for the 10th consecutive year. This demonstrates Citi’s continued impact on its
clients’ banking activities. Citi also received the prestigious Adam Smith award as Highly Commended in the “Best in Class Treasury Solution in Africa” category for the solution suite implemented for Nigerian Breweries Plc.
Citi is poised to follow through on the opportunities that surfaced in 2017 and deepen engagement with its clients accordingly. The goal is to stay close to clients and ensure we remain their trusted partner for the provision of transaction banking solutions.
ImplementationsCiti’s Implementation team was able to manage the delivery of Cash, Cards and Trade products to clients using client-friendly implementation models. Onboarding experience for clients was consistently maintained, which resulted in faster and efficient solutions delivery of mandates received.
Implementation of tailored electronic solutions that provide greater efficiency were popular amongst the bank’s clients in the course of the year with increased requests for robust integration with clients’ Enterprise Resource
Planning (ERP) systems. These solutions enabled Citi clients to enhance their organizational work flow process, improve their overall productivity while aligning with various regulatory requirements.
In 2018, Citi will continue to focus on the enhancement of its service proposition to clients by deploying value-added and innovative solutions which will enable the bank’s clients to optimize their operating performance.
Citi Nigeria won the Euromoney Cash Management Award for “Best Domestic Cash Manager in Nigeria” for the 10th consecutive year.
Citi will continue to focus on the enhancement of its service proposition to clients by deploying value-added and innovative solutions which will enable the bank’s clients to optimize their operating performance.
2017 ANNUAL REPORT
2017 ANNUAL REPORT
26
Global Subsidiaries Group
Citi Nigeria’s Global Subsidiaries Group (GSG) remains part of a global client coverage force, harnessing the power of Citi’s unparalleled global network and delivering seamlessly to our clients. The team framework is designed to mirror the clients’ organizational structure and continues to create a unique alignment between the clients’ Treasury organizations and Citi’s network. Citi’s clients value the depth of Citi’s offering, universal systems, well-orchestrated global teams and extensive local market knowledge. In the last year, the bank’s clients with their global Treasury teams, especially relied on unique insights from the Citi team to interpret the rather dynamic and challenging economic environment in Nigeria, to support their business sustainability.
The year 2016 was quite historic in the Nigeria economic landscape, with negative growth recorded for four consecutive quarters and the country ultimately recording its first recession in over two decades. Many factors were contributory but severe Foreign Exchange shortages
considerably dampened the business environment.
Citi played quite a pivotal role in supporting clients’ needs during this crucial period, leveraging its diversified foreign investor footprint and cross-border Trade Finance capacity. In particular, Citi deployed import and Foreign Exchange solutions which enabled our clients secure the much needed production inputs to remain in business. The critical supply chain partners of Citi’s client base were also integrated into the bank’s trade solution suite.
The Central Bank of Nigeria (CBN) Foreign Exchange reforms in June 2016 were laudable and provided some of the much needed flexibility. In particular, the new Foreign Exchange policy enabled hedging opportunities and the bank worked with several clients to improve their cost certainties. The ensuing naira devaluation increased Citi clients’ input costs, coupled with a change in the fuel price regime which led to a sharp increase in the pump price of fuel. Also most market operators had foreign currency liabilities, which resulted in exchange losses when the exchange rate moved adversely. The CBN tightened the monetary policy rate by 200bps during the year to control inflationary pressures and interest costs increased, further aggravating business costs.
All of these cost escalations squeezed out business margins for most companies and inevitably led to outright losses in several others. While some market operators had sufficient capacity and financial flexibility to withstand the market
stresses, others were more vulnerable. Citi worked closely with its clients to lower their financial risks. Citi’s rich credit culture, advanced credit monitoring techniques and proactive screening of the credit portfolio against key stress factors, ensured that Citi continued to maintain a healthy portfolio of credit clients, and defend shareholder value.
While credit availability generally reduced in the market due to cautious lending appetite in the bank market, Citi continued to provide competitively priced loans to clients in its target market. Citi’s scalable supply chain financing solution further deepened Citi’s reach, to provide financing options to its clients’ supply chain. Where some companies increased the number of their banking providers, ostensibly to improve access to Foreign Exchange, Citi’s multi-banking technology platforms/systems proved invaluable to optimizing liquidity across banking system applications and enhancing overall operating efficiency.
Citi remained key banking providers to strategic Industry segments. Citi especially dominated the wallets of a number of clients during the year, on the strength of the bank’s product innovation and dynamic response to clients’ key business imperatives. Notably, Citi won landmark client mandates for Capital Raising and debt restructuring.
In Citi’s annual Client feedback survey, most clients defined their relationship with the Citi team as Trusted Advisor relationships, underscoring the strength of
Nneka EnwerejiExecutive Director and Head of Global Subsidiaries Group
26
2017 ANNUAL REPORT
27
Citi played quite a pivotal role in supporting clients’ needs during this crucial period, leveraging its diversified foreign investor footprint and cross-border Trade Finance capacity.
our partnerships. The quality of Citi’s client engagement was also validated in the KPMG 2016 Banking Industry Customer Satisfaction survey which for the third consecutive year voted Citibank Nigeria as the Most Customer Focused Bank in the wholesale banking category.
During the year, Citi continued to invest in its GSG team, which remains fundamental to the bank’s business aspirations. Citi deployed various talent intervention programs, including training courses and short-term assignments with other businesses. In-house partnerships were crucial to the bank’s achievements during the year and GSG collaborated very effectively with the various product, risk and control functions, to drive our business agenda. The bank’s network connectivity remains a key advantage and Citi continued to optimally exploit this.
Overall, while it was a tough year, it was a very accomplished one for
Citi’s business, as Citi differentiated itself as a trusted partner to its esteemed client base.
2017 OutlookThe Nigeria economic growth forecasts for 2017 signal some growth, albeit marginal. This would be driven by higher or at least more stable oil prices, continued containment of the Niger Delta militancy and better traction on economic policy implementation. Foreign Exchange availability would no doubt be a key enabler for the anticipated growth momentum and it is a good sign that the CBN have significantly boosted market supply in the first couple of months.
Citi’s continued insights on the business terrain, strong knowledge of our clients’ business dynamics, strategic client partnerships, innovative and proactive solutions should once again serve the bank well to steer the business to another record performance amidst the market uncertainties.
2017 ANNUAL REPORT
2017 ANNUAL REPORT
28
Citi organized a client seminar themed Charting Industry Progress in Nigeria, designed to bring together market regulators, participants and other industry experts to discuss and explore the Nigerian asset custody ecosystem vis-à-vis global developments
Aderonke AdetoroSecurities CountryManager
Direct Custody and Clearing
2017 Overview
2017 began with quite some optimism against the recessionary back drop of 2016. Gross Domestic Product (GDP) turning positive in the second quarter of 2017 – progressively increasing from -0.52 per cent in quarter one to 0.72 per cent in quarter two to 1.40 per cent in quarter three of 2017, with the economy steadily clawing its way out of recession (2016 GDP -1.58 per cent). Foreign exchange (FX) reserves have continued to grow, with a foreign reserve balance of USD 37.7 billion as at 21 December 2017. The FX reforms implemented by the Central Bank of Nigeria (CBN) have supported the improved performance in the financial markets.
A number of policies geared towards the FX environment were implemented by the CBN in 2017. Some of these policies include the establishment of the Investors’ and Exporters’ (I&E) FX Window which took effect in April 2017; this was predicated on a willing buyer and willing seller transaction execution, with the aim of boosting liquidity in the FX market and ensuring the
timely execution and settlement of eligible transactions. The Nigerian Autonomous Foreign Exchange (NAFEX) fixing was also introduced. This is the reference rate for FX activities in the I&E FX window representing the spot FX market rate in the window.
On the capital market front, there was a notable resurgence in the equity market in 2017, especially following the commencement of the I&E FX window. According to the Nigerian Bureau of Statistics (NBS), Foreign Portfolio Investment (FPI) remained the largest component of capital importation into Nigeria in the third quarter of 2017, at 67 per cent, with this component exhibiting the highest growth of the three capital importation categories (FPI, Foreign Direct Investment (FDI) and Other Investments) with a 200 per cent year-on-year growth. The Nigerian Stock Exchange (NSE) market capitalisation grew by about 48.25 per cent on a year-to date basis as at 22 December 2017; a reflection of increased investor confidence and improved FPI flows into the Nigerian equities market. The NSE All Share Index as at 22 December 2017 stood at 38,522.14; close to the year high of 39,534.14 set on 7 December 2017. A low of 24,581.99 was seen on 6 March 2017 before the FX reforms began.
Fixed income yields on the other hand, closed the fourth quarter of the year at a low. At the final primary T-Bill auction for the year, the 182 day T-Bill was issued at 15 per cent, compared with 17.50 per cent during the first week of 2017. Yields on the 1 year note also fell from 18.685 percent to 15.75 percent. The benchmark 10 year government bonds has decreased by approximately 300 bps from January 2017 levels.
Within Direct Custody and Clearing (DCC), we continued to leverage Citi’s custody-related technology platforms and broad knowledge pool to support our domestic and foreign clients in 2017. Following the FX policy changes in 2017, there was an increase in Assets under Custody (AUC) compared to 2016. The overall year-on-year AUC growth is 68 per cent – with a growth of 62 per cent for FPI clients and 73 per cent for domestic clients. New client mandates were won during the year, and incremental deals from existing clients all led to a steady growth. In 2017, Citi organized a client seminar themed Charting Industry Progress in Nigeria, designed to bring together market regulators, participants and other industry experts to discuss and explore the Nigerian asset custody ecosystem vis-à-vis global developments while identifying opportunities for success transfer to help meet the needs of investors in the Nigerian capital market sector. The seminar
28
2017 ANNUAL REPORT
29
also provided informative sessions on the Nigerian economy and capital market through various presentations from the Securities and Exchange Commission (SEC), Central Securities and Clearing Systems PLC (CSCS), and NSE. The participants at the seminar were from various sectors including Asset Management, Financial Services and Advisory and Legal Services.
Throughout 2017 Citi also hosted a number of FPI clients as part of their sub-custodian annual due diligence visits. Through this medium, Citi provided the clients with in-depth discussions on the Nigerian economy, capital market developments as well as Citi’s custody service offering, its strengths and differentiating factors. Some capital market developments that occurred in 2017 include the market-wide implementation of the Electronic Certificate of Capital Importation System (eCCIS) by the CBN, Financial Markets Dealers Association (FMDA) and Association of Asset Custodians of Nigeria
(AACN) – to dematerialise the existing CCI process and provide increased efficiency in the issuance, tracking and transfer of CCIs as well as the launch of the fully SWIFT enabled system, TCS BaNCS, by the CSCS to improve efficiency in the depository and settlement services provided by the CSCS. The CSCS also issued a directive requiring all corporate and institutional investors to provide their Legal Entity Identifier (LEI) code which facilitates the identification of parties involved in any financial transaction – this takes effect on 1 January 2018.
2018 Outlook
Citi is optimistic about 2018, and expects GDP growth to continue its recovery. Oil production and the FX reserves will remain stable, giving foreign investors the confidence to put money into the Nigerian market. As a business, Citi will continue to provide global perspectives on best practices, working closely with the market infrastructure and regulators, on improving efficiency
As a business, Citi will continue to provide global perspectives on best practices, working closely with the market infrastructure and regulators, on improving efficiency in the Nigerian capital market.
in the Nigerian capital market. Simultaneously, Citi will continue to drive process automation and straight-through transaction process enhancements while also strengthening its risk management framework and procedures.
2017 ANNUAL REPORT
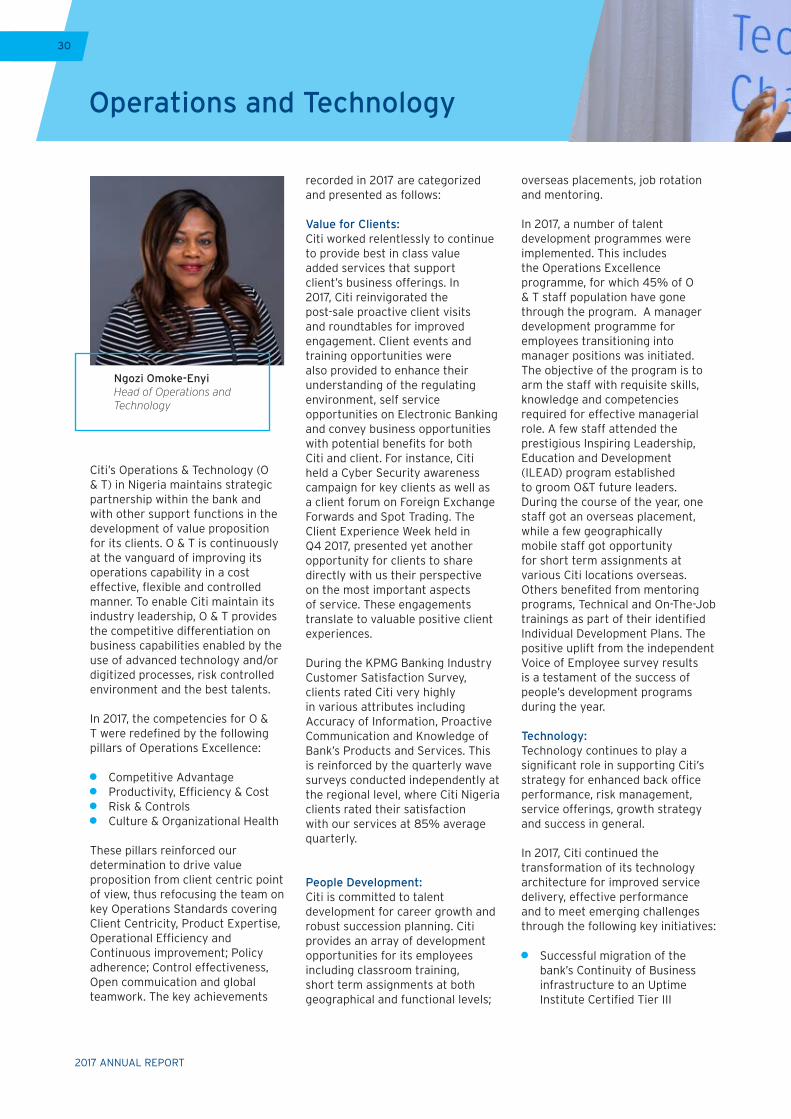
2017 ANNUAL REPORT
30
Operations and Technology
Citi’s Operations & Technology (O & T) in Nigeria maintains strategic partnership within the bank and with other support functions in the development of value proposition for its clients. O & T is continuously at the vanguard of improving its operations capability in a cost effective, flexible and controlled manner. To enable Citi maintain its industry leadership, O & T provides the competitive differentiation on business capabilities enabled by the use of advanced technology and/or digitized processes, risk controlled environment and the best talents.
In 2017, the competencies for O & T were redefined by the following pillars of Operations Excellence:
Competitive Advantage Productivity, Efficiency & Cost Risk & Controls Culture & Organizational Health
These pillars reinforced our determination to drive value proposition from client centric point of view, thus refocusing the team on key Operations Standards covering Client Centricity, Product Expertise, Operational Efficiency and Continuous improvement; Policy adherence; Control effectiveness, Open commuication and global teamwork. The key achievements
recorded in 2017 are categorized and presented as follows:
Value for Clients:Citi worked relentlessly to continue to provide best in class value added services that support client’s business offerings. In 2017, Citi reinvigorated the post-sale proactive client visits and roundtables for improved engagement. Client events and training opportunities were also provided to enhance their understanding of the regulating environment, self service opportunities on Electronic Banking and convey business opportunities with potential benefits for both Citi and client. For instance, Citi held a Cyber Security awareness campaign for key clients as well as a client forum on Foreign Exchange Forwards and Spot Trading. The Client Experience Week held in Q4 2017, presented yet another opportunity for clients to share directly with us their perspective on the most important aspects of service. These engagements translate to valuable positive client experiences.
During the KPMG Banking Industry Customer Satisfaction Survey, clients rated Citi very highly in various attributes including Accuracy of Information, Proactive Communication and Knowledge of Bank’s Products and Services. This is reinforced by the quarterly wave surveys conducted independently at the regional level, where Citi Nigeria clients rated their satisfaction with our services at 85% average quarterly.
People Development:Citi is committed to talent development for career growth and robust succession planning. Citi provides an array of development opportunities for its employees including classroom training, short term assignments at both geographical and functional levels;
overseas placements, job rotation and mentoring.
In 2017, a number of talent development programmes were implemented. This includes the Operations Excellence programme, for which 45% of O & T staff population have gone through the program. A manager development programme for employees transitioning into manager positions was initiated. The objective of the program is to arm the staff with requisite skills, knowledge and competencies required for effective managerial role. A few staff attended the prestigious Inspiring Leadership, Education and Development (ILEAD) program established to groom O&T future leaders. During the course of the year, one staff got an overseas placement, while a few geographically mobile staff got opportunity for short term assignments at various Citi locations overseas. Others benefited from mentoring programs, Technical and On-The-Job trainings as part of their identified Individual Development Plans. The positive uplift from the independent Voice of Employee survey results is a testament of the success of people’s development programs during the year.
Technology:Technology continues to play a significant role in supporting Citi’s strategy for enhanced back office performance, risk management, service offerings, growth strategy and success in general.
In 2017, Citi continued the transformation of its technology architecture for improved service delivery, effective performance and to meet emerging challenges through the following key initiatives:
Successful migration of the bank’s Continuity of Business infrastructure to an Uptime Institute Certified Tier III
Ngozi Omoke-EnyiHead of Operations and Technology
30
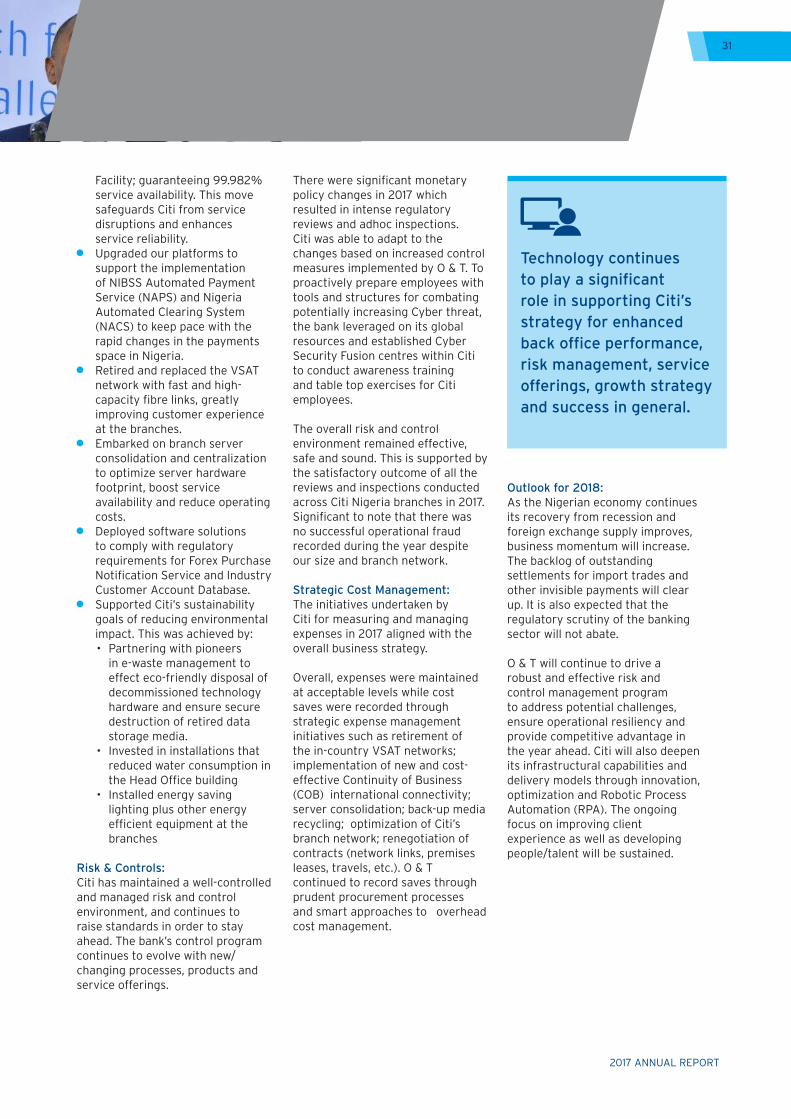
2017 ANNUAL REPORT
31
Technology continues to play a significant role in supporting Citi’s strategy for enhanced back office performance, risk management, service offerings, growth strategy and success in general.
Facility; guaranteeing 99.982% service availability. This move safeguards Citi from service disruptions and enhances service reliability.
Upgraded our platforms to support the implementation of NIBSS Automated Payment Service (NAPS) and Nigeria Automated Clearing System (NACS) to keep pace with the rapid changes in the payments space in Nigeria.
Retired and replaced the VSAT network with fast and high-capacity fibre links, greatly improving customer experience at the branches.
Embarked on branch server consolidation and centralization to optimize server hardware footprint, boost service availability and reduce operating costs.
Deployed software solutions to comply with regulatory requirements for Forex Purchase Notification Service and Industry Customer Account Database.
Supported Citi’s sustainability goals of reducing environmental impact. This was achieved by:• Partneringwithpioneers
in e-waste management to effect eco-friendly disposal of decommissioned technology hardware and ensure secure destruction of retired data storage media.
• Investedininstallationsthatreduced water consumption in the Head Office building
• Installedenergysavinglighting plus other energy efficient equipment at the branches
Risk & Controls:Citi has maintained a well-controlled and managed risk and control environment, and continues to raise standards in order to stay ahead. The bank’s control program continues to evolve with new/ changing processes, products and service offerings.
There were significant monetary policy changes in 2017 which resulted in intense regulatory reviews and adhoc inspections. Citi was able to adapt to the changes based on increased control measures implemented by O & T. To proactively prepare employees with tools and structures for combating potentially increasing Cyber threat, the bank leveraged on its global resources and established Cyber Security Fusion centres within Citi to conduct awareness training and table top exercises for Citi employees.
The overall risk and control environment remained effective, safe and sound. This is supported by the satisfactory outcome of all the reviews and inspections conducted across Citi Nigeria branches in 2017. Significant to note that there was no successful operational fraud recorded during the year despite our size and branch network.
Strategic Cost Management:The initiatives undertaken by Citi for measuring and managing expenses in 2017 aligned with the overall business strategy.
Overall, expenses were maintained at acceptable levels while cost saves were recorded through strategic expense management initiatives such as retirement of the in-country VSAT networks; implementation of new and cost-effective Continuity of Business (COB) international connectivity; server consolidation; back-up media recycling; optimization of Citi’s branch network; renegotiation of contracts (network links, premises leases, travels, etc.). O & T continued to record saves through prudent procurement processes and smart approaches to overhead cost management.
Outlook for 2018:As the Nigerian economy continues its recovery from recession and foreign exchange supply improves, business momentum will increase. The backlog of outstanding settlements for import trades and other invisible payments will clear up. It is also expected that the regulatory scrutiny of the banking sector will not abate.
O & T will continue to drive a robust and effective risk and control management program to address potential challenges, ensure operational resiliency and provide competitive advantage in the year ahead. Citi will also deepen its infrastructural capabilities and delivery models through innovation, optimization and Robotic Process Automation (RPA). The ongoing focus on improving client experience as well as developing people/talent will be sustained.
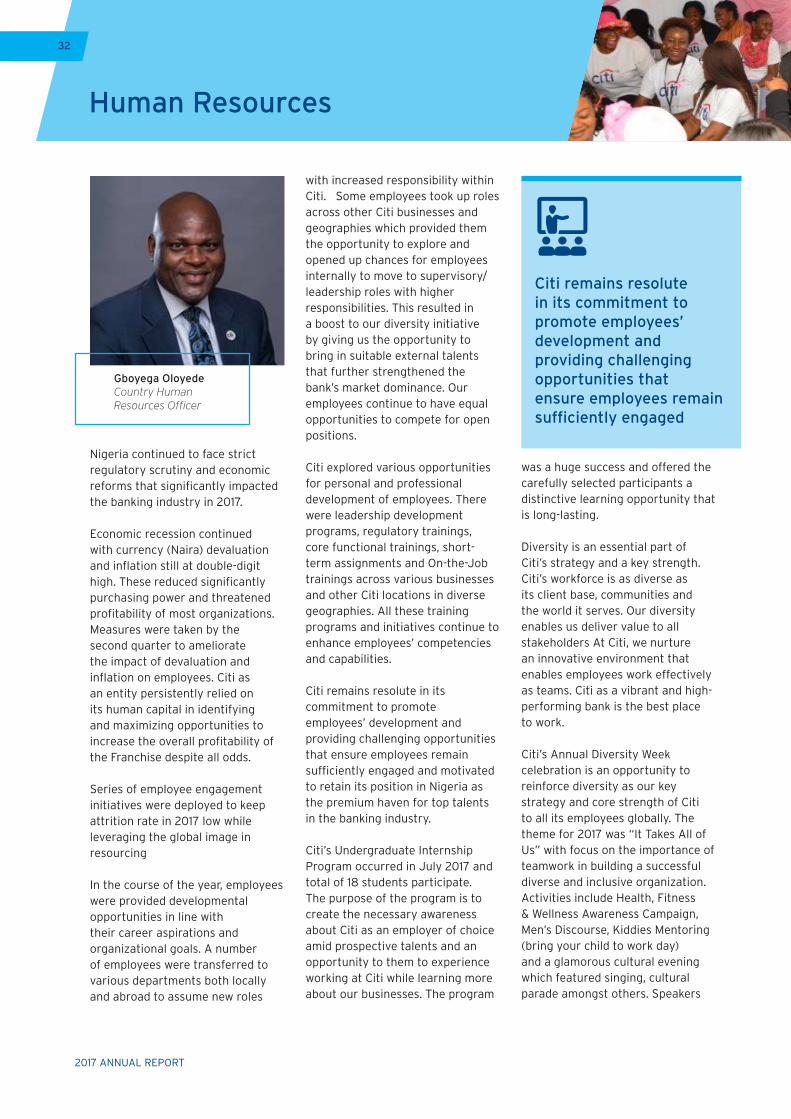
2017 ANNUAL REPORT
32
Human Resources
Nigeria continued to face strict regulatory scrutiny and economic reforms that significantly impacted the banking industry in 2017.
Economic recession continued with currency (Naira) devaluation and inflation still at double-digit high. These reduced significantly purchasing power and threatened profitability of most organizations. Measures were taken by the second quarter to ameliorate the impact of devaluation and inflation on employees. Citi as an entity persistently relied on its human capital in identifying and maximizing opportunities to increase the overall profitability of the Franchise despite all odds.
Series of employee engagement initiatives were deployed to keep attrition rate in 2017 low while leveraging the global image in resourcing
In the course of the year, employees were provided developmental opportunities in line with their career aspirations and organizational goals. A number of employees were transferred to various departments both locally and abroad to assume new roles
with increased responsibility within Citi. Some employees took up roles across other Citi businesses and geographies which provided them the opportunity to explore and opened up chances for employees internally to move to supervisory/leadership roles with higher responsibilities. This resulted in a boost to our diversity initiative by giving us the opportunity to bring in suitable external talents that further strengthened the bank’s market dominance. Our employees continue to have equal opportunities to compete for open positions.
Citi explored various opportunities for personal and professional development of employees. There were leadership development programs, regulatory trainings, core functional trainings, short-term assignments and On-the-Job trainings across various businesses and other Citi locations in diverse geographies. All these training programs and initiatives continue to enhance employees’ competencies and capabilities.
Citi remains resolute in its commitment to promote employees’ development and providing challenging opportunities that ensure employees remain sufficiently engaged and motivated to retain its position in Nigeria as the premium haven for top talents in the banking industry.
Citi’s Undergraduate Internship Program occurred in July 2017 and total of 18 students participate. The purpose of the program is to create the necessary awareness about Citi as an employer of choice amid prospective talents and an opportunity to them to experience working at Citi while learning more about our businesses. The program
was a huge success and offered the carefully selected participants a distinctive learning opportunity that is long-lasting.
Diversity is an essential part of Citi’s strategy and a key strength. Citi’s workforce is as diverse as its client base, communities and the world it serves. Our diversity enables us deliver value to all stakeholders At Citi, we nurture an innovative environment that enables employees work effectively as teams. Citi as a vibrant and high-performing bank is the best place to work.
Citi’s Annual Diversity Week celebration is an opportunity to reinforce diversity as our key strategy and core strength of Citi to all its employees globally. The theme for 2017 was “It Takes All of Us” with focus on the importance of teamwork in building a successful diverse and inclusive organization. Activities include Health, Fitness & Wellness Awareness Campaign, Men’s Discourse, Kiddies Mentoring (bring your child to work day) and a glamorous cultural evening which featured singing, cultural parade amongst others. Speakers
Gboyega OloyedeCountry Human Resources Officer
Citi remains resolute in its commitment to promote employees’ development and providing challenging opportunities that ensure employees remain sufficiently engaged
32
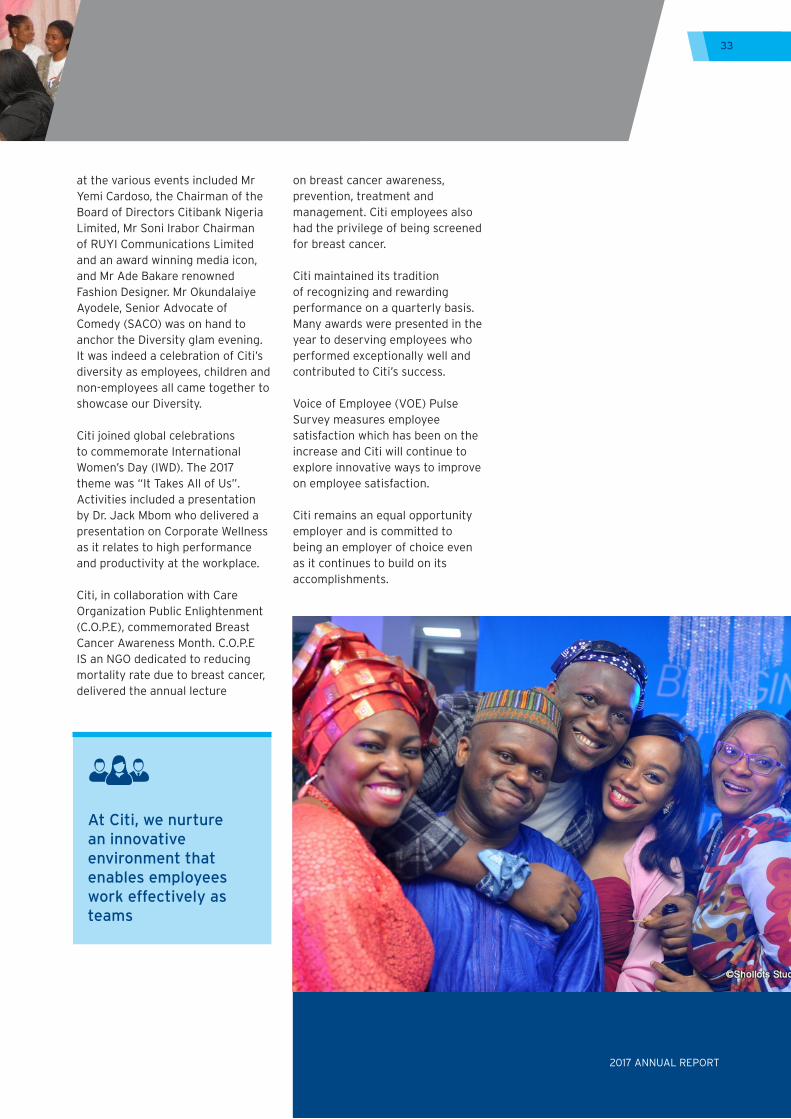
2017 ANNUAL REPORT
33
at the various events included Mr Yemi Cardoso, the Chairman of the Board of Directors Citibank Nigeria Limited, Mr Soni Irabor Chairman of RUYI Communications Limited and an award winning media icon, and Mr Ade Bakare renowned Fashion Designer. Mr Okundalaiye Ayodele, Senior Advocate of Comedy (SACO) was on hand to anchor the Diversity glam evening. It was indeed a celebration of Citi’s diversity as employees, children and non-employees all came together to showcase our Diversity.
Citi joined global celebrations to commemorate International Women’s Day (IWD). The 2017 theme was “It Takes All of Us”. Activities included a presentation by Dr. Jack Mbom who delivered a presentation on Corporate Wellness as it relates to high performance and productivity at the workplace.
Citi, in collaboration with Care Organization Public Enlightenment (C.O.P.E), commemorated Breast Cancer Awareness Month. C.O.P.E IS an NGO dedicated to reducing mortality rate due to breast cancer, delivered the annual lecture
on breast cancer awareness, prevention, treatment and management. Citi employees also had the privilege of being screened for breast cancer.
Citi maintained its tradition of recognizing and rewarding performance on a quarterly basis. Many awards were presented in the year to deserving employees who performed exceptionally well and contributed to Citi’s success.
Voice of Employee (VOE) Pulse Survey measures employee satisfaction which has been on the increase and Citi will continue to explore innovative ways to improve on employee satisfaction.
Citi remains an equal opportunity employer and is committed to being an employer of choice even as it continues to build on its accomplishments.
At Citi, we nurture an innovative environment that enables employees work effectively as teams
2017 ANNUAL REPORT
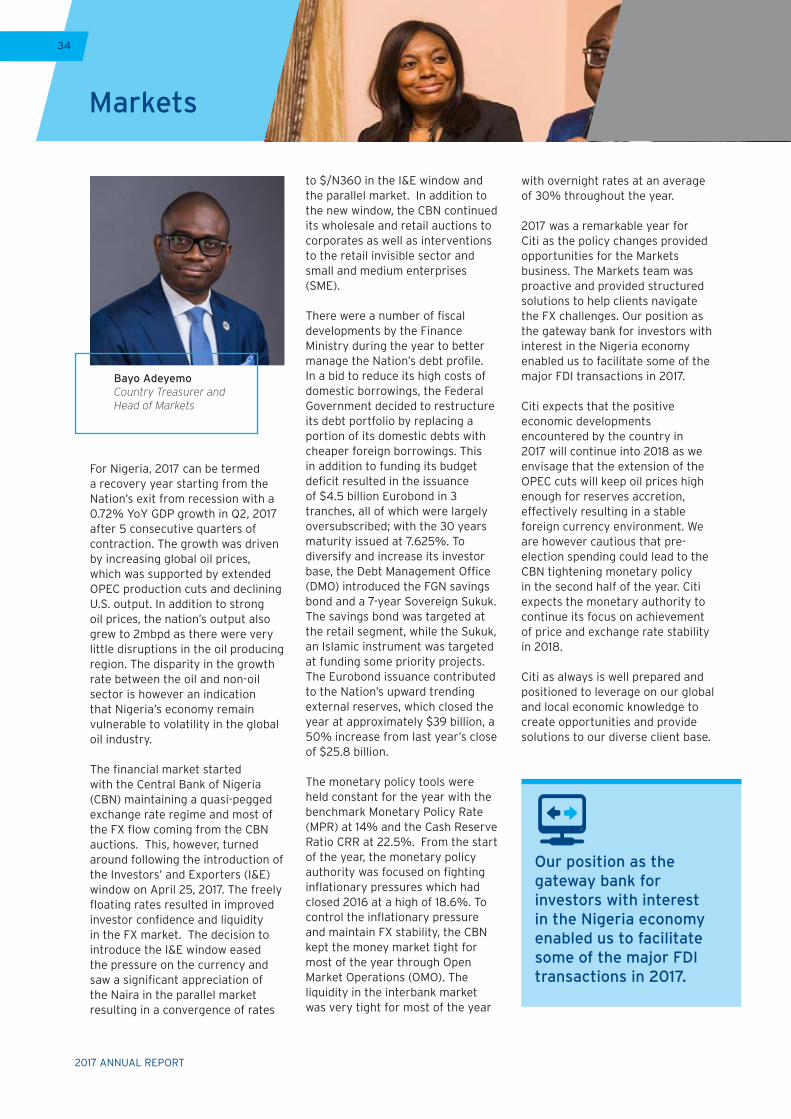
2017 ANNUAL REPORT
34
Our position as the gateway bank for investors with interest in the Nigeria economy enabled us to facilitate some of the major FDI transactions in 2017.
Markets
For Nigeria, 2017 can be termed a recovery year starting from the Nation’s exit from recession with a 0.72% YoY GDP growth in Q2, 2017 after 5 consecutive quarters of contraction. The growth was driven by increasing global oil prices, which was supported by extended OPEC production cuts and declining U.S. output. In addition to strong oil prices, the nation’s output also grew to 2mbpd as there were very little disruptions in the oil producing region. The disparity in the growth rate between the oil and non-oil sector is however an indication that Nigeria’s economy remain vulnerable to volatility in the global oil industry.
The financial market started with the Central Bank of Nigeria (CBN) maintaining a quasi-pegged exchange rate regime and most of the FX flow coming from the CBN auctions. This, however, turned around following the introduction of the Investors’ and Exporters (I&E) window on April 25, 2017. The freely floating rates resulted in improved investor confidence and liquidity in the FX market. The decision to introduce the I&E window eased the pressure on the currency and saw a significant appreciation of the Naira in the parallel market resulting in a convergence of rates
to $/N360 in the I&E window and the parallel market. In addition to the new window, the CBN continued its wholesale and retail auctions to corporates as well as interventions to the retail invisible sector and small and medium enterprises (SME).
There were a number of fiscal developments by the Finance Ministry during the year to better manage the Nation’s debt profile. In a bid to reduce its high costs of domestic borrowings, the Federal Government decided to restructure its debt portfolio by replacing a portion of its domestic debts with cheaper foreign borrowings. This in addition to funding its budget deficit resulted in the issuance of $4.5 billion Eurobond in 3 tranches, all of which were largely oversubscribed; with the 30 years maturity issued at 7.625%. To diversify and increase its investor base, the Debt Management Office (DMO) introduced the FGN savings bond and a 7-year Sovereign Sukuk. The savings bond was targeted at the retail segment, while the Sukuk, an Islamic instrument was targeted at funding some priority projects. The Eurobond issuance contributed to the Nation’s upward trending external reserves, which closed the year at approximately $39 billion, a 50% increase from last year’s close of $25.8 billion.
The monetary policy tools were held constant for the year with the benchmark Monetary Policy Rate (MPR) at 14% and the Cash Reserve Ratio CRR at 22.5%. From the start of the year, the monetary policy authority was focused on fighting inflationary pressures which had closed 2016 at a high of 18.6%. To control the inflationary pressure and maintain FX stability, the CBN kept the money market tight for most of the year through Open Market Operations (OMO). The liquidity in the interbank market was very tight for most of the year
with overnight rates at an average of 30% throughout the year.
2017 was a remarkable year for Citi as the policy changes provided opportunities for the Markets business. The Markets team was proactive and provided structured solutions to help clients navigate the FX challenges. Our position as the gateway bank for investors with interest in the Nigeria economy enabled us to facilitate some of the major FDI transactions in 2017.
Citi expects that the positive economic developments encountered by the country in 2017 will continue into 2018 as we envisage that the extension of the OPEC cuts will keep oil prices high enough for reserves accretion, effectively resulting in a stable foreign currency environment. We are however cautious that pre-election spending could lead to the CBN tightening monetary policy in the second half of the year. Citi expects the monetary authority to continue its focus on achievement of price and exchange rate stability in 2018.
Citi as always is well prepared and positioned to leverage on our global and local economic knowledge to create opportunities and provide solutions to our diverse client base.
Bayo AdeyemoCountry Treasurer and Head of Markets
34

2017 ANNUAL REPORT
35
Mabel is a perfect model of our “be the best” initiative as well as the impact of our leadership standards on client satisfaction and ultimately, revenues.
Mabel ItamboTrade Services Professional,Operations Department
2017 Employee of the Year
Mabel works in the Trade Operations Department as a Trade Services Professional (TSP) where she supports some of the bank’s top trade revenue clients; Procter & Gamble Nigeria Ltd, Nestle Nigeria Ltd, Nigeria Bottling Company (bottlers of Coca Cola), Chi Limited and Parco Group account. Trade revenue recorded a 30% increase in 2017 with significant contribution from increased share of wallet from many but mostly Mabel’s clients. While many factors contributed to this revenue growth, we see a direct impact of the improvement in service quality provided by the Trade Service Professional Team of which Mabel played a very prominent role.
Mabel is a perfect model of our “be the best” initiative as well as the impact of our leadership standards on client satisfaction and ultimately, revenues. Over the years, she has delivered stellar services to our client in a terrain of multiplicity of regulations, constant macro-economic changes, changing internal policies and processes. Clients have proactively described her consistent positive attitude, timely responses to customer
inquiries, energy, credibility of advice and depth of knowledge of trade operations . She has earned a reputation as the trusted advisor for trade related enquiries both with clients and colleagues.
Also worthy of note is Mabel’s proactive approach to initiating daily calls to customers. This has enabled the team to prevent financial losses, reduce customer complaints and generally manage emerging issues in a very professional and proactive manner, which has now become a reference point in the team.
A very good team player, she is always ready and willing to take up new challenges. Her wealth of experience, sound product knowledge and “can-do” attitude have all played important roles in shaping her ability to dimension and simplify the complex regulatory landscape to the benefits of the bank and delight of our customers. Her ability to do these consistently easily sets her apart. She has earned the respect of her peers and colleagues and is highly regarded as a role model.
Her contribution on several initiatives contributed immensely to improve the turnaround time and the quality of metrics used for measuring performance and identifying areas of opportunity. The simplification of tracking system for capturing and analysing enquiries resulted in a remarkable increase in number of enquiries being captured as well as the timely resolution of the issues. She was instrumental to redesigning customer Trade reports that have enabled customers to plan and achieve efficiencies in their trade cycle.
Notwithstanding being the recipient of 2016 employee of the year award, she has not slowed down in her quest to making Citibank the “best for our customers”. In appreciation of her consistent exceptional contributions to the franchise, Mabel Itambo is the EMPLOYEE OF THE YEAR 2017.
35
2017 ANNUAL REPORT

Financial ReportDirectors’ report 39
Corporate Governance report 50
Board Performance Review 56
Statement of Directors’ Responsibility 57
Independent Auditor’s report 58
Consolidated & Separate Statement of Profit or Loss 63
Consolidated & Separate Statement of Comprehensive Income 64
Consolidated & Separate Statement of Financial Position 65
Consolidated & Separate Statement of Changes in Equity 66
Consolidated & Separate Statement of Cash Flows 68
Statement of significant accounting policies 70
Notes to the Financial Statements 70
Financial risk management 89
Statement of value added 153
Consolidated & Separate five year financial summary 155
2017 ANNUAL REPORT
38
Directors, Officers and Advisors
DIRECTORS
Mr. Olayemi Cardoso Chairman
Mr. Akinsowon Dawodu Managing Director
Mr. Fatai Karim Executive Director
Mrs. Funmi Ogunlesi Executive Director
Mrs. Nneka Enwereji Executive Director
Mr. Chinedu Ikwudinma (Resigned September 6, 2017) Executive Director
Mr. Oluwole Awotundun (Appointed Oct. 5, 2017; CBN Approval Dec. 19, 2017) Executive Director
Mr. Phillip Cullingworth (Resigned February 24, 2017) Non Executive Director
Mr. Oyesoji Oyeleke (Appointed Feb. 23, 2017; CBN Approval April 7, 2017) Non Executive Director
Mr. Peter McCarthy Non Executive Director
Dr. Hilary Onyiuke Non Executive Director
Ms. Diane Evans (Appointed Feb. 23, 2017; CBN Approval Oct. 9, 2017) Non Executive Director
Mrs. Ireti Samuel-Ogbu Non Executive Director
Dr. Shamsuddeen Usman (Appointed March 24, 2017; CBN Approval April 12, 2017) Independent Director
Dr. Daphne Dafinone Independent Director
Mrs. Olusola Fagbure Company Secretary
CORPORATE HEAD OFFICE
Citibank Nigeria Limited
Charles S. Sankey House
27, Kofo Abayomi Street
Victoria Island, Lagos.
Telephone: +234 01 2798400
+234 01 4638400
Website: www.citigroup.com/nigeria
AUDITORS
PricewaterhouseCoopers
Landmark Towers, 5B Water Corporation Road
Victoria Island, Lagos
Telephone: +234 (1) 271 1700
Website: www.pwc.com/ng
Engagement Partner: Patrick Obianwa
FRC no.:FRC/2013/ICAN/00000000880
2017 ANNUAL REPORT
39
The Directors have pleasure in presenting their annual report on the affairs of Citibank Nigeria Limited and its subsidiary
entity (“the Group”) together with the financial statements and auditors’ report for the year ended 31 December 2017.
LEGAL FORM
The Bank was incorporated in Nigeria under the Companies and Allied Matter Act as a private limited liability company on 2
May 1984. It was granted a license on 14 September 1984 to carry on the business of commercial banking and commenced
business on 14 September 1984.
PRINCIPAL ACTIVITY AND BUSINESS REVIEW
The principal activity of the Group is the provision of commercial banking services to its customers. Such services include
transactional services, corporate finance, provision of finance, custodial business and money market and trading activities.
The Bank has a subsidiary, Nigeria International Bank Nominees Limited. The company acts as the holder of securities
purchased for customers of the Bank’s custodial business.
OPERATING RESULTS
The net operating income and profit before tax of the Group increased by 26.95% and 27.10% respectively over prior year.
The directors recommend the approval of a final dividend of N27,452,710,688 (N9.83k per share) (2016:N21,704,297,219
(N7.77k per share) from the outstanding balance in the retained earnings account as at 31 December 2017. The dividends are
subject to deduction of withholding tax of 10%.
Highlights of the Group’s operating results for the year under review are as follows
2017 2016 % change
N’000 N’000
Net operating Income 57,644,906 45,406,905 26.95%
Profit before tax 41,013,134 32,267,427 27.10%
Taxation (9,043,937) (6,893,620) 31.19%
Profit for the year 31,969,197 25,373,807 25.99%
Other comprehensive income for the year, net of tax 6,562,441 (3,898,226) -268.34%
Total comprehensive income for the year 38,531,638 21,475,581 79.42%
Directors’ ReportFOR THE YEAR ENDED 31 DECEMBER 2017
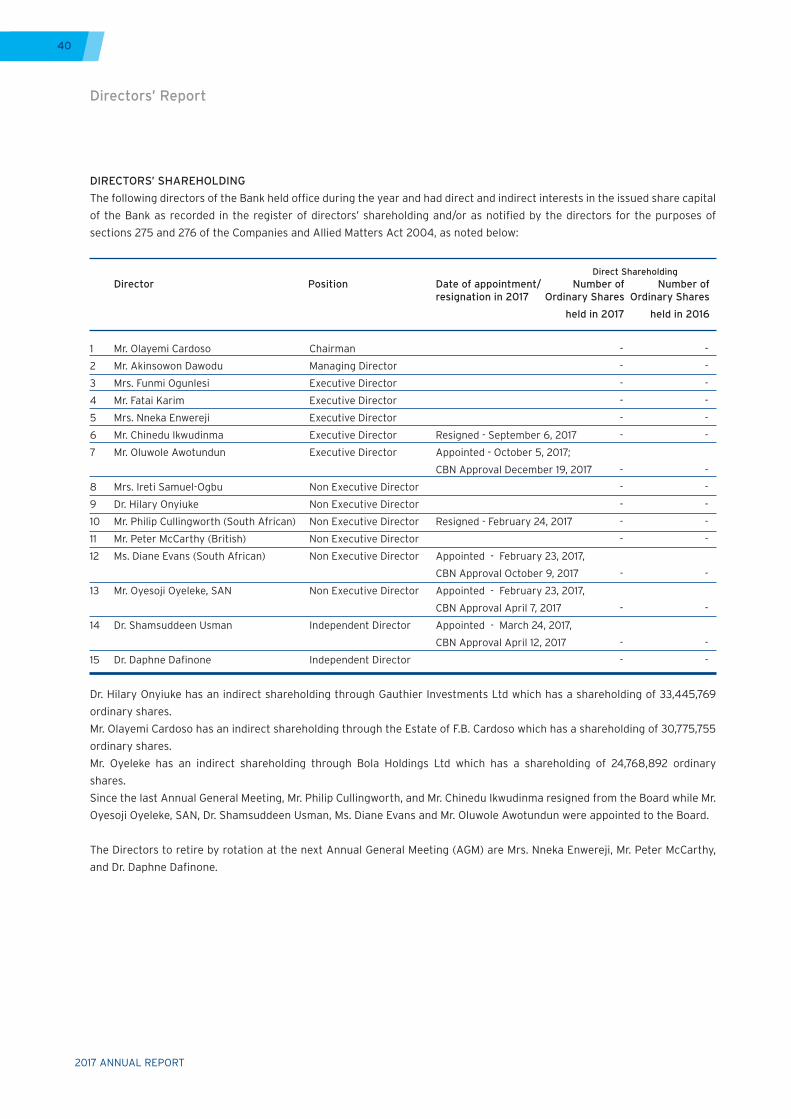
2017 ANNUAL REPORT
40
DIRECTORS’ SHAREHOLDING
The following directors of the Bank held office during the year and had direct and indirect interests in the issued share capital
of the Bank as recorded in the register of directors’ shareholding and/or as notified by the directors for the purposes of
sections 275 and 276 of the Companies and Allied Matters Act 2004, as noted below:
Direct Shareholding Director Position Date of appointment/ Number of Number of resignation in 2017 Ordinary Shares Ordinary Shares
held in 2017 held in 2016
1 Mr. Olayemi Cardoso Chairman - -
2 Mr. Akinsowon Dawodu Managing Director - -
3 Mrs. Funmi Ogunlesi Executive Director - -
4 Mr. Fatai Karim Executive Director - -
5 Mrs. Nneka Enwereji Executive Director - -
6 Mr. Chinedu Ikwudinma Executive Director Resigned - September 6, 2017 - -
7 Mr. Oluwole Awotundun Executive Director Appointed - October 5, 2017;
CBN Approval December 19, 2017 - -
8 Mrs. Ireti Samuel-Ogbu Non Executive Director - -
9 Dr. Hilary Onyiuke Non Executive Director - -
10 Mr. Philip Cullingworth (South African) Non Executive Director Resigned - February 24, 2017 - -
11 Mr. Peter McCarthy (British) Non Executive Director - -
12 Ms. Diane Evans (South African) Non Executive Director Appointed - February 23, 2017,
CBN Approval October 9, 2017 - -
13 Mr. Oyesoji Oyeleke, SAN Non Executive Director Appointed - February 23, 2017,
CBN Approval April 7, 2017 - -
14 Dr. Shamsuddeen Usman Independent Director Appointed - March 24, 2017,
CBN Approval April 12, 2017 - -
15 Dr. Daphne Dafinone Independent Director - -
Dr. Hilary Onyiuke has an indirect shareholding through Gauthier Investments Ltd which has a shareholding of 33,445,769
ordinary shares.
Mr. Olayemi Cardoso has an indirect shareholding through the Estate of F.B. Cardoso which has a shareholding of 30,775,755
ordinary shares.
Mr. Oyeleke has an indirect shareholding through Bola Holdings Ltd which has a shareholding of 24,768,892 ordinary
shares.
Since the last Annual General Meeting, Mr. Philip Cullingworth, and Mr. Chinedu Ikwudinma resigned from the Board while Mr.
Oyesoji Oyeleke, SAN, Dr. Shamsuddeen Usman, Ms. Diane Evans and Mr. Oluwole Awotundun were appointed to the Board.
The Directors to retire by rotation at the next Annual General Meeting (AGM) are Mrs. Nneka Enwereji, Mr. Peter McCarthy,
and Dr. Daphne Dafinone.
Directors’ Report
2017 ANNUAL REPORT
41
PROFILE OF DIRECTORS OF CITIBANK NIGERIA LTD
BRIEF PROFILE
Mr. Cardoso holds a degree in Finance and Accounting from Aston University (1980), UK and a postgraduate degree in Public Administration and Management from the Kennedy School of Government, Harvard University. He was a Mason Fellow of the Kennedy School of Government. He is also an Associate of the Chartered Institute of Stock Brokers. He worked for Citi in several countries between 1981 and 1990. He left Citi in 1990 to become an Executive Director in Citizens International Bank. Between 1999 and 2004, Mr. Cardoso served as the Lagos State Commissioner for Economic Planning and Budget. He has been on the board of the Bank since April 2010. He was appointed Chairman of the Board of Directors of the Bank in November 2010 Mr. Cardoso has served on the board of directors of several companies including Chevron Oil Plc. He is presently the only African elected board member at the Harvard Kennedy school alumni governing body and consults on financial and developmental activities. Mr. Cardoso was awarded an honorary Doctorate degree from Aston university in 2017. He is in his sixties.
Mr. Akinsowon Dawodu holds a B.Sc. degree in Accounting from the University of Lagos. He also holds an MBA (1997) from the Manchester Business School. He became a Chartered Financial Analyst in 2004. He has worked in Citi since 2000. Between 2005 and 2007 he served as Senior Treasury Manager for MTN Communications Nigeria Ltd. In Citi he has served as Country Treasurer, and Chief Operating Officer and Public Sector Head. He was appointed to the Board in 2013 and was appointed Managing Director in 2015. He is in his forties.
Mrs. Ogunlesi holds degrees in History and Law from Leicester University (1981) and Cambridge University (1985) as well as a Master’s in Business Administration from Judge Institute of Management, Cambridge University (1996). Mrs. Ogunlesi also holds a Masters degree in Law from Kings College, Cambridge University (1989). She joined the Bank in 1997 and has served in several roles including Managing Director of Citibank Gabon. She is currently the Africa Division TTS Public Sector Head. She was appointed to the Board in 2007. She is in her fifties.
Mr. Karim is a graduate of Accounting from Bayero University, Kano. He also holds an MBA from the Enugu State University of Technology. Mr. Karim who is in his fifties, joined Citibank Nigeria in 1987. Over the years, he has held various positions of responsibilities in different countries covering Human Resources Management, Operations & Technology, Risk & Control, and Vendor Management. Between 2000 and 2004, Mr. Karim was General Manager and Executive Director, Citibank Tanzania. Between 2004 and June 2009, he was General Manager, Citibank London with responsibilities for Operational Risk and Control Management. Mr. Fatai Karim was appointed Executive Director Citibank Nigeria Limited in May 2009.
Dr. Onyiuke holds an MB, B.S. degree from the College of Medicine, University of Ibadan (1982). He is a fellow of The Royal College of Surgeons of Canada, and a member of the American board of Neurosurgeons. He is also Director, Comprehensive Spine Center and Administrative Head of Spine Program at the University of Connecticut School of Medicine. Dr. Onyiuke became an Associate Professor, Neurosurgery Division, University of Connecticut School of Medicine in 2001. He was appointed to the Board of the Bank in June 2010. Dr. Onyiuke is in his fifties.
Mrs. Nneka Enwereji is a 1991 first class graduate of Computer Science and Economics (Combined Honours) from the Obafemi Awolowo University. She also holds a Master in Business Administration from Warwick Business School, United Kingdom (2011). She has over 25 years banking experience covering Capital Market, FMCG, Financial Institutions Products, Credit Management and Top Tier Local Corporates management where she has worked in various capacities. She joined the Bank in 1992 as a Youth Corps member. She was appointed Head, Bank Services Group & Africa Trade Services Head in 2010 and became Head, Global Subsidiaries Group and Top Tier Local Corporates in 2011. She was appointed to the Board of the Bank in June 2014. Mrs. Enwereji is in her forties.
NAME
MR. YEMI CARDOSO
MR. AKINSOWON DAWODU
MRS. FUNMI OGUNLESI
MR. FATAI KARIM
DR. HILARY ONYIUKE
MRS. NNEKA ENWEREJI
S/N
1
2
3
4
5
6
Directors’ Report
2017 ANNUAL REPORT
42
Directors’ Report
BRIEF PROFILE
Mrs. Ireti Samuel-Ogbu holds a Bachelor degree in Accounting & Finance from Middlesex University (1984). She also obtained a Masters degree in Business Administration from the University of Bradford (1987). She is a seasoned banker with over thirty years banking experience. She joined the Bank in 1988 as Unit Head, Commercial Bank. Mrs. Samuel-Ogbu has worked in various capacities in Citibank offices in Lagos, Johannesburg and London. She was appointed Resident Vice President, Trade Co-ordinator, Corporate Finance in Citi London in 1995. In January 2013, she became the Team Captain and Public Sector Lead for a selection of EMEA names in Citi London. Mrs. Samuel-Ogbu was appointed to the Board of the Bank in June 2014. She is in her fifties.
Mr. McCarthy qualified as a Chartered Accountant in 1981. He has over 30 years of experience in the Financial Services industry. Shortly before joining Citigroup in 1987 as Head of Management Accounting within the Finance Division in London, Mr. McCarthy was the European Financial Controller, Merrill Lynch. He has held various positions of responsibility in Fixed Income, Currencies and Commodities, and Technology. Prior to his current role of EMEA Chief Administrative Officer, (Europe, Middle East and Africa), Mr. McCarthy was EMEA Chief Administrative Officer for the Markets Business responsible for the Operating infrastructure and Franchise Governance for the Institutional Sales and Trading business (Fixed Income, Foreign Exchange, Commodities and Equities) across EMEA. Mr. McCarthy who is in his sixties was appointed to the Board in April 2016.
Dr. Daphne Terri Dafinone is the Chief Operating Officer of Howarth Dafinone & Co, Chartered Accountants. She holds a B. A. (Hons) Economics from Victoria University of Manchester, Manchester, UK (1987), and M.Sc. (Internal Audit & Management) and PhD (internal Audit & Corporate Governance) from City University, London. She is a Fellow, Institute of Chartered Accountants in England and Wales, Associate Member, Chartered Taxation Institute of Nigeria, and a Fellow, Institute of Chartered Accountants of Nigeria. She is in her early fifties. She worked with KPMG, Chartered Accountants, London from 1987 to 1990 and Horwath Dafinone, Chartered Accountants, Lagos from January 1990 to date. She became a partner in the firm in March 1997, and was appointed the Chief Operating Officer of the firm in January 2013. Dr. Dafinone was appointed to the Board in June 2016.
Mr. Oyesoji Oyeleke, SAN is the Managing Partner of Law Offices of O.G. Oyeleke LLP, a firm of Barristers & Solicitors, and a Notary Public. He is a 1982 graduate of law from the Obafemi Awolowo University, Ile Ife. Mr. Oyeleke possesses extensive experience in all forms of commercial Litigation, including shipping and maritime related matters and is a member of various professional bodies including the Nigerian Bar Association; Institute of Chartered Secretaries and Administrators; Commercial League of America; International Association of Restructuring Insolvency and Bankruptcy Professionals among others. He was appointed a Notary Public in 1991 and a Senior Advocate of Nigeria (SAN) in 2016. He was appointed to the Board of Citibank Nigeria in April 2017. Mr. Oyeleke is in his fifties.
Dr. Shamsuddeen Usman is the Chairman/CEO of Susman & Associates Ltd. He holds a Ph.D in Economics from London School of Economics and Political Science, University of London (LSE), UK (1980). Dr. Usman has over 40 years professional experience in both the Public and Private sectors of the Economy. He has served as the Hon. Minister of Finance and Hon. Minister of National Planning. He was also a Deputy Governor, Central Bank of Nigeria and Managing Director, NAL Merchant Bank, as well as the Director-General, Technical Committee on Privatisation and Commercialisation (TCPC); Executive Director, United Bank for Africa; Executive Director, Union Bank of Nigeria Plc; and Director of Budget/Special Economic Adviser to the Kano State Government. Dr. Usman who is in his sixties also sits on the board of Lafarge Africa Plc. He was appointed to the Board of Citibank Nigeria in April 2017.
PROFILE OF DIRECTORS OF CITIBANK NIGERIA LTD (contd.)
NAME
MRS. IRETI SAMUEL-OGBU
MR. PETER MCCARTHY
DR. DAPHNE TERRI DAFINONE
MR. OYESOJI OYELEKE SAN
DR. SHAMSUDDEEN USMAN
S/N
7
8
9
10
11
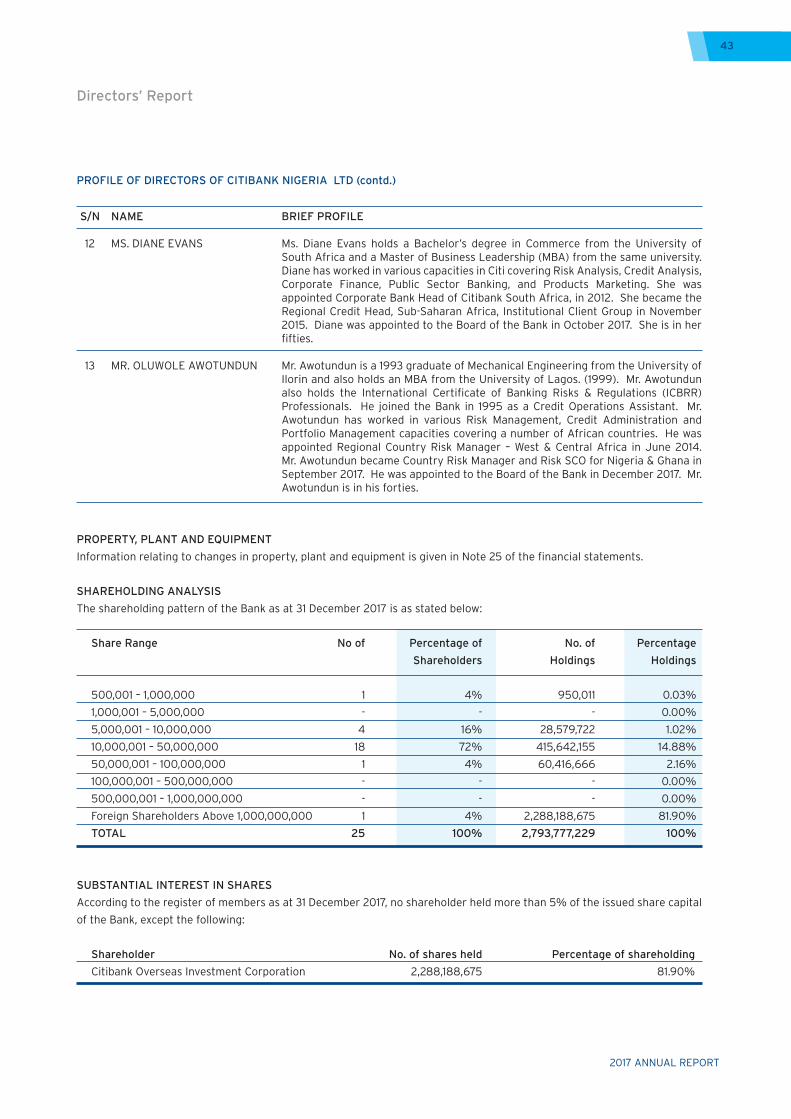
2017 ANNUAL REPORT
43
PROPERTY, PLANT AND EQUIPMENT
Information relating to changes in property, plant and equipment is given in Note 25 of the financial statements.
SHAREHOLDING ANALYSIS
The shareholding pattern of the Bank as at 31 December 2017 is as stated below:
Share Range No of Percentage of No. of Percentage
Shareholders Holdings Holdings
500,001 – 1,000,000 1 4% 950,011 0.03%
1,000,001 – 5,000,000 - - - 0.00%
5,000,001 – 10,000,000 4 16% 28,579,722 1.02%
10,000,001 – 50,000,000 18 72% 415,642,155 14.88%
50,000,001 – 100,000,000 1 4% 60,416,666 2.16%
100,000,001 – 500,000,000 - - - 0.00%
500,000,001 – 1,000,000,000 - - - 0.00%
Foreign Shareholders Above 1,000,000,000 1 4% 2,288,188,675 81.90%
TOTAL 25 100% 2,793,777,229 100%
SUBSTANTIAL INTEREST IN SHARES
According to the register of members as at 31 December 2017, no shareholder held more than 5% of the issued share capital
of the Bank, except the following:
Shareholder No. of shares held Percentage of shareholding
Citibank Overseas Investment Corporation 2,288,188,675 81.90%
Directors’ Report
PROFILE OF DIRECTORS OF CITIBANK NIGERIA LTD (contd.)
BRIEF PROFILE
Ms. Diane Evans holds a Bachelor’s degree in Commerce from the University of South Africa and a Master of Business Leadership (MBA) from the same university. Diane has worked in various capacities in Citi covering Risk Analysis, Credit Analysis, Corporate Finance, Public Sector Banking, and Products Marketing. She was appointed Corporate Bank Head of Citibank South Africa, in 2012. She became the Regional Credit Head, Sub-Saharan Africa, Institutional Client Group in November 2015. Diane was appointed to the Board of the Bank in October 2017. She is in her fifties.
Mr. Awotundun is a 1993 graduate of Mechanical Engineering from the University of Ilorin and also holds an MBA from the University of Lagos. (1999). Mr. Awotundun also holds the International Certificate of Banking Risks & Regulations (ICBRR) Professionals. He joined the Bank in 1995 as a Credit Operations Assistant. Mr. Awotundun has worked in various Risk Management, Credit Administration and Portfolio Management capacities covering a number of African countries. He was appointed Regional Country Risk Manager – West & Central Africa in June 2014. Mr. Awotundun became Country Risk Manager and Risk SCO for Nigeria & Ghana in September 2017. He was appointed to the Board of the Bank in December 2017. Mr. Awotundun is in his forties.
NAME
MS. DIANE EVANS
MR. OLUWOLE AWOTUNDUN
S/N
12
13
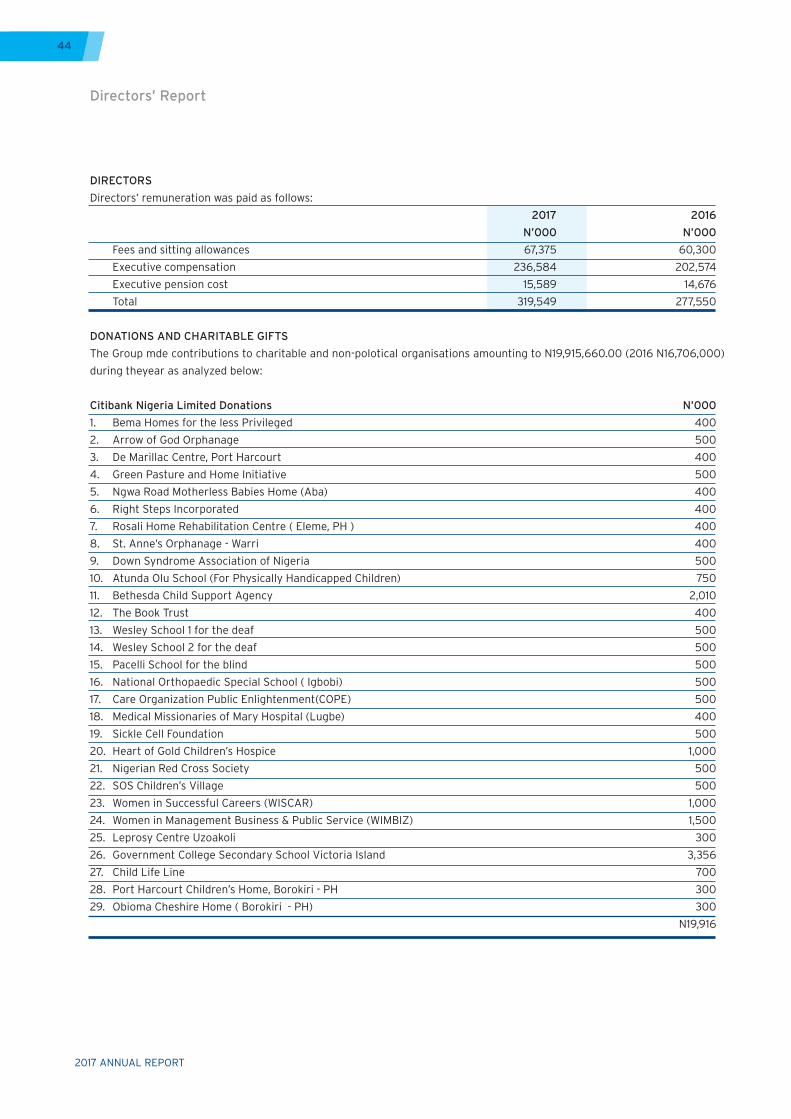
2017 ANNUAL REPORT
44
DIRECTORS
Directors’ remuneration was paid as follows:
2017 2016
N’000 N’000
Fees and sitting allowances 67,375 60,300
Executive compensation 236,584 202,574
Executive pension cost 15,589 14,676
Total 319,549 277,550
DONATIONS AND CHARITABLE GIFTS
The Group mde contributions to charitable and non-polotical organisations amounting to N19,915,660.00 (2016 N16,706,000)
during theyear as analyzed below:
Citibank Nigeria Limited Donations N’000
1. Bema Homes for the less Privileged 400
2. Arrow of God Orphanage 500
3. De Marillac Centre, Port Harcourt 400
4. Green Pasture and Home Initiative 500
5. Ngwa Road Motherless Babies Home (Aba) 400
6. Right Steps Incorporated 400
7. Rosali Home Rehabilitation Centre ( Eleme, PH ) 400
8. St. Anne’s Orphanage - Warri 400
9. Down Syndrome Association of Nigeria 500
10. Atunda Olu School (For Physically Handicapped Children) 750
11. Bethesda Child Support Agency 2,010
12. The Book Trust 400
13. Wesley School 1 for the deaf 500
14. Wesley School 2 for the deaf 500
15. Pacelli School for the blind 500
16. National Orthopaedic Special School ( Igbobi) 500
17. Care Organization Public Enlightenment(COPE) 500
18. Medical Missionaries of Mary Hospital (Lugbe) 400
19. Sickle Cell Foundation 500
20. Heart of Gold Children’s Hospice 1,000
21. Nigerian Red Cross Society 500
22. SOS Children’s Village 500
23. Women in Successful Careers (WISCAR) 1,000
24. Women in Management Business & Public Service (WIMBIZ) 1,500
25. Leprosy Centre Uzoakoli 300
26. Government College Secondary School Victoria Island 3,356
27. Child Life Line 700
28. Port Harcourt Children’s Home, Borokiri - PH 300
29. Obioma Cheshire Home ( Borokiri - PH) 300
N19,916
Directors’ Report
2017 ANNUAL REPORT
45
POST BALANCE SHEET EVENTS
There were no post balance sheet events which could have a material effect on the financial position of the Group as at 31
December 2017 or the statement of profit and loss and other comprehensive income for the year ended on that date that
have not been adequately provided for or disclosed.
EMPLOYMENT OF DISABLED PERSONS
The Group continues to maintain a policy of giving fair consideration to application for employment made by disabled persons
with due regard to their abilities and aptitudes. The Group’s policies prohibit discrimination against disabled persons in the
recruitment, training and career development of employees. In the event of members of staff becoming disabled, efforts will
be made to ensure that their employment within the Group continues and appropriate training arranged to ensure that they
fit into the Group’s working environment.
HEALTH, SAFETY AND WELFARE AT WORK
The Group enforces strict health and safety rules and practices at the work environment, which are reviewed and tested
regularly. In addition, medical facilities are provided for staff and their immediate families at the Group’s expense.
Fire prevention and fire-fighting equipment are installed in strategic locations within the Group’s premises.
The Group operates both Group Personal Accident and Workmen’s Compensation Insurance cover for the benefit of its
employees. It is also fully compliant with the provisions of the Employee Compensation Act. The Group also operates a
contributory pension plan in line with the Pension Reform Act, 2014.
EMPLOYEE INVOLVEMENT AND TRAINING
The Group ensures, through various fora, that employees are informed on matters concerning them. Formal and informal
channels are also employed in communication with employees with an appropriate two-way feedback mechanism.
In accordance with the Group’s policy of continuous development, the Group draws extensively on Citigroup’s training
programmes around the world. The programmes include on the job training, classroom sessions and web-based training
programmes which are available to all staff. In addition, employees of the Group are nominated to attend both locally and
internationally organized courses.
DIVERSITY IN EMPLOYMENT
The Group recognises that the recruitment, involvement and advancement of women and a diverse workforce are business
imperatives. During the financial year ended 31 December 2017:
- There were 83 women out of 235 employees comprising 35.32% of the total number of employees;
- There were 5 women out of 13 Directors on the Board of Directors;
- There were 31 women out of 99 top management staff, including executive directors
- There were 29 women out of 94 top management staff between Assistant General Manager to General Manager
grade;
- There were 2 women out of 5 top management staff between Executive Director to Chief Executive Officer;
- The bank had no persons with disabilities in its employment.
The Group is committed to maintaining a positive work environment and to conducting business in a positive, professional
manner by consistently ensuring equal employment opportunity. The Group has programs aimed at achieving gender balance
which include developmental programs targeted for women; mentoring; and policies that support Work-Life balance.
Directors’ Report
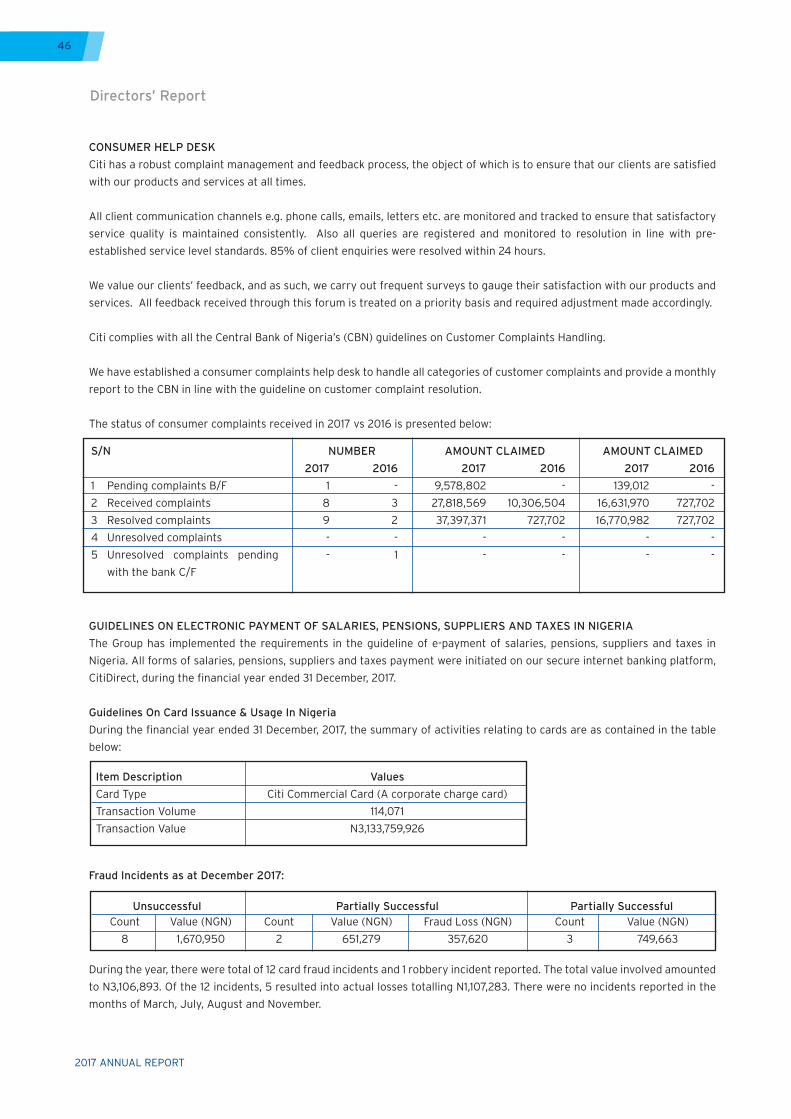
2017 ANNUAL REPORT
46
CONSUMER HELP DESK
Citi has a robust complaint management and feedback process, the object of which is to ensure that our clients are satisfied
with our products and services at all times.
All client communication channels e.g. phone calls, emails, letters etc. are monitored and tracked to ensure that satisfactory
service quality is maintained consistently. Also all queries are registered and monitored to resolution in line with pre-
established service level standards. 85% of client enquiries were resolved within 24 hours.
We value our clients’ feedback, and as such, we carry out frequent surveys to gauge their satisfaction with our products and
services. All feedback received through this forum is treated on a priority basis and required adjustment made accordingly.
Citi complies with all the Central Bank of Nigeria’s (CBN) guidelines on Customer Complaints Handling.
We have established a consumer complaints help desk to handle all categories of customer complaints and provide a monthly
report to the CBN in line with the guideline on customer complaint resolution.
The status of consumer complaints received in 2017 vs 2016 is presented below:
During the year, there were total of 12 card fraud incidents and 1 robbery incident reported. The total value involved amounted
to N3,106,893. Of the 12 incidents, 5 resulted into actual losses totalling N1,107,283. There were no incidents reported in the
months of March, July, August and November.
Item Description
Card Type
Transaction Volume
Transaction Value
Unsuccessful Partially Successful Partially SuccessfulCount
8
Count
3
Count
2
Value (NGN)
1,670,950
Value (NGN)
749,663
Value (NGN)
651,279
Fraud Loss (NGN)
357,620
Values
Citi Commercial Card (A corporate charge card)
114,071
N3,133,759,926
GUIDELINES ON ELECTRONIC PAYMENT OF SALARIES, PENSIONS, SUPPLIERS AND TAXES IN NIGERIA
The Group has implemented the requirements in the guideline of e-payment of salaries, pensions, suppliers and taxes in
Nigeria. All forms of salaries, pensions, suppliers and taxes payment were initiated on our secure internet banking platform,
CitiDirect, during the financial year ended 31 December, 2017.
Guidelines On Card Issuance & Usage In Nigeria
During the financial year ended 31 December, 2017, the summary of activities relating to cards are as contained in the table
below:
Fraud Incidents as at December 2017:
S/N
1 Pending complaints B/F
2 Received complaints
3 Resolved complaints
4 Unresolved complaints
5 Unresolved complaints pending
with the bank C/F
NUMBER
2017 2016
1 -
8 3
9 2
- -
- 1
AMOUNT CLAIMED
2017 2016
9,578,802 -
27,818,569 10,306,504
37,397,371 727,702
- -
- -
AMOUNT CLAIMED
2017 2016
139,012 -
16,631,970 727,702
16,770,982 727,702
- -
- -
Directors’ Report
2017 ANNUAL REPORT
47
CONTINGENCY PLANNING FRAMEWORK
OVERVIEW
Citibank Nigeria Limited implements a Contingency Planning Framework (business continuity) which aligns with Citigroup’s
global business continuity framework
The business continuity program includes:
Business Continuity Assessment processes
Crisis Management Planning
Recovery Planning
Testing; Maintenance
Independent Review
Monitoring and Reporting
Training and Awareness
Citigroup has a global Continuity of Business (CoB) Program Operations organization which is responsible for developing and
managing the enterprise-wide CoB policy, standards, tools, and guidance. Citibank Nigeria Limited also uses a software tool
called CoB Trac to support CoB assessment, planning, and testing and provide evidence of compliance.
GOVERNANCE
Citibank Nigeria Limited has a crisis management team which has the responsibility of managing crisis events. This team
is chaired by the Citi Country Officer (CCO). In addition, each business unit is required to designate at least one Business
Recovery Coordinator (BRC) and one Business Unit Head (BUH) to manage the CoB program in their business unit. The
activities of all the BRCs are coordinated by the Country CoB Coordinated who is appointed by CCO.
ASSESSMENT
All business units in Citibank Nigeria Limited perform a Business Impact Analysis (BIA) on an annual basis. The purpose is to
define the processes and timeframes required for recovery.
Threat and Vulnerability Analysis and Proximity Risk Assessments are also performed for all in-scope locations, as defined in
the CoB standards. External third parties’ resilience and recovery capabilities are also assessed and monitored.
CRISIS MANAGEMENT
Citibank Nigeria Limited also develops and maintains an enhanced country crisis management plan which provides a
framework for managing Crisis. The country crisis management plans include the evacuation plans for each location in the
Bank. The Crisis Management team have the responsibility for managing crisis in the Bank.
PLANNING
Business units and technology units in the bank are required to document and maintain plans for the recovery of their
processes in the event of a business interruption or technology service disruption.
Application Managers are required to create and maintain an Application Recovery Plan (ARP) for each Citibank-owned or
Citibank–managed application to which they are assigned in the Citi Systems Inventory. For each Infrastructure component,
Technology Managers from Citi Technology Infrastructure (CTI) must create and maintain a Technology Recovery Plan (TRP).
ARPs and TRPs must contain the appropriate actions to be taken during the recovery and resumption of services.
Directors’ Report
2017 ANNUAL REPORT
48
TESTING
Citibank Nigeria Limited performs business and technology tests in order to verify that processes can be recovered in line
with the business’s continuity objectives, as defined by the Business Impact Analysis process. Business Recovery Coordinators
are responsible for ensuring that test objectives are met. Business recovery teams, crisis management teams, infrastructure
teams, and application teams must participate in CoB testing, as appropriate.
MAINTENANCE
CoB documentation, including policy, standards, as well as recovery and crisis management plans are reviewed and approved
at least annually and refreshed more frequently as needed. Specific maintenance triggers for CoB documentation are
documented in the Bank’s CoB standards document. Call trees must be refreshed at least semi-annually.
QUALITY REVIEW
Quality reviews must be conducted on a regular basis as required by the Bank’s CoB Standards document.
MONITORING AND REPORTING
The Country CoB coordinator provides quarterly Business Continuity updates to the Audit Committee of the Citibank Nigeria
board. Citibank Nigeria Limited’s CoB Program undergo independent review by Internal Audit.
TRAINING
The business recovery coordinators for all business units are required to take at least one CoB training annually. This training
is tracked by the office of business continuity. Also, CoB training is included in the new hire induction program.
Compensation Policy
Citibank Nigeria has a compensation plan which is fair, transparent, and consistent. We have a Pay for Performance culture
to enable us attract and retain people of the highest quality. Our Total Compensation package is designed to retain and
motivate people to constantly exceed their goal; differentiate between levels of performance and thus increasing the total
compensation available to the employees based on performance.
Our Compensation policy is linked to:
- The performance of the Organization as a whole
- The performance of the Country/business/teams in which our people work
- The individual performance of each employee
- The ability to pay for the total compensation programme
To remain competitive as an employer of choice, Citibank regularly benchmarks its compensation practices with the market
through participation in remuneration surveys.
Overall individual salary decisions are taken on the basis of assessment of performance against measurable goals and
targets, which is fair, consistent and explainable. Each year, individual goals and targets are set in line with the overall plan
for the business in the country. At the end of the year, a formal meeting takes place between the employee and the manager
to discuss achievements against goals.
Citibank Nigeria Limited’s goal is to recognize the contribution of people and reward their successes.
We will know that our compensation program is working well when we are able to attract, retain and motivate staff who
give us competitive advantage in our chosen markets; when our people believe that they are recognized, valued and their
compensation is determined by performance and competitive market positioning. The better the employee’s performance
the better the total compensation.
Directors’ Report
2017 ANNUAL REPORT
49
Auditors
PricewaterhouseCoopers have indicated their willingness to continue in office as auditors in accordance with Section 357(2)
of the Companies and Allied Matters Act.
Charles S. Sankey House BY ORDER OF THE BOARD
27, Kofo Abayomi Street
Victoria Island
Lagos
March 12, 2018 Olusola Fagbure, Company Secretary
FRC/2013/CIBN/00000002203
Directors’ Report
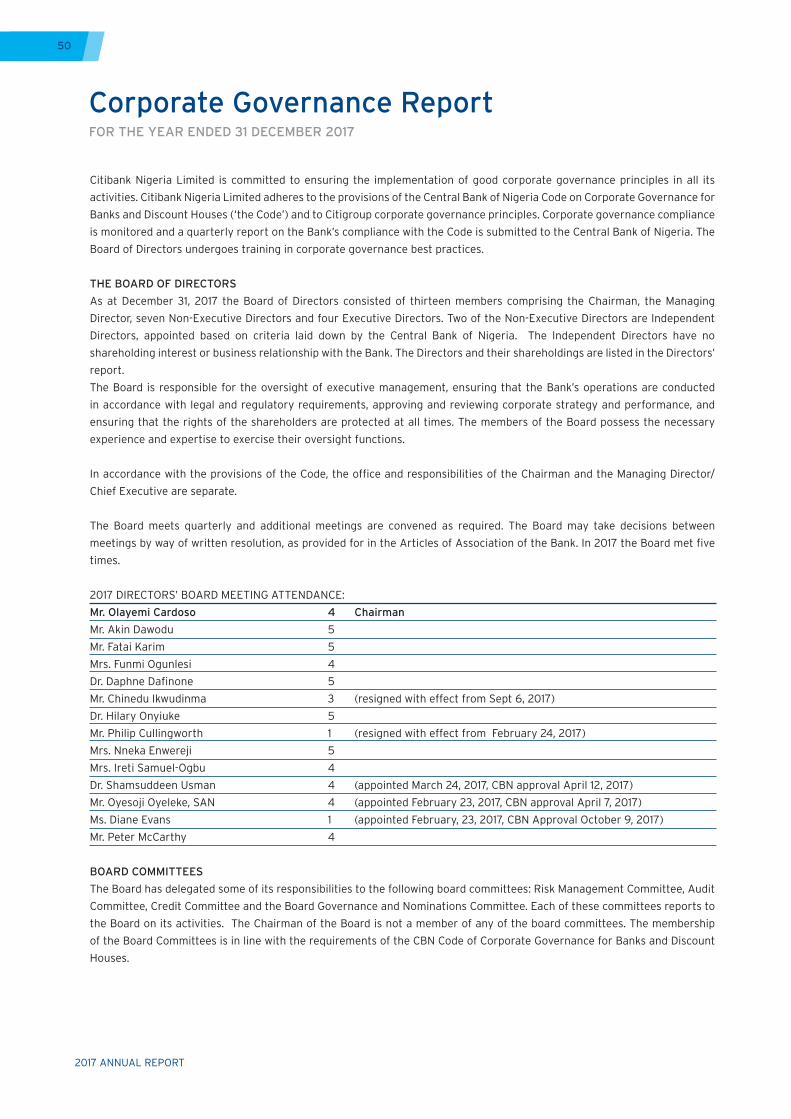
2017 ANNUAL REPORT
50
Citibank Nigeria Limited is committed to ensuring the implementation of good corporate governance principles in all its
activities. Citibank Nigeria Limited adheres to the provisions of the Central Bank of Nigeria Code on Corporate Governance for
Banks and Discount Houses (‘the Code’) and to Citigroup corporate governance principles. Corporate governance compliance
is monitored and a quarterly report on the Bank’s compliance with the Code is submitted to the Central Bank of Nigeria. The
Board of Directors undergoes training in corporate governance best practices.
THE BOARD OF DIRECTORS
As at December 31, 2017 the Board of Directors consisted of thirteen members comprising the Chairman, the Managing
Director, seven Non-Executive Directors and four Executive Directors. Two of the Non-Executive Directors are Independent
Directors, appointed based on criteria laid down by the Central Bank of Nigeria. The Independent Directors have no
shareholding interest or business relationship with the Bank. The Directors and their shareholdings are listed in the Directors’
report.
The Board is responsible for the oversight of executive management, ensuring that the Bank’s operations are conducted
in accordance with legal and regulatory requirements, approving and reviewing corporate strategy and performance, and
ensuring that the rights of the shareholders are protected at all times. The members of the Board possess the necessary
experience and expertise to exercise their oversight functions.
In accordance with the provisions of the Code, the office and responsibilities of the Chairman and the Managing Director/
Chief Executive are separate.
The Board meets quarterly and additional meetings are convened as required. The Board may take decisions between
meetings by way of written resolution, as provided for in the Articles of Association of the Bank. In 2017 the Board met five
times.
2017 DIRECTORS’ BOARD MEETING ATTENDANCE:
Mr. Olayemi Cardoso 4 Chairman
Mr. Akin Dawodu 5
Mr. Fatai Karim 5
Mrs. Funmi Ogunlesi 4
Dr. Daphne Dafinone 5
Mr. Chinedu Ikwudinma 3 (resigned with effect from Sept 6, 2017)
Dr. Hilary Onyiuke 5
Mr. Philip Cullingworth 1 (resigned with effect from February 24, 2017)
Mrs. Nneka Enwereji 5
Mrs. Ireti Samuel-Ogbu 4
Dr. Shamsuddeen Usman 4 (appointed March 24, 2017, CBN approval April 12, 2017)
Mr. Oyesoji Oyeleke, SAN 4 (appointed February 23, 2017, CBN approval April 7, 2017)
Ms. Diane Evans 1 (appointed February, 23, 2017, CBN Approval October 9, 2017)
Mr. Peter McCarthy 4
BOARD COMMITTEES
The Board has delegated some of its responsibilities to the following board committees: Risk Management Committee, Audit
Committee, Credit Committee and the Board Governance and Nominations Committee. Each of these committees reports to
the Board on its activities. The Chairman of the Board is not a member of any of the board committees. The membership
of the Board Committees is in line with the requirements of the CBN Code of Corporate Governance for Banks and Discount
Houses.
Corporate Governance ReportFOR THE YEAR ENDED 31 DECEMBER 2017
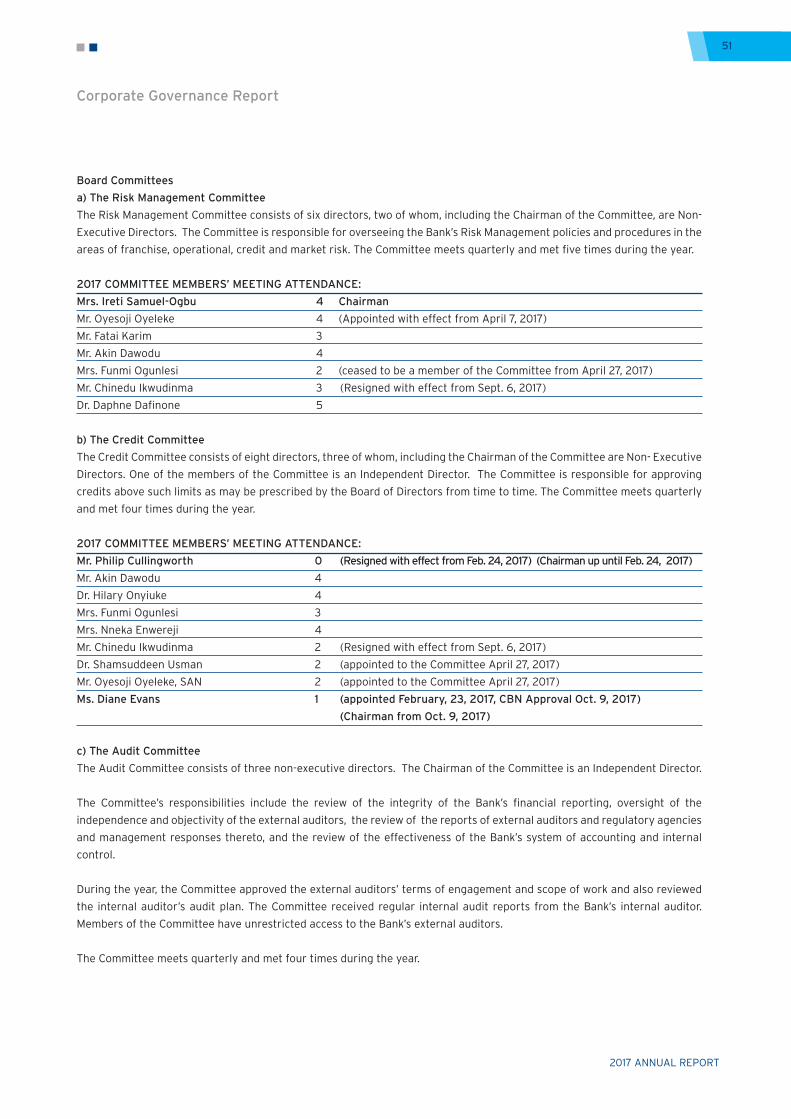
2017 ANNUAL REPORT
51
Board Committees
a) The Risk Management Committee
The Risk Management Committee consists of six directors, two of whom, including the Chairman of the Committee, are Non-
Executive Directors. The Committee is responsible for overseeing the Bank’s Risk Management policies and procedures in the
areas of franchise, operational, credit and market risk. The Committee meets quarterly and met five times during the year.
2017 COMMITTEE MEMBERS’ MEETING ATTENDANCE:
Mrs. Ireti Samuel-Ogbu 4 Chairman
Mr. Oyesoji Oyeleke 4 (Appointed with effect from April 7, 2017)
Mr. Fatai Karim 3
Mr. Akin Dawodu 4
Mrs. Funmi Ogunlesi 2 (ceased to be a member of the Committee from April 27, 2017)
Mr. Chinedu Ikwudinma 3 (Resigned with effect from Sept. 6, 2017)
Dr. Daphne Dafinone 5
b) The Credit Committee
The Credit Committee consists of eight directors, three of whom, including the Chairman of the Committee are Non- Executive
Directors. One of the members of the Committee is an Independent Director. The Committee is responsible for approving
credits above such limits as may be prescribed by the Board of Directors from time to time. The Committee meets quarterly
and met four times during the year.
2017 COMMITTEE MEMBERS’ MEETING ATTENDANCE:
Mr. Philip Cullingworth 0 (Resigned with effect from Feb. 24, 2017) (Chairman up until Feb. 24, 2017)
Mr. Akin Dawodu 4
Dr. Hilary Onyiuke 4
Mrs. Funmi Ogunlesi 3
Mrs. Nneka Enwereji 4
Mr. Chinedu Ikwudinma 2 (Resigned with effect from Sept. 6, 2017)
Dr. Shamsuddeen Usman 2 (appointed to the Committee April 27, 2017)
Mr. Oyesoji Oyeleke, SAN 2 (appointed to the Committee April 27, 2017)
Ms. Diane Evans 1 (appointed February, 23, 2017, CBN Approval Oct. 9, 2017)
(Chairman from Oct. 9, 2017)
c) The Audit Committee
The Audit Committee consists of three non-executive directors. The Chairman of the Committee is an Independent Director.
The Committee’s responsibilities include the review of the integrity of the Bank’s financial reporting, oversight of the
independence and objectivity of the external auditors, the review of the reports of external auditors and regulatory agencies
and management responses thereto, and the review of the effectiveness of the Bank’s system of accounting and internal
control.
During the year, the Committee approved the external auditors’ terms of engagement and scope of work and also reviewed
the internal auditor’s audit plan. The Committee received regular internal audit reports from the Bank’s internal auditor.
Members of the Committee have unrestricted access to the Bank’s external auditors.
The Committee meets quarterly and met four times during the year.
Corporate Governance Report
2017 ANNUAL REPORT
52
2017 COMMITTEE MEMBERS’ MEETING ATTENDANCE:
Dr. Daphne Dafinone 4 Chairman
Mr. Philip Cullingworth NIL (Resigned with effect from February 24, 2017)
Mrs. Ireti Samuel-Ogbu 3
Dr. Shamsuddeen Usman 3 (Appointed to the Committee April 27, 2017)
d) Board Governance and Nominations Committee
The Committee is made up of four non-executive directors. One of the members of the Committee is an Independent Director.
The Committee’s responsibilities include recommending the criteria for the selection of new directors to serve on the Board,
identifying and evaluating individuals qualified to be nominated as directors of the Bank, or any of the Board’s committees,
evaluating and making recommendations to the Board regarding compensation for non-executive directors, and considering
and approving the remuneration of executive directors.
The Committee is required to hold a minimum of two meetings in a year. The Committee met three times during the year.
2017 COMMITTEE MEMBERS’ MEETING ATENDANCE:
Dr. Hilary Onyiuke 3 - Chairman
Mr. Peter McCarthy 2
Dr. Daphne Dafinone 3
Mr. Oyesoji Oyeleke, SAN 1 (appointed to the Committee April 27, 2017)
GENERAL MEETINGS
The last Annual General Meeting was held on April 27, 2017.
Management Committees
The following are the key management committees: Country Co-Ordinating Committee, Business Risk and Compliance
Committee, Assets and Liabilities Committee, Legal Entity Management Committee, Country Senior Human Resources
Committee, Information Technology Steering Committee, Management Credit Committee, Local Regulatory Reporting
Governance Committee and Third Party Management Committee.
RISK AND CONTROLS
In line with Citigroup policies, Citibank Nigeria Limited maintains a strong control environment, which is hinged on:
- Establishing long and short-term strategic objectives, and adopting operating policies to achieve these objectives in a
legal and sound manner.
- Maintaining acceptable risk appetite – consistent with the local and global environment and regulations, and ensuring
adherence to the risk management framework – consistent with the strategic plan of the business.
- Ensuring that the Bank’s operations are controlled adequately and are in compliance with governing laws and policies.
- Ensuring the balance of risks and returns, and capital performance through sustainable risk management practices.
The Bank’s internal control systems are designed to achieve efficiency and effectiveness of its operations, reliability of
financial reporting, adherence to its risk tolerance and policies, and compliance with applicable laws and regulations at all
levels.
The Bank’s risk management policies and mechanisms ensure effective identification of risk and effective control, and an
active commitment to a strong culture of compliance, control and ethical conduct. The Board, through the Board Risk
Management Committee, oversees the Bank’s risk management policies.
WHISTLE BLOWING PROCEDURES
In line with the Bank’s commitment to instill best corporate governance practices, the Bank has established a robust whistle
blowing procedure that ensures anonymity for whistle-blowers. The procedures provides a clear framework for reporting
suspected breaches of laws, regulations and the Bank’s internal policies.
Corporate Governance Report
2017 ANNUAL REPORT
53
The Bank has instituted a strong whistle blowing culture among staff and also published a copy of the whistleblowing policy
on its website with the aim of ensuring that all cases of irregularities are made known and addressed by the Bank. The Bank
has a dedicated whistle blowing hotline and e-mail address through which stakeholders can anonymously report suspected
wrong-doing. The whistle blowing platforms are accessible to all. The Chief Compliance Officer forwards quarterly returns
to the Central Bank of Nigeria on all all whistle-blowing reports. All whistleblowing reports are reported to the Board Audit
Committee.
CODE OF CONDUCT
The Bank has a Code of Conduct which sets out the Bank’s expectations from its directors and staff and which all staff
and directors of the Bank are expected to adhere to. All staff and directors are expected to strive to maintain the highest
standards of ethical conduct and integrity in all aspects of their professional life as prescribed in the Code of Conduct. Below
are some relevant provisions in the Citigroup Code of Conduct.
Act with Integrity: Demonstrate a commitment to the highest standards of ethics and professional behavior in dealings with
clients, business colleagues, shareholders, communities, and each other. Ask questions when you are uncertain about the best
course of action in a particular situation, and speak up if you reasonably suspect or become aware of possible misconduct.
Treat Others Fairly: Treat other employees, customers and third-parties fairly and with respect. Create a work environment
free of discrimination, harassment, and retaliation.
Respect Privacy: Treat confidential information as such Use or share information only for the purpose for which it was
collected and only with authorized persons. Do not disclose any non-public information unless authorized by law.
Protect Citi’s Assets: Maintain accurate and complete records. Follow Citi’s expense management and fraud control policies.
Immediately report a suspected or attempted fraud. Do not use communications equipment, systems, and services provided
or approved by Citi for any inappropriate or unauthorized purpose.
Avoid Conflicts of Interest: Do not act in ways that conflict, or appear to conflict, with the interests of Citi, its clients,
shareholders, or the responsibilities of your employment at Citi. Be alert for situations in which personal activities, interests,
or relationships could interfere with, or be perceived to interfere with, your objectivity. Report real or perceived conflicts.
Avoid Corruption: Never attempt to bribe someone or offer anything of value to another person in exchange for an improper
business advantage.
Do Not Retaliate: Never retaliate against any colleague for raising a concern in good faith or participating in an investigation.
Escalate: Promptly raise any concerns or questions you may have about your conduct or that of others, either through the
Citi Ethics Hotline or one of the other contacts listed in the Code.
MANAGEMENT SUCCESSION
The Bank has a strong management team and a documented succession plan for every executive role within the Bank.
REMUNERATION POLICY
The Bank’s employee remuneration policy revolves around Pay for Performance, to enable the Bank to attract and retain
people of the highest quality. Employees total compensation package is linked to the performance of the organisation as a
whole, as well as to the individual performance of each employee as assessed against measurable goals and targets.
Board Compensation
Members of the Board are paid directors fees, sitting allowances and reimbursable expenses as provided for in the CBN
Code of Corporate Governance for banks.
Corporate Governance Report
2017 ANNUAL REPORT
54
INSIDER CREDIT POLICY
Policy Statement and Certain Key Definitions
Citibank Nigeria Limited has established a framework to satisfy safety and soundness concerns and comply with all applicable
laws and regulations concerning Extensions of Credit to Insiders
Extensions of Credit to insiders must be made within legal and regulatory limits and on substantially the same as those
prevailing at the time for comparable transactions by Citi for non-insiders and reported in accordance with applicable
requirements as described in this Policy.
Insiders are board members and executive officers, directors, significant shareholders and employees, including the immediate
family and related Interests of each. According to the Banks and Other Financial Institutions Acts (BOFIA), the term “director”
includes director’s wife, husband, father, mother, brother, sister, son, daughter and their spouses.
Significant shareholding is defined as a holding of at least 5% (individually or in aggregate) of the Bank’s equity
Prohibition On Using Position To Obtain Extensions Of Credit
All Citibank Nigeria Limited employees are prohibited from using their positions to make, or influence the making of,
Extensions of Credit by Citibank Nigeria Limited to themselves and/or their immediate family or related Interests that (i) are
not on market terms and conditions and/or (ii) reflect more than a normal risk of repayment (“Preferential Terms”).
Regulatory Guidance
The Bank has established procedures to ensure compliance with the provisions of the Prudential Guidelines and local
regulation including approval and disclosure requirements
Corporate Governance Report
2017 ANNUAL REPORT
55
Specific Exclusions: The Insider-Credit requirements do not apply to credits extended to employees under their employment
scheme of service, or to shareholders whose shareholding and related interests are less than 5% of the bank’s paid up capital
as at the date of the financial report or to public limited liability companies in which a director has an interest that is less
than 5%
Board Performance Review
An annual review of the Board’s performance is conducted by Ernst & Young. A summary of Ernst & Young’s report is
contained at page 56.
General Rule Applicable to:
Approval
Audit Report and Opinion
Write-off of Fully Provided Insider-Credits
Disclosure of Insider Credits in the Financial Statements
S/N
1
2
3
4
Regulatory / Policy Requirement
Lending to insiders, including directors shall substantially be at the same terms as those prevailing at the time for comparable transactions by Citi for non-Insiders
They shall be subject to the bank’s Risk Policy requirements, in addition to explicit approval by the Board Credit Committee of Citibank Nigeria Limited
The external auditors and audit committees should include in their report, their opinion on related-party credits
Policies and procedures for write-off of fully provided credit facilities:
(a) The facility must have been fully provided for in line with the loan loss provisioning guidelines and must be in bank’s book for at least one year after full provision.
(b) There should be evidence of board approval.
(c) ‘If the facility is insider or related party credit, the approval of CBN is required
(d) The fully provisioned facility must be appropriately disclosed in the audited financial statement
(a) The aggregate amount of insider-related loans, advances and leases outstanding as at the financial year end should be separately stated in a note to the accounts and the non-performing component further analyzed by security, maturity, performance, provision, interest-in suspense and name of borrowers
(b) Notes to the accounts on guarantees, commitments and other contingent liabilities should also give details of those arising from related-party transactions
(c)The external auditors and audit committees should include in their report, their opinion on related-party credits
Responsible party
Business Sponsor
Independent Risk Credit Officer shall provide the covering limit.
Board Credit Committee shall approve by circulation and/or at scheduled approval meetings
Chief Auditor/Head of Internal Audit
Chief Finance Officer
Chief Finance Officer
Corporate Governance Report
Specific roles and responsibilities designed to ensure compliance with regulatory and internal requirements are summarized
below
2017 ANNUAL REPORT
56
Report of External Consultants on the Board Performance Appraisal of Citibank Nigeria Limited
We have performed the procedures agreed with Citibank Nigeria Limited (“Citibank”) in respect of the evaluation of the
Board of Citibank for the year ended 31 December, 2017 in accordance with the guidelines of Section 2.8.3 of the Central Bank
of Nigeria (CBN) Code of Corporate Governance (CCG) 2014 for Banks and Discount Houses “CBN CCG”. Our engagement
was undertaken in accordance with the International Standard on Related Services applicable to agreed-upon procedures’
engagements.
The procedures were performed in accordance with the CBN CCG which mandates an annual evaluation of the Board and
individual directors with specific focus on the Board structure and composition, responsibilities, proceedings and relationships,
individual director’s competences and respective roles in the performance of the Board.
The field work was performed in January and February, 2018. The evaluation is limited in nature, and as such may not
necessarily disclose all significant matters about the company or reveal irregularities, if any, in the underlying information.
Our approach included the review of Citibank’s Corporate Governance framework, and all relevant policies and procedures.
We obtained written representation through questionnaires administered to the Board members and conducted face to face
interviews and conference calls with the directors and key personnel of the Company. On the basis of our work, the Board of
Citibank has largely complied with the requirements of the CBN CCG during the year ended December 31, 2017.
The outcome of the review and our recommendations have been articulated and included in our detailed report to the Board.
Bunmi Akinde
Partner Advisory Services
FRC/2012/ICAN/00000000187
March 01, 2018
Board Performance Review
A member firm of Ernst & Young Global Limited.
Ernst & Young 10th & 13th Floor UBA House 57, Marina P.O. Box 2442, Marina Lagos, Nigeria
Tel: +234 (01) 631 4500 Fax:+234 (01) 463 0481 www.ey.com
Report of External Consultants on the Board Performance Appraisal of Citibank Nigeria Limited We have performed the procedures agreed with Citibank Nigeria Limited (“Citibank”) in respect of the evaluation of the Board of Citibank for the year ended 31 December, 2017 in accordance with the guidelines of Section 2.8.3 of the Central Bank of Nigeria (CBN) Code of Corporate Governance (CCG) 2014 for Banks and Discount Houses “CBN CCG". Our engagement was undertaken in accordance with the International Standard on Related Services applicable to agreed-upon procedures’ engagements. The procedures were performed in accordance with the CBN CCG which mandates an annual evaluation of the Board and individual directors with specific focus on the Board structure and composition, responsibilities, proceedings and relationships, individual director’s competences and respective roles in the performance of the Board. The field work was performed in January and February, 2018. The evaluation is limited in nature, and as such may not necessarily disclose all significant matters about the company or reveal irregularities, if any, in the underlying information. Our approach included the review of Citibank’s Corporate Governance framework, and all relevant policies and procedures. We obtained written representation through questionnaires administered to the Board members and conducted face to face interviews and conference calls with the directors and key personnel of the Company. On the basis of our work, the Board of Citibank has largely complied with the requirements of the CBN CCG during the year ended December 31, 2017. The outcome of the review and our recommendations have been articulated and included in our detailed report to the Board. Bunmi Akinde Partner Advisory Services FRC/2012/ICAN/00000000187 March 01, 2018
2017 ANNUAL REPORT
57
RESPONSIBILITY FOR ANNUAL FINANCIAL STATEMENTS
In accordance with the provisions of the Companies and Allied Matters Act and the Banks and Other Financial Institutions
Act, the directors are responsible for the preparation of the annual financial statements which give a true and fair view of the
state of affairs of the Group at the end of the year and of the financial performance and cashflows for the year then ended.
The responsibilities include ensuring that:
i. the Group keeps proper accounting records that disclose, with reasonable accuracy, the financial position of the Group
and comply with the requirements of the Companies and Allied Matters Act and the Banks and Other Financial Institutions
Act;
ii. appropriate and adequate internal controls are established to safeguard its assets and to prevent and detect fraud and
other irregularities;
iii. the Group prepares its financial statements using suitable accounting policies supported by reasonable and prudent
judgements and estimates, that are consistently applied; and
iv. it is appropriate for the financial statements to be prepared on a going concern basis.
The directors accept responsibility for the annual financial statements, which have been prepared using appropriate
accounting policies supported by reasonable and prudent judgements and estimates, in conformity with,
- International Financial Reporting Standards;
- Prudential Guidelines for Licensed Banks;
- Relevant circulars issued by the Central Bank of Nigeria;
- The requirements of the Banks and Other Financial Institutions Act;
- The requirements of the Companies and Allied Matters Act; and
- The requirements of the Financial Reporting Council of Nigeria Act.
The directors are of the opinion that the financial statements give a true and fair view of the state of the financial position of
the Group and of its financial performance and cash flows for the year.
The directors further accept responsibility for the maintenance of accounting records that may be relied upon in the
preparation of financial statements, as well as adequate systems of internal financial control.
Nothing has come to the attention of the directors to indicate that the Group will not remain a going concern for at least
twelve months from the date of this statement.
SIGNED ON BEHALF OF THE BOARD OF DIRECTORS BY:
MR. OLAYEMI CARDOSO MR. AKINSOWON DAWODU
CHAIRMAN MANAGING DIRECTOR
FRC/2013/CISN/00000002200 FRC/2015/CIBN/00000013238
March 12, 2018 March 12, 2018
Statement Of Directors’ ResponsibilitiesFOR THE YEAR ENDED 31 DECEMBER 2017
2017 ANNUAL REPORT
58
Report on the audit of the consolidated and separate financial statements
Our opinion
In our opinion, the consolidated and separate financial statements give a true and fair view of the consolidated and separate
financial position of Citibank Nigeria Limited (“the bank”) and its subsidiary (Together “the Group”) as at 31 December 2017,
and of their consolidated and separate financial performance and their consolidated and separate cash flows for the year
then ended in accordance with international Financial Reporting Standards and the requirements of the Companies and
Allied Matters Act, the Banks and other Financial Institution Act and the Financial Reporting Council of Nigeria Act.
What we have audited
Citibank Nigeria Limited’s financial statements comprise:
the consolidated and separate statements of financial position as at 31 December 2017;
the consolidated and separate statements of profit and loss for the year then ended;
the consolidated and separate statements of comprehensive income for the year then ended;
the consolidated and separate statements of changes in equity for the year ended;
the consolidated and separate statements of cash flows for the year then ended; and
the notes to the consolidated and separate financial statements, which include a summary of significant accounting
policies.
Basis for opinion
We conducted our audit in accordance with International Standard on Auditing (ISAs). Our responsibilities under those
standards are further described in the Auditor’s responsibilities for the audit of the financial statements section of our report.
We believe that the audit evidence we have obtained is sufficient and appropriate to provide a basis for our opinion.
Independence
We are independent of the bank in accordance with the International Ethics Standard Board for Accountants’ Code of Ethics
for Professional Accountants (IESBA Code). We have fulfilled our other ethical responsibilities in accordance with the IESBA
Code.
Key audit matters
Key audit matters are those matters that, in our professional judgement, were of most significance in our audit of the
consolidated and separate financial statements of the current period. These matters were addresses in the context of our
audit of the consolidated and separate financial statements as a whole, and in forming our opinion thereon, and we do not
provide a separate opinion on these matters.
Pricewaterhousecoopers Chartered Accountants, Landmark Towers, 5b Water Corporation Road, Victoria Island, Lagos, Nigeria
Independent Auditor’s ReportTO THE MEMBERS OF CITIBANK NIGERIA LIMITED
2017 ANNUAL REPORT
59
Key audit matter
Loan loss reserve assessment (N2.1 billion)
We focussed on this area due to the size of the loans and advances to customers net of impairment balance (N98.2billion) and because it required significant judgement both for the timing and recognition of impairment and the estimation of the size of any such impairment.
In particular we focussed on:
How impairment events are identified.
How impairments are measured. For specific impairment, management makes assumptions about the future cash flows of the borrower. For collective impairment, the internal rating model developed by management is used to assess the credit quality and measure the default risk of borrowers. Management’s assumption in arriving at the risk rating in the model is subjective and sensitive to the changes in economic and credit conditions across the different sectors and industries that borrowers operate in.
This is considered a key audit matter in the consolidated and separate financial statements.
See Notes 13 and 21 to the consolidated and separate financial statements.
Valuation of derivatives (N7.63billion asset & N7.1billion liability)
Due to their nature and terms, the valuations of derivatives
are based on management estimates and judgements. As
a result, changes to key inputs in the estimates and/or the
judgements made can result in a material change to the
valuation of the derivatives.
This is considered a key matter in the consolidated and
separate financial statements.
See Note 19 to the consolidated and separate financial
statements.
How our audit addressed the key audit matter
We understood and tested key controls around the approval for loan disbursements, identification of impairment triggers and assignment of ratings and the review process that management has in place for the output of the bank’s impairment models.
We applied a risk based target testing approach in selecting a sample of credit facilities, comprising significant and non-significant facilities, for detailed reviews of related customer files and account statements. Our review, which include checking the details of the borrowers and their account history, the nature of the facility, the borrowers’ industry and the borrowers’ capacity to repay, was to enable us form our own judgement as to whether management’s identification of loans as potentially impaired was appropriate.
Where impairment was individually assessed, we considered whether key judgements were appropriate given the borrowers’ circumstances and formed our own judgement about the reasonableness of the specific impairment charge.
Where impairment was calculated on a modelled basis, we reviewed the reasonableness of management’s assumptions with respect to other inputs into the incurred loss model. We then assessed the accuracy of the inputs and recalculated the collective impairment amount.
Our audit work included having our valuation experts
develop an independent point estimate to evaluate
management’s estimate, based on reasonable market
indicators and assumptions, comparing the results to the
Group’s valuations and the investigation of any significant
variances.
Independent Auditor’s Report
2017 ANNUAL REPORT
60
Key audit matter
Disclosure of the impact of IFRS 9 transition
On 1 January 2018, the Group transitioned to financial
instruments accounting standard - IFRS 9 which replaced
IAS39.
Significant judgement was applied in estimating the
impairment allowances under the new expected credit
loss (ECL) model. ECL models incorporate forward looking
information, reflecting management’s view of potential
future economic environments. The new standard also
introduced requirements around the classification and
measurement of financial instruments, potentially resulting
in fair value differences.
Disclosure of IFRS 9 impact is considered a key audit matter
in the consolidated and separate financial statements.
The estimated transition impact is disclosed in Notes 2.2.3
and 40 of the consolidated and separate financial statement.
How our audit addressed the key audit matter
We understood and critically assessed management’s
decisions around classification and measurement of financial
instruments in line with IFRS 9.
We relied on our credit modelling experts in assessing
the judgements and assumptions supporting the ECL
requirements of the standard. We assessed reasonableness
of forward looking information incorporated into the
impairment calculations and re-performed certain model
calculations to confirm the risk parameter outputs. We also
challenged the multiple economic scenarios chosen and the
weighting applied to non-linear losses.
We assessed the adequacy of the underlying disclosures
related to the transition impact.
Other information
The directors are responsible for the other information. The other information comprises Directors’ report, Corporate
Governance report, Statement of Directors’ responsibilities, Statement of value added and Consolidated five year financial
summary (but does not include the consolidated and separate financial statements and our auditor’s report thereon) which we
obtained prior to the date of this auditor’s report, and Board performance review, which is expected to be made available to us
after that date.
Our opinion on the consolidated and separate financial statements does not cover the other information and we do not and will
not express any form of assurance conclusion thereon.
In connection with our audit of the consolidated and separate financial statements, our responsibility is to read the other
information identified above and, in doing so, consider whether the other information is materially inconsistent with the
consolidated and separate financial statements or our knowledge obtained in the audit, or otherwise appears to be materially
misstated. If, based on the work we have performed on the other information that we obtained prior to the date of this auditors
report, we conclude that there is a material misstatement of this other information, we are required to report that fact. We have
nothing to report in this regard.
When we read the Board Performance review, if we conclude that there is a material misstatement therein, we are required to
communicate the matter to those charged with governance.
Independent Auditor’s Report
2017 ANNUAL REPORT
61
Auditor’s responsibilities for the audit of the consolidated and separate financial statements
Our objectives are to obtain reasonable assurance about whether the consolidated and separate financial statements as a
whole are free from material misstatement, whether due to fraud or error, and to issue an auditor’s report that includes our
opinion. Reasonable assurance is a high level of assurance, but it is not a guarantee that an audit conducted in accordance
with ISAs will always detect a material misstatement when it exists. Misstatements can arise from fraud or error and are
considered material if, individually or in the aggregate, they could reasonably be expected to influence the economic decisions
of users taken on the basis of these consolidated and separate financial statements.
As part of an audit in accordance with ISAs, we exercise professional judgment and maintain professional scepticism
throughout the audit. We also:
Identify and assess the risks of material misstatement of the consolidated and separate financial statements, whether
due to fraud or error, design and perform audit procedures responsive to those risks, and obtain audit evidence that is
sufficient and appropriate to provide a basis for our opinion. The risk of not detecting a material misstatement resulting
from fraud is higher than for one resulting from error, as fraud may involve collusion, forgery, intentional omissions,
misrepresentations, or the override of internal control.
Obtain an understanding of internal control relevant to the audit in order to design audit procedures that are appropriate
in the circumstances, but not for the purpose of expressing an opinion on the effectiveness of the Group’s internal
control.
Evaluate the appropriateness of accounting policies used and the reasonableness of accounting estimates and related
disclosures made by the directors.
Conclude on the appropriateness of the directors’ use of the going concern basis of accounting and, based on the audit
evidence obtained, whether a material uncertainty exists related to events or conditions that may cast significant doubt
on the Group’s ability to continue as a going concern. If we conclude that a material uncertainty exists, we are required
to draw attention in our auditor’s report to the related disclosures in the consolidated and separate financial statements
or, if such disclosures are inadequate, to modify our opinion. Our conclusions are based on the audit evidence obtained
up to the date of our auditor’s report. However, future events or conditions may cause the Group to cease to continue as
a going concern.
Evaluate the overall presentation, structure and content of the consolidated and separate financial statements, including
the disclosures, and whether the consolidated and separate financial statements represent the underlying transactions
and events in a manner that achieves fair presentation.
Independent Auditor’s Report
Responsibilities of the directors and those charged with governance for the consolidated and separate financial statements
The directors are responsible for the preparation of the consolidated and separate financial statements that give a true and
fair view in accordance with International Finance Reporting Standards and the requirements of the Companies And Allied
Matters Act, the Financial Reporting Council of Nigeria Act, the Banks and Other Financial Institutions Act, and for such
internal control as the directors determine is necessary to enable the preparation of consolidated and separate financial
statements that are free from material misstatement, whether due to fraud or error.
In preparing the consolidated and separate financial statements, the directors are responsible for accessing the Group’s
ability to continue as a going concern, disclosing, as applicable, matters related to going concern and using the going concern
basis of accounting unless the directors either intend to liquidate the Group or to cease operations, or have no realistic
alternative but to do so.
Those charged with governance are responsible for overseeing the Group’s financial reporting process.
2017 ANNUAL REPORT
62
Obtain sufficient appropriate audit evidence regarding the financial information of the entities or business activities
within the Group to express an opinion on the consolidated and separate financial statements. We are responsible for
the direction, supervision and performance of the group audit. We remain solely responsible for our audit opinion.
We communicate with those charged with governance regarding, among other matters, the planned scope and timing of
the audit and significant audit findings, including any significant deficiencies in internal control that we identify during our
audit.
From the matters communicated with those charged with governance, we determine those matters that were of most
significance in the audit of the consolidated and separate financial statements of the current period and are therefore the
key audit matters. We describe these matters in our auditor’s report unless law or regulation precludes public disclosure
about the matter or when, in extremely rare circumstances, we determine that a matter should not be communicated in
our report because the adverse consequences of doing so would reasonably be expected to outweigh the public interest
benefits of such communication.
Report on other legal and regulatory requirements
The Companies and Allied Matters Act and the Banks and Other Financial Institutions Act require that in carrying out our
audit we consider and report to you on the following matters. We confirm that:
i we have obtained all the information and explanations which to the best of our knowledge and belief were necessary
for the purpose of our audit;
ii the bank has kept proper books of account, so far as appears from the examination of those books and returns adequate
for our audit have been received from branches not visited by us;
iii the bank’s statements of financial position, statement of profit or loss and statement of comprehensive income are in
agreement with the books of account.
iv the information required by Central Bank of Nigeria Circular BSD/1/2004 on insider related credits is disclosed in Note
34.3 to the consolidated and separate financial statements; and
v except for the contraventions disclosed in Note 38 to the consolidated and separate financial statements, the bank has
complied with the requirements of the relevant circulars issued by the Central Bank of Nigeria.
For: PricewaterhouseCoopers
Chartered Accountants
Lagos, Nigeria
Engagement Partner; Patrick Obianwa
FRC/2013/ICAN/00000000880
Independent Auditor’s Report
12 March 2018
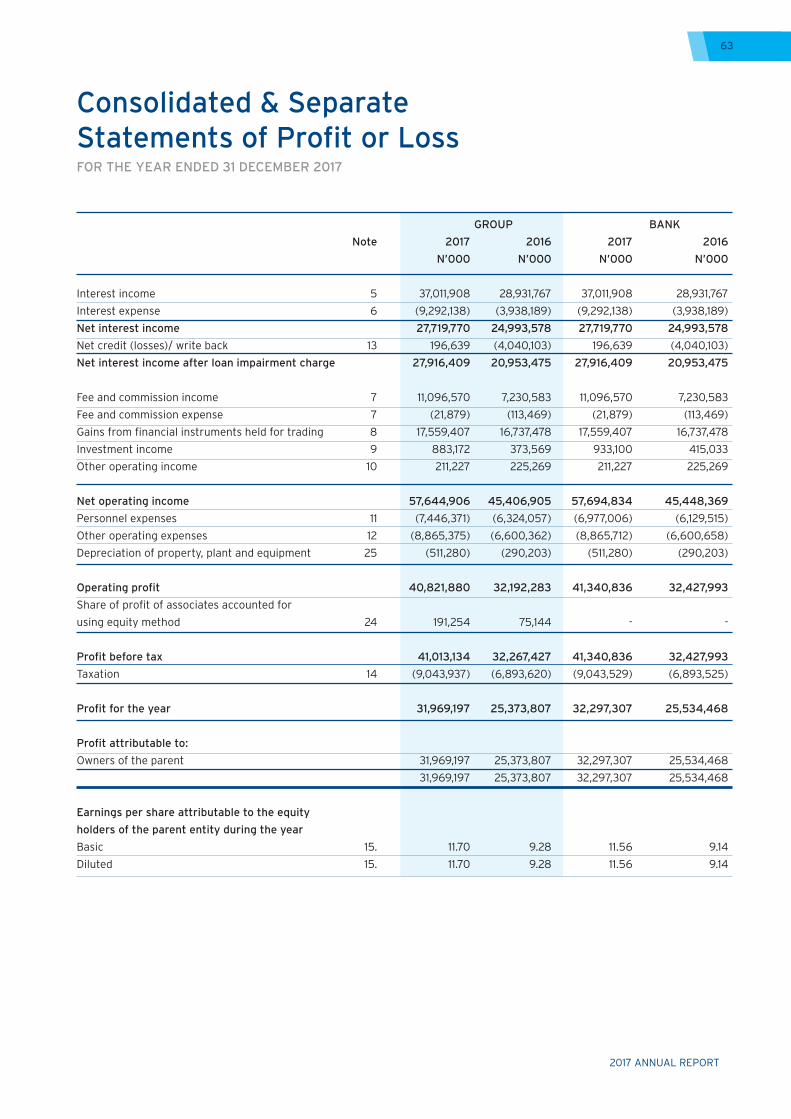
2017 ANNUAL REPORT
63
GROUP BANK
Note 2017 2016 2017 2016
N’000 N’000 N’000 N’000
Interest income 5 37,011,908 28,931,767 37,011,908 28,931,767
Interest expense 6 (9,292,138) (3,938,189) (9,292,138) (3,938,189)
Net interest income 27,719,770 24,993,578 27,719,770 24,993,578
Net credit (losses)/ write back 13 196,639 (4,040,103) 196,639 (4,040,103)
Net interest income after loan impairment charge 27,916,409 20,953,475 27,916,409 20,953,475
Fee and commission income 7 11,096,570 7,230,583 11,096,570 7,230,583
Fee and commission expense 7 (21,879) (113,469) (21,879) (113,469)
Gains from financial instruments held for trading 8 17,559,407 16,737,478 17,559,407 16,737,478
Investment income 9 883,172 373,569 933,100 415,033
Other operating income 10 211,227 225,269 211,227 225,269
Net operating income 57,644,906 45,406,905 57,694,834 45,448,369
Personnel expenses 11 (7,446,371) (6,324,057) (6,977,006) (6,129,515)
Other operating expenses 12 (8,865,375) (6,600,362) (8,865,712) (6,600,658)
Depreciation of property, plant and equipment 25 (511,280) (290,203) (511,280) (290,203)
Operating profit 40,821,880 32,192,283 41,340,836 32,427,993
Share of profit of associates accounted for
using equity method 24 191,254 75,144 - -
Profit before tax 41,013,134 32,267,427 41,340,836 32,427,993
Taxation 14 (9,043,937) (6,893,620) (9,043,529) (6,893,525)
Profit for the year 31,969,197 25,373,807 32,297,307 25,534,468
Profit attributable to:
Owners of the parent 31,969,197 25,373,807 32,297,307 25,534,468
31,969,197 25,373,807 32,297,307 25,534,468
Earnings per share attributable to the equity
holders of the parent entity during the year
Basic 15. 11.70 9.28 11.56 9.14
Diluted 15. 11.70 9.28 11.56 9.14
Consolidated & Separate Statements of Profit or LossFOR THE YEAR ENDED 31 DECEMBER 2017
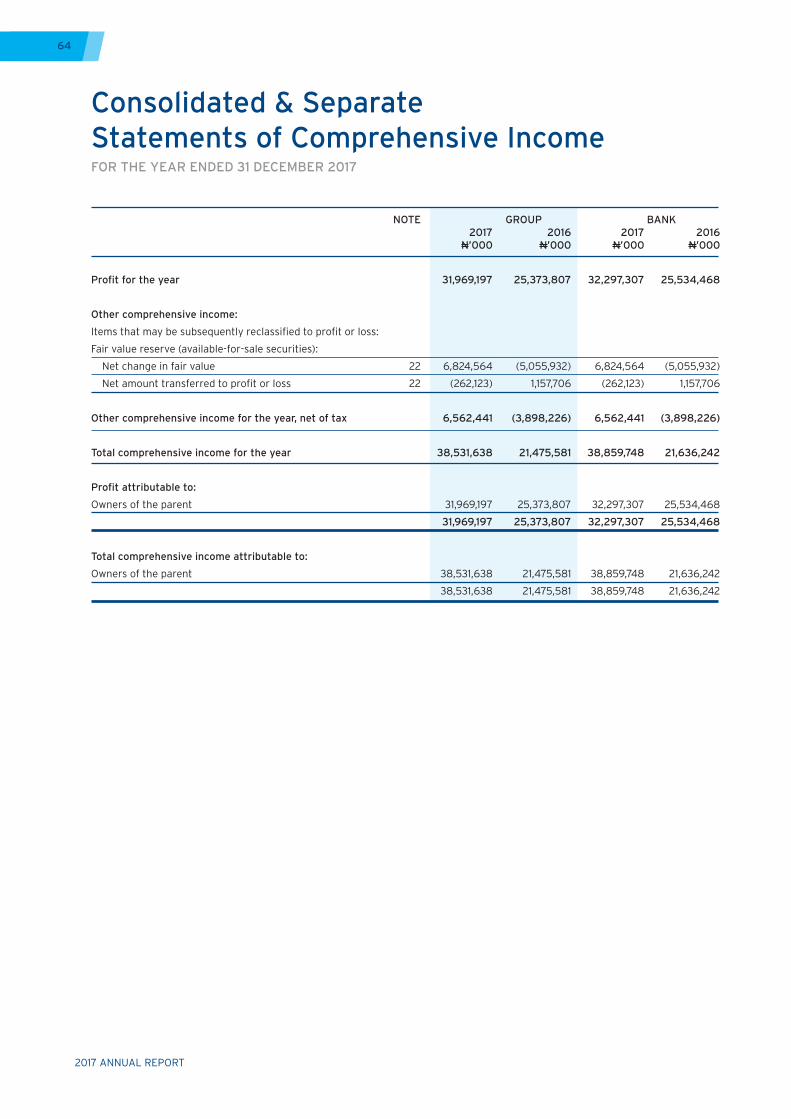
2017 ANNUAL REPORT
64
NOTE GROUP BANK 2017 2016 2017 2016 N’000 N’000 N’000 N’000
Profit for the year 31,969,197 25,373,807 32,297,307 25,534,468
Other comprehensive income:
Items that may be subsequently reclassified to profit or loss:
Fair value reserve (available-for-sale securities):
Net change in fair value 22 6,824,564 (5,055,932) 6,824,564 (5,055,932)
Net amount transferred to profit or loss 22 (262,123) 1,157,706 (262,123) 1,157,706
Other comprehensive income for the year, net of tax 6,562,441 (3,898,226) 6,562,441 (3,898,226)
Total comprehensive income for the year 38,531,638 21,475,581 38,859,748 21,636,242
Profit attributable to:
Owners of the parent 31,969,197 25,373,807 32,297,307 25,534,468
31,969,197 25,373,807 32,297,307 25,534,468
Total comprehensive income attributable to:
Owners of the parent 38,531,638 21,475,581 38,859,748 21,636,242
38,531,638 21,475,581 38,859,748 21,636,242
Consolidated & Separate Statements of Comprehensive IncomeFOR THE YEAR ENDED 31 DECEMBER 2017
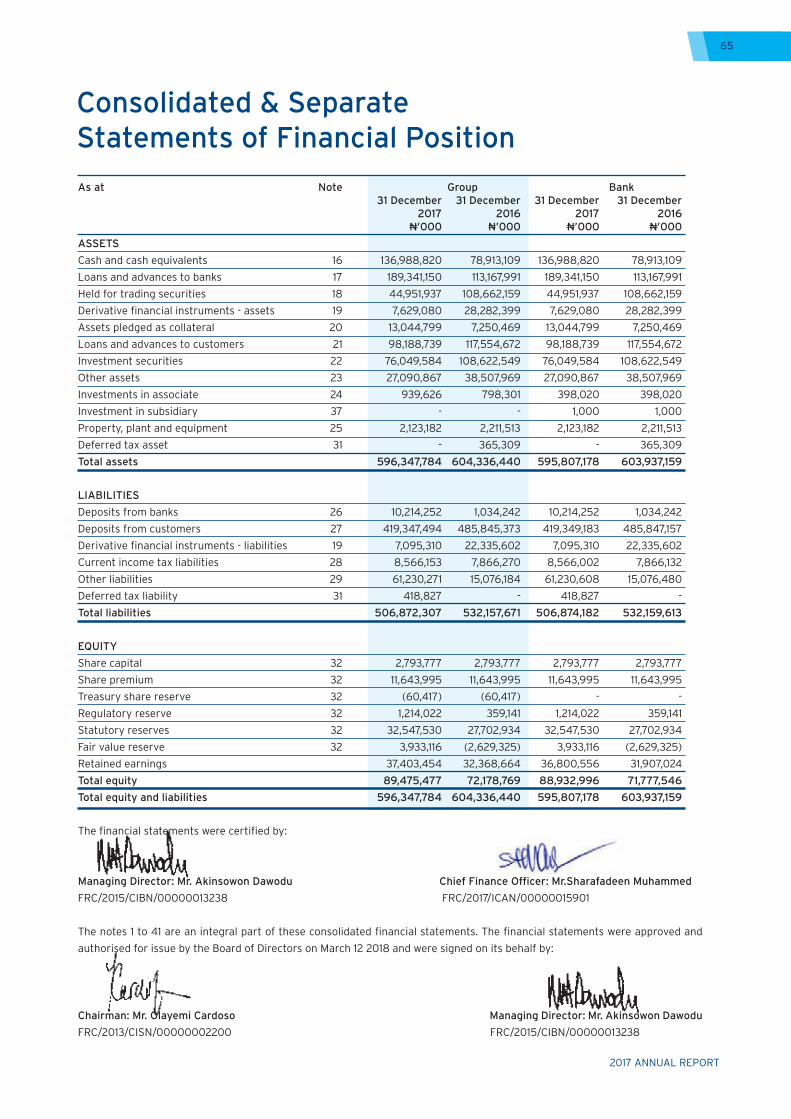
2017 ANNUAL REPORT
65
As at Note Group Bank 31 December 31 December 31 December 31 December 2017 2016 2017 2016 N’000 N’000 N’000 N’000
ASSETS
Cash and cash equivalents 16 136,988,820 78,913,109 136,988,820 78,913,109
Loans and advances to banks 17 189,341,150 113,167,991 189,341,150 113,167,991
Held for trading securities 18 44,951,937 108,662,159 44,951,937 108,662,159
Derivative financial instruments - assets 19 7,629,080 28,282,399 7,629,080 28,282,399
Assets pledged as collateral 20 13,044,799 7,250,469 13,044,799 7,250,469
Loans and advances to customers 21 98,188,739 117,554,672 98,188,739 117,554,672
Investment securities 22 76,049,584 108,622,549 76,049,584 108,622,549
Other assets 23 27,090,867 38,507,969 27,090,867 38,507,969
Investments in associate 24 939,626 798,301 398,020 398,020
Investment in subsidiary 37 - - 1,000 1,000
Property, plant and equipment 25 2,123,182 2,211,513 2,123,182 2,211,513
Deferred tax asset 31 - 365,309 - 365,309
Total assets 596,347,784 604,336,440 595,807,178 603,937,159
LIABILITIES
Deposits from banks 26 10,214,252 1,034,242 10,214,252 1,034,242
Deposits from customers 27 419,347,494 485,845,373 419,349,183 485,847,157
Derivative financial instruments - liabilities 19 7,095,310 22,335,602 7,095,310 22,335,602
Current income tax liabilities 28 8,566,153 7,866,270 8,566,002 7,866,132
Other liabilities 29 61,230,271 15,076,184 61,230,608 15,076,480
Deferred tax liability 31 418,827 - 418,827 -
Total liabilities 506,872,307 532,157,671 506,874,182 532,159,613
EQUITY
Share capital 32 2,793,777 2,793,777 2,793,777 2,793,777
Share premium 32 11,643,995 11,643,995 11,643,995 11,643,995
Treasury share reserve 32 (60,417) (60,417) - -
Regulatory reserve 32 1,214,022 359,141 1,214,022 359,141
Statutory reserves 32 32,547,530 27,702,934 32,547,530 27,702,934
Fair value reserve 32 3,933,116 (2,629,325) 3,933,116 (2,629,325)
Retained earnings 37,403,454 32,368,664 36,800,556 31,907,024
Total equity 89,475,477 72,178,769 88,932,996 71,777,546
Total equity and liabilities 596,347,784 604,336,440 595,807,178 603,937,159
The financial statements were certified by:
Managing Director: Mr. Akinsowon Dawodu Chief Finance Officer: Mr.Sharafadeen Muhammed
FRC/2015/CIBN/00000013238 FRC/2017/ICAN/00000015901
The notes 1 to 41 are an integral part of these consolidated financial statements. The financial statements were approved and
authorised for issue by the Board of Directors on March 12 2018 and were signed on its behalf by:
Chairman: Mr. Olayemi Cardoso Managing Director: Mr. Akinsowon Dawodu
FRC/2013/CISN/00000002200 FRC/2015/CIBN/00000013238
Consolidated & Separate Statements of Financial Position
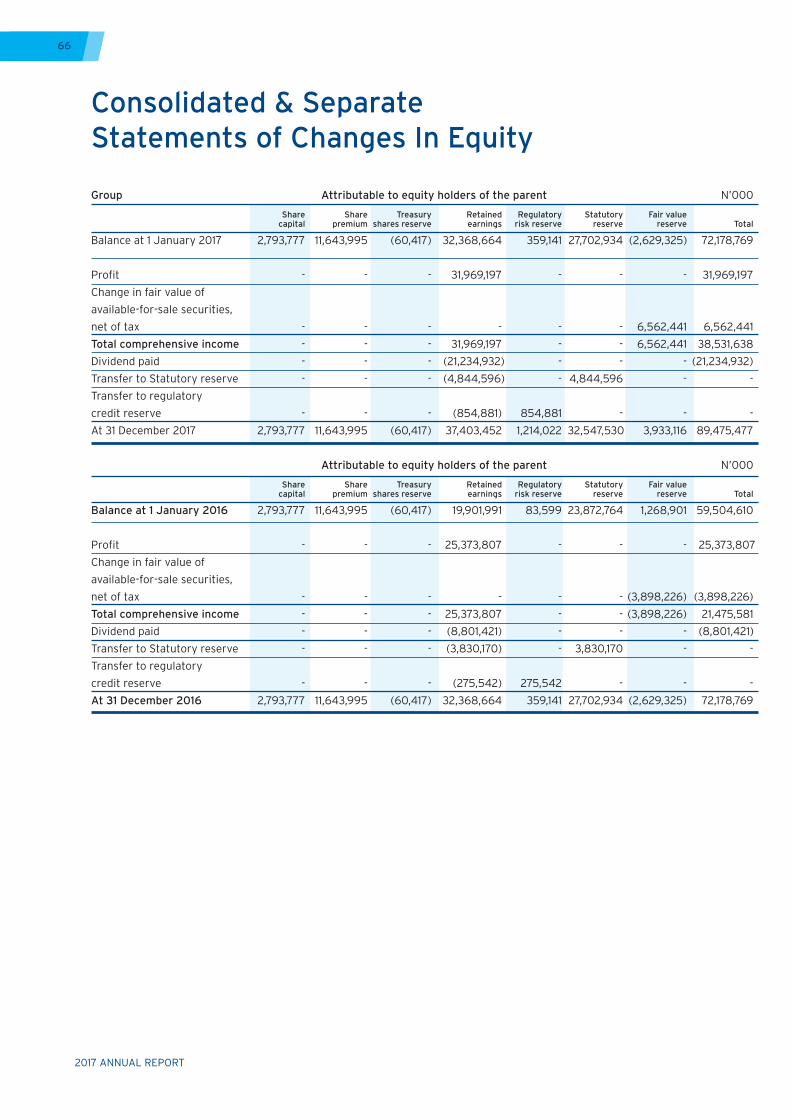
2017 ANNUAL REPORT
66
Group Attributable to equity holders of the parent N’000 Share Share Treasury Retained Regulatory Statutory Fair value capital premium shares reserve earnings risk reserve reserve reserve Total
Balance at 1 January 2017 2,793,777 11,643,995 (60,417) 32,368,664 359,141 27,702,934 (2,629,325) 72,178,769
Profit - - - 31,969,197 - - - 31,969,197
Change in fair value of
available-for-sale securities,
net of tax - - - - - - 6,562,441 6,562,441
Total comprehensive income - - - 31,969,197 - - 6,562,441 38,531,638
Dividend paid - - - (21,234,932) - - - (21,234,932)
Transfer to Statutory reserve - - - (4,844,596) - 4,844,596 - -
Transfer to regulatory
credit reserve - - - (854,881) 854,881 - - -
At 31 December 2017 2,793,777 11,643,995 (60,417) 37,403,452 1,214,022 32,547,530 3,933,116 89,475,477
Attributable to equity holders of the parent N’000 Share Share Treasury Retained Regulatory Statutory Fair value capital premium shares reserve earnings risk reserve reserve reserve Total
Balance at 1 January 2016 2,793,777 11,643,995 (60,417) 19,901,991 83,599 23,872,764 1,268,901 59,504,610
Profit - - - 25,373,807 - - - 25,373,807
Change in fair value of
available-for-sale securities,
net of tax - - - - - - (3,898,226) (3,898,226)
Total comprehensive income - - - 25,373,807 - - (3,898,226) 21,475,581
Dividend paid - - - (8,801,421) - - - (8,801,421)
Transfer to Statutory reserve - - - (3,830,170) - 3,830,170 - -
Transfer to regulatory
credit reserve - - - (275,542) 275,542 - - -
At 31 December 2016 2,793,777 11,643,995 (60,417) 32,368,664 359,141 27,702,934 (2,629,325) 72,178,769
Consolidated & SeparateStatements of Changes In Equity
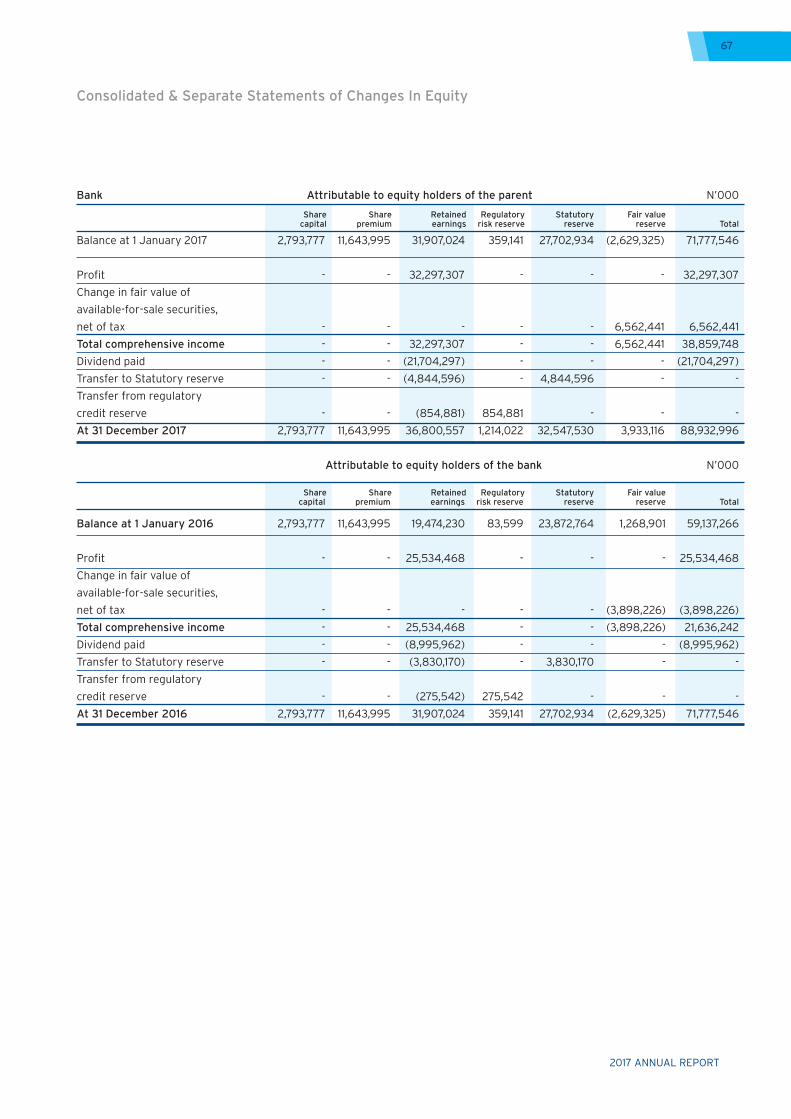
2017 ANNUAL REPORT
67
Bank Attributable to equity holders of the parent N’000 Share Share Retained Regulatory Statutory Fair value capital premium earnings risk reserve reserve reserve Total
Balance at 1 January 2017 2,793,777 11,643,995 31,907,024 359,141 27,702,934 (2,629,325) 71,777,546
Profit - - 32,297,307 - - - 32,297,307
Change in fair value of
available-for-sale securities,
net of tax - - - - - 6,562,441 6,562,441
Total comprehensive income - - 32,297,307 - - 6,562,441 38,859,748
Dividend paid - - (21,704,297) - - - (21,704,297)
Transfer to Statutory reserve - - (4,844,596) - 4,844,596 - -
Transfer from regulatory
credit reserve - - (854,881) 854,881 - - -
At 31 December 2017 2,793,777 11,643,995 36,800,557 1,214,022 32,547,530 3,933,116 88,932,996
Attributable to equity holders of the bank N’000
Share Share Retained Regulatory Statutory Fair value capital premium earnings risk reserve reserve reserve Total
Balance at 1 January 2016 2,793,777 11,643,995 19,474,230 83,599 23,872,764 1,268,901 59,137,266
Profit - - 25,534,468 - - - 25,534,468
Change in fair value of
available-for-sale securities,
net of tax - - - - - (3,898,226) (3,898,226)
Total comprehensive income - - 25,534,468 - - (3,898,226) 21,636,242
Dividend paid - - (8,995,962) - - - (8,995,962)
Transfer to Statutory reserve - - (3,830,170) - 3,830,170 - -
Transfer from regulatory
credit reserve - - (275,542) 275,542 - - -
At 31 December 2016 2,793,777 11,643,995 31,907,024 359,141 27,702,934 (2,629,325) 71,777,546
Consolidated & Separate Statements of Changes In Equity
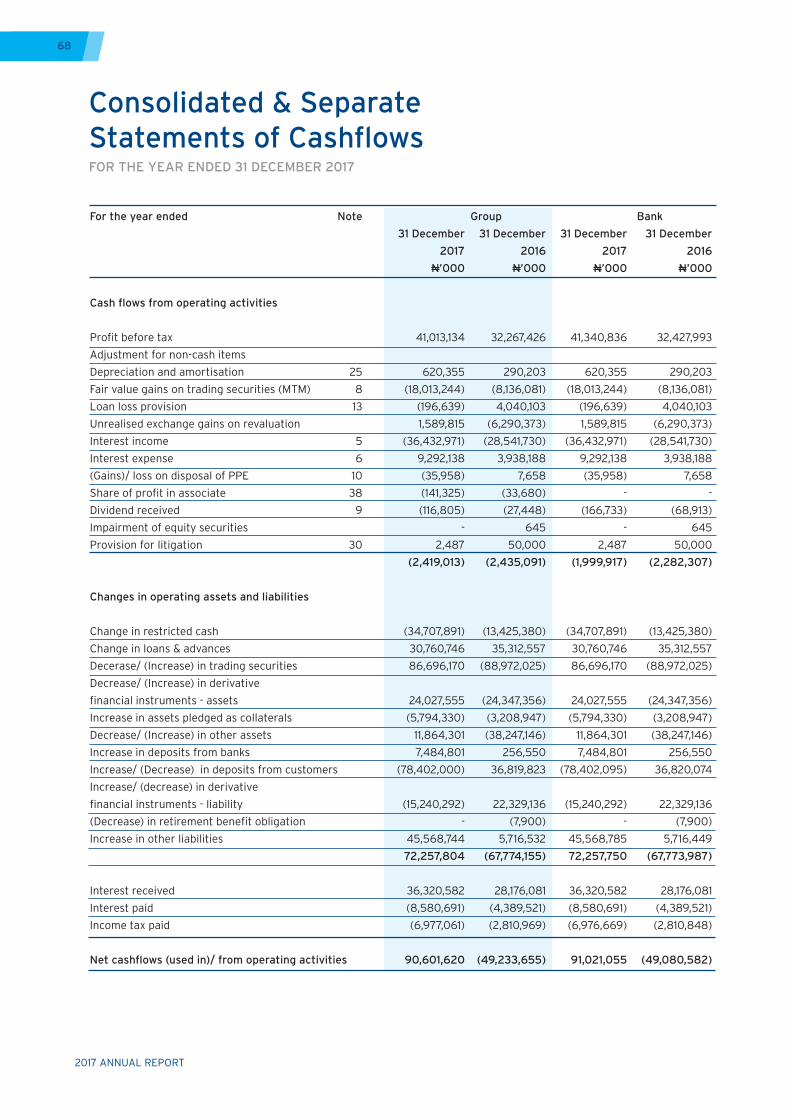
2017 ANNUAL REPORT
68
For the year ended Note Group Bank
31 December 31 December 31 December 31 December
2017 2016 2017 2016
N’000 N’000 N’000 N’000
Cash flows from operating activities
Profit before tax 41,013,134 32,267,426 41,340,836 32,427,993
Adjustment for non-cash items
Depreciation and amortisation 25 620,355 290,203 620,355 290,203
Fair value gains on trading securities (MTM) 8 (18,013,244) (8,136,081) (18,013,244) (8,136,081)
Loan loss provision 13 (196,639) 4,040,103 (196,639) 4,040,103
Unrealised exchange gains on revaluation 1,589,815 (6,290,373) 1,589,815 (6,290,373)
Interest income 5 (36,432,971) (28,541,730) (36,432,971) (28,541,730)
Interest expense 6 9,292,138 3,938,188 9,292,138 3,938,188
(Gains)/ loss on disposal of PPE 10 (35,958) 7,658 (35,958) 7,658
Share of profit in associate 38 (141,325) (33,680) - -
Dividend received 9 (116,805) (27,448) (166,733) (68,913)
Impairment of equity securities - 645 - 645
Provision for litigation 30 2,487 50,000 2,487 50,000
(2,419,013) (2,435,091) (1,999,917) (2,282,307)
Changes in operating assets and liabilities
Change in restricted cash (34,707,891) (13,425,380) (34,707,891) (13,425,380)
Change in loans & advances 30,760,746 35,312,557 30,760,746 35,312,557
Decerase/ (Increase) in trading securities 86,696,170 (88,972,025) 86,696,170 (88,972,025)
Decrease/ (Increase) in derivative
financial instruments - assets 24,027,555 (24,347,356) 24,027,555 (24,347,356)
Increase in assets pledged as collaterals (5,794,330) (3,208,947) (5,794,330) (3,208,947)
Decrease/ (Increase) in other assets 11,864,301 (38,247,146) 11,864,301 (38,247,146)
Increase in deposits from banks 7,484,801 256,550 7,484,801 256,550
Increase/ (Decrease) in deposits from customers (78,402,000) 36,819,823 (78,402,095) 36,820,074
Increase/ (decrease) in derivative
financial instruments - liability (15,240,292) 22,329,136 (15,240,292) 22,329,136
(Decrease) in retirement benefit obligation - (7,900) - (7,900)
Increase in other liabilities 45,568,744 5,716,532 45,568,785 5,716,449
72,257,804 (67,774,155) 72,257,750 (67,773,987)
Interest received 36,320,582 28,176,081 36,320,582 28,176,081
Interest paid (8,580,691) (4,389,521) (8,580,691) (4,389,521)
Income tax paid (6,977,061) (2,810,969) (6,976,669) (2,810,848)
Net cashflows (used in)/ from operating activities 90,601,620 (49,233,655) 91,021,055 (49,080,582)
Consolidated & Separate Statements of CashflowsFOR THE YEAR ENDED 31 DECEMBER 2017
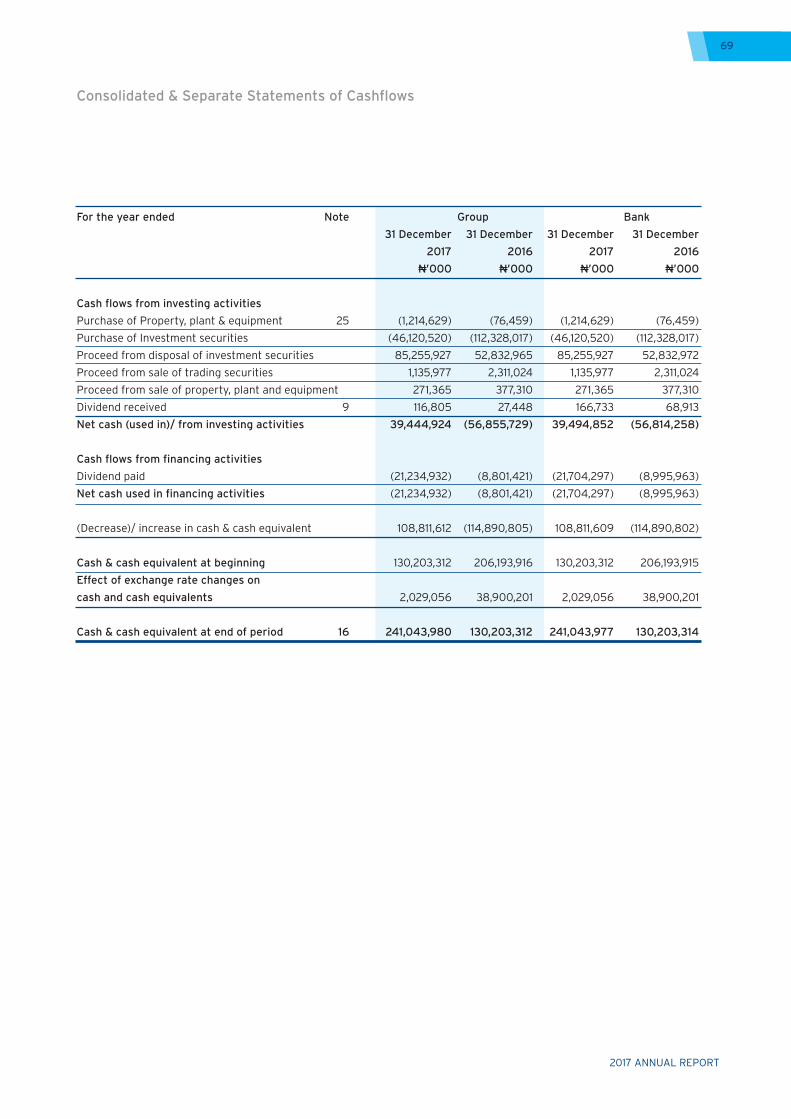
2017 ANNUAL REPORT
69
For the year ended Note Group Bank
31 December 31 December 31 December 31 December
2017 2016 2017 2016
N’000 N’000 N’000 N’000
Cash flows from investing activities
Purchase of Property, plant & equipment 25 (1,214,629) (76,459) (1,214,629) (76,459)
Purchase of Investment securities (46,120,520) (112,328,017) (46,120,520) (112,328,017)
Proceed from disposal of investment securities 85,255,927 52,832,965 85,255,927 52,832,972
Proceed from sale of trading securities 1,135,977 2,311,024 1,135,977 2,311,024
Proceed from sale of property, plant and equipment 271,365 377,310 271,365 377,310
Dividend received 9 116,805 27,448 166,733 68,913
Net cash (used in)/ from investing activities 39,444,924 (56,855,729) 39,494,852 (56,814,258)
Cash flows from financing activities
Dividend paid (21,234,932) (8,801,421) (21,704,297) (8,995,963)
Net cash used in financing activities (21,234,932) (8,801,421) (21,704,297) (8,995,963)
(Decrease)/ increase in cash & cash equivalent 108,811,612 (114,890,805) 108,811,609 (114,890,802)
Cash & cash equivalent at beginning 130,203,312 206,193,916 130,203,312 206,193,915
Effect of exchange rate changes on
cash and cash equivalents 2,029,056 38,900,201 2,029,056 38,900,201
Cash & cash equivalent at end of period 16 241,043,980 130,203,312 241,043,977 130,203,314
Consolidated & Separate Statements of Cashflows
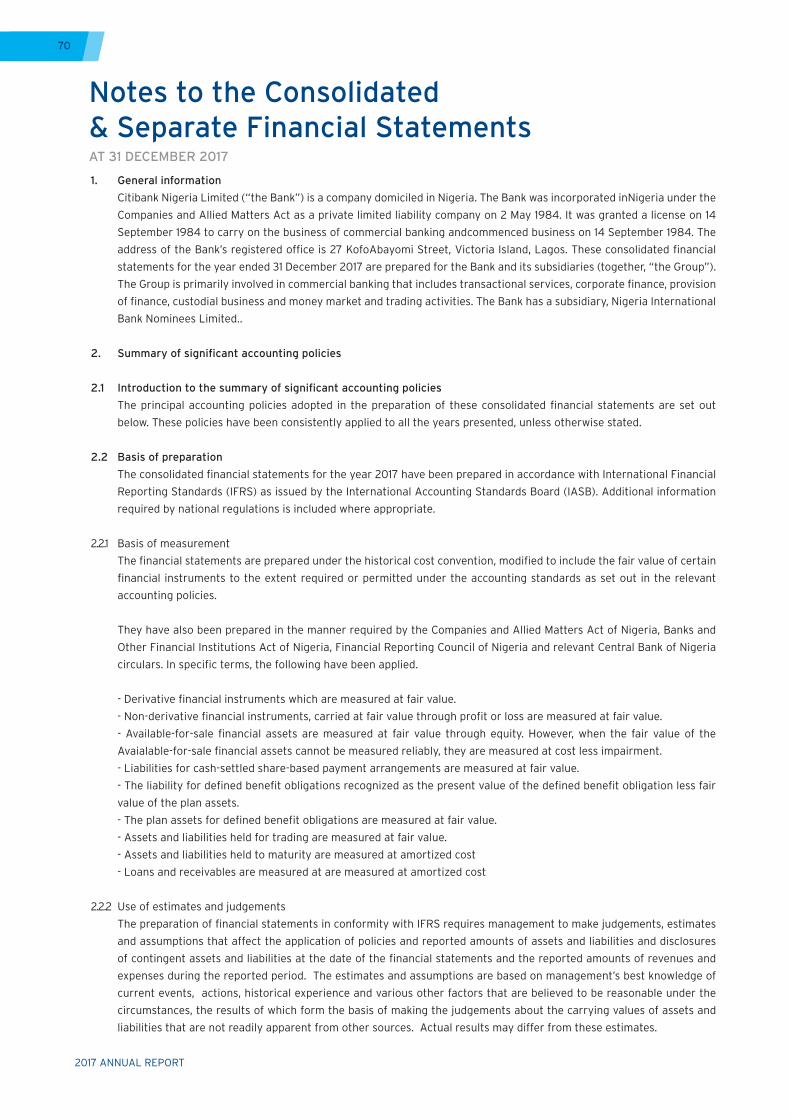
2017 ANNUAL REPORT
70
1. General information
Citibank Nigeria Limited (“the Bank”) is a company domiciled in Nigeria. The Bank was incorporated inNigeria under the
Companies and Allied Matters Act as a private limited liability company on 2 May 1984. It was granted a license on 14
September 1984 to carry on the business of commercial banking andcommenced business on 14 September 1984. The
address of the Bank’s registered office is 27 KofoAbayomi Street, Victoria Island, Lagos. These consolidated financial
statements for the year ended 31 December 2017 are prepared for the Bank and its subsidiaries (together, “the Group”).
The Group is primarily involved in commercial banking that includes transactional services, corporate finance, provision
of finance, custodial business and money market and trading activities. The Bank has a subsidiary, Nigeria International
Bank Nominees Limited..
2. Summary of significant accounting policies
2.1 Introduction to the summary of significant accounting policies
The principal accounting policies adopted in the preparation of these consolidated financial statements are set out
below. These policies have been consistently applied to all the years presented, unless otherwise stated.
2.2 Basis of preparation
The consolidated financial statements for the year 2017 have been prepared in accordance with International Financial
Reporting Standards (IFRS) as issued by the International Accounting Standards Board (IASB). Additional information
required by national regulations is included where appropriate.
2.2.1 Basis of measurement
The financial statements are prepared under the historical cost convention, modified to include the fair value of certain
financial instruments to the extent required or permitted under the accounting standards as set out in the relevant
accounting policies.
They have also been prepared in the manner required by the Companies and Allied Matters Act of Nigeria, Banks and
Other Financial Institutions Act of Nigeria, Financial Reporting Council of Nigeria and relevant Central Bank of Nigeria
circulars. In specific terms, the following have been applied.
- Derivative financial instruments which are measured at fair value.
- Non-derivative financial instruments, carried at fair value through profit or loss are measured at fair value.
- Available-for-sale financial assets are measured at fair value through equity. However, when the fair value of the
Avaialable-for-sale financial assets cannot be measured reliably, they are measured at cost less impairment.
- Liabilities for cash-settled share-based payment arrangements are measured at fair value.
- The liability for defined benefit obligations recognized as the present value of the defined benefit obligation less fair
value of the plan assets.
- The plan assets for defined benefit obligations are measured at fair value.
- Assets and liabilities held for trading are measured at fair value.
- Assets and liabilities held to maturity are measured at amortized cost
- Loans and receivables are measured at are measured at amortized cost
2.2.2 Use of estimates and judgements
The preparation of financial statements in conformity with IFRS requires management to make judgements, estimates
and assumptions that affect the application of policies and reported amounts of assets and liabilities and disclosures
of contingent assets and liabilities at the date of the financial statements and the reported amounts of revenues and
expenses during the reported period. The estimates and assumptions are based on management’s best knowledge of
current events, actions, historical experience and various other factors that are believed to be reasonable under the
circumstances, the results of which form the basis of making the judgements about the carrying values of assets and
liabilities that are not readily apparent from other sources. Actual results may differ from these estimates.
Notes to the Consolidated & Separate Financial StatementsAT 31 DECEMBER 2017
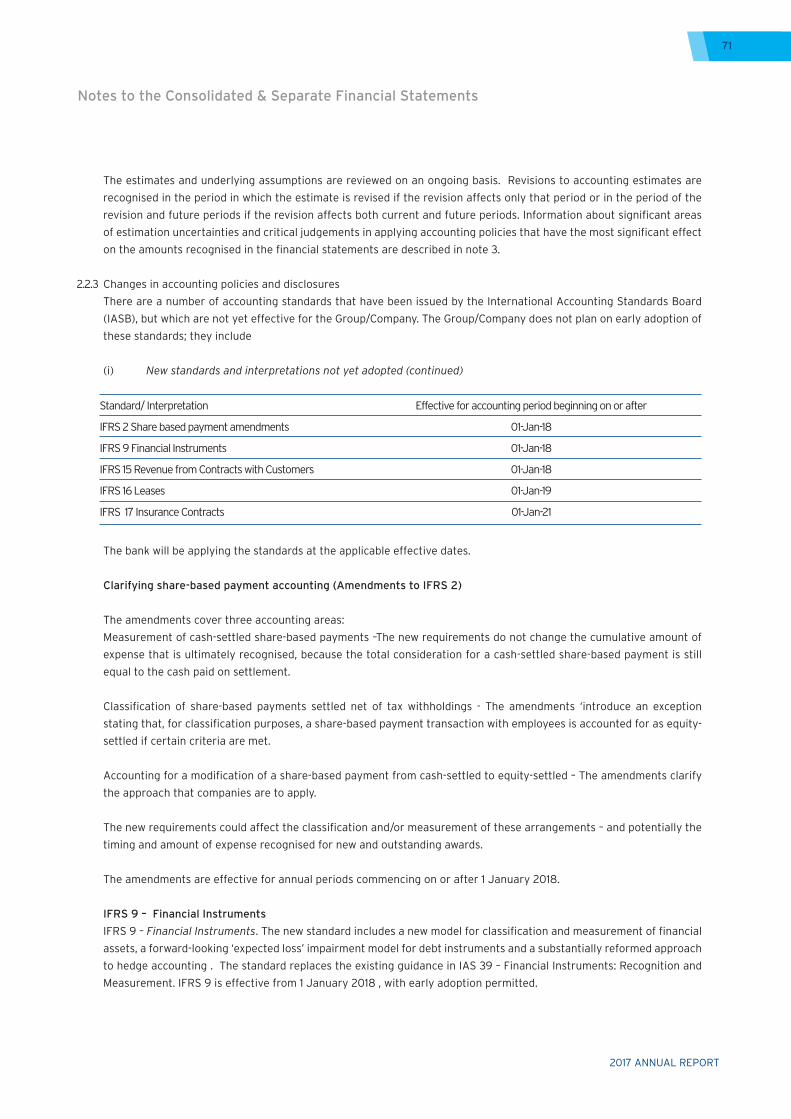
2017 ANNUAL REPORT
71
The estimates and underlying assumptions are reviewed on an ongoing basis. Revisions to accounting estimates are
recognised in the period in which the estimate is revised if the revision affects only that period or in the period of the
revision and future periods if the revision affects both current and future periods. Information about significant areas
of estimation uncertainties and critical judgements in applying accounting policies that have the most significant effect
on the amounts recognised in the financial statements are described in note 3.
2.2.3 Changes in accounting policies and disclosures
There are a number of accounting standards that have been issued by the International Accounting Standards Board
(IASB), but which are not yet effective for the Group/Company. The Group/Company does not plan on early adoption of
these standards; they include
(i) New standards and interpretations not yet adopted (continued)
The bank will be applying the standards at the applicable effective dates.
Clarifying share-based payment accounting (Amendments to IFRS 2)
The amendments cover three accounting areas:
Measurement of cash-settled share-based payments –The new requirements do not change the cumulative amount of
expense that is ultimately recognised, because the total consideration for a cash-settled share-based payment is still
equal to the cash paid on settlement.
Classification of share-based payments settled net of tax withholdings - The amendments ‘introduce an exception
stating that, for classification purposes, a share-based payment transaction with employees is accounted for as equity-
settled if certain criteria are met.
Accounting for a modification of a share-based payment from cash-settled to equity-settled – The amendments clarify
the approach that companies are to apply.
The new requirements could affect the classification and/or measurement of these arrangements – and potentially the
timing and amount of expense recognised for new and outstanding awards.
The amendments are effective for annual periods commencing on or after 1 January 2018.
IFRS 9 – Financial Instruments
IFRS 9 – Financial Instruments. The new standard includes a new model for classification and measurement of financial
assets, a forward-looking ‘expected loss’ impairment model for debt instruments and a substantially reformed approach
to hedge accounting . The standard replaces the existing guidance in IAS 39 – Financial Instruments: Recognition and
Measurement. IFRS 9 is effective from 1 January 2018 , with early adoption permitted.
Standard/ Interpretation
IFRS 2 Share based payment amendments
IFRS 9 Financial Instruments
IFRS 15 Revenue from Contracts with Customers
IFRS 16 Leases
IFRS 17 Insurance Contracts
Effective for accounting period beginning on or after
01-Jan-18
01-Jan-18
01-Jan-18
01-Jan-19
01-Jan-21
Notes to the Consolidated & Separate Financial Statements
2017 ANNUAL REPORT
72
Classification and measurement:
From a classification and measurement perspective, the new standard will require all financial assets, except equity
instruments and derivatives, to be assessed based on a combination of the entity’s business model for managing
the assets and the instruments’ contractual cash flow characteristics (whether the contractual cash flows are solely
payments of principal and interest (SPPI).
The IAS 39 measurement categories will be replaced by: fair value through profit or loss (FVTPL), fair value through other
comprehensive income (FVOCI), and amortised cost. IFRS 9 will also allow entities to continue to irrevocably designate
instruments that qualify for amortised cost or FVOCI instruments as FVTPL, if doing so eliminates or significantly
reduces an accounting mismatch.
The accounting for financial liabilities will largely be the same as the requirements of IAS 39, except for the treatment
of gains or losses arising from an entity’s own credit risk relating to liabilities designated at FVTPL. Such movements
will be presented in OCI with no subsequent reclassification to the income statement, unless an accounting mismatch in
profit or loss would arise.
The Bank expects that the classification and measurement outcomes will be similar to IAS 39, although some differences
may arise. The expected impact to the Bank due to the changes to classification and measurement of financial
instruments from the adoption of IFRS 9 as at 1 January 2018 is highlighted below:
- Held-for-Trading financial assets will be classified and measured as FVTPL.
- Financial assets designated at fair value will continue to be classified as measured at FVTPL due to the business model
assessment or the fact that the designation eliminates or significantly reduces an accounting mismatch.
- Loans and advances to banks and to customers currently classified and measured at amortised cost will continue to
be measured and classified at amortised cost unless they fail the business model or SPPI test.
- Investment debt securities currently classified as Available-for-Sale and measured at FVOCI consist of government and
corporate bonds that are held for an indefinite period of time as they may be sold in response to needs for liquidity or
changes in interest rates or exchange rates. These debt securities will be classified and measured as FVOCI as they are
held under a business model whose objective is achieved by both collecting contractual cash flows and selling financial
assets.
- Investment securities currently classified as Held-to-Maturity and measured at amortised cost will be classified and
measured at amortised cost as the financial assets are held within a business model whose objective is to collect
contractual cash flows that satisfy the SPPI criterion
Investment in equity securities currently classified as Available-for-Sale and measured at FVOCI will be classified as
FVTPL under IFRS 9. The Company has made an accounting policy choice not to irrevocably elect to classify and
measure non-trading equity instruments at FVOCI as all amounts recognised in OCI can never be reclassified to profit
or loss
For financial liabilities, IFRS 9 largely retains the pre-existing requirements for classification and measurement
previously included in IAS 39. However, under IFRS 9 fair value changes on financial liabilities which are designated
at fair value through profit or loss that are attributable to changes in the credit risk of the liability will be presented in
other comprehensive income
The assessment above may not be fully representatitive of the impact as at 01 January 2018 because the bank is still
finalising its implementation effort and assessment.
Notes to the Consolidated & Separate Financial Statements
2017 ANNUAL REPORT
73
Impairment
IFRS 9 introduces an expected credit loss (ECL) impairment model that differs significantly from the incurred loss model
under IAS 39 and is expected to result in the earlier recognition of credit losses going forward.
Scope
Under IFRS 9, the same impairment model is applied to all financial assets, except for financial assets classified or
designated as at FVTPL and equity securities designated as at FVOCI, which are not subject to impairment assessment.
The scope of the IFRS 9 expected credit loss impairment model includes amortized cost financial assets, debt securities
classified as FVOCI, and off-balance sheet loan commitments and financial guarantees which were previously provided
for under IAS 37, Provisions, Contingent Liabilities and Contingent Assets (IAS 37).
Expected credit loss impairment model
Under IFRS 9, credit loss allowances will be measured on each reporting date according to a three-Stage expected credit
loss impairment model under which each financial asset is classified in one of the stages below:
Stage 1 – From initial recognition of a financial asset to the date on which the asset has experienced a significant
increase in credit risk relative to its initial recognition, a loss allowance is recognized equal to the credit losses expected
to result from defaults expected over the next 12 months. Interest is calculated based on the gross carrying amount of
the asset.
Stage 2 – Following a significant increase in credit risk relative to the risk at initial recognition of the financial asset,
a loss allowance is recognized equal to the full credit losses expected over the remaining life of the asset. Interest is
calculated based on the gross carrying amount of the asset.
Stage 3 – When a financial asset is considered to be credit-impaired, a loss allowance equal to the full lifetime expected
credit losses will be recognized. Interest revenue is calculated based on the carrying amount of the asset, net of the loss
allowance, rather than on its gross carrying amount.
Stage 1 and Stage 2 credit loss allowances effectively replace the collectively-assessed allowance for incurred but not
identified losses recorded under IAS 39, while Stage 3 credit loss allowances effectively replace the individually assessed
allowances for impaired loans.
Consistent with IAS 39, loans are written off when there is no realistic probability of recovery. Accordingly, the Group’s
policy on when financial assets are written off will not change significantly upon adoption of IFRS 9.
The recognition and measurement of impairment is intended to be more forward looking than under IAS 39. The
estimation of an expected credit loss (ECL) is required to be unbiased and probability weighted, including information
about past events, current conditions and reasonable and supportable forecasts of future events and economic
conditions at the reporting date. The estimate will also consider the time value of money.
The measurement of an ECL will primarily be determined by an assessment of the financial asset’s probability of default
(PD), loss given default (LGD) and exposure at default (EAD) where the cash shortfalls are discounted to the reporting
date. For a financial asset in Stage 1, the Group will utilise a 12-month PD, whereas a financial asset within Stage 2 will
utilise a lifetime PD in order to estimate an impairment allowance. For credit impaired financials asset within Stage 3,
the Group will continue to leverage existing processes.
Notes to the Consolidated & Separate Financial Statements
2017 ANNUAL REPORT
74
Wholesale Classifiably Managed Exposures
An impairment allowance will be estimated for Corporate loans at an individual loan level utilising sophisticated models
depending on the relative size, quality and complexity of the portfolios. Impairment allowances for the small Consumer
loan portfolios will be estimated utilising a less sophisticated approach that is reasonable and proportionate after
considering both entity level and portfolio level factors.
Delinquency Managed Exposures
In particular, for Consumer loan portfolios, where the Group does not have access to detailed historical information and/
or loss experience, the Group will adopt a simplified approach using backstops and other qualitative information specific
to each portfolio.
Other Financial Assets Simplified Approaches
For other financial assets, being short term and simple in nature, the Bank will apply a simplified measurement approach
that may differ from what is described above. Models will leverage existing models currently used globally for stress-
testing and regulatory capital reporting purposes, but will incorporate specifically developed components to make the
estimates compliant with IFRS 9.
Significant increase in credit risk (SICR)
A financial asset will move from Stage 1 to Stage 2 if there has been a significant increase in credit risk relative to initial
recognition. From 1 January 2018 and at each reporting date going forward, the Group shall assess whether the credit
risk of a financial instrument has increased significantly since initial recognition. Determining whether there has been
a significant increase in credit risk will require significant judgement. When making this assessment, the Group will
consider the increase in the risk of default (both in relative terms and absolute terms) over the expected life of the
financial asset. A given change in absolute terms of the risk of a default since initial recognition will be more significant
for a financial instrument with a lower initial risk of default compared to one with a higher initial risk of default. A
change in the probability of default of the obligor is driven primarily by the obligor risk rating. Internal credit risk rating
categories will capture the further qualitative indicators that act as backstops.
Staging
Financial assets can move in both directions through the Stages of the IFRS 9 impairment model depending on whether
the assessment results in a significant increase of credit risk since initial recognition.
In order to determine the ECL reporting stage for an obligation, the Group will check whether the asset is already
impaired (Stage 3) or not (Stage 1 and 2). Stage 2 will be determined by the existence of a significant credit deterioration
(or credit improvement) compared with the credit rating at initial recognition. Stage 1 assets do not have significant
credit deterioration compared with that at initial recognition. All newly acquired or originated financial assets that are
not purchased or originated credit impaired (POCI) will be in Stage 1 initially. The existence of a (statistically) significant
deterioration/improvement is combined with the materiality of the probability of default to determine whether a transfer
in stages is required.
Further, the Group will not rebut the presumption that exposures 30 days past due are deemed to have incurred a
significant increase in credit risk. Additional qualitative reviews will also be performed to assess the staging results and
make adjustments, as necessary, to better reflect the positions which have significantly increased in risk.
Changes in the required credit loss allowance, including the impact of movements between Stage 1 (12-month expected
credit losses) and Stage 2 (lifetime expected credit losses), will be recorded in profit or loss as an adjustment of the
provision for credit losses.
Notes to the Consolidated & Separate Financial Statements
2017 ANNUAL REPORT
75
Expected life
When measuring ECL, the Group must consider the maximum contractual period over which the Group is exposed to
credit risk, including possible drawdowns and the expected maturity of the financial asset. For certain revolving credit
facilities that do not have a fixed maturity, the expected life is estimated based on the period over which the Group is
exposed to credit risk and where the credit losses would not be mitigated by management actions.
Stage 3 definition of default
As mentioned above, to determine whether an instrument should move to a lifetime ECL, the change in the risk of a
default’s occurring over the expected life of the financial instruments must be considered.
IFRS 9 does not define the term “default,” but instead requires each entity to do so. Under IFRS 9, the Group must apply a
default definition that is consistent with that used for internal credit risk management purposes for the relevant financial
instrument and consider qualitative indicators (for example, financial covenants) when appropriate. The definition of
default used for this purpose must be applied consistently to all financial instruments unless information becomes
available that demonstrates another default definition is more appropriate for a particular financial instrument.
The Group aligns its definition of default with that of the Capital Requirements Regulation (CRR) Article 178 (CRR 178).
CRR 178 is an EU law that reflects Basel II rules including the definition of default.
A default shall be considered to have occurred in regard to a particular obligor when either or both of the following have
taken place:
1 - There are material exposures which are more than 90 days past-due;
2 - The obligor is assessed as unlikely to pay its credit obligations in full without realisation of collateral, regardless of
the existence of any past-due amount or of the number of days past due.
Forward Looking Information and multiple economic scenarios
Estimates must consider information about past events, current conditions and reasonable and supportable forecasts
around future events and economic conditions. The application of forward looking information (FLI) will require
significant judgment. The Group has developed models that will include multiple economic scenarios that consider the
variability and uncertainty in expected losses including factors such as GDP growth rates and unemployment rates,
provided by the economists in Citigroup Global Country Risk Management (GCRM). These estimates are based on
portfolio data that reflect the current risk attributes of obligors and debt instruments combined with loss projections
derived from the rating migration, PD and loss models built for estimating stress credit losses for wholesale portfolios.
The PD, LGD and Credit Conversion Factor (CCF) models are calibrated to the observed historical patterns of defaults
and losses over several years and linked to economic drivers. The model reflects different loss likelihood and loss
severity as a function of different economic forecasts. The Group will not use the best case or worst case scenario, but
will assess a representative number of scenarios (at least 3 when applying a sophisticated approach and where multiple
scenarios are deemed to have a material non-linear impact) and probability weight of these scenarios to determine the
ECL. The model is still being refined as additional inputs become available.
Transition
The impairment classification and measurement requirements of IFRS 9 will be applied by adjusting the Group’s
Balance Sheet at 1 January 2018, the date of initial application of IFRS 9, with the difference between previous carrying
amounts and carrying amounts at initial application recognized in retained earnings. There is no requirement to restate
comparative periods other than for hedge accounting. See note 40 for impact assessment.
Notes to the Consolidated & Separate Financial Statements
2017 ANNUAL REPORT
76
IFRS 15 Revenue from contracts with customers
IFRS 15 “Revenue from Contracts with Customers” was published by IASB on 28th May 2014.The core principle of the
new Standard is revenue recognition to depict the transfer of goods or services to customers in amounts that reflect
the consideration to which the company expects to be entitled in exchange for those goods or services. The revenue is
recognized when the control over the goods or services is transferred to the customer.
This standard replaces IAS 11 Construction Contracts, IAS 18 Revenue, IFRIC 13 Customer Loyalty Programmes, IFRIC 15
Agreements for the Construction of Real Estate, IFRIC 18 Transfer of Assets from Customers and SIC-31 Revenue – Barter
of Transactions Involving Advertising Services.
The standard contains a comprehensive model that applies to contracts with customers and two approaches to
recognising revenue: at a point in time or over time. Revenue under IFRS 15 will need to be recognised as goods and
services are transferred, to the extent that the transferor anticipates entitlement to goods and services. The model
features a contract-based five-step analysis of transactions to determine whether, how much and when revenue is
recognised.
a) Identify the contract(s) with a customer.
b) Identify the performance obligations in the contract.
c) Determine the transaction price.
d) Allocate the transaction price to the performance obligations in the contract.
e) Recognise revenue when (or as) the entity satisfies a performance obligation.
The standard is effective for annual periods beginning on or after 1 January 2018, with early adoption permitted.
IFRS 15 will have no material impact on the financial statements of the Group. The impact on the bank’s retained earning
would be immaterial.
IFRS 16 Leases
IFRS 16 was published in January 2017. It sets out the principles for the recognition, measurement, presentation and
disclosure of leases for both parties to a contract, i.e. the customer (‘lessee’) and the supplier (‘lessor’).
IFRS 16 replaces the previous leases Standard, IAS 17 Leases, and related Interpretations. IFRS 16 has one model for
lessees which will result in almost all leases being included on the Statement of Financial position. No significant changes
have been included for lessors.
The standard is effective for annual periods beginning on or after 1 January 2019, with early adoption permitted only if
the entity also adopts IFRS 15. The transitional requirements are different for lessees and lessors.
The Group is yet to perform the impact assessment.
IFRS 17 Insurance Contracts
IFRS 17 was issued in May 2017 and applies to annual reporting periods beginning on or after 1 January 2021. The new
IFRS 17 standard establishes the principles for the recognition, measurement, presentation, and disclosure of Insurance
contracts within the scope of the Standard. The objective of IFRS 17 is to ensure an entity provides relevant information
that faithfully represent those contracts. This information gives a basis for users of financial statements to access
the effect that insurance contracts have on the entity’s financial position, financial performance and cash flows. It is
not expected that the standard will have a material impact on the Group as the Group does not engage in insurance
business.
There are no other IFRSs or IFRIC interpretations that are not yet effective that would be expected to have a material
impact on the Group.
Notes to the Consolidated & Separate Financial Statements
2017 ANNUAL REPORT
77
2.3 Consolidation
The financial statements of the subsidiaries used to prepare the consolidated financial statements were prepared as of
the parent company’s reporting date.
Subsidiaries
The consolidated financial statements of the Group comprise the financials statements of the parent entity and
subsidiary as at 31 December 2017. Subsidiaries are all entities (including structured entities) over which the group
has control. The group controls an entity when the group is exposed to, or has rights to, variable returns from its
involvement with the entity and has the ability to affect those returns through its power over the entity.
The group financial statements consolidate the financial statements of the Bank and its wholly owned subsidiary
company, NIB Nominees Limited. Subsidiary undertakings of those companies in which the Group, directly or indirectly,
has power to exercise control over their operations, are consolidated.
Structured entities are consolidated where the group has control. The activities of the staff participation scheme has
been consolidated into the financial statements of the Group resulting in the assets of the staff participation scheme,
which are the shares of the bank, being recognised in shareholders equity as Treasury shares (Note 2.13).
Inter-company transactions, balances and unrealised gains on transactions between companies within the Group are
eliminated on consolidation. Unrealised losses are also eliminated in the same manner as unrealised gains, but only to
the extent that there is no evidence of impairment.
The subsidiaries were fully consolidated from the date control was transferred to the Group.The integration of the
subsidiaries into the consolidated financial statements is based on consistent accounting and valuation methods for
similar transactions and other occurrences under similar circumstances.
In the seperate financial statements for the bank, the investment in the subsidiary is carried at cost.
Associates
Associates are those entities over which the Group has significant influence but not control, generally accompanying
a shareholding between 20% and 50% of the voting rights. In addition, it includes entities where the shareholding is
less than 20% but such significant influence can be demonstrated with the existence of representation on the board of
directors or equivalent governing body of the investee.
Investment in associates is accounted for by the equity method of accounting. Under the equity method, the investment
is initially recognised at cost, and the carrying amount is increased or decreased to recognise the investor’s share of
profit or loss of the investee after the acquisition date.
The Group’s share of post-acquistion profit or loss is recognised in the statement of profit or loss, and its share of
post-acquistion movements in other comprehensive income is recognised in other comprehensive income with the
corresponding adjustment to the carrying amount of the investment. When the Group’s share of losses in an associate
equals or exceeds its interest in the associate, including any other unsecured receivables, the Group does not recognise
further losses, unless it has incurred legal or constructive obligations or made payments on behalf of the associate.
The Group determines at each reporting date whether there is any objective evidence that the investment in the
associate is impaired. If this is the case, the group calculates the amount of impairment as the difference between the
recoverable amount of the associate and its carrying value and recognises the amount adjacent to “share of profit/
(loss) of an associate in the statement of profit or loss.
In the seperate financial statements for the bank, the investment in the associate is carried at cost.
Notes to the Consolidated & Separate Financial Statements
2017 ANNUAL REPORT
78
2.4 Segment Reporting
The Group is a private company that has no debt or equity traded in a public market therefore there is no disclosure
required for segment reporting.
2.5 Foreign currency translation
(a) Functional and presentation currency
Items included in the financial statements of each of the Group’s entities are measured using the currency of the primary
economic environment in which the entity operates (‘the functional currency’).The consolidated financial statements
are presented in Naira, which is the Group’s presentation currency. The figures shown in the consolidated financial
statements are stated in thousands in Naira.
(b) Transactions and balances
Transactions in foreign currencies are translated to Naira at the rates of exchange ruling at the date of each transaction
(or where appropriate the rate of the related forward contracts). Monetary assets and liabilities denominated in foreign
currencies are reported at the rates of exchange prevailing at the statement of financial position date. Any gain or loss
arising from a change in exchange rates subsequent to the date of the transaction is included in the statement of profit
or loss.
Changes in fair value of monetary securities denominated in foreign currency classified as available for sale are analysed
between translation differences resulting from changes in amortised cost of the security and other changes in the
carrying amount of the security. Translation differences related to changes in amortised cost are recognised in the
statement of profit or loss, and other changes in carrying amount are recognised in other comprehensive income.
2.6 Financial assets and liabilities
In accordance with IAS 39 all financial assets and liabilities have to be recognised in the consolidated statement of
financial position and measured in accordance with their assigned category.
2.6.1 Recognition
The Group initially recognises loans, receivables and deposits on the date that they are originated. Other financial assets
and liabilities that include debt securities and assets and liabilities designated at fair value through profit or loss are
recognised on the basis of settlement date accounting.
All financial instruments are measured initially at their fair value plus transaction costs, except in the case of financial
assets and financial liabilities recorded at fair value through profit or loss. Subsequent recognition of financial assets
and liabilities is at amortised cost or fair value.
2.6.2 Classification
The classification of financial instruments depends on the purpose and management’s intention for which the financial
instruments were acquired and their characteristics. See accounting policies 2.6.11 to 2.6.16.
2.6.3 Derecognition
The Group derecognises a financial asset when the contractual rights to the cash flows from the asset expire, or it
transfers the rights to receive the contractual cash flows on the financial asset in a transaction in which substantially
all the risks and rewards of ownership of the financial asset are transferred. Any interest in transferred financial assets
that is created or retained by the Group is recognised as a separate asset or liability.
The Group derecognises a financial liability when its contractual obligations are discharged or cancelled or expire.
The Group enters into transactions whereby it transfers assets recognised on its statement of financial position, but
retains either all risks and rewards of the transferred assets or a portion of them. If all or substantially all risks and
rewards are retained, then the transferred assets are not derecognised from the statement of financial position.
Transfers of assets with retention of all or substantially all risks and rewards include, secured borrowing and repurchase
transactions. Such assets are reported as Assets pledged as collateral in the statement of financial position.
Notes to the Consolidated & Separate Financial Statements
2017 ANNUAL REPORT
79
On derecognition of a financial asset, the difference between the carrying amount of the asset (or the carrying amount
allocated to the portion of the asset transferred), and the sum of (i) the consideration received (including any new
asset obtained less any new liability assumed) and (ii) any cummulative gain or loss that had been recognized in other
comprehensive income is recognised in profit or loss.
In transactions in which the Group neither retains nor transfers substantially all the risks and rewards of ownership of
a financial asset and it retains control over the asset, the Group contiunes to recognize the asset to the extent of its
continuing involvement, determined by the extent to which it is exposed to changes in the value of the transferred asset.
Derecognition of a financial liability occurs only when the obligation is extinguished. A financial liability is said to be
extinguished when the obligation is discharged, cancelled or expired.
2.6.4 Offsetting of financial assets and liabilities
Financial assets and liabilities are offset and the net amount reported on the statement of financial position where there
is a legally enforceable right to set-off the recognised amount and there is an intention to settle on a net basis, or to
realise the asset and settle the liability simultaneously.
2.6.5 Sale and repurchase agreements
Securities sold subject to repurchase agreements (‘repos’) are reclassified in the financial statements as assets pledged
as collateral when the transferee has the right by contract or custom to sell or repledge the collateral; the counterparty
liability is included in deposits from banks or deposits from customers, as appropriate. Securities purchased under
agreements to resell (‘reverse repos’) are recorded as loans and advances to other banks or customers, as appropriate.
The difference between sale and repurchase price is treated as interest and accrued over the life of the agreements
using the effective interest method. Securities lent to counterparties are also retained in the financial statements.
2.6.6 Amortised cost measurement
The amortised cost of a financial asset or liability is the amount at which the financial asset or liability is measured at
initial recognition, minus principal repayments, plus or minus the cumulative amortisation using the effective interest
method of any difference between the initial amount recognised and the maturity amount, minus any reduction for
impairment.
2.6.7 Fair value measurement
Fair value is the price that would be received from the sale of an asset or paid to transfer a liability in an orderly
transaction between market participants at the measurement date.
The fair value of trading assets, financial assets held at fair value and available-for-sale assets are based on quoted
market prices, excluding transaction costs. If a quoted market price is not available for the financial assets, the fair value
is estimated using pricing models or discounted cash flow techniques.
Where discounted cash flow techniques are used, estimated future cash flows are based on management’s best
estimates and the discount rate is a market-related rate at the reporting date for a financial asset with similar terms
and conditions. Where pricing models are used, inputs are based on market related measures at the reporting date.
All items for fair valuation are recurring.
2.6.8 Identification and measurement of impairment of financial assets
i) Assets carried at amortised cost
At each reporting date the Group assesses whether there is objective evidence that financial assets are impaired.
Financial assets are impaired when objective evidence demonstrates that a loss event has occurred after the initial
recognition of the asset, and that the loss event has an impact on the future cash flows of the asset that can be
estimated reliably.
Notes to the Consolidated & Separate Financial Statements
2017 ANNUAL REPORT
80
The Group considers evidence of impairment at both a specific asset and collective asset level. All individually significant
financial assets are assessed for specific impairment. All significant assets found not to be specifically impaired are then
collectively assessed for any impairment that could be incurred but not yet identified. Assets that are not individually
significant are then collectively assessed for impairment by grouping together financial assets (carried at amortised
cost) with similar risk characteristics.
Objective evidence that financial assets (including equity securities) are impaired can include significant financial
difficulty, default on the facility or probability that the obligor will enter bankruptcy, the disappearance of an active
market for a security, or other observable data relating to a group of assets such as adverse changes in the payment
status of borrowers or issuers in the group, or economic conditions that correlate with defaults in the group.
In assessing collective impairment the Group uses statistical modelling of historical trends of the probability of default,
timing of recoveries and the amount of loss incurred, adjusted for management’s judgement as to whether current
economic and credit conditions are such that the actual losses are likely to be greater or less than suggested by
historical modelling. The collective impairment is determined on a portfolio basis based on the historical loss experience
for assets with credit risk characteristics similar to those in the Group. The loan impairment provision would be based
on risk-rating of obligor and loss norms attached to each risk-rating. The loss norm would have been statistically derived
from historical data.
Impairment losses on assets carried at amortised cost are measured as the difference between the carrying amount of
the financial assets and the present value of estimated cash flows discounted at the assets’ original effective interest
rate. Losses are recognised in statement of profit or loss and reflected in an allowance account against loans and
advances. Interest on the impaired asset continues to be recognised through the unwinding of the discount.
If, in a subsequent period, the amount of the impairment loss decreases and the decrease can be related objectively
to an event occurring after the impairment was recognised (such as an improvement in the obligor’s credit rating), the
previously recognised impairment loss is reversed by adjusting the allowance account. The amount of the reversal is
recognised in the statement of profit or loss.
ii) Assets classified as available-for-sale
Impairment losses on available-for-sale investment securities are recognised by transferring the difference between the
amortised acquisition cost and current fair value out of equity to the statement of profit or loss.
In the case of equity investments classified as available-for-sale, a significant or prolonged decline in the fair value of
the security below its cost is objective evidence of impairment resulting in the recognition of an impairment loss. If any
such evidence exists for available-for-sale financial assets, the cumulative loss – measured as the difference between
the acquisition cost and the current fair value, less any impairment loss on that financial asset previously recognised in
the statement of profit or loss – is removed from equity and recognised in statement of profit or loss. Impairment losses
recognised in statement of profit or loss on equity instruments are not reversed.
If, in a subsequent period, the fair value of an investment security classified as available-for-sale increases and the
increase can be objectively related to an event occurring after the impairment loss was recognised in statement of profit
or loss, the impairment loss shall be reversed, with the amount of the reversal recognised in the statement of profit or
loss.
However, any subsequent recovery in the fair value of an impaired available-for-sale investment security is recognised
directly in equity.
Notes to the Consolidated & Separate Financial Statements
2017 ANNUAL REPORT
81
2.6.9 Regulatory risk reserve
In compliance with the Prudential Guidelines for Licensed Banks, the Group assesses qualifying financial assets using
the guidance under the Prudential Guidelines. These apply objective and subjective criteria towards providing for
losses in risk assets. Assets are classed as performing or non-performing. Non-performing assets are further classed as
Substandard, Doubtful or Lost with attendant provision as per the table below based on objective criteria.
Classification % Provided Basis
Substandard 10% Interest and/or principal overdue by 90 days but less than 180 days.
Doubtful 50% Interest and/or principal overdue by more than 180 days but less than 365 days.
Lost 100% Interest and/or principal overdue by more than 365 days.
A more accelerated provision may be done using the subjective criteria. A 2% provision is taken on all risk assets not
specifically provisioned.
The results of the application of Prudential Guidelines and the impairment determined for these assets under IAS 39
are compared. The IAS 39 determined impairment charge is always included in the statement of profit or loss (Note
21.1). Where the Prudential Guidelines provision is greater, the difference is appropriated from Retained Earnings and
included in a non-distributable reserve called Statutory Credit Reserve. Where the IAS 39 impairment is greater, no
appropriation is made and the amount of the IAS 39 impairment is recognised in the statement of profit or loss.
In subsequent periods, reversals or additional appropriations are made between the Statutory Credit Reserve and
Retained Earnings to maintain total provisions at the levels expected by the Regulator.
The comparison will going forward be conducted against the new IFRS 9 impairment effective January 1, 2018
2.6.10 Cash and cash equivalents
Cash and cash equivalents include notes and coins on hand, unrestricted balances held with central banks and highly
liquid financial assets with original maturities of less than three months, which are subject to insignificant risk of
changes in their fair value, and are used by the Group in the management of its short-term commitments. Cash and
cash equivalents are carried at amortised cost in the statement of financial position
2.6.11 Financial assets and liabilities classified as held for trading
Trading assets and liabilities are those assets and liabilities that the Group acquires or incurs principally for the purpose
of selling or repurchasing in the near term, or holds as part of a portfolio that is managed together for short-term profit.
Trading assets and liabilities are initially recognised and subsequently measured at fair value in the statement of
financial position with transaction costs recognised in statement of profit or loss. Net gains at fair value through profit
or loss includes interest. All changes in fair value are recognised as part of net trading income in statement of profit or
loss. These are transacted at trade date.
2.6.12 Loans and receivables
Loans and receivables are non-derivative financial assets with fixed or determinable payments that are not quoted in
an active market and that the Group does not intend to sell immediately or in the near term.
When the Group is the lessor in a lease agreement that transfers substantially all of the risks and rewards incidental to
ownership of an asset to the lessee, the arrangement is classified as a finance lease and a receivable equal to the net
investment in the lease is recognised and presented as part of loans and advances to customers.
Loans and advances are initially measured at fair value plus incremental direct transaction costs, and subsequently
measured at their amortised cost using the effective interest method.
Notes to the Consolidated & Separate Financial Statements
2017 ANNUAL REPORT
82
2.6.13 Available-for-sale
Available-for-sale investments are non-derivative investments that are not designated as any other category of financial
assets. All available-for-sale investments are carried at fair value traded at trade date.
Interest income is recognised in statement of profit or loss using the effective interest method. Dividend income is
recognised in statement of profit or loss when the Group becomes entitled to the dividend. Foreign exchange gains or
losses on available-for-sale debt investment securities are reclassified in statement of profit or loss.
Other fair value changes are recognised directly in other comprehensive income until the investment is sold or impaired
whereupon the cumulative gains and losses previously recognised in other comprehensive income are recognised to
statement of profit or loss as a reclassification adjustment for non-equity securities, while there will be no reclassification
adjustment to profit or loss in the case of equity securities
A non-derivative financial asset may be reclassified from the available-for-sale category to the loans and receivable
category if it otherwise would have met the definition of loans and receivables and if the Group has the intention and
ability to hold that financial asset for the foreseeable future or until maturity.
2.6.14 Derivative financial instruments
Derivative financial instruments are recognised initially at fair value on the date which the derivative contract is entered
into and subsequently re-measured at their fair value. Fair values are obtained from quoted market prices in active
markets, including recent market transactions and valuation techniques. All derivatives are carried as assets when fair
value is positive and as liabilities when fair value is negative. Changes in fair value are recognised immediately in the
statement of profit or loss.
Derivatives are valued based on observable market inputs where readily available. However, where any of these market
inputs is not readily available, a derived value can be implied based on what is readily available in the market or on
market data.
2.6.15 Non-derivative Financial liabilities
Financial liabilities are initially measured at fair value net of transaction costs at trade date. Subsequently, they are
measured at amortized cost using the effective interest rate method.
2.6.16 Reconciliation of Financials Statement line items to IAS 39 categories
The table below shows the classification of the Group’s Financial Statement line items to different categories in line with
IAS 39 provisions.
Notes to the Consolidated & Separate Financial Statements
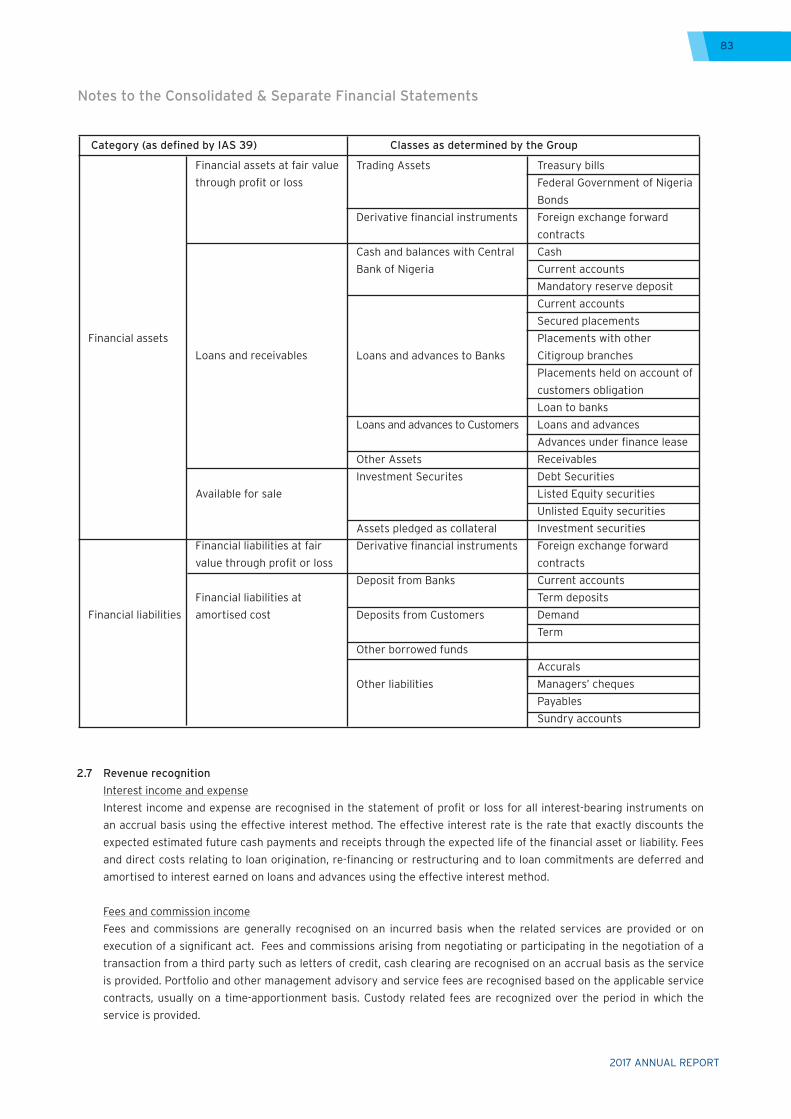
2017 ANNUAL REPORT
83
2.7 Revenue recognition
Interest income and expense
Interest income and expense are recognised in the statement of profit or loss for all interest-bearing instruments on
an accrual basis using the effective interest method. The effective interest rate is the rate that exactly discounts the
expected estimated future cash payments and receipts through the expected life of the financial asset or liability. Fees
and direct costs relating to loan origination, re-financing or restructuring and to loan commitments are deferred and
amortised to interest earned on loans and advances using the effective interest method.
Fees and commission income
Fees and commissions are generally recognised on an incurred basis when the related services are provided or on
execution of a significant act. Fees and commissions arising from negotiating or participating in the negotiation of a
transaction from a third party such as letters of credit, cash clearing are recognised on an accrual basis as the service
is provided. Portfolio and other management advisory and service fees are recognised based on the applicable service
contracts, usually on a time-apportionment basis. Custody related fees are recognized over the period in which the
service is provided.
Category (as defined by IAS 39) Classes as determined by the Group
Trading Assets
Derivative financial instruments
Cash and balances with Central
Bank of Nigeria
Loans and advances to Banks
Loans and advances to Customers
Other Assets
Investment Securites
Assets pledged as collateral
Derivative financial instruments
Deposit from Banks
Deposits from Customers
Other borrowed funds
Other liabilities
Treasury bills
Federal Government of Nigeria
Bonds
Foreign exchange forward
contracts
Cash
Current accounts
Mandatory reserve deposit
Current accounts
Secured placements
Placements with other
Citigroup branches
Placements held on account of
customers obligation
Loan to banks
Loans and advances
Advances under finance lease
Receivables
Debt Securities
Listed Equity securities
Unlisted Equity securities
Investment securities
Foreign exchange forward
contracts
Current accounts
Term deposits
Demand
Term
Accurals
Managers’ cheques
Payables
Sundry accounts
Financial assets at fair value
through profit or loss
Loans and receivables
Available for sale
Financial liabilities at fair
value through profit or loss
Financial liabilities at
amortised cost
Financial assets
Financial liabilities
Notes to the Consolidated & Separate Financial Statements
2017 ANNUAL REPORT
84
Net income from financial instruments held for trading at fair value through profit or loss
Net income on items at fair value through profit and loss comprises of all gains less losses related to trading assets and
liabilities and financial instruments designated at fair value, and include all realized and unrealized fair value changes,
together with related interest and foreign exchange differences.
Dividend income
Dividends are recognised in Investment income in the statement of profit or loss when the entity’s right to receive
payment is established.
Rental income
Property held for the purpose of leasing to third parties under operating leases are included in “Property, plant and
equipment” and depreciated on a straight-line basis over their estimated useful lives. Rentals receivable are accounted
for on a straight-line basis over the period of the lease and are included within “Other operating income”.
2.8 Property, plant and equipment
Land and buildings comprise mainly headoffice and branch offices. All property, plant and equipment used by the
parent or its subsidiary is stated at historical cost less depreciation. Historical cost includes expenditure that is directly
attributable to the acquisition of the items.
Subsequent costs are included in the asset’s carrying amount or are recognised as a separate asset, as appropriate, only
when it is probable that future economic benefits associated with the asset will flow to the Group and the cost of the
asset can be measured reliably. All other repairs and maintenance are charged to the statement of profit or loss during
the financial period in which they are incurred.
Land is not depreciated. Depreciation of assets is calculated using the straight-line method to allocate the cost of
property and equipment to their residual values over their estimated useful lives, as follows:
- Leasehold improvements: Over the lease period or useful life whichever is shorter
- Building 50 years
- Furniture and equipment 5 years
- Computer equipment 3 years
- Motor vehicles 4 years
Depreciation begins when an asset is available for use and ceases at the earlier of the date that the asset is derecognized
or classified as held for sale in accordance with IFRS 5. A non-current asset or disposal group is not depreciated while
it is classified as held for sale
Capital work-in-progress is not depreciated. Upon completion it is transferred to the relevant asset category.
The assets’ residual values and useful lives are reviewed, and adjusted if appropriate, at the end of each reporting
period. Assets are reviewed for impairment whenever events or changes in circumstances indicate that the carrying
amount may not be recoverable.
Gains and losses on disposals are determined by comparing proceeds with carrying amount. These are included in ‘other
operating income’ in the statement of profit or loss.
2.9 Impairment of non-financial assets
The carrying amounts of the Group’s non-financial assets, are reviewed as a whole at each reporting date to determine
whether there is any indication of impairment. If any such indication exists, then the asset’s recoverable amount is
estimated. For intangible assets that have indefinite useful lives or that are not yet available for use, the recoverable
amount is estimated each year at the same time. An impairment loss is recognised if the carrying amount of an asset
exceeds its estimated recoverable amount.
Notes to the Consolidated & Separate Financial Statements
2017 ANNUAL REPORT
85
Impairment losses are recognised in the statement of profit or loss. Impairment losses recognised in respect of assets
are allocated to reduce the carrying amount of the assets.
Impairment losses recognised in prior periods are assessed at each reporting date for any indications that the loss
has decreased or no longer exists. An impairment loss is reversed if there has been a change in the estimates used to
determine the recoverable amount. An impairment loss is reversed only to the extent that the asset’s carrying amount
does not exceed the carrying amount that would have been determined, net of depreciation or amortisation, if no
impairment loss had been recognised.
2.10 Provisions
A provision is recognised if, as a result of a past event, the Group has a present legal or constructive obligation that can
be estimated reliably and it is probable that an outflow of economic benefits will be required to settle the obligation.
Provisions are determined by the present value of the expenditures expected to settle the obligation using a pre-tax
rate that reflects current market assessments of the time value of money and, where appropriate, the risks specific to
the liability.
2.11 Income taxation
Current income tax
The tax expense for the period comprises current and deferred income tax. Tax is recognised in statement of profit or
loss, except to the extent that it relates to items recognised in other comprehensive income or directly in equity. In this
case, the tax is also recognised in other comprehensive income or directly in equity respectively.
The current income tax charge is calculated on the basis of tax laws enacted or substantively enacted at the reporting
date. The directors periodically evaluate positions taken in tax returns with respect to situations in which applicable tax
regulation is subject to interpretation. They establish provisions where appropriate, on the basis of amounts expected
to be paid to the tax authorities.
Deferred income tax
Deferred tax arises from temporary differences in the recognition of items for accounting and tax purposes and is
calculated using the liability method. Deferred tax is provided on timing differences, which are expected to reverse in
the foreseeable future at the rates of tax likely to be in force at the time of reversal. Deferred income tax is determined
using tax rates (and laws) that have been enacted or substantially enacted by the reporting date and are expected to
apply when the related deferred income tax asset is realised or the deferred income tax liability is settled.
Deferred income tax asset is recognised only to the extent that it is probable that future taxable profit will be available
against which the temporary differences can be utilised.
Deferred income tax assets and liabilities are offset when there is a legally enforceable right to offset current income tax
assets against current income tax liabiltites and when the deferred income taxes assets and liabilities relate to income
taxes levied by the same taxation authority on either the same entity or different taxable entities where there is an
intention to settle the balances on a net basis.
Deferred tax related to fair value measurement, after initial recognition, of available-for-sale securities, is recognised in
other comprehensive income.
2.12 Employee benefits
Defined contribution scheme
The Group operates a defined contributory pension scheme. The scheme is fully funded and is managed by licensed
Pension Fund Administrators. Membership of the scheme is automatic for an employee upon commencement of duties
at the Group. The Group contributes 10% while the employee contributes 8% of gross emoluments to the scheme. The
Group’s contributions to this scheme are charged to the statement of profit or loss in the period to which they relate.
Notes to the Consolidated & Separate Financial Statements
2017 ANNUAL REPORT
86
Short - term employee benefits
Short-term employee benefits are those expected to be settled wholly before twelve months after the end of the annual
reporting period during which employee services are rendered, but do not include termination benefits.
Short-term employee benefit obligations are measured on an uniscounted basis and are expensed as the related services
is provided.
A liability is recognised for the amount expected to be paid under short-term cash bonus or profit sharing plans if the
Group has a present legal or constructive obligation to pay this amount as a result of past service provided by the
employee and the obligation can be estimated reliably.
Share-based incentive plans
As part of the Group’s remuneration programme it participates in a number of Citigroup share-based incentive plans.
These plans involve the granting of stock options, restricted or deferred share awards and share payments. Such awards
are used to attract, retain and motivate officers and employees to provide incentives for their contributions to the
long-term performance and growth of the Group, and to align their interests with those of the shareholders. The award
programmes are administered by the Personnel and Compensation Committee of the Group Inc. Board of Directors,
which is composed entirely of non-employee Directors.
In the share award programme Citigroup issues in the form of restricted share awards, deferred share awards and share
payments. For all stock award programmes during the applicable vesting period, the shares awarded are not issued to
aprticipants (in the case of a deferred stock award) or cannot be sold or transferred by the participants (in the case
of a restricted stock award), until after vesting conditions have been satisfied. Recipients of deferred share awards do
not have any sharehloder rights until shares are delivered to them, but they generally are entitled to receive dividend-
equivalent payments during vesting period. Recipients of restricted share awards are entitled to a limited voting right
an to receive dividend or dividend-equivalent payments during the vesting period. Once a share award vests the shares
become freely transferrable, but in the case of certain employees, may be subject to transfer restriction by their terms
or share ownership commitment.
Deferred Cash Awards
Citibank Nigeria Limited granted awards to employees other than cash incentive compensation, Capital Accumulation
Programme (CAP) or stock options. Those awards include (Deferred Cash Stock Unit Awards) DCSUs, which are cash-
settled awards with the payment made to employees being equal to Citi’s share price at the relevant vesting date and
Deferred Cash Awards which are fixed amounts plus interest at a stated rate with a required future service (vesting)
period.
For Deferred Cash Awards, the bank accrues a liability over the vesting period because that reflects the period over
which employees must provide services.
2.13 Share Capital
Dividend on ordinary shares
Dividend on ordinary shares is appropriated from retained earnings in the year it is approved by the Group’s shareholders.
Dividend per share is calculated based on the declared dividend during the year and the number of shares in issue at the
date of the declaration and qualifying for dividend.
Dividend for the current year that is approved by the Directors after the statement of financial position date is disclosed
in the subsequent events note to the financial statements.
Dividend proposed by Directors’ but not yet approved by members is disclosed in the financial statements in accordance
with the requirements of the Companies and Allied Matters Act of Nigeria.
Notes to the Consolidated & Separate Financial Statements
2017 ANNUAL REPORT
87
Treasury shares
Where the Bank or any member of the Group purchases the Bank’s share capital, the consideration paid, if any, is
deducted from the shareholders equity as treasury shares until they are cancelled or disposed, as disclosed in note 38.3.
Where such shares are subsequently sold or reissued, any consideration received is included in shareholders equity.
2.14 Contingent assets and liabilities
Contingent assets
Contingent asset is a possible asset that arises from past events and whose existence will be confirmed only by the
occurrence or non-occurrence of one or more uncertain future events not wholly within the control of the Group.
Contingent assets are disclosed in the financial statements when they arise.
Contingent liabilities
Contingent liability is a probable obligation that arises from past events and whose existence will be confirmed only by
the occurrence or non-occurrence of one or more uncertain future events not wholly within the control of the Group.
Contingent liabilities are disclosed in the financial statements. However they are recognized, if it is probable that an
outflow of economic resources will be required to settle the obligation and the amount can be reliably estimated.
Financial guarantees
Financial guarantees are contracts that require the Group to make specified payments to reimburse the holder for a loss
it incurs because a specified debtor fails to make payment when due in accordance with the terms of a debt instrument.
Financial guarantee liabilities are recognised initially at their fair value, and the initial fair value is amortised over the
life of the financial guarantee. The financial guarantee liability is subsequently carried at the higher of this amortised
amount and the present value of any expected payment when a payment under the guarantee has become probable.
Financial guarantees are included within other liabilities. The fee income earned is recognised on a straight-line basis
over the life of the guarantee.
2.15 Comparatives
Except when a standard or an interpretation permits or requires otherwise, all amounts are reported or disclosed with
comparative information.
Where IAS 8 applies, comparative figures have been adjusted to conform with changes in presentation in the current
year.
3 Critical accounting estimates and judgements
Estimates and judgements are continually evaluated and are based on historical experience and other factors, including
expectations of future events that are believed to be reasonable under the circumstances.
The group makes estimates and assumptions concerning the future. The resulting accounting estimates will, by
definition, seldom equal the related actual results. The estimates and assumptions that have a significant risk of causing
a material adjustment to the carrying amounts of assets and liabilities within the next financial year are addressed
below.
3.1. Impairment losses on loans and advances
The Group reviews its loan portfolios to assess impairment periodically. In determining whether an impairment loss
should be recorded in statement of profit or loss, the Group makes judgements as to whether there is any observable
data indicating an impairment trigger, followed by measurable decrease in the estimated future cash flows from the
portfolio of loans, before the decrease can be identified with that portfolio. This evidence may include observable data
that indicates significant financial difficulty, default on the facility or probability that the obligor will enter bankruptcy,
or other observable data relating to a group of assets such as adverse changes in the payment status of borrowers or
issuers in the group, or economic conditions that correlate with defaults in the group. The Group uses estimates based
on historical loss experience for assets with credit risk characteristics and objective evidence of impairment similar to
those in the portfolio. The loan impairment provision was based on risk rating of obligors and loss norms attached to
each risk rating.
Notes to the Consolidated & Separate Financial Statements
2017 ANNUAL REPORT
88
3.2. Fair value of financial instruments
The fair value of financial instruments where no active market exists or where quoted prices are not otherwise available
are determined by using valuation techniques. In these cases, the fair values are estimated from observable data in
respect of similar financial instruments or using valuation models. Where market observable inputs are not available,
they are estimated based on appropriate assumptions. Where valuation techniques (for example, models) are used to
determine fair values, they are validated and periodically reviewed by qualified personnel independent of those that
sourced them. All models are certified before they are used, and models are calibrated to ensure that outputs reflect
actual data and comparative market prices. To the extent practical, models use only observable data; however, areas
such as credit risk (both own credit risk and counterparty risk), volatilities and correlations require management to
make estimates. Note 4.2.1 details further sensitivity analysis on the non-trading portfolio.
3.3 Determination of rates used to translate foreign currency denominated transactions
The bank uses NIFEX rate (which is the rate at which banks and other financial institutions conduct business) to translate
its financial activities at the reporting date. It is the average rate of both demand and supply in the market.
3.4 Finance and operating leases
Where the Group leases out equipment and there is a transfer of substantially all of the risks and rewards of ownership
to the lessee, the lease is accounted for as a finance lease. Operating leases are leases other than finance leases.
Finance and operating leases - as lessee
Assets held under finance leases and hire purchase contracts are capitalised and depreciated accordingly. Finance
charges are allocated to accounting periods so as to produce a constant periodic rate of interest on the remaining
balance of the obligation for each accounting period. Rentals payable under operating leases are charged to the income
statement on a straight line basis over the lease term.
Finance and operating leases - as lessor
The net investment in finance leases is included where applicable in “Loans and advances to customers”. The gross
earnings over the period of the lease are allocated to give a constant periodic rate of return on the net investment.
Direct costs of initiating leases are added to the initial recognition amount of the lease receivable. Rentals receivable
are included within “interest and similar income”.
Assets held for the purpose of leasing to third parties under operating leases are included in “property, plant and
equipment” and depreciated on a straight-line basis over their estimated useful lives. Rentals receivable are accounted
for on a straight-line basis over the period of the lease and are included within “other operating income”.
Residual values
Residual value exposure occurs due to the uncertain nature of the value of an asset at the end of an agreement.
Throughout the life of an asset its residual value will fluctuate because of the uncertainty of the future market and
technological changes or product enhancements as well as general economic conditions.
Residual values are set at the commencement of the lease based upon management’s expectations of future values.
During the course of the lease residual values are reviewed on an annual basis so as to identify any potential impairment.
Any reduction in the residual value that leads to an impairment of a leased asset is identified within such reviews and
recognised immediately.
Notes to the Consolidated & Separate Financial Statements
2017 ANNUAL REPORT
89
4. Financial risk management
The risk management framework has as its foundation a robust set of policies, procedures and processes covering the
following broad categories of risk: Credit risk, Market risk and Liquidity risk.
The risk management policies serve as the basis for risk identification and analysis inherent in the product offering as
well as operating environment, setting of appropriate risk limits and controls and monitoring adherence to limits. Risk
management policies and systems are reviewed regularly to reflect changes in market conditions, products and services
offered. Business managers and functional heads are acountable for risks in their businesses and functions. The Group,
through its training, management standards and procedures, aims to develop a disciplined and constructive control
environment, in which all employees understand their roles and obligations.
Enterprise risk review
The diversity of customers, products, and business strategies at Citibank Nigeria Limited requires that we have a well-
defined, risk management framework to identify, analyze, originate, monitor and report on acceptable risk taking
activities within pre-defined thresholds.
The Group’s risk management function works with the business towards the goal of taking intelligent risk with shared
responsibility, without forsaking individual accountability and mitigating the potential of losses in risk activities under 3
broad categories: Credit risk, Liquidity and Market risk. Senior Business Management‘s objectives (budgets, portfolios
and investments) must be prudent, reflecting their view of risks and rewards arising from market conditions and should
dynamically adjust these strategies and budgets to fit changing environments.
Governance structure
The key governance structure includes the Board of Directors, Credit Committees, Risk Management committee and
senior management committees which specifically focus on the broad risk categories stated above.
The Board of Directors has overall responsibility for the establishment and oversight of the Group’s risk management
framework.
The Board Credit Committee has the responsibility for approval of credit facilities, delegation of approval limits and
ratification of Management Credit committee limits as recommended by the Country Risk Manager.
All Board committees report regularly to the board of directors on their activities.
Asset and Liability Committee (ALCO) is responsible for the market risk management and oversight for the bank. The
ALCO establishes and implements liquidity and price risk management policies; approves the annual liquidity and
funding plans; approves and reviews the liquidity and price risk limits; monitors compliance with regulatory risk capital
and the capital management process.
Excessive risk concentration
Concentrations arise when a number of counterparties are engaged in similar business activities, or activities in
the same geographical region, or have similar economic features that would cause their ability to meet contractual
obligations to be similarly affected by changes in economic, political or other conditions.
Concentrations indicate the relative sensitivity of the Group’s performance to developments affecting a particular
industry or geographical location. In order to avoid excessive concentrations of risk, the Group’s policies and procedures
include specific concentration limits based on the Group’s overal risk capacity, capital considerations and evaluation of
internal and external environments. Identified concentrations of credit risks are monitored, controlled and managed
accordingly.
Notes to the Consolidated & Separate Financial Statements
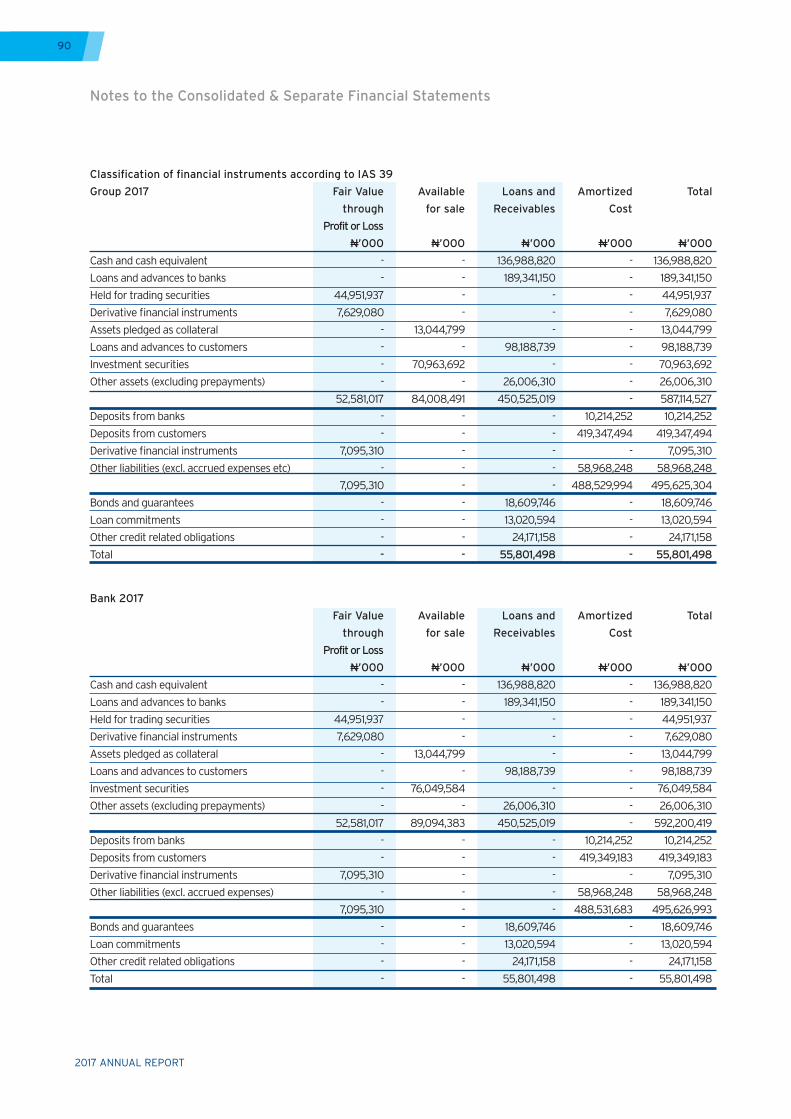
2017 ANNUAL REPORT
90
Classification of financial instruments according to IAS 39
Group 2017 Fair Value Available Loans and Amortized Total
through for sale Receivables Cost
Profit or Loss
N’000 N’000 N’000 N’000 N’000
Cash and cash equivalent - - 136,988,820 - 136,988,820
Loans and advances to banks - - 189,341,150 - 189,341,150
Held for trading securities 44,951,937 - - - 44,951,937
Derivative financial instruments 7,629,080 - - - 7,629,080
Assets pledged as collateral - 13,044,799 - - 13,044,799
Loans and advances to customers - - 98,188,739 - 98,188,739
Investment securities - 70,963,692 - - 70,963,692
Other assets (excluding prepayments) - - 26,006,310 - 26,006,310
52,581,017 84,008,491 450,525,019 - 587,114,527
Deposits from banks - - - 10,214,252 10,214,252
Deposits from customers - - - 419,347,494 419,347,494
Derivative financial instruments 7,095,310 - - - 7,095,310
Other liabilities (excl. accrued expenses etc) - - - 58,968,248 58,968,248
7,095,310 - - 488,529,994 495,625,304
Bonds and guarantees - - 18,609,746 - 18,609,746
Loan commitments - - 13,020,594 - 13,020,594
Other credit related obligations - - 24,171,158 - 24,171,158
Total - - 55,801,498 - 55,801,498
Bank 2017
Fair Value Available Loans and Amortized Total
through for sale Receivables Cost
Profit or Loss
N’000 N’000 N’000 N’000 N’000
Cash and cash equivalent - - 136,988,820 - 136,988,820
Loans and advances to banks - - 189,341,150 - 189,341,150
Held for trading securities 44,951,937 - - - 44,951,937
Derivative financial instruments 7,629,080 - - - 7,629,080
Assets pledged as collateral - 13,044,799 - - 13,044,799
Loans and advances to customers - - 98,188,739 - 98,188,739
Investment securities - 76,049,584 - - 76,049,584
Other assets (excluding prepayments) - - 26,006,310 - 26,006,310
52,581,017 89,094,383 450,525,019 - 592,200,419
Deposits from banks - - - 10,214,252 10,214,252
Deposits from customers - - - 419,349,183 419,349,183
Derivative financial instruments 7,095,310 - - - 7,095,310
Other liabilities (excl. accrued expenses) - - - 58,968,248 58,968,248
7,095,310 - - 488,531,683 495,626,993
Bonds and guarantees - - 18,609,746 - 18,609,746
Loan commitments - - 13,020,594 - 13,020,594
Other credit related obligations - - 24,171,158 - 24,171,158
Total - - 55,801,498 - 55,801,498
Notes to the Consolidated & Separate Financial Statements
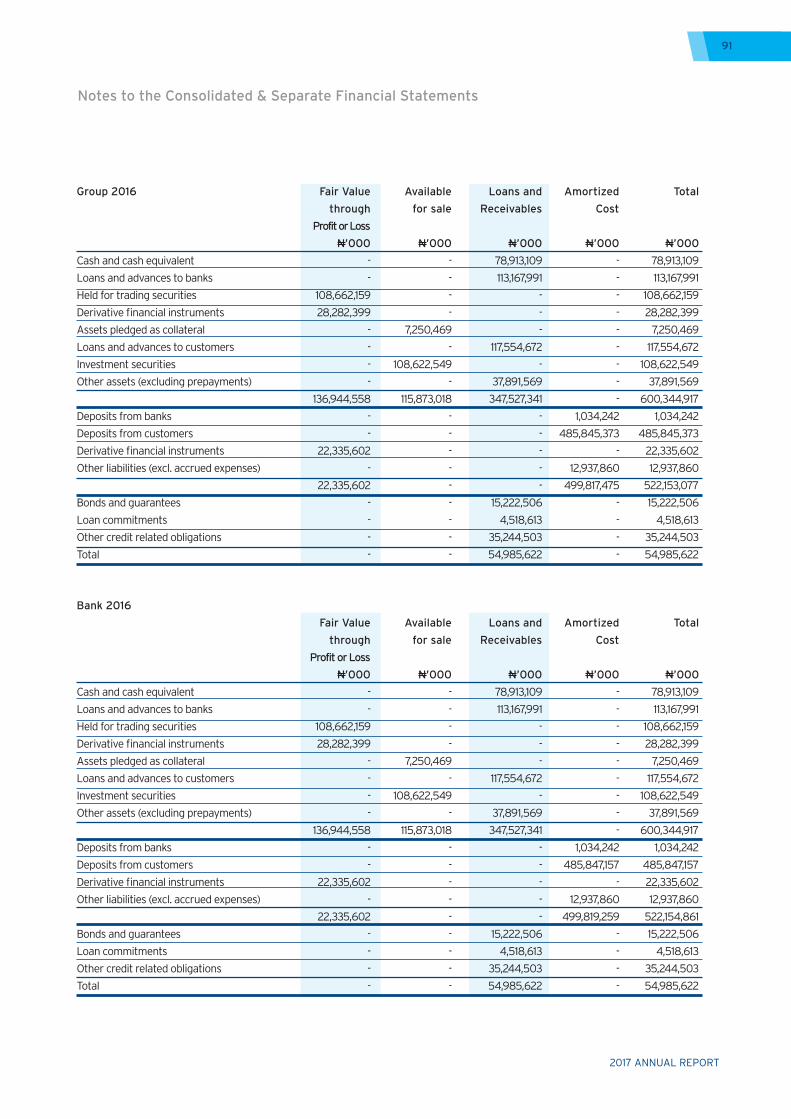
2017 ANNUAL REPORT
91
Group 2016 Fair Value Available Loans and Amortized Total
through for sale Receivables Cost
Profit or Loss
N’000 N’000 N’000 N’000 N’000
Cash and cash equivalent - - 78,913,109 - 78,913,109
Loans and advances to banks - - 113,167,991 - 113,167,991
Held for trading securities 108,662,159 - - - 108,662,159
Derivative financial instruments 28,282,399 - - - 28,282,399
Assets pledged as collateral - 7,250,469 - - 7,250,469
Loans and advances to customers - - 117,554,672 - 117,554,672
Investment securities - 108,622,549 - - 108,622,549
Other assets (excluding prepayments) - - 37,891,569 - 37,891,569
136,944,558 115,873,018 347,527,341 - 600,344,917
Deposits from banks - - - 1,034,242 1,034,242
Deposits from customers - - - 485,845,373 485,845,373
Derivative financial instruments 22,335,602 - - - 22,335,602
Other liabilities (excl. accrued expenses) - - - 12,937,860 12,937,860
22,335,602 - - 499,817,475 522,153,077
Bonds and guarantees - - 15,222,506 - 15,222,506
Loan commitments - - 4,518,613 - 4,518,613
Other credit related obligations - - 35,244,503 - 35,244,503
Total - - 54,985,622 - 54,985,622
Bank 2016
Fair Value Available Loans and Amortized Total
through for sale Receivables Cost
Profit or Loss
N’000 N’000 N’000 N’000 N’000
Cash and cash equivalent - - 78,913,109 - 78,913,109
Loans and advances to banks - - 113,167,991 - 113,167,991
Held for trading securities 108,662,159 - - - 108,662,159
Derivative financial instruments 28,282,399 - - - 28,282,399
Assets pledged as collateral - 7,250,469 - - 7,250,469
Loans and advances to customers - - 117,554,672 - 117,554,672
Investment securities - 108,622,549 - - 108,622,549
Other assets (excluding prepayments) - - 37,891,569 - 37,891,569
136,944,558 115,873,018 347,527,341 - 600,344,917
Deposits from banks - - - 1,034,242 1,034,242
Deposits from customers - - - 485,847,157 485,847,157
Derivative financial instruments 22,335,602 - - - 22,335,602
Other liabilities (excl. accrued expenses) - - - 12,937,860 12,937,860
22,335,602 - - 499,819,259 522,154,861
Bonds and guarantees - - 15,222,506 - 15,222,506
Loan commitments - - 4,518,613 - 4,518,613
Other credit related obligations - - 35,244,503 - 35,244,503
Total - - 54,985,622 - 54,985,622
Notes to the Consolidated & Separate Financial Statements
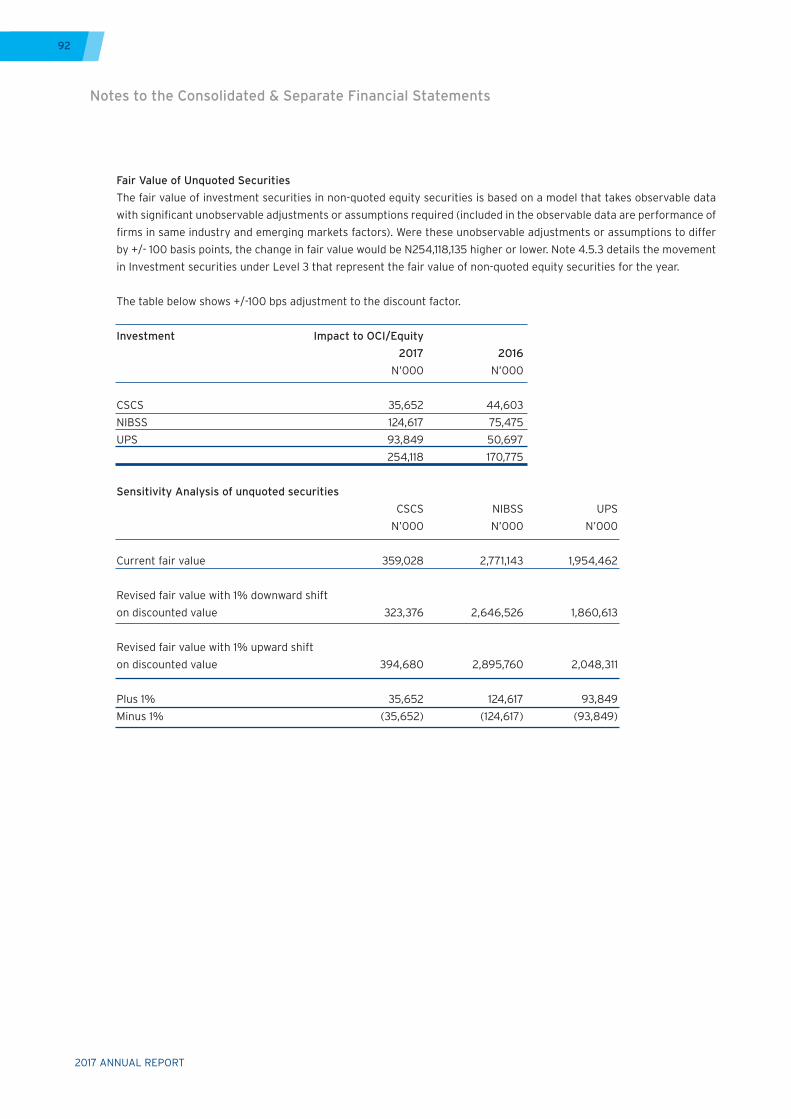
2017 ANNUAL REPORT
92
Fair Value of Unquoted Securities
The fair value of investment securities in non-quoted equity securities is based on a model that takes observable data
with significant unobservable adjustments or assumptions required (included in the observable data are performance of
firms in same industry and emerging markets factors). Were these unobservable adjustments or assumptions to differ
by +/- 100 basis points, the change in fair value would be N254,118,135 higher or lower. Note 4.5.3 details the movement
in Investment securities under Level 3 that represent the fair value of non-quoted equity securities for the year.
The table below shows +/-100 bps adjustment to the discount factor.
Investment Impact to OCI/Equity
2017 2016
N’000 N’000
CSCS 35,652 44,603
NIBSS 124,617 75,475
UPS 93,849 50,697
254,118 170,775
Sensitivity Analysis of unquoted securities
CSCS NIBSS UPS
N’000 N’000 N’000
Current fair value 359,028 2,771,143 1,954,462
Revised fair value with 1% downward shift
on discounted value 323,376 2,646,526 1,860,613
Revised fair value with 1% upward shift
on discounted value 394,680 2,895,760 2,048,311
Plus 1% 35,652 124,617 93,849
Minus 1% (35,652) (124,617) (93,849)
Notes to the Consolidated & Separate Financial Statements
2017 ANNUAL REPORT
93
4.1 Credit risk
Credit risk is the risk of financial loss to the Group if a customer or counterparty to a financial instrument fails to meet
its contractual obligations. This arises principally from the Group’s loans and advances to customers and banks, and
investment debt securities. For risk management reporting purposes the bank considers and consolidates all elements
of credit risk exposure.
4.1.1 Management of credit risk
The credit policy is the bedrock of the credit risk management and is predicated on the Group’s business strategy and
return objective through well pre-defined target market, risk acceptance criteria and stress testing. Based on Board
approval, independent risk committee in conjuction with the business unit set and monitor limits.
To manage the credit process with predictable results, the Group has a dynamic and interactive three phased approach:
i. Portfolio strategy and planning: Where the Group defines desired financial results and strategies required to achieve
those results. Target market is part of the strategy that identifies the acceptable profile of customers and the products
the Group propose to offer;
ii) Credit Origination and Maintenance: Where the Group creates and maintains transactions and portfolios with
characteristics that are consistent with institutional strategies; and
iii) Performance Assessment and Reporting: Where the Group monitors the performance for continual improvement.
System capture of credit information and documentation review is another critical attribute of financial analysis which
facilitates credit monitoring done both on obligor and portfolio basis.
Methodology for risk rating
The Risk Rating Process is the end-to-end process for deriving Obligor Risk Rating (ORR’s) and Facility Risk Rating
(FRR’s). These ratings are derived as part of the overall risk rating process that involves the use of risk rating models,
supplemental guidelines, support adjustments, collateral adjustments, process controls, as well as any other defined
processes that the Group undertakes in order to arrive at ORR’s and FRR’s. The required inputs into the model for
deriving the risk rating are the obligor’s financial statements. The models are statistical models, which are revalidated
periodically by the Credit and Operational Risk Analytics Group of Citigroup, which is based in New York. The revalidation
had no impact but ensured consistency of the rating process.
The Obligor Risk Rating (ORR) represents the probability that an obligor will default within a one-year time horizon. Risk
ratings for obligors are assigned on a scale of 1 to 10, with sub-grades, where ‘1’ is the best quality risk and ‘7’ is the worst
for performing and accruing obligors that are not in default. ORR “9” and “10” rating categories indicate that the obligor
is in default (ORR “8” is applicable only to adverse classifications resulting solely from cross-border events such as FX
restrictions
The Facility Risk Rating (FRR) approximates a ‘Loss Norm’ for each facility, and is the product of two components: the
Default Probability of the Obligor, i.e. the final ORR, and the Loss Given Default (‘LGD’). FRR’s are assigned on a scale
of 1 to 10, with sub-grades, where ‘1’ is the best quality risk and ‘7’ is the worst for performing facilities. The 8, 9 and 10
rating categories indicate facilities that have been classified as impaired.
The Obligor Limit Rating (OLR) represents a longer-term (beyond one year) view of an obligor’s credit quality. The OLR
is derived from the final ORR and considers a range of factors, such as quality of management and strategy, nature of
industry, and regulatory environment, among other factors.
As part of the risk management process, the Group assigns numeric risk ratings to its Obligors based on quantitative
and qualitative assessment of the obligor and facility. These risk ratings are reviewed at least annually or more often if
material events related to the obligor or facility warrant.
Notes to the Consolidated & Separate Financial Statements
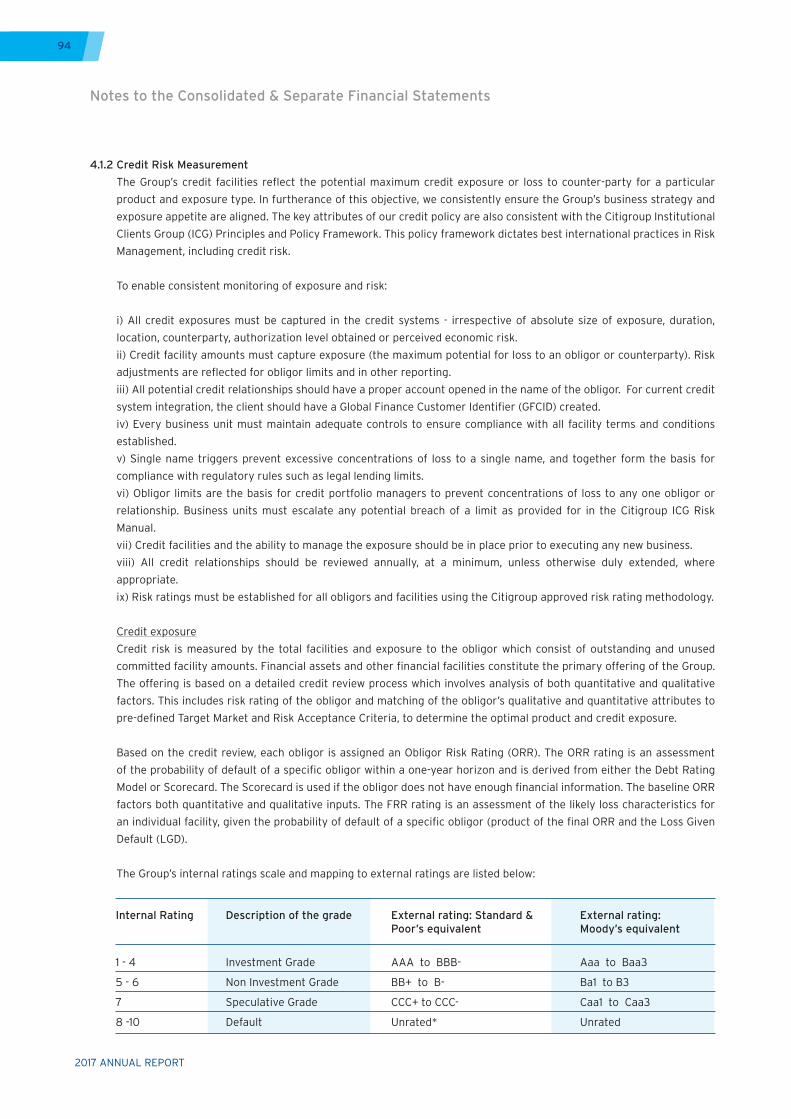
2017 ANNUAL REPORT
94
4.1.2 Credit Risk Measurement
The Group’s credit facilities reflect the potential maximum credit exposure or loss to counter-party for a particular
product and exposure type. In furtherance of this objective, we consistently ensure the Group’s business strategy and
exposure appetite are aligned. The key attributes of our credit policy are also consistent with the Citigroup Institutional
Clients Group (ICG) Principles and Policy Framework. This policy framework dictates best international practices in Risk
Management, including credit risk.
To enable consistent monitoring of exposure and risk:
i) All credit exposures must be captured in the credit systems - irrespective of absolute size of exposure, duration,
location, counterparty, authorization level obtained or perceived economic risk.
ii) Credit facility amounts must capture exposure (the maximum potential for loss to an obligor or counterparty). Risk
adjustments are reflected for obligor limits and in other reporting.
iii) All potential credit relationships should have a proper account opened in the name of the obligor. For current credit
system integration, the client should have a Global Finance Customer Identifier (GFCID) created.
iv) Every business unit must maintain adequate controls to ensure compliance with all facility terms and conditions
established.
v) Single name triggers prevent excessive concentrations of loss to a single name, and together form the basis for
compliance with regulatory rules such as legal lending limits.
vi) Obligor limits are the basis for credit portfolio managers to prevent concentrations of loss to any one obligor or
relationship. Business units must escalate any potential breach of a limit as provided for in the Citigroup ICG Risk
Manual.
vii) Credit facilities and the ability to manage the exposure should be in place prior to executing any new business.
viii) All credit relationships should be reviewed annually, at a minimum, unless otherwise duly extended, where
appropriate.
ix) Risk ratings must be established for all obligors and facilities using the Citigroup approved risk rating methodology.
Credit exposure
Credit risk is measured by the total facilities and exposure to the obligor which consist of outstanding and unused
committed facility amounts. Financial assets and other financial facilities constitute the primary offering of the Group.
The offering is based on a detailed credit review process which involves analysis of both quantitative and qualitative
factors. This includes risk rating of the obligor and matching of the obligor’s qualitative and quantitative attributes to
pre-defined Target Market and Risk Acceptance Criteria, to determine the optimal product and credit exposure.
Based on the credit review, each obligor is assigned an Obligor Risk Rating (ORR). The ORR rating is an assessment
of the probability of default of a specific obligor within a one-year horizon and is derived from either the Debt Rating
Model or Scorecard. The Scorecard is used if the obligor does not have enough financial information. The baseline ORR
factors both quantitative and qualitative inputs. The FRR rating is an assessment of the likely loss characteristics for
an individual facility, given the probability of default of a specific obligor (product of the final ORR and the Loss Given
Default (LGD).
The Group’s internal ratings scale and mapping to external ratings are listed below:
Internal Rating
1 - 4
5 - 6
7
8 -10
Description of the grade
Investment Grade
Non Investment Grade
Speculative Grade
Default
External rating: Standard & Poor’s equivalent
AAA to BBB-
BB+ to B-
CCC+ to CCC-
Unrated*
External rating: Moody’s equivalent
Aaa to Baa3
Ba1 to B3
Caa1 to Caa3
Unrated
Notes to the Consolidated & Separate Financial Statements
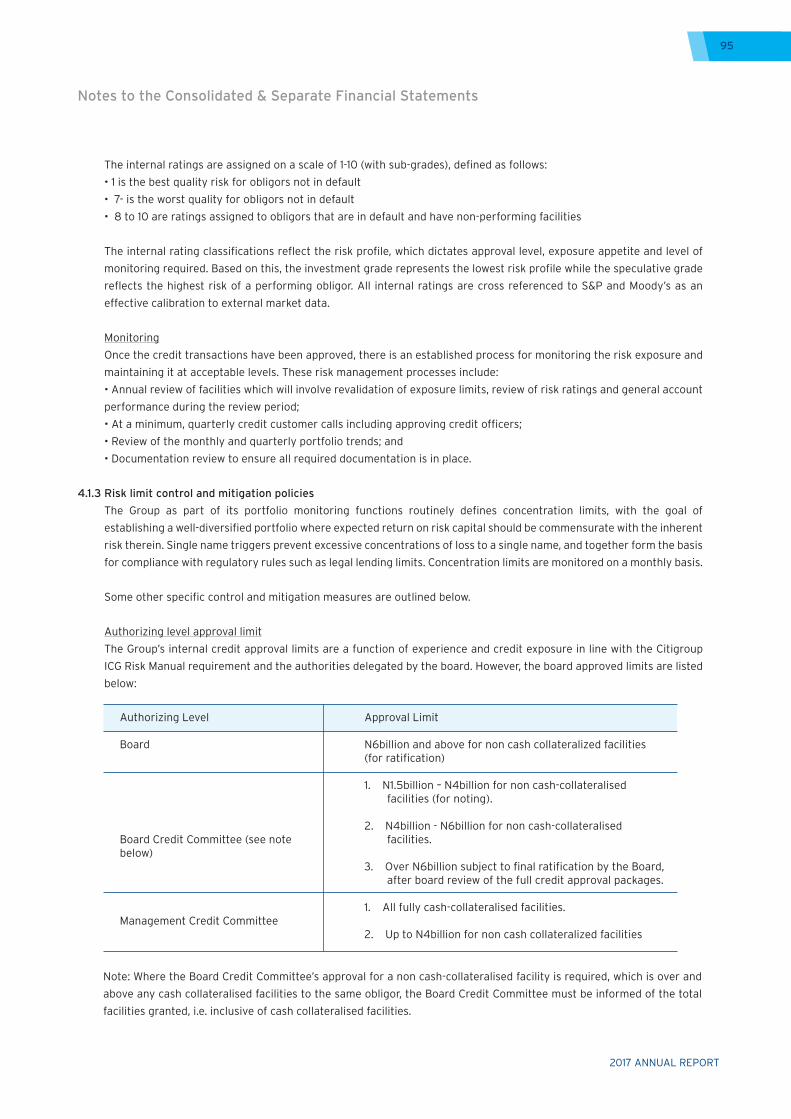
2017 ANNUAL REPORT
95
The internal ratings are assigned on a scale of 1-10 (with sub-grades), defined as follows:
•1isthebestqualityriskforobligorsnotindefault
•7-istheworstqualityforobligorsnotindefault
•8to10areratingsassignedtoobligorsthatareindefaultandhavenon-performingfacilities
The internal rating classifications reflect the risk profile, which dictates approval level, exposure appetite and level of
monitoring required. Based on this, the investment grade represents the lowest risk profile while the speculative grade
reflects the highest risk of a performing obligor. All internal ratings are cross referenced to S&P and Moody’s as an
effective calibration to external market data.
Monitoring
Once the credit transactions have been approved, there is an established process for monitoring the risk exposure and
maintaining it at acceptable levels. These risk management processes include:
•Annualreviewoffacilitieswhichwillinvolverevalidationofexposurelimits,reviewofriskratingsandgeneralaccount
performance during the review period;
•Ataminimum,quarterlycreditcustomercallsincludingapprovingcreditofficers;
•Reviewofthemonthlyandquarterlyportfoliotrends;and
•Documentationreviewtoensureallrequireddocumentationisinplace.
4.1.3 Risk limit control and mitigation policies
The Group as part of its portfolio monitoring functions routinely defines concentration limits, with the goal of
establishing a well-diversified portfolio where expected return on risk capital should be commensurate with the inherent
risk therein. Single name triggers prevent excessive concentrations of loss to a single name, and together form the basis
for compliance with regulatory rules such as legal lending limits. Concentration limits are monitored on a monthly basis.
Some other specific control and mitigation measures are outlined below.
Authorizing level approval limit
The Group’s internal credit approval limits are a function of experience and credit exposure in line with the Citigroup
ICG Risk Manual requirement and the authorities delegated by the board. However, the board approved limits are listed
below:
Authorizing Level
Board
Board Credit Committee (see note below)
Management Credit Committee
Approval Limit
N6billion and above for non cash collateralized facilities (for ratification)
1. N1.5billion – N4billion for non cash-collateralised facilities (for noting).
2. N4billion - N6billion for non cash-collateralised facilities.
3. Over N6billion subject to final ratification by the Board, after board review of the full credit approval packages.
1. All fully cash-collateralised facilities.
2. Up to N4billion for non cash collateralized facilities
Note: Where the Board Credit Committee’s approval for a non cash-collateralised facility is required, which is over and
above any cash collateralised facilities to the same obligor, the Board Credit Committee must be informed of the total
facilities granted, i.e. inclusive of cash collateralised facilities.
Notes to the Consolidated & Separate Financial Statements
2017 ANNUAL REPORT
96
The key feature of credit approval in the Group is the fact that no one person can singly approve a credit, irrespective
of the limit.
Exposure to credit risk is also managed through periodic calls on the borrowers to ascertain operating performance and
determine their continued ability to meet all obligations as and when due.
Collateral
The Group focuses primarily on the cash-flows of the borrower for its repayments. The general principle is that
repayment should come from the transactions financed or other operating cash-flows. The Group maintains a policy of
not lending in an inferior position, without proper approvals (and only in exceptional circumstances), or where it is at a
disadvantage to other lenders as regards seniority of claim in a default scenario.
During the annual credit review process, searches are conducted to verify that the Group is not lending in an inferior
position. In instances where pre-existing charges exist on the customer’s assets, the Group generally demands a pari-
passu ranking with other lenders. However, based on the credit profile assessment on a case by case basis, the Board
Credit Committee may also request for additional collateral for credit enhancement.
For term loans for the acquisition of specific assets, the Group generally takes a charge over the assets financed by the
term loan.
As a general principle, all credits are reviewed and approved based broadly on the under listed key factors:
- The operations of the Borrower/Obligor falling within the approved target market.
- Strong financial profile with emphasis on present and future cash flow which determines the capacity of the operations
to meet debt obligations.
- Review and assessment of Borrower/Obligor management and sponsors.
- Credit history track record.
- Economic/industry trends.
- For an international company where the Group has recourse to branches or subsidiaries of Citibank outside Nigeria,
or where the exposure is secured against guarantees, cash or other types of collateral, the Bank may reserve the right
not to insist on obtaining a local security ranking pari-passu with other local lenders, in view of the superior access it
maintains through its global affiliates to the parent company seniors.
The Group implements the above guidelines on the acceptability of specific classes of collateral or credit risk mitigation.
The principal collateral types for loans and advances are:
1. Floating charge which covers all the assets of the company and the value can change in the normal course of business
e.g. stocks, receivables etc.
2. All assets debenture which is a fixed and floating charge on the assets of the company.
3. Fixed charge which covers specicifc assets of the company.
4. Mortgage debenture in which a charge is taken on land or real estates as well as other assets.
5. Legal mortgage in which a charge is taken on other assets.
Notes to the Consolidated & Separate Financial Statements
2017 ANNUAL REPORT
97
The Group’s summary policy on collateral for short term exposure is as summarized below
- If the practice of the obligor has been to secure the overdrafts or other facilities for other lenders, then Citi will join
the consortium in order to retain a pari-pasu position with other lenders
- When security is obtained in the form of a floating charge or all asset debentures, there is no reliance placed on this
and it is considered merely a leverage or negotiation tool in the event of adverse development i.e treated as support not
security.
- Given the minimal reliance on such security, the Group will not normally request insurance policies and valuation
of the assets (excluding land and buildings) unless this is required in the inter-creditor agreement and is enforced by
all lenders. Land and buildings taken as support under charge will be valued at establishment of the charge (but not
thereafter) and insured.
- In certain exceptional cases, the Group may request other forms of security such as assignment and domiciliation of
receivables where reliance is placed on the security as a primary way out.
- For secured lending and reverse repurchase transactions, cash or securities;
- For commercial lending, cash or charges over real estate properties, inventory and trade receivables;
- Charges over financial instruments such as debt securities.
The Group also obtains guarantees from parent companies for loans to their subsidiaries in Nigeria.
The total collateral held for loans and advances and other financial facilities as at 31 December 2017 was N1,500,333,000
(2016: N4,734,333,000). See note 4.16
Notes to the Consolidated & Separate Financial Statements
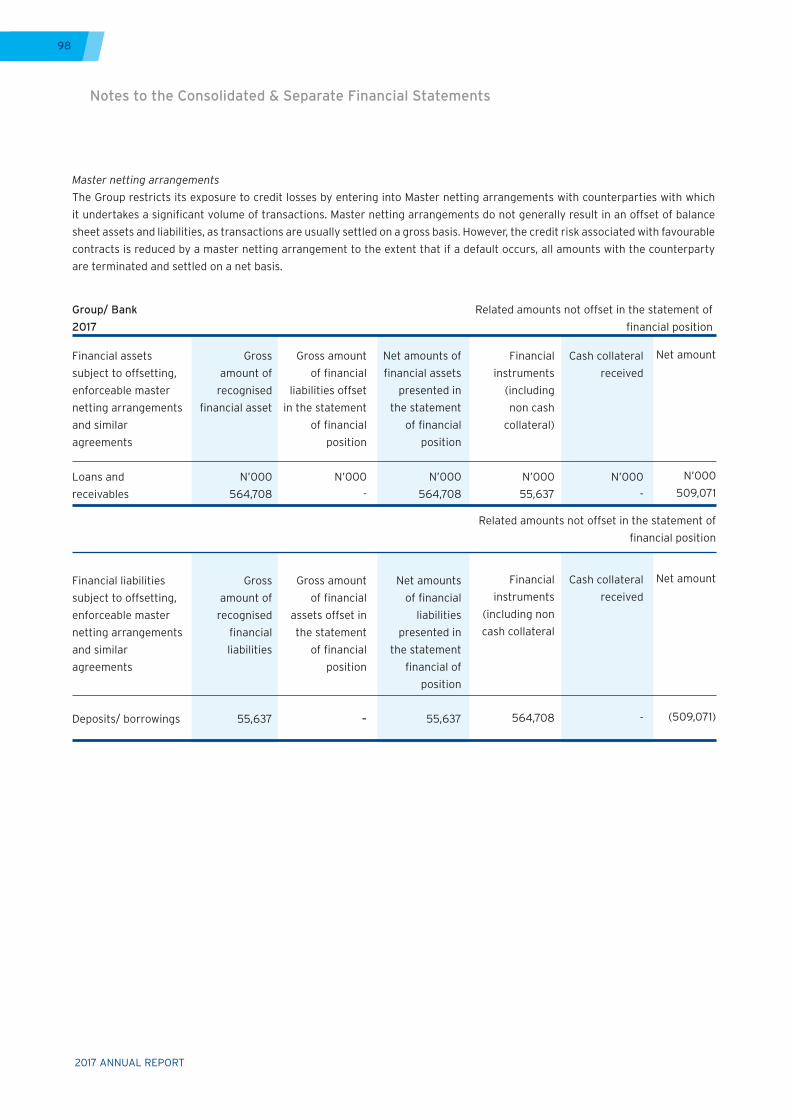
2017 ANNUAL REPORT
98
Group/ Bank
2017
Financial assets
subject to offsetting,
enforceable master
netting arrangements
and similar
agreements
Loans and
receivables
Financial liabilities
subject to offsetting,
enforceable master
netting arrangements
and similar
agreements
Deposits/ borrowings
Gross amount
of financial
liabilities offset
in the statement
of financial
position
N’000
-
Gross amount
of financial
assets offset in
the statement
of financial
position
-
Cash collateral
received
N’000
-
Cash collateral
received
-
Gross
amount of
recognised
financial asset
N’000
564,708
Gross
amount of
recognised
financial
liabilities
55,637
Financial
instruments
(including
non cash
collateral)
N’000
55,637
Financial
instruments
(including non
cash collateral
564,708
Related amounts not offset in the statement of
financial position
Net amounts of
financial assets
presented in
the statement
of financial
position
N’000
564,708
Net amounts
of financial
liabilities
presented in
the statement
financial of
position
55,637
Net amount
N’000
509,071
Net amount
(509,071)
Related amounts not offset in the statement of
financial position
Master netting arrangements
The Group restricts its exposure to credit losses by entering into Master netting arrangements with counterparties with which
it undertakes a significant volume of transactions. Master netting arrangements do not generally result in an offset of balance
sheet assets and liabilities, as transactions are usually settled on a gross basis. However, the credit risk associated with favourable
contracts is reduced by a master netting arrangement to the extent that if a default occurs, all amounts with the counterparty
are terminated and settled on a net basis.
Notes to the Consolidated & Separate Financial Statements
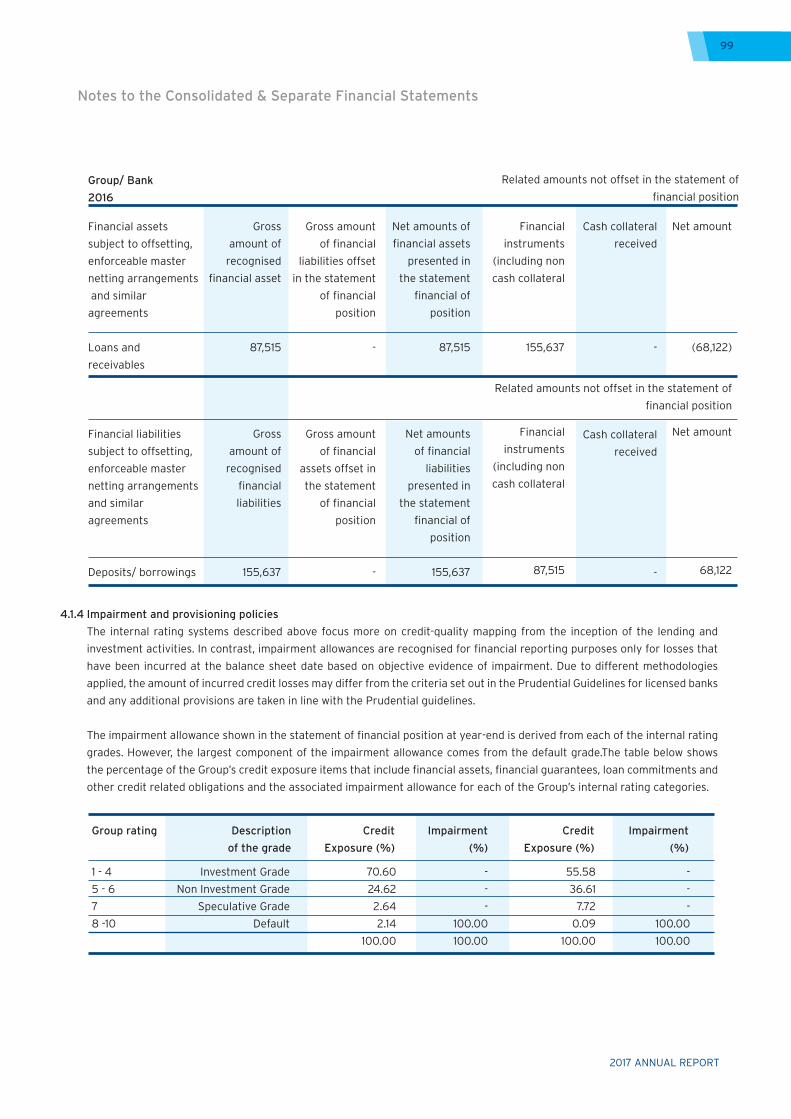
2017 ANNUAL REPORT
99
4.1.4 Impairment and provisioning policies
The internal rating systems described above focus more on credit-quality mapping from the inception of the lending and
investment activities. In contrast, impairment allowances are recognised for financial reporting purposes only for losses that
have been incurred at the balance sheet date based on objective evidence of impairment. Due to different methodologies
applied, the amount of incurred credit losses may differ from the criteria set out in the Prudential Guidelines for licensed banks
and any additional provisions are taken in line with the Prudential guidelines.
The impairment allowance shown in the statement of financial position at year-end is derived from each of the internal rating
grades. However, the largest component of the impairment allowance comes from the default grade.The table below shows
the percentage of the Group’s credit exposure items that include financial assets, financial guarantees, loan commitments and
other credit related obligations and the associated impairment allowance for each of the Group’s internal rating categories.
Group/ Bank
2016
Financial assets
subject to offsetting,
enforceable master
netting arrangements
and similar
agreements
Loans and
receivables
Financial liabilities
subject to offsetting,
enforceable master
netting arrangements
and similar
agreements
Deposits/ borrowings
Gross amount
of financial
liabilities offset
in the statement
of financial
position
-
Gross amount
of financial
assets offset in
the statement
of financial
position
-
Cash collateral
received
-
Cash collateral
received
-
Gross
amount of
recognised
financial asset
87,515
Gross
amount of
recognised
financial
liabilities
155,637
Financial
instruments
(including non
cash collateral
155,637
Financial
instruments
(including non
cash collateral
87,515
Related amounts not offset in the statement of
financial position
Net amounts of
financial assets
presented in
the statement
financial of
position
87,515
Net amounts
of financial
liabilities
presented in
the statement
financial of
position
155,637
Net amount
(68,122)
Net amount
68,122
Related amounts not offset in the statement of
financial position
Group rating Description Credit Impairment Credit Impairment
of the grade Exposure (%) (%) Exposure (%) (%)
1 - 4 Investment Grade 70.60 - 55.58 -
5 - 6 Non Investment Grade 24.62 - 36.61 -
7 Speculative Grade 2.64 - 7.72 -
8 -10 Default 2.14 100.00 0.09 100.00
100.00 100.00 100.00 100.00
Notes to the Consolidated & Separate Financial Statements
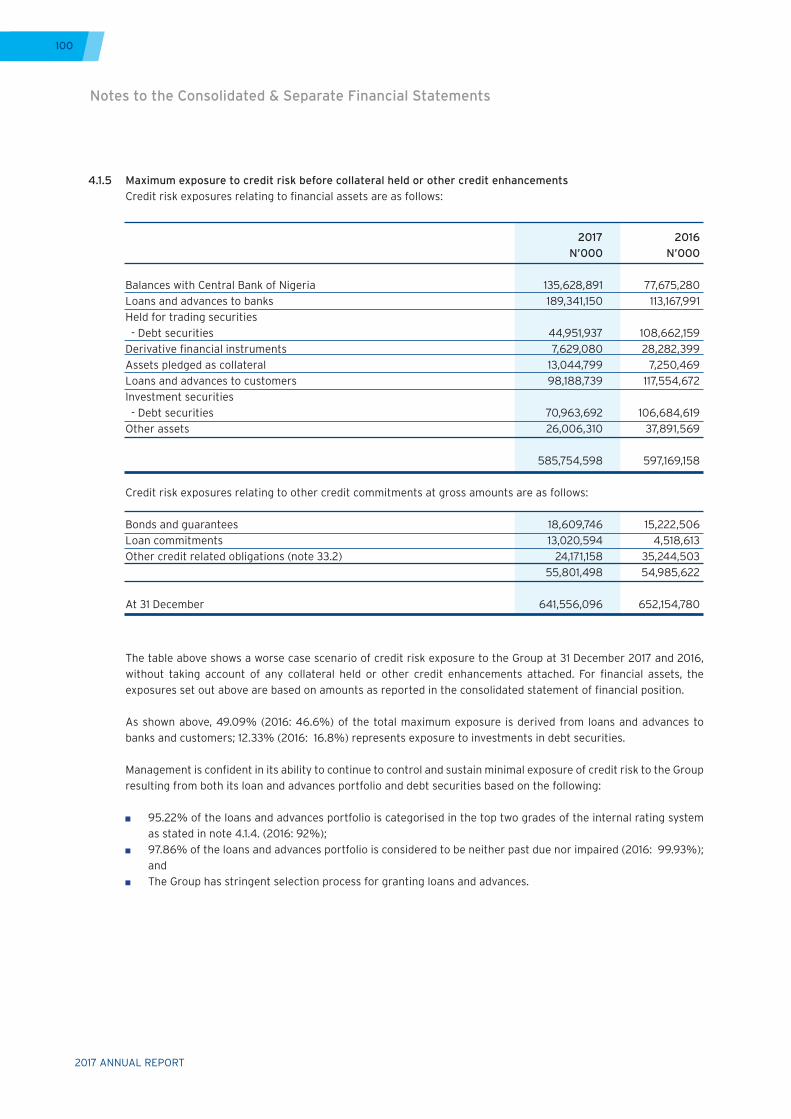
2017 ANNUAL REPORT
100
2017 2016 N’000 N’000
Balances with Central Bank of Nigeria 135,628,891 77,675,280Loans and advances to banks 189,341,150 113,167,991Held for trading securities - Debt securities 44,951,937 108,662,159Derivative financial instruments 7,629,080 28,282,399Assets pledged as collateral 13,044,799 7,250,469Loans and advances to customers 98,188,739 117,554,672Investment securities - Debt securities 70,963,692 106,684,619Other assets 26,006,310 37,891,569
585,754,598 597,169,158
Credit risk exposures relating to other credit commitments at gross amounts are as follows:
Bonds and guarantees 18,609,746 15,222,506Loan commitments 13,020,594 4,518,613Other credit related obligations (note 33.2) 24,171,158 35,244,503 55,801,498 54,985,622 At 31 December 641,556,096 652,154,780
4.1.5 Maximum exposure to credit risk before collateral held or other credit enhancements Credit risk exposures relating to financial assets are as follows:
The table above shows a worse case scenario of credit risk exposure to the Group at 31 December 2017 and 2016, without taking account of any collateral held or other credit enhancements attached. For financial assets, the exposures set out above are based on amounts as reported in the consolidated statement of financial position.
As shown above, 49.09% (2016: 46.6%) of the total maximum exposure is derived from loans and advances to banks and customers; 12.33% (2016: 16.8%) represents exposure to investments in debt securities.
Management is confident in its ability to continue to control and sustain minimal exposure of credit risk to the Group resulting from both its loan and advances portfolio and debt securities based on the following:
95.22% of the loans and advances portfolio is categorised in the top two grades of the internal rating system as stated in note 4.1.4. (2016: 92%);
97.86% of the loans and advances portfolio is considered to be neither past due nor impaired (2016: 99.93%); and
The Group has stringent selection process for granting loans and advances.
Notes to the Consolidated & Separate Financial Statements
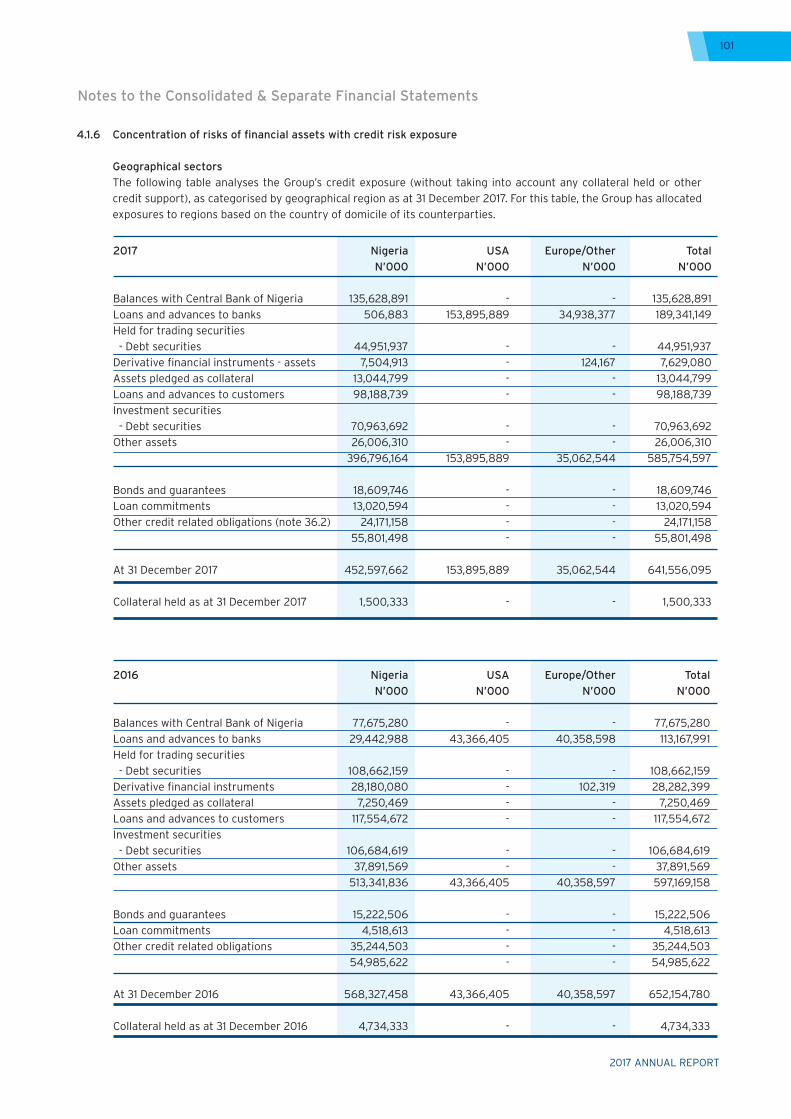
2017 ANNUAL REPORT
101
2017 Nigeria USA Europe/Other Total N’000 N’000 N’000 N’000
Balances with Central Bank of Nigeria 135,628,891 - - 135,628,891Loans and advances to banks 506,883 153,895,889 34,938,377 189,341,149Held for trading securities - Debt securities 44,951,937 - - 44,951,937Derivative financial instruments - assets 7,504,913 - 124,167 7,629,080Assets pledged as collateral 13,044,799 - - 13,044,799Loans and advances to customers 98,188,739 - - 98,188,739Investment securities - Debt securities 70,963,692 - - 70,963,692Other assets 26,006,310 - - 26,006,310 396,796,164 153,895,889 35,062,544 585,754,597
Bonds and guarantees 18,609,746 - - 18,609,746Loan commitments 13,020,594 - - 13,020,594Other credit related obligations (note 36.2) 24,171,158 - - 24,171,158 55,801,498 - - 55,801,498
At 31 December 2017 452,597,662 153,895,889 35,062,544 641,556,095
Collateral held as at 31 December 2017 1,500,333 - - 1,500,333
2016 Nigeria USA Europe/Other Total N’000 N’000 N’000 N’000
Balances with Central Bank of Nigeria 77,675,280 - - 77,675,280Loans and advances to banks 29,442,988 43,366,405 40,358,598 113,167,991Held for trading securities - Debt securities 108,662,159 - - 108,662,159Derivative financial instruments 28,180,080 - 102,319 28,282,399Assets pledged as collateral 7,250,469 - - 7,250,469Loans and advances to customers 117,554,672 - - 117,554,672Investment securities - Debt securities 106,684,619 - - 106,684,619Other assets 37,891,569 - - 37,891,569 513,341,836 43,366,405 40,358,597 597,169,158
Bonds and guarantees 15,222,506 - - 15,222,506Loan commitments 4,518,613 - - 4,518,613Other credit related obligations 35,244,503 - - 35,244,503 54,985,622 - - 54,985,622
At 31 December 2016 568,327,458 43,366,405 40,358,597 652,154,780
Collateral held as at 31 December 2016 4,734,333 - - 4,734,333
4.1.6 Concentration of risks of financial assets with credit risk exposure
Geographical sectors The following table analyses the Group’s credit exposure (without taking into account any collateral held or other
credit support), as categorised by geographical region as at 31 December 2017. For this table, the Group has allocated exposures to regions based on the country of domicile of its counterparties.
Notes to the Consolidated & Separate Financial Statements
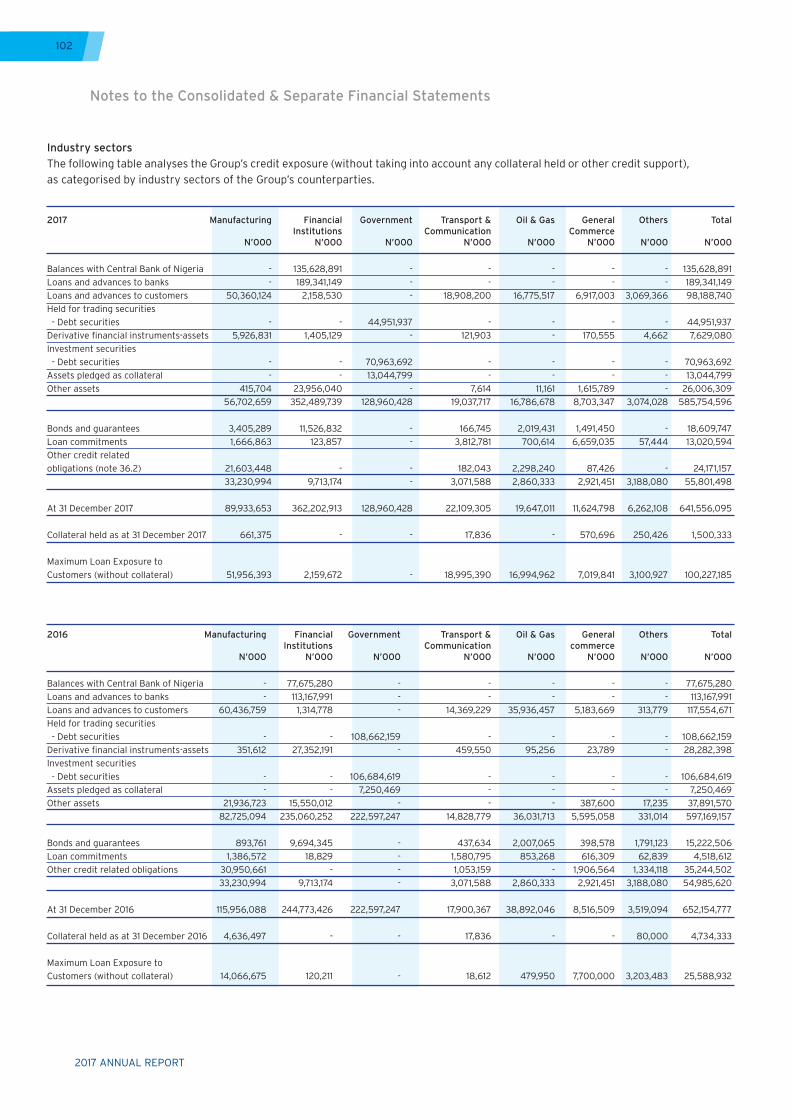
2017 ANNUAL REPORT
102
Industry sectors The following table analyses the Group’s credit exposure (without taking into account any collateral held or other credit support), as categorised by industry sectors of the Group’s counterparties.
2017 Manufacturing Financial Government Transport & Oil & Gas General Others Total Institutions Communication Commerce N’000 N’000 N’000 N’000 N’000 N’000 N’000 N’000
Balances with Central Bank of Nigeria - 135,628,891 - - - - - 135,628,891 Loans and advances to banks - 189,341,149 - - - - - 189,341,149 Loans and advances to customers 50,360,124 2,158,530 - 18,908,200 16,775,517 6,917,003 3,069,366 98,188,740 Held for trading securities - Debt securities - - 44,951,937 - - - - 44,951,937 Derivative financial instruments-assets 5,926,831 1,405,129 - 121,903 - 170,555 4,662 7,629,080 Investment securities - Debt securities - - 70,963,692 - - - - 70,963,692 Assets pledged as collateral - - 13,044,799 - - - - 13,044,799 Other assets 415,704 23,956,040 - 7,614 11,161 1,615,789 - 26,006,309 56,702,659 352,489,739 128,960,428 19,037,717 16,786,678 8,703,347 3,074,028 585,754,596
Bonds and guarantees 3,405,289 11,526,832 - 166,745 2,019,431 1,491,450 - 18,609,747 Loan commitments 1,666,863 123,857 - 3,812,781 700,614 6,659,035 57,444 13,020,594 Other credit related obligations (note 36.2) 21,603,448 - - 182,043 2,298,240 87,426 - 24,171,157 33,230,994 9,713,174 - 3,071,588 2,860,333 2,921,451 3,188,080 55,801,498
At 31 December 2017 89,933,653 362,202,913 128,960,428 22,109,305 19,647,011 11,624,798 6,262,108 641,556,095
Collateral held as at 31 December 2017 661,375 - - 17,836 - 570,696 250,426 1,500,333
Maximum Loan Exposure to Customers (without collateral) 51,956,393 2,159,672 - 18,995,390 16,994,962 7,019,841 3,100,927 100,227,185
2016 Manufacturing Financial Government Transport & Oil & Gas General Others Total Institutions Communication commerce N’000 N’000 N’000 N’000 N’000 N’000 N’000 N’000
Balances with Central Bank of Nigeria - 77,675,280 - - - - - 77,675,280 Loans and advances to banks - 113,167,991 - - - - - 113,167,991 Loans and advances to customers 60,436,759 1,314,778 - 14,369,229 35,936,457 5,183,669 313,779 117,554,671 Held for trading securities - Debt securities - - 108,662,159 - - - - 108,662,159 Derivative financial instruments-assets 351,612 27,352,191 - 459,550 95,256 23,789 - 28,282,398 Investment securities - Debt securities - - 106,684,619 - - - - 106,684,619 Assets pledged as collateral - - 7,250,469 - - - - 7,250,469 Other assets 21,936,723 15,550,012 - - - 387,600 17,235 37,891,570 82,725,094 235,060,252 222,597,247 14,828,779 36,031,713 5,595,058 331,014 597,169,157
Bonds and guarantees 893,761 9,694,345 - 437,634 2,007,065 398,578 1,791,123 15,222,506 Loan commitments 1,386,572 18,829 - 1,580,795 853,268 616,309 62,839 4,518,612 Other credit related obligations 30,950,661 - - 1,053,159 - 1,906,564 1,334,118 35,244,502 33,230,994 9,713,174 - 3,071,588 2,860,333 2,921,451 3,188,080 54,985,620
At 31 December 2016 115,956,088 244,773,426 222,597,247 17,900,367 38,892,046 8,516,509 3,519,094 652,154,777
Collateral held as at 31 December 2016 4,636,497 - - 17,836 - - 80,000 4,734,333
Maximum Loan Exposure to Customers (without collateral) 14,066,675 120,211 - 18,612 479,950 7,700,000 3,203,483 25,588,932
Notes to the Consolidated & Separate Financial Statements
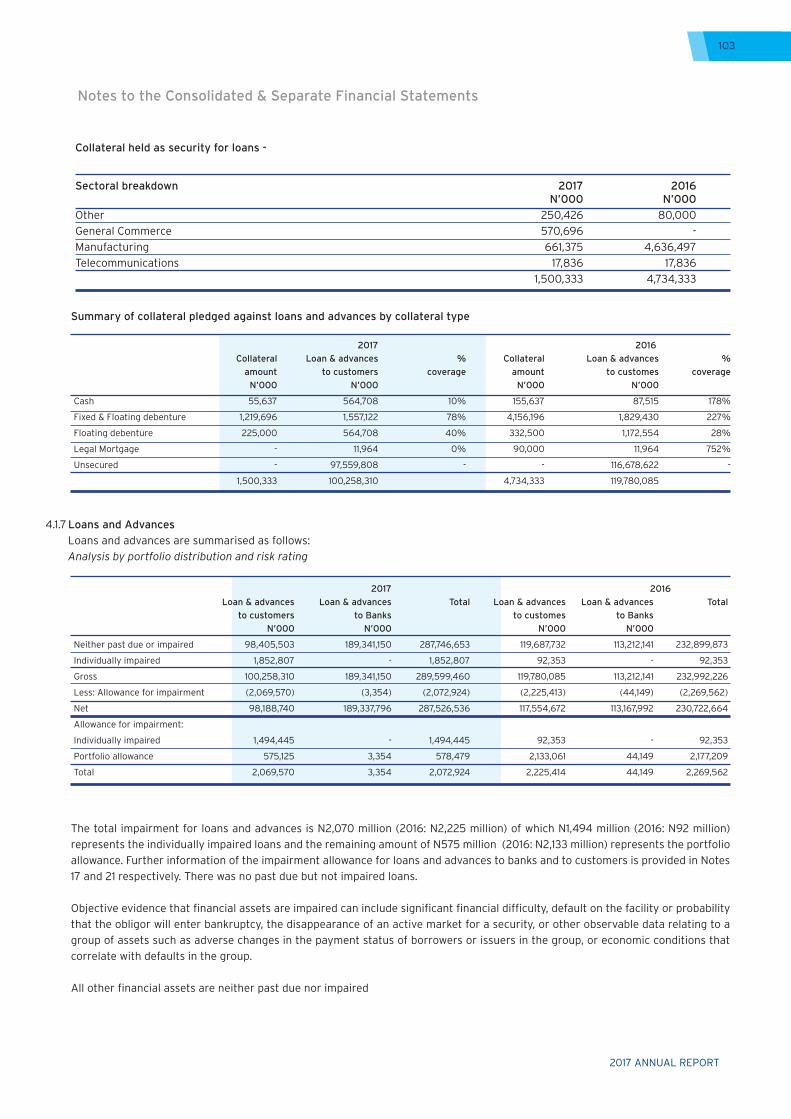
2017 ANNUAL REPORT
103
Collateral held as security for loans -
Summary of collateral pledged against loans and advances by collateral type
4.1.7 Loans and Advances Loans and advances are summarised as follows: Analysis by portfolio distribution and risk rating
The total impairment for loans and advances is N2,070 million (2016: N2,225 million) of which N1,494 million (2016: N92 million) represents the individually impaired loans and the remaining amount of N575 million (2016: N2,133 million) represents the portfolio allowance. Further information of the impairment allowance for loans and advances to banks and to customers is provided in Notes 17 and 21 respectively. There was no past due but not impaired loans.
Objective evidence that financial assets are impaired can include significant financial difficulty, default on the facility or probability that the obligor will enter bankruptcy, the disappearance of an active market for a security, or other observable data relating to a group of assets such as adverse changes in the payment status of borrowers or issuers in the group, or economic conditions that correlate with defaults in the group.
All other financial assets are neither past due nor impaired
2017 2016 Collateral Loan & advances % Collateral Loan & advances % amount to customers coverage amount to customes coverage N’000 N’000 N’000 N’000
Cash 55,637 564,708 10% 155,637 87,515 178%
Fixed & Floating debenture 1,219,696 1,557,122 78% 4,156,196 1,829,430 227%
Floating debenture 225,000 564,708 40% 332,500 1,172,554 28%
Legal Mortgage - 11,964 0% 90,000 11,964 752%
Unsecured - 97,559,808 - - 116,678,622 -
1,500,333 100,258,310 4,734,333 119,780,085
2017 2016 Loan & advances Loan & advances Total Loan & advances Loan & advances Total to customers to Banks to customes to Banks N’000 N’000 N’000 N’000
Neither past due or impaired 98,405,503 189,341,150 287,746,653 119,687,732 113,212,141 232,899,873
Individually impaired 1,852,807 - 1,852,807 92,353 - 92,353
Gross 100,258,310 189,341,150 289,599,460 119,780,085 113,212,141 232,992,226
Less: Allowance for impairment (2,069,570) (3,354) (2,072,924) (2,225,413) (44,149) (2,269,562)
Net 98,188,740 189,337,796 287,526,536 117,554,672 113,167,992 230,722,664
Allowance for impairment:
Individually impaired 1,494,445 - 1,494,445 92,353 - 92,353
Portfolio allowance 575,125 3,354 578,479 2,133,061 44,149 2,177,209
Total 2,069,570 3,354 2,072,924 2,225,414 44,149 2,269,562
Sectoral breakdown 2017 2016 N’000 N’000Other 250,426 80,000 General Commerce 570,696 - Manufacturing 661,375 4,636,497 Telecommunications 17,836 17,836 1,500,333 4,734,333
Notes to the Consolidated & Separate Financial Statements
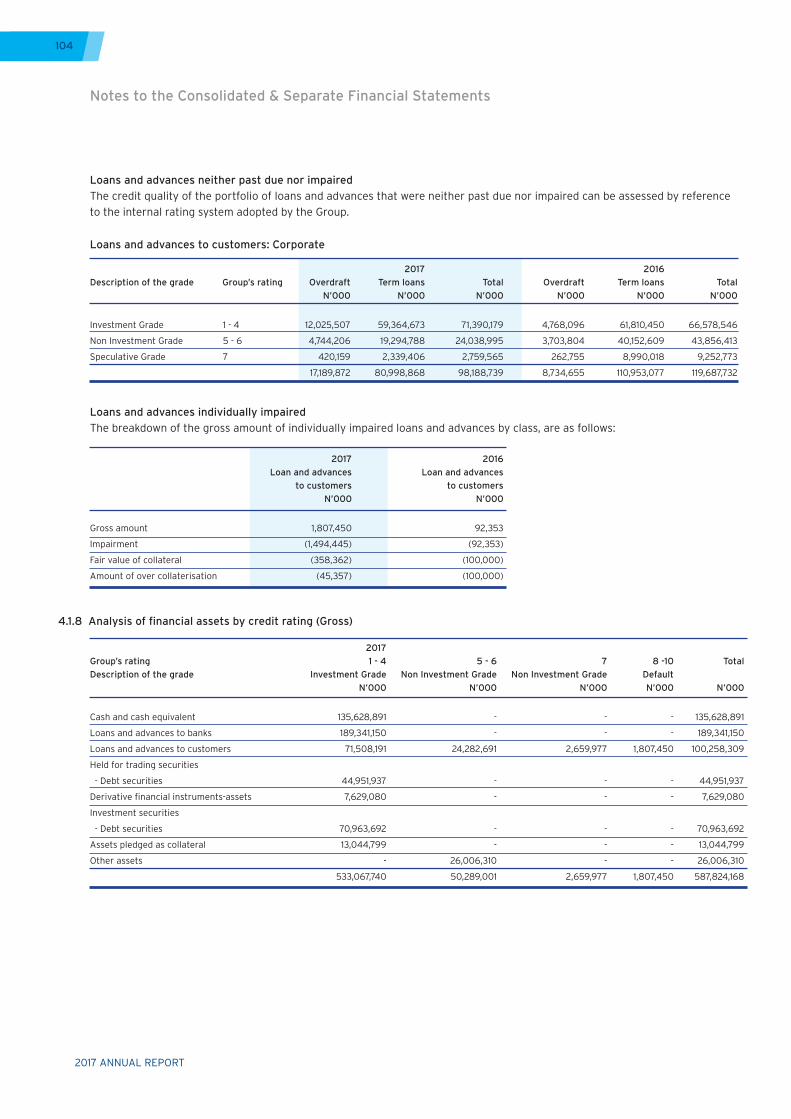
2017 ANNUAL REPORT
104
2017 2016 Description of the grade Group’s rating Overdraft Term loans Total Overdraft Term loans Total N’000 N’000 N’000 N’000 N’000 N’000
Investment Grade 1 - 4 12,025,507 59,364,673 71,390,179 4,768,096 61,810,450 66,578,546
Non Investment Grade 5 - 6 4,744,206 19,294,788 24,038,995 3,703,804 40,152,609 43,856,413
Speculative Grade 7 420,159 2,339,406 2,759,565 262,755 8,990,018 9,252,773
17,189,872 80,998,868 98,188,739 8,734,655 110,953,077 119,687,732
Loans and advances to customers: Corporate
4.1.8 Analysis of financial assets by credit rating (Gross)
Loans and advances individually impaired The breakdown of the gross amount of individually impaired loans and advances by class, are as follows:
2017 2016 Loan and advances Loan and advances to customers to customers N’000 N’000
Gross amount 1,807,450 92,353
Impairment (1,494,445) (92,353)
Fair value of collateral (358,362) (100,000)
Amount of over collaterisation (45,357) (100,000)
2017 Group’s rating 1 - 4 5 - 6 7 8 -10 TotalDescription of the grade Investment Grade Non Investment Grade Non Investment Grade Default N’000 N’000 N’000 N’000 N’000
Cash and cash equivalent 135,628,891 - - - 135,628,891
Loans and advances to banks 189,341,150 - - - 189,341,150
Loans and advances to customers 71,508,191 24,282,691 2,659,977 1,807,450 100,258,309
Held for trading securities
- Debt securities 44,951,937 - - - 44,951,937
Derivative financial instruments-assets 7,629,080 - - - 7,629,080
Investment securities
- Debt securities 70,963,692 - - - 70,963,692
Assets pledged as collateral 13,044,799 - - - 13,044,799
Other assets - 26,006,310 - - 26,006,310
533,067,740 50,289,001 2,659,977 1,807,450 587,824,168
Loans and advances neither past due nor impaired The credit quality of the portfolio of loans and advances that were neither past due nor impaired can be assessed by reference to the internal rating system adopted by the Group.
Notes to the Consolidated & Separate Financial Statements
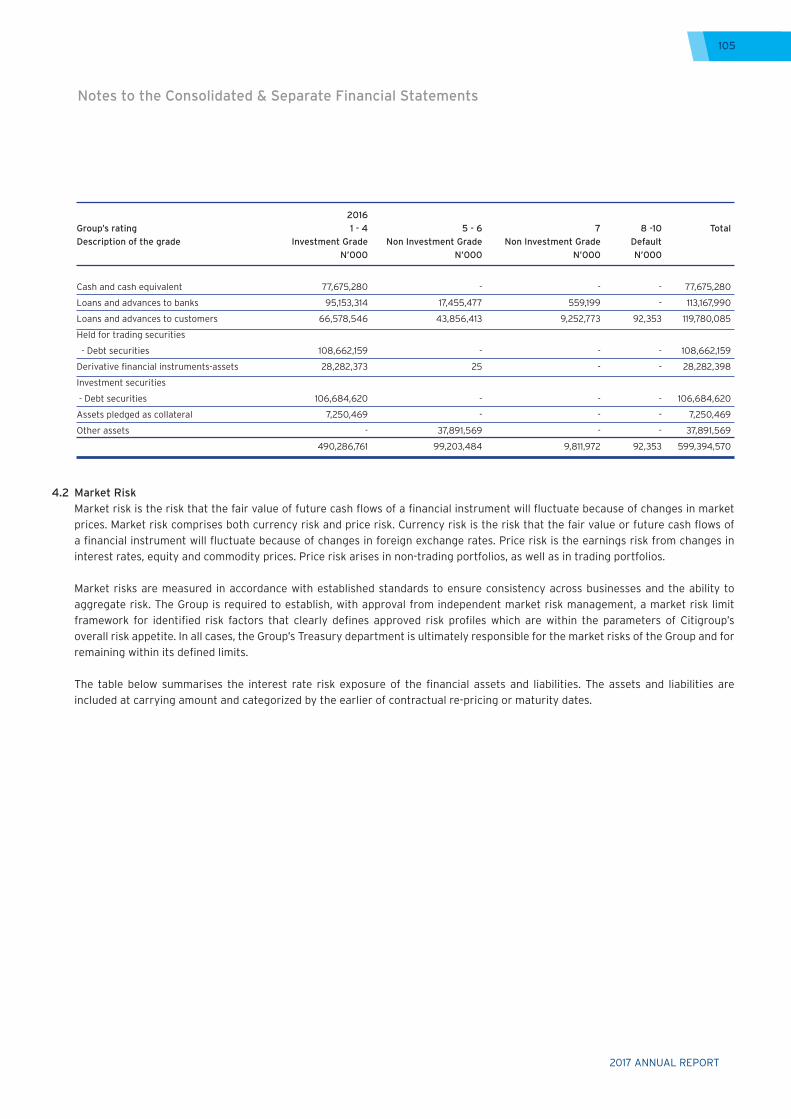
2017 ANNUAL REPORT
105
4.2 Market Risk Market risk is the risk that the fair value of future cash flows of a financial instrument will fluctuate because of changes in market
prices. Market risk comprises both currency risk and price risk. Currency risk is the risk that the fair value or future cash flows of a financial instrument will fluctuate because of changes in foreign exchange rates. Price risk is the earnings risk from changes in interest rates, equity and commodity prices. Price risk arises in non-trading portfolios, as well as in trading portfolios.
Market risks are measured in accordance with established standards to ensure consistency across businesses and the ability to aggregate risk. The Group is required to establish, with approval from independent market risk management, a market risk limit framework for identified risk factors that clearly defines approved risk profiles which are within the parameters of Citigroup’s overall risk appetite. In all cases, the Group’s Treasury department is ultimately responsible for the market risks of the Group and for remaining within its defined limits.
The table below summarises the interest rate risk exposure of the financial assets and liabilities. The assets and liabilities are included at carrying amount and categorized by the earlier of contractual re-pricing or maturity dates.
2016 Group’s rating 1 - 4 5 - 6 7 8 -10 TotalDescription of the grade Investment Grade Non Investment Grade Non Investment Grade Default N’000 N’000 N’000 N’000
Cash and cash equivalent 77,675,280 - - - 77,675,280
Loans and advances to banks 95,153,314 17,455,477 559,199 - 113,167,990
Loans and advances to customers 66,578,546 43,856,413 9,252,773 92,353 119,780,085
Held for trading securities
- Debt securities 108,662,159 - - - 108,662,159
Derivative financial instruments-assets 28,282,373 25 - - 28,282,398
Investment securities
- Debt securities 106,684,620 - - - 106,684,620
Assets pledged as collateral 7,250,469 - - - 7,250,469
Other assets - 37,891,569 - - 37,891,569
490,286,761 99,203,484 9,811,972 92,353 599,394,570
Notes to the Consolidated & Separate Financial Statements
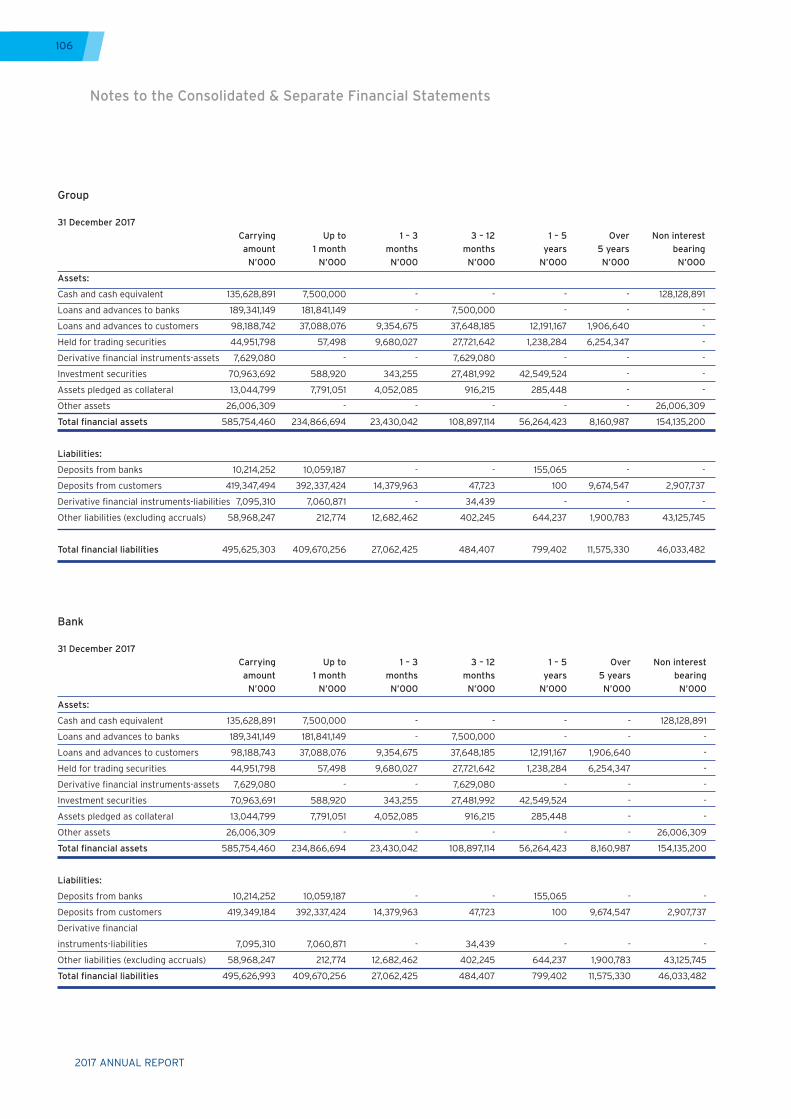
2017 ANNUAL REPORT
106
Group
31 December 2017 Carrying Up to 1 – 3 3 – 12 1 – 5 Over Non interest amount 1 month months months years 5 years bearing N’000 N’000 N’000 N’000 N’000 N’000 N’000
Assets:
Cash and cash equivalent 135,628,891 7,500,000 - - - - 128,128,891
Loans and advances to banks 189,341,149 181,841,149 - 7,500,000 - - -
Loans and advances to customers 98,188,742 37,088,076 9,354,675 37,648,185 12,191,167 1,906,640 -
Held for trading securities 44,951,798 57,498 9,680,027 27,721,642 1,238,284 6,254,347 -
Derivative financial instruments-assets 7,629,080 - - 7,629,080 - - -
Investment securities 70,963,692 588,920 343,255 27,481,992 42,549,524 - -
Assets pledged as collateral 13,044,799 7,791,051 4,052,085 916,215 285,448 - -
Other assets 26,006,309 - - - - - 26,006,309
Total financial assets 585,754,460 234,866,694 23,430,042 108,897,114 56,264,423 8,160,987 154,135,200
Liabilities:
Deposits from banks 10,214,252 10,059,187 - - 155,065 - -
Deposits from customers 419,347,494 392,337,424 14,379,963 47,723 100 9,674,547 2,907,737
Derivative financial instruments-liabilities 7,095,310 7,060,871 - 34,439 - - -
Other liabilities (excluding accruals) 58,968,247 212,774 12,682,462 402,245 644,237 1,900,783 43,125,745
Total financial liabilities 495,625,303 409,670,256 27,062,425 484,407 799,402 11,575,330 46,033,482
Bank
31 December 2017 Carrying Up to 1 – 3 3 – 12 1 – 5 Over Non interest amount 1 month months months years 5 years bearing N’000 N’000 N’000 N’000 N’000 N’000 N’000
Assets:
Cash and cash equivalent 135,628,891 7,500,000 - - - - 128,128,891
Loans and advances to banks 189,341,149 181,841,149 - 7,500,000 - - -
Loans and advances to customers 98,188,743 37,088,076 9,354,675 37,648,185 12,191,167 1,906,640 -
Held for trading securities 44,951,798 57,498 9,680,027 27,721,642 1,238,284 6,254,347 -
Derivative financial instruments-assets 7,629,080 - - 7,629,080 - - -
Investment securities 70,963,691 588,920 343,255 27,481,992 42,549,524 - -
Assets pledged as collateral 13,044,799 7,791,051 4,052,085 916,215 285,448 - -
Other assets 26,006,309 - - - - - 26,006,309
Total financial assets 585,754,460 234,866,694 23,430,042 108,897,114 56,264,423 8,160,987 154,135,200
Liabilities:
Deposits from banks 10,214,252 10,059,187 - - 155,065 - -
Deposits from customers 419,349,184 392,337,424 14,379,963 47,723 100 9,674,547 2,907,737
Derivative financial
instruments-liabilities 7,095,310 7,060,871 - 34,439 - - -
Other liabilities (excluding accruals) 58,968,247 212,774 12,682,462 402,245 644,237 1,900,783 43,125,745
Total financial liabilities 495,626,993 409,670,256 27,062,425 484,407 799,402 11,575,330 46,033,482
Notes to the Consolidated & Separate Financial Statements
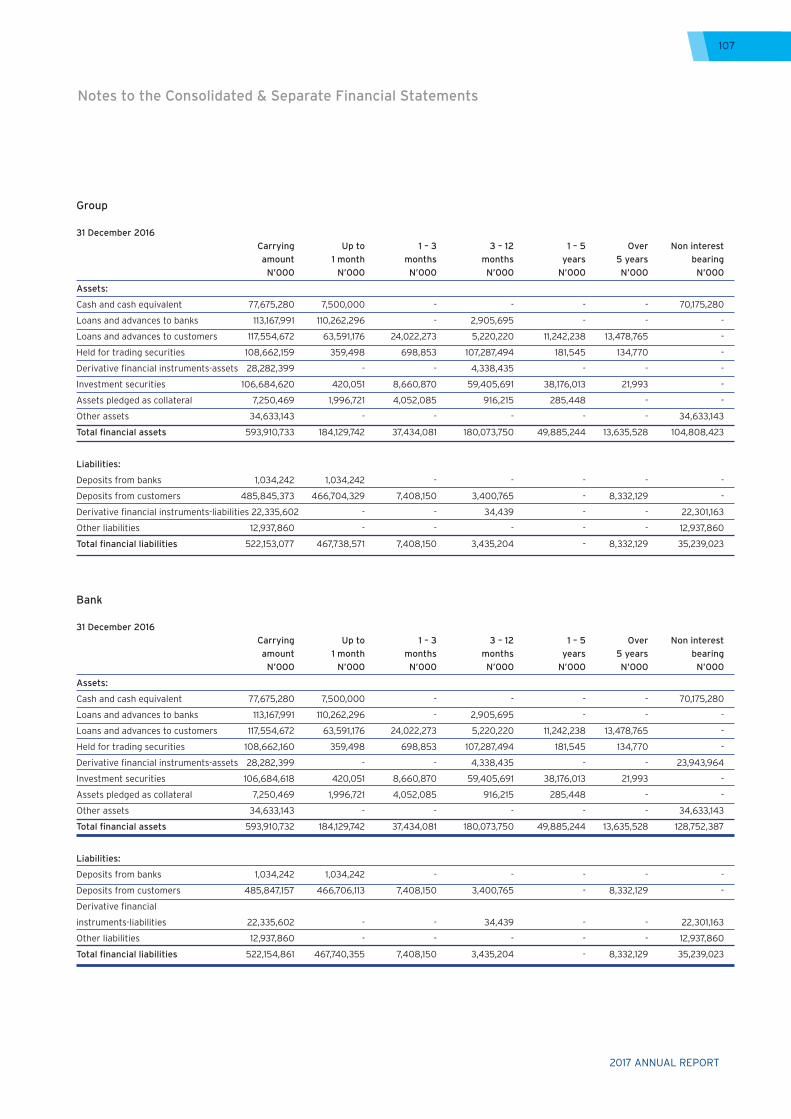
2017 ANNUAL REPORT
107
Group
31 December 2016 Carrying Up to 1 – 3 3 – 12 1 – 5 Over Non interest amount 1 month months months years 5 years bearing N’000 N’000 N’000 N’000 N’000 N’000 N’000
Assets:
Cash and cash equivalent 77,675,280 7,500,000 - - - - 70,175,280
Loans and advances to banks 113,167,991 110,262,296 - 2,905,695 - - -
Loans and advances to customers 117,554,672 63,591,176 24,022,273 5,220,220 11,242,238 13,478,765 -
Held for trading securities 108,662,159 359,498 698,853 107,287,494 181,545 134,770 -
Derivative financial instruments-assets 28,282,399 - - 4,338,435 - - -
Investment securities 106,684,620 420,051 8,660,870 59,405,691 38,176,013 21,993 -
Assets pledged as collateral 7,250,469 1,996,721 4,052,085 916,215 285,448 - -
Other assets 34,633,143 - - - - - 34,633,143
Total financial assets 593,910,733 184,129,742 37,434,081 180,073,750 49,885,244 13,635,528 104,808,423
Liabilities:
Deposits from banks 1,034,242 1,034,242 - - - - -
Deposits from customers 485,845,373 466,704,329 7,408,150 3,400,765 - 8,332,129 -
Derivative financial instruments-liabilities 22,335,602 - - 34,439 - - 22,301,163
Other liabilities 12,937,860 - - - - - 12,937,860
Total financial liabilities 522,153,077 467,738,571 7,408,150 3,435,204 - 8,332,129 35,239,023
Bank
31 December 2016 Carrying Up to 1 – 3 3 – 12 1 – 5 Over Non interest amount 1 month months months years 5 years bearing N’000 N’000 N’000 N’000 N’000 N’000 N’000
Assets:
Cash and cash equivalent 77,675,280 7,500,000 - - - - 70,175,280
Loans and advances to banks 113,167,991 110,262,296 - 2,905,695 - - -
Loans and advances to customers 117,554,672 63,591,176 24,022,273 5,220,220 11,242,238 13,478,765 -
Held for trading securities 108,662,160 359,498 698,853 107,287,494 181,545 134,770 -
Derivative financial instruments-assets 28,282,399 - - 4,338,435 - - 23,943,964
Investment securities 106,684,618 420,051 8,660,870 59,405,691 38,176,013 21,993 -
Assets pledged as collateral 7,250,469 1,996,721 4,052,085 916,215 285,448 - -
Other assets 34,633,143 - - - - - 34,633,143
Total financial assets 593,910,732 184,129,742 37,434,081 180,073,750 49,885,244 13,635,528 128,752,387
Liabilities:
Deposits from banks 1,034,242 1,034,242 - - - - -
Deposits from customers 485,847,157 466,706,113 7,408,150 3,400,765 - 8,332,129 -
Derivative financial
instruments-liabilities 22,335,602 - - 34,439 - - 22,301,163
Other liabilities 12,937,860 - - - - - 12,937,860
Total financial liabilities 522,154,861 467,740,355 7,408,150 3,435,204 - 8,332,129 35,239,023
Notes to the Consolidated & Separate Financial Statements
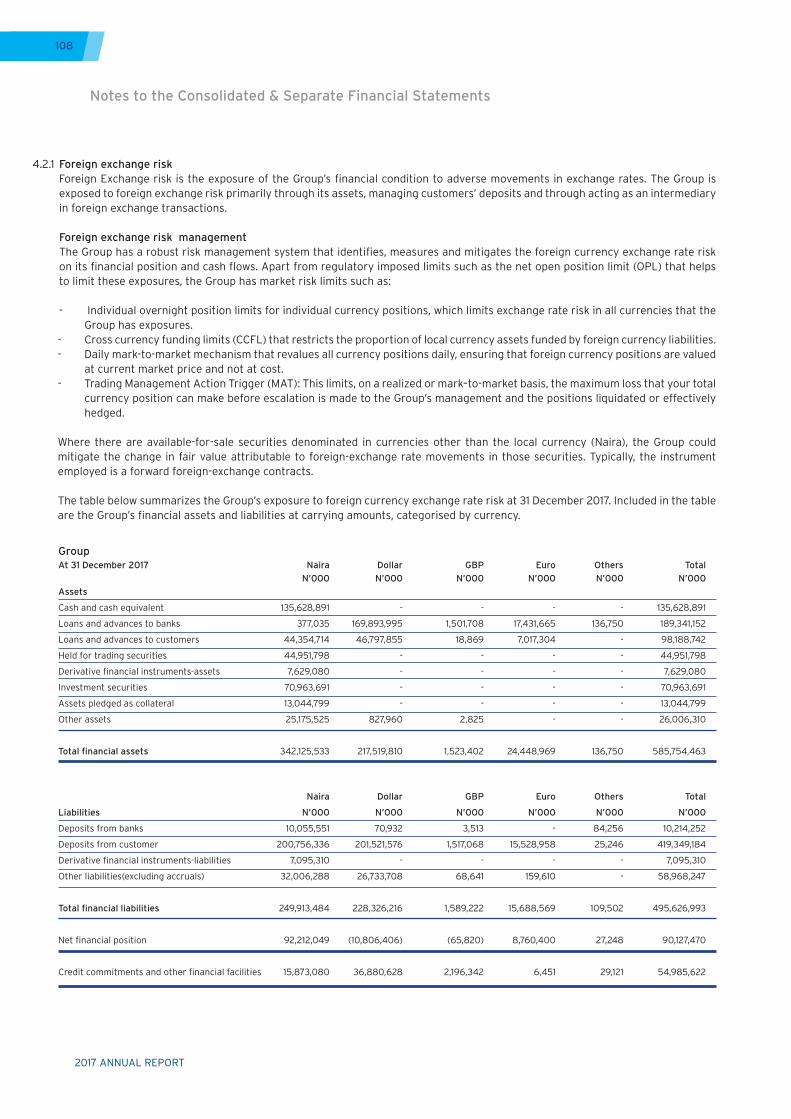
2017 ANNUAL REPORT
108
4.2.1 Foreign exchange risk Foreign Exchange risk is the exposure of the Group’s financial condition to adverse movements in exchange rates. The Group is
exposed to foreign exchange risk primarily through its assets, managing customers’ deposits and through acting as an intermediary in foreign exchange transactions.
Foreign exchange risk management
The Group has a robust risk management system that identifies, measures and mitigates the foreign currency exchange rate risk on its financial position and cash flows. Apart from regulatory imposed limits such as the net open position limit (OPL) that helps to limit these exposures, the Group has market risk limits such as: - Individual overnight position limits for individual currency positions, which limits exchange rate risk in all currencies that the
Group has exposures.- Cross currency funding limits (CCFL) that restricts the proportion of local currency assets funded by foreign currency liabilities.- Daily mark-to-market mechanism that revalues all currency positions daily, ensuring that foreign currency positions are valued
at current market price and not at cost.- Trading Management Action Trigger (MAT): This limits, on a realized or mark–to-market basis, the maximum loss that your total
currency position can make before escalation is made to the Group’s management and the positions liquidated or effectively hedged.
Where there are available-for-sale securities denominated in currencies other than the local currency (Naira), the Group could mitigate the change in fair value attributable to foreign-exchange rate movements in those securities. Typically, the instrument employed is a forward foreign-exchange contracts.
The table below summarizes the Group’s exposure to foreign currency exchange rate risk at 31 December 2017. Included in the table are the Group’s financial assets and liabilities at carrying amounts, categorised by currency.
Group At 31 December 2017 Naira Dollar GBP Euro Others Total N’000 N’000 N’000 N’000 N’000 N’000Assets
Cash and cash equivalent 135,628,891 - - - - 135,628,891
Loans and advances to banks 377,035 169,893,995 1,501,708 17,431,665 136,750 189,341,152
Loans and advances to customers 44,354,714 46,797,855 18,869 7,017,304 - 98,188,742
Held for trading securities 44,951,798 - - - - 44,951,798
Derivative financial instruments-assets 7,629,080 - - - - 7,629,080
Investment securities 70,963,691 - - - - 70,963,691
Assets pledged as collateral 13,044,799 - - - - 13,044,799
Other assets 25,175,525 827,960 2,825 - - 26,006,310
Total financial assets 342,125,533 217,519,810 1,523,402 24,448,969 136,750 585,754,463
Naira Dollar GBP Euro Others Total
Liabilities N’000 N’000 N’000 N’000 N’000 N’000
Deposits from banks 10,055,551 70,932 3,513 - 84,256 10,214,252
Deposits from customer 200,756,336 201,521,576 1,517,068 15,528,958 25,246 419,349,184
Derivative financial instruments-liabilities 7,095,310 - - - - 7,095,310
Other liabilities(excluding accruals) 32,006,288 26,733,708 68,641 159,610 - 58,968,247
Total financial liabilities 249,913,484 228,326,216 1,589,222 15,688,569 109,502 495,626,993
Net financial position 92,212,049 (10,806,406) (65,820) 8,760,400 27,248 90,127,470
Credit commitments and other financial facilities 15,873,080 36,880,628 2,196,342 6,451 29,121 54,985,622
Notes to the Consolidated & Separate Financial Statements
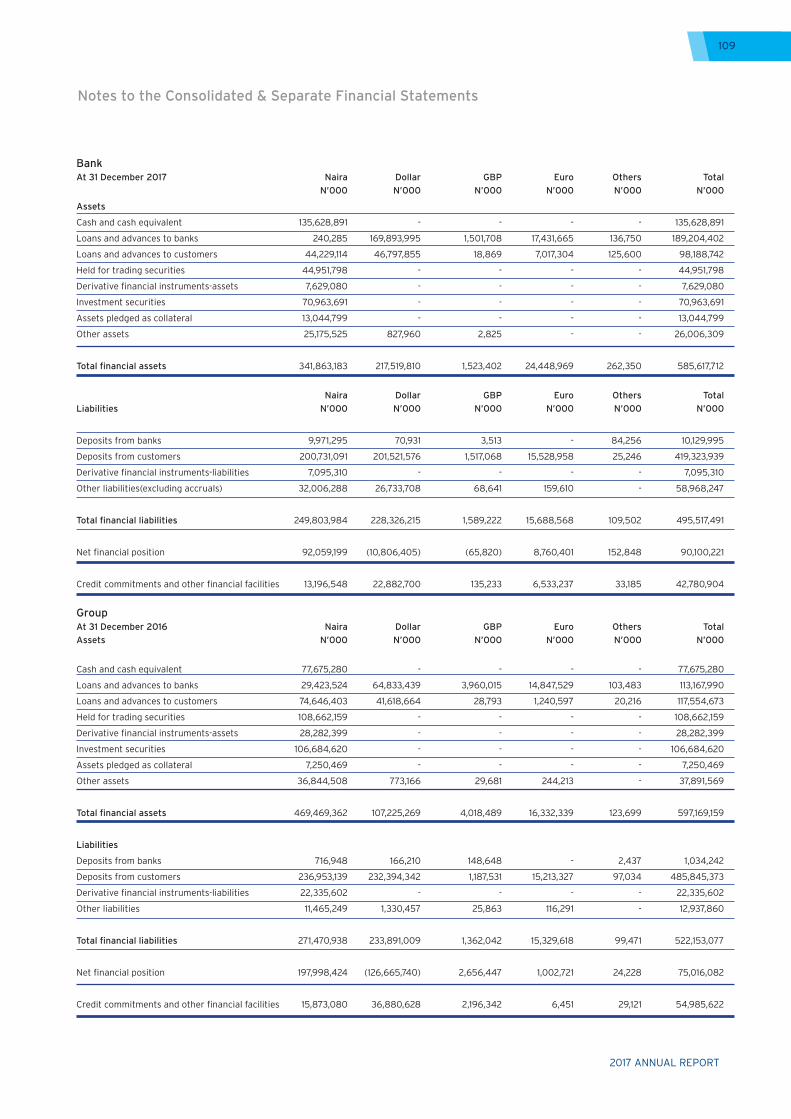
2017 ANNUAL REPORT
109
Bank At 31 December 2017 Naira Dollar GBP Euro Others Total N’000 N’000 N’000 N’000 N’000 N’000
Assets
Cash and cash equivalent 135,628,891 - - - - 135,628,891
Loans and advances to banks 240,285 169,893,995 1,501,708 17,431,665 136,750 189,204,402
Loans and advances to customers 44,229,114 46,797,855 18,869 7,017,304 125,600 98,188,742
Held for trading securities 44,951,798 - - - - 44,951,798
Derivative financial instruments-assets 7,629,080 - - - - 7,629,080
Investment securities 70,963,691 - - - - 70,963,691
Assets pledged as collateral 13,044,799 - - - - 13,044,799
Other assets 25,175,525 827,960 2,825 - - 26,006,309
Total financial assets 341,863,183 217,519,810 1,523,402 24,448,969 262,350 585,617,712
Naira Dollar GBP Euro Others TotalLiabilities N’000 N’000 N’000 N’000 N’000 N’000
Deposits from banks 9,971,295 70,931 3,513 - 84,256 10,129,995
Deposits from customers 200,731,091 201,521,576 1,517,068 15,528,958 25,246 419,323,939
Derivative financial instruments-liabilities 7,095,310 - - - - 7,095,310
Other liabilities(excluding accruals) 32,006,288 26,733,708 68,641 159,610 - 58,968,247
Total financial liabilities 249,803,984 228,326,215 1,589,222 15,688,568 109,502 495,517,491
Net financial position 92,059,199 (10,806,405) (65,820) 8,760,401 152,848 90,100,221
Credit commitments and other financial facilities 13,196,548 22,882,700 135,233 6,533,237 33,185 42,780,904
Group At 31 December 2016 Naira Dollar GBP Euro Others TotalAssets N’000 N’000 N’000 N’000 N’000 N’000
Cash and cash equivalent 77,675,280 - - - - 77,675,280
Loans and advances to banks 29,423,524 64,833,439 3,960,015 14,847,529 103,483 113,167,990
Loans and advances to customers 74,646,403 41,618,664 28,793 1,240,597 20,216 117,554,673
Held for trading securities 108,662,159 - - - - 108,662,159
Derivative financial instruments-assets 28,282,399 - - - - 28,282,399
Investment securities 106,684,620 - - - - 106,684,620
Assets pledged as collateral 7,250,469 - - - - 7,250,469
Other assets 36,844,508 773,166 29,681 244,213 - 37,891,569
Total financial assets 469,469,362 107,225,269 4,018,489 16,332,339 123,699 597,169,159
Liabilities
Deposits from banks 716,948 166,210 148,648 - 2,437 1,034,242
Deposits from customers 236,953,139 232,394,342 1,187,531 15,213,327 97,034 485,845,373
Derivative financial instruments-liabilities 22,335,602 - - - - 22,335,602
Other liabilities 11,465,249 1,330,457 25,863 116,291 - 12,937,860
Total financial liabilities 271,470,938 233,891,009 1,362,042 15,329,618 99,471 522,153,077
Net financial position 197,998,424 (126,665,740) 2,656,447 1,002,721 24,228 75,016,082
Credit commitments and other financial facilities 15,873,080 36,880,628 2,196,342 6,451 29,121 54,985,622
Notes to the Consolidated & Separate Financial Statements
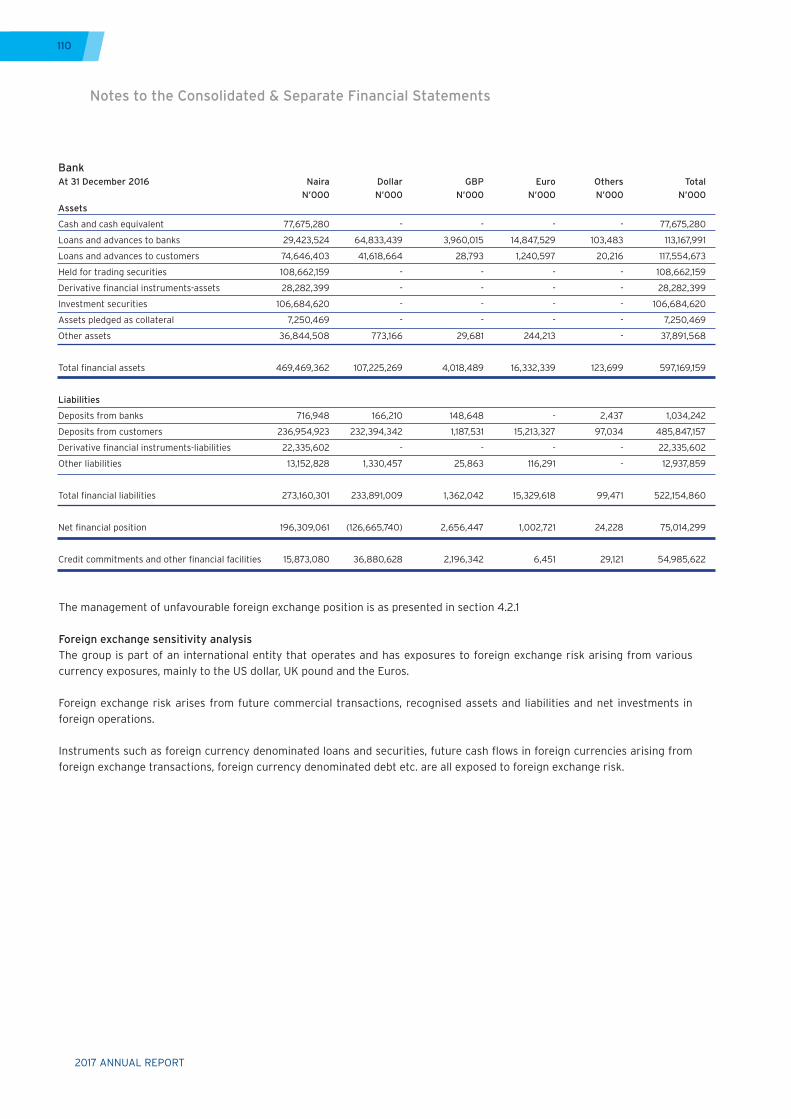
2017 ANNUAL REPORT
110
Bank At 31 December 2016 Naira Dollar GBP Euro Others Total N’000 N’000 N’000 N’000 N’000 N’000Assets
Cash and cash equivalent 77,675,280 - - - - 77,675,280
Loans and advances to banks 29,423,524 64,833,439 3,960,015 14,847,529 103,483 113,167,991
Loans and advances to customers 74,646,403 41,618,664 28,793 1,240,597 20,216 117,554,673
Held for trading securities 108,662,159 - - - - 108,662,159
Derivative financial instruments-assets 28,282,399 - - - - 28,282,399
Investment securities 106,684,620 - - - - 106,684,620
Assets pledged as collateral 7,250,469 - - - - 7,250,469
Other assets 36,844,508 773,166 29,681 244,213 - 37,891,568
Total financial assets 469,469,362 107,225,269 4,018,489 16,332,339 123,699 597,169,159
Liabilities
Deposits from banks 716,948 166,210 148,648 - 2,437 1,034,242
Deposits from customers 236,954,923 232,394,342 1,187,531 15,213,327 97,034 485,847,157
Derivative financial instruments-liabilities 22,335,602 - - - - 22,335,602
Other liabilities 13,152,828 1,330,457 25,863 116,291 - 12,937,859
Total financial liabilities 273,160,301 233,891,009 1,362,042 15,329,618 99,471 522,154,860
Net financial position 196,309,061 (126,665,740) 2,656,447 1,002,721 24,228 75,014,299
Credit commitments and other financial facilities 15,873,080 36,880,628 2,196,342 6,451 29,121 54,985,622
The management of unfavourable foreign exchange position is as presented in section 4.2.1
Foreign exchange sensitivity analysisThe group is part of an international entity that operates and has exposures to foreign exchange risk arising from various currency exposures, mainly to the US dollar, UK pound and the Euros.
Foreign exchange risk arises from future commercial transactions, recognised assets and liabilities and net investments in foreign operations.
Instruments such as foreign currency denominated loans and securities, future cash flows in foreign currencies arising from foreign exchange transactions, foreign currency denominated debt etc. are all exposed to foreign exchange risk.
Notes to the Consolidated & Separate Financial Statements
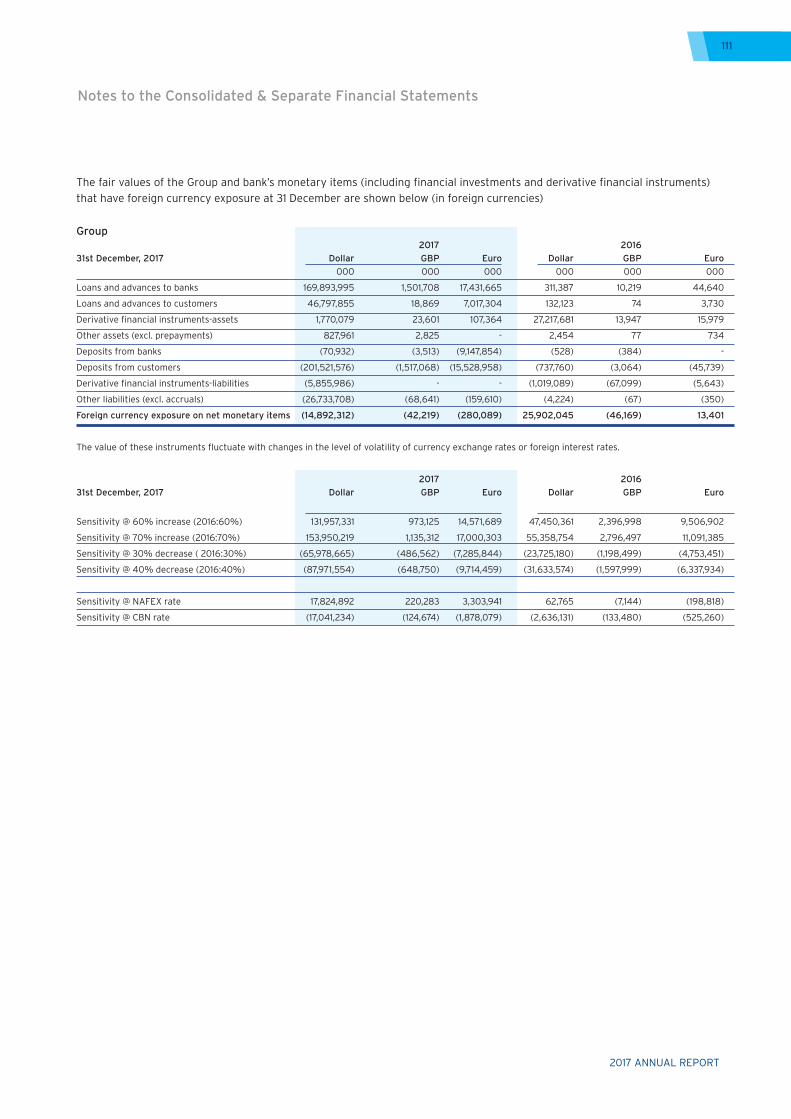
2017 ANNUAL REPORT
111
Group 2017 2016 31st December, 2017 Dollar GBP Euro Dollar GBP Euro 000 000 000 000 000 000
Loans and advances to banks 169,893,995 1,501,708 17,431,665 311,387 10,219 44,640
Loans and advances to customers 46,797,855 18,869 7,017,304 132,123 74 3,730
Derivative financial instruments-assets 1,770,079 23,601 107,364 27,217,681 13,947 15,979
Other assets (excl. prepayments) 827,961 2,825 - 2,454 77 734
Deposits from banks (70,932) (3,513) (9,147,854) (528) (384) -
Deposits from customers (201,521,576) (1,517,068) (15,528,958) (737,760) (3,064) (45,739)
Derivative financial instruments-liabilities (5,855,986) - - (1,019,089) (67,099) (5,643)
Other liabilities (excl. accruals) (26,733,708) (68,641) (159,610) (4,224) (67) (350)
Foreign currency exposure on net monetary items (14,892,312) (42,219) (280,089) 25,902,045 (46,169) 13,401
The value of these instruments fluctuate with changes in the level of volatility of currency exchange rates or foreign interest rates.
2017 2016 31st December, 2017 Dollar GBP Euro Dollar GBP Euro
Sensitivity @ 60% increase (2016:60%) 131,957,331 973,125 14,571,689 47,450,361 2,396,998 9,506,902
Sensitivity @ 70% increase (2016:70%) 153,950,219 1,135,312 17,000,303 55,358,754 2,796,497 11,091,385
Sensitivity @ 30% decrease ( 2016:30%) (65,978,665) (486,562) (7,285,844) (23,725,180) (1,198,499) (4,753,451)
Sensitivity @ 40% decrease (2016:40%) (87,971,554) (648,750) (9,714,459) (31,633,574) (1,597,999) (6,337,934)
Sensitivity @ NAFEX rate 17,824,892 220,283 3,303,941 62,765 (7,144) (198,818)
Sensitivity @ CBN rate (17,041,234) (124,674) (1,878,079) (2,636,131) (133,480) (525,260)
The fair values of the Group and bank’s monetary items (including financial investments and derivative financial instruments) that have foreign currency exposure at 31 December are shown below (in foreign currencies)
Notes to the Consolidated & Separate Financial Statements
2017 ANNUAL REPORT
112
4.2.2 Price risk Price risk is the risk that the fair value of future cash flows of a financial instrument will fluctuate because of changes in
market prices, whether those changes are caused by factors specific to the individual financial instrument or its issuer or by factors affecting all similar financial instruments traded in the market. The Group assess the potential impact that fluctuations of idenfied market risk factors would have on the Group’s income and the value of its holdings of financial instruments.
Price risk management
Non trading portfolios Interest rate risk One of Group’s primary business functions is providing financial products that meet the needs of its customers. Loans
and deposits are tailored to the customers’ requirements with regard to tenor, index, and rate type. Net interest revenue (NIR) is the difference between the yield earned on the non-trading portfolio assets (including customer loans) and the rate paid on the liabilities (including customer deposits or wholesale borrowings). NIR is affected by changes in the level of interest rates. For example:
- At any given time, there may be an unequal amount of assets and liabilities which are subject to market rates due to
maturation or repricing. Whenever the amount of liabilities subject to repricing exceeds the amount of assets subject to repricing, a company is considered “liability sensitive.” In this case, a company’s NIR will deteriorate in a rising rate environment.
- The assets and liabilities of a company may reprice at different speeds or mature at different times, subjecting both “liability-sensitive” and “asset sensitive” companies to NIR sensitivity from changing interest rates. For example, a company may have a large amount of loans that are subject to repricing at a particular period, but the majority of deposits are not scheduled for repricing until the following period. That company would suffer from NIR deterioration if interest rates were to fall.
NIR in the current period is the result of customer transactions and the related contractual rates originated in prior periods as well as new transactions in the current period. Those prior-period transactions will be impacted by changes in rates on floating-rate assets and liabilities in the current period.
Due to the long-term nature of the portfolios, NIR will vary from quarter to quarter even assuming no change in the shape or level of the yield curve as the assets and liabilities reprice. These repricings are a function of implied forward interest rates, which represent the overall market’s unbiased estimate of future interest rates and incorporate possible changes in the overnight rate as well as the shape of the yield curve.
Interest rate risk governance The risks in the Group’s non-traded portfolios are estimated using a common set of standards that define, measure,
limit and report the market risk. Each business is required to establish, with approval from independent market risk management, a market risk limit framework that clearly defines approved risk profiles and is within the parameters of the Group’s overall risk appetite.
In all cases, the businesses are ultimately responsible for the market risks they take and for remaining within their defined limits. These limits are monitored by independent market risk, country and business ALCOs and financial control.
Interest rate risk measurement The principal risk to which non-trading portfolios are exposed is the risk of loss from fluctuations in the future cash
flows or fair values of financial instruments because of a change in market interest rates. Interest rate risk is managed principally through monitoring interest rate gaps and by having pre-approved limits. ALCO is the monitoring body for compliance with these limits and is assisted by Treasury in its day-to-day monitoring activities.
The Group’s principal measure of risk to net interest revenue is interest rate exposure (IRE). IRE measures the change in expected net interest revenue in each currency resulting solely from unanticipated changes in interest rates. Factors
Notes to the Consolidated & Separate Financial Statements
2017 ANNUAL REPORT
113
Notes to the Consolidated & Separate Financial Statements
such as changes in volumes, spreads, margins and the impact of prior-period pricing decisions are not captured by IRE. IRE assumes that businesses make no additional changes in pricing or balances in response to the unanticipated rate changes.
IRE mesures the potential impact on net interest revenue over a specified period, for the accrual positions, from a defined parallel shift in the yield curve. It is a forward-looking measure, analogous to factor sensitivity on the trading portfolios. The IRE measures the potential change of interest rate margin of the Bank for 100 basis points parallel change of interest rate curve in the horizon.
The impact of changing prepayment rates on loan portfolios is incorporated into the results. For example, in the declining interest rate scenarios, it is assumed that mortgage portfolios faster have a faster repayment period and income is reduced. In addition, in a rising interest rate scenario, portions of the deposit portfolio are assumed to experience rate increases that may be less than the change in market interest rates.
Sensitivity analysis interest rate risk The management of interest rate risk against interest rate gap limits is supplemented by monitoring the sensitivity
of the Group’s financial assets and liabilities to specific interest rate scenarios. The sensitivity analysis is the effect of the assumed changes in interest rates on the profit or loss for the period, based on the floating rate non–trading financial assets and financial liabilities held at 31 December 2017. The sensitivity analysis on the non-trading portfolio is measured by the change in DV01(Dollar value of 01) that measures the change in value of the non-trading accrual portfolio due to a 100 basis point parallel move in the interest rates. At 31 December 2017, a 100 basis point parallel increase in the interest rates with all other variables held constant would have resulted to a total loss of N13,386,000 (2016: N472,500). On the available-for-sale investment securities, a 100 basis point parallel increase in the interest rates with all other variables held constant, as at 31 December 2017, would have resulted to an other comprehensive income loss of N20,100,000 (2016: N13,797,000).
Mitigation of Risk All financial institutions’ financial performance is subject to some degree of risk due to changes in interest rates. In
order to manage these risks effectively, the Group may modify pricing on new customer loans and deposits, enter into transactions with other institutions or enter into forward exchange contracts that have the opposite risk exposures. Therefore, the Group regularly assesses the viability of strategies to reduce unacceptable risks to earnings and implements such strategies when the Group believes those actions are prudent. As information becomes available, the Group formulates strategies aimed at protecting earnings from the potential negative effects of changes in interest rates.
The Group employs additional measurements, including stress testing on the impact of non-linear interest rate movements on the value of the balance sheet; the analysis of portfolio duration, volatility and the potential impact of the change in the spread between different market indices.
Trading portfolios Price risk in trading portfolios is monitored using a series of measures, including: - Factor sensitivities - Value-at-Risk (VAR) - Stress testing
i) Factor sensitivities Factor sensitivities are expressed as the change in the value of a position for a defined change in a market risk factor,
such as a change in the price of a treasury bill for a one-basis-point change in interest rates. The Group’s independent market risk management ensures that factor sensitivities are calculated, monitored and, in most cases, limited, for all relevant risks taken in a trading portfolio.
ii) Value-at-Risk (VAR) The Group applies a Value at Risk (VAR) methodology to its trading portfolios to estimate the market risk of positions
held and the maximum losses expected, based upon a number of assumptions for various changes in market conditions.
2017 ANNUAL REPORT
114
VAR is a statistically based estimate of the potential loss on the current portfolio from adverse market movements. The VAR method incorporates the factor sensitivities of the trading portfolio with the volatilities and correlations of those factors and is expressed as the ‘maximum’ amount the Bank might lose over a one-day holding period, at a 99% confidence level. The Group’s VAR is based on the volatilities and correlations among a multitude of market risk factors as well as factors that track the specific issuer risk in debt securities.
As VAR constitutes an integral part of the Group’s market risk control regime, VAR limits are set by the Group’s ALCO, after consultations with Citigroup Independent Risk Management. Actual exposure against limits, together with a bank-wide VAR, is reviewed daily by Treasury. The following table summarises trading price risk by disclosing the VAR exposure as at 31 December:
VAR analysis 2017 2016 N’000 N’000 Interest rate risk 425,412 2,817,124 Foreign currency risk 1,755 39,211 Overall portfolio risk 424,683 2,568,318
The Group periodically performs extensive back-testing of many hypothetical test portfolios as one check of the accuracy of its VAR. Back-testing is the process in which the daily VAR of a portfolio is compared to the actual daily change in the market value of its transactions. Back-testing is conducted to confirm that the daily market value losses in excess of a 99% confidence level occur, on average, only 1% of the time. The VAR calculation for the hypothetical test portfolios, with different degrees of risk concentration, meets these statistical criteria.
iii) Stress testing Stress testing is performed on trading portfolios on a regular basis to estimate the impact of extreme market movements.
It is performed on both individual trading portfolios, and on aggregations of portfolios and businesses. Independent market risk management, in conjunction with the businesses, develops stress scenarios, reviews the output of periodic stress testing exercises, and uses the information to make judgments as to the ongoing appropriateness of exposure levels and limits.
Each trading portfolio has its own market risk limit framework encompassing these measures and other controls, including permitted product lists and a new product approval process for complex products.
The level of price risk exposure at any given point in time depends on the market environment and expectations of future price and market movements, and will vary from period to period.
4.3 Liquidity risk Liquidity risk is the risk that the Group is unable to meet its obligations as and when they fall due without affecting its
daily operations or its financial condition. The Group’s approach to managing liquidity is to ensure, as far as possible, that it always has sufficient liquidity to meet its liabilities when due, under both normal and stressed conditions, without incurring unacceptable losses or risking damage to the bank’s reputation.
Liquidity risk management Management of liquidity at the Group is the responsibility of the Risk Treasurer. There is a uniform liquidity risk
management policy for Citigroup. Under this policy, there is a single set of standards for the measurement of liquidity risk in order to ensure consistency across businesses, stability in methodologies and transparency of risk. Management of liquidity risk is performed on a daily basis and is monitored by the Country Treasurer and independent risk management, combined with an active corporate oversight function.
The Group’s ALCO undertakes this oversight responsibility along with the Country Treasurer. One of the objectives of ALCO is to monitor and review the overall liquidity and balance sheet positions of the Group. The Risk Treasurer must prepare an annual funding and liquidity plan for review by the Country Treasurer and approved by independent risk management. The funding and liquidity plan includes analysis of the statement of financial position, as well as the economic and business conditions impacting the liquidity of the Group. As part of the funding and liquidity plan,
Notes to the Consolidated & Separate Financial Statements
2017 ANNUAL REPORT
115
Notes to the Consolidated & Separate Financial Statements
liquidity limits, liquidity ratios, market triggers, and assumptions for periodic stress tests are established and approved. At a minimum, these parameters are reviewed on an annual basis.
Liquidity limits Liquidity limits establish boundaries for market access in business-as-usual conditions and are monitored against the
liquidity position on a daily basis. These limits are established based on the size of the statement of financial position, depth of the market, experience level of local management, stability of the liabilities and liquidity of the assets. Finally, the limits are subject to evaluation of the Group’s stress test result. Generally, limits are established such that in stress scenarios, the entities are self-funded or net providers of liquidity. Thus, the risk tolerance of the liquidity position is limited based on the capacity to cover the position in a stressed environment. These limits are the key daily risk management tools for Treasury management.
Liquidity sources The Group maintains cash and a portfolio of highly liquid government securities that could be sold or financed on a
secured basis.
Liquidity ratios A series of standard corporate-wide liquidity ratios have been established to monitor the structural elements of the
Group’s liquidity. Ratios are established for liquid assets against short-term obligations. Key liquidity ratios include cash capital (defined as core deposits, long-term debt, and capital compared with illiquid assets), liquid assets against liquidity gaps, core deposits to loans, and deposits to loans. Several measures exist to review potential concentrations of funding by individual name, product, industry, or geography. Triggers for management discussion, which may result in other actions, have been established against these ratios.
The Central Bank of Nigeria requires banks to maintain a statutory minimum liquidity ratio of 30% of liquid assets to all its local currency deposit liabilities. For this purpose, liquid assets comprise cash and balances with Central Bank of Nigeria and other local banks, treasury bills, FGN Bonds, placement and money at call with other banks. Deposit liabilities comprise deposits from customers, deposits from banks. The liquidity ratio at the reporting date 31 December 2017 was 76.47% (2016: 112.52%).
Market triggers: Market triggers are internal, external market or economic factors that may imply a change to market liquidity or
Citigroup’s access to the markets. Citibank Nigeria’s market triggers are monitored on a weekly basis by the Country Treasurer and the head of Risk and are presented to the ALCO at the monthly meeting.
Stress testing: Simulated liquidity stress testing is periodically performed by the Group. A variety of firm-specific and market related
scenarios are used at the consolidated level and in individual businesses. These scenarios include assumptions about significant changes in key funding sources, credit ratings, contingent uses of funding, and political and economic conditions in specific countries. The results of the stress tests are reviewed to ensure that the bank is either a self-funded or net provider of liquidity. In addition, a Contingency Funding Plan is prepared on a periodic basis for Citigroup. The plan includes detailed policies, procedures, roles and responsibilities, and the results of corporate stress tests. The product of these stress tests is a series of alternatives that can be used by the Treasurer in a liquidity event.
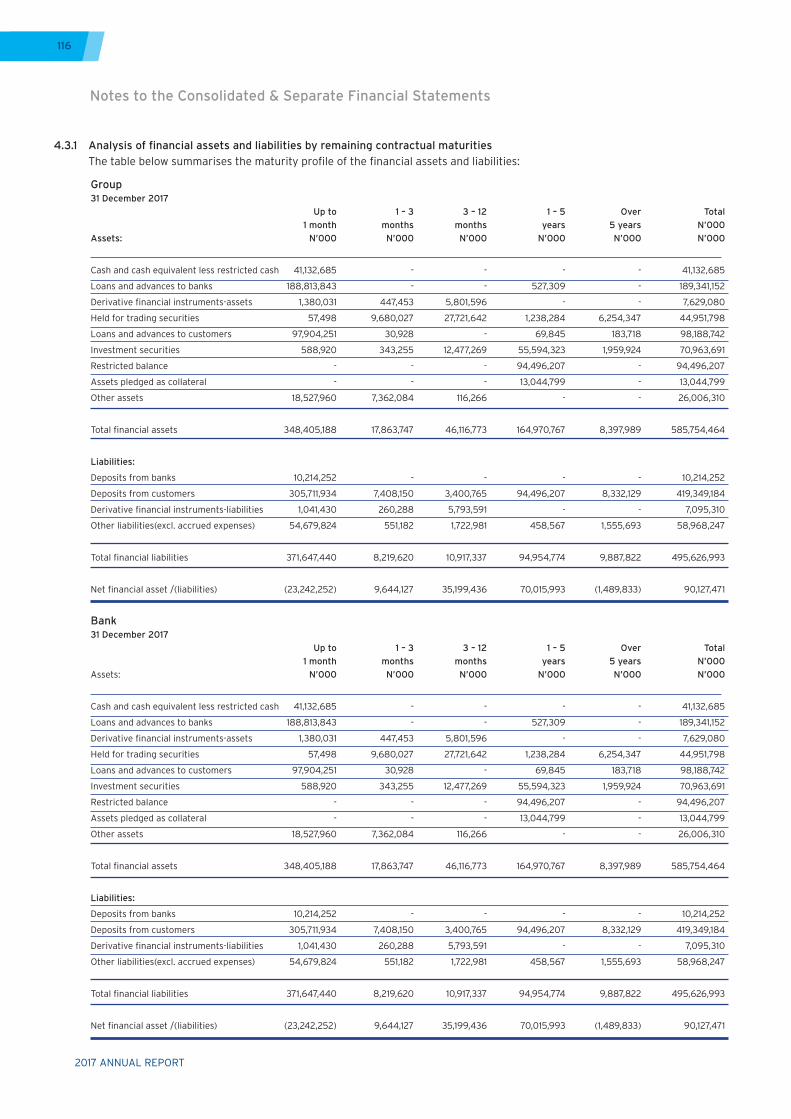
2017 ANNUAL REPORT
116
4.3.1 Analysis of financial assets and liabilities by remaining contractual maturities The table below summarises the maturity profile of the financial assets and liabilities:
Group 31 December 2017 Up to 1 – 3 3 – 12 1 – 5 Over Total 1 month months months years 5 years N’000Assets: N’000 N’000 N’000 N’000 N’000 N’000
Cash and cash equivalent less restricted cash 41,132,685 - - - - 41,132,685
Loans and advances to banks 188,813,843 - - 527,309 - 189,341,152
Derivative financial instruments-assets 1,380,031 447,453 5,801,596 - - 7,629,080
Held for trading securities 57,498 9,680,027 27,721,642 1,238,284 6,254,347 44,951,798
Loans and advances to customers 97,904,251 30,928 - 69,845 183,718 98,188,742
Investment securities 588,920 343,255 12,477,269 55,594,323 1,959,924 70,963,691
Restricted balance - - - 94,496,207 - 94,496,207
Assets pledged as collateral - - - 13,044,799 - 13,044,799
Other assets 18,527,960 7,362,084 116,266 - - 26,006,310
Total financial assets 348,405,188 17,863,747 46,116,773 164,970,767 8,397,989 585,754,464
Liabilities:
Deposits from banks 10,214,252 - - - - 10,214,252
Deposits from customers 305,711,934 7,408,150 3,400,765 94,496,207 8,332,129 419,349,184
Derivative financial instruments-liabilities 1,041,430 260,288 5,793,591 - - 7,095,310
Other liabilities(excl. accrued expenses) 54,679,824 551,182 1,722,981 458,567 1,555,693 58,968,247
Total financial liabilities 371,647,440 8,219,620 10,917,337 94,954,774 9,887,822 495,626,993
Net financial asset /(liabilities) (23,242,252) 9,644,127 35,199,436 70,015,993 (1,489,833) 90,127,471
Bank 31 December 2017 Up to 1 – 3 3 – 12 1 – 5 Over Total 1 month months months years 5 years N’000Assets: N’000 N’000 N’000 N’000 N’000 N’000
Cash and cash equivalent less restricted cash 41,132,685 - - - - 41,132,685
Loans and advances to banks 188,813,843 - - 527,309 - 189,341,152
Derivative financial instruments-assets 1,380,031 447,453 5,801,596 - - 7,629,080
Held for trading securities 57,498 9,680,027 27,721,642 1,238,284 6,254,347 44,951,798
Loans and advances to customers 97,904,251 30,928 - 69,845 183,718 98,188,742
Investment securities 588,920 343,255 12,477,269 55,594,323 1,959,924 70,963,691
Restricted balance - - - 94,496,207 - 94,496,207
Assets pledged as collateral - - - 13,044,799 - 13,044,799
Other assets 18,527,960 7,362,084 116,266 - - 26,006,310
Total financial assets 348,405,188 17,863,747 46,116,773 164,970,767 8,397,989 585,754,464
Liabilities:
Deposits from banks 10,214,252 - - - - 10,214,252
Deposits from customers 305,711,934 7,408,150 3,400,765 94,496,207 8,332,129 419,349,184
Derivative financial instruments-liabilities 1,041,430 260,288 5,793,591 - - 7,095,310
Other liabilities(excl. accrued expenses) 54,679,824 551,182 1,722,981 458,567 1,555,693 58,968,247
Total financial liabilities 371,647,440 8,219,620 10,917,337 94,954,774 9,887,822 495,626,993
Net financial asset /(liabilities) (23,242,252) 9,644,127 35,199,436 70,015,993 (1,489,833) 90,127,471
Notes to the Consolidated & Separate Financial Statements
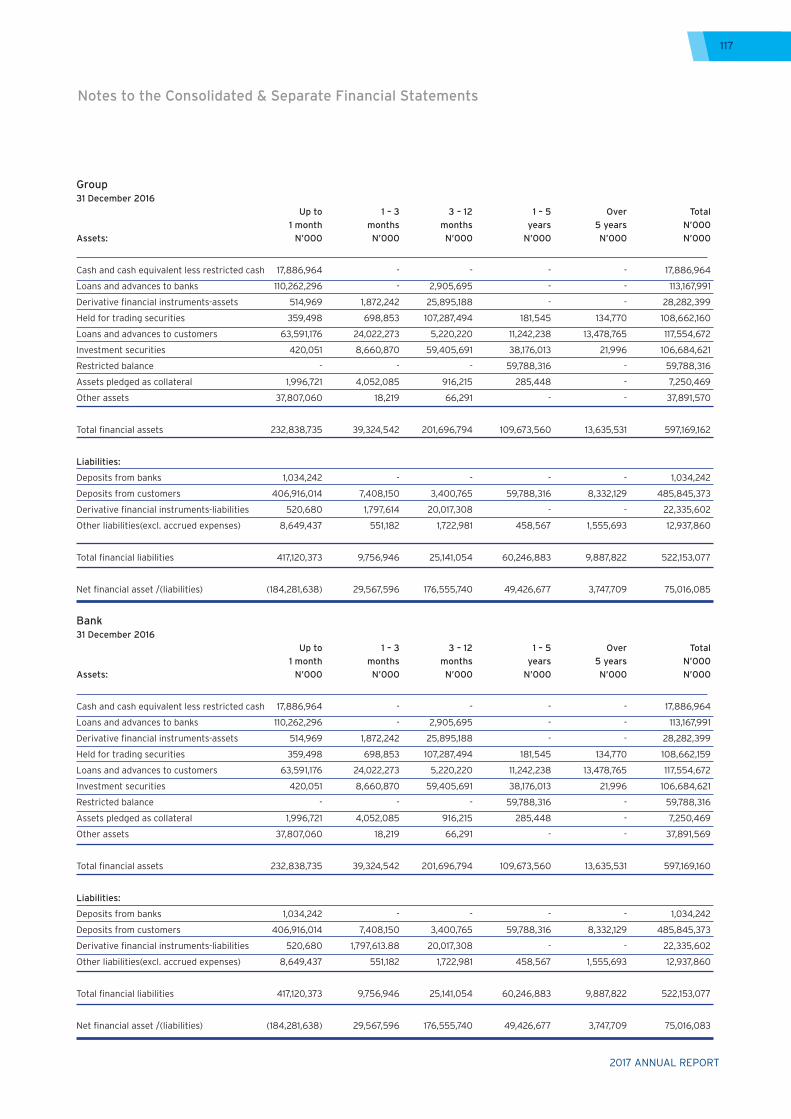
2017 ANNUAL REPORT
117
Notes to the Consolidated & Separate Financial Statements
Group 31 December 2016 Up to 1 – 3 3 – 12 1 – 5 Over Total 1 month months months years 5 years N’000Assets: N’000 N’000 N’000 N’000 N’000 N’000
Cash and cash equivalent less restricted cash 17,886,964 - - - - 17,886,964
Loans and advances to banks 110,262,296 - 2,905,695 - - 113,167,991
Derivative financial instruments-assets 514,969 1,872,242 25,895,188 - - 28,282,399
Held for trading securities 359,498 698,853 107,287,494 181,545 134,770 108,662,160
Loans and advances to customers 63,591,176 24,022,273 5,220,220 11,242,238 13,478,765 117,554,672
Investment securities 420,051 8,660,870 59,405,691 38,176,013 21,996 106,684,621
Restricted balance - - - 59,788,316 - 59,788,316
Assets pledged as collateral 1,996,721 4,052,085 916,215 285,448 - 7,250,469
Other assets 37,807,060 18,219 66,291 - - 37,891,570
Total financial assets 232,838,735 39,324,542 201,696,794 109,673,560 13,635,531 597,169,162
Liabilities:
Deposits from banks 1,034,242 - - - - 1,034,242
Deposits from customers 406,916,014 7,408,150 3,400,765 59,788,316 8,332,129 485,845,373
Derivative financial instruments-liabilities 520,680 1,797,614 20,017,308 - - 22,335,602
Other liabilities(excl. accrued expenses) 8,649,437 551,182 1,722,981 458,567 1,555,693 12,937,860
Total financial liabilities 417,120,373 9,756,946 25,141,054 60,246,883 9,887,822 522,153,077
Net financial asset /(liabilities) (184,281,638) 29,567,596 176,555,740 49,426,677 3,747,709 75,016,085
Bank 31 December 2016 Up to 1 – 3 3 – 12 1 – 5 Over Total 1 month months months years 5 years N’000Assets: N’000 N’000 N’000 N’000 N’000 N’000
Cash and cash equivalent less restricted cash 17,886,964 - - - - 17,886,964
Loans and advances to banks 110,262,296 - 2,905,695 - - 113,167,991
Derivative financial instruments-assets 514,969 1,872,242 25,895,188 - - 28,282,399
Held for trading securities 359,498 698,853 107,287,494 181,545 134,770 108,662,159
Loans and advances to customers 63,591,176 24,022,273 5,220,220 11,242,238 13,478,765 117,554,672
Investment securities 420,051 8,660,870 59,405,691 38,176,013 21,996 106,684,621
Restricted balance - - - 59,788,316 - 59,788,316
Assets pledged as collateral 1,996,721 4,052,085 916,215 285,448 - 7,250,469
Other assets 37,807,060 18,219 66,291 - - 37,891,569
Total financial assets 232,838,735 39,324,542 201,696,794 109,673,560 13,635,531 597,169,160
Liabilities:
Deposits from banks 1,034,242 - - - - 1,034,242
Deposits from customers 406,916,014 7,408,150 3,400,765 59,788,316 8,332,129 485,845,373
Derivative financial instruments-liabilities 520,680 1,797,613.88 20,017,308 - - 22,335,602
Other liabilities(excl. accrued expenses) 8,649,437 551,182 1,722,981 458,567 1,555,693 12,937,860
Total financial liabilities 417,120,373 9,756,946 25,141,054 60,246,883 9,887,822 522,153,077
Net financial asset /(liabilities) (184,281,638) 29,567,596 176,555,740 49,426,677 3,747,709 75,016,083
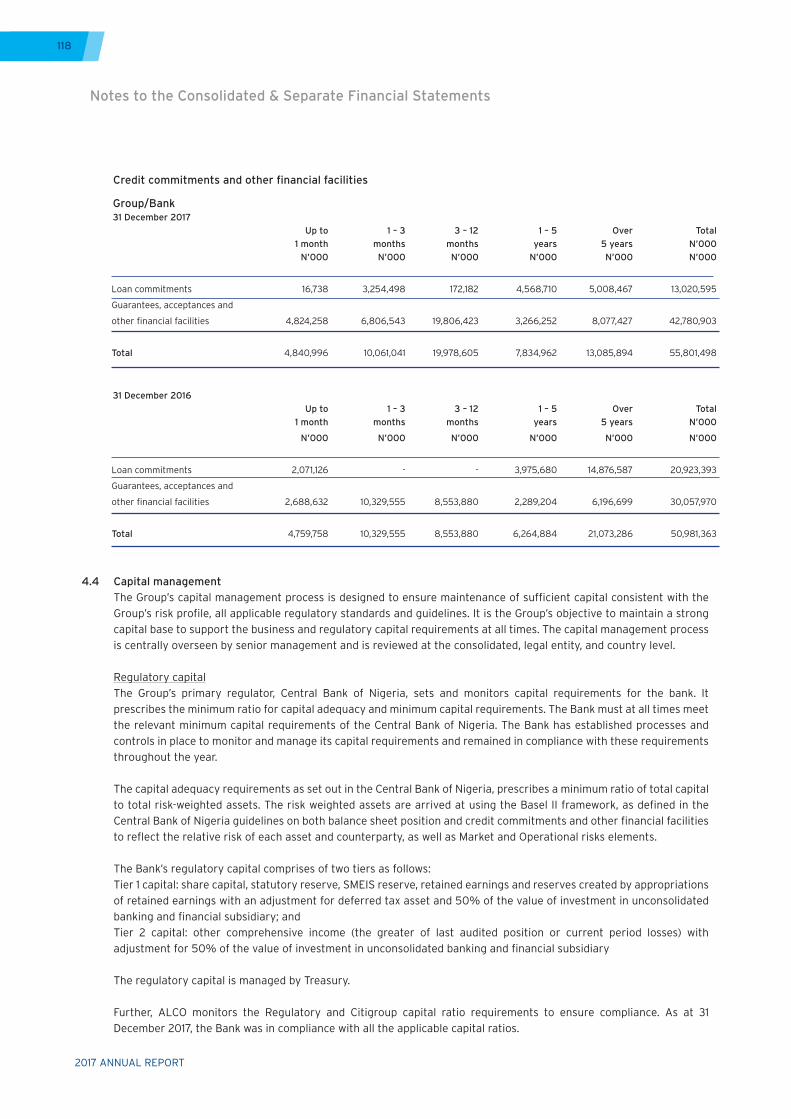
2017 ANNUAL REPORT
118
Group/Bank 31 December 2017
Up to 1 – 3 3 – 12 1 – 5 Over Total 1 month months months years 5 years N’000 N’000 N’000 N’000 N’000 N’000 N’000
Loan commitments 16,738 3,254,498 172,182 4,568,710 5,008,467 13,020,595
Guarantees, acceptances and
other financial facilities 4,824,258 6,806,543 19,806,423 3,266,252 8,077,427 42,780,903
Total 4,840,996 10,061,041 19,978,605 7,834,962 13,085,894 55,801,498
31 December 2016 Up to 1 – 3 3 – 12 1 – 5 Over Total 1 month months months years 5 years N’000
N’000 N’000 N’000 N’000 N’000 N’000
Loan commitments 2,071,126 - - 3,975,680 14,876,587 20,923,393
Guarantees, acceptances and
other financial facilities 2,688,632 10,329,555 8,553,880 2,289,204 6,196,699 30,057,970
Total 4,759,758 10,329,555 8,553,880 6,264,884 21,073,286 50,981,363
4.4 Capital management The Group’s capital management process is designed to ensure maintenance of sufficient capital consistent with the
Group’s risk profile, all applicable regulatory standards and guidelines. It is the Group’s objective to maintain a strong capital base to support the business and regulatory capital requirements at all times. The capital management process is centrally overseen by senior management and is reviewed at the consolidated, legal entity, and country level.
Regulatory capital The Group’s primary regulator, Central Bank of Nigeria, sets and monitors capital requirements for the bank. It
prescribes the minimum ratio for capital adequacy and minimum capital requirements. The Bank must at all times meet the relevant minimum capital requirements of the Central Bank of Nigeria. The Bank has established processes and controls in place to monitor and manage its capital requirements and remained in compliance with these requirements throughout the year.
The capital adequacy requirements as set out in the Central Bank of Nigeria, prescribes a minimum ratio of total capital to total risk-weighted assets. The risk weighted assets are arrived at using the Basel II framework, as defined in the Central Bank of Nigeria guidelines on both balance sheet position and credit commitments and other financial facilities to reflect the relative risk of each asset and counterparty, as well as Market and Operational risks elements.
The Bank’s regulatory capital comprises of two tiers as follows: Tier 1 capital: share capital, statutory reserve, SMEIS reserve, retained earnings and reserves created by appropriations
of retained earnings with an adjustment for deferred tax asset and 50% of the value of investment in unconsolidated banking and financial subsidiary; and
Tier 2 capital: other comprehensive income (the greater of last audited position or current period losses) with adjustment for 50% of the value of investment in unconsolidated banking and financial subsidiary
The regulatory capital is managed by Treasury.
Further, ALCO monitors the Regulatory and Citigroup capital ratio requirements to ensure compliance. As at 31 December 2017, the Bank was in compliance with all the applicable capital ratios.
Credit commitments and other financial facilities
Notes to the Consolidated & Separate Financial Statements
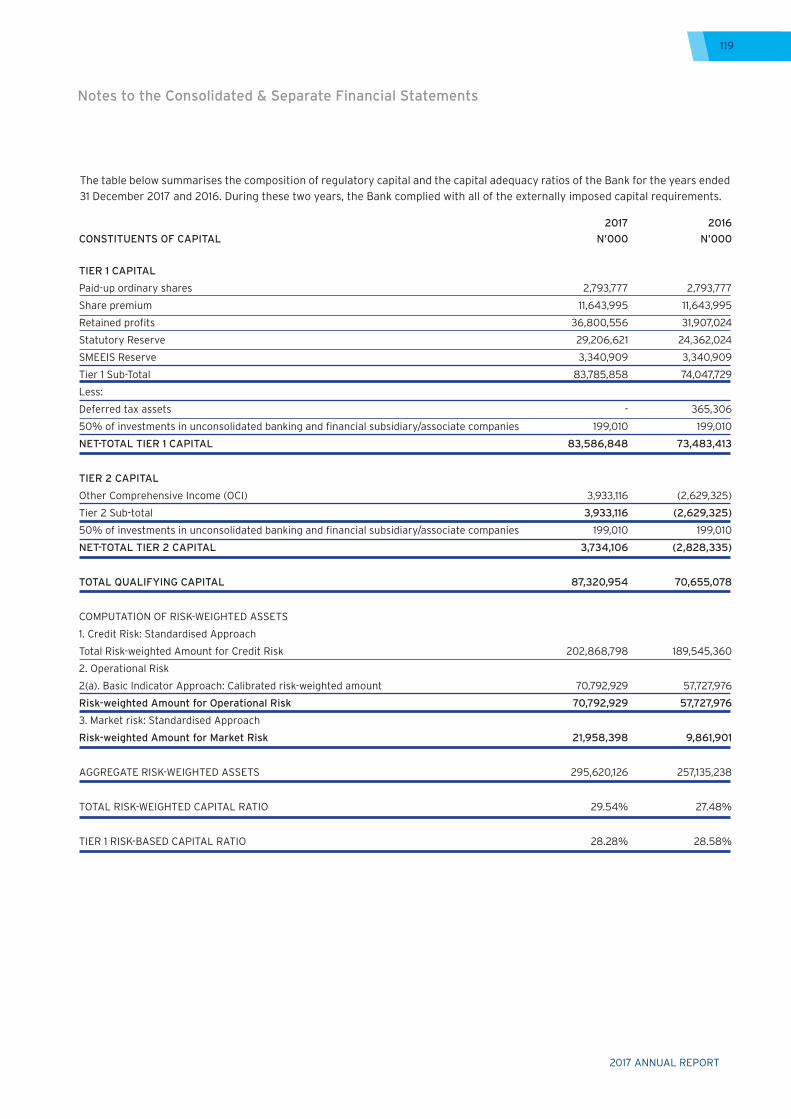
2017 ANNUAL REPORT
119
Notes to the Consolidated & Separate Financial Statements
2017 2016 CONSTITUENTS OF CAPITAL N’000 N’000 TIER 1 CAPITAL
Paid-up ordinary shares 2,793,777 2,793,777
Share premium 11,643,995 11,643,995
Retained profits 36,800,556 31,907,024
Statutory Reserve 29,206,621 24,362,024
SMEEIS Reserve 3,340,909 3,340,909
Tier 1 Sub-Total 83,785,858 74,047,729
Less:
Deferred tax assets - 365,306
50% of investments in unconsolidated banking and financial subsidiary/associate companies 199,010 199,010
NET-TOTAL TIER 1 CAPITAL 83,586,848 73,483,413
TIER 2 CAPITAL
Other Comprehensive Income (OCI) 3,933,116 (2,629,325)
Tier 2 Sub-total 3,933,116 (2,629,325)
50% of investments in unconsolidated banking and financial subsidiary/associate companies 199,010 199,010
NET-TOTAL TIER 2 CAPITAL 3,734,106 (2,828,335)
TOTAL QUALIFYING CAPITAL 87,320,954 70,655,078
COMPUTATION OF RISK-WEIGHTED ASSETS
1. Credit Risk: Standardised Approach
Total Risk-weighted Amount for Credit Risk 202,868,798 189,545,360
2. Operational Risk
2(a). Basic Indicator Approach: Calibrated risk-weighted amount 70,792,929 57,727,976
Risk-weighted Amount for Operational Risk 70,792,929 57,727,976
3. Market risk: Standardised Approach
Risk-weighted Amount for Market Risk 21,958,398 9,861,901
AGGREGATE RISK-WEIGHTED ASSETS 295,620,126 257,135,238
TOTAL RISK-WEIGHTED CAPITAL RATIO 29.54% 27.48%
TIER 1 RISK-BASED CAPITAL RATIO 28.28% 28.58%
The table below summarises the composition of regulatory capital and the capital adequacy ratios of the Bank for the years ended 31 December 2017 and 2016. During these two years, the Bank complied with all of the externally imposed capital requirements.
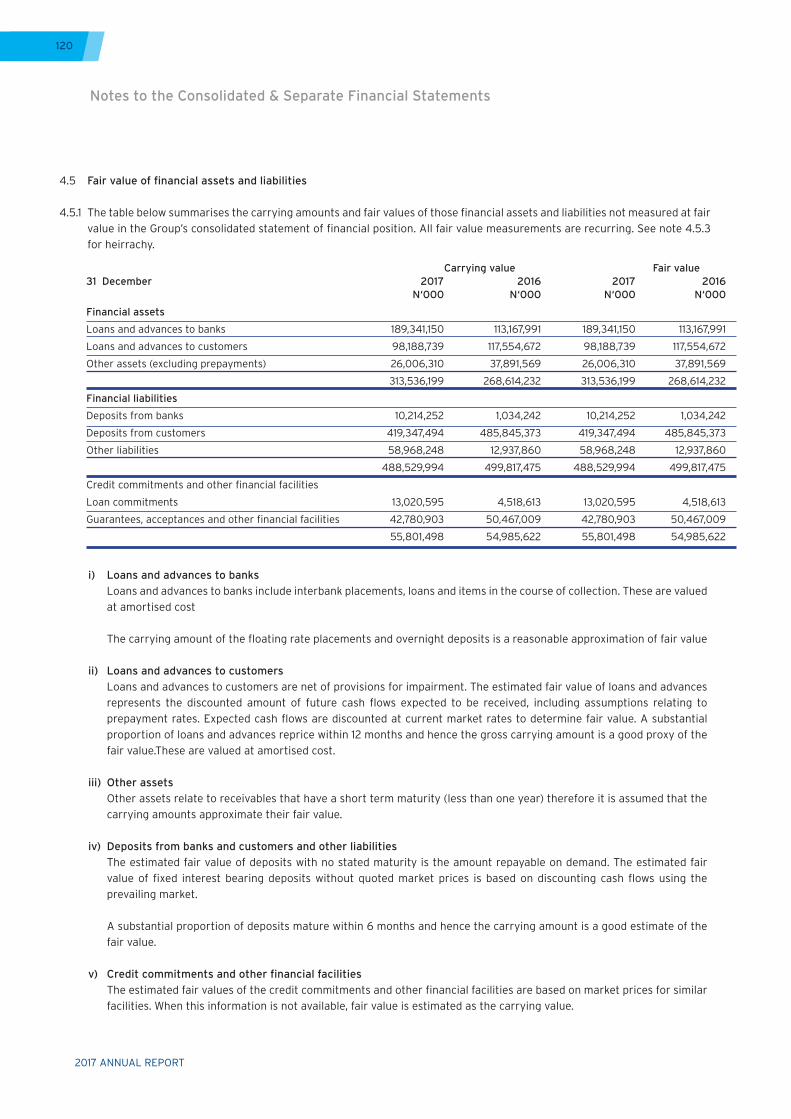
2017 ANNUAL REPORT
120
Carrying value Fair value 31 December 2017 2016 2017 2016 N‘000 N‘000 N‘000 N‘000
Financial assets
Loans and advances to banks 189,341,150 113,167,991 189,341,150 113,167,991
Loans and advances to customers 98,188,739 117,554,672 98,188,739 117,554,672
Other assets (excluding prepayments) 26,006,310 37,891,569 26,006,310 37,891,569
313,536,199 268,614,232 313,536,199 268,614,232
Financial liabilities
Deposits from banks 10,214,252 1,034,242 10,214,252 1,034,242
Deposits from customers 419,347,494 485,845,373 419,347,494 485,845,373
Other liabilities 58,968,248 12,937,860 58,968,248 12,937,860
488,529,994 499,817,475 488,529,994 499,817,475
Credit commitments and other financial facilities
Loan commitments 13,020,595 4,518,613 13,020,595 4,518,613
Guarantees, acceptances and other financial facilities 42,780,903 50,467,009 42,780,903 50,467,009
55,801,498 54,985,622 55,801,498 54,985,622
4.5 Fair value of financial assets and liabilities
4.5.1 The table below summarises the carrying amounts and fair values of those financial assets and liabilities not measured at fair value in the Group’s consolidated statement of financial position. All fair value measurements are recurring. See note 4.5.3 for heirrachy.
i) Loans and advances to banks Loans and advances to banks include interbank placements, loans and items in the course of collection. These are valued
at amortised cost
The carrying amount of the floating rate placements and overnight deposits is a reasonable approximation of fair value
ii) Loans and advances to customers Loans and advances to customers are net of provisions for impairment. The estimated fair value of loans and advances
represents the discounted amount of future cash flows expected to be received, including assumptions relating to prepayment rates. Expected cash flows are discounted at current market rates to determine fair value. A substantial proportion of loans and advances reprice within 12 months and hence the gross carrying amount is a good proxy of the fair value.These are valued at amortised cost.
iii) Other assets Other assets relate to receivables that have a short term maturity (less than one year) therefore it is assumed that the
carrying amounts approximate their fair value.
iv) Deposits from banks and customers and other liabilities The estimated fair value of deposits with no stated maturity is the amount repayable on demand. The estimated fair
value of fixed interest bearing deposits without quoted market prices is based on discounting cash flows using the prevailing market.
A substantial proportion of deposits mature within 6 months and hence the carrying amount is a good estimate of the fair value.
v) Credit commitments and other financial facilities The estimated fair values of the credit commitments and other financial facilities are based on market prices for similar
facilities. When this information is not available, fair value is estimated as the carrying value.
Notes to the Consolidated & Separate Financial Statements
2017 ANNUAL REPORT
121
Notes to the Consolidated & Separate Financial Statements
4.5.2 Fair value hierarchy The Group measures fair values using the following fair value hierarchy that reflects the significance of the inputs
used in making the measurements:
Level 1: Quoted market price (unadjusted) in an active market for an identical instrument.
Level 2: Valuation techniques based on observable inputs, either directly (i.e. as prices) or indirectly (i.e. derived from prices). This category includes instruments valued using: quoted market prices in active markets for similar instruments; quoted for identical or similar instruments in markets that are considered less than active; or other valuation techniques where all significant inputs are directly or indirectly observable from market data.
Level 3: Valuation techniques using significant unobservable inputs. This category includes all instruments where the valuation technique includes inputs not based on observable data and the unobservable inputs have a significant effect on the instrument’s valuation. This category includes instruments that are valued based on quoted prices for similar instruments where significant unobservable adjustments or assumptions are required to reflect the difference between the instruments.
The Group uses the following procedures to determine the fair value of financial assets and liabilities:
Trading securities Where available, the Group uses the quoted market prices to determine the fair value of trading assets and such
items are classified as Level 1 of the fair value hierarchy.
Where there are securities that are not actively traded, the Group uses internal valuation techniques which are based on observable inputs obtained from the quoted market prices of similiar actively traded securities.
Derivatives The derivatives entered into by the Group are executed over the counter and so are valued using internal valuation
techniques. These derivatives consist of foreign exchange forward contracts and the principal technique used to value these instruments is based on market observable inputs. The valuation techniques include forward pricing based on interpolation of the current interest rates and foreign exchange rates.
The key inputs depend upon the the type of derivative and the nature of underlying instrument and include interest rate yield curves and foreign exchange rates, which are based on observable input therefore classified as Level 2.
Investment securities Investment securities classified as available-for-sale are measured at fair value by reference to quoted market
prices when available and therefore are classified as Level 1. If quoted market prices are not available, the fair values are estimated based on internal valuation techniques. The
key inputs depend upon the type of investment security and the nature of inputs to the valuation technique. The item is placed in either Level 2 or Level 3 depending on the observability of the significant inputs to the model.
Valuation process for Level 3 Fair Value Measurements Price verification procedures and related internal control procedures are governed by the Citibank Pricing and
Price Verification Policy and Standards, which are jointly owned by Finance and Risk Management. Finance has implemented the Pricing and Price Verification Standards and Procedures to facilitate compliance with this policy.
2017 ANNUAL REPORT
122
For fair value measurements of substantially all assets and liabilities held by Citibank, individual business units are responsible for valuing the trading account assets and liabilities, and Product Control within Finance performs independent price verification procedures to evaluate those fair value measurements. Product Control is independent of the individual business units and reports into the Global Head of Product Control, who ultimately reports to the Citibank Chief Financial Officer. Fair value measurements of assets and liabilities are determined using various techniques including, but not limited to, discounted cash flows and internal models, such as option and correlation models.
Based on the observability of inputs used, Product Control classifies the inventory as Level 1, Level 2 or Level 3 within the fair value hierarchy. When a position involves one or more significant inputs that are not directly observable, additional price verification procedures are applied. These procedures may include reviewing relevant historical data, analysing profit and loss, valuing each component of a structured trade individually and benchmarking, amongst others.
Reports of Level 3 inventory of each business line of the bank are distributed to senior management in Finance, Risk and the individual business lines. Reports are also discussed at the EMEA Risk Committee, the Citibank Risk Committee and in monthly meetings with Senior Management. Whenever a valuation adjustment is needed to bring the price of an asset or liability to its exit price, Product Control reports it to management along with other price verification results.
In addition, the pricing models used in measuring fair value are governed by an independent control framework. Although the models are developed and tested by the individual business units, they are independently validated by the Model Validation Group within Model Risk Management and reviewed by Finance with respect to their impact on the price verification procedures. The purpose of this independent control framework is to assess model risk arising from models’ theoretical soundness, calibration techniques where needed, and the appropriateness of the model for a specific product in a defined market. To ensure their continued applicability, models are independently reviewed annually. In addition, Risk Management approves and maintains a list of products permitted to be valued under each approved model for a given business.
Transfers into or out of Level 1 - 3 are primarily driven by changes in the availability of independent data for positions where the Company has risk exposure, yet the market is no longer considered to be active. As liquidity and transparency improves, the financial instrument may transfer back to a previous classification level.
Unobservable inputs During the year, for investment securities, total changes in fair value, representing a gain of N5,084,633,000 (2016:
N4,338,435,000) were recognised in the profit and loss account relating to items where fair value was estimated using a valuation technique that incorporated one or more significant inputs based on unobservable market data. As these valuation techniques were based upon assumptions, changing the assumptions would change the estimate of fair value.
The methodology used to derive the impact across each product is determined by applying adjustments to the price or significant model input parameters used in the valuation.
Notes to the Consolidated & Separate Financial Statements
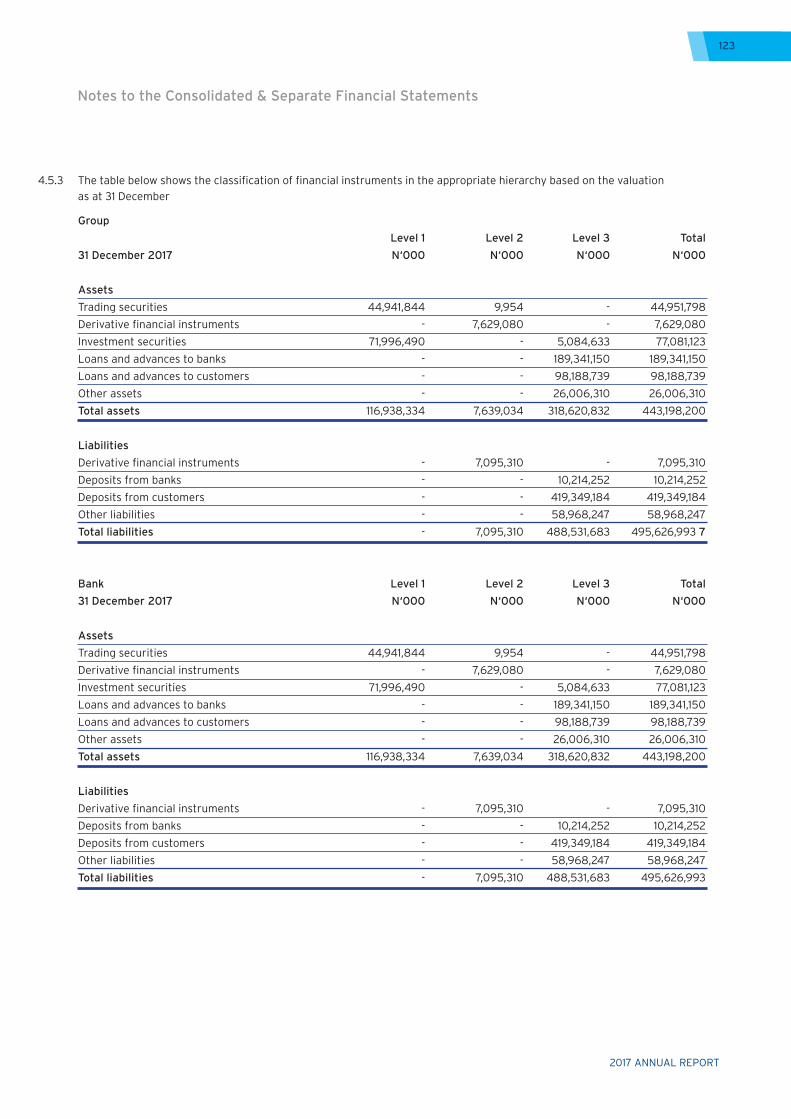
2017 ANNUAL REPORT
123
Notes to the Consolidated & Separate Financial Statements
Group
Level 1 Level 2 Level 3 Total
31 December 2017 N‘000 N‘000 N‘000 N‘000
Assets
Trading securities 44,941,844 9,954 - 44,951,798
Derivative financial instruments - 7,629,080 - 7,629,080
Investment securities 71,996,490 - 5,084,633 77,081,123
Loans and advances to banks - - 189,341,150 189,341,150
Loans and advances to customers - - 98,188,739 98,188,739
Other assets - - 26,006,310 26,006,310
Total assets 116,938,334 7,639,034 318,620,832 443,198,200
Liabilities
Derivative financial instruments - 7,095,310 - 7,095,310
Deposits from banks - - 10,214,252 10,214,252
Deposits from customers - - 419,349,184 419,349,184
Other liabilities - - 58,968,247 58,968,247
Total liabilities - 7,095,310 488,531,683 495,626,993 7
Bank Level 1 Level 2 Level 3 Total
31 December 2017 N‘000 N‘000 N‘000 N‘000
Assets
Trading securities 44,941,844 9,954 - 44,951,798
Derivative financial instruments - 7,629,080 - 7,629,080
Investment securities 71,996,490 - 5,084,633 77,081,123
Loans and advances to banks - - 189,341,150 189,341,150
Loans and advances to customers - - 98,188,739 98,188,739
Other assets - - 26,006,310 26,006,310
Total assets 116,938,334 7,639,034 318,620,832 443,198,200
Liabilities
Derivative financial instruments - 7,095,310 - 7,095,310
Deposits from banks - - 10,214,252 10,214,252
Deposits from customers - - 419,349,184 419,349,184
Other liabilities - - 58,968,247 58,968,247
Total liabilities - 7,095,310 488,531,683 495,626,993
4.5.3 The table below shows the classification of financial instruments in the appropriate hierarchy based on the valuation as at 31 December
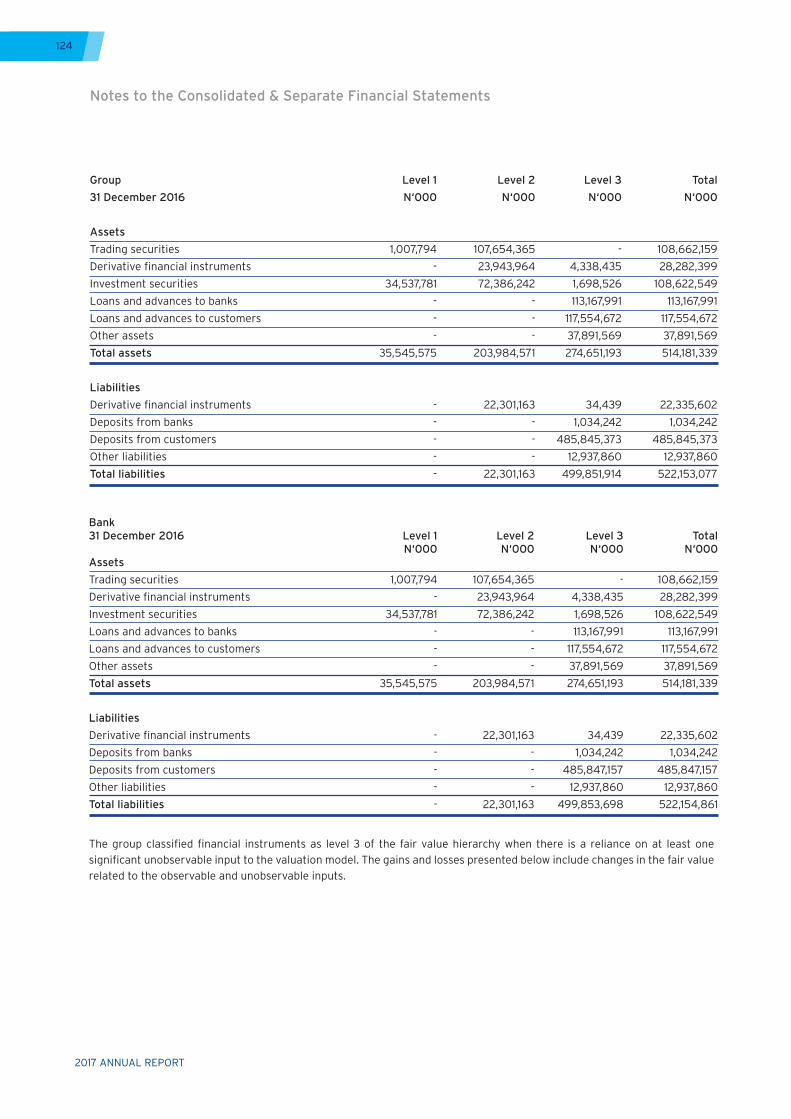
2017 ANNUAL REPORT
124
Bank31 December 2016 Level 1 Level 2 Level 3 Total N‘000 N‘000 N‘000 N‘000Assets
Trading securities 1,007,794 107,654,365 - 108,662,159
Derivative financial instruments - 23,943,964 4,338,435 28,282,399
Investment securities 34,537,781 72,386,242 1,698,526 108,622,549
Loans and advances to banks - - 113,167,991 113,167,991
Loans and advances to customers - - 117,554,672 117,554,672
Other assets - - 37,891,569 37,891,569
Total assets 35,545,575 203,984,571 274,651,193 514,181,339
Liabilities
Derivative financial instruments - 22,301,163 34,439 22,335,602
Deposits from banks - - 1,034,242 1,034,242
Deposits from customers - - 485,847,157 485,847,157
Other liabilities - - 12,937,860 12,937,860
Total liabilities - 22,301,163 499,853,698 522,154,861
Group Level 1 Level 2 Level 3 Total
31 December 2016 N‘000 N‘000 N‘000 N‘000
Assets
Trading securities 1,007,794 107,654,365 - 108,662,159
Derivative financial instruments - 23,943,964 4,338,435 28,282,399
Investment securities 34,537,781 72,386,242 1,698,526 108,622,549
Loans and advances to banks - - 113,167,991 113,167,991
Loans and advances to customers - - 117,554,672 117,554,672
Other assets - - 37,891,569 37,891,569
Total assets 35,545,575 203,984,571 274,651,193 514,181,339
Liabilities
Derivative financial instruments - 22,301,163 34,439 22,335,602
Deposits from banks - - 1,034,242 1,034,242
Deposits from customers - - 485,845,373 485,845,373
Other liabilities - - 12,937,860 12,937,860
Total liabilities - 22,301,163 499,851,914 522,153,077
The group classified financial instruments as level 3 of the fair value hierarchy when there is a reliance on at least one significant unobservable input to the valuation model. The gains and losses presented below include changes in the fair value related to the observable and unobservable inputs.
Notes to the Consolidated & Separate Financial Statements
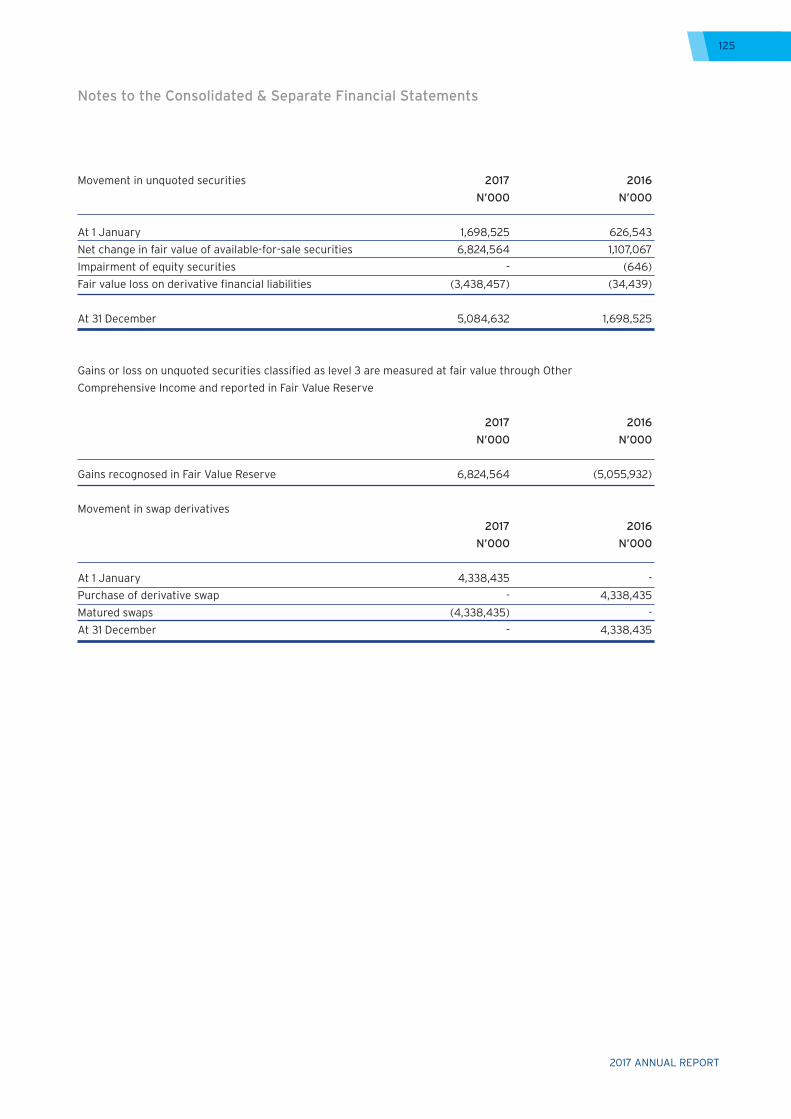
2017 ANNUAL REPORT
125
Notes to the Consolidated & Separate Financial Statements
Movement in unquoted securities 2017 2016
N’000 N’000
At 1 January 1,698,525 626,543
Net change in fair value of available-for-sale securities 6,824,564 1,107,067
Impairment of equity securities - (646)
Fair value loss on derivative financial liabilities (3,438,457) (34,439)
At 31 December 5,084,632 1,698,525
Gains or loss on unquoted securities classified as level 3 are measured at fair value through Other
Comprehensive Income and reported in Fair Value Reserve
2017 2016
N’000 N’000
Gains recognosed in Fair Value Reserve 6,824,564 (5,055,932)
Movement in swap derivatives
2017 2016
N’000 N’000
At 1 January 4,338,435 -
Purchase of derivative swap - 4,338,435
Matured swaps (4,338,435) -
At 31 December - 4,338,435
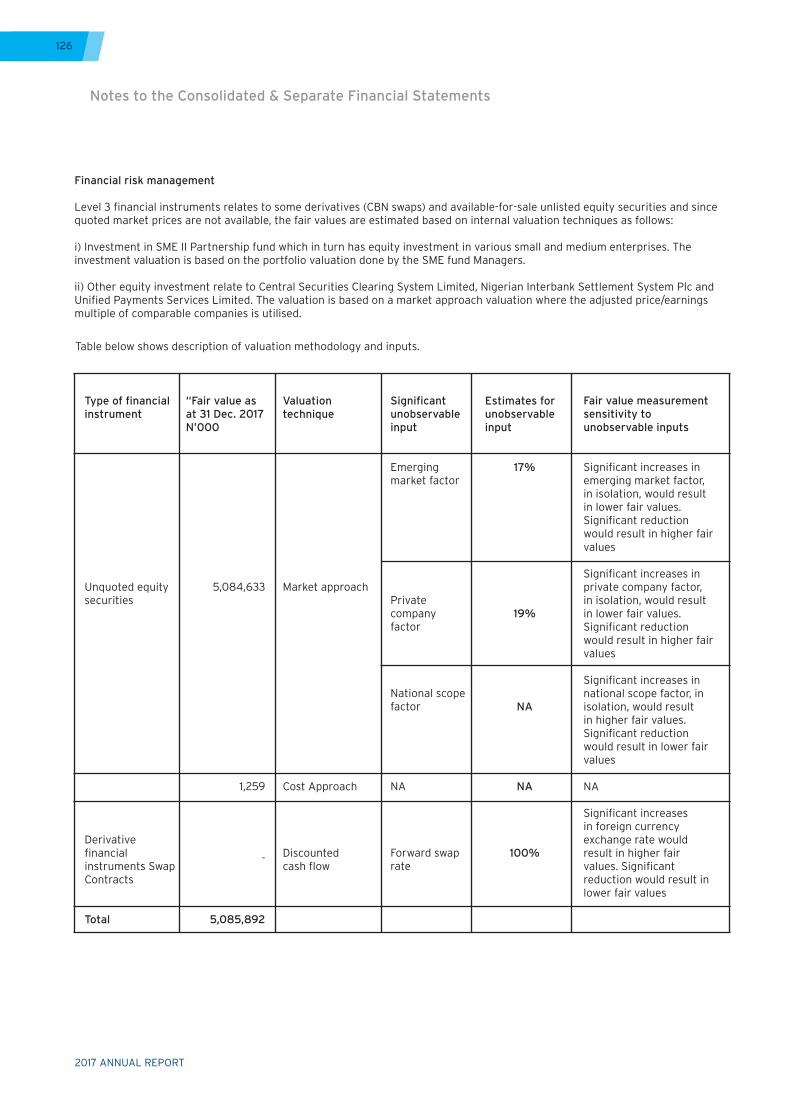
2017 ANNUAL REPORT
126
Financial risk management
Level 3 financial instruments relates to some derivatives (CBN swaps) and available-for-sale unlisted equity securities and since quoted market prices are not available, the fair values are estimated based on internal valuation techniques as follows:
i) Investment in SME II Partnership fund which in turn has equity investment in various small and medium enterprises. The investment valuation is based on the portfolio valuation done by the SME fund Managers.
ii) Other equity investment relate to Central Securities Clearing System Limited, Nigerian Interbank Settlement System Plc and Unified Payments Services Limited. The valuation is based on a market approach valuation where the adjusted price/earnings multiple of comparable companies is utilised.
Table below shows description of valuation methodology and inputs.
Type of financial instrument
Unquoted equity securities
Derivative financial instruments Swap Contracts
Total
Valuation technique
Market approach
Cost Approach
Discounted cash flow
Estimates for unobservable input
17%
19%
NA
NA
100%
“Fair value as at 31 Dec. 2017 N’000
5,084,633
1,259
-
5,085,892
Significant unobservable input
Emerging market factor
Private company factor
National scope factor
NA
Forward swap rate
Fair value measurement sensitivity to unobservable inputs
Significant increases in emerging market factor, in isolation, would result in lower fair values. Significant reduction would result in higher fair values
Significant increases in private company factor, in isolation, would result in lower fair values. Significant reduction would result in higher fair values
Significant increases in national scope factor, in isolation, would result in higher fair values. Significant reduction would result in lower fair values
NA
Significant increases in foreign currency exchange rate would result in higher fair values. Significant reduction would result in lower fair values
Notes to the Consolidated & Separate Financial Statements
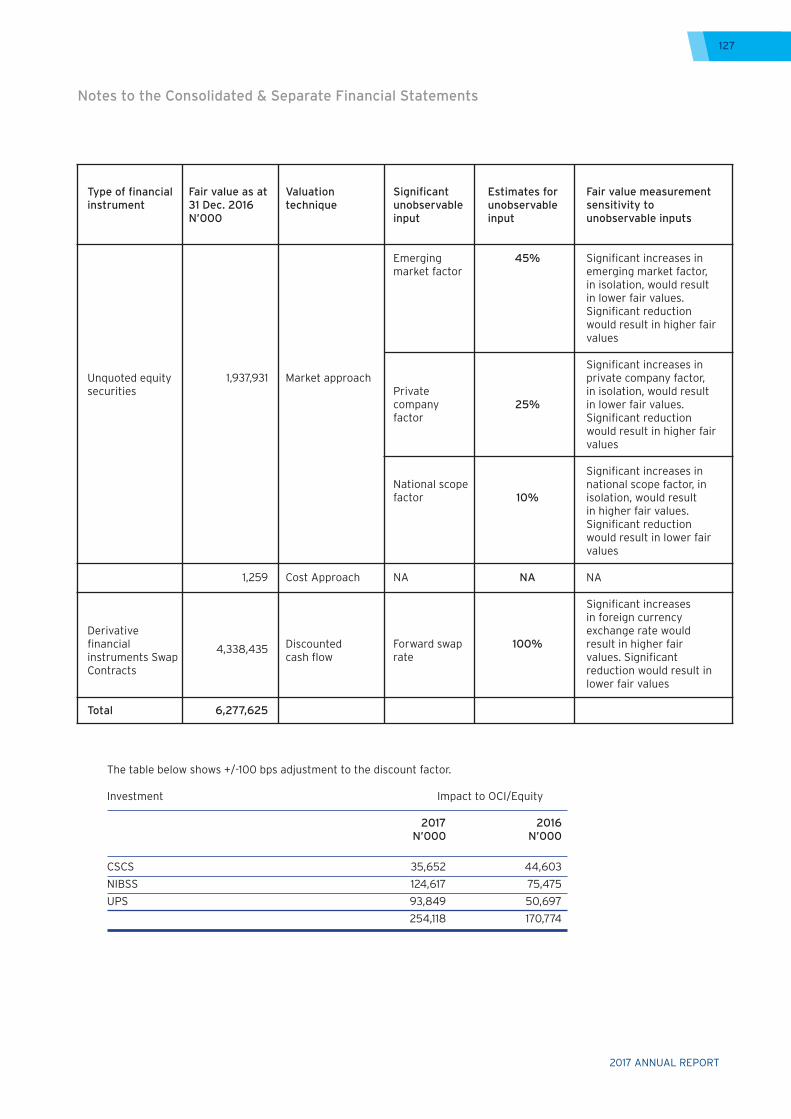
2017 ANNUAL REPORT
127
Notes to the Consolidated & Separate Financial Statements
Type of financial instrument
Unquoted equity securities
Derivative financial instruments Swap Contracts
Total
Valuation technique
Market approach
Cost Approach
Discounted cash flow
Estimates for unobservable input
45%
25%
10%
NA
100%
Fair value as at 31 Dec. 2016 N’000
1,937,931
1,259
4,338,435
6,277,625
Significant unobservable input
Emerging market factor
Private company factor
National scope factor
NA
Forward swap rate
Fair value measurement sensitivity to unobservable inputs
Significant increases in emerging market factor, in isolation, would result in lower fair values. Significant reduction would result in higher fair values
Significant increases in private company factor, in isolation, would result in lower fair values. Significant reduction would result in higher fair values
Significant increases in national scope factor, in isolation, would result in higher fair values. Significant reduction would result in lower fair values
NA
Significant increases in foreign currency exchange rate would result in higher fair values. Significant reduction would result in lower fair values
The table below shows +/-100 bps adjustment to the discount factor.
Investment Impact to OCI/Equity
2017 2016 N’000 N’000
CSCS 35,652 44,603
NIBSS 124,617 75,475
UPS 93,849 50,697
254,118 170,774
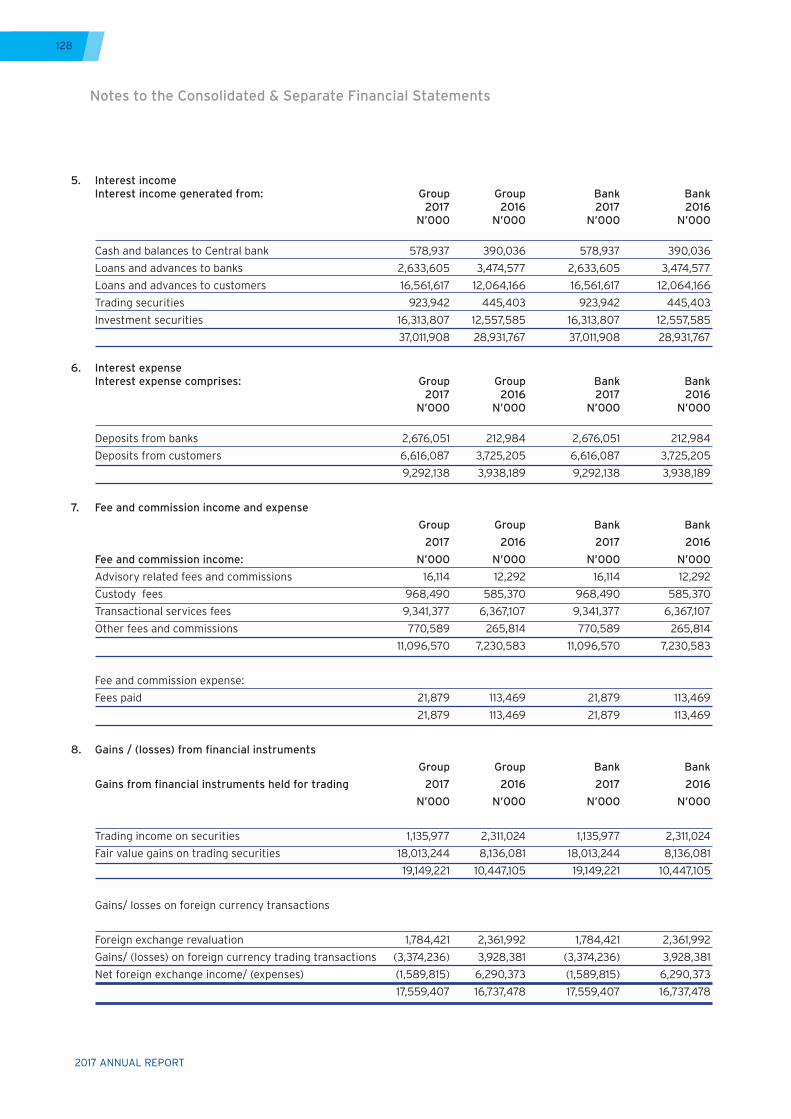
2017 ANNUAL REPORT
128
5. Interest income Interest income generated from: Group Group Bank Bank 2017 2016 2017 2016 N’000 N’000 N’000 N’000
Cash and balances to Central bank 578,937 390,036 578,937 390,036
Loans and advances to banks 2,633,605 3,474,577 2,633,605 3,474,577
Loans and advances to customers 16,561,617 12,064,166 16,561,617 12,064,166
Trading securities 923,942 445,403 923,942 445,403
Investment securities 16,313,807 12,557,585 16,313,807 12,557,585
37,011,908 28,931,767 37,011,908 28,931,767
6. Interest expense Interest expense comprises: Group Group Bank Bank 2017 2016 2017 2016 N’000 N’000 N’000 N’000
Deposits from banks 2,676,051 212,984 2,676,051 212,984
Deposits from customers 6,616,087 3,725,205 6,616,087 3,725,205
9,292,138 3,938,189 9,292,138 3,938,189
7. Fee and commission income and expense
Group Group Bank Bank
2017 2016 2017 2016
Fee and commission income: N’000 N’000 N’000 N’000
Advisory related fees and commissions 16,114 12,292 16,114 12,292
Custody fees 968,490 585,370 968,490 585,370
Transactional services fees 9,341,377 6,367,107 9,341,377 6,367,107
Other fees and commissions 770,589 265,814 770,589 265,814
11,096,570 7,230,583 11,096,570 7,230,583
Fee and commission expense:
Fees paid 21,879 113,469 21,879 113,469
21,879 113,469 21,879 113,469
8. Gains / (losses) from financial instruments
Group Group Bank Bank
Gains from financial instruments held for trading 2017 2016 2017 2016
N’000 N’000 N’000 N’000
Trading income on securities 1,135,977 2,311,024 1,135,977 2,311,024
Fair value gains on trading securities 18,013,244 8,136,081 18,013,244 8,136,081
19,149,221 10,447,105 19,149,221 10,447,105
Gains/ losses on foreign currency transactions
Foreign exchange revaluation 1,784,421 2,361,992 1,784,421 2,361,992
Gains/ (losses) on foreign currency trading transactions (3,374,236) 3,928,381 (3,374,236) 3,928,381
Net foreign exchange income/ (expenses) (1,589,815) 6,290,373 (1,589,815) 6,290,373
17,559,407 16,737,478 17,559,407 16,737,478
Notes to the Consolidated & Separate Financial Statements
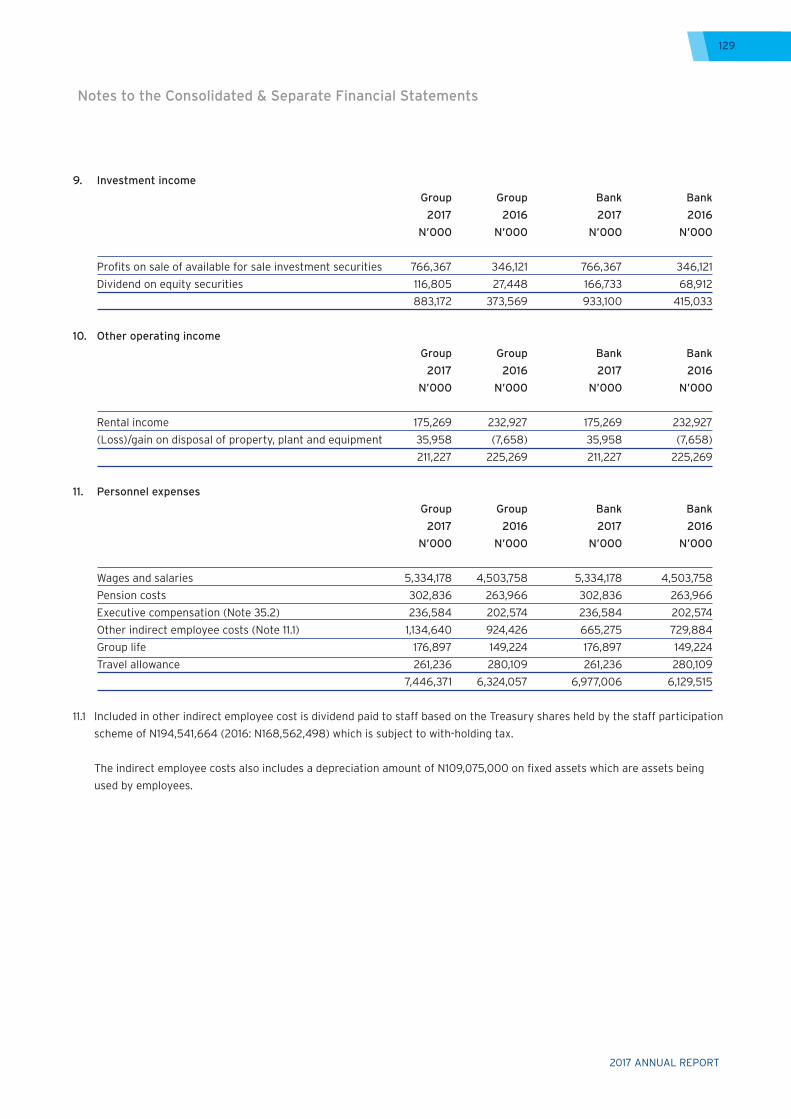
2017 ANNUAL REPORT
129
Notes to the Consolidated & Separate Financial Statements
9. Investment income
Group Group Bank Bank
2017 2016 2017 2016
N’000 N’000 N’000 N’000
Profits on sale of available for sale investment securities 766,367 346,121 766,367 346,121
Dividend on equity securities 116,805 27,448 166,733 68,912
883,172 373,569 933,100 415,033
10. Other operating income
Group Group Bank Bank
2017 2016 2017 2016
N’000 N’000 N’000 N’000
Rental income 175,269 232,927 175,269 232,927
(Loss)/gain on disposal of property, plant and equipment 35,958 (7,658) 35,958 (7,658)
211,227 225,269 211,227 225,269
11. Personnel expenses
Group Group Bank Bank
2017 2016 2017 2016
N’000 N’000 N’000 N’000
Wages and salaries 5,334,178 4,503,758 5,334,178 4,503,758
Pension costs 302,836 263,966 302,836 263,966
Executive compensation (Note 35.2) 236,584 202,574 236,584 202,574
Other indirect employee costs (Note 11.1) 1,134,640 924,426 665,275 729,884
Group life 176,897 149,224 176,897 149,224
Travel allowance 261,236 280,109 261,236 280,109
7,446,371 6,324,057 6,977,006 6,129,515
11.1 Included in other indirect employee cost is dividend paid to staff based on the Treasury shares held by the staff participation
scheme of N194,541,664 (2016: N168,562,498) which is subject to with-holding tax.
The indirect employee costs also includes a depreciation amount of N109,075,000 on fixed assets which are assets being
used by employees.
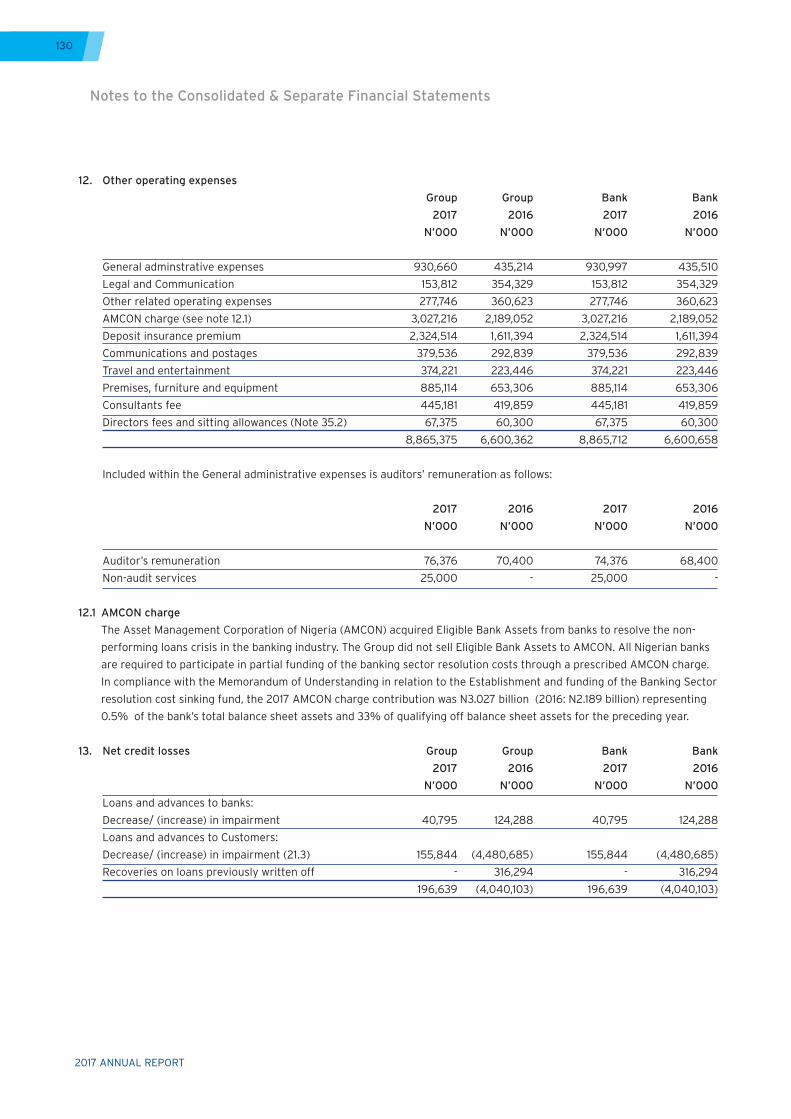
2017 ANNUAL REPORT
130
12. Other operating expenses
Group Group Bank Bank
2017 2016 2017 2016
N’000 N’000 N’000 N’000
General adminstrative expenses 930,660 435,214 930,997 435,510
Legal and Communication 153,812 354,329 153,812 354,329
Other related operating expenses 277,746 360,623 277,746 360,623
AMCON charge (see note 12.1) 3,027,216 2,189,052 3,027,216 2,189,052
Deposit insurance premium 2,324,514 1,611,394 2,324,514 1,611,394
Communications and postages 379,536 292,839 379,536 292,839
Travel and entertainment 374,221 223,446 374,221 223,446
Premises, furniture and equipment 885,114 653,306 885,114 653,306
Consultants fee 445,181 419,859 445,181 419,859
Directors fees and sitting allowances (Note 35.2) 67,375 60,300 67,375 60,300
8,865,375 6,600,362 8,865,712 6,600,658
Included within the General administrative expenses is auditors’ remuneration as follows:
2017 2016 2017 2016
N’000 N’000 N’000 N’000
Auditor’s remuneration 76,376 70,400 74,376 68,400
Non-audit services 25,000 - 25,000 -
12.1 AMCON charge
The Asset Management Corporation of Nigeria (AMCON) acquired Eligible Bank Assets from banks to resolve the non-
performing loans crisis in the banking industry. The Group did not sell Eligible Bank Assets to AMCON. All Nigerian banks
are required to participate in partial funding of the banking sector resolution costs through a prescribed AMCON charge.
In compliance with the Memorandum of Understanding in relation to the Establishment and funding of the Banking Sector
resolution cost sinking fund, the 2017 AMCON charge contribution was N3.027 billion (2016: N2.189 billion) representing
0.5% of the bank’s total balance sheet assets and 33% of qualifying off balance sheet assets for the preceding year.
13. Net credit losses Group Group Bank Bank
2017 2016 2017 2016
N’000 N’000 N’000 N’000
Loans and advances to banks:
Decrease/ (increase) in impairment 40,795 124,288 40,795 124,288
Loans and advances to Customers:
Decrease/ (increase) in impairment (21.3) 155,844 (4,480,685) 155,844 (4,480,685)
Recoveries on loans previously written off - 316,294 - 316,294
196,639 (4,040,103) 196,639 (4,040,103)
Notes to the Consolidated & Separate Financial Statements
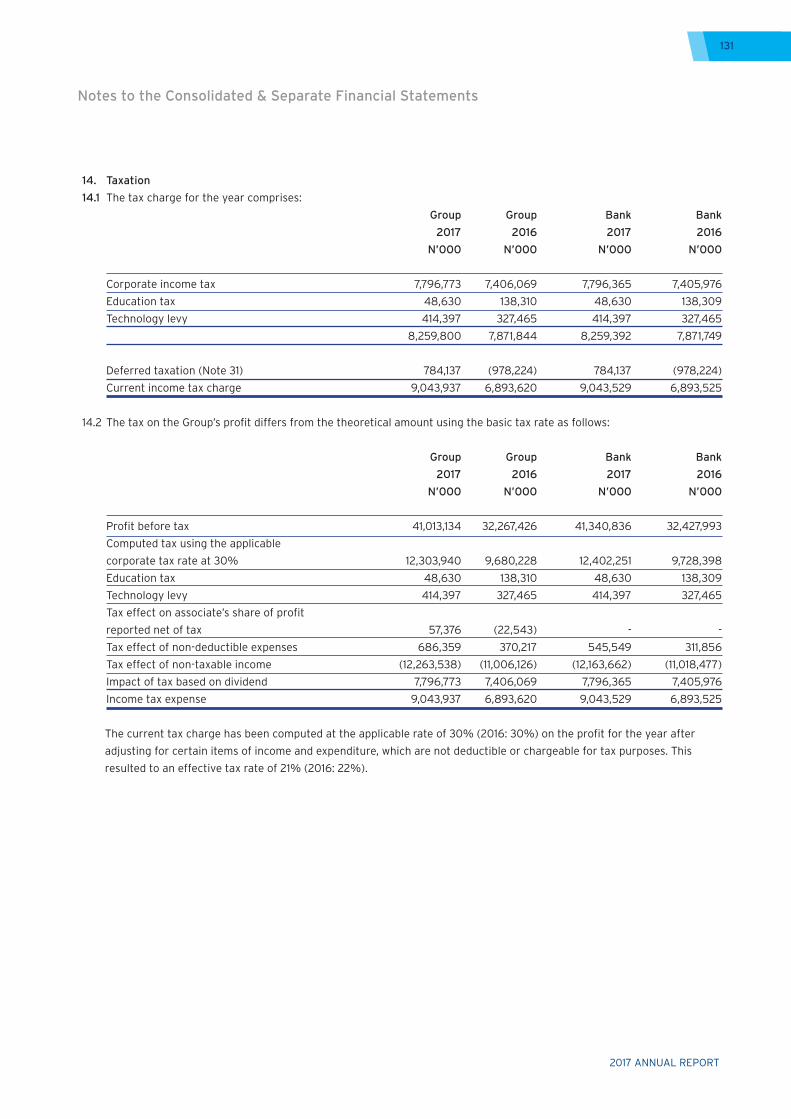
2017 ANNUAL REPORT
131
Notes to the Consolidated & Separate Financial Statements
14. Taxation
14.1 The tax charge for the year comprises:
Group Group Bank Bank
2017 2016 2017 2016
N’000 N’000 N’000 N’000
Corporate income tax 7,796,773 7,406,069 7,796,365 7,405,976
Education tax 48,630 138,310 48,630 138,309
Technology levy 414,397 327,465 414,397 327,465
8,259,800 7,871,844 8,259,392 7,871,749
Deferred taxation (Note 31) 784,137 (978,224) 784,137 (978,224)
Current income tax charge 9,043,937 6,893,620 9,043,529 6,893,525
14.2 The tax on the Group’s profit differs from the theoretical amount using the basic tax rate as follows:
Group Group Bank Bank
2017 2016 2017 2016
N’000 N’000 N’000 N’000
Profit before tax 41,013,134 32,267,426 41,340,836 32,427,993
Computed tax using the applicable
corporate tax rate at 30% 12,303,940 9,680,228 12,402,251 9,728,398
Education tax 48,630 138,310 48,630 138,309
Technology levy 414,397 327,465 414,397 327,465
Tax effect on associate’s share of profit
reported net of tax 57,376 (22,543) - -
Tax effect of non-deductible expenses 686,359 370,217 545,549 311,856
Tax effect of non-taxable income (12,263,538) (11,006,126) (12,163,662) (11,018,477)
Impact of tax based on dividend 7,796,773 7,406,069 7,796,365 7,405,976
Income tax expense 9,043,937 6,893,620 9,043,529 6,893,525
The current tax charge has been computed at the applicable rate of 30% (2016: 30%) on the profit for the year after
adjusting for certain items of income and expenditure, which are not deductible or chargeable for tax purposes. This
resulted to an effective tax rate of 21% (2016: 22%).
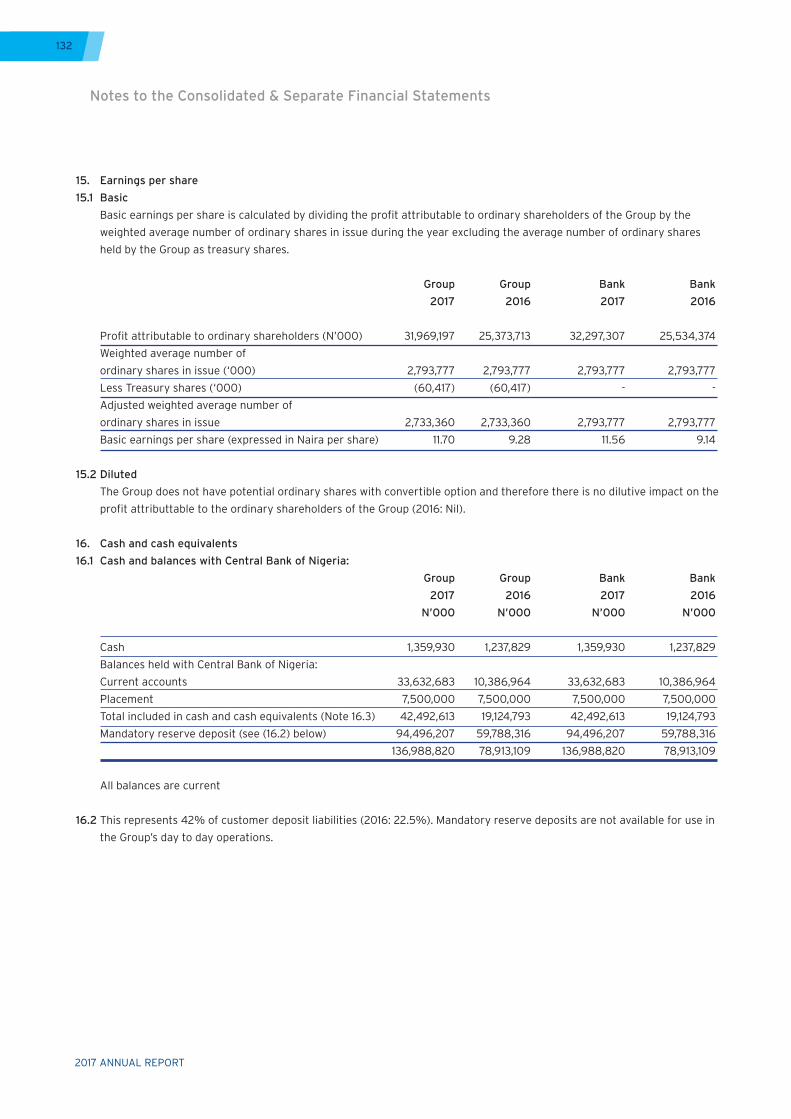
2017 ANNUAL REPORT
132
15. Earnings per share
15.1 Basic
Basic earnings per share is calculated by dividing the profit attributable to ordinary shareholders of the Group by the
weighted average number of ordinary shares in issue during the year excluding the average number of ordinary shares
held by the Group as treasury shares.
Group Group Bank Bank
2017 2016 2017 2016
Profit attributable to ordinary shareholders (N’000) 31,969,197 25,373,713 32,297,307 25,534,374
Weighted average number of
ordinary shares in issue (‘000) 2,793,777 2,793,777 2,793,777 2,793,777
Less Treasury shares (‘000) (60,417) (60,417) - -
Adjusted weighted average number of
ordinary shares in issue 2,733,360 2,733,360 2,793,777 2,793,777
Basic earnings per share (expressed in Naira per share) 11.70 9.28 11.56 9.14
15.2 Diluted
The Group does not have potential ordinary shares with convertible option and therefore there is no dilutive impact on the
profit attributtable to the ordinary shareholders of the Group (2016: Nil).
16. Cash and cash equivalents
16.1 Cash and balances with Central Bank of Nigeria:
Group Group Bank Bank
2017 2016 2017 2016
N’000 N’000 N’000 N’000
Cash 1,359,930 1,237,829 1,359,930 1,237,829
Balances held with Central Bank of Nigeria:
Current accounts 33,632,683 10,386,964 33,632,683 10,386,964
Placement 7,500,000 7,500,000 7,500,000 7,500,000
Total included in cash and cash equivalents (Note 16.3) 42,492,613 19,124,793 42,492,613 19,124,793
Mandatory reserve deposit (see (16.2) below) 94,496,207 59,788,316 94,496,207 59,788,316
136,988,820 78,913,109 136,988,820 78,913,109
All balances are current
16.2 This represents 42% of customer deposit liabilities (2016: 22.5%). Mandatory reserve deposits are not available for use in
the Group’s day to day operations.
Notes to the Consolidated & Separate Financial Statements
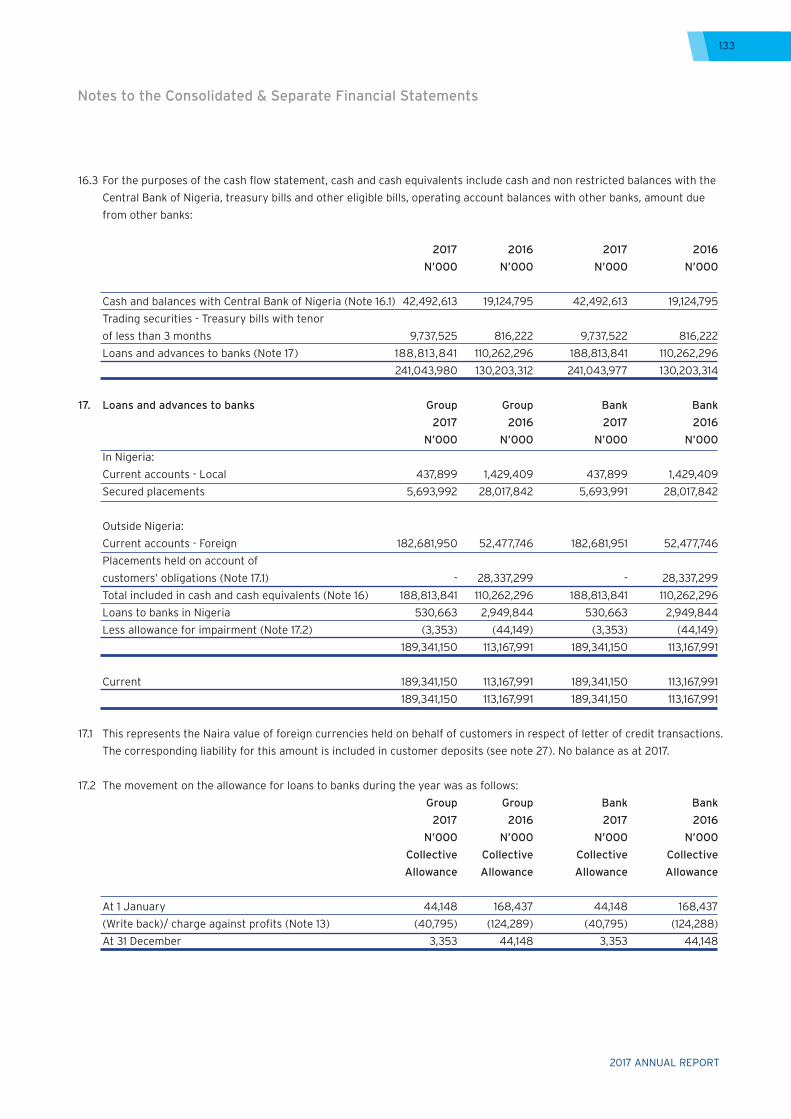
2017 ANNUAL REPORT
133
Notes to the Consolidated & Separate Financial Statements
16.3 For the purposes of the cash flow statement, cash and cash equivalents include cash and non restricted balances with the
Central Bank of Nigeria, treasury bills and other eligible bills, operating account balances with other banks, amount due
from other banks:
2017 2016 2017 2016
N’000 N’000 N’000 N’000
Cash and balances with Central Bank of Nigeria (Note 16.1) 42,492,613 19,124,795 42,492,613 19,124,795
Trading securities - Treasury bills with tenor
of less than 3 months 9,737,525 816,222 9,737,522 816,222
Loans and advances to banks (Note 17) 188,813,841 110,262,296 188,813,841 110,262,296
241,043,980 130,203,312 241,043,977 130,203,314
17. Loans and advances to banks Group Group Bank Bank
2017 2016 2017 2016
N’000 N’000 N’000 N’000
In Nigeria:
Current accounts - Local 437,899 1,429,409 437,899 1,429,409
Secured placements 5,693,992 28,017,842 5,693,991 28,017,842
Outside Nigeria:
Current accounts - Foreign 182,681,950 52,477,746 182,681,951 52,477,746
Placements held on account of
customers’ obligations (Note 17.1) - 28,337,299 - 28,337,299
Total included in cash and cash equivalents (Note 16) 188,813,841 110,262,296 188,813,841 110,262,296
Loans to banks in Nigeria 530,663 2,949,844 530,663 2,949,844
Less allowance for impairment (Note 17.2) (3,353) (44,149) (3,353) (44,149)
189,341,150 113,167,991 189,341,150 113,167,991
Current 189,341,150 113,167,991 189,341,150 113,167,991
189,341,150 113,167,991 189,341,150 113,167,991
17.1 This represents the Naira value of foreign currencies held on behalf of customers in respect of letter of credit transactions.
The corresponding liability for this amount is included in customer deposits (see note 27). No balance as at 2017.
17.2 The movement on the allowance for loans to banks during the year was as follows:
Group Group Bank Bank
2017 2016 2017 2016
N’000 N’000 N’000 N’000
Collective Collective Collective Collective
Allowance Allowance Allowance Allowance
At 1 January 44,148 168,437 44,148 168,437
(Write back)/ charge against profits (Note 13) (40,795) (124,289) (40,795) (124,288)
At 31 December 3,353 44,148 3,353 44,148
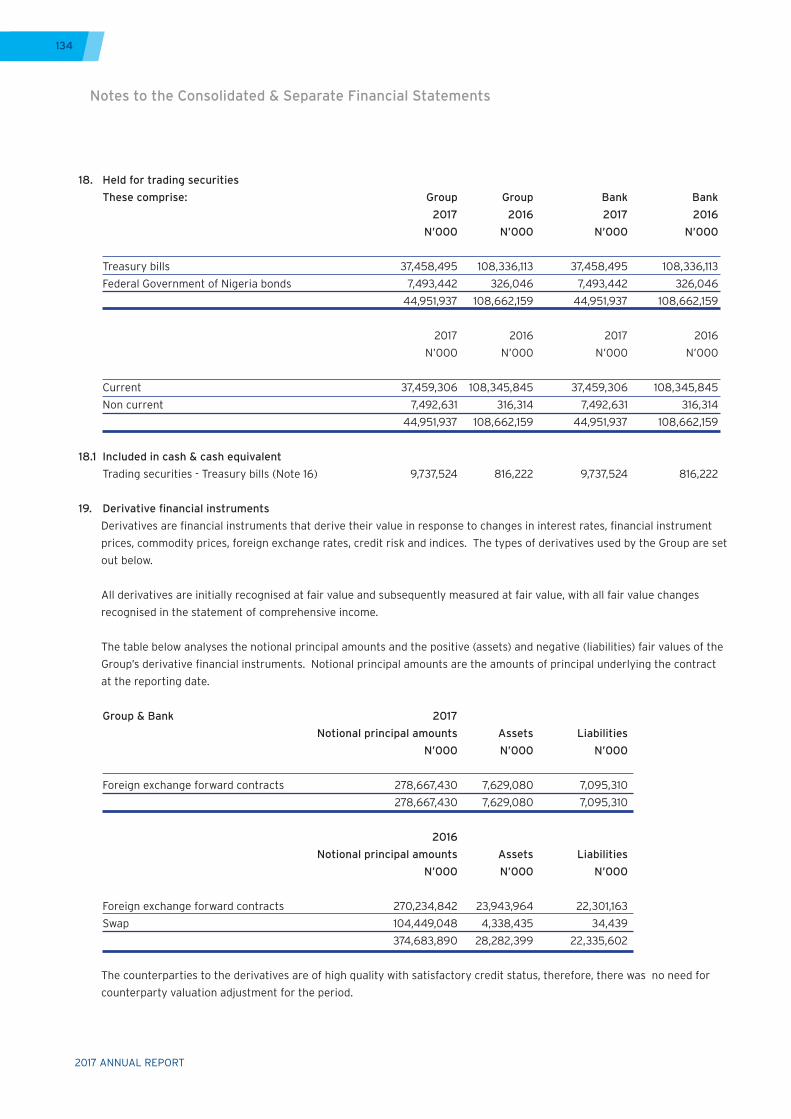
2017 ANNUAL REPORT
134
18. Held for trading securities
These comprise: Group Group Bank Bank
2017 2016 2017 2016
N’000 N’000 N’000 N’000
Treasury bills 37,458,495 108,336,113 37,458,495 108,336,113
Federal Government of Nigeria bonds 7,493,442 326,046 7,493,442 326,046
44,951,937 108,662,159 44,951,937 108,662,159
2017 2016 2017 2016
N’000 N’000 N’000 N’000
Current 37,459,306 108,345,845 37,459,306 108,345,845
Non current 7,492,631 316,314 7,492,631 316,314
44,951,937 108,662,159 44,951,937 108,662,159
18.1 Included in cash & cash equivalent
Trading securities - Treasury bills (Note 16) 9,737,524 816,222 9,737,524 816,222
19. Derivative financial instruments
Derivatives are financial instruments that derive their value in response to changes in interest rates, financial instrument
prices, commodity prices, foreign exchange rates, credit risk and indices. The types of derivatives used by the Group are set
out below.
All derivatives are initially recognised at fair value and subsequently measured at fair value, with all fair value changes
recognised in the statement of comprehensive income.
The table below analyses the notional principal amounts and the positive (assets) and negative (liabilities) fair values of the
Group’s derivative financial instruments. Notional principal amounts are the amounts of principal underlying the contract
at the reporting date.
Group & Bank 2017
Notional principal amounts Assets Liabilities
N’000 N’000 N’000
Foreign exchange forward contracts 278,667,430 7,629,080 7,095,310
278,667,430 7,629,080 7,095,310
2016
Notional principal amounts Assets Liabilities
N’000 N’000 N’000
Foreign exchange forward contracts 270,234,842 23,943,964 22,301,163
Swap 104,449,048 4,338,435 34,439
374,683,890 28,282,399 22,335,602
The counterparties to the derivatives are of high quality with satisfactory credit status, therefore, there was no need for
counterparty valuation adjustment for the period.
Notes to the Consolidated & Separate Financial Statements
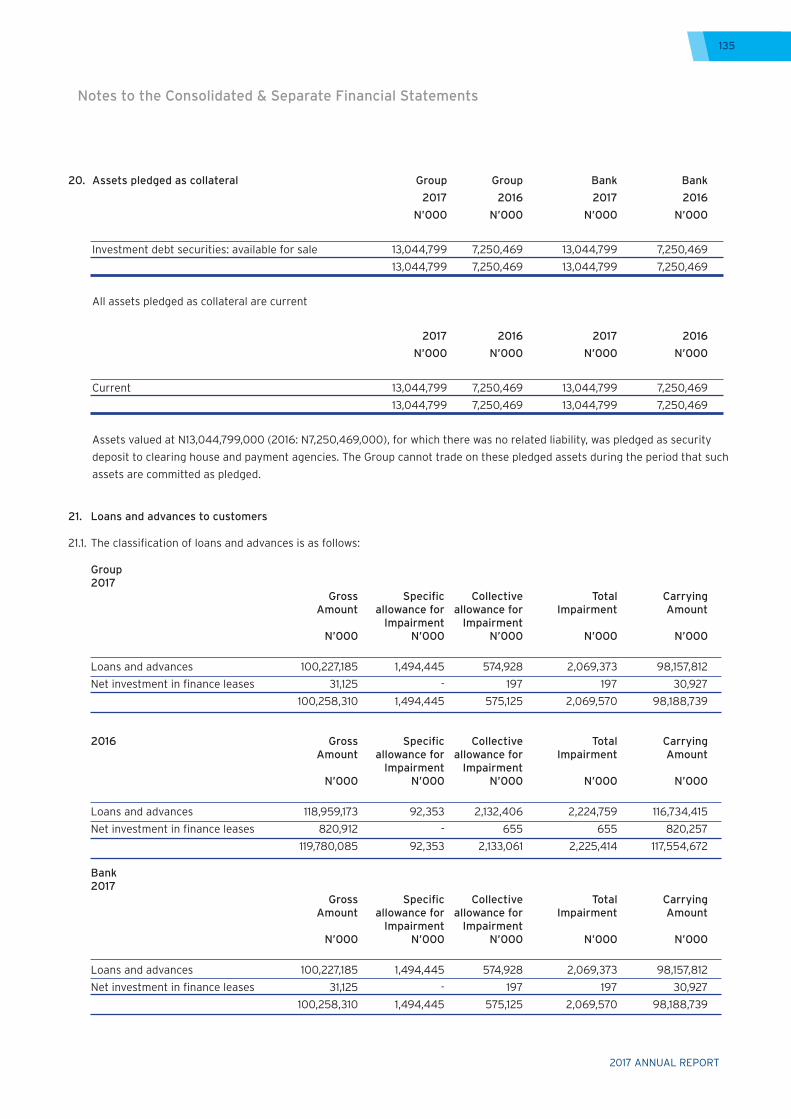
2017 ANNUAL REPORT
135
Notes to the Consolidated & Separate Financial Statements
20. Assets pledged as collateral Group Group Bank Bank
2017 2016 2017 2016
N’000 N’000 N’000 N’000
Investment debt securities: available for sale 13,044,799 7,250,469 13,044,799 7,250,469
13,044,799 7,250,469 13,044,799 7,250,469
All assets pledged as collateral are current
2017 2016 2017 2016
N’000 N’000 N’000 N’000
Current 13,044,799 7,250,469 13,044,799 7,250,469
13,044,799 7,250,469 13,044,799 7,250,469
Assets valued at N13,044,799,000 (2016: N7,250,469,000), for which there was no related liability, was pledged as security
deposit to clearing house and payment agencies. The Group cannot trade on these pledged assets during the period that such
assets are committed as pledged.
21. Loans and advances to customers
21.1. The classification of loans and advances is as follows:
Group2017 Gross Specific Collective Total Carrying Amount allowance for allowance for Impairment Amount Impairment Impairment N’000 N’000 N’000 N’000 N’000
Loans and advances 100,227,185 1,494,445 574,928 2,069,373 98,157,812
Net investment in finance leases 31,125 - 197 197 30,927
100,258,310 1,494,445 575,125 2,069,570 98,188,739 2016 Gross Specific Collective Total Carrying Amount allowance for allowance for Impairment Amount Impairment Impairment N’000 N’000 N’000 N’000 N’000
Loans and advances 118,959,173 92,353 2,132,406 2,224,759 116,734,415
Net investment in finance leases 820,912 - 655 655 820,257
119,780,085 92,353 2,133,061 2,225,414 117,554,672 Bank 2017 Gross Specific Collective Total Carrying Amount allowance for allowance for Impairment Amount Impairment Impairment N’000 N’000 N’000 N’000 N’000
Loans and advances 100,227,185 1,494,445 574,928 2,069,373 98,157,812
Net investment in finance leases 31,125 - 197 197 30,927
100,258,310 1,494,445 575,125 2,069,570 98,188,739
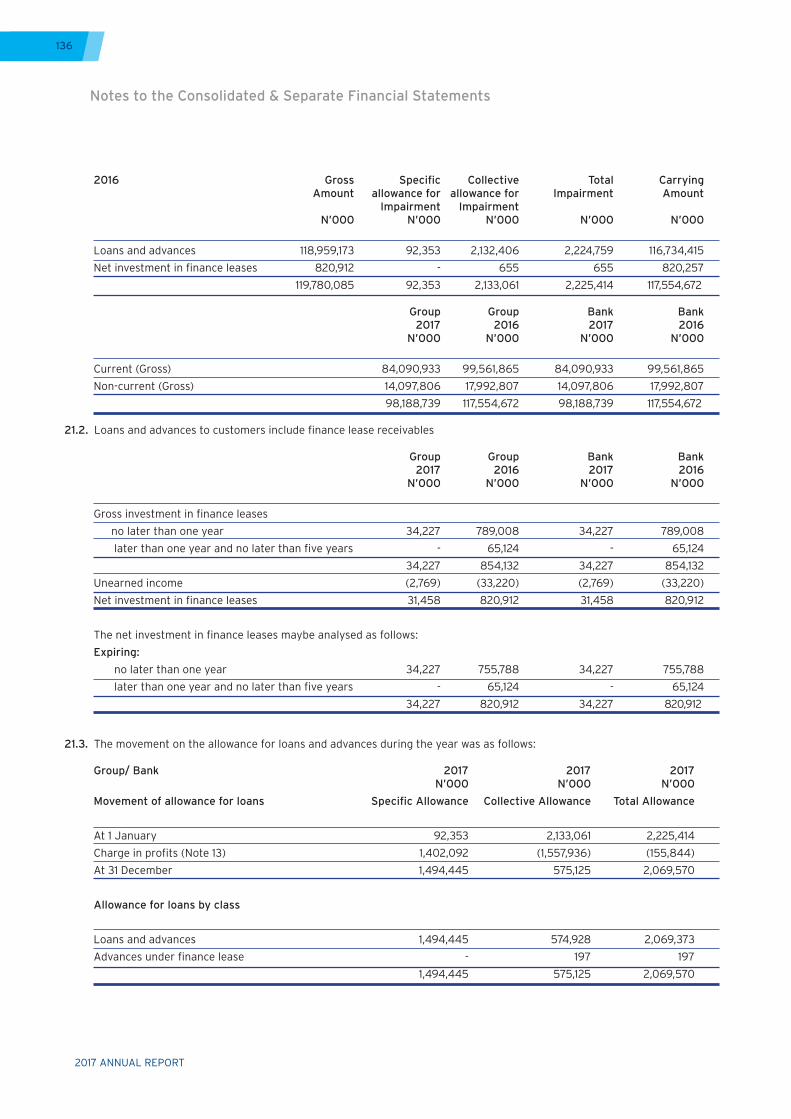
2017 ANNUAL REPORT
136
2016 Gross Specific Collective Total Carrying Amount allowance for allowance for Impairment Amount Impairment Impairment N’000 N’000 N’000 N’000 N’000
Loans and advances 118,959,173 92,353 2,132,406 2,224,759 116,734,415
Net investment in finance leases 820,912 - 655 655 820,257
119,780,085 92,353 2,133,061 2,225,414 117,554,672 Group Group Bank Bank 2017 2016 2017 2016 N’000 N’000 N’000 N’000
Current (Gross) 84,090,933 99,561,865 84,090,933 99,561,865
Non-current (Gross) 14,097,806 17,992,807 14,097,806 17,992,807
98,188,739 117,554,672 98,188,739 117,554,672
21.2. Loans and advances to customers include finance lease receivables
Group Group Bank Bank 2017 2016 2017 2016 N’000 N’000 N’000 N’000
Gross investment in finance leases
no later than one year 34,227 789,008 34,227 789,008
later than one year and no later than five years - 65,124 - 65,124
34,227 854,132 34,227 854,132
Unearned income (2,769) (33,220) (2,769) (33,220)
Net investment in finance leases 31,458 820,912 31,458 820,912
The net investment in finance leases maybe analysed as follows:
Expiring:
no later than one year 34,227 755,788 34,227 755,788
later than one year and no later than five years - 65,124 - 65,124
34,227 820,912 34,227 820,912
21.3. The movement on the allowance for loans and advances during the year was as follows:
Group/ Bank 2017 2017 2017 N’000 N’000 N’000
Movement of allowance for loans Specific Allowance Collective Allowance Total Allowance
At 1 January 92,353 2,133,061 2,225,414
Charge in profits (Note 13) 1,402,092 (1,557,936) (155,844)
At 31 December 1,494,445 575,125 2,069,570
Allowance for loans by class
Loans and advances 1,494,445 574,928 2,069,373
Advances under finance lease - 197 197
1,494,445 575,125 2,069,570
Notes to the Consolidated & Separate Financial Statements
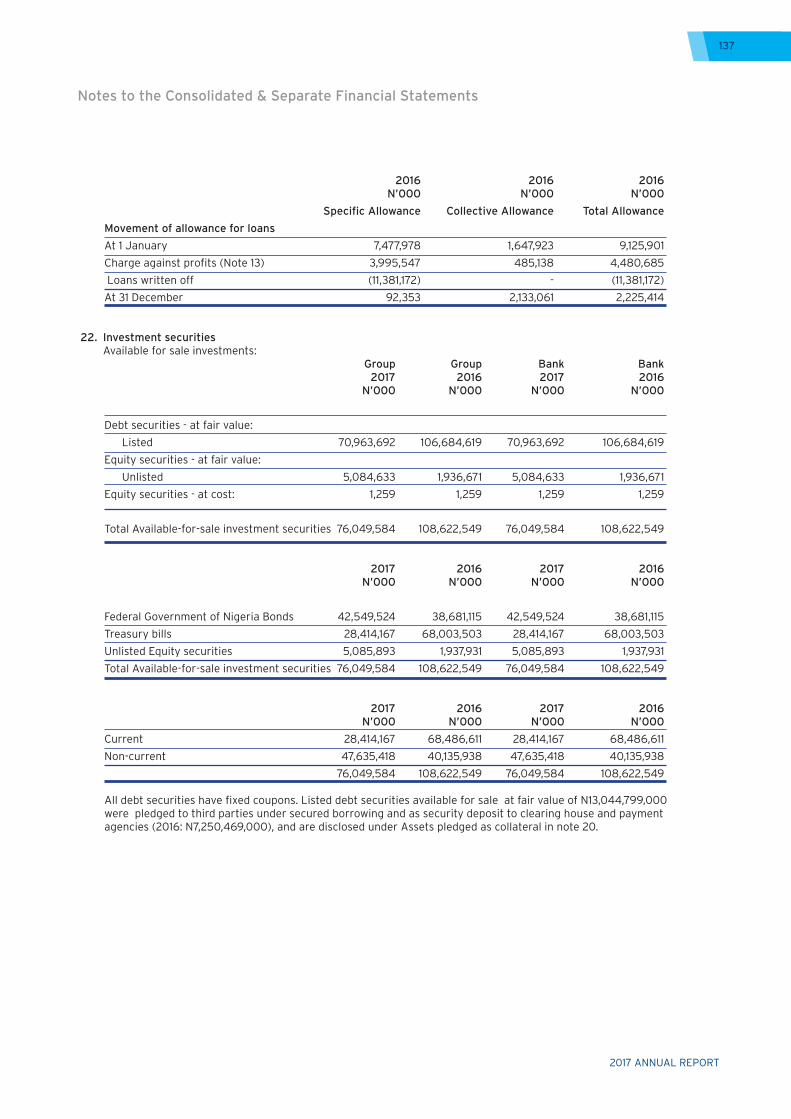
2017 ANNUAL REPORT
137
Notes to the Consolidated & Separate Financial Statements
2016 2016 2016 N’000 N’000 N’000
Specific Allowance Collective Allowance Total Allowance
Movement of allowance for loans
At 1 January 7,477,978 1,647,923 9,125,901
Charge against profits (Note 13) 3,995,547 485,138 4,480,685
Loans written off (11,381,172) - (11,381,172)
At 31 December 92,353 2,133,061 2,225,414
22. Investment securities Available for sale investments:
Group Group Bank Bank 2017 2016 2017 2016 N’000 N’000 N’000 N’000
Debt securities - at fair value:
Listed 70,963,692 106,684,619 70,963,692 106,684,619
Equity securities - at fair value:
Unlisted 5,084,633 1,936,671 5,084,633 1,936,671
Equity securities - at cost: 1,259 1,259 1,259 1,259
Total Available-for-sale investment securities 76,049,584 108,622,549 76,049,584 108,622,549
2017 2016 2017 2016 N’000 N’000 N’000 N’000
Federal Government of Nigeria Bonds 42,549,524 38,681,115 42,549,524 38,681,115
Treasury bills 28,414,167 68,003,503 28,414,167 68,003,503
Unlisted Equity securities 5,085,893 1,937,931 5,085,893 1,937,931
Total Available-for-sale investment securities 76,049,584 108,622,549 76,049,584 108,622,549
2017 2016 2017 2016 N’000 N’000 N’000 N’000
Current 28,414,167 68,486,611 28,414,167 68,486,611
Non-current 47,635,418 40,135,938 47,635,418 40,135,938
76,049,584 108,622,549 76,049,584 108,622,549
All debt securities have fixed coupons. Listed debt securities available for sale at fair value of N13,044,799,000 were pledged to third parties under secured borrowing and as security deposit to clearing house and payment agencies (2016: N7,250,469,000), and are disclosed under Assets pledged as collateral in note 20.
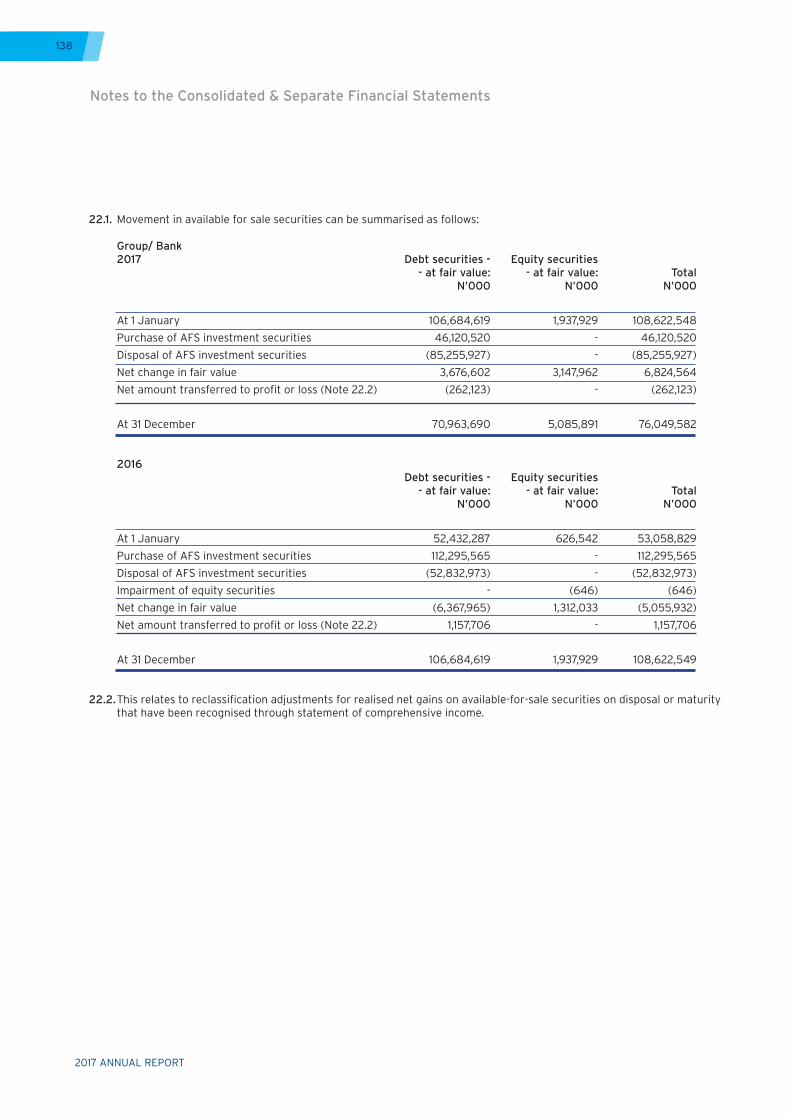
2017 ANNUAL REPORT
138
22.1. Movement in available for sale securities can be summarised as follows:
Group/ Bank2017 Debt securities - Equity securities
- at fair value: - at fair value: Total N’000 N’000 N’000
At 1 January 106,684,619 1,937,929 108,622,548
Purchase of AFS investment securities 46,120,520 - 46,120,520
Disposal of AFS investment securities (85,255,927) - (85,255,927)
Net change in fair value 3,676,602 3,147,962 6,824,564
Net amount transferred to profit or loss (Note 22.2) (262,123) - (262,123)
At 31 December 70,963,690 5,085,891 76,049,582
2016 Debt securities - Equity securities - at fair value: - at fair value: Total N’000 N’000 N’000
At 1 January 52,432,287 626,542 53,058,829
Purchase of AFS investment securities 112,295,565 - 112,295,565
Disposal of AFS investment securities (52,832,973) - (52,832,973)
Impairment of equity securities - (646) (646)
Net change in fair value (6,367,965) 1,312,033 (5,055,932)
Net amount transferred to profit or loss (Note 22.2) 1,157,706 - 1,157,706
At 31 December 106,684,619 1,937,929 108,622,549
22.2. This relates to reclassification adjustments for realised net gains on available-for-sale securities on disposal or maturity that have been recognised through statement of comprehensive income.
Notes to the Consolidated & Separate Financial Statements
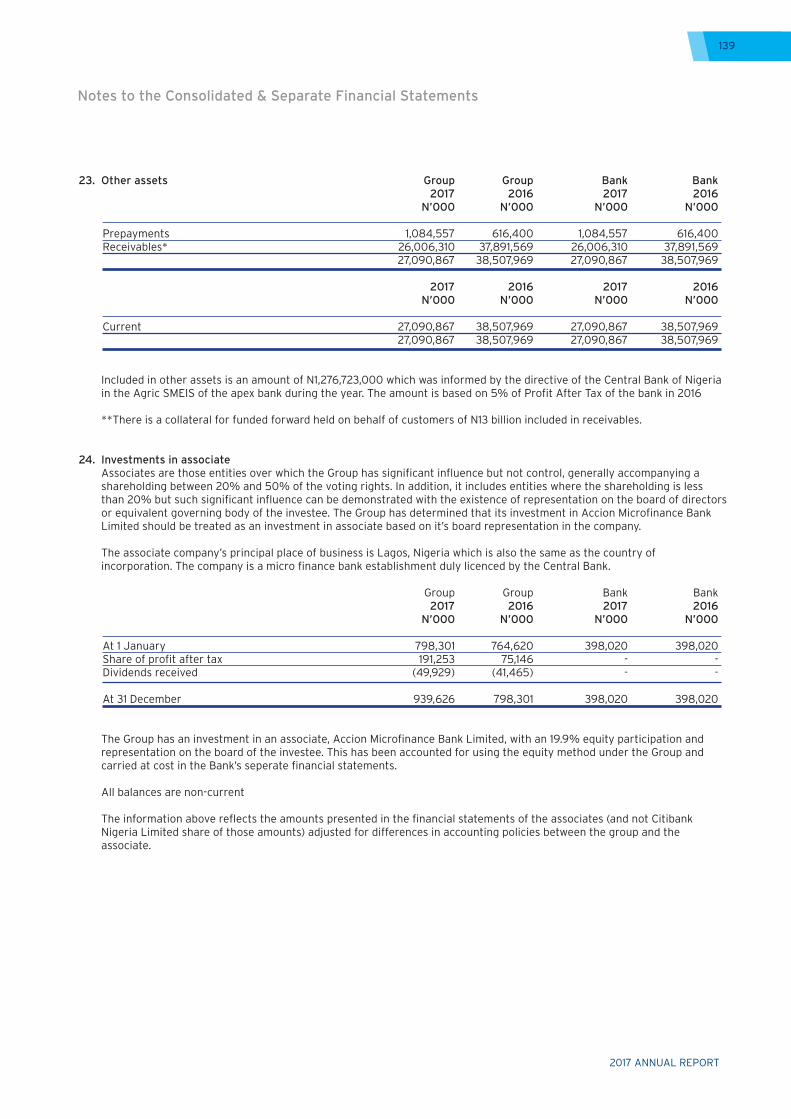
2017 ANNUAL REPORT
139
Notes to the Consolidated & Separate Financial Statements
23. Other assets Group Group Bank Bank 2017 2016 2017 2016 N’000 N’000 N’000 N’000
Prepayments 1,084,557 616,400 1,084,557 616,400 Receivables* 26,006,310 37,891,569 26,006,310 37,891,569 27,090,867 38,507,969 27,090,867 38,507,969
2017 2016 2017 2016 N’000 N’000 N’000 N’000
Current 27,090,867 38,507,969 27,090,867 38,507,969 27,090,867 38,507,969 27,090,867 38,507,969
Included in other assets is an amount of N1,276,723,000 which was informed by the directive of the Central Bank of Nigeria in the Agric SMEIS of the apex bank during the year. The amount is based on 5% of Profit After Tax of the bank in 2016
**There is a collateral for funded forward held on behalf of customers of N13 billion included in receivables.
24. Investments in associate Associates are those entities over which the Group has significant influence but not control, generally accompanying a
shareholding between 20% and 50% of the voting rights. In addition, it includes entities where the shareholding is less than 20% but such significant influence can be demonstrated with the existence of representation on the board of directors or equivalent governing body of the investee. The Group has determined that its investment in Accion Microfinance Bank Limited should be treated as an investment in associate based on it’s board representation in the company.
The associate company’s principal place of business is Lagos, Nigeria which is also the same as the country of incorporation. The company is a micro finance bank establishment duly licenced by the Central Bank.
Group Group Bank Bank 2017 2016 2017 2016 N’000 N’000 N’000 N’000
At 1 January 798,301 764,620 398,020 398,020 Share of profit after tax 191,253 75,146 - - Dividends received (49,929) (41,465) - -
At 31 December 939,626 798,301 398,020 398,020
The Group has an investment in an associate, Accion Microfinance Bank Limited, with an 19.9% equity participation and representation on the board of the investee. This has been accounted for using the equity method under the Group and carried at cost in the Bank’s seperate financial statements.
All balances are non-current
The information above reflects the amounts presented in the financial statements of the associates (and not Citibank Nigeria Limited share of those amounts) adjusted for differences in accounting policies between the group and the associate.
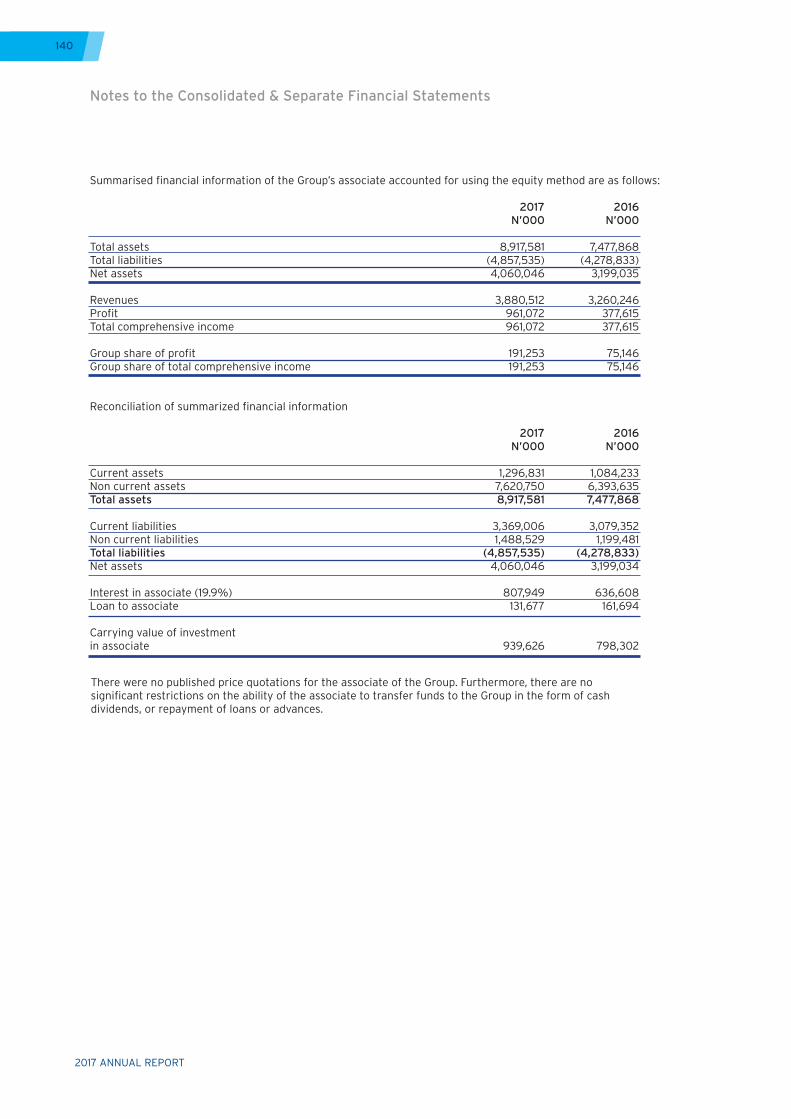
2017 ANNUAL REPORT
140
Summarised financial information of the Group’s associate accounted for using the equity method are as follows:
2017 2016 N’000 N’000
Total assets 8,917,581 7,477,868Total liabilities (4,857,535) (4,278,833)Net assets 4,060,046 3,199,035
Revenues 3,880,512 3,260,246Profit 961,072 377,615Total comprehensive income 961,072 377,615
Group share of profit 191,253 75,146Group share of total comprehensive income 191,253 75,146
Reconciliation of summarized financial information
2017 2016 N’000 N’000
Current assets 1,296,831 1,084,233Non current assets 7,620,750 6,393,635Total assets 8,917,581 7,477,868
Current liabilities 3,369,006 3,079,352Non current liabilities 1,488,529 1,199,481Total liabilities (4,857,535) (4,278,833)Net assets 4,060,046 3,199,034
Interest in associate (19.9%) 807,949 636,608Loan to associate 131,677 161,694
Carrying value of investmentin associate 939,626 798,302
Notes to the Consolidated & Separate Financial Statements
There were no published price quotations for the associate of the Group. Furthermore, there are no significant restrictions on the ability of the associate to transfer funds to the Group in the form of cash dividends, or repayment of loans or advances.
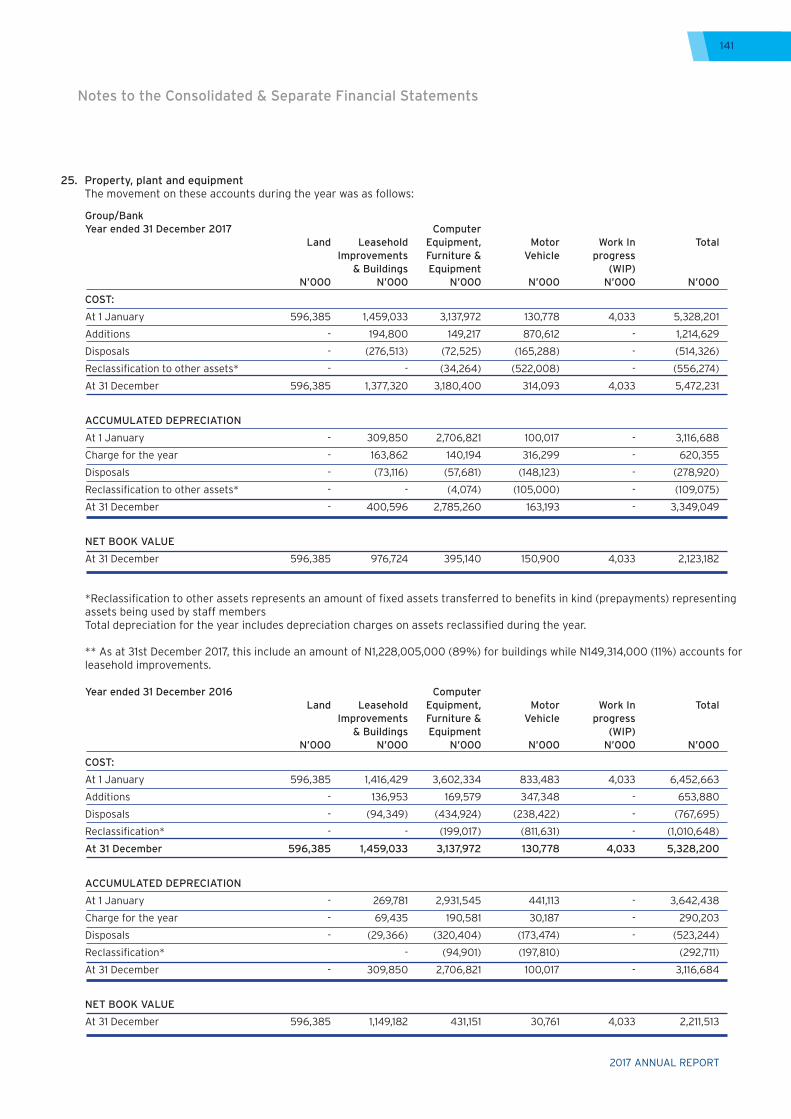
2017 ANNUAL REPORT
141
Notes to the Consolidated & Separate Financial Statements
Group/Bank Year ended 31 December 2017 Computer Land Leasehold Equipment, Motor Work In Total Improvements Furniture & Vehicle progress & Buildings Equipment (WIP) N’000 N’000 N’000 N’000 N’000 N’000
COST:
At 1 January 596,385 1,459,033 3,137,972 130,778 4,033 5,328,201
Additions - 194,800 149,217 870,612 - 1,214,629
Disposals - (276,513) (72,525) (165,288) - (514,326)
Reclassification to other assets* - - (34,264) (522,008) - (556,274)
At 31 December 596,385 1,377,320 3,180,400 314,093 4,033 5,472,231
ACCUMULATED DEPRECIATION
At 1 January - 309,850 2,706,821 100,017 - 3,116,688
Charge for the year - 163,862 140,194 316,299 - 620,355
Disposals - (73,116) (57,681) (148,123) - (278,920)
Reclassification to other assets* - - (4,074) (105,000) - (109,075)
At 31 December - 400,596 2,785,260 163,193 - 3,349,049
NET BOOK VALUE
At 31 December 596,385 976,724 395,140 150,900 4,033 2,123,182 *Reclassification to other assets represents an amount of fixed assets transferred to benefits in kind (prepayments) representing assets being used by staff membersTotal depreciation for the year includes depreciation charges on assets reclassified during the year.
** As at 31st December 2017, this include an amount of N1,228,005,000 (89%) for buildings while N149,314,000 (11%) accounts for leasehold improvements.
Year ended 31 December 2016 Computer Land Leasehold Equipment, Motor Work In Total Improvements Furniture & Vehicle progress & Buildings Equipment (WIP) N’000 N’000 N’000 N’000 N’000 N’000
COST:
At 1 January 596,385 1,416,429 3,602,334 833,483 4,033 6,452,663
Additions - 136,953 169,579 347,348 - 653,880
Disposals - (94,349) (434,924) (238,422) - (767,695)
Reclassification* - - (199,017) (811,631) - (1,010,648)
At 31 December 596,385 1,459,033 3,137,972 130,778 4,033 5,328,200
ACCUMULATED DEPRECIATION
At 1 January - 269,781 2,931,545 441,113 - 3,642,438
Charge for the year - 69,435 190,581 30,187 - 290,203
Disposals - (29,366) (320,404) (173,474) - (523,244)
Reclassification* - (94,901) (197,810) (292,711)
At 31 December - 309,850 2,706,821 100,017 - 3,116,684
NET BOOK VALUE
At 31 December 596,385 1,149,182 431,151 30,761 4,033 2,211,513
25. Property, plant and equipment The movement on these accounts during the year was as follows:
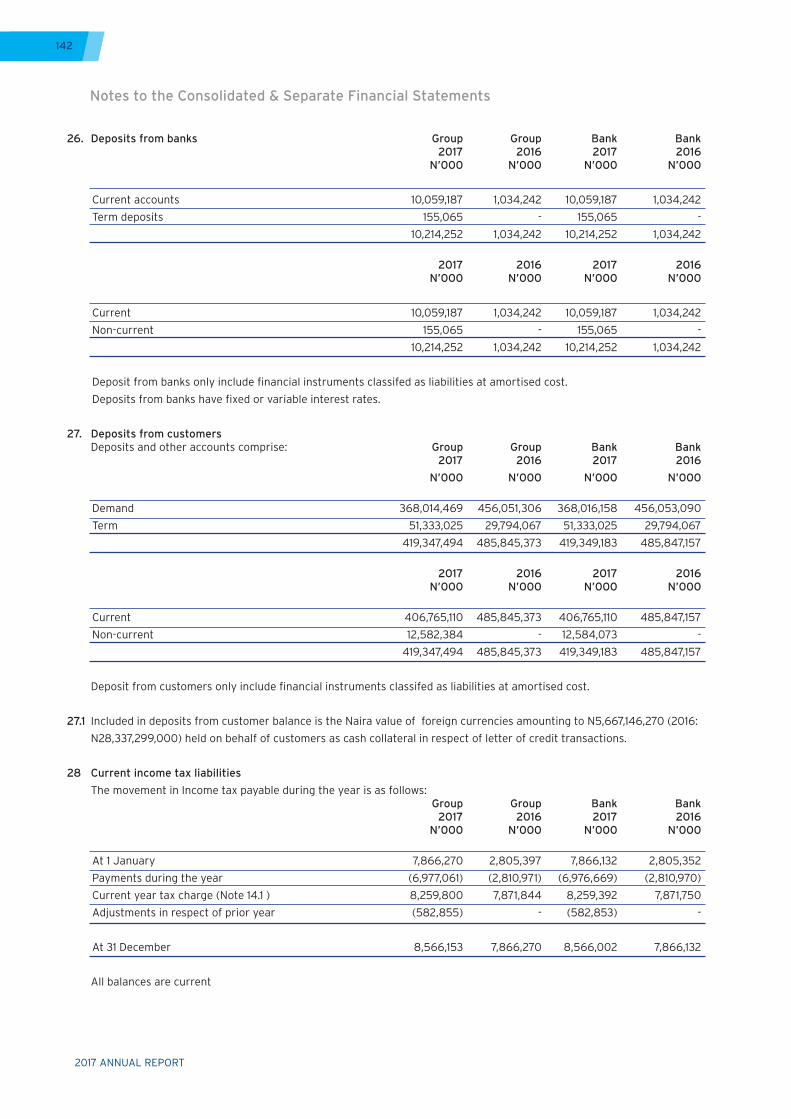
2017 ANNUAL REPORT
142
26. Deposits from banks Group Group Bank Bank 2017 2016 2017 2016 N’000 N’000 N’000 N’000
Current accounts 10,059,187 1,034,242 10,059,187 1,034,242
Term deposits 155,065 - 155,065 -
10,214,252 1,034,242 10,214,252 1,034,242
2017 2016 2017 2016 N’000 N’000 N’000 N’000
Current 10,059,187 1,034,242 10,059,187 1,034,242
Non-current 155,065 - 155,065 -
10,214,252 1,034,242 10,214,252 1,034,242
Deposit from banks only include financial instruments classifed as liabilities at amortised cost.
Deposits from banks have fixed or variable interest rates.
27. Deposits from customers Deposits and other accounts comprise: Group Group Bank Bank 2017 2016 2017 2016
N’000 N’000 N’000 N’000
Demand 368,014,469 456,051,306 368,016,158 456,053,090
Term 51,333,025 29,794,067 51,333,025 29,794,067
419,347,494 485,845,373 419,349,183 485,847,157
2017 2016 2017 2016 N’000 N’000 N’000 N’000
Current 406,765,110 485,845,373 406,765,110 485,847,157
Non-current 12,582,384 - 12,584,073 -
419,347,494 485,845,373 419,349,183 485,847,157
Deposit from customers only include financial instruments classifed as liabilities at amortised cost.
27.1 Included in deposits from customer balance is the Naira value of foreign currencies amounting to N5,667,146,270 (2016:
N28,337,299,000) held on behalf of customers as cash collateral in respect of letter of credit transactions.
28 Current income tax liabilities
The movement in Income tax payable during the year is as follows: Group Group Bank Bank 2017 2016 2017 2016 N’000 N’000 N’000 N’000
At 1 January 7,866,270 2,805,397 7,866,132 2,805,352
Payments during the year (6,977,061) (2,810,971) (6,976,669) (2,810,970)
Current year tax charge (Note 14.1 ) 8,259,800 7,871,844 8,259,392 7,871,750
Adjustments in respect of prior year (582,855) - (582,853) -
At 31 December 8,566,153 7,866,270 8,566,002 7,866,132
All balances are current
Notes to the Consolidated & Separate Financial Statements
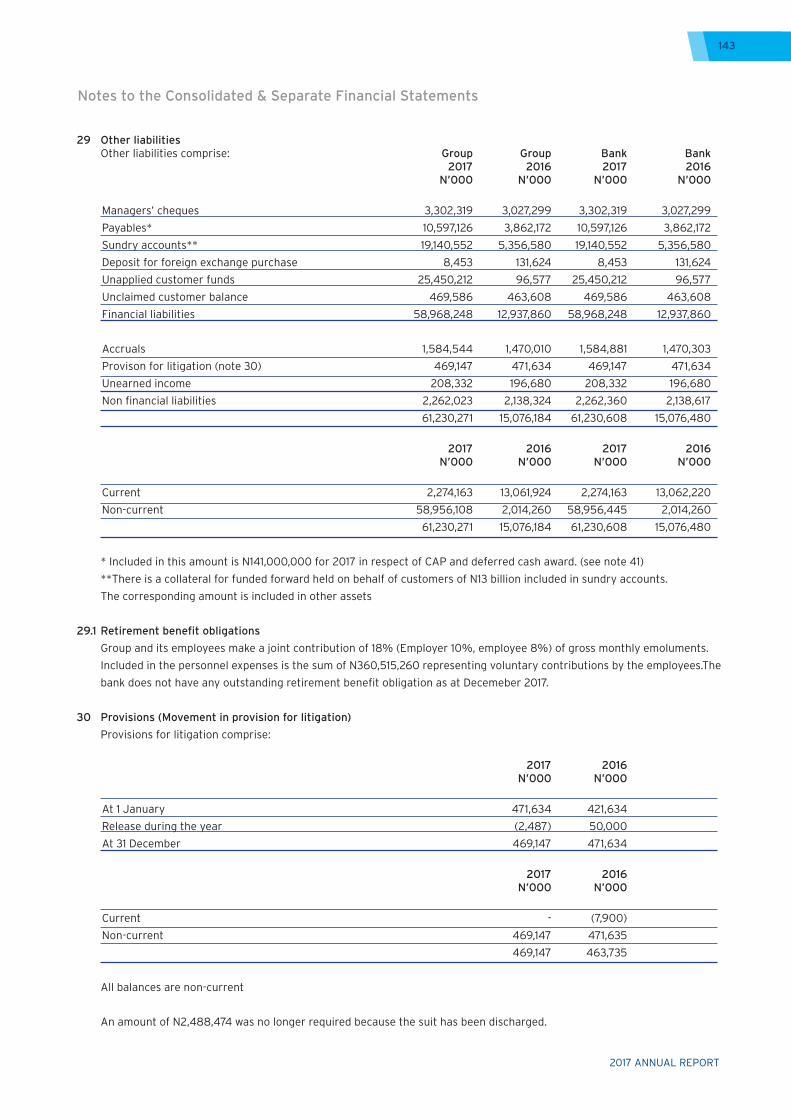
2017 ANNUAL REPORT
143
29 Other liabilities Other liabilities comprise: Group Group Bank Bank 2017 2016 2017 2016 N’000 N’000 N’000 N’000
Managers’ cheques 3,302,319 3,027,299 3,302,319 3,027,299
Payables* 10,597,126 3,862,172 10,597,126 3,862,172
Sundry accounts** 19,140,552 5,356,580 19,140,552 5,356,580
Deposit for foreign exchange purchase 8,453 131,624 8,453 131,624
Unapplied customer funds 25,450,212 96,577 25,450,212 96,577
Unclaimed customer balance 469,586 463,608 469,586 463,608
Financial liabilities 58,968,248 12,937,860 58,968,248 12,937,860
Accruals 1,584,544 1,470,010 1,584,881 1,470,303
Provison for litigation (note 30) 469,147 471,634 469,147 471,634
Unearned income 208,332 196,680 208,332 196,680
Non financial liabilities 2,262,023 2,138,324 2,262,360 2,138,617
61,230,271 15,076,184 61,230,608 15,076,480
2017 2016 2017 2016 N’000 N’000 N’000 N’000
Current 2,274,163 13,061,924 2,274,163 13,062,220
Non-current 58,956,108 2,014,260 58,956,445 2,014,260
61,230,271 15,076,184 61,230,608 15,076,480
* Included in this amount is N141,000,000 for 2017 in respect of CAP and deferred cash award. (see note 41)
**There is a collateral for funded forward held on behalf of customers of N13 billion included in sundry accounts.
The corresponding amount is included in other assets
29.1 Retirement benefit obligations
Group and its employees make a joint contribution of 18% (Employer 10%, employee 8%) of gross monthly emoluments.
Included in the personnel expenses is the sum of N360,515,260 representing voluntary contributions by the employees.The
bank does not have any outstanding retirement benefit obligation as at Decemeber 2017.
30 Provisions (Movement in provision for litigation)
Provisions for litigation comprise:
2017 2016 N’000 N’000
At 1 January 471,634 421,634
Release during the year (2,487) 50,000
At 31 December 469,147 471,634
2017 2016 N’000 N’000
Current - (7,900)
Non-current 469,147 471,635
469,147 463,735
All balances are non-current
An amount of N2,488,474 was no longer required because the suit has been discharged.
Notes to the Consolidated & Separate Financial Statements
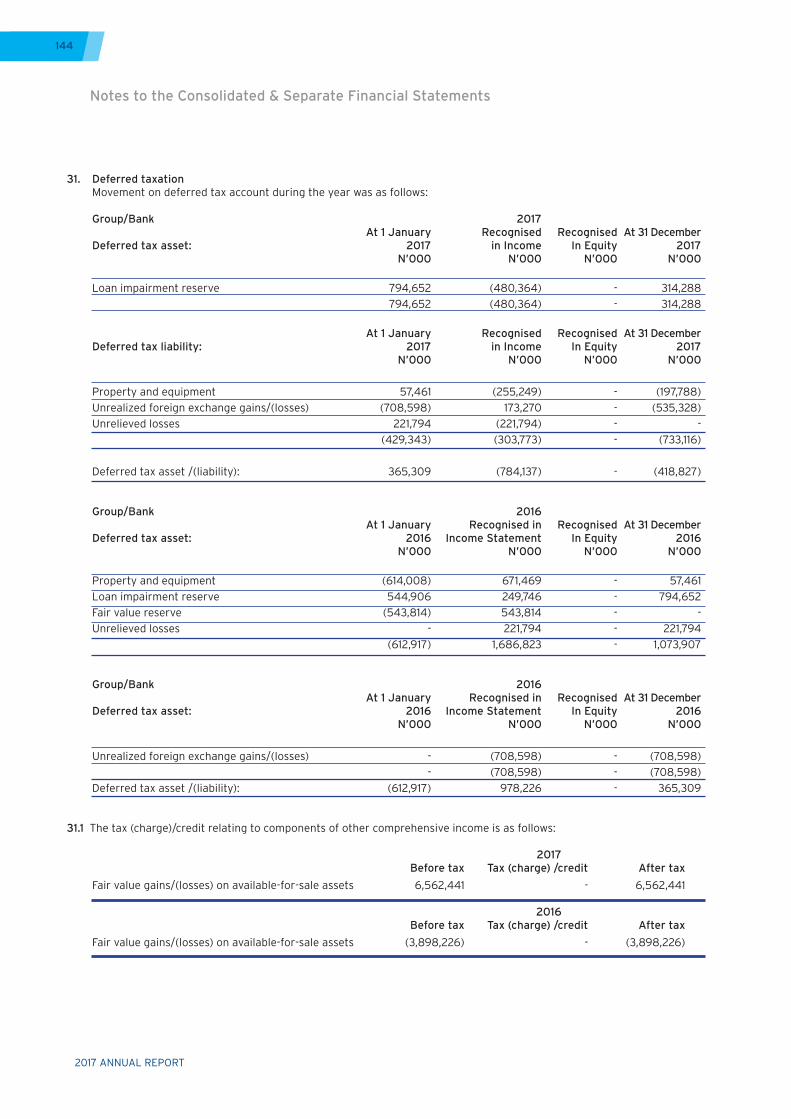
2017 ANNUAL REPORT
144
31. Deferred taxation Movement on deferred tax account during the year was as follows:
Group/Bank 2017 At 1 January Recognised Recognised At 31 December
Deferred tax asset: 2017 in Income In Equity 2017 N’000 N’000 N’000 N’000
Loan impairment reserve 794,652 (480,364) - 314,288 794,652 (480,364) - 314,288
At 1 January Recognised Recognised At 31 DecemberDeferred tax liability: 2017 in Income In Equity 2017 N’000 N’000 N’000 N’000
Property and equipment 57,461 (255,249) - (197,788)Unrealized foreign exchange gains/(losses) (708,598) 173,270 - (535,328)Unrelieved losses 221,794 (221,794) - - (429,343) (303,773) - (733,116)
Deferred tax asset /(liability): 365,309 (784,137) - (418,827)
Group/Bank 2016 At 1 January Recognised in Recognised At 31 December
Deferred tax asset: 2016 Income Statement In Equity 2016 N’000 N’000 N’000 N’000
Property and equipment (614,008) 671,469 - 57,461 Loan impairment reserve 544,906 249,746 - 794,652 Fair value reserve (543,814) 543,814 - - Unrelieved losses - 221,794 - 221,794 (612,917) 1,686,823 - 1,073,907
Group/Bank 2016 At 1 January Recognised in Recognised At 31 December
Deferred tax asset: 2016 Income Statement In Equity 2016 N’000 N’000 N’000 N’000
Unrealized foreign exchange gains/(losses) - (708,598) - (708,598) - (708,598) - (708,598)Deferred tax asset /(liability): (612,917) 978,226 - 365,309
31.1 The tax (charge)/credit relating to components of other comprehensive income is as follows:
2017 Before tax Tax (charge) /credit After tax
Fair value gains/(losses) on available-for-sale assets 6,562,441 - 6,562,441 2016 Before tax Tax (charge) /credit After tax
Fair value gains/(losses) on available-for-sale assets (3,898,226) - (3,898,226)
Notes to the Consolidated & Separate Financial Statements
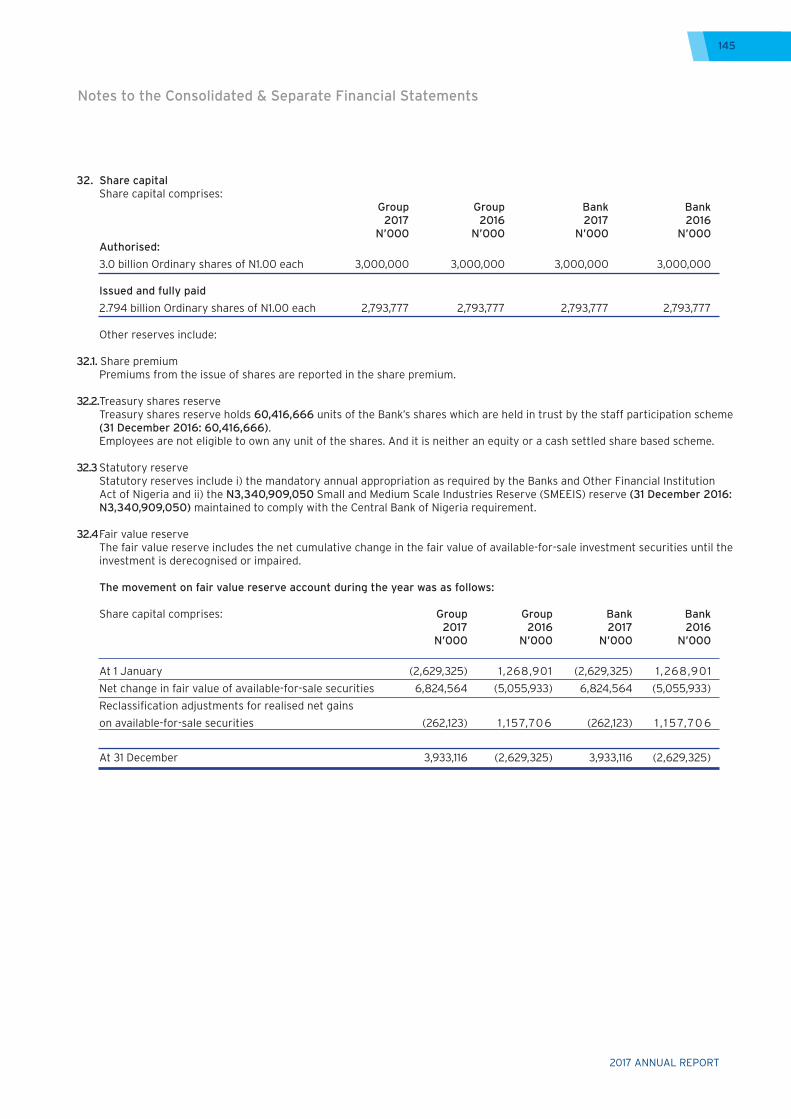
2017 ANNUAL REPORT
145
32. Share capital Share capital comprises:
Group Group Bank Bank 2017 2016 2017 2016 N’000 N’000 N’000 N’000
Authorised:
3.0 billion Ordinary shares of N1.00 each 3,000,000 3,000,000 3,000,000 3,000,000
Issued and fully paid
2.794 billion Ordinary shares of N1.00 each 2,793,777 2,793,777 2,793,777 2,793,777
Other reserves include:
32.1. Share premium Premiums from the issue of shares are reported in the share premium.
32.2. Treasury shares reserve Treasury shares reserve holds 60,416,666 units of the Bank’s shares which are held in trust by the staff participation scheme
(31 December 2016: 60,416,666). Employees are not eligible to own any unit of the shares. And it is neither an equity or a cash settled share based scheme.
32.3 Statutory reserve Statutory reserves include i) the mandatory annual appropriation as required by the Banks and Other Financial Institution
Act of Nigeria and ii) the N3,340,909,050 Small and Medium Scale Industries Reserve (SMEEIS) reserve (31 December 2016: N3,340,909,050) maintained to comply with the Central Bank of Nigeria requirement.
32.4 Fair value reserve The fair value reserve includes the net cumulative change in the fair value of available-for-sale investment securities until the
investment is derecognised or impaired.
The movement on fair value reserve account during the year was as follows:
Share capital comprises: Group Group Bank Bank 2017 2016 2017 2016 N’000 N’000 N’000 N’000
At 1 January (2,629,325) 1,268,901 (2,629,325) 1 ,268,901
Net change in fair value of available-for-sale securities 6,824,564 (5,055,933) 6,824,564 (5,055,933)
Reclassification adjustments for realised net gains
on available-for-sale securities (262,123) 1 ,157,706 (262,123) 1 , 1 57,70 6
At 31 December 3,933,116 (2,629,325) 3,933,116 (2,629,325)
Notes to the Consolidated & Separate Financial Statements
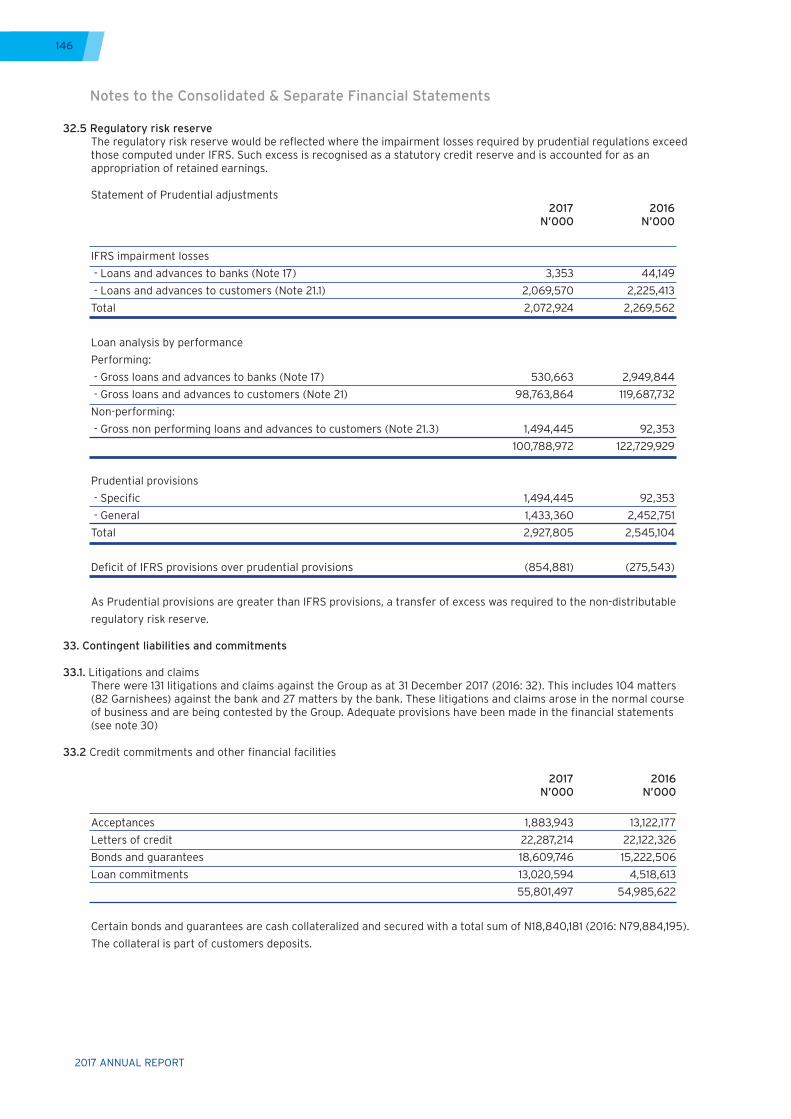
2017 ANNUAL REPORT
146
32.5 Regulatory risk reserve The regulatory risk reserve would be reflected where the impairment losses required by prudential regulations exceed
those computed under IFRS. Such excess is recognised as a statutory credit reserve and is accounted for as an appropriation of retained earnings.
Statement of Prudential adjustments 2017 2016 N’000 N’000
IFRS impairment losses
- Loans and advances to banks (Note 17) 3,353 44,149
- Loans and advances to customers (Note 21.1) 2,069,570 2,225,413
Total 2,072,924 2,269,562
Loan analysis by performance
Performing:
- Gross loans and advances to banks (Note 17) 530,663 2,949,844
- Gross loans and advances to customers (Note 21) 98,763,864 119,687,732
Non-performing:
- Gross non performing loans and advances to customers (Note 21.3) 1,494,445 92,353
100,788,972 122,729,929
Prudential provisions
- Specific 1,494,445 92,353
- General 1,433,360 2,452,751
Total 2,927,805 2,545,104
Deficit of IFRS provisions over prudential provisions (854,881) (275,543)
As Prudential provisions are greater than IFRS provisions, a transfer of excess was required to the non-distributable
regulatory risk reserve.
33. Contingent liabilities and commitments
33.1. Litigations and claims There were 131 litigations and claims against the Group as at 31 December 2017 (2016: 32). This includes 104 matters
(82 Garnishees) against the bank and 27 matters by the bank. These litigations and claims arose in the normal course of business and are being contested by the Group. Adequate provisions have been made in the financial statements (see note 30)
33.2 Credit commitments and other financial facilities
2017 2016
N’000 N’000
Acceptances 1,883,943 13,122,177
Letters of credit 22,287,214 22,122,326
Bonds and guarantees 18,609,746 15,222,506
Loan commitments 13,020,594 4,518,613
55,801,497 54,985,622
Certain bonds and guarantees are cash collateralized and secured with a total sum of N18,840,181 (2016: N79,884,195).
The collateral is part of customers deposits.
Notes to the Consolidated & Separate Financial Statements
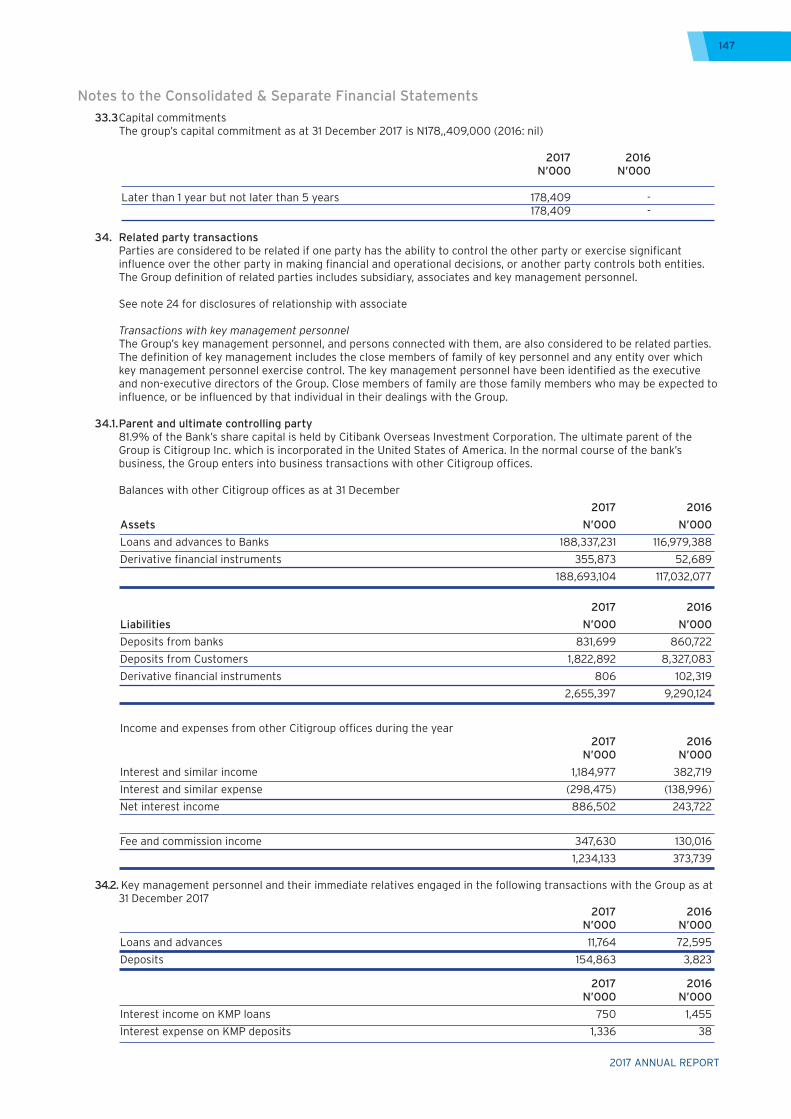
2017 ANNUAL REPORT
147
33.3 Capital commitments The group’s capital commitment as at 31 December 2017 is N178,,409,000 (2016: nil)
2017 2016 N’000 N’000
Later than 1 year but not later than 5 years 178,409 - 178,409 -
34. Related party transactions Parties are considered to be related if one party has the ability to control the other party or exercise significant
influence over the other party in making financial and operational decisions, or another party controls both entities. The Group definition of related parties includes subsidiary, associates and key management personnel.
See note 24 for disclosures of relationship with associate
Transactions with key management personnel The Group’s key management personnel, and persons connected with them, are also considered to be related parties.
The definition of key management includes the close members of family of key personnel and any entity over which key management personnel exercise control. The key management personnel have been identified as the executive and non-executive directors of the Group. Close members of family are those family members who may be expected to influence, or be influenced by that individual in their dealings with the Group.
34.1. Parent and ultimate controlling party 81.9% of the Bank’s share capital is held by Citibank Overseas Investment Corporation. The ultimate parent of the
Group is Citigroup Inc. which is incorporated in the United States of America. In the normal course of the bank’s business, the Group enters into business transactions with other Citigroup offices.
Balances with other Citigroup offices as at 31 December 2017 2016
Assets N’000 N’000
Loans and advances to Banks 188,337,231 116,979,388
Derivative financial instruments 355,873 52,689
188,693,104 117,032,077
2017 2016
Liabilities N’000 N’000
Deposits from banks 831,699 860,722
Deposits from Customers 1,822,892 8,327,083
Derivative financial instruments 806 102,319
2,655,397 9,290,124
Income and expenses from other Citigroup offices during the year 2017 2016 N’000 N’000
Interest and similar income 1,184,977 382,719
Interest and similar expense (298,475) (138,996)
Net interest income 886,502 243,722
Fee and commission income 347,630 130,016
1,234,133 373,739
34.2. Key management personnel and their immediate relatives engaged in the following transactions with the Group as at 31 December 2017
2017 2016 N’000 N’000
Loans and advances 11,764 72,595
Deposits 154,863 3,823
2017 2016 N’000 N’000
Interest income on KMP loans 750 1,455
Interest expense on KMP deposits 1,336 38
Notes to the Consolidated & Separate Financial Statements
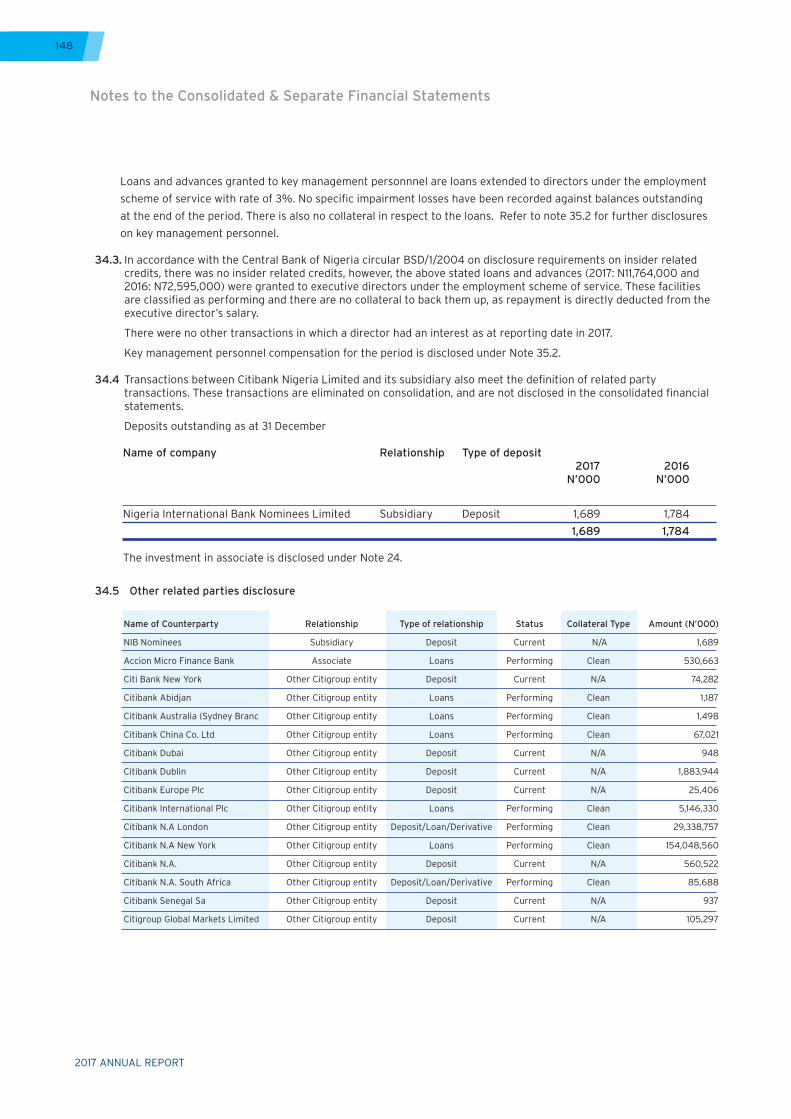
2017 ANNUAL REPORT
148
Loans and advances granted to key management personnnel are loans extended to directors under the employment
scheme of service with rate of 3%. No specific impairment losses have been recorded against balances outstanding
at the end of the period. There is also no collateral in respect to the loans. Refer to note 35.2 for further disclosures
on key management personnel. 34.3. In accordance with the Central Bank of Nigeria circular BSD/1/2004 on disclosure requirements on insider related
credits, there was no insider related credits, however, the above stated loans and advances (2017: N11,764,000 and 2016: N72,595,000) were granted to executive directors under the employment scheme of service. These facilities are classified as performing and there are no collateral to back them up, as repayment is directly deducted from the executive director’s salary.
There were no other transactions in which a director had an interest as at reporting date in 2017.
Key management personnel compensation for the period is disclosed under Note 35.2.
34.4 Transactions between Citibank Nigeria Limited and its subsidiary also meet the definition of related party transactions. These transactions are eliminated on consolidation, and are not disclosed in the consolidated financial statements.
Deposits outstanding as at 31 December
Name of company Relationship Type of deposit 2017 2016 N’000 N’000
Nigeria International Bank Nominees Limited Subsidiary Deposit 1,689 1,784
1,689 1,784
The investment in associate is disclosed under Note 24.
34.5 Other related parties disclosure
Name of Counterparty
NIB Nominees
Accion Micro Finance Bank
Citi Bank New York
Citibank Abidjan
Citibank Australia (Sydney Branc
Citibank China Co. Ltd
Citibank Dubai
Citibank Dublin
Citibank Europe Plc
Citibank International Plc
Citibank N.A London
Citibank N.A New York
Citibank N.A.
Citibank N.A. South Africa
Citibank Senegal Sa
Citigroup Global Markets Limited
Relationship
Subsidiary
Associate
Other Citigroup entity
Other Citigroup entity
Other Citigroup entity
Other Citigroup entity
Other Citigroup entity
Other Citigroup entity
Other Citigroup entity
Other Citigroup entity
Other Citigroup entity
Other Citigroup entity
Other Citigroup entity
Other Citigroup entity
Other Citigroup entity
Other Citigroup entity
Type of relationship
Deposit
Loans
Deposit
Loans
Loans
Loans
Deposit
Deposit
Deposit
Loans
Deposit/Loan/Derivative
Loans
Deposit
Deposit/Loan/Derivative
Deposit
Deposit
Amount (N’000)
1,689
530,663
74,282
1,187
1,498
67,021
948
1,883,944
25,406
5,146,330
29,338,757
154,048,560
560,522
85,688
937
105,297
Collateral Type
N/A
Clean
N/A
Clean
Clean
Clean
N/A
N/A
N/A
Clean
Clean
Clean
N/A
Clean
N/A
N/A
Status
Current
Performing
Current
Performing
Performing
Performing
Current
Current
Current
Performing
Performing
Performing
Current
Performing
Current
Current
Notes to the Consolidated & Separate Financial Statements
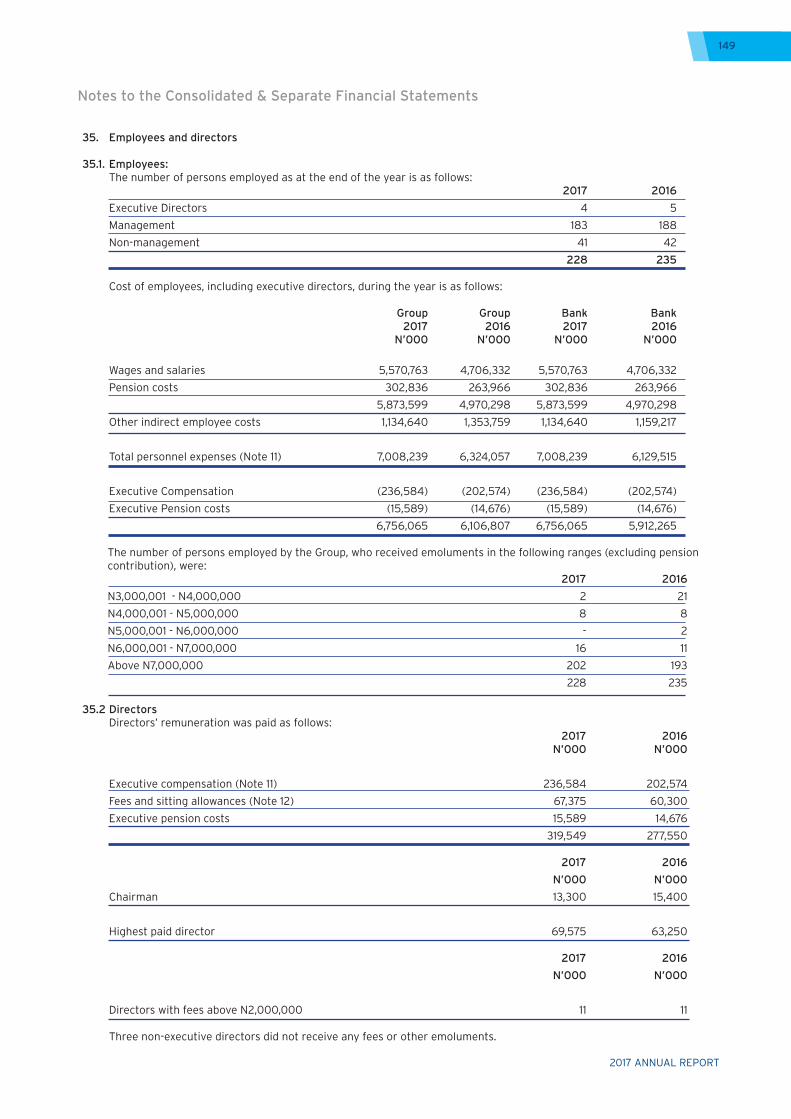
2017 ANNUAL REPORT
149
35. Employees and directors
35.1. Employees: The number of persons employed as at the end of the year is as follows:
2017 2016
Executive Directors 4 5
Management 183 188
Non-management 41 42
228 235
Cost of employees, including executive directors, during the year is as follows:
Group Group Bank Bank 2017 2016 2017 2016 N’000 N’000 N’000 N’000
Wages and salaries 5,570,763 4,706,332 5,570,763 4,706,332
Pension costs 302,836 263,966 302,836 263,966
5,873,599 4,970,298 5,873,599 4,970,298
Other indirect employee costs 1,134,640 1,353,759 1,134,640 1,159,217
Total personnel expenses (Note 11) 7,008,239 6,324,057 7,008,239 6,129,515
Executive Compensation (236,584) (202,574) (236,584) (202,574)
Executive Pension costs (15,589) (14,676) (15,589) (14,676)
6,756,065 6,106,807 6,756,065 5,912,265
The number of persons employed by the Group, who received emoluments in the following ranges (excluding pension contribution), were: 2017 2016
N3,000,001 - N4,000,000 2 21
N4,000,001 - N5,000,000 8 8
N5,000,001 - N6,000,000 - 2
N6,000,001 - N7,000,000 16 11
Above N7,000,000 202 193
228 235
35.2 Directors Directors’ remuneration was paid as follows: 2017 2016 N’000 N’000
Executive compensation (Note 11) 236,584 202,574
Fees and sitting allowances (Note 12) 67,375 60,300
Executive pension costs 15,589 14,676
319,549 277,550
2017 2016
N’000 N’000
Chairman 13,300 15,400
Highest paid director 69,575 63,250
2017 2016
N’000 N’000
Directors with fees above N2,000,000 11 11
Three non-executive directors did not receive any fees or other emoluments.
Notes to the Consolidated & Separate Financial Statements
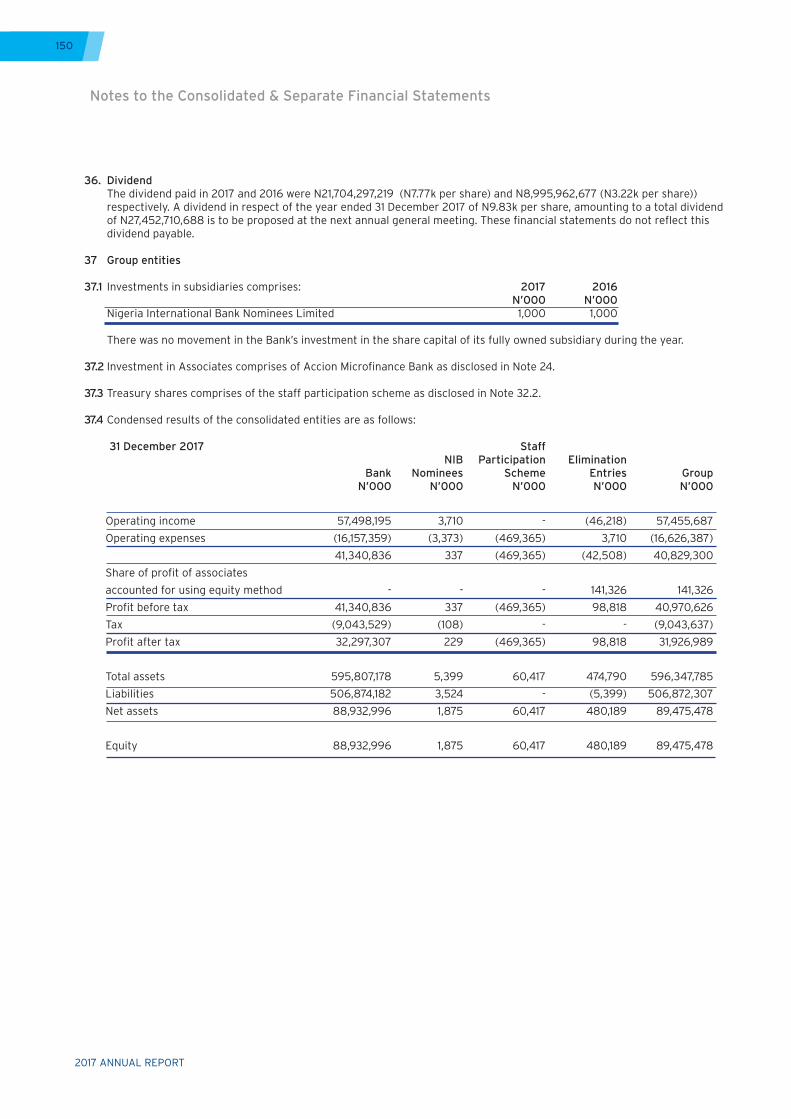
2017 ANNUAL REPORT
150
36. Dividend The dividend paid in 2017 and 2016 were N21,704,297,219 (N7.77k per share) and N8,995,962,677 (N3.22k per share))
respectively. A dividend in respect of the year ended 31 December 2017 of N9.83k per share, amounting to a total dividend of N27,452,710,688 is to be proposed at the next annual general meeting. These financial statements do not reflect this dividend payable.
37 Group entities
37.1 Investments in subsidiaries comprises: 2017 2016 N’000 N’000 Nigeria International Bank Nominees Limited 1,000 1,000
There was no movement in the Bank’s investment in the share capital of its fully owned subsidiary during the year.
37.2 Investment in Associates comprises of Accion Microfinance Bank as disclosed in Note 24.
37.3 Treasury shares comprises of the staff participation scheme as disclosed in Note 32.2.
37.4 Condensed results of the consolidated entities are as follows:
31 December 2017 Staff NIB Participation Elimination Bank Nominees Scheme Entries Group N’000 N’000 N’000 N’000 N’000
Operating income 57,498,195 3,710 - (46,218) 57,455,687
Operating expenses (16,157,359) (3,373) (469,365) 3,710 (16,626,387)
41,340,836 337 (469,365) (42,508) 40,829,300
Share of profit of associates
accounted for using equity method - - - 141,326 141,326
Profit before tax 41,340,836 337 (469,365) 98,818 40,970,626
Tax (9,043,529) (108) - - (9,043,637)
Profit after tax 32,297,307 229 (469,365) 98,818 31,926,989
Total assets 595,807,178 5,399 60,417 474,790 596,347,785
Liabilities 506,874,182 3,524 - (5,399) 506,872,307
Net assets 88,932,996 1,875 60,417 480,189 89,475,478
Equity 88,932,996 1,875 60,417 480,189 89,475,478
Notes to the Consolidated & Separate Financial Statements
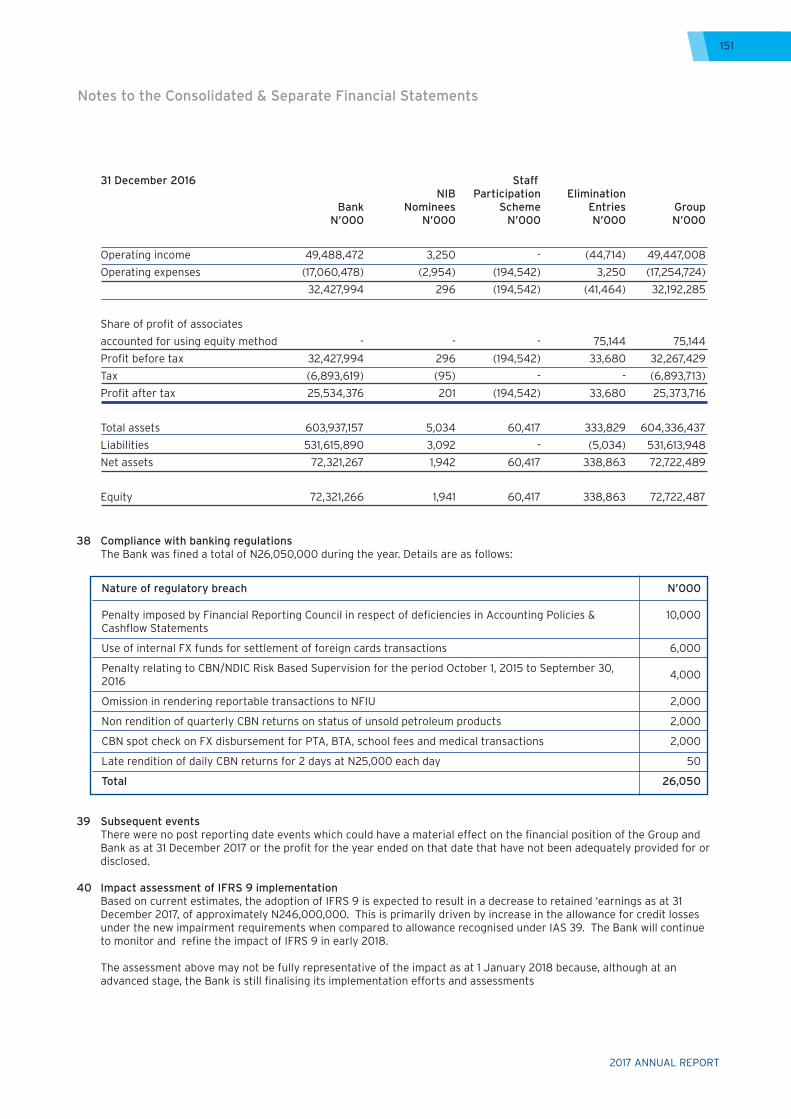
2017 ANNUAL REPORT
151
31 December 2016 Staff NIB Participation Elimination Bank Nominees Scheme Entries Group N’000 N’000 N’000 N’000 N’000
Operating income 49,488,472 3,250 - (44,714) 49,447,008
Operating expenses (17,060,478) (2,954) (194,542) 3,250 (17,254,724)
32,427,994 296 (194,542) (41,464) 32,192,285
Share of profit of associates
accounted for using equity method - - - 75,144 75,144
Profit before tax 32,427,994 296 (194,542) 33,680 32,267,429
Tax (6,893,619) (95) - - (6,893,713)
Profit after tax 25,534,376 201 (194,542) 33,680 25,373,716
Total assets 603,937,157 5,034 60,417 333,829 604,336,437
Liabilities 531,615,890 3,092 - (5,034) 531,613,948
Net assets 72,321,267 1,942 60,417 338,863 72,722,489
Equity 72,321,266 1,941 60,417 338,863 72,722,487
38 Compliance with banking regulations The Bank was fined a total of N26,050,000 during the year. Details are as follows:
Nature of regulatory breach
Penalty imposed by Financial Reporting Council in respect of deficiencies in Accounting Policies & Cashflow Statements
Use of internal FX funds for settlement of foreign cards transactions
Penalty relating to CBN/NDIC Risk Based Supervision for the period October 1, 2015 to September 30, 2016
Omission in rendering reportable transactions to NFIU
Non rendition of quarterly CBN returns on status of unsold petroleum products
CBN spot check on FX disbursement for PTA, BTA, school fees and medical transactions
Late rendition of daily CBN returns for 2 days at N25,000 each day
Total
N’000
10,000
6,000
4,000
2,000
2,000
2,000
50
26,050
39 Subsequent events There were no post reporting date events which could have a material effect on the financial position of the Group and
Bank as at 31 December 2017 or the profit for the year ended on that date that have not been adequately provided for or disclosed.
40 Impact assessment of IFRS 9 implementation Based on current estimates, the adoption of IFRS 9 is expected to result in a decrease to retained ‘earnings as at 31
December 2017, of approximately N246,000,000. This is primarily driven by increase in the allowance for credit losses under the new impairment requirements when compared to allowance recognised under IAS 39. The Bank will continue to monitor and refine the impact of IFRS 9 in early 2018.
The assessment above may not be fully representative of the impact as at 1 January 2018 because, although at an advanced stage, the Bank is still finalising its implementation efforts and assessments
Notes to the Consolidated & Separate Financial Statements
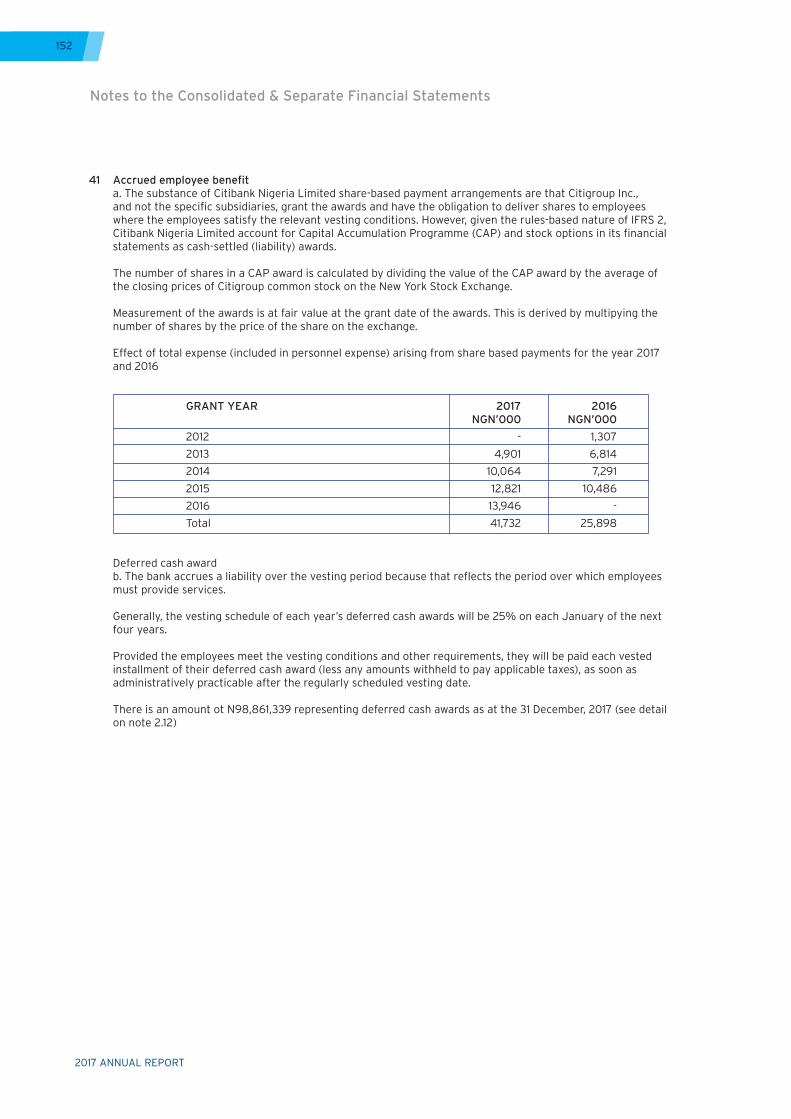
2017 ANNUAL REPORT
152
41 Accrued employee benefit a. The substance of Citibank Nigeria Limited share-based payment arrangements are that Citigroup Inc.,
and not the specific subsidiaries, grant the awards and have the obligation to deliver shares to employees where the employees satisfy the relevant vesting conditions. However, given the rules-based nature of IFRS 2, Citibank Nigeria Limited account for Capital Accumulation Programme (CAP) and stock options in its financial statements as cash-settled (liability) awards.
The number of shares in a CAP award is calculated by dividing the value of the CAP award by the average of the closing prices of Citigroup common stock on the New York Stock Exchange.
Measurement of the awards is at fair value at the grant date of the awards. This is derived by multipying the number of shares by the price of the share on the exchange.
Effect of total expense (included in personnel expense) arising from share based payments for the year 2017 and 2016
GRANT YEAR 2017 2016 NGN’000 NGN’000
2012 - 1,307
2013 4,901 6,814
2014 10,064 7,291
2015 12,821 10,486
2016 13,946 -
Total 41,732 25,898
Deferred cash awardb. The bank accrues a liability over the vesting period because that reflects the period over which employees must provide services.
Generally, the vesting schedule of each year’s deferred cash awards will be 25% on each January of the next four years.
Provided the employees meet the vesting conditions and other requirements, they will be paid each vested installment of their deferred cash award (less any amounts withheld to pay applicable taxes), as soon as administratively practicable after the regularly scheduled vesting date.
There is an amount ot N98,861,339 representing deferred cash awards as at the 31 December, 2017 (see detail on note 2.12)
Notes to the Consolidated & Separate Financial Statements
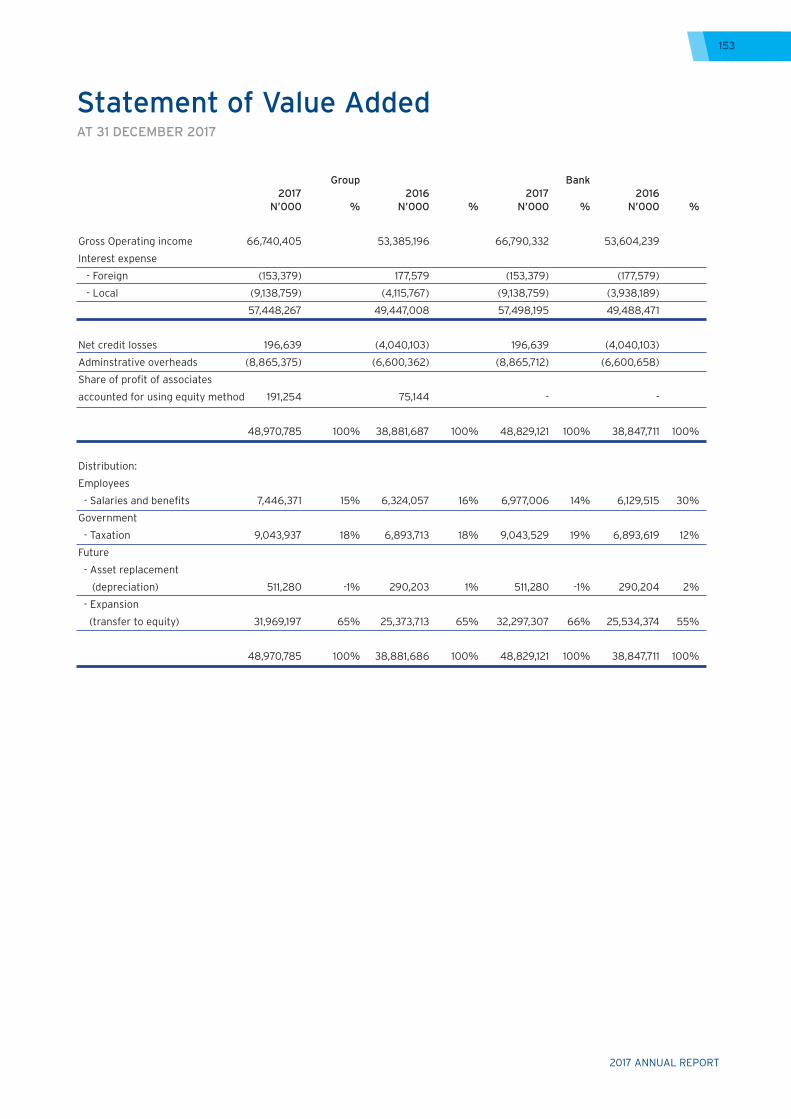
2017 ANNUAL REPORT
153
Group Bank 2017 2016 2017 2016 N’000 % N’000 % N’000 % N’000 %
Gross Operating income 66,740,405 53,385,196 66,790,332 53,604,239
Interest expense
- Foreign (153,379) 177,579 (153,379) (177,579)
- Local (9,138,759) (4,115,767) (9,138,759) (3,938,189)
57,448,267 49,447,008 57,498,195 49,488,471
Net credit losses 196,639 (4,040,103) 196,639 (4,040,103)
Adminstrative overheads (8,865,375) (6,600,362) (8,865,712) (6,600,658)
Share of profit of associates
accounted for using equity method 191,254 75,144 - -
48,970,785 100% 38,881,687 100% 48,829,121 100% 38,847,711 100%
Distribution:
Employees
- Salaries and benefits 7,446,371 15% 6,324,057 16% 6,977,006 14% 6,129,515 30%
Government
- Taxation 9,043,937 18% 6,893,713 18% 9,043,529 19% 6,893,619 12%
Future
- Asset replacement
(depreciation) 511,280 -1% 290,203 1% 511,280 -1% 290,204 2%
- Expansion
(transfer to equity) 31,969,197 65% 25,373,713 65% 32,297,307 66% 25,534,374 55%
48,970,785 100% 38,881,686 100% 48,829,121 100% 38,847,711 100%
Statement of Value AddedAT 31 DECEMBER 2017
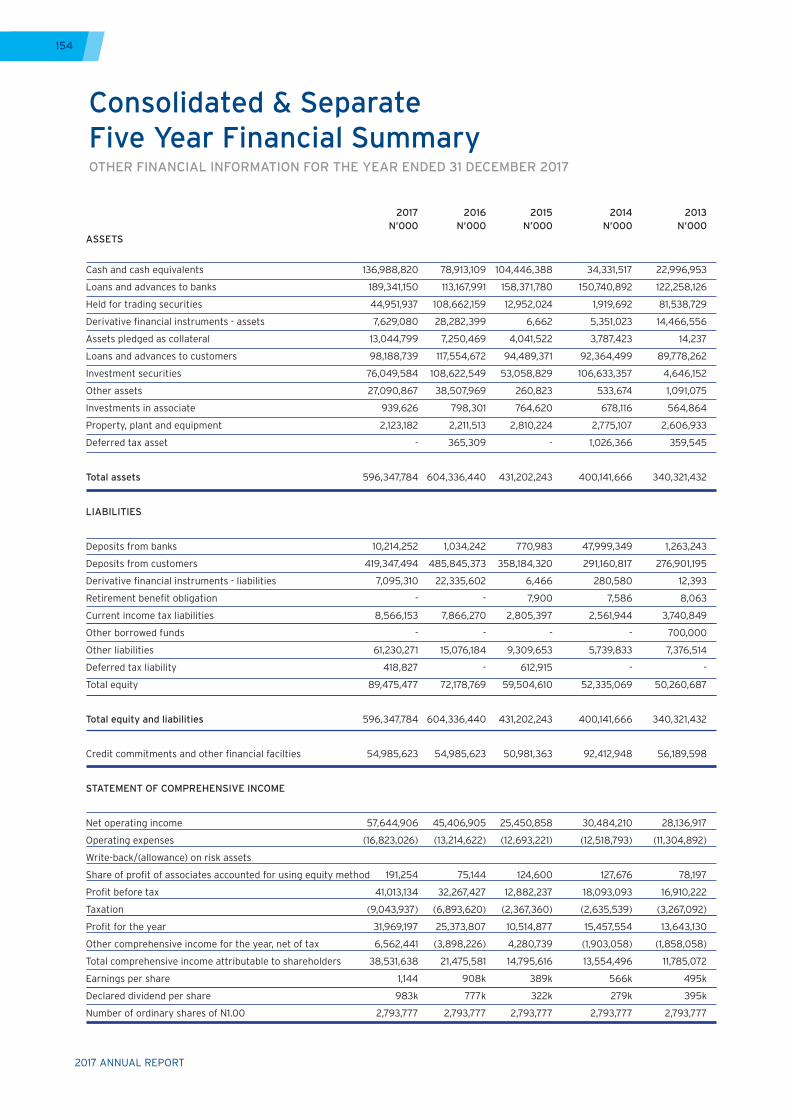
2017 ANNUAL REPORT
154
2017 2016 2015 2014 2013 N’000 N’000 N’000 N’000 N’000 ASSETS
Cash and cash equivalents 136,988,820 78,913,109 104,446,388 34,331,517 22,996,953
Loans and advances to banks 189,341,150 113,167,991 158,371,780 150,740,892 122,258,126
Held for trading securities 44,951,937 108,662,159 12,952,024 1,919,692 81,538,729
Derivative financial instruments - assets 7,629,080 28,282,399 6,662 5,351,023 14,466,556
Assets pledged as collateral 13,044,799 7,250,469 4,041,522 3,787,423 14,237
Loans and advances to customers 98,188,739 117,554,672 94,489,371 92,364,499 89,778,262
Investment securities 76,049,584 108,622,549 53,058,829 106,633,357 4,646,152
Other assets 27,090,867 38,507,969 260,823 533,674 1,091,075
Investments in associate 939,626 798,301 764,620 678,116 564,864
Property, plant and equipment 2,123,182 2,211,513 2,810,224 2,775,107 2,606,933
Deferred tax asset - 365,309 - 1,026,366 359,545
Total assets 596,347,784 604,336,440 431,202,243 400,141,666 340,321,432
LIABILITIES
Deposits from banks 10,214,252 1,034,242 770,983 47,999,349 1,263,243
Deposits from customers 419,347,494 485,845,373 358,184,320 291,160,817 276,901,195
Derivative financial instruments - liabilities 7,095,310 22,335,602 6,466 280,580 12,393
Retirement benefit obligation - - 7,900 7,586 8,063
Current income tax liabilities 8,566,153 7,866,270 2,805,397 2,561,944 3,740,849
Other borrowed funds - - - - 700,000
Other liabilities 61,230,271 15,076,184 9,309,653 5,739,833 7,376,514
Deferred tax liability 418,827 - 612,915 - -
Total equity 89,475,477 72,178,769 59,504,610 52,335,069 50,260,687
Total equity and liabilities 596,347,784 604,336,440 431,202,243 400,141,666 340,321,432
Credit commitments and other financial facilties 54,985,623 54,985,623 50,981,363 92,412,948 56,189,598
STATEMENT OF COMPREHENSIVE INCOME
Net operating income 57,644,906 45,406,905 25,450,858 30,484,210 28,136,917
Operating expenses (16,823,026) (13,214,622) (12,693,221) (12,518,793) (11,304,892)
Write-back/(allowance) on risk assets
Share of profit of associates accounted for using equity method 191,254 75,144 124,600 127,676 78,197
Profit before tax 41,013,134 32,267,427 12,882,237 18,093,093 16,910,222
Taxation (9,043,937) (6,893,620) (2,367,360) (2,635,539) (3,267,092)
Profit for the year 31,969,197 25,373,807 10,514,877 15,457,554 13,643,130
Other comprehensive income for the year, net of tax 6,562,441 (3,898,226) 4,280,739 (1,903,058) (1,858,058)
Total comprehensive income attributable to shareholders 38,531,638 21,475,581 14,795,616 13,554,496 11,785,072
Earnings per share 1,144 908k 389k 566k 495k
Declared dividend per share 983k 777k 322k 279k 395k
Number of ordinary shares of N1.00 2,793,777 2,793,777 2,793,777 2,793,777 2,793,777
Consolidated & Separate Five Year Financial SummaryOTHER FINANCIAL INFORMATION FOR THE YEAR ENDED 31 DECEMBER 2017
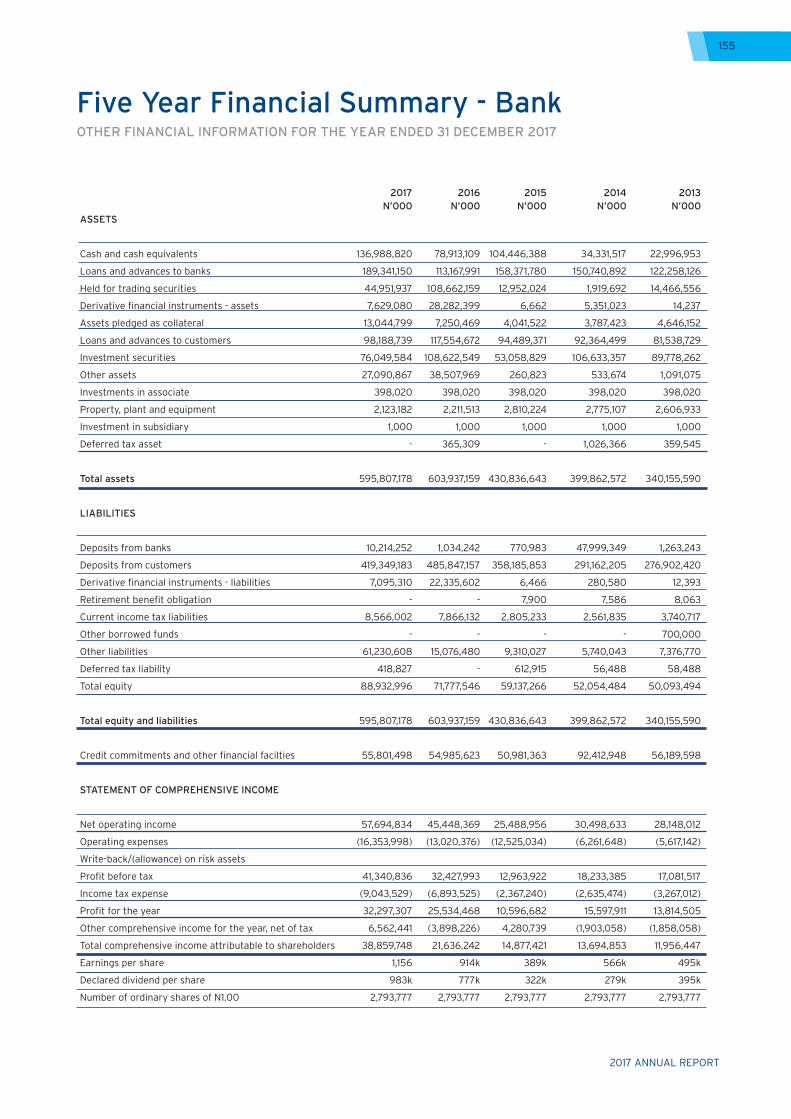
2017 ANNUAL REPORT
155
2017 2016 2015 2014 2013 N’000 N’000 N’000 N’000 N’000 ASSETS
Cash and cash equivalents 136,988,820 78,913,109 104,446,388 34,331,517 22,996,953
Loans and advances to banks 189,341,150 113,167,991 158,371,780 150,740,892 122,258,126
Held for trading securities 44,951,937 108,662,159 12,952,024 1,919,692 14,466,556
Derivative financial instruments - assets 7,629,080 28,282,399 6,662 5,351,023 14,237
Assets pledged as collateral 13,044,799 7,250,469 4,041,522 3,787,423 4,646,152
Loans and advances to customers 98,188,739 117,554,672 94,489,371 92,364,499 81,538,729
Investment securities 76,049,584 108,622,549 53,058,829 106,633,357 89,778,262
Other assets 27,090,867 38,507,969 260,823 533,674 1,091,075
Investments in associate 398,020 398,020 398,020 398,020 398,020
Property, plant and equipment 2,123,182 2,211,513 2,810,224 2,775,107 2,606,933
Investment in subsidiary 1,000 1,000 1,000 1,000 1,000
Deferred tax asset - 365,309 - 1,026,366 359,545
Total assets 595,807,178 603,937,159 430,836,643 399,862,572 340,155,590
LIABILITIES
Deposits from banks 10,214,252 1,034,242 770,983 47,999,349 1,263,243
Deposits from customers 419,349,183 485,847,157 358,185,853 291,162,205 276,902,420
Derivative financial instruments - liabilities 7,095,310 22,335,602 6,466 280,580 12,393
Retirement benefit obligation - - 7,900 7,586 8,063
Current income tax liabilities 8,566,002 7,866,132 2,805,233 2,561,835 3,740,717
Other borrowed funds - - - - 700,000
Other liabilities 61,230,608 15,076,480 9,310,027 5,740,043 7,376,770
Deferred tax liability 418,827 - 612,915 56,488 58,488
Total equity 88,932,996 71,777,546 59,137,266 52,054,484 50,093,494
Total equity and liabilities 595,807,178 603,937,159 430,836,643 399,862,572 340,155,590
Credit commitments and other financial facilties 55,801,498 54,985,623 50,981,363 92,412,948 56,189,598
STATEMENT OF COMPREHENSIVE INCOME
Net operating income 57,694,834 45,448,369 25,488,956 30,498,633 28,148,012
Operating expenses (16,353,998) (13,020,376) (12,525,034) (6,261,648) (5,617,142)
Write-back/(allowance) on risk assets
Profit before tax 41,340,836 32,427,993 12,963,922 18,233,385 17,081,517
Income tax expense (9,043,529) (6,893,525) (2,367,240) (2,635,474) (3,267,012)
Profit for the year 32,297,307 25,534,468 10,596,682 15,597,911 13,814,505
Other comprehensive income for the year, net of tax 6,562,441 (3,898,226) 4,280,739 (1,903,058) (1,858,058)
Total comprehensive income attributable to shareholders 38,859,748 21,636,242 14,877,421 13,694,853 11,956,447
Earnings per share 1,156 914k 389k 566k 495k
Declared dividend per share 983k 777k 322k 279k 395k
Number of ordinary shares of N1.00 2,793,777 2,793,777 2,793,777 2,793,777 2,793,777
Five Year Financial Summary - BankOTHER FINANCIAL INFORMATION FOR THE YEAR ENDED 31 DECEMBER 2017

2017 ANNUAL REPORT
156
2017 in Pictures

2017 ANNUAL REPORT
157

158

Citibank Nigeria Limited 2017 ANNUAL REPORT
© 2017 Citibank, N.A. All rights reserved. Citi and Arc Design is a trademark and service mark of Citigroup Inc., used and registered throughout the world.
GRA00000 00/00
CIT
IBA
NK
NIG
ER
IA L
IMIT
ED
| 20
17 A
nn
ua
l Re
po
rt