2017 ANNUAL REPORT CANCOM SE 2017€¦ · 126 Notes to the company accounts SE 136 Responsibility...
146
ANNUAL REPORT CANCOM SE 2017
Transcript of 2017 ANNUAL REPORT CANCOM SE 2017€¦ · 126 Notes to the company accounts SE 136 Responsibility...

CANCOM SEErika-Mann-Straße 6980636 MünchenPhone +49 89 54054–[email protected]
ANNUAL REPORTCANCOM SE
CA
NC
OM
SE
AN
NU
AL
RE
PO
RT
2017
2017

CANCOM GROUP (IN € MILLION)
2017 2016 2015 2014 2013
Sales revenues 1,161.2 1,023.1 932.8 828.9 613.8
Gross profit 321.8 292.7 274.2 257.7 186.5
EBITDA 84.5 72.9 63.1 51.6 33.1
EBITDA margin 7.3% 7.1% 6.8% 6.2% 5,4%
EBITA 69.7 59.5 50.5 40.3 25.3
EBIT 60.5 51.3 41.1 28.8 22.4
Earnings per share from continuing operations (basic) 2.40 € 2.11 € 1.99 € 1.27 € 1.22 €
Group key figures
Balance sheet total 692.1 537.8 436.3 439.3 319.6
Equity 364.3 285.1 204.3 193.8 162.7
Equity ratio 52.6% 53.0% 46.8% 44.1% 50.9%
Total staff at December 31 2,913 2,654 2,724 2,909 2,360
EBITDA margin
2013 2014 2015 2016 2017
6.8%6.2%5.4%7.1%
EBITDA per staff member
2013 2014 2015 2016 2017
€ 23k€ 18k
€ 14k
€ 27k7.3%
€ 29k
1CANCOM GROUP
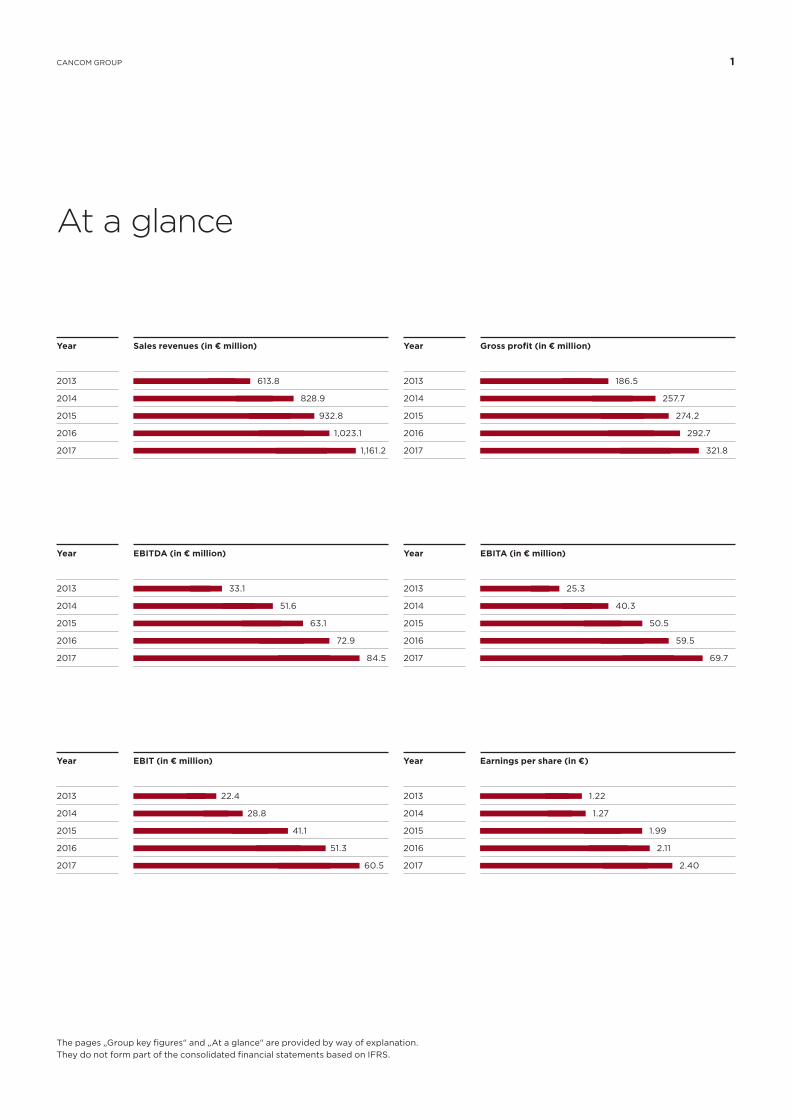
At a glance
Year Sales revenues (in € million)
2013 613.8
2014 828.9
2015 932.8
2016 1,023.1
2017 1,161.2
Year Gross profit (in € million)
2013 186.5
2014 257.7
2015 274.2
2016 292.7
2017 321.8
Year EBITDA (in € million)
2013 33.1
2014 51.6
2015 63.1
2016 72.9
2017 84.5
Year Earnings per share (in €)
2013 1.22
2014 1.27
2015 1.99
2016 2.11
2017 2.40
The pages „Group key figures“ and „At a glance“ are provided by way of explanation. They do not form part of the consolidated financial statements based on IFRS.
Year EBITA (in € million)
2013 25.3
2014 40.3
2015 50.5
2016 59.5
2017 69.7
Year EBIT (in € million)
2013 22.4
2014 28.8
2015 41.1
2016 51.3
2017 60.5


3TABLE OF CONTENTS
Table of contents
4 TO OUR SHAREHOLDERS
4 Letter to our stockholders
6 Report of the Supervisory Board
10 Corporate Governance report
16 CANCOM on the capital market
20 COMBINED MANAGEMENT REPORT
56 CONSOLIDATED FINANCIAL STATEMENTS
66 Notes to the consolidated financial statements
113 Responsibility statements
114 Auditors’ report for the Group
120 COMPANY FINANCIAL STATEMENTS CANCOM SE
126 Notes to the company accounts SE
136 Responsibility statements
137 Auditors’ report for CANCOM SE

4
Dear Shareholders,
Our primary objective in 2017 was to take advantage of the rapidly changing IT market environment to achieve substantial and visible growth. The Executive Board, along with all the staff, achieved this objective very convincingly in the past year. By substantial growth, we are of course referring to the increase in the volume of business, but mainly the steady development of the CANCOM Group into a high-margin ‘Leading Digital Transforma-tion Partner’.
This was the vision we set for CANCOM in its 25th anniversary year. It combines everything that has always set us apart, yet it is also the foundation for our future success. We are adaptable and always have our finger on the pulse of the IT market yet, despite all our innovations, we never forget our roots. In concrete terms, this means that we aim to generate sustainable, regular income from the increasingly sought-after cloud and managed services business and from providing high-quality advice to companies undergoing digital transformation. With this in mind, in 2017 we acquired synaix, a company that perfectly combines IT services and the concept of ‘Business IT as a Service’ specifically for digital business models. However, we also made large-scale investments in our new service factory at our office in Jettingen-Scheppach, Germany, where we have created capacity second to none in Germany for logistics and the roll-out of IT projects. This is because we believe that companies continue to need practical IT infrastructure solutions in addition to service and expertise. As a ‘Leading Digital Transformation Partner’ we aim to offer our clients everything they need for success in the digitized economy under one roof.
Following our very positive growth in the past few years, in the fiscal year 2017 we also adjusted our internal structures to the increased volume of business and the changing markets and chal-lenges. The most visible sign of this is the expansion of the Exec-utive Board of CANCOM SE, but we also expanded the CANCOM Group’s management structures and attracted a large number of new staff. This is particularly gratifying in the competitive market for IT experts.
This expansion can also be seen as a signal that we do not intend to rest on our laurels, but will keep aiming high. We plan to grow further, yet to continue increasing our EBITDA margin, using the financial means available to us to reach our targets. For this reason our plans for 2018 target significant further growth in both Group segments.
We are grateful to you, our shareholders, for your investment and your trust in CANCOM. We also thank our partners and clients for their support, and our staff for the work they accomplished in the fiscal year 2017.
Executive Board of CANCOM SE
LETTER TO OUR STOCKHOLDERS
Klaus Weinmann Rudolf HotterCEO COO
Thomas Volk Thomas StarkPresident & General Manager CFO

6
Report of the Supervisory Board
Dear Shareholders,
CANCOM SE looks back on a successful fiscal year 2017. As the elected representatives of the stockholders of CANCOM, the Super-visory Board of CANCOM SE congratulates the Executive Board and the staff members of the CANCOM Group on the company‘s excellent performance. We would also like to thank them for the good and open-minded cooperation. We also wish to thank CANCOM’s stockholders for their trust.
The CANCOM Group is well positioned to continue the company’s growth and to meet the challenges brought about by digital trans-formation. During the past year, the Supervisory Board guided the work of the Executive Board of CANCOM SE, and gave advice when necessary. After a successful fiscal year, the management decided to propose to the general meeting of stockholders that a dividend be paid again this year.
The Supervisory Board carried out the tasks set by law, the corpo-rate by-laws and the rules of procedure in the fiscal year 2017. It advised the Executive Board on matters of corporate management, and assisted with and supervised the management and develop-ment of the business. To maintain the usual close cooperation between the boards, the Executive Board used a combination of written correspondence, phone calls and face-to-face discussions to inform the members of the Supervisory Board promptly of any matters arising. This meant that the Supervisory Board was updated regularly and comprehensively on the company’s situation and its prospects, the principles of corporate policy, the company’s profitability and major business transactions. Between the scheduled meetings, the CEO in particular was in commu-nication with the members of the Supervisory Board, especially the Chairperson. The entire Supervisory Board was also kept informed of relevant developments and transactions requiring approval. The Supervisory Board was consulted directly and in good time when decisions had to be made that were of funda-mental importance for the company, or where its involvement was required by law, the corporate by-laws or the rules of procedure. In urgent cases, the option of passing resolutions in writing was open to the Supervisory Board. Because it was updated promptly, thoroughly and at regular intervals by the Executive Board, the Supervisory Board was able to perform its supervisory and advisory functions at all times. The Supervisory Board therefore considers that the Executive Board acted lawfully, properly and appropriately in every respect.
A. Meetings and key topics
The IT sector will continue to face further great challenges and profound change, partly owing to the ever-increasing digitization and networking of economy and society. This also continues to present plenty of opportunities for the IT sector. Throughout the year 2017, therefore, these profound changes were the subject of regular and intensive debates between the Executive Board and the Supervisory Board on market developments and on the devel-opment of different areas of business. They were also a topic of discussion at meetings and talks on the Group’s strategic direction and on the appropriate organisational and management structure to meet the CANCOM Group’s ambitious growth targets.
The Supervisory Board held six meetings during the fiscal year 2017, on March 1, March 23, June 20, September 14, October 6 and December 5. All the meetings were attended in person by all the incumbent Supervisory Board members.
In their meetings, the Supervisory Board received regular reports from the Executive Board in accordance with Section 90, para-graph 1, sentence 1, numbers 1 to 3 of the German Stock Corpora-tion Act (Aktiengesetz, AktG) on the intended corporate policy and the profitability and performance of the business, including the situation with regard to the market and competition. The reports were discussed in depth by the Supervisory Board. The Executive Board also reported, in accordance with Section 90, paragraph 1, sentence 1, numbers 1 to 4, on businesses that could be of major importance to the profitability or solvency of CANCOM SE and/or the Group, especially planned acquisitions and divestments.
The following topics and resolutions relating to the activities of the Supervisory Board in the fiscal year 2017 are particularly noteworthy:
• In its telephone meeting on March 1, 2017 the Supervisory Board decided, at the recommendation of its Nominating Committee, to make a court application for the appointment of Martin Wild to the company’s Supervisory Board.
• In its meeting on March 23, 2017 the Supervisory Board received the auditor’s report on the annual financial statements of CANCOM SE and the CANCOM Group for 2016. Following in-depth discussions, the annual financial statements of the company and the Group were approved by the Supervisory Board along with the combined management report for CANCOM SE and the Group. The annual financial statements were thus adopted. The Supervisory Board also discussed its
REPORT OF THE SUPERVISORY BOARD

7
own report and the corporate governance report in the annual report for 2016. Also in the meeting on March 23, the Super-visory Board passed resolutions on matters concerning the Executive Board, including the extension of Klaus Weinmann’s tenure as CEO and his new contract of employment starting on January 1, 2018.
• In its meeting on June 20, 2017, following lengthy fact finding and discussions, the Supervisory Board approved the acquisi-tion of all of the shares of the synaix group. Based in Aachen, Germany, the synaix group consists of synaix Gesellschaft für angewandte Informations-Technologien mbH and synaix Service GmbH. The Supervisory Board also passed a resolution in writing on July 10, 2017 approving the issue of new shares from authorized capital for a non-cash contribution in connec-tion with the acquisition of the shares of the synaix group. In the same meeting, the Supervisory Board approved the rest-ructuring of the schedule of responsibilities for the Executive Board. This provides for an enlarged Executive Board to prepare the CANCOM Group for its future growth.
• In its telephone meeting on October 6, 2017 following lengthy fact finding and discussions, the Supervisory Board decided to appoint Thomas Volk to the Executive Board of CANCOM SE with effect from November 1, 2017 and draw up a service cont-ract effective from the same date.
• In the Supervisory Board meeting on December 5, 2017 the business plans for 2018 were presented by the Executive Board and approved by the Supervisory Board. The Supervisory Board was also given a report on CANCOM SE’s system of internal audit and risk and compliance management. The relevance for CANCOM SE of the recommendations of the German Corpo-rate Governance Code was discussed at length. In line with the recommendation of the Code, the Supervisory Board set targets for its own composition and drew up a competency profile for the entire Supervisory Board. The Supervisory Board also undertook a critical review of the remuneration system and the level of remuneration of the Executive Board. Due to the successful business performance, the Supervisory Board saw no reason to adjust the remuneration or the remuneration system, which it considers to be appropriate. Another agenda item was the recommendation of the German Corporate Governance Code that the Supervisory Board undertake an assessment of its own efficiency, which found there was no need for improvement.
The declaration of conformity with the German Corporate Governance Code was then approved. Also in the meeting on December 5, 2017 after prior fact finding and lengthy discus-sions, the Supervisory Board decided to appoint Thomas Stark to the Executive Board of CANCOM SE with effect from January 1, 2018, and approved the drawing up of a service contract effec-tive from the same date. The Supervisory Board also modified the schedule of responsibilities for the Executive Board to reflect its enlargement.
B. Composition of the Executive Board and the Supervisory Board
There was a change in the composition of the Executive Board of CANCOM SE in the fiscal year 2017. CEO Klaus Weinmann and Rudolf Hotter retained their positions on the Executive Board of CANCOM SE. With effect from November 1, 2017, the Supervisory Board appointed Thomas Volk as a new member to the Executive Board. As President and General Manager, the new Executive Board Member is mainly responsible for the Group’s go-to-market strategy, in addition to marketing, sales, consulting and interna-tional business.
The Supervisory Board appointed Thomas Stark as an additional member of the Executive Board with effect from January 1, 2018. His divisional responsibilities include finance, governance, risk and compliance, investor relations, legal, and human resources, in addition to corporate information systems and security.
The members of the Supervisory Board of CANCOM SE in the fiscal year 2017 were: Dr. Lothar Koniarski, Uwe Kemm, Regina Weinmann, Dominik Eberle, Walter Krejci (until March 20, 2017), Martin Wild (with effect from March 27, 2017) und Marlies Terock (with effect from June 6, 2017). Alongside Dr. Lothar Koniarski as the Chairperson of the Supervisory Board was Deputy Chair-person Uwe Kemm. Dr. Lothar Koniarski fulfils the requirement of Section 100, paragraph 5 first half sentence of the German Stock Corporation Act for one member of the Supervisory Board to have expertise in the areas of accounting or audit.
REPORT OF THE SUPERVISORY BOARD

8
C. Composition and work of the committees
To help it to perform its function, the Supervisory Board has formed two committees. In the year under review, the Audit Committee comprised Dr. Lothar Koniarski, Uwe Kemm and Dominik Eberle. The offices of Chairperson and Deputy Chair-person of the Audit Committee were occupied by Uwe Kemm (Chairperson), Dr. Lothar Koniarski (Deputy Chairperson). The Audit Committee as a whole had relevant sector expertise at all times. The Audit Committee met on March 23, 2017. All members of the Committee attended the meeting.
In the year under review, the Nominating Committee comprised Dr. Lothar Koniarski, Regina Weinmann and Uwe Kemm. The Chairperson and Deputy Chairperson of the Nominating Committee were Dr. Lothar Koniarski (Chairperson) and Uwe Kemm (Deputy Chairperson).
The Nominating Committee discussed at length the composition of the Supervisory Board. All Committee members attended the meetings held on February 14, 2017 and on April 4, 2017, in which they discussed the process of the filling vacancies on the Supervisory Board. Based on prior discussions and deliberations, it was decided to recommend to the Supervisory Board that Martin Wild be appointed to the Supervisory Board by the court, and to propose Marlies Terock as a candidate for election at the general meeting of stockholders.
D. Corporate Governance and declaration of conformity
The work of the Supervisory Board is governed by the regulations of the German Stock Corporation Act, as well as the recommenda-tions of the German Corporate Governance Code.
The meeting of the Supervisory Board on December 5, 2017 covered the relevant recommendations of the Corporate Gover-nance Code of February 7, 2017, and examined the extent to which the Code has been implemented. In the past year, CANCOM complied with all the recommendations of the Code. The compa-ny‘s corporate governance guidelines are presented in detail in the corporate governance report within this financial report.
E. Annual financial statements of CANCOM SE and the CANCOM Group
The annual financial statements prepared by the Executive Board and the combined management report for CANCOM SE and the Group for the fiscal year 2017 were audited by S&P GmbH Wirtschaftsprüfungsgesellschaft, Augsburg, Germany – the auditing firm appointed by the general meeting of shareholders – under the supervision of certified auditor and tax consultant Ulrich Stauber, managing director of S&P GmbH. S&P GmbH Wirtschaftsprüfungsgesellschaft has been auditing CANCOM’s annual financial statements since 1999, and this is the sixth year that Ulrich Stauber has been the lead auditor for CANCOM SE. The auditor conducted the audit in accordance with Section 317 of the German Commercial Code (Handelsgesetzbuch, HGB), in compliance with the German standards for the audit of financial statements laid down by the German Institute of Auditors (Institut der Wirtschaftsprüfer, IDW). The auditor gave his unqualified approval to all the financial statements.
The annual financial statements of CANCOM SE and the consoli-dated financial statements of the CANCOM Group, the combined management report, the auditor‘s report and the Executive Board‘s proposal for appropriation of the net retained profit for the year were submitted to all Supervisory Board members in good time for the passing of a resolution to approve them on March 16, 2018. The auditor gave the Supervisory Board a report on the audit process and the main findings, and was available to answer questions, discuss the report and provide additional information where needed. He took part in the Supervisory Board‘s discussion of the financial statements and the Audit Committee‘s meeting on March 16, 2018, as well as the meeting of the Supervisory Board to approve the balance sheet, also on March 16, 2018.
The Audit Committee of the Supervisory Board held a meeting on March 16, 2018. The meeting dealt with the financial statements and the combined management report for CANCOM SE and the Group, as well as the Executive Board’s proposal for appropria-tion of the net retained profit for the year and the payment of a dividend of € 1.00 per share. The proposal was backed by the entire Supervisory Board. The Audit Committee also made a recommendation as to the Supervisory Board’s proposal to the general meeting of stockholders regarding the appointment of an auditor. Prior to this, the Supervisory Board obtained a written independence declaration from the auditor. The Supervisory Board also discussed CANCOM’s accounting process and risk manage-ment system, the effectiveness of the in-house audit processes, the resources of the internal audit department and its findings, in addition to the issue of maintaining integrity in financial reporting.
REPORT OF THE SUPERVISORY BOARD
9
After an in-depth discussion of the audit reports, the financial statements and the combined management report, the Supervisory Board had no objections to raise. It considered the proposal for appropriation of the net retained profit to be reasonable.
It approved the annual financial statements of CANCOM SE prepared by the Executive Board, the consolidated financial statements of the Group and the combined management report for CANCOM SE and the Group for the fiscal year 2017. The annual financial statements are thus adopted.
Dear stockholders, we are satisfied that CANCOM is well placed for the future. The Supervisory Board would like to thank the members of the Executive Board, the management and all the employees for their great commitment, which has contributed greatly to CANCOM’s success and gives us confidence in the continuation of its positive performance.
Munich, Germany, March 2018
On behalf of the Supervisory Board
Dr. Lothar Koniarski(Chairperson)
REPORT OF THE SUPERVISORY BOARD
10
Corporate Governance Report
Corporate Governance Report
This report on corporate governance at CANCOM is written by the Executive Board and Supervisory Board in accordance with Subsection 3.10 of the current version of the German Corporate Governance Code published on February 7, 2017. The corporate governance report also includes the remuneration report, as part of the management report.
I. CORPORATE GOVERNANCE OVERVIEW
1. Implementation of the German Corporate Governance Code and declaration of conformity
The purpose of effective and responsible corporate governance and control is to ensure the future of the company as a going concern as well as to achieve a sustainable development and increase in its value. In 2016 the Executive Board and the Supervisory Board of CANCOM SE again devoted much attention to the applicable recommendations of the German Corporate Governance Code. At the Supervisory Board meeting on December 5, 2017, the Executive Board and Supervisory Board issued a joint declaration of confor-mity with the recommendations of the Code, in accordance with Section 161, paragraph 1 of the German Stock Corporation Act (Aktiengesetz, AktG), which was published immediately. The decla-ration is permanently available for public view on the company’s website.
The declaration of conformity published on December 5, 2017, reads as follows:
‘In accordance with Section 161 of the German Stock Corporation Act, the Executive and Supervisory Boards of CANCOM SE declare that, since the previous declaration of conformity on December 13, 2016, the company had been fully compliant with the version of the German Corporate Governance Code issued on May 5, 2015 and published in the German Federal Gazette (Bundesanzeiger) of June 12, 2015 and with the amended version of the Code issued on February 7, 2017 and published in the German Federal Gazette of April 24, 2017 (as corrected on May 19, 2017)’
2. Basic principles of the corporate governance policy
2.1. Shareholders and the annual general meeting
The general meeting of shareholders is the central decision- making body, at which CANCOM’s stockholders can exercise their rights and cast their votes. For the past several years, large numbers of shareholders have attended this meeting. The annual general meeting of shareholders was held in Munich, Germany, on June 20, 2017.
The only shares of CANCOME SE in circulation are common bearer shares. All shares carry the same voting rights, and each no-par value share entitles its owner to one vote, in accordance with the corporate by-laws. The general meeting of stockholders passes resolutions on matters expressly defined by law and the corporate by-laws – in particular on appropriation of the net retained profit, discharge of Executive Board and Supervisory Board and appointment of Supervisory Board members – and chooses the auditing firm for the annual financial statements. In accordance with the German Stock Corporation Act, the general meeting of stockholders also determines the object of the company and any changes to the corporate by-laws, as well as authorizing the raising or reducing of capital or any purchases of the compa-ny’s own shares.
At the annual general meeting, our stockholders can exercise their voting rights in person or appoint a proxy to vote on their behalf, for example a representative of the company, who is bound to act in accordance with their instructions. Stockholders will be able to take advantage of this opportunity at the next general meeting of stockholders in Munich on June 14, 2018, as they have done in previous years.The agenda and the necessary reports and documents for the general meeting of stockholders will be made available to stock-holders on the company’s website in due course. There is no provi-sion in the corporate by-laws of CANCOM SE for voting by mail.
2.2. Cooperation between the Executive Board and the Supervisory Board
Good corporate governance depends on open communication. The Executive Board and the Supervisory Board work closely together in the interests of the company. Intensive and continuous dialog between the two boards forms the basis for efficient corporate management at CANCOM SE. The Supervisory Board assists the Executive Board in an advisory capacity, and is involved in all major corporate decisions. The Executive Board gives regular,
CORPORATE GOVERNANCE AT CANCOM

11
timely and comprehensive reports to the Supervisory Board on all matters relevant to the company concerning strategy, plan-ning, business performance, on possible risks and opportunities connected with corporate development, and on risk management and compliance. The Executive Board’s disclosure and reporting obligations are described in more detail in its rules of procedure. For instance, the Executive Board discusses interim financial reports with the Supervisory Board before they are published. Documents relevant to a decision are forwarded to the members of the Supervisory Board as early as possible before the meeting. The corporate by-laws and the rules of procedure for the Executive Board require the agreement of the Supervisory Board for certain important transactions.
2.2.1. Executive Board
In the fiscal year 2017, there were changes in the composition of the Executive Board of CANCOM SE. The Executive Board currently consists of four members: Klaus Weinmann (Chair-person of the Executive Board, CEO), Rudolf Hotter (member of the Executive Board, COO), Thomas Volk (member of the Executive Board, President and General Manager, since November 1, 2017), and Thomas Stark (member of the Executive Board, CFO, responsible for environment, social and governance (ESG) issues, since January 1, 2018). The current terms of office are as follows: Klaus Weinmann until December 31, 2022; Rudolf Hotter until March 31, 2020; Thomas Volk until December 31, 2020; Thomas Stark until December 31, 2022. There is an age limit of 65 years for members of the Executive Board.
The work of the Executive Board is geared towards achieving a sustainable increase in the company’s going-concern value in the interests of the enterprise and its stakeholders. The members of the Executive Board bear joint responsibility for the management of the business as a whole. In addition to setting out the schedule of responsibilities, the rules of procedure for the Executive Board govern, inter alia, how the Executive Board members work together, the majority required for a resolution to be passed, and the Executive Board’s work with the Supervisory Board. In line with Subsection 4.1.5 of the German Corporate Governance Code, the Executive Board aims to achieve a proportionate representa-tion of women when filling management positions in CANCOM SE. In line with its obligations arising from Section 76, paragraph 4 of the German Stock Corporation Act, therefore, the Executive Board has set targets for the representation of women at the first and second level of management below the Executive Board.
Competence, qualifications and suitability are the main criteria for the appointment of Executive Board members. The diver-sity within the Executive Board is reflected most notably in the different professional careers and fields of operation of its
members, as well as their different ranges of experience. The Supervisory Board has set targets for the representation of women on the Executive Board, in line with its obligations under Section 111, paragraph 5 of the German Stock Corporation Act.
2.2.2. Supervisory Board
The Supervisory Board of CANCOM SE appoints and discharges the members of the Executive Board. It oversees the work of the Executive Board and advises it on the management of the business.
In accordance with the corporate by-laws of CANCOM SE, it comprises six members. According to the by-laws and the targets set by the Supervisory Board for its composition, these members are appointed by the general meeting of stockholders for a maximum period of six years, up to an age limit of 70 years. The general meeting of stockholders can specify a shorter term of office for certain or all members when electing the Supervisory Board. In accordance with the agreement between the company and the special negotiating body on codetermination at CANCOM SE, there are no employee representatives on the Supervisory Board.
At the time of writing the Corporate Governance Report, the members of the Supervisory Board are: Dr. Lothar Koniarski (Chairperson), Uwe Kemm (Deputy Chairperson), Dominik Eberle, Regina Weinmann, Martin Wild und Marlies Terock, who all bring proven professional expertise into the enterprise. Supervi-sory Board members Dr. Lothar Koniarski, Uwe Kemm, Dominik Eberle, and Regina Weinmann were elected by the general meeting of stockholders on June 25, 2014, for the period up to the end of the general meeting of stockholders that resolves on the discharge of the Supervisory Board for the fiscal year 2018. Martin Wild and Marlies Terock were both elected to the Supervisory Board by the general meeting of stockholders on June 20, 2017 for the period up to the end of the general meeting of stockholders at which a resolution is passed on the discharge of the Supervi-sory Board for the fiscal year 2018. With Dr. Lothar Koniarski, CANCOM SE has among others a Supervisory Board member, who has expertise in the areas of accounting or financial statement audits and as such fulfills the requirements under Section 100, paragraph 5 of the German Stock Corporation Act.
The Supervisory Board has rules of procedure that govern its work, particularly how its members work together as a team. The Supervisory Board aims to fulfil its role with the greatest care. For this purpose it carries out an evaluation of its own efficiency every year. The self-assessment conducted in 2017 found that the Supervisory Board works efficiently.
CORPORATE GOVERNANCE AT CANCOM

12
To help it to perform its function, the Supervisory Board has formed two Committees: the Audit Committee and the Nomi-nating Committee. Their tasks, responsibilities and working processes are in line with the requirements of the German Stock Corporation Act and the German Corporate Governance Code. The Chairpersons of the Committees give regular reports to the Super-visory Board on the work of their Committees.
The Audit Committee, at the time this Corporate Governance Report was written, comprises Uwe Kemm (Chairperson), Dr. Lothar Koniarski (Deputy Chairperson), and Dominik Eberle. The Chairperson, Uwe Kemm, has special knowledge and experience of applying accounting principles and internal control procedures as required by Subsection 5.3.2 of the German Corporate Gover-nance Code. In particular, the Audit Committee oversees the accounting process and monitors the effectiveness of the internal control system and the in-house audit system. It is also concerned with audit of the annual financial statements – particularly the independence of the auditor, the additional services provided by the auditor, the commissioning of the auditor, the determination of the focal points of the audit and the agreement on the fee to be paid, as well as compliance matters.
At the time of preparation of this report, the Nominating Committee comprises Dr. Lothar Koniarski (Chairperson), Uwe Kemm (Deputy Chairperson) and Regina Weinmann. This Committee suggests to the Supervisory Board suitable candidates for nomination at the general meeting of stockholders. The nomi-nations of candidates should continue to be based primarily on the interests of the company, while taking into account the targets set by the Supervisory Board for its composition. It must be ensured that men and women are proportionately represented in line with the legal requirements on the gender quota.
In line with Subsection 5.4.1, paragraph 2 of the German Corpo-rate Governance Code, the Supervisory Board has set specific targets for its composition and drawn up a competency profile for the entire Supervisory Board.
While reflecting the specific situation of the enterprise, the targets for its composition are supposed to take into account its interna-tional activities, potential conflicts of interest, the number of inde-pendent members as defined by Subsection 5.4.2 of the German Corporate Governance Code, and diversity, as well as specifying an age limit and a limit to the length of membership of the Super-visory Board.In accordance with the Code provision, the members of the Supervisory Board as a group must have the knowledge, skills and professional experience necessary to perform their func-tion properly. The knowledge, skills and experience of the indi-vidual Supervisory Board members can and should complement each other so as to ensure that the Supervisory Board as a whole is qualified to oversee and advise the Executive Board properly.
When appointing new members, the Supervisory Board takes into account the following requirements:
The Supervisory Board as a group is supposed to have the compe-tencies that are considered essential in view of the activities in which the CANCOM Group engages. In particular, these include experience and knowledge of:
• the management of a large or medium-sized enterprise engaging in international activities;
• marketing, sales and distribution, human resources, and digitization;
• the main markets in which CANCOM operates; • accounting and controlling;• governance, risk, and compliance.
Appropriate consideration should be given to the international activities of the enterprise. When nominating candidates for election by the general meeting of stockholders, the Supervisory Board endeavors to consider candidates whose origin, education or professional career give them special international knowledge and experience in the company’s sales area.
As a rule, no member of the Supervisory Board should perform an executive or advisory role for a major competitor of the company, unless, as an exception, this is in CANCOM’s interest. The Super-visory Board endeavors to avoid potential conflicts of interest, including any that could arise from future nominations of candi-dates for election by the general meeting of stockholders. If any temporary or permanent conflicts of interest should nevertheless arise during the term of office of a Supervisory Board member, they will be dealt with in accordance with the recommendations of the German Corporate Governance Code.
In the view of the Supervisory Board, at least half of its members, as defined in the by-laws, should be independent within the meaning of Subsection 5.4.2 of the German Corporate Governance Code. A Supervisory Board member is no longer deemed to be independent within the meaning of the above provision if he/she has a personal or business relationship with the company, its governing bodies, a controlling stockholder, or a company connected with a controlling stockholder that could constitute a major, non-temporary conflict of interest.
The setting of an age limit for members of the Supervisory Board of CANCOM SE means that candidates nominated for election may not be older than 70 years of age at the time of the election.
CORPORATE GOVERNANCE AT CANCOM

13
In principle, the Supervisory Board shares the view that the composition of the Supervisory Board should be as practical as possible, with a balanced mix of different areas of expertise. However, the Supervisory Board also feels that the competence and capabilities of Supervisory Board members should not in all cases be defined by the length of time that they have served on the Supervisory Board. It is felt that in exceptional cases the company should also be able to avail itself of the expertise of individuals who, due to the length of time they have served on the Supervi-sory Board, are experienced and, in particular, familiar with the circumstances in the sector and the company. The Supervisory Board has nevertheless set a limit of 20 years for membership of the Supervisory Board.
Diversity in the composition of the Supervisory Board should be reflected most notably by the different professional careers and areas of operation of its members, as well as their different ranges of experience. With regard to the representation of women on the Supervisory Board, we refer to the statutory targets.
The current composition of the Supervisory Board is in line with the above targets.
Nominations of candidates by the Supervisory Board for election to the Supervisory Board should continue to be in the interests of the company, while taking into consideration these targets. The Supervisory Board is of the view that this can be best achieved by placing the primary emphasis on the special expertise and qualifi-cations of the candidates.
2.3. Conflicts of interest
The members of the Executive Board and the Supervisory Board are obliged to act in the best interests of the enterprise. When making decisions in connection with their work, they must not pursue their own personal interests or exploit any business oppor-tunities intended for the enterprise for their own advantage.
In line with the recommendation of Subsection 4.3.3 sentence 4 of the German Corporate Governance Code, the Executive Board and the Supervisory Board agree that no significant transactions will be carried out with related parties of Executive Board members without the prior approval of the Supervisory Board.
In accordance with their rules of procedure, the members of the Supervisory Board must disclose without delay any conflicts of interest that arise. The Supervisory Board must mention in its report to the general meeting of stockholders any conflicts of interest that may have arisen, or that could arise, through a consulting, executive or supervisory function performed for clients, suppliers, creditors or other third parties, and how such conflicts of interest are handled.
No conflicts of interest involving either Supervisory Board or Executive Board members arose during the past fiscal year. Detailed information on positions currently held by members of the Supervisory Board or Executive Board on supervisory boards or similar controlling boards of other companies can be found in Section G. Other information paragraph 8 of the Notes to the consolidated accounts.
2.4. Transparency
CANCOM SE publishes all information and company announce-ments relevant to the capital market regularly and promptly on the company’s website. Ad hoc announcements and corporate news are disseminated simultaneously in German and English via a wide distribution network.
Each fiscal year, CANCOM SE keeps its stockholders informed by means of quarterly statements and financial reports on the Group’s performance and on its financial, earnings, assets and cash posi-tion. CANCOM SE also provides comprehensive information on a regular basis at the annual general meeting of stockholders and at investor conferences and road shows.
Stockholders are given information on important publication dates and investor relations events in a financial calendar, which is published on the company’s website.
2.5. Accounting and annual financial statements audit
The consolidated financial statements and the interim reports are drawn up according to International Financial Reporting Stan-dards (IFRS) as adopted in the European Union, and the annual financial statements of CANCOM SE are drawn up according to the provisions of the German Commercial Code (Handelsgesetz-buch, HGB).
CORPORATE GOVERNANCE AT CANCOM

14
The general meeting of stockholders on June 20, 2017 appointed the audit firm S&P GmbH Wirtschaftsprüfungsgesellschaft based in Augsburg, Germany, to audit the annual financial statements for the fiscal year 2017. The Supervisory Board of CANCOM SE and its Audit Committee work closely with the auditor. This encourages an exchange of information and improves the quality of the audit. Before submission of the nominations of candidates for election at the general meeting of stockholders, the Supervisory Board obtained a written independence declaration from the auditor.
The auditor reported to the Supervisory Board on the audit process and the main findings, and was available to answer questions, discuss the report and provide additional information. He took part in the Supervisory Board’s discussion of the financial state-ments and the Audit Committee’s meeting on March 16, 2018, as well as the meeting of the Supervisory Board to approve the balance sheet on the same day.
3. Compliance management
Compliance management is an important part of corporate gover-nance. Its purpose is to ensure that the activities of the enterprise comply with legal regulations and voluntary arrangements. One of the central elements of compliance management is a well-func-tioning compliance management system (CMS). This covers all measures and processes aimed at pursuing the above objective. The key elements required of an adequate CMS are in place in the CANCOM Group and are practiced, and the system is developed continuously as needed. With regard to the amendments to the Corporate Governance Code resolved on February 7, 2017, in particular, CANCOM has implemented a whistleblower system in compliance with Subsection 4.1.3, sentence 3. This enables all staff in the CANCOM Group to contact the company anonymously and pass on information on potential compliance violations within the CANCOM Group.
Since December 2015, CANCOM has been a member of the United Nations Global Compact. The aim of this initiative is to foster sustainable and responsible corporate governance. It is based on ten universal principles. The Group’s membership commits it to actively supporting these ten principles – which cover human rights, labor standards, environmental protection, and the combating of corruption – and to promoting them within its sphere of influence. Its membership also means that CANCOM consistently integrates these principles into its business strategy, its corporate culture and its daily business.
3.1. Business Code of Conduct
CANCOM is aware not only of its commercial responsibility but also its social responsibility. To underline this position, CANCOM has adopted a Code of Conduct that sets out how CANCOM deals with its various stakeholders. One of the outcomes of the estab-lishment of CANCOM’s compliance is that its Code of Conduct, Fairness First, is brought to the attention of all employees, and e-learning modules have been set up to train them to implement it. As stated in its introduction, the Code of Conduct reflects the Exec-utive Board’s aim of strengthening ethical standards throughout the enterprise and creating a working environment based on integrity, respect and fair dealing. In line with the motto Fairness First, employees at all levels are enjoined to abide by the statutory provisions and internal guidelines and live up to the company’s high standards of ethics and quality. The employees are also regularly reminded of the compliance rules and audit processes as a kind of preventative measure.
There is a Compliance Officer who ensures that the Code of Conduct is complied with, as well as providing a point of contact for all compliance-related issues and questions. The Code of Conduct is freely accessible to all CANCOM employees via the company’s intranet. In the event of an evident or suspected violation of the code, those affected should contact the Compliance Officer. CANCOM values and actively encourages open and objec-tive feedback.
3.2. Risk management and the internal control system
CANCOM has a comprehensive system for recording and controlling business and financial risks, which is documented in a risk manual. The internal control and risk management systems are designed to recognize significant business risks in advance and to control them. However, they cannot fully eliminate risks and therefore do not offer absolute protection against losses or fraudulent acts.
3.3. In-house audit
The in-house audit of CANCOM SE is central to the internal corporate governance system. Its function is to assess the effec-tiveness of the risk management system, the internal controls and the compliance management system, and to help improve them continuously. The Executive Board of CANCOM defines the issues that need closer analysis in the interests of the company, and keeps the Supervisory Board informed of the issues and the findings.
CORPORATE GOVERNANCE AT CANCOM

15
II. REMUNERATION REPORT
The remuneration report presents the basic principles of the system for remuneration of Executive Board members, and explains the structure and level of the remuneration of the Exec-utive Board members and the emoluments of the Supervisory Board members. The report is based on the recommendations of the German Corporate Governance Code and contains details in compliance with the requirements of the German Commercial Code as well as International Financial Reporting Standards (IFRS). The remuneration report forms a part of the combined management report and can be found on pages 29 to 33.
III. CORPORATE GOVERNANCE DECLARATION
The corporate governance declaration in accordance with Section 289f of the German Commercial Code is published on the company website. It outlines the principles of responsible corpo-rate action and describes the working practices of the Executive Board and the Supervisory Board as well as details of the compo-sition and working practices of its Committees, the declaration of conformity in line with Section 161 of the German Stock Corpora-tion Act, relevant details of the principal corporate management practices, as well as the stipulations under Section 76, paragraph 4 and Section 111, paragraph 5 of the German Stock Corporation Act and a statement as to whether the targets set were met during the reference period.
Munich, Germany, March 2018
CANCOM SE
Executive Board Supervisory BoardKlaus Weinmann Dr. Lothar Koniarski
CORPORATE GOVERNANCE AT CANCOM

16 THE CANCOM STOCK AND BOND
German equity market performance
The German blue-chip index DAX gained some 13 percent in 2017, reaching an all-time high at around 13,479 points during the year on the basis of closing prices. The TecDAX, which tracks German technology companies and in which the CANCOM share is listed, recorded considerably stronger growth in 2017, with an increase of almost 40 percent.
CANCOM share performance
The CANCOM share started trading at EUR 44.50 on XETRA at the beginning of 2017. After a moderate performance in January and February, the price increased continuously from March. Following a slight setback in May, the share price rose signifi-cantly in the second half of the year, ending 2017 at a XETRA closing price of EUR 69.40. This represented an increase in value of around 56 percent, outstripping the performance of the TecDAX benchmark index over the year.
CANCOM on the German capital market
ONE-YEAR-PERFORMANCE CANCOM SHARE
SHARE REFERENCE DATA
ISIN / WKN DE0005419105 / 541910
Stock market segment Prime Standard
Index membership TecDAX, CDAX
Designated Sponsor Hauck & Aufhäuser
RESEARCH COVERAGE
Baader /Helvea
Bankhaus Lampe
Berenberg
Commerzbank
Hauck & Aufhäuser
Kepler Cheuvreux
Warburg
Dec. 31, 2017Jan. 1, 2017 Mar. 2, 2017 May 1, 2017 Jul. 01, 2017 Sep. 1, 2017 02.11.17
60
40
20
0
Euro
80
SHAREHOLDER STRUCTURE
PRIMEPULSE Beteiligungs GmbH 10.1%
Allianz Global Investors Europe 8.4%
Allianz Global Investors Luxembourg 4.1%
Remaining Free Float 77.4%
Details according to the most recent voting rights disclosure received.

17THE CANCOM STOCK AND BOND
KEY FIGURES AND TRADING STATISTICS CANCOM SHARE
2017 2016
Price at start of the year € 44.50 44.13
Price at end of the year € 69.40 45.02
High (June 8, 2016) € 70.50 52.40
Low (January 20, 2016) € 42.43 37.80
Performance - absolute € +24.90 +0.89
Performance - relative % +55.96 +2.02
Market capitalization at year-end € million 1,216.0 736.9
Average turnover per trading day* piece 55,441 98,077
Average turnover per trading day* € 3,713,217 4,323,978
Earnings per share from continuing operations (basic) € 2.40 2.11
Outstanding stock as at December 31, 2016 piece 17,521,819 16,367,531
* all German Stock exchanges
Dividend
The aim of CANCOM’s dividend policy is to support the compa-ny’s growth strategy - the primary objective of the Executive Board. Management has identified good growth potential in the IT environment, due in part to digitization, one of the current tech-nology megatrends. It will therefore give priority to using future profits to finance the growth and development of the business. The objective of this policy is to achieve a long-term increase in the company’s going-concern value, and it is thus deemed also to be in the interest of the shareholders. For the financial year 2017, the Executive Board and Supervisory Board will propose to the general meeting of shareholders that a dividend of EUR 1,00 per share be paid.
The number of shares with dividend rights was 17.521.819 at the end of the financial year. The total dividend payment for the finan-cial year 2017 would therefore be EUR 17.5 million.
American depositary receipts program in the U.S.A.
CANCOM SE maintains a Level 1 American depositary receipts (ADR) program in the United States. ADRs are securities denom-inated in U.S. dollars that represent underlying equities of a non-U.S. company and can be traded in the U.S.A. This enables U.S. investors to buy bearer shares in CANCOM SE, which are listed on the Frankfurt Stock Exchange, indirectly on the U.S. market.
General meeting of stockholders
The Executive Board and Supervisory Board welcomed a large number of shareholders and their representatives to the general meeting of CANCOM SE shareholders at the Alte Kongresshalle in Munich, Germany, on 20 June 2017. The attendees represented 54.55 percent of the company’s equity. The voting results reflected the high level of confidence in CANCOM management. All items on the agenda were resolved by an overwhelming majority.
Communication with the capital market
Active, open and transparent communication with its stakeholders is of central importance to CANCOM. The company’s website, for instance, is an important and much-used platform for information and communication with shareholders and the capital market. But analysts’ views of the company are also important in shaping the opinions of shareholders and investors. CANCOM engages in regular, constructive dialogue with all analysts. In 2017, a large number of contacts were also made with existing and potential investors at roadshows in Germany and internationally, as well as at investor conferences and in personal meetings and telephone conferences.
Up-to-date information about the CANCOM share can be found in the Investors section of our website. Please visit us at www.cancom.de.


20
Combined management report for CANCOM SE and the CANCOM Group
January 1 to December 31, 2017
1. Fundamental information about the Group
The CANCOM Group is one of the leading providers of IT infrastructure and services in Germany and Austria. With its decentralized distribution and service structure, as well as central services in areas such as finance, purchasing, warehousing, logis-tics, marketing, product management and human resources, the Group is well placed for sustainable, profitable growth. The Group has locations in Germany, Austria, Switzerland and the U.S.A. in addition to a representative office in Brussels, Belgium.
Structure of the CANCOM Group
CANCOM SE, based in Munich, Germany, performs the central financial and management role for the long-term equity invest-ments held by the CANCOM Group.
The structure of the CANCOM Group (also referred to as ‘CANCOM’) ensures that its control and management is highly efficient. It also provides effective support for operational units through central divisions, specialized distributors and competence centers.
Areas of business
The cloud solutions operating segment includes CANCOM Pironet AG & Co. KG (formerly PIRONET Datacenter AG & Co. KG, PIRONET Enterprise Solutions GmbH, Pironet AG, synaix Gesellschaft für angewandte Informations-Technologien mbH, synaix Service GmbH, in addition to the division of CANCOM GmbH allocated to the cloud solutions operating segment. This segment comprises the CANCOM Group’s cloud and shared managed services business, including project-related cloud hard-ware, software and services business. The product and service portfolio comprises analysis, consulting, delivery, implementation and services, thus providing clients with the necessary orientation and support for their transition from corporate IT systems to cloud computing. As part of its range of services, the CANCOM Group
can provide scalable cloud and managed services – in particular shared managed services – to run entire IT departments, or parts of them, for its clients. Distribution costs allocated to cloud distri-bution are included in the segment. The cloud business also bene-fits from synergies with CANCOM’s central sales and marketing activities, the costs of which are allocated to the IT solutions reportable segment.
The IT solutions operating segment includes CANCOM GmbH, CANCOM Computersysteme GmbH, CANCOM a+d IT solutions GmbH, CANCOM (Switzerland) AG, CANCOM ICT Service GmbH (formerly NSG ICT Service GmbH), CANCOM SCS GmbH, CANCOM ICP GmbH, CANCOM on line GmbH, Cancom on line B.V.B.A., c.a.r.u.s. Information Technology GmbH Hannover, CANCOM physical infrastructure GmbH, CANCOM Inc., HPM Incorporated with the exception of the divisions of CANCOM GmbH allocated to the cloud solutions and ‘other companies’ segments. This operating segment of the CANCOM Group offers comprehensive support for IT infrastructure and applications. The range of services offered includes IT strategy consulting, project planning and implementation, system integration, IT procurement via e-procurement services or as part of a project, in addition to professional IT services and support.
Focus of activities and sales markets
CANCOM is one of the largest independent integrated IT systems providers in Germany. It provides IT architecture, systems integra-tion and managed services. As a provider of integrated services, it mainly focuses on IT services, in addition to distributing hard-ware and software. The IT services offered include IT consulting, the design of IT architectures and landscapes, and the design, inte-gration and operation of IT infrastructure and systems. CANCOM can manage individual partial assignments or run a company’s entire IT systems.
COMBINED MANAGEMENT REPORT FOR CANCOM SE AND THE CANCOM GROUP

21
The CANCOM’s client lists therefore mainly include commercial end-users, from small and medium sized enterprises to large enter-prises and groups, as well as public-sector clients. Geographically, the CANCOM Group operates primarily in Germany and Austria as well as in the U.S.A.
The strategy includes focusing on major IT trends such as cloud computing, mobility, analytics, collaboration and security, in addi-tion to profitable, high-growth market segments such as complete integrated IT solutions, consulting and managed services. In the managed services business, CANCOM focuses on standardizing and increasingly automating services in a one-to-many model - in other words, as a shared service. Ideally, services are provided remotely and using a joint platform. Selective acquisitions are also part of the Group’s growth strategy.
Competitive position
According to the Federal Statistical Office of Germany, there are currently more than 90,000 information and communications technology (ICT) enterprises in Germany, although they vary in size and in the range of services they offer. Of these enterprises, approximately 85,600 provide IT hardware, software and IT services. There are around 178 businesses with more than 500 employees. Fifteen integrated systems providers (including CANCOM) generate sales revenue in excess of € 250 million in Germany.
According to the German Association of the Information Industry, Telecommunications and New Media (BITKOM), the total volume of the German IT market in 2017 was € 85.8 billion. This means that, with annual sales revenues in Germany of € 1,047.9 million, the CANCOM Group currently has a market share of around one percent.
The five largest German integrated IT systems providers in the latest ChannelPartner/COMPUTERWOCHE ranking (CANCOM is ranked fifth) have a market share of around fifteen percent between them. The remaining market share is held among others by IT manufacturers as well as small and medium sized, mainly regional, enterprises. This reflects the very fragmented nature of the German IT market.
Explanation of the control system used within the Group
To control and monitor the performance of the individual subsid-iaries and the reporting segments, CANCOM SE analyzes their monthly figures for, among other things, sales revenues, gross profit, operating expenditure and operating profit, and compares the actual figures with the targets. The key performance indicators are gross profit1, EBITDA2 and operating profit (EBIT3). The latter offers a detailed picture of the performance of the enterprise as a whole, as it enables management to draw conclusions about the operational business performance and make transparent compari-sons, particularly over a period of time.
Any significant deviations identified in the key figures call for the preparation of a forecast. For the purpose of management control, the company also regularly looks at external indicators such as inflation and interest rates, and IT sector and general economic performance and forecasts. It also takes into account any early warning data or indicators generated by the Group-wide risk management system. Further details can be found in the risks and opportunities report.
Research and development activities
Innovation is very important for economic momentum and growth. As it is a service and trading enterprise, CANCOM does not conduct any research activities. Its development work focuses mainly on software solutions, applications or architecture in IT growth segments such as cloud computing, mobile solutions, IoT & analytics, IT security and shared managed services. Cloud computing benefits the entire enterprise, as it offers huge advan-tages for the IT departments, management and staff. Above all, users benefit from the central provision of applications and being able to access company data at all times, in any location and on any device. During the period under review, further development work was carried out on the Group’s own IT architecture platform, CANCOM AHP Enterprise Cloud, in addition to customization of in-house software used by the company, mainly in connection with the Group-wide introduction of the enterprise resource plan-ning (ERP) system of SAP.
Explanation of the alternative performance measures (APM) required by the guidelines on APMs issued by the European Securities and Markets Authority (ESMA):
1) Gross profit = gross revenue (sales revenues + other operating income + other own work capitalized) less cost of purchased materials and services
2) EBITDA = net income for the period + taxes + profit/loss accounted for using the equity method + income from long-term equity investments + financial result + depreciation of property, plant and equipment (tangible assets), and amortization of intangible assets
3) EBIT = net income for the year + taxes + profit/loss accounted for using the equity method + income from long-term equity investments + financial result
COMBINED MANAGEMENT REPORT FOR CANCOM SE AND THE CANCOM GROUP

22
Environmental report
As an IT services and trading company, CANCOM aims to offer services and products of excellent quality, at an attractive price and as environmentally friendly as possible. It therefore places great importance on conserving the resources at its disposal. The corporation offers innovative solutions across its entire range of services and products in order to make a professional contribution to the environmentally-friendly and resource-conserving use of information technology over the whole life cycle of the equipment. For instance, CANCOM offers its clients the advantages of state-of-the-art, energy-efficient data centers, which bring not only ecolog-ical benefits, but also considerable savings on a company’s energy and IT costs. CANCOM’s use of advanced, intelligent systems for communication and collaboration (for instance, video and web conferencing solutions) also enables resources to be conserved. The resulting reduction in travel needs by employees leads to lower CO2 emissions, in addition to benefits such as process opti-mization and considerable cost savings.
CANCOM SE is a member of the UN Global Compact, thereby supporting its principles, which cover human rights, labor standards and the combating of corruption in addition to environ-mental protection.
Further information on environmental concerns - in addition to employer and social issues, the respecting of human rights and the combating of corruption and bribery - can be found in the combined corporate and social responsibility report of the CANCOM Group and CANCOM SE. The report is published annually, at the latest four months after the reporting date for the previous fiscal year, on the company’s website at www.cancom.com/reports.
2. Economic report
General economic situation
The German economy grew for the eighth consecutive year in 2017, at a rate faster than in any year since 2011. Gross domestic product (GDP) was up 2.3 percent in comparison with 2016. The upturn in 2016 was mainly driven by positive developments in Germany. Retail consumption remains a key driver of the positive performance, along with the good labor market situation and the zero-interest rate policy of the European Central Bank (ECB).
Gross domestic product in 2017*(real change compared with 2016, as a percentage)
Germany: + 2.3
Euro area: + 2.3
U.S.A: + 2.3
World: + 3.8
* Source: Deutsche Bank Research, 23 January 2018
The inflation rate in Germany rose to its highest level in five years in 2017, according to the first estimate of the Federal Statistical Office of Germany, which found that goods and services cost on average 1.8 percent more than in the previous year. In 2016, the inflation rate was only 0.5 percent.
Performance of the information technology sector
Overall, the IT sector developed well in 2017. According to the latest estimates by the German Association of the Information Industry, Telecommunications and New Media (BITKOM), the German IT market grew by 3.4 percent in 2017. Within the IT sector, the hardware segment grew by 2.6 percent, the software segment by 6.3 percent and the IT services segment by 2.3 percent.
Performance of the German IT market in 2017**(real change compared with 2016, as a percentage)
IT market as a whole: + 3.4
Hardware: + 2.6
Software: + 6.3
Services: + 2.3
** Source: BITKOM, EITO, October 2017
The European Information Technology Observatory (EITO) predicts that global IT revenues will increase by 3.4 percent to € 1.4 trillion in 2017. It expects IT revenues in EU member states to rise by 3.0 percent to € 389 billion.
COMBINED MANAGEMENT REPORT FOR CANCOM SE AND THE CANCOM GROUP

23
Impact on the CANCOM Group
Against the background of the successful performance in 2016, the CANCOM Executive Board expected further growth in sales reve-nues and profits in the fiscal year 2017. Specifically, the forecast predicted that sales revenues and consolidated gross profits would grow faster than the German IT market in 2017. The Executive Board aimed for an improvement in the consolidated earnings before interest, tax, depreciation and amortization (EBITDA) accompanied by organic growth in sales revenues.4
Sales revenues of the CANCOM Group increased by 13.5 percent in the fiscal year 2017, to € 1,161.2 million compared with € 1,023.1 million in 2016. This represents considerably stronger growth than that of the German IT market, which grew by 3.4 percent. Of the sales revenues generated in fiscal 2017, a portion of € 51.8 million which CANCOM views as derived from inorganic growth was attributable to the companies acquired in 2016 and 2017. The acquired companies in turn benefited from being part of the Group and were able to expand their business as a result. This meant that marketing and cost synergies were exploited through integration and combining of units within the Group. The organic component of the Group’s growth in fiscal 2017 was 9.3 percent.As in 2016, the growth is mainly attributable to the continued high demand for innovative, sustainable and integrated IT solutions. This willingness of the companies to innovate and invest had a positive influence on the development. The progressive digitization and networking of the economy, with all its increasing complexity, presents an opportunity for providers such as CANCOM, which have the relevant competence and experience, to reap profits.
There was a quite significant year-on-year increase in both the consolidated gross profit and the consolidated EBITDA, which were up 9.9 percent and 15.9 percent respectively. The same applied to the consolidated EBIT, which exceeded the prior year’s figure by 17.9 percent. The continued high demand in the high-skill services business had a further positive impact on profits, as in 2016. Owing to the increasing complexity and requirements in areas such as IT landscapes and applications, IT consulting is becoming more and more important. Additionally, the level of services provided is increasingly demanding and of higher quality. In the fiscal year 2017, therefore, CANCOM continued to change the Group’s staff structure in line with the service
portfolio by increasing the number of qualified, appropriately certified employees. The success of this policy is demonstrated by the improvement in the earnings before interest, tax, depreciation and amortization (EBITDA) per staff member in 2017 despite the general increase in the number of employees compared with the previous year.
CANCOM endeavors to position itself as a trusted advisor of its clients, and to deliver integrated IT solutions from a single source. In addition, investment by businesses both in standard IT systems/data center infrastructure and in cloud computing was encouraged by the development of new technologies and services and the advancement of existing ones, in addition to the transformation of business models and information technology to cloud computing. This strategy and the market development had a positive impact on the growth of the IT solutions segment and the cloud solutions segment in 2017.
Also, attractive profit margins are achieved in the IT solutions segment by continuously focusing on selling comprehensive one-stop-shop solutions comprising consulting, integration and services. In the cloud solutions operating segment, the level of recurring revenue from cloud and shared managed services remained at a consistently high level.
The digital revolution and the changes within the IT sector require many companies to realign and develop their current business models. As cloud computing becomes more widely used, the IT services to be provided are increasingly being transferred to data centers. This means the staff performing these higher-end IT services will have to be of increasingly high caliber, highly skilled and competent. CANCOM focuses on profitable business in the traditional IT environment and withdraws without hesitation from areas that the Group does not consider viable. This strategic principle was also pursued in 2017, and there was further develop-ment of both the portfolio of products and services and the staff structure.
The Executive Board is of the opinion that the positive develop-ment of sales revenues, gross profit, EBITDA and EBIT anticipated for the fiscal year 2017 was achieved in the IT solutions and cloud solutions operating segments and in the Group as a whole.
4) The alternative performance measures (APMs) used are described in the section headed ‚Explanation of the control system used within the Group‘.
COMBINED MANAGEMENT REPORT FOR CANCOM SE AND THE CANCOM GROUP

24
Significant events and investments
CANCOM regularly optimizes its corporate structure in order to secure and consolidate its position in existing markets and also to tap new markets. Below is a description of the most significant events that had an effect on the Group’s business performance, as well as other important events and investments in the fiscal year 2017:
• CANCOM SE has acquired all the stocks of antauris AG, based in Hamburg, Germany. The acquisition is documented in a cont-ract of sale dated May 30, 2017. antauris AG operates nationally in Germany as an IT systems and consulting company, service partner and provider of corporate applications for data centers. The acquisition expands the CANCOM Group‘s client lists and its business activities in northern Germany. antauris-Aktienge-sellschaft was merged into CANCOM GmbH, and the merger is documented in a contract dated August 7, 2017. The merger was recorded in the commercial register on September 1, 2017.
• CANCOM SE has acquired all the stocks of synaix Gesellschaft für angewandte Informations-Technologien mbH and synaix Service GmbH (the synaix group), based in Aachen, Germany. The acquisition is documented by a notarized contract of sale dated June 22, 2017. The synaix group is an IT service provider with an integrated portfolio of solutions for the digitization of business processes (digital transformation services). The acqui-sition broadens the Group’s client lists and adds complementary solutions expertise, enabling the CANCOM Group to expand its IT as a service (ITaaS) and cloud and managed services business and strengthen its position as a digital transformation partner.
• On September 5, 2017, CANCOM SE notified bondholders of its irrevocable decision to redeem early all outstanding bonds forming part of the 0.875 percent CANCOM SE convertible bond issue 2014/2019 in line with the issuing conditions. Every holder of a convertible bond who had not exercised the conversion right in accordance with the issuing conditions by September 29, 2017 was repaid the specified nominal amount on October 6, 2017, in addition to the interest accrued up to (but not including) the call redemption date. A total of 968,574 new shares were issued to holders of convertible bonds in 2017 as a result of the exercising of conversion rights.
• In order to pursue the ambitious growth targets for the next few years consistently and make further progress in transforming the business model towards the provision of cloud and managed services, CANCOM SE has strengthened the competencies of the Executive Board. Thomas Volk (President and General Manager) joined the Executive Board with effect from November 1, 2017. Thomas Stark (CFO) was appointed to the Executive Board with effect from January 1, 2018.
Staff
CANCOM employed an average of 2,913 people in the fiscal year 2017, compared with 2,654 in 2016.
Number of employees in the CANCOM Group(as at December 31)
2016 2,654
2017 2,913
The staff worked in the following areas (as at December 31):
2017 2016
Professional services: 1,841 1,717
Sales and distribution: 600 542
Central services: 472 395
Earnings, financial and assets position of the CANCOM Group
There was further improvement in the earnings, financial and assets position during the fiscal year 2017.
Earnings position
The sales revenues of the CANCOM Group grew from € 1,023.1 million to € 1,161.2 million in 2017. This represents consolidated growth of 13.5 percent. As in 2016, the increase was reflected in both operating segments. The Executive Board believes the sustained demand from companies for the CANCOM Group’s products and solutions across all areas of the IT value chain is attributable to the high level of investment required in the economy as a whole - for both ongoing IT operations and increased digitization efforts.
COMBINED MANAGEMENT REPORT FOR CANCOM SE AND THE CANCOM GROUP

25
Of the sales revenues generated, a portion of € 51.8 million, which CANCOM views as derived from inorganic growth, was attrib-utable to acquired companies. In 2016 this portion of the sales revenues amounted to € 46.0 million.
CANCOM Group sales revenues 2016 – 2017 (in € million)
2016 1,023.1
2017 1,161.2
Sales revenues in Germany went up by 14.6 percent, from € 914.2 million to € 1,047.9 million. In international business, the Group’s sales revenues rose by 4.1 percent from € 108.9 million to € 113.4 million.
Sales revenues in the IT solutions segment increased from € 866.9 million to € 978.8 million – a growth of 12.9 percent year on year. In the cloud solutions segment, sales revenues were up 16.8 percent to stand at € 182.3 million, compared with € 156.1 million the year before. As in 2016, the Group’s positive performance in terms of sales revenues was driven by the cloud and managed services activities and the shared managed services business, as well as related solutions such as IT mobility, IT security, network solutions, and communications and collaboration, which contrib-uted to the positive performance of the integrated IT systems provider business.
The consolidated gross profit of the CANCOM Group rose by 9.9 percent, from € 292.7 million in 2016 to € 321.7 million in 2017. The slightly lower growth rate in comparison with the consoli-dated sales revenues was mainly due to an increase in services obtained from third parties. Accordingly, the gross profit margin decreased from 28.6 percent to 27.7 percent year on year.
CANCOM Group gross profit 2016 – 2017 (in € million)
2016 292.7
2017 321.7
In the IT solutions segment, gross profits were up from € 211.8 million in 2016 to € 226.4 million in 2017. This represented a slight improvement in gross profits in comparison with the previous year, in a segment strongly influenced by trade margins. In the cloud solutions segment, gross profits increased from € 69.7 million to € 90.3 million in the same reporting period. The significant increase in gross profits in the cloud solutions segment is largely due to the good performance of the high-margin area of the CANCOM portfolio - the high-skill services.
The growth of the CANCOM Group can be seen from the increase in staff numbers as well as the increase in sales revenues. The Group also continued its strategy of scaling up its activities in the higher-end consulting and services business and in IT growth areas in 2017. The consequent need to upskill staff and change the staff structure – in addition to the increase in staff numbers resulting from new hires and acquisitions of companies – resulted in an increase in staff expenditure from € 178.6 million to € 191.0 million in the fiscal year 2017. However, the ratio of staff expendi-ture to sales revenues improved from 17.5 percent to 16.4 percent, as the gratifyingly high growth more than compensated for the necessary increase in expenditure on well-qualified staff.
The details of the staff expenses were as follows (in ’000):
2017 2016
Wages and salaries 164,207 153,380
Social security contributions 26,316 24,816
Pension provisions 457 369
Total 190,981 178,565
Other operating expenses increased year on year from € 41.3 million to € 46.3 million, but the increase was only in proportion to the growth in sales revenues. The ratio between operating expenses and sales revenues was therefore unchanged in fiscal 2017 at 4.0 percent.
Consolidated earnings before interest, tax, depreciation and amor-tization (EBITDA) were up 15.9 percent and amounted to € 84.5 million compared with € 72.9 million in 2016. The EBITDA margin improved from 7.1 percent to 7.3 percent.
CANCOM Group EBITDA 2016 – 2017 (in € million)
2016 72.9
2017 84.5
EBITDA in the IT solutions segment increased from € 49.2 million in 2016 to € 50.5 million in 2017. In the cloud solutions segment, EBITDA was up from € 31.4 million to € 43.2 million. The increase in earnings was driven by the expansion of the Group’s business activities in the cloud and shared managed services business and also generated by the traditional integrated IT systems provider business.
COMBINED MANAGEMENT REPORT FOR CANCOM SE AND THE CANCOM GROUP

26
Corporate acquisitions usually lead to cost synergies within the Group for the acquired companies and CANCOM – for instance, by the use of resources for both existing and acquired units. This means that the relevant earnings cannot meaningfully be quanti-fied or allocated to organic or acquisition-based profit, and for this reason we do not attempt any such quantification or allocation. The profitability of both Group segments continues to remain at a high level. The EBITDA margin5 of the IT solutions segment was 5.2 percent compared with 5.7 percent in 2016, while that of the cloud solutions segment was 23.2 percent compared with 20.1 percent in 2016.
Consolidated earnings before interest, tax and amortization6 (EBITA) were up 17.1 percent, from € 59.5 million in 2016 to € 69.7 million in the fiscal year 2017. The amortization relates to the IFRS amortization of intangible assets from the purchase price alloca-tion (PPA) from acquisitions, and mainly arises in relation to client lists and orders in hand.
CANCOM Group EBITA 2016 – 2017 (in € million)
2016 59.5
2017 69.7
Consolidated earnings before interest and tax (EBIT) rose from € 51.3 million to € 60.5 million, representing an increase of 17.9 percent, which largely exceeded the growth in sales revenues. This improvement in profitability was largely due to the fact that the gratifyingly high growth more than compensated for the necessary increase in expenditure on well-qualified staff. The EBIT in the IT solutions segment amounted to € 36.6 million (2016: € 34.3 million), while the EBIT in the cloud solutions segment amounted to € 33.3 million (2016: € 25.0 million).
CANCOM Group EBIT 2016 – 2017 (in € million)
2016 51.3
2017 60.5
The improved profitability noticeable in the consolidated EBIT was also evident in the net income for the period, as there were no extraordinary changes in the financial result and taxes overall. The net income of the CANCOM Group for the fiscal year 2017 was € 40.0 million, compared with € 33.7 million the previous year. In 2017, € 39.8 million of this was attributable to stockholders of the parent company (CANCOM SE) (2016: € 33.4 million).
This resulted in basic earnings per share from the net income attributable to stockholders of € 2.38, compared with € 2.07 in the year before.
Order position
In the cloud solutions segment and large parts of the IT solutions segment, orders are often placed over long periods. For this reason, the reporting date figures do not give a good indication of the order situation in this segment, and they are therefore not published. At the time this management report was written, capacity utilization among our consultants was good in both oper-ating segments. Demand for integrated solutions is in line with our expectations in either of the segments.
Financial and assets position
Objectives of financial management
The core objective of the financial management of CANCOM is to safeguard its liquidity at all times in such a way that day-to-day business activities can be continued. In addition, the Group aims to achieve optimum profitability as well as a high credit status to ensure favorable refinancing rates.
Notes on the capital structure
The current liabilities amount to € 294.7 million (2016: € 188.5 million), and include trade accounts payable of € 221.0 million (2016: € 127.1 million), in addition to the portion of long-term debt due within a year, subordinated loans and capital from profit participation rights, provisions and other current liabilities and other payables.
The non-current liabilities, which amount to € 33.2 million (2016: € 64.2 million), are liabilities with a residual term of at least one year. The sharp fall is mainly due to the convertible bond, which was fully converted into shares or repurchased in 2017. Convert-ible bonds, a balance sheet item no longer existing at the end of 2017, amounted to € 41.8 in 2016.
5) EBITDA margin = (EBITDA / gross profit) * 100 6) EBITA = net income for the period + taxes + profit/loss accounted for using the equity method + income from long-term equity investments + financial result + amortization of intangible assets
COMBINED MANAGEMENT REPORT FOR CANCOM SE AND THE CANCOM GROUP

27
The financing structure is distinctly geared towards the long term. There was a sharp decline in interest-bearing liabilities from € 48.3 million as at December 31, 2016 to € 4.4 million as at December 31, 2017, likewise mainly due to the repayment or conversion of the convertible bond. The interest-bearing liabilities now comprise only long-term loans and subordinated loans. The short-term loans and the short-term portion of long-term loans amounted to € 3.8 million, compared with € 1.9 million recognized in 2016. Other long-term liabilities increased from € 3.5 million to € 7.2 million.
Total assets grew from € 537.8 million in 2016 to € 692.1 million in 2017. The nominal equity capital, including capital reserves, rose to € 364.3 million during the year (2016: € 285.1 million), mainly due to retention of profits and an increase in capital reserves. There was a particularly sharp increase in capital reserves, as a signifi-cant portion of the outstanding convertible bonds were converted into CANCOM SE shares during the fiscal year 2017, and the capital increase against non-cash contributions connected with the acquisition of the synaix group also had the effect of increasing capital reserves. At 52.6 percent, the equity ratio as at December 31, 2017 was roughly the same as in the previous year (December 31, 2016: 53.0 percent).
On the assets side, current assets went up from € 370.8 million to € 438.0 million. Cash and cash equivalents increased sharply from € 63.6 million to € 157.6 million year on year. Other current finan-cial assets totaled € 25.3 million and thus were significantly below the prior-year figure of € 96.1 million. The cash position is covered in the section below. Due to the expansion of the company’s busi-ness activities, trade accounts receivable rose from € 182.4 million to € 223.7 million. Inventories were approximately the same as in the previous year, at € 22.9 million (2016: € 22.5 million).
Non-current assets were also up markedly at € 254.1 million as at the reporting date of December 31, 2017 compared with € 167.0 million the previous year. The increase can be seen most clearly in the property plant and equipment (tangible assets) balance sheet item, which rose from € 44.1 million to € 60.9 million; intangible assets, which went up from € 28.3 million to € 56.5 million; and goodwill, which increased from € 73.2 million to € 115.2 million. The main reasons for these changes were the extensive investment in the construction of the new logistics center at the Jettingen loca-tion in Germany – which caused an increase in property plant and equipment – and the acquisitions of forwerts, antauris, synaix and c.a.r.u.s. and the inclusion of these companies in the consolidated financial statements for the first time, with the resulting impact on goodwill in particular.
Notes to the changes in cash and cash equivalents
The expansion of the Group’s business activities, a further improvement in profits for the period, and especially a stronger focus on working capital management – partly by taking advan-tage of CANCOM’s importance to suppliers as a major purchaser – resulted in a sharp increase in trade accounts payable and a cash flow of € 124.9 million from operating activities (2016: € 48.2 million).
Having reached an extraordinarily high negative figure of € 125.6 million in 2016, the cash flow from investing activities returned to a significantly lower negative figure of € 16.6 million. This reduction was mainly the result of a significant fall in the volume of acquisitions of financial assets held for sale, combined with a sharp increase in the volume of disposals of financial assets held for sale. Added to this, there was an increase in capital expendi-ture due to the purchase of intangible assets and property, plant and equipment, (tangible assets) although these increased invest-ments were significantly outweighed by the effects mentioned above.
There was a negative cash flow of € 12.2 million from financing activities – around the same level as in 2015. In 2016, this cash flow was well into positive figures, at € 54.7 million. This excep-tional figure was influenced, among other things, by a capital increase against cash contributions in that year.
Overall, these developments resulted in a strong inflow of cash and cash equivalents in the fiscal year 2017. Cash and cash equivalents as at December 31, 2017 were € 157.6 million, up from € 63.6 million at December 31, 2016.
At the reporting date, the CANCOM Group had credit facilities (including guarantees) of € 87.4 million provided by banks. Of this amount, € 82.8 million was readily available as at December 31, 2017.
On balance, the earnings, assets and financial position of the Group improved further in the fiscal year 2017, and can therefore be described as good.
COMBINED MANAGEMENT REPORT FOR CANCOM SE AND THE CANCOM GROUP

28
Earnings, financial and assets position of CANCOM SE
CANCOM SE performs the central financial and management role with regard to the long-term equity investments held by the CANCOM Group. The risks and opportunities of CANCOM are therefore the risks and opportunities of its long-term equity invest-ments. These are commented on in more detail in the report on risks and opportunities in section 6.
CANCOM SE generated sales revenues of € 7.7 million (2016: € 7.8 million) from intercompany management fees and net income for the year of € 38.0 million (2016: € 27.2 million). This figure mainly consisted of income of € 45.8 million (2016: € 39.0 million) from profit transfer agreements with subsidiaries and intercompany management fees.
Total assets increased from € 340.7 million as at December 31, 2016 to € 377.4 million as at December 31, 2017. The reason for this was the increase in equity capital, which at the end of the reporting period amounted to € 362.8 million (2016: € 283.9 million). The increase was caused by higher capital reserves following a capital increase against non-cash contributions, the conversion of convert-ible bonds into shares, added to the net income for the year and retention of profits. The higher equity figure also compensated for the effect of the significant reduction in liabilities, which were down from € 45.7 million to only € 2.5 million. This was triggered by the redemption and conversion of the convertible bond as well as full repayment of the bondholders in October 2017.
The equity ratio of CANCOM SE as at the reporting date was 96.1 percent (2016: 83.3 percent).
Cash and cash equivalents decreased from € 95.8 million at the end of fiscal 2016 to € 56.8 million as at December 31, 2017.
Overall, CANCOM SE’s earnings, assets and financial position continued to be very robust in the fiscal year of 2017.
3. Information concerning takeovers
The paragraphs below contain disclosures in accordance with Section 289a, paragraph 1 and Section 315a, paragraph 1 of the German Commercial Code (Handelsgesetzbuch, HGB). For details, please see the Notes to the Group financial statements and the Notes to the financial statements of CANCOM SE.
Capital stock: amount and division
In accordance with the company’s by-laws, the company’s capital stock as at December 31, 2017 was € 16,553,245 (2016: € 16,367,531), divided into 16,553,245 no-par value shares (shares without a nominal value) (2016: 16,367,531). However, the conversion of CANCOM SE convertible bonds into CANCOM SE shares increased the capital stock of the company further during the fiscal year. In accordance with the by-laws, the company’s contin-gent capital 2013/I was used for this increase. However, the related amendment to the by-laws was not yet entered in the commercial register as at the reporting date.
The company’s capital stock at the time of publication of this report is therefore € 17,521,819. It is divided into 17,521,819 no-par value bearer shares. Each share represents € 1,00 of the capital stock. The shares are evidenced by global certificates, and the stockholders have no claim to the issue of individual physical share certificates.
Each no-par value share carries a voting right at general meetings of stockholders. Different classes of shares do not exist. The same rights and duties are attached to all shares. There are no holders of shares with special rights that confer controlling powers.
Direct or indirect equity investments of 10 percent or more
CANCOM was made aware of the following direct equity interests exceeding 10 percent of the voting rights in the fiscal year 2017:
PRIMEPULSE Beteiligungs GmbH (formerly AL-KO Beteiligungs GmbH): 10.056 percent
Appointment and dismissal of members of the Executive Board
The appointment and dismissal of members of the Executive Board is governed by Section 84 paragraph 3 and Section 85 of the German Stock Corporation Act (Aktiengesetz, AktG) in conjunc-tion with Article 9, paragraph 1 c (ii) and Article 39 of the Council Regulation (EC) No. 2157/2001 on the Statute for a European Company (SE). The Supervisory Board determines the number of members in the Executive Board. CANCOM follows the recom-mendations of the German Corporate Governance Code when appointing members of the Executive Board, taking into account the company’s specific situation.
COMBINED MANAGEMENT REPORT FOR CANCOM SE AND THE CANCOM GROUP

29
Changes to corporate by-laws
Changes to the corporate by-laws are governed by Sections 133 and 179 of the German Stock Corporation Act. Any resolution regarding a change to the corporate by-laws must be passed by at least a three-quarters majority vote of the capital stock represented at the general meeting of stockholders. The corporate by-laws may differ in this respect from the legal stipulations and impose a different majority vote. However, where there is a proposal to change the object of the company, the majority vote required to pass such a resolution may only be increased. Section 15, para-graph 3 of the corporate by-laws of CANCOM SE contains such a provision. According to this provision, resolutions to change the corporate by-laws require a majority of two-thirds of the votes cast, or, if at least half of the capital stock is represented by a simple majority of the votes cast. In cases where the law addi-tionally requires a majority of the capital stock represented in the vote on the resolution, a simple majority of the capital stock repre-sented in the vote on the resolution will suffice, unless stipulated otherwise by law. The general meeting of stockholders may confer on the Supervisory Board the authority to make amendments that merely concern the wording. At CANCOM, this has been done by means of section 11 of the corporate by-laws.
Significant agreements that are subject to alteration in the event of a change of control
Please see section 4.1.1. of the remuneration report for details of these agreements.
4. Remuneration report
The remuneration report presents the basic principles of the system for remuneration of Executive Board members, and explains the structure and level of Executive Board members’ remuneration and the emoluments of the Supervisory Board members. The report is based on the recommendations of the German Corporate Governance Code and contains details in compliance with the requirements of the German Commercial Code as well as International Financial Reporting Standards (IFRS). The remuneration report below forms a part of the combined management report and the notes to the consolidated accounts.
4.1. Remuneration of the Executive Board
The Supervisory Board as a whole is responsible for establishing and reviewing the remuneration system and the level of remu-neration of the Executive Board. The remuneration is based on factors such as the size of the company, its financial situation, its performance, and its prospects, as well as the level of remunera-tion of the executive boards of comparable companies, both within and outside the IT sector. Other factors taken into account are the responsibilities and the personal performance of the relevant Executive Board member, as well as the level of remuneration that would be considered normal given the remuneration structure of the rest of the company. The system of Executive Board remuner-ation used at CANCOM is aimed at the sustainable growth of the enterprise.
The most current approval of the remuneration system for the Executive Board was given by the general meeting of shareholders on June 8, 2011.
4.1.1. Components of Executive Board remuneration
The remuneration of the Executive Board is performance-based. In 2017, the remuneration of Klaus Weinmann, Rudolf Hotter and Thomas Volk consisted of a fixed payment (basic salary) and a variable bonus. The Executive Board remuneration does not include any equity-based component. In the fiscal year 2017, the Executive Board members did not have any subscription rights or any other stock-based remuneration regarding shares in CANCOM SE. There were no pension benefits.
The fixed remuneration is paid in the form of monthly salary payments. Whether the variable bonus is paid, and how much is paid, depends on the earnings for the year (EBITDA), or the degree to which the target EBITDA of the CANCOM Group is achieved. The bonus consists of a short-term bonus based on the achieve-ment of targets (over one fiscal year), and of a bonus which is a long-term bonus (for three fiscal years). The short-term bonus paid to Klaus Weinmann is 0.7 percent of the EBITDA generated, while Rudolf Hotter’s bonus is 0.45 percent of the EBITDA achieved. The long-term bonus paid to Klaus Weinmann is 0.8 percent of the EBITDA generated, while Rudolf Hotter’s bonus is 0.55 percent of the achieved EBITDA. As a bonus for the fiscal year 2017, Thomas Volk receives 0.33 percent of the consolidated EBITDA generated, if this exceeds the value of 80 percent of the target fixed, but is capped at 125 percent.
COMBINED MANAGEMENT REPORT FOR CANCOM SE AND THE CANCOM GROUP
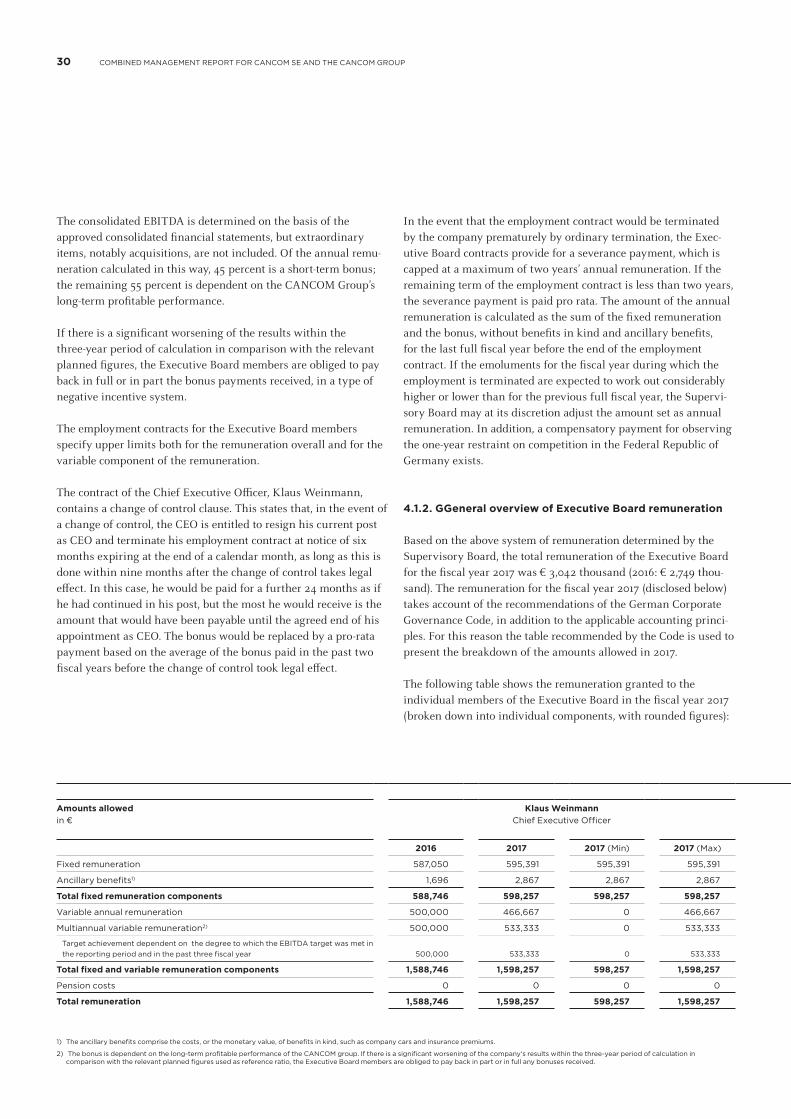
30
The consolidated EBITDA is determined on the basis of the approved consolidated financial statements, but extraordinary items, notably acquisitions, are not included. Of the annual remu-neration calculated in this way, 45 percent is a short-term bonus; the remaining 55 percent is dependent on the CANCOM Group’s long-term profitable performance.
If there is a significant worsening of the results within the three-year period of calculation in comparison with the relevant planned figures, the Executive Board members are obliged to pay back in full or in part the bonus payments received, in a type of negative incentive system.
The employment contracts for the Executive Board members specify upper limits both for the remuneration overall and for the variable component of the remuneration.
The contract of the Chief Executive Officer, Klaus Weinmann, contains a change of control clause. This states that, in the event of a change of control, the CEO is entitled to resign his current post as CEO and terminate his employment contract at notice of six months expiring at the end of a calendar month, as long as this is done within nine months after the change of control takes legal effect. In this case, he would be paid for a further 24 months as if he had continued in his post, but the most he would receive is the amount that would have been payable until the agreed end of his appointment as CEO. The bonus would be replaced by a pro-rata payment based on the average of the bonus paid in the past two fiscal years before the change of control took legal effect.
In the event that the employment contract would be terminated by the company prematurely by ordinary termination, the Exec-utive Board contracts provide for a severance payment, which is capped at a maximum of two years’ annual remuneration. If the remaining term of the employment contract is less than two years, the severance payment is paid pro rata. The amount of the annual remuneration is calculated as the sum of the fixed remuneration and the bonus, without benefits in kind and ancillary benefits, for the last full fiscal year before the end of the employment contract. If the emoluments for the fiscal year during which the employment is terminated are expected to work out considerably higher or lower than for the previous full fiscal year, the Supervi-sory Board may at its discretion adjust the amount set as annual remuneration. In addition, a compensatory payment for observing the one-year restraint on competition in the Federal Republic of Germany exists.
4.1.2. GGeneral overview of Executive Board remuneration
Based on the above system of remuneration determined by the Supervisory Board, the total remuneration of the Executive Board for the fiscal year 2017 was € 3,042 thousand (2016: € 2,749 thou-sand). The remuneration for the fiscal year 2017 (disclosed below) takes account of the recommendations of the German Corporate Governance Code, in addition to the applicable accounting princi-ples. For this reason the table recommended by the Code is used to present the breakdown of the amounts allowed in 2017.
The following table shows the remuneration granted to the individual members of the Executive Board in the fiscal year 2017 (broken down into individual components, with rounded figures):
Amounts allowed in €
Klaus Weinmann Chief Executive Officer
Rudolf Hotter Executive Board member
Thomas Volk Executive Board member
2016 2017 2017 (Min) 2017 (Max) 2016 2017 2017 (Min) 2017 (Max) 2016 2017 2017 (Min) 2017 (Max)
Fixed remuneration 587,050 595,391 595,391 595,391 429,605 445,568 445,568 445,568 0 100,000 100,000 100,000
Ancillary benefits1) 1,696 2,867 2,867 2,867 2,943 2,943 2,943 2,943 0 5,000 5,000 5,000
Total fixed remuneration components 588,746 598,257 598,257 598,257 432,548 448,511 448,511 448,511 0 105,000 105,000 105,000
Variable annual remuneration 500,000 466,667 0 466,667 363,930 380,140 0 380,140 0 21,136 0 21,136
Multiannual variable remuneration2) 500,000 533,333 0 533,333 363,930 464,615 0 464,615 0 25,833 0 25,103
Target achievement dependent on the degree to which the EBITDA target was met in the reporting period and in the past three fiscal year
500,000
533,333
0
533,333
363,930
464,615
0
464,615
0
25,103
0
25,103
Total fixed and variable remuneration components 1,588,746 1,598,257 598,257 1,598,257 1,160,408 1,293,266 448,511 1,293,266 0 151,969 105,000 151,239
Pension costs 0 0 0 0 0 0 0 0 0 0 0 0
Total remuneration 1,588,746 1,598,257 598,257 1,598,257 1,160,408 1,293,266 448,511 1,293,266 0 151,969 105,000 151,239
1) The ancillary benefits comprise the costs, or the monetary value, of benefits in kind, such as company cars and insurance premiums.
2) The bonus is dependent on the long-term profitable performance of the CANCOM group. If there is a significant worsening of the company‘s results within the three-year period of calculation in comparison with the relevant planned figures used as reference ratio, the Executive Board members are obliged to pay back in part or in full any bonuses received.
COMBINED MANAGEMENT REPORT FOR CANCOM SE AND THE CANCOM GROUP

31
4.1.3. Payments received
The table below shows the amounts of fixed remuneration, ancillary benefits, annual variable remuneration and multiannual variable remuneration received by the Executive Board members in/for the fiscal year 2017, broken down into the relevant reference
years, as well as the pension costs. Unlike the above table, which shows the multiannual variable remuneration allowed for the fiscal year 2017, the table below shows the actual value of the multiannual variable remuneration allowed in previous years and received in 2017.
Payments received (in €)
Klaus Weinmann Chief Executive Officer
Rudolf Hotter Member of Executive Board
Thomas Volk Member of Executive Board
2016 2017 2016 2017 2016 2017
Fixed remuneration 587,050 595,391 429,605 445,568 0 100,000
Ancillary benefits1) 1,696 2,867 2,943 2,943 0 2,943
Total fixed remuneration components 588,746 598,257 432,548 448,511 0 102,943
Variable annual remuneration 500,000 500,000 315,349 363,930 0 0
Multiannual variable remuneration2) 500,000 500,000 315,349 363,930 0 0
Target achievement dependent on the degree to which the EBITDA target was met in the reporting period and in the past three fiscal year
500,000
500,000
315,349
363,930
0
0
Total fixed and variable remuneration components 1,588,746 1,598,257 1,063,246 1,176,371 0 102,943
Pension costs 0 0 0 0 0 0
Total remuneration 1,588,746 1,598,257 1,063,246 1,176,371 0 102,943
1) The ancillary benefits comprise the costs, or the monetary value, of ancillary benefits, such as company cars, and insurance premiums.
2) The bonus is dependent on the long-term profitable performance of the CANCOM Group. If there is a significant worsening of the company’s results within the three-year period of calcu-lation in comparison with the relevant planned figures used as reference ratio, the Executive Board is obliged to pay back in part or in full any bonuses received.
Amounts allowed in €
Klaus Weinmann Chief Executive Officer
Rudolf Hotter Executive Board member
Thomas Volk Executive Board member
2016 2017 2017 (Min) 2017 (Max) 2016 2017 2017 (Min) 2017 (Max) 2016 2017 2017 (Min) 2017 (Max)
Fixed remuneration 587,050 595,391 595,391 595,391 429,605 445,568 445,568 445,568 0 100,000 100,000 100,000
Ancillary benefits1) 1,696 2,867 2,867 2,867 2,943 2,943 2,943 2,943 0 5,000 5,000 5,000
Total fixed remuneration components 588,746 598,257 598,257 598,257 432,548 448,511 448,511 448,511 0 105,000 105,000 105,000
Variable annual remuneration 500,000 466,667 0 466,667 363,930 380,140 0 380,140 0 21,136 0 21,136
Multiannual variable remuneration2) 500,000 533,333 0 533,333 363,930 464,615 0 464,615 0 25,833 0 25,103
Target achievement dependent on the degree to which the EBITDA target was met in the reporting period and in the past three fiscal year
500,000
533,333
0
533,333
363,930
464,615
0
464,615
0
25,103
0
25,103
Total fixed and variable remuneration components 1,588,746 1,598,257 598,257 1,598,257 1,160,408 1,293,266 448,511 1,293,266 0 151,969 105,000 151,239
Pension costs 0 0 0 0 0 0 0 0 0 0 0 0
Total remuneration 1,588,746 1,598,257 598,257 1,598,257 1,160,408 1,293,266 448,511 1,293,266 0 151,969 105,000 151,239
COMBINED MANAGEMENT REPORT FOR CANCOM SE AND THE CANCOM GROUP

32
4.2. Remuneration of the Supervisory Board
The remuneration for the Supervisory Board was decided at the general meeting of shareholders on June 21, 2012. The prin-ciples of the remuneration system are laid down in number 13 of the currently applicable version of the corporate by-laws for CANCOM. The remuneration system for members of the Supervi-sory Board was also amended and clarified by a resolution of the general meeting of shareholders on June 25, 2014, particularly in respect of work performed on the Committees of the Supervisory Board. The Supervisory Board’s remuneration consists of a fixed component only. The remuneration of the Deputy Chairperson and Chairperson of the Supervisory Board, and the members of the Committees and their chairpersons, is higher than that of the other Supervisory Board members. The remuneration system also takes into account the number of meetings attended by the different Supervisory Board members, as they are paid an atten-dance fee for each meeting they attend.
4.2.1. Components of Supervisory Board remuneration
Each member of the Supervisory Board receives a fixed annual remuneration for his/her activities as Supervisory Board member, which is determined by the general meeting of stockholders and remains fixed until a general meeting of stockholders resolves on a change. In accordance with the resolution passed by the general meeting of stockholders on June 21, 2012, each member receives a payment of € 20,000. The Deputy Chairperson receives double the fixed amount paid to the other members, and the Chairperson
receives four times the amount. Each member also receives an attendance fee of € 1,000. The attendance fee for the Chairperson of the Supervisory Board is € 2,000. If a Supervisory Board member does not serve a full year, he/she receives the pro rata remuneration for the period served.
The company reimburses the Supervisory Board members for any expenses incurred in direct connection with their position. Sales tax is reimbursed by the company if the relevant Supervisory Board member is entitled to bill separately for sales tax of the company, and exercises this entitlement.
In accordance with a resolution passed by the general meeting of shareholders on June 25, 2014, the Committee members receive a fixed annual remuneration for their Committee work as follows: as members of the Nominating Committee or the Audit Committee, the members of the Supervisory Board receive a single annual payment; members of the Nominating Committee receive a remu-neration of € 1,000 (the Chairperson of the Committee is paid € 2,000); members of the Audit Committee receive remuneration of € 2,000 (the Chairperson receives € 4,000). If a Supervisory Board member does not serve a full year on a Committee, he/she receives the pro rata remuneration for the period served.
4.2.2. General overview of Supervisory Board remuneration
The Supervisory Board members received the following remunera-tion in the fiscal year 2017 (rounded figures):
Fixed remuneration in €
Attendance fee in €
Total 2017 in €
Total 2016 in €
Dr. Lothar Koniarski 85,000 12,000 97,000 56,290
Uwe Kemm 42,000 6,000 48,000 31,645
Walter Krejci 9,000 1,000 10,000 29,000
Regina Weinmann 21,000 6,000 27,000 30,000
Dominik Eberle 20,000 6,000 26,000 100,065
Martin Wild, 16,667 4,000 20,667 0
Marlies Terock 11,667 4,000 15,667 0
Roland Welzbacher 0 0 0 1,667
Raymond Kober 0 0 0 16,667
Total 205,333 39,000 244,333 265,334
COMBINED MANAGEMENT REPORT FOR CANCOM SE AND THE CANCOM GROUP

33
In fiscal 2017, the Supervisory Board members did not receive any other remuneration or benefits for services provided individually, especially consulting or agency services. They were not granted loans or advance payments, nor has the company entered any contingent liabilities in favor of Supervisory Board members.
4.3. D & O insurance
The company has directors’ and officers’ insurance covering legal liability in relation to the activities of the Executive Board, the Supervisory Board and managerial employees. A deductible has been agreed for the D&O insurance covering the Executive and Supervisory Boards.
5. Corporate governance declaration as defined in Section 315d in conjunction with Section 289f of the German Commercial Code
As defined in Section 315d in conjunction with Section 289f of the German Commercial Code, CANCOM has published a corporate governance declaration on the company’s website that can be freely accessed.
6. Non-financial declaration in accordance with Sections 315c and 289c of the German Commercial Code
CANCOM publishes the non-financial declaration inspected by the Supervisory Board in accordance with Sections 315c and 289c of the German Commercial Code as a separate, combined non-financial report for the CANCOM Group and CANCOM SE on the company’s website at www.cancom.com/reports within four months of the reporting date.
7. Risks and opportunities report
As an international operator in a fast-moving sector, the CANCOM Group faces many risks and opportunities, which may have considerable impact on CANCOM’s business performance, and thus also on its financial and assets position and profits. There are always certain risks associated with business opportunities. CANCOM’s aim, therefore, is to achieve a sustainable increase in the value of the company for our stockholders by means of an optimal balance between the risks and opportunities.
Risk and opportunity management
One of the basic principles of responsible business management based on stockholder value maximization is that management should exploit business opportunities while at the same time antic-ipating and controlling the associated risks.
CANCOM’s management closely monitors market trends and assesses the competitive situation, using the information it finds to identify potential opportunities in the relevant operating segments and set appropriate targets and measures at annual planning meet-ings with the Executive Board and operational management.
Ongoing risk management, on the other hand, is necessary for efficient monitoring and early identification of risks and is thus also an integral component of the strategic and business develop-ment as well as the internal monitoring and control system of the CANCOM Group. CANCOM’s risk management system is aimed at identifying as early as possible any risks that could endanger the future of the company as a going concern, and/or substantial business risks, and dealing with them in a responsible way.
Risk management system
The Internal control and risk management system in relation to the Group accounting process
The internal control and risk management system at CANCOM in relation to the (Group) accounting process includes guidelines, procedures and measures intended to ensure that the accounting process complies with the relevant laws and standards. The main features of the system are as follows:
• CANCOM has a clear management and corporate structure, in addition to a schedule of responsibilities. Cross-departmental key functions are centrally controlled by CANCOM SE.
• The functions of the business areas with the greatest invol-vement in the accounting process are clearly divided. The areas of responsibility are clearly allocated.
• Integrity and responsibility with regard to finance and financial reporting are safeguarded by a commitment made to this effect in the company’s internal Code of Conduct.
• CANCOM takes care to analyze new laws, accounting stan-dards and other announcements, as failure to comply with them would pose a major risk to the correctness of CANCOM’s accounting processes.
COMBINED MANAGEMENT REPORT FOR CANCOM SE AND THE CANCOM GROUP

34
• Appropriate facilities are in place in the IT areas to protect CANCOM’s financial systems against unauthorized access. Where possible, standard software is used in the financial systems.
• The consolidation is performed in the central consolidation department, using the same consolidation software across all companies.
• The annual financial statements that are included in the consoli-dated financial statements are prepared according to accounting guidelines that apply throughout the Group.
• There is an integrated approach to corporate governance, in which all elements – risk management, compliance manage-ment, the in-house audit department and the internal control system (ICS) – influence each other. The effectiveness of the various elements is regularly checked.
• An appropriate system of guidelines (for example payment and travel cost guidelines etc.) is in place, and is continuously updated.
• The main assets of all the companies are regularly tested for impairment, and there are guidelines that cover the checking of all accounting-related processes.
• All payment-related processes are subject to cross-checking.
• Accounting-related processes are inspected by the in-house audit department, (which is independent of these processes).
• Both the risk management system and the internal control system have appropriate measures for the control of accoun-ting-related processes.
• Departments and divisions involved in the accounting process are equipped with appropriate resources, in terms of both quan-tity and quality.
• Accounting data received and passed on is continually checked in order to ensure it is complete and correct. This is done by means of spot checks, among other methods. There is a three-stage system for checking the correctness of financial statem-ents. First, single-entity financial statements are generated by the financial accounting department. In a second control stage, Group accounts are prepared and consolidated figures produced; and in the third stage a review is carried out by managerial staff of the finance department.
The internal control and risk management system with regard to the accounting process is intended to ensure that company data is always correctly recorded, processed and acknowledged in the balance sheet, and included in the financial statements.
A proper, consistent and continuous accounting process is depen-dent on skilled and qualified staff, the use of appropriate software, and clear legal and corporate guidelines. A well-defined demar-cation of responsibilities and various controlling and checking mechanisms, as described above (especially plausibility checks and cross-checking), ensure that accounting is carried out correctly and responsibly.
In particular, the process creates the necessary organizational structure for recording, processing and documenting business transactions and entering them immediately and correctly in the accounts in compliance with the legal requirements, the corporate by-laws and the internal guidelines. At the same time the process provides for assets and liabilities in the annual and consolidated financial statements to be accurately recognized, reported and valued, and for comprehensive, reliable and relevant information to be made available quickly.
Risk identification, analysis and documentation
To identify risks and ensure that the risk control system is adequate, the Executive Board has formulated risk principles and appointed a central risk officer to monitor and evaluate possible risks. One of the prime objectives of risk management is the early identification of major risks and those that might jeopardize the future of the company as a going concern, as well as the initiation of appropriate measures as part of the risk control process to minimize or prevent any loss caused to the enterprise when a risk materializes.
CANCOM has put together a risk manual, which documents the organizational rules and measures for risk identification, analysis, evaluation, quantification, management and control. The manual also describes the appropriate way to handle business risks at CANCOM.
CANCOM’s risk evaluation process starts by grouping the identi-fied risks into thematic clusters. The probability that these risks will materialize is then assessed and the potential loss determined. All the risks identified become the responsibility of a special appointee. If the risks are quantifiable, they are measured with the aid of appropriately defined key figures. If no precisely defined ratios are available, the risks are assessed by the special appointee.
COMBINED MANAGEMENT REPORT FOR CANCOM SE AND THE CANCOM GROUP

35
Three categories are used to distinguish between the levels of probability that a risk will materialize: low, medium and high. The severity of the potential loss associated with the individual risk is also ranked according to these categories. The individual risks are arranged in a risk matrix, where they are allocated to various risk classes according to the above dimensions. The tables below outline the two dimensions and show the resulting risk matrix.
PROBABILITY OF OCCURRENCE
Probability of occurrence Definition
Low Probability < 33%
Medium Probability 34% to 66%
High Probability > 66%
POTENTIAL LOSS
Potential loss Definition
Low Minor negative impact on the earnings, asset and financial situation
Medium Significant negative impact on the earnings, asset and financial situation
High Major negative impact on the earnings, asset and financial situation
RISK MATRIX
Probability of occurrence Potential loss
Low Medium High
Low Moderate risk
High risk High risk
Medium Low risk Moderate risk
High risk
High Low risk Low risk Moderate risk
For risks to the company as a going concern, CANCOM’s risk management system has defined early warning indicators. Changes or trends in these are continually monitored and discussed in risk management meetings. The regular risk manage-ment meetings between the Executive Board and the risk officer ensure ongoing and timely control of existing and future risks. They also provide the best possible guarantee that the Executive Board and the Supervisory Board are informed in good time of any possible major risks.
Risks of future development
The following paragraphs provide an overview of the risks classi-fied as substantial, and the possible future developments or events that would potentially have a negative impact on the CANCOM Group. It is not possible to rule out the existence of other risks that are not yet known or that are currently felt to be insignificant, and which could be equally damaging to the business in the future. In principle, all the risk factors referred to below concern both oper-ating segments (cloud solutions and IT solutions) equally. If one of the two business fields is particularly affected by a risk, this will be pointed out in each case.
Industry and market risks
The CANCOM Group’s order position is affected by the economic and (geo)political situation.
As a provider of integrated information and communications technology (ICT) solutions, CANCOM is dependent on the demand for hardware, software and information technology solutions. The size of the client’s IT budget depends on both the companies’ financial situation and the general economic and increasingly (geo)political conditions. If budgets for IT expenditure are cut, or the funds are used for other purposes, companies may become less willing to invest in IT and therefore postpone or cancel orders. A significant deterioration in the economic situation could therefore have a serious impact on the outlook for the CANCOM Group’s business.
The IT market is intensely competitive. An increasing level of competition could lead to a reduction in sales revenues, lower margins and/or a loss of market shares for the CANCOM Group.
The market in which the CANCOM Group operates is highly competitive and subject to rapid change. Insufficient knowledge of the market and the competition could result in wrong decisions – or a failure to make decisions – with regard to both the marketing mix and how to approach the market, and the Group’s strategic and tactical product and pricing policy. This could be detrimental to the Group’s sales performance and result in perseverance in already saturated markets, as well as risky investments in new business fields with uncertain market success. CANCOM guards against these risks by means of regular analysis of research infor-mation and discussions with clients, experts and IT analysts as well as continuous reviews of market attractiveness, technological developments, the competitive situation and sales revenue perfor-mance.
COMBINED MANAGEMENT REPORT FOR CANCOM SE AND THE CANCOM GROUP

36
The Group is in competition with both large and medium sized providers of integrated IT systems. International integrated systems providers are increasingly attempting to gain a market share in the operating segments and client groups served by the CANCOM Group. Additionally, the process of consolidation in the market has accelerated in the past few years owing to takeovers, as well as insolvencies among integrated IT systems providers of various sizes. If this process continues, the pricing and competi-tive pressure the Group already experiences could intensify. It is also possible that new competitors will emerge onto the market, or that new alliances could be formed between competitors, which could gain a substantial market share within a short period of time. In the market for cloud computing in particular, rapid growth is being recorded by hyperscale cloud providers such as Google and Amazon, which offer public cloud services. This could lead future transactions and related corporate expenditure or investments shifting to hyperscale cloud providers. Although only a few of CANCOM’s current and potential competitors have better resources (for instance, in terms of finance, technology, marketing or purchasing) at their disposal, we cannot rule out the possibility that competitors may be able to respond more quickly to new or developing technologies or standards, or to changes in clients’ requirements, or to supply competitive products at a lower consumer price. Intensified competition could lead to downward pressure on prices, reduced margins and a loss of market share. CANCOM’s integrated portfolio of products and services, carefully tailored to the target Groups, makes it stand out from the compe-tition.
In order to counter the industry and market risks, CANCOM is constantly adapting its organizational structure, its processes and its range of products and solutions to the current market condi-tions and to clients’ requirements. In particular, the focus and the challenge are concentrated on the expansion in business fields with higher growth potential (cloud computing, shared managed services etc.). Unlike projects exclusively involving the integrated systems business, contracts for projects in these new business areas generally run over several years, reducing the Group’s depen-dence on short-term trends in the economy.
In addition, CANCOM conducts in-depth analyses of the market and technologies on an ongoing basis to enable it to identify new trends early and ensure that the Group remains competitive in the long term.
We cannot rule out the possibility that one or more of the indi-vidual industry and market risks described above might materi-alize. CANCOM estimates the probability of their occurrence as high. Depending on the individual case, these risks could have a major adverse impact on CANCOM’s business activities and its assets and earnings position. These risks are therefore considered to be high. There has not been any change in the classification since 2016.
There are risks from direct sales by manufacturers.
The CANCOM Group is increasingly in direct competition with manufacturers of hardware and software. Whereas in the past manufacturers predominantly distributed their products through intermediaries such as CANCOM, there is now an increasing tendency for manufacturers in the sector to engage in retail sales. This creates additional price and competitive pressure for the CANCOM Group. If the manufacturers succeed in establishing their direct sales business more firmly, this could have a substan-tial negative impact on the Group’s assets, financial and earnings position.
CANCOM feels its flexibility and service quality give it a definite competitive advantage over manufacturers in its core target market – (high-end) medium sized enterprises – and is working to boost its competitive edge by means of appropriate measures.
We cannot rule out the possibility that this risk might materialize. CANCOM estimates the probability of occurrence as medium. Depending on the individual case, this risk could have a moderate adverse impact on CANCOM’s business activities and its assets and earnings position. CANCOM therefore considers the risk to be moderate.
There has not been any change in the classification of this risk in comparison with 2016.
COMBINED MANAGEMENT REPORT FOR CANCOM SE AND THE CANCOM GROUP

37
Product and technology risks
There is a risk that the solutions and services of the CANCOM Group might not meet the latest requirements of its clients or comply with changed regulatory requirements, owing to techno-logical and digital change or new trends.
The IT sector is subject to rapid technological change. In partic-ular, the market is shaped by rapid development of technologies, frequent introductions of improved or new solutions and services, constant changes in client requirements and regulatory changes, for instance in the area of data protection. The CANCOM Group develops some technology solutions in-house as part of its busi-ness activities. These are partly based on standard systems which the CANCOM Group customizes for use with client applications, while some of the solutions are developed fully in-house.
The success of the CANCOM Group therefore depends crucially on its ability to predict well in advance any new trends and devel-opments, such as in cloud computing and data protection. It must constantly adapt and improve existing solutions and services and develop new ones to stay abreast of changes in technologies, regu-lations and clients’ requirements. Every delay in the introduction of improved or new solutions or services as part of the product portfolio, or failure to take account of them, or any lack of accep-tance or delayed acceptance of these solutions or services on the market, can have a serious impact on the competitive position and the business prospects of the CANCOM Group.
There is a risk that CANCOM’s own digital transformation may progress too slowly or even fail. Digital transformation requires digital skills, such as new methods and processes. It also calls for staff to take an active role in the transition and put it into practice, determine the correct course of action and translate it into inno-vations. Disruptive technologies, products or services change the competitive landscape rapidly and with lasting effect. However, they seldom happen overnight or with a big bang, but usually develop over an extended period of time, in the shadow of existing products or services. CANCOM’s success in this area likewise depends crucially on its ability to predict new trends and develop-ments well in advance, keep a careful watch on the environment in which it operates, and encourage the development of innovative new solutions and services and the enhancement of existing ones in all business fields. To this end, CANCOM fosters a creative and open corporate culture, streamlined structures and agile processes.
Technological innovations might not be introduced onto the market in time.
Companies in the IT sector are under great pressure to innovate. The sector is characterized by ever-shorter development cycles, while IT solutions and systems are becoming increasingly complex. The innovativeness of the CANCOM Group and its ability to identify technological trends early and turn them into products and solutions are major factors distinguishing it from the competition. In addition to its in-house developments, the CANCOM Group draws on technological solutions from external providers. If the CANCOM Group does not succeed in identifying technology trends early and introducing technological innovations onto the market at the right time, this could have a serious impact on the competitive position and the business prospects of the CANCOM Group.
To minimize this risk, CANCOM maintains strong relationships with all major manufacturers and many well-known IT experts. This ensures that CANCOM is always informed at an early stage with regard to the latest developments in the market.
We cannot rule out the possibility that one or more of the indi-vidual product and technology risks described above might materi-alize. CANCOM estimates the probability of their occurrence as medium. Depending on the individual case, these risks could have a major adverse impact on CANCOM’s business activities and its assets and earnings position. CANCOM therefore considers these risks to be high. There has not been any change in the classifica-tion since 2016.
CANCOM Group companies are exposed to product liability and warranty risks.
The CANCOM Group purchases its products, especially hardware and software, from manufacturers or dealers, and is dependent on the products being of high quality and meeting the relevant specifications and standards of quality. In the event of any faults coming to light within the warranty period, the CANCOM Group can usually be compensated by its suppliers. Owing to delays between purchasing the merchandise from suppliers and selling it on to clients, however, there may be warranty claims from clients against the CANCOM Group for which the Group itself cannot claim compensation from suppliers, so that it bears the warranty risk.
COMBINED MANAGEMENT REPORT FOR CANCOM SE AND THE CANCOM GROUP

38
The CANCOM Group provides IT solutions as part of complex installation, system integration, software, operational management and outsourcing projects. This may give rise to technical risks due to the complexity of the IT solutions and their level of integration into clients’ processes. These risks could have a serious impact on clients’ business processes.
With the AHP Enterprise Cloud platform developed by CANCOM there is a risk that the client may be unable to use the cloud, or unable to use it properly, in the event of malfunctions, incorrect configurations, or in connection with updates. In CANCOM’s hosting services business, data center outages or errors could result in the restriction or even interruption of clients’ operations. As the CANCOM Group also leases space in some external data centers, a risk of this kind could materialize through no fault of the CANCOM Group. There is a risk of business interruptions, both in the CANCOM Group and at suppliers or clients, as a consequence of environmental or natural disasters or similar events. Manage-ment risks may also arise from failure to identify interruptions in time, from monitoring failures or from violations of service level agreements in which commitments are made to clients that faults will be remedied without delay. As a result CANCOM may find itself exposed to warranty claims and claims for damages, or even loss of contracts.
CANCOM takes extensive precautions to minimize these risks, for instance to safeguard the operation and provision of cloud services. This includes the use of redundant data centers secured against damage caused by natural disaster. The probability of being unable to provide business-critical applications is signifi-cantly reduced, for instance, by a modular process based on the on-demand principle. PIRONET’s data centers also have an information security management system certified to the stringent international ISO 27001 standard, including extensive, tried-and-tested contingency plans. Additionally, CANCOM is seeking to add limitation of liability clauses, as commonly used in the industry, to the contracts relating to the services and project business concerned.
We cannot rule out the possibility that one or more of these risks might materialize. CANCOM estimates the probability of occur-rence as high. Depending on the individual case, these risks could have a major adverse impact on CANCOM’s business activities, and its assets and earnings position. CANCOM therefore considers these risks to be high. There has not been any change in the classi-fication of this risk in comparison with 2016.
Project and business risks
CANCOM Group projects could be delayed or aborted, or for other reasons not be as successful as expected, potentially leading to the full or partial loss of investments made.
The CANCOM Group carries out IT projects in which IT solutions tailored to a client’s specific needs are planned and implemented. IT projects are frequently highly complex and involve a consider-able amount of time and financial resources. This may give rise to both technical risks connected with the execution of the project and contract risks. We cannot rule out the possibility that projects may be delayed, aborted or for other reasons not be as successful as had been hoped.
It is often not possible to arrange for down-payments during such projects. The services provided by the CANCOM Group can there-fore generally only be billed once certain previously agreed project milestones are reached, or at the end of the project as a whole. For this reason the CANCOM Group sometimes has to provide a considerable quantity of work on a project in advance of payment. If a project is delayed or abandoned, this may result in CANCOM partly of fully losing investments it has made, or not being able to bill for work performed. If, for a justified or unjustified reason, a client refuses to accept the results of a project, this can lead to expected payments being delayed or not received at all.
If IT projects are calculated at fixed prices, there is a risk that owing to erroneous assumptions or the occurrence of unforeseen events, the actual cost in time and money may exceed the budget and the client may not accept the price adjusted to the new situa-tion.
In cloud computing, there is also a major risk that various agreed services cannot be provided and that outages of all kinds might result for the client. This could involve substantial costs in time and money, and might entail contract penalties or damage the relationship with the client or even result in the loss of the client.
COMBINED MANAGEMENT REPORT FOR CANCOM SE AND THE CANCOM GROUP

39
Before drawing up quotations for projects, CANCOM generally reviews all requests to establish whether they are technically and financially feasible. Its focus is on ensuring that the client receives the best possible solutions, while taking adequate account of the risks connected with the project. Internal reviews are also carried out to establish potential contract risks. Standard contracts are used where possible. These are controlled by the project manage-ment during the course of the project. Projects are subject to a risk management process which is integrated into CANCOM’s project management system and has coordinated risk and quality management programs to safeguard the implementation process. CANCOM applies various measures and procedures, such as the use of redundant data centers, to ensure that the agreed service can be provided.
We cannot rule out the possibility that one or more of project-re-lated risks described above might materialize. CANCOM estimates the probability of occurrence as high. Depending on the individual case, this risk could have a major adverse impact on CANCOM’s business activities and its assets and earnings position. CANCOM therefore considers the project-related risks to be high. There has not been any change in the classification of this risk in compar-ison with 2016.
There are risks associated with operating as a subcontractor.
CANCOM Group companies are often used as subcontractors on large-scale projects. These companies are subcontracted by a general contractor to perform specific tasks as part of an overall IT project. In these cases, the CANCOM Group is dependent on subcontracts from these general contractors, and there may be deferrals or reductions in the volume of contracts awarded. CANCOM seeks to minimize this risk by constantly expanding client lists and by maintaining strong relationships with its existing clients.
We cannot rule out the possibility that this risk might materi-alize. CANCOM estimates the probability of occurrence as high. Depending on the individual case, this risk could have a major adverse impact on CANCOM’s business activities and its assets and earnings position. CANCOM therefore considers the risk to be high. There has not been any change in the classification of this risk in comparison with 2016. This risk factor is of particular relevance for the IT solutions segment..
There are risks from dependence on large clients.
Thanks to its good market position, CANCOM has extremely broad client lists. However, in principle there is a risk from depen-dence on individual large clients in some sections. A significant reduction in orders from a major client, or the loss of a key account client, could have a severe impact on the business prospects of the CANCOM Group, unless the loss can be offset by the acquisition of a new client of similar size or additional projects from existing clients.
To limit this risk, CANCOM is constantly working to expand and further diversify its client lists. All the activities of large clients are monitored on an ongoing basis – from incoming orders to receiv-ables management.
We cannot rule out the possibility that this risk might materialize. CANCOM estimates the probability of occurrence as medium. Depending on the individual case, this risk could have a major adverse impact on CANCOM’s business activities and its assets and earnings position. CANCOM therefore considers the risk to be high. There has not been any change in the classification of this risk in comparison with 2016.
Financial risks
There are financing, liquidity and counterparty risks.
The CANCOM Group uses both borrowed capital and equity capital to finance its business activities. A downturn in the cash situation of a company can bring with it considerable risks, which could endanger the future of the company as a going concern.
At the reporting date, CANCOM had a liquidity position of € 157.6 million and credit facilities (including guarantees) of € 87.4 million provided by banks. Of this amount, € 82.8 million was easily available as at December 31, 2017. The company regularly monitors the changes in the credit facilities and looks at the extent to which they have been used. In addition to the medium-term financial plan, the Group also prepares a monthly cash flow plan. All companies of the reporting entity are included in the planning system. An adequate credit rating is essential for the procurement of borrowed capital, especially bank loans, and thus for the compa-ny’s long-term existence. Any marked deterioration in the credit rating therefore constitutes a significant risk for the company’s continued existence. Since the equity ratio (calculated according to the method used by banks) is a decisive criterion for the granting of bank loans, it is monitored regularly so that prompt corrective action can be taken if necessary.
COMBINED MANAGEMENT REPORT FOR CANCOM SE AND THE CANCOM GROUP

40
The CANCOM Group has a solid financial standing, a good equity position and a comfortable cash situation. We do not currently see any financing risks or other risks that could jeopardize CANCOM’s continued existence.
There are risks from exchange rate and interest rate fluctuations.
The CANCOM Group’s international business operations generate cash flows in different currencies. However, the majority of trans-actions are conducted in the euro area, which limits the exchange rate risk. Nevertheless, a significant fall in the value of the euro against other currencies could lead to currency losses. Financial derivative instruments are used as a means of safeguarding sound underlying transactions, such as currency hedging. Hedging is used to secure transactions in different currencies on a daily basis. There are in principle underlying transactions that are secured by hedging. Hedge accounting was not applied to economic hedging activities during the fiscal year. The conclusion of hedging transactions is permitted only to specific individuals and within specific orders of magnitude subject to authorization. Transactions exceeding the relevant limits must be authorized by the Chief Financial Officer/Executive Board. Treasury activities to optimize purchasing conditions could have a negative impact and worsen the purchasing conditions if the hedging transaction is unfavorable. Cash pooling within the Group reduces the volume of financing through borrowed capital, and thus optimizes the CANCOM Group’s interest management, with positive effects on the net interest income. The Group derives internal advantages relating to cash investments and borrowing from the cash management system.
It facilitates the internal utilization of the surplus funds of Group companies to finance the cash requirements of other Group companies. Apart from overdraft facilities, CANCOM has only fixed-interest loans or loans subject to a quantifiable interest rate change calculated on the basis of the company’s results.
There are financial market and stock market price risks.
A major objective of CANCOM is to acquire, hold and sell long-term equity investments in companies, as well as to carry out activities connected with raising capital on the capital market. Dealing in derivatives and structured products is not a core business of the company and is only used – if at all – as a means of safeguarding sound underlying transactions, such as currency hedging for trading and service transactions.
Fluctuations in the price of the CANCOM share can have a negative impact on the company’s financial position, especially with regard to raising capital on the capital market. CANCOM therefore sees active financial communication as one of its central management tasks, and attaches great importance to openness and transparency. In addition to maintaining an extensive Internet presence with a comprehensive website, one of the primary objec-tives of CANCOM’s public relations work is to keep in close contact with stockholders, investors, analysts, and business and IT media in the interests of sustaining the stock price. However, external factors, for instance uncertainty in the economy as a whole or in the capital market with resulting fluctuations in prices, cannot be ruled out.
There are default risks.
Default on payment by clients can pose a risk. To counter this risk, CANCOM has a rigorous receivables management system. There are internal guidelines for the issuing of credit limits with regard to both the limits granted and the employees authorized to approve them. Deliveries to clients are generally only made after a credit check has been carried out. There is also a risk of default on long-term loans or financial receivables.
We cannot rule out the possibility that one or more of the individual financial risks described above might materialize. CANCOM estimates the probability of their occurrence as medium. Depending on the individual case, these risks could have a moderately adverse impact on the business activities, the assets and the earnings position. CANCOM therefore considers the financial risks to be medium. There has not been any change in the classification of this risk in comparison with 2016.
COMBINED MANAGEMENT REPORT FOR CANCOM SE AND THE CANCOM GROUP

41
Human resources risks
The success of the CANCOM Group depends on its ability to develop, attract and retain sufficiently well qualified key staff, and to retain expertise within the company.
Larger projects involving services give rise to increased risks connected with the deployment of staff. The loss of big projects can lead to increased staff costs, since often employees cannot be usefully deployed on other projects, or there are delays in read-justing staffing. CANCOM counters the risk of staff turnover and stagnating staff development in the Group by fostering a culture of open communication and access to information, in addition to appropriate measures for employee motivation and develop-ment. The latter are an important cornerstone of corporate and human resources policy, as they are designed specifically to build employee loyalty and increase technical competence and expertise in the enterprise.
The loss of key staff in the company, on whose knowledge and familiarity with clients CANCOM’s success depends, at least in the short term, constitutes a further risk. The CANCOM Group’s devel-opment staff members are among those with expert knowledge. If these staff members leave the company and possibly switch to competitors, there is the danger that the CANCOM Group would lose not only their expertise, but the rights to software developed in-house.
Continual monitoring of the productivity of individual employees makes it possible to identify at all times the key employees and devote particular attention to them. CANCOM also applies various measures for long-term staff retention. In addition, there are appropriate rules on deputizing, particularly in sensitive and knowledge-intensive areas, to compensate as well as possible for the unexpected absence of an employee, at least in the short term. Nevertheless, there is a risk that the shortage of specialist staff could make future recruitment difficult, or that the staff might not possess the skills necessary for CANCOM’s own digital transfor-mation.
One of the ways in which CANCOM counters this is by appro-priate measures to boost its image as an employer and by offering various training measures and further education for employees. CANCOM also offers its staff a high degree of flexibility by enabling them to work flexibly, with easy and secure access to company data and applications at any time, anywhere and on any device or terminal (Digital Workplace). This cultivates the compa-ny’s image as an attractive employer for the digital generation. For this reason, the management feels that despite the human resources risks described, with CANCOM’s current strong market position and the measures in place, it is in a position to continue recruiting and retaining well-qualified specialist staff with the potential to boost CANCOM’s business success.
Since CANCOM is a service provider, the employees are major company assets. However, they are also the largest cost item. If the transaction volume declined, there would be a time lag before the company could respond by adjusting its human resources structures to the reduced demand. Moreover CANCOM, and therefore also the enterprise’s core staff, is constantly shifting its focus towards the provision of high-value services and the creation of greater value added for its clients. If existing or newly acquired clients cannot be convinced of the added value of these services, there is a risk that they may be less willing to pay for these services than expected by CANCOM.
We cannot rule out the possibility that one or more of these risks might materialize. CANCOM estimates the probability of their occurrence as medium. Depending on the individual case, these risks could have a major adverse impact on CANCOM’s business activities and its assets and earnings position. CANCOM therefore considers these risks to be high. There has not been any change in the classification of this risk in comparison with 2016.
Risks exist due to legal changes in connection with the German Temporary Employment Act (Arbeitnehmerüberlassungsgesetz, AÜG), and in relation to the conclusion of works contracts for service provision
The CANCOM Group has a license for hiring out employees and uses it to hire out some of its staff members to work on IT projects for clients where necessary. If there were major changes to the framework regulatory conditions as they exist now, especially the laws on temporary work, this could have a negative impact on the assets, financial and earnings position of the CANCOM Group.
COMBINED MANAGEMENT REPORT FOR CANCOM SE AND THE CANCOM GROUP

42
In addition, risks may arise in connection with the use of works and service contracts for clients and sub-contractors, if the services to be provided are geared to the needs of the particular client and are listed in a service specification. In the event of a dispute before a labor court, the court could take the view that the person providing the service should be classified as an employee and is integrated into the client’s operations. If the contract is classified as a (temporary) employment contract, there is a danger that, besides the requirement to make back-payments of differences in remuneration and social security contributions, fines may be imposed on the company.
We cannot rule out the possibility that one or more of the risks might materialize. CANCOM currently estimates the probability of its occurrence as low. Depending on the individual case, this risk could have a moderately adverse impact on CANCOM’s business activities and its assets and earnings position. CANCOM therefore considers this risk to be low. There has not been any change in the classification of this risk in comparison with 2016.
Information risks
The CANCOM Group may not be able to protect its develop-ments and its expertise or to maintain their secrecy.
In our view, the expertise built up by the CANCOM Group in the course of its business activities, especially from developing inno-vative solutions, represents a decisive competitive advantage. The competitiveness of the CANCOM Group depends particularly on the safeguarding of its technological innovations and the expertise connected with them. If this expertise should be partly or fully revealed to third parties, this could result in the erosion of the competitive edge CANCOM has gained, resulting in a reduction in sales and income opportunities.
CANCOM has taken various organizational precautions to protect confidential information. These range from putting in place tech-nical security measures covering internal and external communi-cation, to making employees aware of the subject through internal training.
We cannot rule out the possibility that the risk might materialize. CANCOM estimates the probability of its occurrence as medium. Depending on the individual case, this risk could have a moder-ately adverse impact on CANCOM’s business activities and its assets and earnings position. CANCOM therefore considers this risk to be moderate. There has been no change in the assessment of this risk in comparison with 2016. This risk factor primarily concerns the cloud solutions segment.
Operational risks
The CANCOM Group is dependent on its suppliers.
CANCOM relies on its manufacturers and/or distributors for the supply of hardware and software. Unexpected supply bottlenecks or price rises – as a result of shortages on the market or lower supplier bonuses, for example – can be detrimental to sales and profits, since our merchandise inventories at the logistics centers are of a short-term nature for reasons relating to optimization. CANCOM tries to reduce these risks by keeping in close contact with major manufacturers and distributors, and by signing long-term supply contracts. In particular, our broad base of manufacturers and distributors enables us to resort to alternative manufacturers or sources at relatively short notice.
There are warehousing risks.
The quantity of merchandise kept in stock by the CANCOM Group is based on sales forecasts as well as expectations of the quantities needed for promotions and to fill make-and-hold orders. The risk of break-in, theft and loss is relatively high, especially in relation to computer and PC merchandise, and small electronic products. There is therefore a risk of uninsured damage or loss occurring. Owing to sometimes sudden, sharp fluctuations in the prices of products, there is also a risk that it may only be possible to sell merchandise at a lower price than usual, if at all, or that the quan-tities requested for release under make-and-hold orders may not be as large as agreed. This would result in inventories having to be written-down, with a possible negative impact on the financial, assets and earnings position of the CANCOM Group.
To reduce the warehousing risk, CANCOM is constantly working to optimize its procurement process. By maintaining close links with manufacturers and distributors, CANCOM always endeavors to keep inventories and warehousing costs as low as possible while at the same time avoiding short-term shortages.
COMBINED MANAGEMENT REPORT FOR CANCOM SE AND THE CANCOM GROUP
43
We cannot rule out the possibility that one or more of the individual operating risks mentioned above might materialize. CANCOM estimates the probability of their occurrence as low. Depending on the individual case, this risk could have a moder-ately adverse impact on CANCOM’s assets and earnings position. CANCOM therefore considers these risks to be low. There has not been any change in the classification since 2016.
Internal risks
The CANCOM Group’s value chain covers all steps in its activities, from marketing, consulting, distribution and logistics to training and maintenance. Disruptions within or between these areas could lead to problems, and possibly bring work processes in one or more areas to a temporary standstill.
In addition, there is the risk of problems with quality, particularly in the areas of the IT solutions segment and the cloud solutions segment where consulting is a major element of the service offered. The company’s rapid growth also entails the risk that our administrative structures, as well as our organizational structures and operational processes, cannot be adapted at the same rate as the company grows, and that the control of the Group as a whole will suffer as a result. Additionally, tax audits can lead to diverging legal viewpoints on data of tax relevance, possibly resulting in demands for back-pay-ments of taxes and levies.
We cannot rule out the possibility that one or more of these risks might materialize. CANCOM estimates the probability of their occurrence as medium. Depending on the individual case, this risk could have a moderately adverse impact on CANCOM’s business activities and its assets and earnings position. CANCOM therefore considers this risk to be moderate. There has not been any change in the classification of this risk in comparison with 2016.
Risks connected with the introduction of the enterprise resource planning system (ERP) of SAP
CANCOM is planning to implement the SAP ERP system throughout the Group. The introduction of SAP could be delayed if some or all of the various tasks connected with the project are not fulfilled, or if deadlines are not met.
This could have a prolonged and sometimes severe impact on the business activities and the competitiveness of the CANCOM Group. A delay in the implementation could cause additional expense for CANCOM, for instance for external consulting.
However, a delayed introduction is not the only risk for the Group. If the introduction of the ERP system is unsuccessful or there are errors in its implementation, culminating in a complete failure of the system, this could impair, for instance, the availability of the online store or customer connections and the entire e-commerce process chain. Also, it might not or only to a limited extent be possible to carry out determinate operational activities. This could have an adverse impact on some aspects of the handling of clients’ projects and orders, such as deliveries and billing. Technology downtimes could also seriously impair CANCOM’s ability to carry out internal processes such as the recording of time worked, billing or accounting transactions, with serious consequences.
To minimize this risk, CANCOM uses various measures such as experienced staff, project managers for the successful implementa-tion of internal projects, as well as tried, tested and trusted admin-istration and controlling systems to ensure the highest possible level of risk control. A specific person appointed to head each project, and project goals and sub-goals are clearly defined in the form of milestones. The person in charge of the project supervises the individual steps and drives the swift implementation of the SAP system.
A training concept is drawn up and there is a test phase for the purpose of reducing any additional risks. Whatever measures are taken, it must be noted that a switch of the ERP system represents an important step for any company, and its effects on the company cannot be evaluated conclusively. All those responsible are made fully aware of the implications and the potential risk of intro-ducing a new system. Despite all preparatory measures, disrup-tions in operation could follow the switch. CANCOM will handle any such events in the best possible way.
We cannot rule out the possibility that one or more of these risks might materialize. CANCOM estimates the probability of their occurrence as high. Depending on the individual case, these risks could have a major adverse impact on CANCOM’s business activities and its assets and earnings position. CANCOM therefore considers this risk to be high. Owing to the complexity and the scale of the switch to SAP, the possibility of an increase in expen-diture with a consequent impact on Group profitability cannot be ruled out.
COMBINED MANAGEMENT REPORT FOR CANCOM SE AND THE CANCOM GROUP

44
The business activities of the CANCOM Group could be affected by operational malfunctions, including IT system failures, which could be detrimental to its information technology.
The success and functioning capacity of a company depends to a considerable degree on its IT equipment. There are fundamental information technology risks from operating computer-assisted databases as well as from the use of systems for merchandise management, e-commerce, controlling and financial accounting. This also applies to the CANCOM Group and its internal IT systems. The temperamental nature of these IT systems means they are susceptible to failure which – whether partial or complete – could bring working processes to a standstill in extreme circumstances. This or a delay in restoring the systems to normal operation could jeopardize the company’s continued existence. A malfunction of the IT systems that ensure the proper processing of orders could present a risk with regard to the availability of products, for example.
In particular, there has recently been a significant increase in cyber attacks. It cannot be guaranteed that the security measures taken will provide sufficient protection. There is therefore a risk that the CANCOM Group may also become a victim of a cyber attack of whatever kind. This could cause damage to, or a complete failure of, internal IT systems. The monitoring of clients’ systems could become ineffective as a result of management tools not functioning property, in turn resulting in disruptions for clients, or possibly the total failure of their systems.
The CANCOM Group offers its clients data center services, both in its own data centers and in rented data centers. There is a possi-bility that it might no longer be able to provide the data center services or any connected services. Additionally, the possibility that a cyber attack might lead to client information and sensi-tive, protected data becoming available to the public cannot be ruled out. In the event of a failure of one of the data centers, the stand-by systems in the second data center could ensure that oper-ations can be continued. However, if both data centers fail simulta-neously, this would cause not only considerable financial loss, but also serious damage to the reputation of the CANCOM Group.
CANCOM is aware of this risk. The company therefore makes every effort to minimize it in order to ensure the availability of IT systems and data centers as well as possible. For instance, the data centers are equipped with advanced data center technology. Additionally, failure scenarios are simulated as a precautionary measure, and protective mechanisms are checked and tested to ensure that they are functioning. However, disruptions or a complete failure of IT systems and data centers could have a nega-tive impact on the course of business and on supplier and client relationships.
We cannot rule out the possibility that one or more of these risks might materialize. CANCOM estimates the probability of their occurrence as medium. Depending on the individual case, these risks could have a major adverse impact on CANCOM’s business activities and its assets and earnings position. CANCOM therefore considers these risks as high risks. There has not been any change in the classification of this risk in comparison with 2016.
Legal risks
There is a risk that CANCOM (allegedly) violates the property rights of third parties.
The CANCOM Group is not aware of violating any third party’s industrial property rights in connection with the products, solu-tions and services it offers. However, we cannot rule out the possi-bility that the CANCOM Group may violate the property rights of third parties in the course of its business activities, or that third parties may make claims against the Group for violation of prop-erty rights, or that action may be brought against the CANCOM Group as part of a legal dispute. This may result in the Group having to pay licensing fees. There is also a possibility that inven-tions of the CANCOM Group cannot be used commercially, or that their commercial use is delayed. Successful claims for breaches of patent could result in the CANCOM Group being obliged to pay substantial compensation. Legal disputes of this kind can also involve considerable costs in time, staff and money. At the time this management report was written, there were no contingent liabilities resulting from major legal disputes or relevant litigation risks. Even a claim by a third party that the CANCOM Group is violating industrial property rights could lead to economic loss, owing to the crucial role of industrial property rights in the sector in which the CANCOM Group operates.
We cannot rule out the possibility that this risk might materialize. CANCOM estimates the probability of its occurrence as medium. Depending on the individual case, this risk could have a moderate adverse impact on CANCOM’s business activities and its assets and earnings position. CANCOM therefore considers this risk to be moderate. There has not been any change in the classification of this risk since 2016.
COMBINED MANAGEMENT REPORT FOR CANCOM SE AND THE CANCOM GROUP

45
There are risks connected with the violation of national or inter-national data protection regulations.
The use of data – especially data relating to clients, suppliers or staff – by the CANCOM Group is subject to the German Federal Data Protection Act (Bundesdatenschutzgesetz, BDSG) and similar regulations, including international provisions. If unauthorized third parties obtain access to data processed by the CANCOM Group or stored by it in the context of the provision of storage solutions, or if the CANCOM Group itself violates data protection regulations, there could be resulting claims for compensation and damage to the reputation of the Group.
We cannot rule out the possibility that this risk might materialize. CANCOM estimates the probability of its occurrence as medium. Depending on the individual case, these risks could have a major adverse impact on CANCOM’s business activities and its assets and earnings position. CANCOM therefore considers this risk to be high. There has not been any change in the classification of this risk since 2016.
Merger and acquisition (M&A) risks
There is a risk of misjudgments with regard to both acquisitions already made and potential acquisitions of companies in the future, as well as the integration of these companies into the CANCOM Group.
Both in its long-term equity investments and in its acquisition of companies or parts of companies, CANCOM occasionally ventures into business fields that are new to it. The acquisition of compa-nies and long-term equity investments presents a considerable risk. We cannot rule out the risk that these acquisitions and busi-ness fields might not perform as well as anticipated, or that risks might materialize that were not identified or that were wrongly assessed in the due diligence process. Additionally, key employees from the acquired companies could leave the relevant company as a result of the acquisition by the CANCOM Group. Consequently, owing to the loss of these key employees, it may not be possible to meet the targets expected to be met by the acquisition. There is also a risk that clients of the acquired company might not place any orders or enter into any related contracts with the CANCOM Group and might switch to competitors. In addition, the organiza-tional integration of further companies into the CANCOM Group can involve considerable expenditure in terms of both time and money. There is also a possibility that there may be difficulties in implementing the strategy on which the acquisition was based, and that the targets and anticipated synergy effects cannot be realized to the extent planned. If one or more of these risks mate-rialize, this could result in the partial or entire loss of any money invested and, in certain circumstances, the necessity that assets must be written down in the balance sheet due to impairment.
From its experience of previous acquisitions and the expertise it has built up in the integration of companies into the Group, CANCOM can actively manage the potential risks associated with M&A processes. Its thorough knowledge of the market situation, built up over many years, is a great advantage in this respect. Also, the integration process is implemented by experienced inte-gration managers, and there are checklists and documentation that allow the processes and risks to be properly recorded. We attempt to reduce the risk arising from acquisitions in new business fields by focusing on our core business.
The acquisition or disposal of companies or stakes in businesses could expose the CANCOM Group to various risks.
In the past few years, the CANCOM Group has acquired and disposed of some companies and stakes in companies. In M&A processes there is a risk connected with contract negotiations and contractual arrangements. There is also the risk that it could emerge later that certain guarantees and/or warranties and/or obli-gations entered into by the seller/buyer have not been met. If this only occurs after they have lapsed, and/or the seller/buyer cannot settle any claims for compensation that may arise, there could be resulting financial losses for the relevant CANCOM Group company. Any determination of purchase prices based on current or future profits could also prove unfavorable for CANCOM.
We cannot rule out the possibility that one or more of the indi-vidual M&A risks described above might materialize. CANCOM estimates the probability of their occurrence as high. Depending on the individual case, these risks could have a major adverse impact on CANCOM’s business activities and its assets and earn-ings position. CANCOM therefore considers this risk to be high. There has not been any change in the classification of this risk since 2016.
Review of overall risk
Overall, there was no major change in the evaluation of the individual risks described in comparison with 2016. Against the background of the overall risk situation, from the current perspec-tive, CANCOM SE’s management does not consider the company’s future as a going concern to be in any danger.
In view of CANCOM’s position in the market, its committed staff, the flexible Group structure and its structured processes for early identification of risks, the Executive Board of CANCOM is confident that in 2018 we can continue to successfully meet the challenges arising from the risks described.
COMBINED MANAGEMENT REPORT FOR CANCOM SE AND THE CANCOM GROUP

46
In addition to CANCOM’s own bullish self-assessment, external assessments of its future performance are also positive. The LBBW rating improved by one level to 1 (A-) during the fiscal year 2017. UniCredit considers CANCOM to be ‘sound investment grade’ and gives it a rating of M9, equivalent to a rating of BBB.
Opportunities of future development
CANCOM’s international business activities in various fields of the IT sector and in IT-related areas offer many opportunities. To identify them, the Group examines the market and competitive environment closely on a regular basis, naturally focusing on the latest trends in the sector, in technology, and in the economy as a whole.
Below is an overview of opportunities and potential future devel-opments and events that could have a positive impact on the sales revenue and profit trend of the CANCOM Group.
General market trends
The transformation to a digital future is well underway. There are four common threads in all forecasts that will dominate company agendas in the coming years: speed, customer proximity, innova-tion and agility. The focus is therefore no longer on optimization and cost reduction. According to IT analysts, budgets could also shift increasingly towards areas such as big data and analytics, the Internet of Things and customer experience over the next few years.
There is increasing pressure to take action. Companies have to focus attention on technological changes in order to continue fulfilling the requirements of their clients and business partners, thus ensuring their future competitiveness. In the enterprise itself, the focus is on employees’ changed needs with regard to their working environment and the internal organizational structures, processes and services. Information technology is spurring the industrialization of services in all sectors. In many branches, it is the most important driver of innovation. Given the great strategic importance of IT, it can be assumed that enterprises could imple-ment planned digitalization projects even if the economic situation were to deteriorate.
At the same time, with the enormous increase in the use of smartphones, tablets and mobile applications, people’s work and personal lives have become more mobile. These developments have led to an increase in data volumes and user traffic, and have influenced IT to such an extent that IT organizations have to undergo a fundamental process of change. Traditional IT infra-structure now struggles to cope with the demand for the retention and particularly the use of increasing amounts of data, and also the challenges in terms of efficiency and scalability. Indeed, new technologies and platforms being implemented in established enterprises have to be integrated into existing IT landscapes, struc-tures and processes that are shaped by tradition. Experts are of the opinion that, in the next few years, enterprises will increasingly be looking for service support for their digital transformation.
What is referred to as ‘the third platform’ – based on cloud, mobile, big data/analytics, and social media technologies – is now gaining momentum through other catalysts for innovation, such as the Internet of Things and augmented and virtual reality (AR and VR). It has already entered its second phase, with its devel-opment beginning to accelerate again. An exponential increase in innovativeness is being fueled by platforms, open innovation ecosystems, massive data sharing and modernization, hyperagile deployment technologies for applications, and the growing number of people working on developing digital solutions. The development is also being driven by the improved confidence in the digital environment brought about by blockchain technology, the growing number of artificial intelligence (AI) services and solutions, the increasing complexity of human-machine interfaces, and the more diverse range of cloud services.
Trends
The subject of the digital transformation of German businesses and the associated technologies will continue to dominate the IT market in 2018. The success of companies’ digital transformation will depend on agile, flexible and scalable IT infrastructure.
COMBINED MANAGEMENT REPORT FOR CANCOM SE AND THE CANCOM GROUP

47
Software-Defined Data Center: IT as a Service (ITaaS)
Software-defined data centers, also known as virtual data centers, consist of fully virtualized IT infrastructure, which can be decou-pled from specific physical hardware and managed automatically by software in a simple way.
This IT infrastructure, consisting of servers, storage and networking equipment, can also be put together as desired (composable infrastructure). The abstraction of the different infra-structure components allows flexible resource pools to be allocated to workloads easily and automatically as required. This makes IT systems highly flexible and scalable, and considerably simplifies all processes. With this approach, it is possible to achieve a level of flexibility and speed in the local data center that is otherwise only possible with cloud computing (cloud-like speed). Software-defined data centers are a prerequisite for the provision of IT as a service (ITaaS) and on a pay-per-use basis. CANCOM has many years of experience and expertise in data centers, in relation to both IT infrastructure and IT services. This growth area could therefore present promising business opportunities for CANCOM.
Hybrid and multi-cloud environments: adoption/operation via managed services
Cloud computing will continue to be one of the strategic elements in companies’ digital transformation, and the technological basis for new high-tech trends. Even though the attitude of German companies towards cloud computing and its use has recently become significantly more positive, companies still plan to increase further their use of cloud solutions. A survey by the German digital association BITKOM in partnership with KPMG found that around two-thirds of companies use at least one such application. IT research and consulting company Crisp Research has also found that around 80 percent of small and medium sized German enterprises are working on this subject. The functional benefits and cost advantages of cloud services are so great that presumably both corporations and small and medium sized enter-prises will quickly set aside their reservations about them. There is a growing demand for flexible cloud solutions in this area that allow companies to respond by making adjustments where neces-sary. Cloud introduction will also be driven by the need for IT mobility, in other words mobile access to a company’s internal IT resources, and the hot topics of the future - the Internet of Things (IoT) and big data and analytics.
Single-cloud architecture will be the exception in the companies of the future. International Data Corporation (IDC) forecasts that expenditure on cloud services and infrastructure will exceed US$ 530 billion by 2021. More than 90 percent of enterprises worldwide
will use multiple cloud services and platforms. Crisp Research also expects the majority of small and medium sized German enterprises to implement hybrid and multi-cloud architectures. In a hybrid cloud model, data and applications are provided by internal and external clouds (private and public clouds) as well as by on-premise services. They may be availed of by several providers, thus becoming increasingly complex. A high degree of integration expertise and experience is needed to create an efficient system out of the two environments. This presents oppor-tunities for providers such as CANCOM in areas ranging from strategic planning, architecture and design, to the implementation and subsequent operation of the systems.
The use of services from a public cloud continues to increase rapidly. The way to the public cloud in enterprises is usually through hybrid or multi-cloud scenarios. This should benefit both private and hosted private cloud environments and the providers of these services, such as CANCOM.
Based on the potential for enterprises to have billions of clients around the world, digital applications are increasingly pushing into the traditional IT landscape and are growing at an acceler-ating rate.
Access to innovations driven by the public cloud is created by managed service providers for public clouds, with the automated and intelligent orchestration of heterogeneous systems becoming a success factor. With its cloud services and hosting portfolio and its managed public cloud services, CANCOM could benefit from this.
With increasing complexity – and pressure to reduce costs and increase performance – agile, flexible IT supply models are popular. However, the wealth of opportunities and cloud services is overwhelming the user and driving the development of ‘shadow’ IT solutions. These are good reasons for enterprises to use a managed service provider such as CANCOM, which, with its certified staff, helps clients with onboarding and operation. But cloud-based solutions alone are not enough to make IT operations more agile and to meet business requirements more fully. Enter-prises need a strategy for an IT as a Service (ITaaS) model that goes beyond the technical aspects. IT as a Service is a conceptual approach involving the provision of customized IT services. These can be supplied by company data centers or by service providers; they can be purchased from a cloud service provider or elsewhere.
CANCOM responds proactively to the developments of the market and is planning to expand its offer of hybrid and multi-cloud environments. The demand for flexible, agile cloud solutions in all areas of companies could have a positive impact on CANCOM’s solutions and services business overall. With CANCOM’s knowl-edge of the complex connections that exist between IT structures,
COMBINED MANAGEMENT REPORT FOR CANCOM SE AND THE CANCOM GROUP
48
which in many companies have evolved over time, along with its many years of project experience, the wide range of IT solutions it provides in its own competence centers, and its extensive cloud solution portfolio, CANCOM is well placed to offer support for both the transition to and the operation of state-of-the-art IT environments.
Research company ISG (formerly Experton Group) has on several occasions awarded CANCOM the title of Cloud Leader in many categories, clearly demonstrating that CANCOM is in a good position to provide complete, integrated solutions to meet the wide-ranging needs of small, medium and large enterprises setting up cloud structures.
Companies are focusing more attention on the use of mobile devices and terminals and the impacts on business processes. Without efficient integration into company IT systems, mobile devices such as smartphones and tablets, running on different operating systems and using diverse mobile applications, represent a cost driver without any real added value, and may even present a security risk. On the one hand, mobile access to company data increases flexibility and mobility as well as the productivity of staff and processes and thus of the company as a whole. On the other hand it also increases the demands on company IT depart-ments in terms of implementation, management and security.
Digital workplace
Another IT concept of central importance for enterprises, in addi-tion to cloud computing, mobility, big data and analytics, is that of the digital workplace. Digital transformation is changing realities of work. Work-life balance and the option of working in flat, interdisciplinary hierarchies are becoming increasingly important. Conventional office workplaces, on the other hand, are becoming less significant, as digital workplaces also include warehouses and forklift trucks. Modern enterprises also enable their staff to adopt flexible working models such as working from home.In addition, modern working styles, as exemplified by many creative agencies, startups and even major corporations as Google – with quiet areas, flexible individual workplaces, casual meeting areas for informal discussions and dedicated rooms for more formal meetings, along with IT-based communications solutions for phone/video conferences, informal discussions and collabora-tion solutions – mean that these facilities have to be incorporated into the overall digital workplace concept.
It is therefore becoming increasingly important for staff to have access to company data and applications at any time, anywhere and on any terminal or device. The reason for this is that the success of a company is increasingly dependent on its staff being able to access data and documents quickly and flexibly from their laptops, smartphones or tablets when they are on the move or based at different locations. Users and the user experience have to become the focus of greater attention. With the increasing demands being placed on enterprises in terms of individual digital workplaces, there is greater potential for companies to increase productivity, reduce costs, contain the use of ‘shadow’ IT and enhance their attractiveness as employers by means of a trendset-ting workplace strategy. According to a study by IDC, workplace modernization will be one of the most important demands on IT in the next two years. The study also reveals that in relation to IT workplaces, companies have delayed investment over the past few years due to other pressing issues, and are now stepping up their investment plans.
In its independent ISG Provider Lens Germany 2017 study (Digital Workspace Service Provider Benchmark), the research company examined the capabilities of the providers of digital workspace services currently active in Germany. CANCOM was awarded the title of Digital Workspace Leader in almost all assessed categories. The central element is the CANCOM AHP Enterprise Cloud, which provides a state-of-the-art, mobile and flexible IT workplace environment from the cloud. The CANCOM AHP Enterprise Cloud is a turnkey enterprise workplace architecture for all workplace scenarios. Further standard mobility, security and governance architectures developed in-house complete the integrated portfolio of the CANCOM Group, thus supporting our clients’ individual digital workspace strategies. This could present business develop-ment opportunities for CANCOM.
Big data / analytics: Artificial intelligence and automation
We are already able to receive information other than in text form, or audio and video format. Sensor and context-based data will become increasingly important in the future, resulting in an extensive supply of data and information from every direction and making the data environment ever more complex. For instance, big data can provide new social, economic and scientific knowl-edge, thus contributing to an improvement in living conditions in an increasingly complex world. Personalized cancer treatments based on swift systematic analysis of various medical data, and the use of superior, automated analytical methods to fight crime are just two examples.
COMBINED MANAGEMENT REPORT FOR CANCOM SE AND THE CANCOM GROUP

49
Companies should be developing suitable strategies and technolo-gies to enable them both to compile and process information from a whole variety of extensive data pools and complex data flows, and to gain valuable insights and ultimately a return for compa-nies and clients from the data.
Rapid analysis of large quantities of structured and unstructured data from different sources is giving rise to new data-based busi-ness models and strategies.
Business and IT drivers, particularly digitization and the Internet of Things, are advancing the use of big data and analytics, as all IoT and digitization projects are based on data, or data analysis. This mainly involves identifying recurring patterns from an anal-ysis of large quantities of data in order to be able to make predic-tions and even generate (automated) instructions (smart services). This enables the monitoring of, for example, machines, plant and production processes in order to proactively prevent production downtime.
If, as is often said, data is the raw material – the ‘oil’ of digital transformation –, then analytical methods are the ‘refinery’, artificial intelligence is the ‘gas’ or the ‘electricity’ for the e-opera-tions, and smart services are the ‘automobile’. A highly developed ecosystem is therefore developing around big data and analytics, consisting of providers of cloud platforms, analytics applications and algorithms, i.e. providers of basic technologies. However, in order for end-user enterprises to be able to push-start new customer services, product developments and business models with the aid of big data and analytics, they need IT partners that can offer a combination of technology, industry and process exper-tise in addition to a strong innovative capacity. With its many years of expertise in IT infrastructure and its IoT and analytics portfolio, CANCOM has a lot to offer its clients in this area.
By 2019, forty percent of all digital transformation initiatives will use one form or another of artificial intelligence, according to IDC research. By 2021, AI will be used in 75 percent of commer-cial corporate applications. Artificial intelligence will therefore definitely be one of the drivers of growth. The German digital association BITKOM anticipates that many products and services will have artificial intelligence, or be shaped by it, within a few years. Application scenarios for self-learning systems, artificial intelligence, augmented and virtual reality (AR and VR) and automation can be found in almost all sectors and all IoT-related applications. Industrial enterprises are experimenting with the use of augmented reality glasses in manufacturing and maintenance; driver-assist systems complement the connected car; and in the health sector physicians are assisted by data-based diagnostic solutions.
The increasing intelligence of our machines is demonstrated by the relentless trend toward robotic automation which, in the transition phase, is producing intelligent assistants in many areas. However, machines, digital assistants or ‘bots’ (i.e. highly auto-mated computer programs) cannot display anything approaching human empathy or sensitivity. On the other hand, in mass and serial production, with very repetitive and highly automated processes, AI systems could help deal with cost pressure, reduce error rates and revolutionize the working world. Artificial intelli-gence is also already being used in many areas of our daily lives, for example digital voice assistants such as Siri and Cortana.
Internet of Things and Industry 4.0
For some time now, the mobile Web has been about more than just smartphones and tablets. Wearables, connected cars, smart-home and other IoT devices: the number of devices through which we access information or communicate with each other is increas-ingly steadily, just as networking, cooperation and communication between the various devices is becoming more common. Eventu-ally, IoT solutions are bringing providers closer to their clients. By connecting several products they can provide valuable insights into consumer behavior.
The Internet of Things plays an important role in the practical implementation of digitization. An essential feature of the IoT is its pronounced sector variation or, more precisely, application-re-lated variation: often, issues such as Industry 4.0, connected cars, smart energy and smart health go beyond the limits of individual sectors of industry. Industry 4.0 means far more than new, effi-cient production methods. It is changing people’s everyday lives massively. The Internet of Things is shaking up the ecosystems and competitive situation in almost all sectors, although it is not yet obvious where the innovations are leading.
There are examples from companies where, in a fully networked manufacturing plant, people are now no longer controlling the machines but the product that is to be made. Chips and digital helpers built into the raw materials ensure that only the predefined components are used. If a staff member makes a mistake, the system stops immediately. This is all possible only with a continuous flow of data, and realtime analysis of that data. Big data and analytics have for a long time been central to the controlling of such complex systems. Traditional industrial Groups such as Bosch and Siemens are developing their own future solutions and platforms, so that they do not lose contact with their clients. Whereas during the past few years much has been said and written about the infrastructure and application sides of cloud computing –Infrastructure as a Service (IaaS) and Software as a
COMBINED MANAGEMENT REPORT FOR CANCOM SE AND THE CANCOM GROUP

50
Service (SaaS) – user companies are now becoming much more interested in the platform concept. Platform as a Service (PaaS) is becoming a central part of the realization of innovation projects in enterprises. PaaS offers them access to standardized infrastructure services and development platforms, combined with the option of individual enhancements that enable them to stand out from the competition in the rapidly developing market for digital business models, smart services and services related to the Internet of Things. It is conceivable that platforms will be offered which will allow collaborations between different companies within a sector, for instance to gain better insights into the sector or improve capacities – like a kind of meeting place for the industry.
With its business solutions customizable to individual sectors, CANCOM could also profit from this.
IT security
Since we depend on our IT systems functioning reliably and securely, the subject of IT security is becoming more and more important globally. There is evidence that the number of cyber attacks on company networks is increasing, though many even remain unnoticed. The age of mobile working, the cloud and the Internet of Things calls for a controlled IT security strategy with global reach. The objective must be to detect cyber attacks as early as possible.
Big data offers many opportunities, but at the same time involves great risks, because large quantities of data are generated in applications such as industry 4.0 and the Internet of Things, and in the processing or analysis of sensor data – for instance in the area of smart energy, smart health or modern traffic management. This data could be a worthwhile target for attackers. An IoT attack could have dire consequences, for example, if attackers succeeded in seizing control of networked cars, machinery or perhaps even power stations. The subject of IoT security will be a focus of much attention in enterprises, not only in 2018, but also in the coming years. There is a high level of pent-up demand in the area of IT security.
This is evident from the level of investments in IT security, which is growing globally, according to the German business newspaper Handelsblatt. Analyst firm techconsult also expects increasing investments in security products, due to a growing awareness of the impacts of security gaps, the steady rise in the number of devastating cyber attacks, and the European Union General Data Protection Regulation (GDPR), which comes into force in May 2018. techconsult believes expenditure on IT security products and services by German enterprises will amount to around € 5.9 billion in 2018.
The progressive globalization and digitization of the economy and society means that larger and larger quantities of data must be reliably managed and protected. This must be therefore accompa-nied at all levels by simultaneously evolved IT security measures. Some of the IT security services will therefore have to come from the cloud.
For many enterprises, the fundamental question is how secure their data can be if they outsource their corporate IT systems. Cloud computing can only work if the customer has confidence in the cloud provider and its information security processes and measures. However, absolute security is not attainable, either within the company’s own IT systems or in the cloud. But the security mechanisms used by cloud providers are often more highly standardized, the processes better integrated and the autho-rization concepts for the data more consistently implemented. Additionally, cloud service providers regularly undergo security audits for various certifications. CANCOM has Group-wide DIN ISO 27001 Information Security Certification. For clients, this means operational excellence in all process sequences, and compli-ance with high technical and security-related standards.
Location remains the main criterion for selecting a cloud provider. Companies are often more disposed to trust cloud providers with data centers and headquarters in Germany than providers or data center locations in other countries. This means that a cloud provider such as CANCOM, with headquarters in Germany, data centers and servers operated in Germany, and subject to German data protection laws, may have a competitive advantage over inter-national competitors.
Security is the basis for all current and future digital business models. This presents business opportunities for the CANCOM Group, with its broad portfolio of IT security solutions ranging from advice to planning and from implementation to managed security services. CANCOM also offers professional solutions for centralization, consolidation and virtualization to satisfy the increasing requirements for integrated system landscapes, as well as safeguarding the business continuity of its clients and increasing their IT efficiency. CANCOM has developed security architecture for cloud transformation and digital workspaces to meet the needs of (high-end) medium sized enterprises, as well as enterprise clients. ISG awarded CANCOM the title of Security Leader Germany 2017 for its work in this area.
COMBINED MANAGEMENT REPORT FOR CANCOM SE AND THE CANCOM GROUP
51
Blockchain technology
Many experts believe blockchain technologies will be a big trend in 2018. The more transactions take place online, the more secure the technologies used by companies will need to be, in order to protect their clients’ data. Users need more security, especially in view of the growth potential of the Internet of Things.
Blockchain in business will therefore be the next big trend in the coming year, according to a study by the telecommunications provider NTT Group. Experts believe blockchain has the potential to fully restructure cybersecurity. IDC also expects that by 2021 at least 25 percent of Forbes Global 2000 companies will be using blockchain services as a foundation for their strategies to improve consumer confidence in the digital environment.
Overall view of trends
Efficient means of handling information and data, along with greater business agility and concentration on core competencies, will be more crucial than ever to the innovative capability and competitiveness of enterprises in the future. New concepts will be required for organizing work processes, as well as for data security and the shaping of the working environment. Enterprises will need service providers that can preferably offer adequate IT components under one roof and complement these with managed information services and scalable cloud solutions. Both segments of the CANCOM Group, and the Group as a whole, could benefit from this trend due to the multitude of specific tasks involved in designing and modernizing IT in companies.
Organization and staff
CANCOM offers more than two decades of experience in IT consulting and integration combined with innovative services. It provides independent advice, and creates economical and techni-cally optimized systems infrastructures. Nowadays, enterprises have to constantly question their approach, essentially adopting a trial and error mentality and developing their responsiveness in the same way as a startup company. Otherwise they run the risk of losing more and more of their regular clients to new competitors, some of which may even be from outside the sector. The Group faces changes in the market by being flexible and constantly optimizing and efficiently adapting the portfolio, struc-tures and processes within the Group. Competence centers facil-itate the focus on particular IT segments by providing dedicated
technical know-how. The expertise of the specialist sales staff is available to the sales and services units of all CANCOM Group companies. With a comprehensive range of ICT services and over 1,800 highly skilled employees in its professional services division, CANCOM offers IT solutions and managed services tailored to individual needs, so creating added value for clients. CANCOM employees have many years of project experience and have been certified by major manufacturers for the latest technologies. On top of this, CANCOM has established various measures to attract, develop and retain high-potential employees – excellently qualified skilled staff and managers.
Organic growth and selective takeovers
CANCOM’s business policy is based on continuing its path of growth. For this purpose it plans to bundle and strengthen its existing business activities, moving further towards high-end inte-grated ICT solutions through both organic and acquisition-based growth.
This will create an opportunity for a further increase in sales revenues. Taking advantage of synergy effects and economies of scale – for example improved purchase terms, centralized adminis-trative tasks and better access to large projects – can contribute to accelerated growth in profits. Additionally, the planned expansion of the services business could lessen the Group’s dependence on hardware price trends.
The German market for integrated IT systems providers has for some years been in a phase of strong consolidation, and CANCOM wishes to continue taking advantage of this trend. Against this background, and in view of the Group’s solid assets position and strong financial resources, there will continue to be opportunities for the Group to consolidate its market position further through appropriate acquisitions.
The CANCOM Executive Board remains confident that the Group’s profitability provides a solid basis for its future performance and makes available the necessary resources for the Group to pursue the opportunities presented.
8. Events of particular significance after the reporting date
Events of particular significance after the end of the fiscal year are described in the Notes to the consolidated financial statements and the Notes to the financial statements of CANCOM SE.
COMBINED MANAGEMENT REPORT FOR CANCOM SE AND THE CANCOM GROUP

52
9. Forecast
The growth of the German economy is likely to continue in 2018. Deutsche Bank Research believes gross domestic product (GDP) will grow by 2.3 percent, the same rate as in 2017. This would continue a pattern of robust growth - it would be the fifth consec-utive year in which the German economy has seen above-potential growth. In Deutsche Bank’s view, the growth is mainly driven by investments due to export demand and capacity utilization, in addition to increasing consumer expenditure.
The European Central Bank’s key interest rate is not expected to change in 2018.
Forecast: Gross domestic product in 2018* (real change compared with 2017, as a percentage)
Germany: + 2.3
Euro area: + 2.3
U.S.A.: + 2.6
World: + 3.8
* Forecasts: Deutsche Bank Research, December 14, 2017
Based on its own extensive experience of many years, CANCOM expects that the IT market will continue to be shaped by strong growth and innovation. The complexity and variety of solutions, and thus also the demands placed on corporate IT, will continue to increase – driven, among other things, by changed work and usage patterns. The digitization of nearly all sectors and the resulting comprehensive networking – along with the Internet of Things – are increasingly driving the development of business models, production processes and products, across all sizes of organization and in all areas of the economy. Against this background, a rise in the demand for innovative and intelligent IT solutions can be expected.
According to figures from the German digital association BITKOM and from EITO and IDC, which BITKOM used for its annual forecast, sales revenues in the IT market will continue to grow. BITKOM forecasts that the volume of sales will grow to € 88.8 billion in 2018 – 3.1 percent higher than in 2017. By far the stron-gest growth is anticipated for the software segment, at 6.3 percent. The IT services segment is expected to grow by 2.6 percent. The IT segment is viewed as the weakest – though still growing – at a rate of 0.9 percent.
The annual IT trends study by Capgemini, for which IT managers of large companies in Germany, Austria and Switzerland were polled, sees a continuation of the positive trend in IT expenditure in 2018.
It found that 48.9 percent of companies plan to increase their IT budgets in 2018, with 10.4 percent increasing by more than 10 percent. Capgemini believes one of the major drivers of this increase is the growing pressure to innovate caused by the entry of technology companies into new sectors in competition with long-established international companies. The study also shows that a remarkably large number of participants from the 500 largest companies in the German-speaking area expect higher IT budgets.
A study by the market research and analyst firm Lünendonk & Hossenfelder in 2017 sees the migration of data centers to the cloud and the sustained trend towards IT outsourcing – partic-ularly in small and medium sized enterprises – as particularly promising growth areas for service providers in 2017/2018. The IT service companies surveyed for the study expected their sales revenues to grow by an average of 7.1 percent in 2017. Similar levels of growth were considered possible in 2018. In the IT consulting and systems integration segment, the conditions for growth were also expected to remain very good. Digital opera-tional excellence and digital customer experience were particularly important areas of investment for their clients. The IT consulting firms surveyed expected sales revenues to grow by an average of 11.0 percent in 2018.
Anticipated performance of the CANCOM Group
The IT market is still characterized by major changes. These changes are being driven by the digital revolution, which is affecting the whole economy and which the CANCOM manage-ment believes is set to continue for the next few years. IT trends such as cloud computing, big data, analytics, mobility and security continue to become increasingly important. Also, the demand for consulting and innovative, flexible IT solutions and services is also rising, owing to the increase in complexity and in networking. This creates great opportunities for growth in the IT sector.
COMBINED MANAGEMENT REPORT FOR CANCOM SE AND THE CANCOM GROUP

53
With its proven expertise and outstanding market position in the IT growth areas referred to above and in shared managed services, the CANCOM Group aims to continue growing its two operating segments, both organically and through acquisitions, at a faster rate than the German IT market as a whole, so contin-uously expanding its market share. To achieve this objective, CANCOM decided at an early stage to gear its business policy to the IT growth areas, designing its sales and services structure around them while focusing on the expansion of the higher-end service and consulting business. This will remain the focus of our strategic orientation in the fiscal year 2018. With its integrated portfolio of services across all areas of IT, and its flexibility in providing individually tailored packages for its clients, CANCOM has major client advantages to enable it to penetrate the market even further. In addition, the increasing complexity of information technology is stretching smaller integrated IT systems providers to the limits of their capabilities. This could result in the CANCOM Group gaining new clients and orders – with positive impacts on the IT solutions and cloud solutions business.
CANCOM plans to continue pursuing its own digital transforma-tion. In order to take full advantage of the trends and efficiently translate them into a demand and market oriented range of solutions for its clients, CANCOM fosters an innovative corpo-rate culture and provides support for individual staff members wishing to undergo further professional training and development and obtain skills certification. With this aim in mind, CANCOM is building on strong, close partnerships with the manufacturers of leading technologies. It uses professional recruitment to gain highly-qualified specialists as employees, while continuously developing the Group’s existing high-potential staff and encour-aging them to acquire the relevant technical qualifications and project management skills.
In the past fiscal year, the Executive Board prepared the company for further growth. CANCOM is ready for good performance in the future: it focuses on profitable business in the traditional IT environment and pushes ahead with its strategy of withdrawing from low-growth or declining areas or those that the Executive Board believes are not viable.
Attractive margins can be achieved in the IT solutions operating segment by selling integrated IT solutions as opposed to just selling products, optimizing or standardizing processes and services in the trading business. Future digitization efforts in enterprises, continuing development and enhancement of tech-nologies, and cloud transformation could lead to an increase in the volume of transactions in the IT solutions business owing to the necessity for investments in standard IT and data center infrastructure. With the opportunities for IT providers such as CANCOM that accompany the progressive digitization of all areas of people’s private and working lives, it should be possible to increase the volume of transactions in the cloud solutions operating segment. The cloud solutions business is characterized by high margins but also longer sales and project durations, which tie up resources. CANCOM will continue to spur the expansion of its market share in the cloud environment and sees the growth in the development and broadening of skills and client relationships in this area as crucial factors. The IT solutions and cloud solutions operating segments benefit from each other’s business, due to the interactions between the CANCOM units across the Group and the fact that the provision of integrated solutions for clients usually requires input from both areas.
Thanks to the growth achieved, CANCOM was able to signifi-cantly expand its market presence and also to considerably improve client proximity in the German-speaking area (i.e. Germany, Austria and Switzerland) in 2017. The Group is repre-sented all over Germany and Austria by its many service and consulting locations. It also has subsidiaries in Switzerland and the U.S.A. as well as a representative office in Brussels, Belgium. CANCOM intends to continue strengthening its market position in the fiscal year of 2018, partly through selective acquisitions, while taking advantage of marketing and cost synergies. The highly fragmented service provider landscape, particularly in the IT market in the German-speaking area, continues to offer favorable conditions for CANCOM to act as a market consolidator.
In fiscal 2018, as in the previous year, substantial investments will be made in the construction of extensions to the logistics and service factory at the company’s location in Jettingen-Scheppach, Germany.
COMBINED MANAGEMENT REPORT FOR CANCOM SE AND THE CANCOM GROUP

54
Basis for forecasts
Our forecasts take into account all events that were known at the time this report was drawn up that could have an impact on the future performance of the CANCOM Group. The outlook is based, among other things, on the expectations with regard to economic growth referred to above, and on the performance of the IT market. It also relates exclusively to organic business growth. This forecast does not take into account the impact of legal or regulatory matters.
Outlook for the CANCOM Group
Against the background of the Group’s successful performance in 2017 and in view of its favorable positioning in the IT market overall as well as in the growth markets connected to cloud computing and related trends, the Executive Board expects further growth in the sales revenues and profits of the Group for 2018, provided that the demand for IT products and services remains steady. However, unforeseen events could influence the currently anticipated performance of both the Group as a whole and of the reportable segments, IT solutions and cloud solutions.
The Executive Board expects a significant increase in the sales revenues and gross profit of the Group as a whole in comparison with 2017. The Executive Board also anticipates a significant increase in both the consolidated EBITDA and the consolidated EBIT in 2018.
CANCOM anticipates a considerable growth in sales revenues, gross profit, EBITDA and EBIT generated by the IT solutions operating segment. For the cloud solutions operating segment, the Executive Board also expects a significant increase in sales revenues, gross profit, EBITDA and EBIT, with the increase being greater than the growth in the IT solutions segment.
Munich, Germany, March 2, 2018
COMBINED MANAGEMENT REPORT FOR CANCOM SE AND THE CANCOM GROUP
Klaus Weinmann Rudolf Hotter Thomas Volk Thomas Stark
The Executive Board of CANCOM SE

55
Disclaimer regarding forward-looking statementsThis document contains statements relating to our future business and financial performance and to future events or developments affecting CANCOM that may constitute forward-looking statements. These statements are based on the current expectations, assumptions and estimates of the Executive Board and other information currently available to the management, of which many are beyond CANCOM’s control. These statements can be identified by phrases and words such as ‘expect’, ‘want’, ‘assume’, ‘believe’, ‘endeavor’, ‘estimate’, ‘presume’, ‘calculate’, ‘intend’, ‘could’, ‘plan’, ‘should’, ‘will’, ‘forecast’ or similar words.
All statements with the exception of facts regarding the past are forward-looking statements. Such statements include expectations regarding the availability of products and services, the financial and earnings position, the business strategy and the Executive Board’s plans for future operating activities, economic performance and all statements regarding assumptions. Although we take the greatest of care when making these statements, we cannot guarantee their correctness, especially in our forecast. Various known and unknown risks, uncertainties and other factors may lead to the actual events deviating significantly from those contained in the forward-looking statements. The following influencing factors are, among others, relevant in this respect: external political influences, changes in the general economic and business situation; changes in the competitive position and situation, for instance by the emergence of new competitors, new products and services or new technologies; changes in the investment behavior of target client Groups etc. and changes to the business strategy. If one or more of these risks or uncertainties should materialize, or if the underlying expectations are not fulfilled or assumptions prove incorrect, the actual results, performance or achievements of CANCOM may (either negatively or positively) deviate substantially from those described either explicitly or implicitly in the relevant forward-looking statement. CANCOM cannot guarantee the pertinence, accuracy, completeness or correctness of the information or opinions in this document.
CANCOM does not make any commitment to update its forward-looking statements, nor does it intend to update them or correct them if developments differ from those anticipated. Due to rounding, some of the numbers presented in this document may not add up precisely to the totals provided and percentages may not precisely reflect the absolute figures they refer to.
COMBINED MANAGEMENT REPORT FOR CANCOM SE AND THE CANCOM GROUP

56
ASSETS
(in € ‘000) Notes Balance sheet date Dec. 31, 2017
Balance sheet date Dec. 31, 2016
Current assets
Cash and cash equivalents C.1. 157,619 63,590
Assets held for sale C.2. 360 360
Trade accounts receivable C.3. 223,672 182,433
Other current financial assets C.4. 25,294 96,062
Inventories C.5. 22,923 22,524
Contracts in progress C.6. 981 417
Prepaid expenses and other current assets C.7. 7,139 5,377
Total current assets 437,988 370,763
Non-current assets
Property, plant and equipment (tangible assets) C.8.1 60,853 44,147
Intangible assets C.8.2 56,471 28,307
Goodwill C.8.3 115,219 73,230
Long-term financial assets 5,321 795
Investments accounted for using the equity method C.8.4 0 501
Loans C.8.5 1,315 1,912
Other non-current financial assets C.9. 8,312 12,716
Deferred taxes arising from temporary differences C.10. 5,023 2,665
Deferred taxes arising from tax loss carryforward C.10. 362 1,605
Other assets 1,266 1 , 157
Total non-current assets 254,142 167,035
Total assets 692,130 537,798
CONSOLIDATED FINANCIAL STATEMENTS
Consolidated balance sheet as at December 31, 2017

57
EQUITY AND LIABILITIES
(in € ‘000) Notes Balance sheet date Dec. 31, 2017
Balance sheet date Dec. 31, 2016
Current liabilties
Short-term loans and current portion of long-term loans C.11. 3,804 1,922
Subordinated loans - short-term portion 1,953 633
Trade accounts payable 220,956 127,047
Prepayments received 6,684 5,349
Other current financial liabilities C.12. 7,979 6,425
Provisions C.13. 3,575 4,883
Deferred income C.14. 5,143 3,946
Income tax liabilities C.15. 11,101 10,244
Other current liabilities C.16. 32,619 27,294
Liabilities in connection with assets held for sale C.2. 770 772
Total current liabilties 294,584 188,515
Non-current liabilities
Long-term loans C.17. 1,315 2,081
Convertible bonds C.18. 0 41,778
Subordinated loans C.19. 3,092 4,457
Deferred income 2,678 2,316
Deferred taxes arising from temporary differences C.20. 15,911 7,550
Pension provisions C.21. 2,041 1,942
Other non-current financial liabilities C.22. 5,230 629
Other non-current liabilities C.13. 3,029 3,451
Total non-current liabilities 33,296 64,204
Equity
Capital stock C.23. 17,522 16,368
Capital reserves 221,943 173,935
Net retained profit/net accumulated loss (incl. revenue reserves) C.23. 122,935 91,263
Equity capital difference due to currency translation and exchange rate differences -236 1,571
Non-controlling interests C.24. 2,086 1,942
Total equity 364,250 285,079
Total equity and liabilities 692,130 537,798
CONSOLIDATED FINANCIAL STATEMENTS

58
CONSOLIDATED STATEMENT OF COMPREHENSIVE INCOME
(in € ‘000) Notes Jan. 1, 2017 - Dec. 31, 2017
Jan. 1, 20156 - Dec. 31, 2016
Sales revenues E.1. 1,161,240 1,023,107
Other operating income E.2. 2,471 3,095
Other own work capitalized E.3. 3,219 2,436
Total revenue 1,166,930 1,028,638
Cost of purchased materials and services -845,127 -735,931
Gross profit 321,803 292,707
Human resources expenses E.4. -190,980 -178,565
Amortization and write-downs of intangible assets, and depreciation and write-downs of tangible assets -23,986 -21,598
Other operating expenses E.5. -46,347 -41,271
Operating result 60,490 51,273
Interest and similar income E.6. 693 644
Interest and other expenses E.6. -2,480 -3,257
Other financial result: income E.7. 381 1,239
Other financial result: expenses E.7. -373 -116
Write-downs of financial assets E.8. 0 -350
Share of profit/loss from associated companies accounted for using the equity method 98 49
Currency translation gains/losses -77 18
Earnings before taxes 58,732 49,500
Income taxes E.9. -18,452 -15,267
Earnings after taxes from continuing operations 40,280 34,233
Earnings from discontinued operations E.10. -259 -582
Net income/(loss) for the period 40,021 33,651
thereof attributable to the stockholders of the parent 39,831 33,365
thereof attributable to non-controlling interests E.11. 190 286
Average number of shares outstanding (basic) E.12. 16,711,565 16,111,407
Average number of shares outstanding (diluted) E.12. 17,483,728 17,166,917
Earnings per share from continuing operations (basic) in € E.12. 2.40 2 . 1 1
Earnings per share from continuing operations (diluted) in € E.12. 2.34 2.05
Earnings per share from discontinued operations (basic) in € E.12. -0.02 -0.04
Earnings per share from discontinued operations (diluted) in € E.12. -0.01 -0.03
Earnings per share attributable to stockholders of the parent from net income/loss for the period (basic) in €
E.12.
2.38
2.07
Earnings per share attributable to stockholders of the parent from net income/loss for the period (diluted) in €
E.12.
2.32
2.01
CONSOLIDATED FINANCIAL STATEMENTS

59
STATEMENT OF COMPREHENSIVE INCOME
(in € ‘000) Jan. 1, 2017 - Dec. 31, 2017
Jan. 1, 2016 - Dec. 31, 2016
Net income/loss for the period 40,021 33,651
Other comprehensive income
Items possibly to be reclassified in profit or loss in subsequent periods
Currency translation difference -2,628 692
Exchange price differences - securities -2 0
Income taxes 823 -214
Items not to be reclassified in profit or loss
Change in actuarial gains/losses from pensions 64 -187
Deferred taxes from change in actuarial gains/losses from pensions -20 58
Other comprehensive income for the period (after taxes) -1,763 349
Comprehensive income for the period 38,258 34,000
thereof attributable to stockholders of the parent 38,068 33,714
thereof attributable to non-controlling interests 190 286
CONSOLIDATED FINANCIAL STATEMENTS

60
CONSOLIDATED STATEMENT OF CASH FLOWS (IN ACCORDANCE WITH IAS 7)
(in € ‘000) Notes Jan. 1, 2017 - Dec. 31, 2017
Jan. 1, 2016 - Dec. 31, 2016
Cash flow from ordinary activities
Profit for the period before taxes and non-controlling interests 58,732 49,500
Adjustments
+ Amortization and write-downs of intangible assets, and depreciation and write-downs of tangible assets 23,986 21,598
+ Write-downs of financial assets 0 350
+ Interest result and other financial result 1,779 1,491
+/- Changes in long-term provisions 481 257
+/- Changes in short-term provisions 118 229
+/- Result from the sale of intangible assets, tangible assets and financial assets -756 -704
+/- Changes in inventories 3,088 5.642
+/- Changes in accounts receivable from purchases and services, as well as other receivables -35,952 -40,557
+/- Changes in accounts payable for purchases and services, as well as other payables 93,735 18,461
- Interest paid -277 -167
+/- Income tax paid and refunded -19,510 -6,209
+/- Non-cash expenses and income -98 -1,020
+/- Cash inflow/outflow from discontinued operations -379 -702
Net cash from operating activities 124,947 48,169
Cash flow from investing activities
+/- Acquisition of subsidiaries and equity instruments of other companies -55,736 -3,539
+/- Cash from acquisitions 5.160 0
+ Cash inflow from disposal of formerly consolidated subsidiaries 200 200
+ Cash inflow from disposal of „at Equity“ consolidated investments 1,104 0
- Acquisition of long-term financial assets -4,525 -737
- Acquisition of financial assets held-for-sale -10,000 -88,000
- Payments for additions to intangible assets and tangible assets -40,969 -25,105
+ Income from disposal of intangible assets, tangible assets and financial assets 2.132 1 ,7 70
+ Outflow of financial asstes held-for-sale 86,000 -105
+ Interest received 70 50
+ Dividends of companies consolidated by „at Equity“ method 10 0
Net cash used in investing activities -16,554 -115,466
Cash flow from financing activities
+/- Income from the issue of subscribed capital 0 66,214
+/- Capital increase costs -53 -1,429
- Repayment of bonds -4,000 0
- Repayment of long-term debt (incl. short-term portion) -1,228 -1,040
+/- Changes in short-term financial liabilities 1,646 523
- Interest paid -740 -822
- Dividends paid -8,213 -8,274
+/- Receipts and payments for finance lease 376 -452
- Outflow for acquisition of non-controlling interests in controlling situation -36 -10,160
Net cash used in financing activities -12,248 44,560
Net increase/decrease in cash and cash equivalents 96,145 -22,737
+/- Changes in value resulting from foreign currency exchange -2,116 525
+/- Cash and cash equivalents at the beginning of the period 63,590 85,802
Cash and cash equivalents at the end of the period F: 157,619 63,590
Structure :
Cash 157,619 63,590
Cash from discontinued operations 0 0
157,619 63,590
CONSOLIDATED FINANCIAL STATEMENTS

61
CONSOLIDATED STATEMENT OF CHANGES IN EQUITYS
har
es
Cap
ital
sto
ck
Cap
ital
res
erve
s
Oth
er r
even
ue
rese
rves
Cu
rren
cy t
ran
slat
ion
rese
rves
Exc
han
ge
rate
pri
ce d
iffe
ren
ce r
eser
ves
Res
erve
s fo
r ch
ang
es in
act
uar
ial
gai
ns/
loss
es f
rom
pes
nsi
on
s
Rev
alua
tio
n re
serv
es (
reve
nu
e re
serv
es)
Net
ret
ain
ed p
rofi
t
Tota
l inv
esto
rs o
f p
aren
t co
mp
any
No
n-c
ont
rolli
ng
inte
rest
s
Tota
l eq
uity
units‘000 in €‘000 in €‘000 in €‘000 in €‘000 in €‘000 in €‘000 in €‘000 in €‘000 in €‘000 in €‘000 in €‘000
January 1, 2016 14,880 14,880 110,197 38,067 1,090 2 -217 -153 34,837 198,703 5,584 204,287
Net income/(loss) for the period 33,365 33,365 286 33,651
Other comprehensive income 479 0 -129 350 0 350
Comprehensive income 479 0 -129 33,365 33,715 286 34,001
Capital increase 1,488 1.488 64,726 66,214 66,214
Changes in reserves: Capital increase costs -988 -988 -988
Transfer of net retained profit/net accumulated loss/revenue reserves 22,455 0 0
Distribution in fiscal year -8,184 -8,184 -90 -8,274
Changes due to acquisition of non-controlling interests -6,323 -6,323 -3,838 -10,161
December 31, 2016 16,368 16,368 173,935 54,199 1,569 2 -346 -153 37,563 283,137 1,942 285,079
Net income/(loss) for the period 39,831 39,831 190 40,021
Other comprehensive income -1,805 -2 44 -1,763 0 -1,763
Comprehensive income -1,805 -2 44 39,831 38,068 190 38,258
Capital increase 1,154 1,154 48,045 49,199 49,199
Changes in reserves: Capital increase costs -37 -37 -37
Transfer of net retained profit/net accumulated loss/revenue reserves 19,060 -19,060 0
0
Distribution in fiscal year -8,184 -8,184 -30 -8,214
Changes due to acquisition of non-controlling interests -19 -19 -16 -35
December 31, 2017 17,522 17,522 221,943 73,240 -236 0 -302 -153 50,150 362,164 2,086 364,250
CONSOLIDATED FINANCIAL STATEMENTS

62
Segment information – IFRS
Segment information Cloud solutions IT solutions Total business segments Other companies Reconciliation Consolidated
Jan. 1, 2017- Dec. 31, 2017
€ ‘000
Jan. 1, 2016- Dec. 31, 2016
€ ‘000
Jan. 1, 2017- Dec. 31, 2017
€ ‘000
Jan. 1, 2016- Dec. 31, 2016
€ ‘000
Jan. 1, 2017- Dec. 31, 2017
€ ‘000
Jan. 1, 2016- Dec. 31, 2016
€ ‘000
Jan. 1, 2017- Dec. 31, 2017
€ ‘000
Jan. 1, 2016- Dec. 31, 2016
€ ‘000
Jan. 1, 2017- Dec. 31, 2017
€ ‘000
Jan. 1, 2016- Dec. 31, 2016
€ ‘000
Jan. 1, 2017- Dec. 31, 2017
€ ‘000
Jan. 1, 2016- Dec. 31, 2016
€ ‘000
Sales revenues
- External sales 182,347 156,122 978,835 866,929 1,161,182 1,023,051 58 56
- Intersegment sales 3,826 1,257 5,477 5,078 9,303 6,335 136 189 -9,439 -6,524
- Total sales revenues 186,173 157,379 984,312 872,007 1,170,485 1,029,386 194 245 -9,439 -6,524 1,161,240 1,023,107
- Cost of purchased materials and services -95,860 -86,425 -757,917 -655,109 -853,777 -741,534 -121 -106 8,771 5,709 -845,127 -735,931
- Human resources costs -37,500 -32,398 -146,436 -139,587 -183,936 - 1 7 1 , 9 8 5 -7,044 -6,580 0 0 -190,980 -178,565
- Other income and expenses -9,611 -7,129 -29,423 -28,114 -39,034 -35,243 -2,291 -1,312 668 815 -40,657 -35,740
EBITDA 43,202 31,427 50,536 49,197 93,738 80,624 -9,262 -7,753 0 0 84,476 72,871
- Depreciation and amortization -9,860 -6,382 -13,896 -14,944 -23,756 -21,326 -230 -272 0 0 -23,986 -21,598
Operating result (EBIT) 33,342 25,045 36,640 34,253 69,982 59,298 -9.492 -8,025 0 0 60,490 51,273
- Interest income 328 360 313 313 641 673 1,938 1,373 -1,886 -1,402 693 644
- Interest expenses -44 -56 -2,785 -2,345 -2,829 -2,401 -1,537 -2,258 1,886 1,402 -2,480 -3,257
- Other financial income 0 0 381 1,238 381 1,238 0 1 0 0 381 1,239
- Other financial expenses 0 0 0 -111 0 -111 -373 -5 0 0 -373 -116
- Write-downs of long-term financial assets 0 0 0 -350 0 -350 0 0 0 0 0 -350
- Share in profit or loss of associated companies accounted for by using the equity method 98 49 0 0 98 49 0 0 0 0 98 49
Result from ordinary activities 33,724 25,398 34,549 32,998 68,273 58,396 -9,464 -8,914 0 0 58,809 49,482
- Foreign currency exchange differences -77 18 -77 18
Earnings before taxes 33,724 25,398 34,549 32,998 68,273 58,396 -9,464 -8.914 -77 18 58,732 49,500
- Income taxes -18,452 -15,267 -18,452 -15,267
- Discontinued operations -259 -582 0 0 -259 -582 0 0 0 0 -259 -582
Consolidated net income for the year 40,021 33,651
thereof attributable to stockholders of the parent 39,831 33,365
thereof attributable to non-controlling interests 190 286
CONSOLIDATED FINANCIAL STATEMENTS
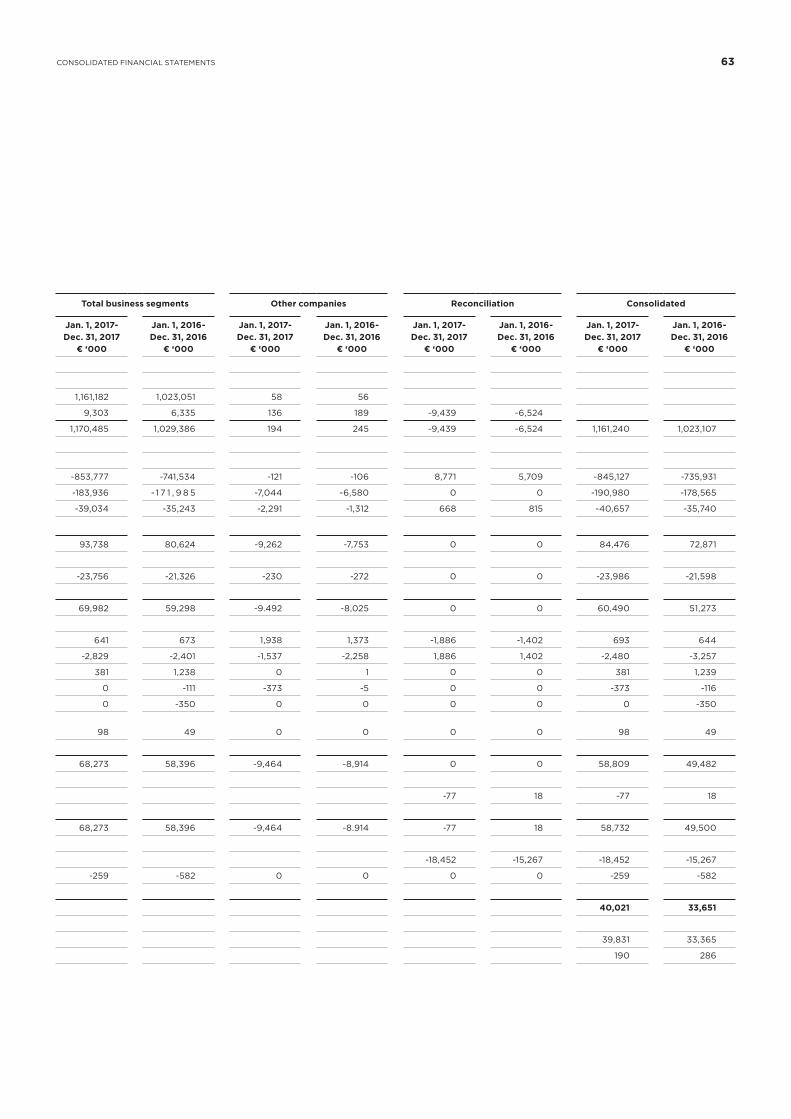
63
Segment information – IFRS
Segment information Cloud solutions IT solutions Total business segments Other companies Reconciliation Consolidated
Jan. 1, 2017- Dec. 31, 2017
€ ‘000
Jan. 1, 2016- Dec. 31, 2016
€ ‘000
Jan. 1, 2017- Dec. 31, 2017
€ ‘000
Jan. 1, 2016- Dec. 31, 2016
€ ‘000
Jan. 1, 2017- Dec. 31, 2017
€ ‘000
Jan. 1, 2016- Dec. 31, 2016
€ ‘000
Jan. 1, 2017- Dec. 31, 2017
€ ‘000
Jan. 1, 2016- Dec. 31, 2016
€ ‘000
Jan. 1, 2017- Dec. 31, 2017
€ ‘000
Jan. 1, 2016- Dec. 31, 2016
€ ‘000
Jan. 1, 2017- Dec. 31, 2017
€ ‘000
Jan. 1, 2016- Dec. 31, 2016
€ ‘000
Sales revenues
- External sales 182,347 156,122 978,835 866,929 1,161,182 1,023,051 58 56
- Intersegment sales 3,826 1,257 5,477 5,078 9,303 6,335 136 189 -9,439 -6,524
- Total sales revenues 186,173 157,379 984,312 872,007 1,170,485 1,029,386 194 245 -9,439 -6,524 1,161,240 1,023,107
- Cost of purchased materials and services -95,860 -86,425 -757,917 -655,109 -853,777 -741,534 -121 -106 8,771 5,709 -845,127 -735,931
- Human resources costs -37,500 -32,398 -146,436 -139,587 -183,936 - 1 7 1 , 9 8 5 -7,044 -6,580 0 0 -190,980 -178,565
- Other income and expenses -9,611 -7,129 -29,423 -28,114 -39,034 -35,243 -2,291 -1,312 668 815 -40,657 -35,740
EBITDA 43,202 31,427 50,536 49,197 93,738 80,624 -9,262 -7,753 0 0 84,476 72,871
- Depreciation and amortization -9,860 -6,382 -13,896 -14,944 -23,756 -21,326 -230 -272 0 0 -23,986 -21,598
Operating result (EBIT) 33,342 25,045 36,640 34,253 69,982 59,298 -9.492 -8,025 0 0 60,490 51,273
- Interest income 328 360 313 313 641 673 1,938 1,373 -1,886 -1,402 693 644
- Interest expenses -44 -56 -2,785 -2,345 -2,829 -2,401 -1,537 -2,258 1,886 1,402 -2,480 -3,257
- Other financial income 0 0 381 1,238 381 1,238 0 1 0 0 381 1,239
- Other financial expenses 0 0 0 -111 0 -111 -373 -5 0 0 -373 -116
- Write-downs of long-term financial assets 0 0 0 -350 0 -350 0 0 0 0 0 -350
- Share in profit or loss of associated companies accounted for by using the equity method 98 49 0 0 98 49 0 0 0 0 98 49
Result from ordinary activities 33,724 25,398 34,549 32,998 68,273 58,396 -9,464 -8,914 0 0 58,809 49,482
- Foreign currency exchange differences -77 18 -77 18
Earnings before taxes 33,724 25,398 34,549 32,998 68,273 58,396 -9,464 -8.914 -77 18 58,732 49,500
- Income taxes -18,452 -15,267 -18,452 -15,267
- Discontinued operations -259 -582 0 0 -259 -582 0 0 0 0 -259 -582
Consolidated net income for the year 40,021 33,651
thereof attributable to stockholders of the parent 39,831 33,365
thereof attributable to non-controlling interests 190 286
CONSOLIDATED FINANCIAL STATEMENTS

64
* In the previous year, currency translation differences were included in disposals, and under goodwill they were included in additions from first-time consolidation
2016 fiscal year:
ACQUISITION/PRODUCTION COSTS AMORTIZATION, DEPRECIATION AND WRITE-DOWNS CARRYING AMOUNTS
As at
Jan. 1, 2016 € ‘000
Currency translation differences
2016 € ‘000
Additions from first-time
consolidation 2016
€ ‘000
Additions
2016 € ‘000
Disposals
2016 € ‘000
Transfers
2016 € ‘000
As at
Dec. 31. 2016 € ‘000
As at
Jan. 1, 2016 € ‘000
Currency translation differences
2016 € ‘000
Additions from first-time
consolidation 2016
€ ‘000
Additions
2016 € ‘000
Disposals
2016 € ‘000
As at
Dec. 31, 2016 € ‘000
As at
Dec. 31., 2016 € ‘000
As at
Dec. 31, 2015 € ‘000
Property,plant and equipment (tangible assets) 71,978 45 0 15,510 8,810 -365 78,358 31,652 17 0 10,416 7,874 34,211 44,147 40,326
Intangible assets
Software and other 13,282 2 0 9,595 99 0 22,780 7,364 1 0 2,980 98 10,247 12,533 5,918
Client lists 49,289 363 1,178 0 2,329 0 48,501 26,525 330 0 8,201 2,329 32,727 15,774 22,764
Goodwill 92,351 450 0 0 0 0 92,801 19,571 0 0 0 0 19,571 73,230 72,780
Long-term financial assets 2,034 0 0 730 1,959 0 805 1,969 0 0 0 1,959 10 795 65
Investments accounted for using the equity method
952
0
0
49
0
0
1,001
500
0
0
0
0
500
501
452
Loans 2,401 0 0 11 500 0 1,912 0 0 0 350 350 0 1,912 2,401
Total 232,287 860 1,178 25,895 13,697 -365 246,158 87,581 348 0 21,947 12,610 97,266 148,892 144,706
Schedule of changes in non-current assets
ACQUISITION/PRODUCTION COSTS AMORTIZATION, DEPRECIATION AND WRITE-DOWNS CARRYING AMOUNTS
As at
Jan. 1, 2017 € ‘000
Currency translation differences
2017 € ‘000
Additions from first-time
consolidation 2017
€ ‘000
Additions
2017 € ‘000
Disposals
2017 € ‘000
Transfers
2017 € ‘000
As at
Dec. 31. 2017 € ‘000
As at
Jan. 1, 2017 € ‘000
Currency translation differences
2017 € ‘000
Additions from first-time
consolidation 2017
€ ‘000
Additions
2017 € ‘000
Disposals
2017 € ‘000
As at
Dec. 31, 2017 € ‘000
As at
Dec. 31., 2017 € ‘000
As at
Dec. 31, 2016 € ‘000
Property,plant and equipment (tangible assets) 78,358 -144 3,344 28.695 10,325 -60 99,868 34,211 -59 2,489 11,482 9,108 39,015 60,853 44,147
Intangible assets
Software and other 22,780 -11 419 12,274 268 60 35,254 10,247 -4 382 3,333 267 13,691 21,563 12,533
Client lists 48,501 -1,381 28,486 0 0 0 75,606 32,727 -1,200 0 9,171 0 40,698 34,908 15,774
Goodwill 92,801 -1,715 43,704 0 0 0 134,790 19,571 0 0 0 0 19,571 115,219 73,230
Long-term financial assets 805 0 327 4,518 75 0 5,575 10 0 254 0 10 254 5,321 795
Investments accounted for using the equity method 1,001 0 0 88 1,089 0 0 500 0 0 0 500 0 0 501
Loans 1,912 0 0 10 607 0 1,315 0 0 0 0 0 0 1,315 1,912
Total 246,158 -3,251 76,280 45,585 12,364 0 352,408 97,266 -1,263 3,125 23,986 9,885 113,229 239,179 148,892
CONSOLIDATED FINANCIAL STATEMENTS

65
2016 fiscal year:
ACQUISITION/PRODUCTION COSTS AMORTIZATION, DEPRECIATION AND WRITE-DOWNS CARRYING AMOUNTS
As at
Jan. 1, 2016 € ‘000
Currency translation differences
2016 € ‘000
Additions from first-time
consolidation 2016
€ ‘000
Additions
2016 € ‘000
Disposals
2016 € ‘000
Transfers
2016 € ‘000
As at
Dec. 31. 2016 € ‘000
As at
Jan. 1, 2016 € ‘000
Currency translation differences
2016 € ‘000
Additions from first-time
consolidation 2016
€ ‘000
Additions
2016 € ‘000
Disposals
2016 € ‘000
As at
Dec. 31, 2016 € ‘000
As at
Dec. 31., 2016 € ‘000
As at
Dec. 31, 2015 € ‘000
Property,plant and equipment (tangible assets) 71,978 45 0 15,510 8,810 -365 78,358 31,652 17 0 10,416 7,874 34,211 44,147 40,326
Intangible assets
Software and other 13,282 2 0 9,595 99 0 22,780 7,364 1 0 2,980 98 10,247 12,533 5,918
Client lists 49,289 363 1,178 0 2,329 0 48,501 26,525 330 0 8,201 2,329 32,727 15,774 22,764
Goodwill 92,351 450 0 0 0 0 92,801 19,571 0 0 0 0 19,571 73,230 72,780
Long-term financial assets 2,034 0 0 730 1,959 0 805 1,969 0 0 0 1,959 10 795 65
Investments accounted for using the equity method
952
0
0
49
0
0
1,001
500
0
0
0
0
500
501
452
Loans 2,401 0 0 11 500 0 1,912 0 0 0 350 350 0 1,912 2,401
Total 232,287 860 1,178 25,895 13,697 -365 246,158 87,581 348 0 21,947 12,610 97,266 148,892 144,706
Schedule of changes in non-current assets
ACQUISITION/PRODUCTION COSTS AMORTIZATION, DEPRECIATION AND WRITE-DOWNS CARRYING AMOUNTS
As at
Jan. 1, 2017 € ‘000
Currency translation differences
2017 € ‘000
Additions from first-time
consolidation 2017
€ ‘000
Additions
2017 € ‘000
Disposals
2017 € ‘000
Transfers
2017 € ‘000
As at
Dec. 31. 2017 € ‘000
As at
Jan. 1, 2017 € ‘000
Currency translation differences
2017 € ‘000
Additions from first-time
consolidation 2017
€ ‘000
Additions
2017 € ‘000
Disposals
2017 € ‘000
As at
Dec. 31, 2017 € ‘000
As at
Dec. 31., 2017 € ‘000
As at
Dec. 31, 2016 € ‘000
Property,plant and equipment (tangible assets) 78,358 -144 3,344 28.695 10,325 -60 99,868 34,211 -59 2,489 11,482 9,108 39,015 60,853 44,147
Intangible assets
Software and other 22,780 -11 419 12,274 268 60 35,254 10,247 -4 382 3,333 267 13,691 21,563 12,533
Client lists 48,501 -1,381 28,486 0 0 0 75,606 32,727 -1,200 0 9,171 0 40,698 34,908 15,774
Goodwill 92,801 -1,715 43,704 0 0 0 134,790 19,571 0 0 0 0 19,571 115,219 73,230
Long-term financial assets 805 0 327 4,518 75 0 5,575 10 0 254 0 10 254 5,321 795
Investments accounted for using the equity method 1,001 0 0 88 1,089 0 0 500 0 0 0 500 0 0 501
Loans 1,912 0 0 10 607 0 1,315 0 0 0 0 0 0 1,315 1,912
Total 246,158 -3,251 76,280 45,585 12,364 0 352,408 97,266 -1,263 3,125 23,986 9,885 113,229 239,179 148,892
CONSOLIDATED FINANCIAL STATEMENTS

66
Notes to the consolidated financial statements for the fiscal yearJanuary 1 to December 31, 2017
A. The principles adopted for the consolidated financial statements
1. General information
The consolidated financial statements of CANCOM SE and its subsidiaries (‘the CANCOM Group’ or ‘the Group’) for the fiscal year 2017 were drawn up according to the International Financial Reporting Standards or the International Accounting Standards (IFRS/IAS, as applicable in the EU).
The corporate objective of CANCOM SE and its consolidated subsidiaries is IT architecture design, system integration and the provision of a range of managed services. As a provider of inte-grated solutions, CANCOM’s main focus is on the provision of IT services, in addition to the distribution of hardware and software of renowned manufacturers. Its IT services range includes the design of IT architectures and IT landscapes, design and integra-tion of IT systems, and systems operation.
The consolidated financial statements were drawn up in euro. All amounts are shown in thousand euro (€ thousand) unless otherwise stated. Rounding of figures may result in apparent inconsistencies between totals and sums of constituent parts. For the same reason, percentage indications may not exactly match the aggregate values shown or total 100 percent.
The fiscal year covers the period from January 1 to December 31, 2017. The address of the company’s registered office is Erika-Mann-Strasse 69, 80636 München, Germany. CANCOM SE is registered at the local court (Amtsgericht) in Munich, Germany, under the commercial register number (HRB) 203845.
The shares of the corporation are traded on the Regulated Market of the Frankfurt Stock Exchange (Frankfurter Wertpapierbörse, FWB) and are admitted to the Prime Standard under ISIN DE0005419105.
2. Adoption of new accounting standards
CANCOM SE has adopted all standards (IFRS and IAS) published by the International Accounting Standards Board (IASB) and the interpretations of the International Financial Reporting Interpreta-tions Committee (IFRIC) or the Standing Interpretations
Committee (SIC) that were effective in the EU as at December 31, 2017. The relevant transitional provisions were observed. The necessary explanations required by the German Commercial Code (Handelsgesetzbuch, HGB) or the German Stock Corporation Act (Aktiengesetz, AktG) were added to the consolidated financial statements.
New reporting standards – implemented
The following accounting standards relevant to the CANCOM Group have to be taken into account for the first time in the fiscal year 2017. None of the changes has a major impact on the consoli-dated financial statements of CANCOM SE.
In January 2016, IASB published amendments to IAS 7 Statement of Cash Flows under its disclosure initiative. The amendments require the notes to contain additional disclosures on liabilities from financing activities, with the aim of improving information about changes in an entity’s liabilities. For more information, see section F. As the new regulations are effective prospectively, no comparative information has to be provided in the year in which they are first applied.
Also in January 2016, the IASB published amendments to IAS 12 – Income Taxes Recognition of Deferred Tax Assets for Unrealized Losses. The changes contain the following clarifications:
• if fixed-income securities are recognized at a fair value that is lower than the tax value owing to an increase in the market interest rate, this gives rise to a temporary difference;
• when estimating the future taxable income, the realizable value of an asset can be assumed to be higher than the IFRS carrying amount if it is likely to be recoverable;
• when deferred tax assets are assessed for impairment, the taxable income before the reversal of any deductible temporary differences must be taken into account. In addition, only such taxable income as can be offset against the expenses/losses from the reversal of deductible temporary differences is relevant.
NOTES TO THE CONSOLIDATED FINANCIAL STATEMENTS
67
In December 2016, the IASB issued Annual Improvements to IFRS Standards 2014-2016 Cycle. The IASB’s annual improvements process involves amendments to individual IFRSs to eliminate inconsistencies between standards and clarify wording. The standards concerned are IFRS 1, IAS 28, IFRS 12, and IFRS 7. The amendments to IFRS 12 are effective for annual periods beginning on or after January 1, 2017. The other amendments are effective for annual periods beginning on or after January 1, 2018. The amendments are not expected to have any major impact on the consolidated financial statements of the CANCOM Group.
Accounting standards published – not yet implemented
The IASB and the IFRIC published the pronouncements described below, which were not yet mandatorily effective in the fiscal year 2017. As a matter of principle, the pronouncements are only adopted by CANCOM from the date at which their adoption becomes mandatory. The pronouncements below only include those expected to apply to the consolidated financial statements of CANCOM SE.
IFRS 9
In July 2014, the IASB completed its project to replace IAS 39 Financial Instruments: Recognition and Measurement with the publication of the final version of IFRS 9 Financial Instruments. IFRS 9 introduces a consistent approach for the classification and measurement of financial assets and financial liabilities. As a basis, the standard refers to the cash flow characteristics and the business model according to which they are controlled. It also provides for a new expected impairment model. IFRS 9 also contains new rules for the use of hedge accounting to reflect an entity’s risk management activities, especially with regard to the control of non-financial risks. The new IFRS 9 is effective for annual periods beginning on or after January 1, 2018. Early adoption was permitted. During the fiscal year 2017, CANCOM SE investigated the impact that applying IFRS 9 for the first time will have on the consolidated financial statements. First, the following issues covered by IFRS 9 were deemed relevant to the company: • classification and measurement under IFRS 9;• expected loss impairment model under IFRS 9;
In view of its financial positions as at December 31, 2017 (see section B Details of financial instruments), the Group found that applying the rules for classification and measurement of financial assets and liabilities contained in IFRS 9 will not have any major first-time application impact. Financial assets previously measured at amortized cost, which are now to be measured at fair value in accordance with IFRS 9, are of minor importance. Financial assets classified as equity instruments, which were categorized as available for sale under IAS 39, are allocated in accordance with IFRS to the measurement category of items recognized directly in equity at fair value without recycling. For this category and the remaining financial assets and liabilities, there is no impact on measurement from the first application of IFRS 9. As the Group has not recognized any hedging relationships as at the reporting date, the rules on hedge accounting in IFRS 9 have no impact on the Group.
The new expected loss impairment model contained in IFRS 9 results in impairments being recorded earlier and the possibility of possibly increased volatility in comparison to the application of the incurred loss model under IAS 39.
At CANCOM SE, financial assets measured at amortized cost and those recognized directly in equity and shown in other comprehensive income are governed by the expected loss model of IFRS 9. For lease receivables and trade accounts receivable with a financing element, the Group uses the option to assign financial instruments to stage 2 of the impairment model on recognition, which gives it the option of recognizing only the lifetime expected credit loss.
The examination found that applying the IFRS 9 impairment model for financial assets for the first time will not result in any major changes compared with the previous impairment model.
The Group applies IFRS 9 retrospectively (IAS 8), taking into account the special transitional provisions of IFRS 9. Under these provisions, the previous year’s figures are not adjusted. Instead, any impact is recognized in the revenue reserves as at January 1, 2018.
NOTES TO THE CONSOLIDATED FINANCIAL STATEMENTS
68
IFRS 15
In May 2014, the IASB published IFRS 15 Revenue from Contracts with Customers. IFRS 15 specifies when revenue is to be recog-nized and in what amount. IFRS preparers are also required to provide users of financial statements with more informative and relevant disclosures than they have hitherto provided. Application of IFRS 15 is mandatory for all IFRS preparers and applies to almost all contracts with clients. However, the main exceptions are leases, financial instruments and insurance contracts. Hence IFRS 15 replaces the standards hitherto applicable (IAS 18, IAS 11 and IFRIC 13) on revenue recognition and relevant interpretations. Additionally, amendments to IFRS 15 were published in April 2016 to clarify and ease the transition to IFRS 15. The standard is effec-tive for annual periods beginning on or after January 1, 2018.
In contrast to the current rules, the new standard provides a single, principles-based five-step model to be applied to all contracts with clients. According to this five-step model, the contract must first be identified with the client (step 1). In step 2, the separate performance obligations in the contract must be identified. Then (step 3) the transaction price must be determined; explicit rules are provided to deal with variable consideration, financing components, payments to the client and exchanges. After the transaction price is determined, it must be allocated to the individual performance obligations by reference to their relative standalone selling prices (step 4). Finally, the revenue can be recognized (step 5) when the entity has satisfied the perfor-mance obligation. Revenue is recognized as control of the goods or services is passed to the client.
When a contract is signed, according to IFRS 15, it must be ascer-tained whether the revenue resulting from the contract is to be recognized at a point in time or over time. It must first be clarified according to specific criteria whether control of the good or service is transferred over time.
If this is not the case, the revenue is recognized when control is passed to the client at a certain point in time. However, if control is passed over time, the revenue may only be recognized over time if progress can be measured reliably by means of input or output based methods.
Finally, the standard has new, more detailed rules with regard to disclosures that must be made on revenues in IFRS financial statements.
Contract assets and liabilities are new items introduced to the balance sheet by IFRS 15.
During the fiscal year 2017, the Group assessed the possible impact of applying IFRS 15 on the consolidated financial statements for the year ended December 31, 2017. An analysis of multi-component sales / IT project business differentiated between the sales reve-nues in the following three categories:
• Sale of hardware and software (approximately € 700 million of consolidated sales revenues as December 31, 2017)
• Sale of licenses (approximately € 200 million of consolidated sales revenues as December 31, 2017)
• Provision of services such as IT strategy consulting, IT services and support (approximately € 250 million of consolidated sales revenues as at December 12, 2017).
The Group’s assessment is that the sale of hardware and soft-ware and, where applicable, related services, represent separate performance obligations, meaning that sales revenues should be recognized when control of the relevant goods and services is transferred to the client. This is in line with the current identifi-cation of individual revenue components under IAS 18. Although IFRS 15 requires that the transaction price be allocated to the individual performance obligations by reference to their relative standalone selling prices, the Group expects this allocation not to deviate significantly from the current allocation, as standard market prices are already used under IAS 18 for the allocation of the transaction price. No significant deviations from the current practice are expected in terms of the timing of revenue recogni-tion either.
With regard to the determination of revenue from licenses, an investigation is currently being carried out in order to determine whether agent/principal arrangements exist and, if applicable, to which extent. Depending on whether CANCOM is deemed to be acting as the principal or the agent, there could be an impact on the amount of sales revenues reported. If the assessment finds that CANCOM is acting as the principal, the sales revenues must be recognized at the gross amount, but if it is acting as the agent, the amount that must be recognized is the net amount that CANCOM receives in return for its agency activity.
NOTES TO THE CONSOLIDATED FINANCIAL STATEMENTS

69
The measurement is based on the assumption that the sales reve-nues concerned are to be reported gross, due partly to the fact that the contractual relationships examined allow discretion in estab-lishing prices, indicating that the company as the principal. Also, the level of advice in the contractual relationships examined is considerable, and the relevant service, combined with the supply of licenses, represents a service unit/standardized performance obligation. The software license would only be of use in conjunc-tion with the appropriate advice, and would not be distinctly separable from the service provision in the context of the contract. Furthermore, CANCOM is liable for any incorrect advice. The criteria mentioned here are the criteria for principal status, which can be established as a result of the assessment. There is also the question of an agent/principal arrangement for other services that continue to be provided subsequent to supplying the software license and which could constitute an independent performance obligation. Owing to these remaining uncertainties, these questions are currently still the subject of discussions on an inter-national level. It is impossible at present to estimate reliably the scale of the impact of a change in presentation (net presentation). CANCOM’s total sales revenues from licenses in 2017 amounted to around € 200 million. If the change in presentation were to be applied this would not affect the consolidated profit or loss.
In relation to the IT project and IT services business, the Group gave particular consideration to the guidelines in IFRS 15 on the aggregation of contracts, the identification of performance obli-gations, contract modifications, assessing whether the contracts include a significant financing component, and the allocation of the transaction price. The investigation found that the revenue from these contracts should be recognized over time, as the assets already sold cannot be used by the Group for any other purpose and the Group has an enforceable right to payment for the performance completed to date. Furthermore, it is assumed that the input-based method hitherto used for measuring progress will also be appropriate under IFRS 15 in the future. Based on the analysis carried out, the management has reached the conclusion that applying IFRS 15 will not have any major financial impact. The management intends to adopt the full retrospective approach when applying the standard for the first time, while applying the practical expedients for contracts that have been performed.
IFRS 16
In January 2016, the IASB published IFRS 16 Leases. This standard provides a comprehensive model for identifying a lease and for accounting for lessors and lessees. The central idea of the new standard is to include basically all leases and the contractual rights and obligations arising under them in the balance sheet of lessees, eliminating the distinction between finance and operating leases so far required by IAS 17. Instead, IFRS 16 introduces a standard accounting model according to which lessees are obliged to recog-nize rights-of-use assets and lease liabilities for lease agreements with a term of more than 12 months.
However, the rules for lessor accounting under the new standard are similar to those formerly required by IAS 17, with the leases continuing to be classified as either finance or operating leases. The new rules are mandatorily effective for annual periods begin-ning on or after January 1, 2019, with early adoption permitted provided that IFRS 15 is also applied.
The Group has not yet completed its analysis of the impact of IFRS 16. As at December 31, 2017, the Group has liabilities relating to noncancelable rental contracts and leases amounting to € 37,602 thousand (undiscounted; see section G. Other disclosures). Unlike IFRS 16, IFRS 17 does not require the recognition of either a right-of-use asset or a lease liability for these future payments. Instead, related disclosures are required. The Group is currently examining which contractual relationships constitute leases within the meaning of IFRS 16. A preliminary assessment indicates that the existing liabilities arising from rental contracts and leases, which amount to € 37,602 thousand, constitute leases within the meaning of IFRS 16, and therefore the relevant right-of-use assets and lease liabilities should be recognized when IFRS 16 is adopted, except in cases where the exemptions provided for short-term leases or low-value assets apply. A reliable estimate of the amount of the financial impact can only be provided after this examina-tion is completed.
For finance leases in which the Group is the lessor, it is not expected that the adoption of IFRS 16 will have a significant impact on the consolidated financial statements. In line with the transitional provisions, CANCOM currently plans to apply the new standard without adjustment of prior-year comparative figures, and to present the cumulative effect of the transition in the revenue reserves.
NOTES TO THE CONSOLIDATED FINANCIAL STATEMENTS

70
Other accounting standards
In October 2017 the IASB published Long-term Interests in Asso-ciates and Joint Ventures (amendments to IAS 28 Investments in Associates and Joint Ventures). The amendments clarify that an entity is obliged to apply IFRS 9 Financial Instruments, including its rules on impairment, to long-term interests in associates or joint ventures that essentially form part of the net investment in the associate or joint venture but to which the equity method is not applied. The application of IFRS 9 thus takes precedence over the application of IAS 28. The amendment to IAS 28 is manda-torily effective for annual periods beginning on or after January 1, 2019 and has not yet been adopted under European Union law. The impact on the presentation of the asset, financial and earnings position is still being examined.
In December 2017, the IASB published Annual Improvements to IFRS Standards 2015-2017 Cycle. These amendments concern IFRS 3 Business Combinations, IFRS 11 Joint Arrangements, IAS 12 Income Taxes, and IAS 23 Borrowing Costs, and mainly contain clarifications. The amendments are effective for annual periods beginning on or after January 1, 2019. Early adoption is permitted. The amendment has not yet been adopted under European Union law. The impact on the presentation of the asset, financial and earnings position is still being examined.
In December 2016, the IASB issued IFRIC 22 Foreign Currency Transactions and Advance Consideration. The interpretation addresses an issue concerning the application of IAS 21. It clar-ifies the date of transaction for the purpose of determining the exchange rate on transactions involving payment or receipt of advance consideration. The amendments are effective for annual periods beginning on or after January 1, 2018. The amendments are not expected to have any major impact on the CANCOM Group.
Also in December 2016, the IASB published Transfers of Invest-ment Property (Amendments to IAS 40). The amendments clarify when transfers should be made to and from investment property classification if the property is under construction or development. Until now the classification of incomplete construction properties was unclear due to the exhaustive list provided by IAS 40.57. The amendments are effective for annual periods beginning on or after January 1, 2018. The possible impact on the CANCOM Group is currently being examined.
In June 2017, the IASB published IFRIC 23 Uncertainty over Income Tax Treatments. The interpretation explains that the tax treatment of certain circumstances and transactions can depend on future recognition by the taxation authorities. While IAS 12 Income Taxes prescribes the accounting treatment of actual and deferred taxes, IFRIC 23 amends IAS 12 by considering uncer-tainties regarding the income tax treatment of circumstances and transactions. The amendments are effective for annual periods beginning on or after January 1, 2019. The possible impact on the CANCOM Group is currently being examined.
In February 2018, the IASB published amendments to IAS 19 Employee Benefits. The amendments concern the accounting treatment of defined benefit obligations from the time of a plan amendment, curtailment or settlement. From this time, the current service cost and net interest expense for the reporting period after the remeasurement must in future be determined on the basis of the current actuarial assumptions used to remeasure the benefit obligation at this point in time. In addition, amend-ments have been included to clarify the impact this will have on the calculation of the asset ceiling. The amendments are effective for annual periods beginning on or after January 1, 2019. Early adoption is permitted. The amendment has not yet been adopted under European Union law. The impact on the presentation of the asset, financial and earnings position is still being examined.
NOTES TO THE CONSOLIDATED FINANCIAL STATEMENTS

71
3. Reporting entity
The consolidated financial statements include CANCOM SE and all subsidiaries in which CANCOM SE has either a direct or an indirect majority stockholding, or in which it holds the majority of the voting rights. These subsidiaries are fully consolidated.
Acquisitions in the fiscal year 2017
On May 30, 2017, CANCOM SE signed a stock purchase and assignment agreement to acquire 100 percent of the shares (10,000 shares) of Antauris-Aktiengesellschaft, based in Hamburg, Germany, with an aggregate nominal value of € 500,000. The purchase price was € 6,000,000. Incidental acquisition costs of € 140 thousand were incurred in the fiscal year 2017; these are shown in the statement of income under other operating expenses.
Antauris-Aktiengesellschaft operates nationally in Germany as an IT systems and consulting company, service partner and provider of system-related enterprise applications for data center solutions. The company has specialist expertise and many years of experi-ence in areas such as IT security, managed services, storage and network management, in addition to data center structures and virtualization. At the date from which it was first consolidated, the company employed 95 people. In 2016 it generated sales revenues of around € 38 million.
The date on which it was first included in the consolidated accounts was July 1, 2017.
Changes in the reporting entity in 2017:
Name and registered office of company
Date from which first
included in the consolidated
financial statements
Stock- holding
(in percent)
Voting rights
(in percent)
Antauris-Aktiengesellschaft, Hamburg, Germany
July 1, 2017
100
100
The table below shows the impact on the consolidated financial statements of the change in the reporting entity as at July 1, 2017, the date from which antauris-Aktiengesellschaft was first included in the consolidated financial statements (preliminary figures).
Fair value € ‘000
Carrying amount € ‘000
Cash and cash equivalents 510 510
Trade accounts receivable 3,850 3,850
Other current financial assets 303 303
Inventories 546 546
Contracts in progress 160 160
Prepaid expenses and other current assets 378 378
Current assets 5,747 5,747
Property, plant and equipment (tangible assets) 171 171
Intangible assets 2,031 20
Financial assets 73 73
Other financial assets 21 21
Deferred taxes arising from temporary differences 91 0
Other assets 71 71
Non-current assets 2,458 356
Total assets 8,205 6,103
Short-term loans and current portion of long-term loans 19 19
Trade accounts payable 3,773 3.773
Prepayments received 404 404
Other current financial liabilities 22 22
Deferred income 663 663
Income tax liabilities 21 21
Other current liabilities 414 414
Current liabilities 5,316 5,316
Long-term loans 52 52
Deferred taxes 646 0
Pension provisions 3 3
Other non-current liabilities 7 7
Non-current liabilities 708 62
Total liabilities 6,024 5,378
Net assets acquired 2.181 725
NOTES TO THE CONSOLIDATED FINANCIAL STATEMENTS

72
The acquisition of the company resulted in goodwill of € 3,819 thousand, which is not tax-deductible. The main reason for the acquisition itself and for recognizing goodwill was to expand the Group’s business activities and to take advantage of business opportunities in northern Germany.
The sales revenues of Antauris-Aktiengesellschaft included in the consolidated sales revenues since the acquisition date amount to € 16,261 thousand, and the profit included in the consolidated profit amounts to € 80 thousand.
On June 22, 2017, CANCOM SE signed a stock purchase and transfer agreement to acquire 81.47 percent of the shares of Synaix Gesellschaft für angewandte Informations-Technologien mbH (nominal value € 407,350), and all the shares of synaix Service GmbH (nominal value € 25,000), both based in Aachen, Germany. The purchase price for synaix Service GmbH is € 34 thousand. The purchase price for Synaix Gesellschaft für angewandte Informa-tions-Technologien mbH consists of a fixed component of € 43,966 thousand payable in cash, in addition to a variable component (earn-out) of € 5,991 thousand. This is a contingent purchase price based on the earnings before interest and tax (EBIT) in the fiscal years 2017 to 2020, capped at € 6,000 thousand. Also on June 22, 2017, CANCOM SE signed a contribution and assignment agreement to acquire the remaining 18.53 percent of the shares of synaix Gesellschaft für angewandte Informa-tions-Technologien mbH, with a nominal value of € 92,650. The purchase price for these shares is € 10,000 thousand and will be paid to the seller as a non-cash contribution in the form of no-par value shares to be issued from the authorized capital of CANCOM SE. The shares will be freely tradable and admitted to trading at the Frankfurt Stock Exchange (FWB). This involves 185,714 shares at a market value of € 53.846.Incidental acquisition costs of € 203 thousand were incurred in the fiscal year 2017; these are shown in the statement of income under other operating expenses.
The synaix group is an IT service provider with an integrated portfolio of solutions for the digitization of business processes (digital transformation services). In the areas of standard IT, managed IT and digital process hosting, the synaix group operates core digital processes under the as-a-service model for its clients in various sectors, and provides IT services in its own and third-party data centers. At the date from which it was first consolidated, the synaix group employed 59 people. In the fiscal year 2016 it generated sales revenues of € 13.7 million with a mid-double digit profit margin.
The group is included in the consolidated accounts from July 31, 2017
Changes in the reporting entity in 2017:
Name and registered office of company
Date from which first
included in the consolidated
financial statements
Stock- holding
(in percent)
Voting rights
(in percent)
synaix Gesellschaft für angewandte Informations- Technologien mbH, Aachen, Germany July 31, 2017 100 100
synaix Service GmbH July 31, 2017 100 100
The table below shows the impact on the consolidated financial statements of the change in the reporting entity as at July 31, 2017, the date from which the synaix group was first included in the consolidated financial statements.
Fair value € ‘000
Carrying amount € ‘000
Cash and cash equivalents 3,081 3,081
Trade accounts receivable 2,607 2,607
Other current financial assets 4 4
Prepaid expenses and other current assets 226 226
Current assets 5,918 5,918
Property, plant and equipment (tangible assets) 628 628
Intangible assets 25,134 31
Other financial assets 5 5
Other assets 54 54
Non-current assets 25,821 718
Total assets 31,739 6,636
Trade accounts payable 268 268
Other current financial liabilities 86 86
Provisions 152 152
Deferred income 17 17
Income tax liabilities 618 618
Other current liabilities 644 644
Current liabilities 1,785 1,785
Deferred taxes 8,148 0
Non-current liabilities 8,148 0
Total liabilities 9,933 1,785
Net assets acquired 21,806 4,851
NOTES TO THE CONSOLIDATED FINANCIAL STATEMENTS

73
The acquisition of the group of companies resulted in goodwill of € 38,185 thousand, which is not tax-deductible. The main reason for the acquisition itself and for recognizing goodwill was to expand CANCOM’s client base associated with IT-as-a-service and cloud and managed services, in addition to strengthening further the Group’s position as a digital transformation partner.
The sales revenues of synaix group included in the consolidated sales revenues since the acquisition date amount to € 6,361 thou-sand, and the profit included in the consolidated profit amounts to € 471 thousand.
On July 31, 2017, CANCOM SE signed a contract to take over selected portions of the company assets (the client list, orders in hand, and property, plant and equipment) and staff of forwerts GmbH through its subsidiary CANCOM GmbH with effect from August 8, 2017. A purchase price of € 330 thousand was paid.
Incidental acquisition costs amounting to € 12 thousand were incurred in connection with the asset deal; these are recognized in the statement of income under other operating expenses.
The following assets were acquired as part of the asset deal (including deferred taxes):
Fair value
€ ‘000
Carrying amount € ‘000
Property, plant and equipment (tangible assets) 23 23
Intangible assets 104 0
Deferred taxes resulting from temporary differences 34 0
Non-current liabilities 161 23
Total assets 161 23
Deferred taxes 30 0
Non-current liabilities 30 0
Total liabilities 30 0
Net assets acquired 131 23
This acquisition resulted in goodwill of € 198 thousand and intangible assets of € 104 thousand. The main reason for the acqui-sition itself and for the recognition of goodwill was to strengthen CANCOM’s expertise in the digitization of business processes – particularly in the Microsoft environment – in Stuttgart and the surrounding region in Germany’s south west.
On November 30, 2017, CANCOM SE signed a stock purchase and assignment agreement to buy all the shares (nominal value € 200,000) of c.a.r.u.s. Information Technology GmbH Hannover, based in Hanover, Germany. The purchase price was € 3,200 thousand.
Incidental acquisition costs of € 47 thousand were incurred in the fiscal year 2017; these are shown in the statement of income under other operating expenses.
c.a.r.u.s Informations Technology GmbH Hannover is a provider of integrated IT systems, specializing in IBM. At the date from which it was first consolidated, the company employed 11 people. In 2016 it generated sales revenues of around € 11 million.
The group is included in the consolidated accounts from November 30, 2017.
Changes in the reporting entity in 2017:
Name and registered office of company
Date from which first
included in the consolidated
financial statements
Stock- holding
(in percent)
Voting rights
(in percent)
c.a.r.u.s. Information Technology GmbH Hannover, Hanover, Germany
November 30, 2017 100 100
NOTES TO THE CONSOLIDATED FINANCIAL STATEMENTS

74
The table below shows the impact on the consolidated financial statements of the change in the reporting entity as at November 30, 2017, the date from which c.a.r.u.s Informations Technology GmbH Hannover was first included in the consolidated financial statements.
Fair value
€ ‘000
Carrying amount € ‘000
Cash and cash equivalents 1,569 1,569
Trade accounts receivable 637 637
Other current financial assets 173 173
Inventories 3,032 3,032
Prepaid expenses and other current assets 508 508
Current assets 5,919 5,919
Property, plant and equipment (tangible assets) 33 33
Intangible assets 1,255 10
Deferred taxes arising from temporary differences 1,911 1,911
Other assets 24 24
Non-current assets 3,223 1,978
Total assets 9,142 7,897
Trade accounts payable 4,063 4,063
Prepayments received 327 327
Provisions 88 88
Deferred income 33 33
Income tax liabilities 69 69
Other current liabilities 321 321
Other liabilities 4,901 4,901
Deferred income 44 44
Deferred taxes 2,338 1,932
Pension provisions 160 160
Non-current liabilities 2,542 2,136
Total liabilities 7,443 7,037
Net assets acquired 1,699 860
The acquisition resulted in goodwill of € 1,501 thousand, which is not tax-deductible. The main reason for the acquisition itself and for the recognition of goodwill was to strengthen CANCOM’s data center know-how and its expertise in SAP Hana, analytics, cloud solutions and IT infrastructure solutions in the north German region.
The sales revenues of c.a.r.u.s. Information Technology GmbH Hannover included in the consolidated sales revenues since the time of acquisition amount to € 5,029 thousand, and the profit included in the consolidated profit amount to € 13 thousand.
If the acquisition date for all the business combinations had been January 1, 2017, the sales revenues of the combined entity would have been approximately € 1,202,230 thousand and the net income for the fiscal year roughly € 43,932 thousand.
Company acquisitions in prior years:
The change during fiscal 2017 in the variable purchase price liability arising from the acquisition of HPM Inc. in 2014 is shown in the table below. The adjusted value is the result of a reclassifica-tion of the attainable EBITDA.
€ ‘000
As at January 1, 2017 3,112
Purchase price payments in 2017 -2,202
Reclassification -174
Currency -248
Discounting 12
As at December 31, 2017 500
Mergers in the fiscal year 2017
Verioplan GmbH was merged into CANCOM VVM GmbH. The merger is documented in a merger contract dated April 26, 2017 and was entered in the commercial register of CANCOM VVM GmbH on May 2, 2017.
Antauris-Aktiengesellschaft was merged into CANCOM GmbH. The merger is documented in a merger contract dated August 7, 2017 and was entered in the commercial register of CANCOM GmbH on September 1, 2017.
4. Adjustment of comparative information in the financial statements as of December 31, 2016
Changes in the cash flow statement
In the cash flow statement for the fiscal year 2016 the acquisition of non-controlling stakes with an amount of € 10,160 thousand was shown in the cash flow from investing activities. This amount was reclassified according to IAS 7.42A and shown in the the cash flow from financing activities.
NOTES TO THE CONSOLIDATED FINANCIAL STATEMENTS

75
5. Accounting and valuation policies
The basic accounting and valuation policies used to prepare the consolidated financial statements are explained below. The methods described were used consistently for the reporting periods shown, unless declared otherwise.
There has been no early adoption of standards that came into effect after the accounting date, so these standards have had no impact on the earnings, financial and assets position of the Group.
Preparation of the single-entity financial statements included in the consolidated statements
The financial statements of the German and non-German companies included in the consolidated financial statements were prepared as at the balance sheet date of CANCOM SE.
Principles of consolidation
The consolidated financial statements are based on the single-en-tity financial statements of the companies included in the financial statements of CANCOM SE.
NOTES TO THE CONSOLIDATED FINANCIAL STATEMENTS
CASH FLOW STATEMENT (ACC. IAS 7)
(in €‘000) 2016 After adjustment
Adjustment
2016 Before adjustment
Cash flow from ordinary activities
- Acquisition of subsidiaries and equity instruments of other companies -3,539 10,160 -13,699
+ Cash inflow from sale of formerly consolidated subsidiaries 200 0 200
- Acquisition of long-term financial assets -737 0 -737
- Acquisition of financial assets held-for-sale -88,000 0 -88,000
- Payments for additions to intangible assets and tangible assets -25,105 0 -25,105
+ Income from disposal of intangible, tangible and financial assets 1,770 0 1,770
- Cash transferred on the sale of shares -105 0 -105
+ Interest received 50 0 50
Net cash used in investing activities -115,466 10,160 -125,626
Cash flow from financing activities
+/- Income from the issue of subscribed capital 66,214 0 66,214
+/- Capital increase costs -1,429 0 -1,429
- Repayment of long-term debt (incl. short-term portion) -1,040 0 -1,040
+/- Changes in short-term financial liabilities 523 0 523
- Interest paid -822 0 -822
- Dividends paid -8,274 0 -8,274
+/- Receipts and payments for finance lease -452 0 -452
- Payments for the acquisition of non-controlling stakes in existing control situation -10,160 -10,160 0
Net cash used for financing activities 44,560 -10,160 54,720

76
The single-entity financial statements of the subsidiaries were included in the consolidated statements according to the acquisition method. Assets, liabilities and contingent liabilities identifiable within the scope of a business combination are valued at their acquisition-date fair value when they are first included in the consolidated accounts. The excess of the acquisition cost over the Group’s share in the fair value of the net assets is recognized as goodwill. In line with IFRS 3 Business Combinations, IAS 36 Impairment of Assets and IAS 38 Intangible Assets, goodwill is no longer subject to an amortization plan. Instead, an impairment test must be carried out at least once a year to establish whether downward revaluation is necessary. The reviews of goodwill based on market values are to be carried out at business unit (cash gener-ating unit) level. For the purposes of this rule, a business unit is an operating segment or one level below.
Profits, losses, revenues, expenses and income within the Group, and accounts payable and receivable between the Group compa-nies, are eliminated. Interests held by other stockholders are shown as a separate adjusting item under equity.
Estimates and assumptions
Discretionary decisions must be made when applying the accounting and valuation policies. The points below describe the most significant assumptions made about the future, and other major sources of uncertainty existing at the reporting date with regard to estimates. On account of these, there is a risk that an adjustment in the carrying amounts of assets and liabilities will be necessary within the next fiscal year:
• The fair values of assets and liabilities and the useful life of assets are calculated on the basis of assessment and forecasting by the management, as is the impairment of property, plant and equipment, intangible assets and financial assets.
• There are bad debt provisions in order to make allowances for doubtful accounts arising from clients’ inability or unwilling-ness to pay.
• Assumptions must also be made when calculating current and deferred taxes. The possibility of generating corresponding taxable income plays a particularly important role in assessing whether deferred tax assets can be used.
• The estimation of realizable profits plays an important role in the reporting and measurement of other provisions, especially in connection with variable purchase price components.
• In addition, the main estimated values in reporting and measu-ring pension provisions are discount factors, expected salary and pension trends, staff turnover and expected mortality.
• Assessment of the recoverable amount is based on assumptions made when impairment tests are being carried out (see Section C. 8.3.).
Where the above uncertainties regarding valuations exist, the best available knowledge given the circumstances at the balance sheet date is used. The actual amounts may differ from the estimates. The carrying amounts that are included in the financial state-ments and that are subject to these uncertainties can be found in the balance sheet and/or the corresponding explanations in the notes.
At the time of compilation of the consolidated financial state-ments, no material changes in the assumptions forming the basis of the reporting and valuation are to be expected. In this respect no noteworthy adjustments to the assumptions and estimates or the carrying amounts of the affected assets and liabilities in the fiscal year 2017 are currently expected.
Currency conversion principles
Foreign currency business transactions in the single-entity finan-cial statements of the companies are recognized at the exchange rate applicable at the time of the initial entry. Gains and losses from exchange rate fluctuations are recognized in net profit or loss. Conversion of the financial statements of international subsidiaries is carried out according to the concept of functional currency. Within the CANCOM Group, all international subsid-iaries are financially independent, and therefore the relevant national currency of the subsidiary is the functional currency. The assets, liabilities and equity are accordingly converted at the rate of exchange applicable on the reporting date, while income and expenditure are converted at the average rate for the year. Differences from the conversion rate on the reporting date in
NOTES TO THE CONSOLIDATED FINANCIAL STATEMENTS

77
the previous year and between the net income/(loss) for the year shown in the balance sheet and in the statement of income are recognized directly in equity and shown separately under other comprehensive income.
Currency 2017 2016 2015
U.S. dollars
Rate on reporting date 1 € = 1.1993 USD 1 € = 1.0541 USD 1 € = 1.0887 USD
Average rate 1 € = 1.1293 USD 1 € = 1.1066 USD 1 € = 1.1095 USD
Swiss francs
Rate on reporting date 1 € = 1.1702 SFR 1 € = 1.0739 SFR 1 € = 1.0835 SFR
Average rate 1 € = 1.1116 SFR 1 € = 1.0902 SFR 1 € = 1.0679 SFR
British pounds
Rate on reporting date 1 € = 0.8872 GBP 1 € = 0.8562 GBP 1 € = 0.7340 GBP
Average rate 1 € = 0.8765 GBP 1 € = 0.8189 GBP 1 € = 0.7258 GBP
A loss of € 77 thousand was recognized in the statement of income for currency translation differences. The currency translation differences shown in the financial statements for the fiscal year as a separate item under equity amount to minus € 1,805 thousand (2016: € 478 thousand). As at December 31, 2017, the reserve for currency translation amounts to minus € 236 thousand (2016: € 1,569 thousand).
Realization of income/sales revenues
Revenues from sales of hardware and software are realized when ownership and risk passes to the client, if payment is pre-arranged or determinable by contract and it is probable that the receivables relating to the sale will be recovered.
Sales revenues relating to the professional services segment are realized only after acceptance by the client, or installation, if this is an essential condition for the initial operation of the product. Sales revenues are shown less discounts, price reductions, client bonuses or rebates.
Service contracts in progress are recognized using the percentage of completion (POC) method in accordance with IAS 18 and IAS 11. The stage of completion is calculated from the ratio between the costs of the contract at the balance sheet date and the estimated total costs of the contract, unless this would distort the representation of the stage of completion. If the outcome of a contract can be estimated reliably, revenues and costs are recognized at the balance sheet date in proportion to this stage of completion. If the outcome of a contract cannot be reliably estimated, revenue is recognized only to the extent of the contract costs incurred that are likely to be recoverable. An explanation of the sales revenues calculated using the POC method can be found in section E.1.
Payments on an operating lease are recorded as expenses in the statement of income using the straight-line method over the term of the lease contract, unless another systematic fundamental corre-sponds more closely to the changes in the benefit to the company over the term. An operating lease is one in which not all major risks and opportunities are assigned to the lessee by the leasing contract. The company reviews all lease contracts at regular inter-vals to establish whether operating or finance lease terms apply.
In finance leases in which the company is the lessee, the leases are recognized in the balance sheet at the beginning of the term of the lease as assets and liabilities of equal value. They are measured at the fair value of the leased asset at the beginning of the term of the lease or at the present value of the minimum lease payments, if this is lower.
In finance leases in which the company is the lessor, the asset values of the lease are recognized in the balance sheet and presented as an account payable at the net investment value of the lease.
The rental agreement concluded for the premises in Erika-Mann-Strasse 69, in Munich, Germany, represents a major operating lease. The lease term ends in 2022. There is no purchase option, but there is an option to extend the lease.
NOTES TO THE CONSOLIDATED FINANCIAL STATEMENTS

78
As at December 31, 2017:
Leases in which the company is the lessor
Minimum lease
payments
Present value of
the minimum
lease payments
Minimum lease
payments
Present value of
the minimum
lease payments
Minimum lease
payments
Present value of
the minimum
lease payments
Financial income not yet realized
Total minimum
lease payments
< 1 year < 1 year > 1 < 5 years
> 1 < 5 years
> 5 years > 5 years
€ '000 € '000 € '000 € '000 € '000 € '000 € '000 € '000
Operating lease 0 0 0 0 0 0 0 0
Finance lease 5,631 5,234 8,205 7,883 0 0 719 13,836
Leases in which the company is lessee
Net carrying
amount at Dec. 31.,
2017
Minimum lease
payments
Present value of
the minimum
lease payments
Minimum lease
payments
Present value of
the minimum
lease payments
Minimum lease
payments
Present value of
the minimum
lease payments
Total subleases
Recogni-zed lease payments in 2017*
< 1 year < 1 year > 1 < 5 years
> 1 < 5 Jahre
> 5 years > 5 years
€ '000 € '000 € '000 € '000 € '000 € '000 € '000 € '000 € '000
Operating lease (operating segment) 0 10,303 0 19,624 0 6,702 0 0 9,515
Finance lease 949 451 431 522 518 0 0 973 0
*minimum lease payments only
As at December 31, 2016
Leases in which the company is the lessor
Minimum lease
payments
Present value of
the minimum
lease payments
Minimum lease
payments
Present value of
the minimum
lease payments
Minimum lease
payments
Present value of
the minimum
lease payments
Financial income not yet realized
Total minimum
lease payments
< 1 year < 1 year > 1 < 5 years
> 1 < 5 years
> 5 years > 5 years
€ '000 € '000 € '000 € '000 € '000 € '000 € '000 € '000
Operating lease 6 0 0 0 0 0 0 6
Finance lease 6,417 5,632 10,338 10,099 0 0 1,023 16,755
Leases in which the company is lessee
Net carrying
amount at Dec. 31.,
2016
Minimum lease
payments
Present value of
the minimum
lease payments
Minimum lease
payments
Present value of
the minimum
lease payments
Minimum lease
payments
Present value of
the minimum
lease payments
Total subleases
Recogni-zed lease payments in 2016*
< 1 year < 1 year > 1 < 5 years
> 1 < 5 Jahre
> 5 years > 5 years
€ '000 € '000 € '000 € '000 € '000 € '000 € '000 € '000 € '000
Operating lease (operating segment) 0 8,497 0 14,287 0 4,021 0 0 9,259
Finance lease 516 317 300 222 216 0 0 539 0
*minimum lease payments only
NOTES TO THE CONSOLIDATED FINANCIAL STATEMENTS
79
There are generally no options to extend or purchase with the above lease agreements. Apart from the lease contract for Erika-Mann-Strasse 69 in Munich, Germany, for which the rent payments are linked to the national consumer price index, there are no adjustment clauses. There are incidental costs in relation to this rental agreement, but there are no other restrictions in relation to the lease agreements that would affect dividends, addi-tional liabilities or other lease agreements.
Interest income is accrued under the relevant period, taking into account the outstanding loan amount and the applicable interest rate. The applicable interest rate is the interest rate that discounts the anticipated future cash inflows over the life of the financial asset with regard to the carrying amount of the asset. Dividend income from financial investments is recognized as soon as a shareholder becomes entitled to a dividend.
Earnings per share
Earnings per share are measured in accordance with IAS 33 Earnings per Share. The basic earnings per share are calculated by dividing the consolidated earnings less non-controlling interests by the weighted average number of common shares outstanding in the fiscal year. For details on how the earnings per share are calculated, please see under ‘statement of income’.
Current assets
Inventories are valued at the lower of cost and net realizable value in accordance with IAS 2.9. Cost includes direct materials costs and, where applicable, direct production costs as well as any over-heads incurred in bringing the inventories to their current location and condition. It is calculated according to the weighted average method and measured item-by-item according to the lower of cost or market principle. The net realizable value is the estimated selling price less all estimated costs up to completion and the cost of marketing, sales and distribution. Items with reduced market-ability are valued at the lower net realizable value.
Where necessary, write-downs are made for excess inventory, obsolescence or reduced marketability.
Any borrowed capital costs associated with manufacturing are capitalized.
Contracts in progress are valued by the percentage of completion method, in which revenue and costs are recognized in proportion to the stage of completion of contract activity, in accordance with IAS 18 and IAS 11.
Accounts receivable are shown at their net sales proceeds value, allowing for a write-down for receivables that may not be recov-erable. Where the agreed interest rate for long-term receivables is less than the market rate, the nominal amount of the receivable is discounted. Trade receivables are not discounted. If a receivable is unlikely to be recoverable, the amount is written down.
Other assets are shown at their nominal values, less specific allow-ances for bad debts, if necessary.
Cash and cash equivalents include cash in banks and cash on hand, and cash deposits that are not subject to any considerable value fluctuation and can be turned into cash within a period of maximum three months.Prepaid expenses are accrued to charge expenses to their relevant accounting period, and are measured at their nominal value.
Property, plant and equipment
Property, plant and equipment are carried at cost less depreciation in accordance with IAS 16. They are depreciated over their useful lives using the straight-line method and valued on the basis of the following useful lives:
Buildings on third-party land 50 yearsOperating and office equipment 3 to 14 years
Cost includes expenditure directly attributable to acquisition. Subsequent costs are only recorded as part of the asset costs or – where relevant – as separate assets if it is probable that the Group will obtain economic benefit from them in the future and the asset costs can be reliably determined. All other repair and maintenance costs are recorded as expense in the fiscal year in which they occur. The carrying amounts and useful lives are reviewed at every balance sheet date and adjusted where necessary. Low-value assets with costs of € 150 or less are written off in full as operating expenses in the year of their acquisition.
NOTES TO THE CONSOLIDATED FINANCIAL STATEMENTS

80
Asset values are written down when there is expected to be perma-nent impairment as a consequence of changed circumstances. At each balance sheet date assets are reviewed to look for any indica-tion of impairment. If such indications are present, the company makes an estimate of the recoverable amount for the relevant asset. The recoverable amount is the higher of the value in use of the asset and the fair value less costs to sell. To calculate the value in use, the estimated future cash flows are discounted to their present value, taking as a basis a discount rate before tax which reflects the current market expectations in terms of the interest effect and the specific risks of the asset. If the fair value cannot be calculated reliably, the value in use of the asset is taken as the recoverable amount. If the carrying amount of an asset exceeds its recoverable amount, the asset is considered to be impaired and written down to its recoverable amount. If necessary, the impair-ment charges are included in a separate expense item.
The need for partial or complete write-up is reviewed as soon as there are indications that the reasons for the depreciation carried out in the preceding fiscal years because of impairment no longer exist.
A previously determined impairment charge must be derecog-nized if there has since been a change in the estimates used as a basis for calculating the recoverable amount. If this is the case, the carrying amount of the asset must be increased to its recoverable amount. This increased carrying amount must not exceed the carrying amount that would result after taking into consideration the depreciation if no impairment charge had been recorded in the earlier years. Such a write-up is immediately included in the result of the fiscal year. Once a write-up has been carried out, the provi-sion for depreciation in future reporting periods is adjusted in order to distribute the adjusted carrying amount of the asset, less any residual carrying amount, systematically over its remaining useful life. There were no impairments in the year under review.
Intangible assets
In line with IAS 38, intangible assets acquired are recognized at cost and the estimated residual carrying amount is written down using the straight-line method over the expected useful life of the assets. Assets are written down uniformly throughout the Group using the straight-line method over the period in which the relevant company expects to benefit from the asset (generally over a useful life of 3 to 12 years). Client lists and orders in hand are written down over the respectively assumed contract term. Goodwill from acquisitions is not amortized according to plan. Instead, it is subject to an impairment test at least once a year (in line with IFRS 3 and IAS 36). IAS 38 distinguishes between intangible assets with finite lives and those with indefinite lives. Only intangible assets with finite lives are amortized according to plan, in contrast to intangible assets with indefinite lives. These are assessed for impairment at least once a year in accordance with IAS 36. With the exception of goodwill, all intangible assets have finite lives.
The costs of development activities are capitalized if the develop-ment costs can be calculated reliably, the product or the process is technically and economically realizable and future economic benefit is probable. The company must also have the intention and sufficient resources to conclude the development and to use or sell the asset.
Goodwill and first inclusion of acquired companies in the Group financial statements
Group companies are included in the consolidated financial state-ments by the acquisition method. Under this method the acquired company’s assets, liabilities and contingent liabilities identified according to IFRS 3 are valued at their acquisition-date fair value, and the costs of the acquirer are balanced against these (purchase price allocation). The interests in the fair values of assets and liabilities not acquired are shown as non-controlling interests.
Any excess of the acquisition costs over the value of the acquired equity is capitalized as goodwill and subsequently subjected to a regular annual impairment test at the end of each fiscal year. In line with IAS 36, goodwill is tested for impairment at reporting unit (cash generating unit) level, following segment reporting. In this process, the carrying amounts of cash generating units are compared with the recoverable amount. The recoverable amount is the higher of fair value less costs to sell and the unit’s value in use.
NOTES TO THE CONSOLIDATED FINANCIAL STATEMENTS

81
Financial assets accounted for by the equity method
Companies on whose business and financial policies CANCOM can exercise a significant but non-controlling influence (associates) are included in the consolidated financial statements using the equity method, and initially valued at their acquisition cost. The acquisition costs in excess of CANCOM’s share of the net assets of the associate are adjusted in line with the fair value, and the remaining amount is recognized as goodwill. The good-will resulting from the acquisition of an associated company is included in the carrying amount of the associate and is not amortized according to plan, but is tested for impairment as a component of the overall investment in the associate. CANCOM’s share in the profit or loss of the associate after acquisition is recog-nized in the consolidated statement of income; its share in changes in equity that has not been included in profit or loss is recognized directly in the consolidated equity. The cumulative changes after the acquisition date increase or reduce the carrying amount of the long-term equity investment in the associate.
If CANCOM’s share in the losses of an associate equals or exceeds the value of its interest in this company, its share of further losses is not recognized, unless liabilities have been incurred or payments have been made for the associate. The interest in the associate is the carrying amount of the investment along with all long-term interests that, in substance, form part of the investor’s net investment in the associate. Profits or losses from business transactions between CANCOM and its associates are eliminated according to CANCOM’s interest in the associate. On each reporting date, CANCOM tests whether there are objective indications of impairment of its interest in the associate. If there are such indications, CANCOM calculates the necessary write-down from the difference between the realizable amount and the carrying amount of the associate.
Financial assets
The Group’s financial assets mainly comprise long-term securities, cash and cash equivalents, trade accounts receivable, receivables relating to finance leases, derivative assets, and other financial assets.
Classification and valuation Financial assets (all contracts that lead to the recognition of a financial asset by one company and to the recognition of a finan-cial liability or an equity instrument by another company) are clas-sified in the following categories in accordance with IAS 39:
• financial assets at fair value through profit or loss;• held-to-maturity investments;• loans and receivables; • available-for-sale financial assets.
The classification depends on the purpose for which the financial assets were acquired. Management determines the classification of the financial assets on initial recognition, and reviews the classi-fication at each reporting date.
1. Financial assets at fair value through profit or loss
This category has two subcategories:
• financial assets classified from the start as held for trading;• any financial asset designated on initial recognition as one to be
measured at fair value through profit or loss.
A financial asset is allocated to this category if it was acquired principally with a view to selling it in the short term, or it has been designated as such by management. Assets in this category are disclosed as current assets if they are either held for trading or are expected to be realized within the 12 months following the reporting date.
NOTES TO THE CONSOLIDATED FINANCIAL STATEMENTS

82
Derivative financial assets are measured at fair value. Changes in the value of derivative instruments not designated as hedging instruments are measured at fair value through profit or loss. If the derivatives are included in a cash flow hedge, the fair value adjustments are recognized directly in equity inclusive of deferred taxes.
Where derivative financial instruments are included in fair value hedges, the carrying amount of the hedged underlying item is adjusted for the gain or loss from the derivative corresponding to the hedged risk.
2. Loans and receivables
The loans and receivables comprise non-derivative financial assets with fixed or determinable payments that are not quoted on an active market, other than those held for trading in the near term, and those that management has designated as at fair value through profit or loss. Loans and receivables arise if the Group provides money, goods or services directly to a debtor without the intention of selling on the receivables. They are allocated to current assets if the maturity date of the loans and receivables is not more than 12 months after the reporting date. Loans and receivables with longer maturities are presented as non-current assets. Loans and receivables are included in the balance sheet under accounts receivable and other assets.
3. Held-to-maturity investments
Held-to-maturity investments are non-derivative financial assets with fixed or determinable payments and a fixed life, which management has the intention and the ability to hold to matu-rity. They do not include investments that are designated for accounting at fair value, held for trading or classified as loans and receivables.
4. Available-for-sale financial assets
Available-for-sale financial assets are non-derivative financial assets that are classified as available for sale and that are not included in any of the other categories. They are allocated to non-current assets provided that management does not intend to sell them within 12 months after the reporting date.
On initial recognition, financial assets are measured at fair value including transaction costs. A financial asset is derecognized when the rights to payments from the investment have expired or been transferred and the Group has transferred substantially all the risks and rewards of ownership.
Available-for-sale financial assets designated as financial assets at fair value through profit or loss are measured at fair value subse-quent to initial recognition. Loans and receivables and held-to-ma-turity investments are measured at amortized cost using the effective interest method.
Realized and unrealized gains and losses from a change in the fair value of assets designated as financial assets at fair value through profit or loss are recognized in the statement of income in the period in which they arise. Unrealized gains and losses from changes in the fair value of non-monetary securities classified as available-for-sale financial assets are recognized in other compre-hensive income. When securities categorized as available-for-sale financial assets are sold or impaired, the changes in fair value combined in the other comprehensive income are recognized in the statement of income as profits or losses from financial assets.
The fair values of financial assets quoted on an active market are measured at the current bid price. If there is no active market for the financial assets, or they are unquoted securities, the fair value is calculated by means of an appropriate valuation method. The methods include reference to recent transactions between knowledgeable business partners, the use of current market prices for other comparable assets, discounted cash flow analysis and, if applicable, special option pricing models.
NOTES TO THE CONSOLIDATED FINANCIAL STATEMENTS

83
Impairment of financial assets
Financial assets, with the exception of those measured at fair value through profit or loss, are examined at each reporting date for possible impairment. Financial assets are considered to be impaired if, as a result of one or more events occurring since the initial recognition of the asset, there is objective evidence that the expected future cash flows from the financial instrument have decreased.
In the case of equity instruments classified as available-for-sale financial assets, any significant or permanent decline in the fair value below acquisition costs is taken into consideration in deter-mining the extent to which the equity instruments are impaired.
For all other financial assets, objective evidence of impairment includes the following:
• significant financial difficulty of the counterparty;• payment defaults or delays extending beyond the average loan
term of the borrower;• a default or delinquency in interest or principal payments;• increased probability that the borrower will enter bankruptcy or
other financial reorganization.
For financial assets valued at amortized cost, the impairment loss is the difference between the carrying amount of the asset and the present value of expected future cash flows discounted at the financial asset’s original effective interest rate.
An impairment results in a direct reduction in the carrying amount of the financial asset concerned, with the exception of trade accounts receivable, whose carrying amounts are reduced by an allowance for doubtful accounts. If an impaired trade account receivable is deemed to be uncollectible, it is written off by debiting the allowance for doubtful accounts. Subsequent recov-eries of amounts recognized as impairments are also posted to the allowance for doubtful accounts.
If a financial asset designated as available for sale is considered impaired, the gains and losses previously recognized in other comprehensive income are reclassified to the consolidated state-ment of income in the period.
If the amount of the impairment loss relating to a financial asset valued at amortized cost decreases in a subsequent fiscal year and the decrease can objectively be attributed to an event occurring after the impairment was recognized, the impairment loss previ-ously recognized is reversed through profit or loss. However, such a reversal must not exceed what the amortized cost would have been if the impairment had not been recognized.
In the case of available-for-sale equity instruments, impairments recognized in the statement of income in the past are not reversed through profit or loss. Each increase in the fair value is recognized in other comprehensive income after an impairment loss is recog-nized and accumulated in the revaluation reserve.
Reversals of impairment losses for available-for-sale debt instru-ments are recognized in the statement of income if an increase in the fair value of the instrument is due to an event that occurred after the impairment loss was recognized.
Derecognition of financial assets
The Group derecognizes a financial asset only if the contractual rights to receive the cash flows from the financial asset expire or the asset is transferred to a third party along with substantially all the risks and rewards of ownership of the financial asset.
If the Group neither transfers nor retains substantially all the risks and rewards of ownership, but continues to have the right of control of the transferred asset, it continues to recognize the asset to the extent to which it has a continuing involvement in the asset, along with a liability of the amount that may have to be paid. If the Group retains substantially all the risks and rewards of ownership of a transferred financial asset, the Group continues to recognize the financial asset and a financial liability.
If a financial asset is derecognized in full, the difference between the carrying amount and the sum of the price received or due to be received and all the accumulated gains or losses that have been recognized in other comprehensive income and accrued in equity is recognized in the consolidated statement of income.
NOTES TO THE CONSOLIDATED FINANCIAL STATEMENTS

84
If a financial asset is not derecognized in full – for instance, if the Group retains an option to buy back a portion of the transferred asset – the Group splits the former carrying amount of the finan-cial asset between the portion that the Group continues to recog-nize to the extent of its continuing involvement in the asset and the portion that it no longer recognizes, on the basis of the relative fair values of these portions on the date on which the asset was transferred. The difference between the carrying amount allocated to the portion no longer recognized and the sum of the remuner-ation received for the portion no longer recognized and all accu-mulated gains or losses allocated to it that have been recognized in other comprehensive income, is recognized in the consolidated statement of income. Any accumulated gain or loss that has been recognized in other comprehensive income is divided up between the portion that continues to be recognized and the portion no longer recognized on the basis of the relative fair values.
Financial derivatives
The Group uses financial derivatives as a means of controlling its foreign exchange risk. The derivatives used are mainly currency futures.
Derivatives are initially recognized at their fair value at the time the contract was entered into and subsequently measured at fair value at each reporting date. The gain or loss resulting from the measurement is recognized immediately in the statement of income unless the derivative is designated as a hedging instru-ment in an effective hedging relationship.
Derivatives embedded in non-derivative host contracts are treated as standalone derivatives if
• they meet the definition of a derivative;• their economic characteristics and risks are not closely related to
the host contract;• the entire contract is not measured at fair value with changes in
fair value recognized in the statement of income.
Fair value measurement
The Group measures certain financial instruments (e.g. deriv-atives) at fair value at each reporting date. The fair value is the price that would be received or paid for the sale of an asset or the transfer of a liability in an orderly transaction between market participants at the measurement date. In measuring the fair value it is assumed that the transaction to sell the asset or transfer the liability takes place either
• in the principal market for the asset or the liability; or• in the absence of a principal market, in the most advantageous
market for the asset or the liability.
The Group must have access to the principal market or the most advantageous market.
The fair value of an asset or a liability is measured according to the assumptions on which the market participants would base the pricing of the asset or the liability. It is assumed that the market participants are acting in their own economic best interests.
The measurement of the fair value of a non-financial asset takes into account the ability of the market participant to generate economic benefit from the highest and best use of the asset or by selling it to another market participant, who finds the highest and best use for the asset.
The Group uses measurement techniques that are appropriate under the relevant circumstances and for which sufficient data is available for measurement of the fair value. Both observable and unobservable inputs are used.
All assets or liabilities that are measured at fair value or whose fair value is stated in the financial statements, are classified in the following fair value hierarchy on the basis of the lowest-level input parameter that is significant to the entire fair value measurement:
NOTES TO THE CONSOLIDATED FINANCIAL STATEMENTS

85
level 1 - quoted (unadjusted) prices in active markets for identical assets or liabilities;
level 2 - method of measurement in which the input of the lowest level that is significant to the entire fair value measure-ment is observable in the market, either directly or indirectly;
level 3 - method of measurement in which the input of the lowest level that is significant to the entire fair value measure-ment is not observable in the market.
For assets and liabilities recorded in the financial statements on a recurring basis, the Group decides whether any changes in the groupings between the levels of the hierarchy have taken place by reviewing the classification at the end of each reporting period (based on the input of the lowest level that is significant to the entire fair value measurement).
The staff responsible for the Group accounting process and the Executive Board together set guidelines and procedures for recur-ring and non-recurring fair value measurement.
To fulfill the disclosure requirements with regard to fair values, the Group has defined groups of assets and liabilities on the basis of their nature, characteristics and risks, and the levels of the fair value hierarchy explained above.
Financial liabilities
The financial liabilities comprise loans, trade accounts payable and subordinated loans, finance lease liabilities, purchase price liabili-ties from company acquisitions, liabilities from convertible bonds, and other financial liabilities.
Financial liabilities are initially recognized at fair value; financial liabilities not measured at fair value through profit or loss also include transaction costs directly attributable to the liability.
In subsequent periods, financial liabilities are measured at amor-tized cost, with the exception of purchase price liabilities arising from company acquisitions, which are measured at fair value.
Current financial liabilities (i.e. liabilities expected to be paid off within 12 months after the reporting date) are recognized at the repayment amount. Subsequent to initial recognition, non-current liabilities and financial liabilities are accounted for at amortized cost by the effective interest rate method. Finance lease liabilities are disclosed at the present value of the minimum lease payments.
The fair values of financial assets quoted on an active market are measured at the current bid price. If there is no active market for the financial assets, or there are unquoted securities, the fair value is calculated by means of an appropriate valuation method. The methods include reference to recent transactions between knowledgeable business partners, the use of current market prices for other comparable liabilities, discounted cash flow analysis and, if applicable, special option pricing models.
According to the definition of equity in IAS 32, from the point of view of the Group a financial instrument is an equity instrument only if it includes no contractual obligation to repay the capital or deliver other financial assets. Repayment obligations from the corporate assets can exist if (non-controlling) stockholders have a termination right and at the same time the exercising of this right is a basis for a claim for compensation against the company. Such capital provided by non-controlling stockholders is also disclosed as a liability if, according to the principles of German commercial law, it is classed as equity. The claims for compensation are accounted for at fair value.
Government grants
Government grants are recognized in the balance sheet as defer-rals and recognized in profit or loss on a systematic and rational basis over the term of the grant.
NOTES TO THE CONSOLIDATED FINANCIAL STATEMENTS

86
Grants paid as compensation for expenses or losses already incurred or for the purpose of giving immediate financial support with no related future costs are recognized in the consolidated statement of income in the period in which they become receivable.
The benefit of a government loan at a below-market interest rate is treated as a government grant and measured as the difference between the payments received and the fair value of the loan at the market rate of interest.
Deferred taxes
Deferred taxes are included for the differences between the carrying amount of the assets and liabilities in the consolidated financial statements and the corresponding tax recognition in the calculation of taxable income, and are added to the balance sheet according to the asset and liability method. Deferred tax liabilities are included in the balance sheet for all assessable temporary differences. Deferred tax assets are included if it is likely that assessable profits are available for which the deductible temporary differences can be used. Deferred taxes are not recognized if the temporary differences are the result of goodwill.
The carrying amount of the deferred tax assets is checked each year at the reporting date and lowered if it is no longer likely that there is sufficient taxable income available to realize the claim.
Deferred taxes are calculated on the basis of the tax rates expected to apply at the time of the fulfilment of the liability or the reali-zation of the asset. The valuation of deferred tax claims and tax liabilities reflects the tax consequences that would arise from the way in which the Group expects to fulfil the liability or realize the asset at the balance sheet date.
Deferred tax claims and tax liabilities are balanced when there is an enforceable right to set off current tax claims with current tax liabilities, and when they are associated with income taxes which are levied by the same tax authority.
Provisions and liabilities
Provisions for employee benefits mainly include perfor-mance-based pension obligations, which are determined on the basis of actuarial reports using the projected unit credit method and taking into account future increases in salary and pensions. Under defined contribution pension schemes, provisions are only made for the value of contributions still outstanding at the reporting date. In the event of any unforeseen changes in pension obligations or plan assets, there may be actuarial gains or losses which are not recognized in the statement of income. The version of IAS 19 effective from 2013 is mandatorily effective for the fiscal year 2017, so the only effective method is now the other compre-hensive income (OCI) method. This means actuarial gains and losses are recognized directly in equity.
Under IFRS, the cost components are service cost, net interest and remeasurements. Service cost and net interest are recognized as expenses in profit or loss. These represent the pension expense. Remeasurements are recognized directly in equity.
Other provisions are made where there is an uncertain current obligation arising from an event that occurred in the past with a legal or factual cause, which is expected to be claimed and which can be reliably quantified.
The obligation is valued on the basis of best estimate, taking into account unit costs and overheads. General administrative, distribu-tion and development costs are not taken into account.
Liabilities are recognized at their repayment value, which is equiv-alent to the current market value.
Utilized overdraft facilities are shown in the balance sheet as short-term loans under non-current financial liabilities.
NOTES TO THE CONSOLIDATED FINANCIAL STATEMENTS

87
B. Details of financial instruments
Classification of financial instruments
Financial assets and financial liabilities are grouped into different classes of financial instruments, in line with IAS 39 and IFRS 7. The categories are also presented in aggregated form.
NOTES TO THE CONSOLIDATED FINANCIAL STATEMENTS
Category in line with IAS 39 and
IFRS 7
Carrying amount Dec. 31, 2017
Fair value Dec. 31, 2017
Carrying amount Dec. 31, 2016
Fair value Dec. 31, 2016
Assets
Cash and cash equivalents LaR 157,619 157,619 63,590 63,590
Fixed-term deposits (short term) LaR 12,000 12,000 86,000 86,000
Long-term securities AfS 5,321 5,321 795 795
Trade accounts receivable LaR 223,672 223,672 182,433 182,433
Lease receivables LaR 13,118 13,399 15,732 17,233
Other financial assets LaR 10,912 10,912 9,761 9,761
Derivatives FApl 194 194 0 0
Liabilities
Short-term loans and current portion of long-term loans
FLAC 3,804 3,804 1,922 1,922
Subordinated loans (current portion) FLAC 1,953 1,953 633 633
Trade accounts payable FLAC 220,956 220,956 127,047 127,047
Long-term loans FLAC 1,315 1,470 2,081 2,343
Convertible bonds - liability component FLAC 0 0 41,778 46,066
Subordinated loans FLAC 3,092 4,323 4,457 6,350
Lease payables FLAC 949 949 516 516
Contingent purchase price liabilities FLpl 6,492 6,492 3,358 3,358
Other financial liabilities FLAC 5,982 5,982 6,541 6,541
of which aggregated according to categories in line with IAS 39:
Financial assets at fair value through profit or loss (FApl) 194 194 0 0
Loans and receivables (LaR) 417,321 417,602 357,516 359,017
Held-to-maturity investments (HtM) 0 0 0 0
Available-for-sale financial assets (AfS) 5,321 5,321 795 795
Financial assets held for trading (FAHfT) 0 0 0 0
Financial liabilities measured at amortised cost (FLAC) 238,051 239,437 184,975 191,418
Financial liabilities held for trading (FLHfT) 0 0 0 0
Financial liabilities at fair value through profit or loss (FLpl) 6,492 6,492 3,358 3,358

88
Cash and cash equivalents, trade accounts receivable and other financial assets mainly have short remaining terms. Their carrying amounts at the balance sheet date are therefore roughly equivalent to their fair value.
Similarly, trade accounts payable, short-term loans and other financial liabilities frequently have short remaining terms. The amounts accounted for are approximately equal to the fair values.
Financial liabilities measured at amortized cost and loans and receivables with a remaining term of more than one year are measured using the effective interest rate method. The effective interest rate is the interest rate that discounts the estimated future payments (including all fees and charges that are part of the effective interest rate, transaction costs, and other premiums and discounts) over the expected life of the debt instrument, or a shorter period where applicable, to their net carrying amounts at the time of their first inclusion in the financial statements.
Financial assets classified as available for sale are not payable at term, are not held for commercial purposes and are available for sale at any time.
Financial derivatives for which there is no hedge relationship are recognized at their fair value in the statement of income in the category of ‘at fair value through profit or loss’. The net gains and losses are calculated by comparing the fair values.
The convertible bond constitutes a compound financial instrument that contains both a liability component and an equity component. The option of conversion into stocks constitutes an embedded derivative. The fair values of the liability and equity components are interdependent.
The net gains/losses are as follows:
2017€ ‘000
2016€ ‘000
Loans and receivables (LaR) 455 36
Financial assets and liabilities at fair value through profit or loss 360 940
Available-for-sale financial assets 16 1
of which: recognized in other comprehensive income -2 0
Financial liabilities measured at amortized cost -1,879 -2,248
The net gains/losses comprise interest expenses, interest income, write-downs and reversals of such write-downs, and measurement gains or losses on financial instruments accounted for at fair value through profit and loss.
Using the effective interest rate method to measure financial liabilities not recognized at their fair value gives rise to an interest expense of € 1,197 thousand (2016: € 1,820 thousand), which is recognized in the statement of income. This relates to the FLAC category.
Interest income of € 605 thousand was produced by the interest accrued on financial assets according to the effective interest rate method (2016: € 589 thousand).
NOTES TO THE CONSOLIDATED FINANCIAL STATEMENTS

89
The following table shows by hierarchical levels the fair values of financial assets and financial liabilities that are either measured at fair value or for which a fair value is stated because it deviates from the carrying amount:
NOTES TO THE CONSOLIDATED FINANCIAL STATEMENTS
December 31, 2017 Class of financial instrument
Prices at which listed on active
markets (level 1) € ‘000
Main observable input parameters
(level 2) € ‘000
Main unobservable input parameters
(level 3) € ‘000
Total € ‘000
Financial assets
Long-term securities 5,321 - - 5,321
Lease receivables - 13,399 - 13,399
Currency futures - 194 - 194
Financial liabilities
Long-term loans - fixed interest rate - 1,470 - 1,470
Convertible bonds - liability component - - - 0
Subordinated loans - 4,323 - 4,323
Lease payables - 949 - 949
Contingent purchase price liabilities - - 6,492 6,492
December 31, 2016 Class of financial instrument
Prices at which listed on active
markets (level 1) € ‘000
Main observable input parameters
(level 2) € ‘000
Main unobservable input parameters
(level 3) € ‘000
Total € ‘000
Financial assets
Long-term securities 795 - - 795
Lease receivables - 17,233 - 17,233
Currency futures - - -
Financial liabilities
Long-term loans - fixed interest rate - 2,343 - 2,343
Convertible bonds - liability component - 46,066 - 46,066
Subordinated loans - 6,350 - 6,350
Lease payables - 516 - 516
Contingent purchase price liabilities - - 3,358 3,358

90
The fair values of the securities are equal to the quantities multi-plied by the price quotes on the reporting date.
The fair value of currency futures is determined using the discounted cash flow method. Future cash flows are estimated on the basis of forward exchange rates (observable rates on the reporting date) and the contracted forward rate, discounted at an interest rate that takes into account the different counterparty risks.
The fair values of lease receivables and payables, long-term loans, the liability component of the convertible bond and subordinated loans are measured as the present values of the expected cash flows from the assets and liabilities and on the basis of the market interest rates of comparable financial instruments.
The valuation model for determining the fair value of the contin-gent purchase price liability takes into account the present value of the expected payment, discounted at a risk-adjusted discount rate. The expected payment is calculated on the basis of the forecast revenues and the EBITDA on the assumption that average growth in revenues would be 12.1 percent and the EBITDA margin average 57.6 percent. The discount rate is 0.04 percent. The estimated fair value would rise (fall) if:
• the annual growth rate in revenues were higher (lower);• the EBITDA margin were higher (lower); or• the risk-adjusted discount rate were lower (higher).
A change in the annual revenue growth rate is generally associated with a change in the EBITDA margin in the same direction.
Risk management
CANCOM’s risk policy is geared towards the early identification of severe or serious corporate risks that could endanger the future of the company as a going concern, and aims to handle them in a responsible manner. To define an adequate system of risk controlling and ensure it can be applied, the Executive Board has drawn up a risk policy and appointed a central risk officer who regularly monitors, measures and controls any risks that may emerge.
As part of CANCOM’s risk analysis procedure, risks are regularly classified and valued according to the probability of their occur-rence and their severity, and the information is then arranged in a risk matrix. All these risks become the responsibility of a special appointee. If the risks are quantifiable, they are measured with the aid of appropriately defined key figures. If no precisely defined ratios are available, the risks are assessed by the special appointee.
For risks to the company as a going concern, the system for early identification of risks includes the definition of early warning indicators. Changes or trends in these are continually monitored and discussed in risk management meetings. The regular risk management meetings between the Executive Board and the risk officer ensure the sustained and timely control of present and future risks.
Liquidity risk
CANCOM’s exposure to liquidity risks is limited due to its strong equity position and the long-term nature of borrowed funds. For a number of years CANCOM has been using a liquidity management system with daily monitoring of the changes in liquidity and assessment of the liquidity risks, with both short-term and long-term liquidity planning.
CANCOM has maintained a sufficient level of net liquidity through retention of profits and capital increases. In addition, short-term liquidity is guaranteed at all times by credit facilities and factoring agreements. Long-term liquidity is safeguarded through long-term bank loans and ample equity. Loans have been significantly reduced and they are almost all long-term at the balance sheet date.
NOTES TO THE CONSOLIDATED FINANCIAL STATEMENTS

91
Early refinancing of financial liabilities minimizes the liquidity risk. The table below was derived from the balance sheet and the contractual bases in addition to other lease contract records, and shows the maturities:
2018
€ ‘000
2019
€ ‘000
2020-2022
€ ‘000
2023 and thereafter
€ ‘000
Trade accounts payable 220,997 0 0 0
Liabilities to banks 3,843 783 560 0
Convertible bonds 0 0 0 0
Subordinated loans 2,441 2,043 1,446 0
Lease payables 451 265 257 0
Contingent purchase price liabilities 2,160 400 3,440 0
Other financial liabilities 5,847 265 86 29
Other financial obligations 10,303 6,677 12,947 6,702
Interest expense 245 131 44 0
The Group has access to credit facilities with banks. As at December 31, 2017, the Group had credit and guarantee facilities of € 87,421 thousand (2016: € 37,521 thousand). The full amount not yet utilized as at the balance sheet date is € 82,786 thousand (2016: € 31,818 thousand). There were no delays in the payment of interest or capital on loans during the fiscal year 2017.
Currency risk
As CANCOM concentrates its activities in the euro area, the Group’s exposure to currency risk is low. The units whose accounts are kept in other currencies than the euro account for less than 10 percent in total of the Group’s equity and the profit for the period.
CANCOM does not engage in currency speculation and has an ongoing currency management policy. This involves hedging against any foreign exchange risks that may arise from orders. The operating units are not allowed to take out loans or make investments in foreign currencies for speculative purposes. For funding or investments within the Group, preference is given to use of the functional currency or a currency-hedged transactions. The use of hedging transactions is permitted only to specific individuals and within specific orders of magnitude subject to authorization. Transactions exceeding the relevant limits must be authorized by the Executive Board.
At December 31, 2017, the carrying amount of the Group’s mone-tary assets and liabilities in foreign currencies was as follows:
€ ‘000 Dec. 31, 2017 Dec. 31, 2016
Assets in USD 31,710 31,222
Liabilities in USD 9,518 13,043
22,192 18,179
Assets in CHF 0 0
Liabilities in CHF 0 0
0 0
Assets in GBP 6 6
Liabilities in GBP 0 0
6 6
Currency risks did not result in any significant concentration of risks arising from financial instruments in the fiscal year 2017.
Currency risks arise particularly when there are, or will be, receivables, liabilities, cash and cash equivalents, and planned transactions in a currency other than the domestic currency of the company.
In an analysis of the foreign exchange risk, the scenario technique was used to find out to what extent significant fluctuations in the value (increases or decreases of 5 percent in the exchange rate) of the relevant currencies have an impact on CANCOM’s business performance. The finding was that the net income for the period would decrease by € 81 thousand and the equity would decline by approximately € 313 thousand.Both effects are negligible in the overall context and thus do not necessitate any further measures.
NOTES TO THE CONSOLIDATED FINANCIAL STATEMENTS

92
Interest risk
Due to the mainly long-term nature of its funding, CANCOM is not exposed to any serious interest rate risks. In the past, fluctu-ations in interest rates have had only minimal effects on the net income for the year, as existing loan agreements are predomi-nantly at fixed rates. CANCOM’s strong equity position ensures that the Group can obtain favorable loan conditions.
There is a risk management system in place to optimize interest risks. This involves continually observing market interest rates and the rates paid by the Group, and also maintaining constant contact with banks. Master loan agreements provide for interest rates to be adjusted. Concrete plans for interest hedges only exist in the case of heavy fluctuation.
Default risk
There is a credit risk for CANCOM in that the value of the assets could be impaired if transaction partners do not comply with their obligations. To minimize the credit risks, deals are concluded only subject to predetermined risk limits.
The default risks are the prevailing market risks. These are allowed for by appropriate provisions. Owing to the Group’s client structure, there is no concentration of risk and thus no significant default risk caused by a contract party or a group of contract parties with similar characteristics. In view of the financial market crisis, the internal guidelines for credit insurance and for the issuing of credit limits have been stepped up.
The maximum theoretical default risk for the categories indicated above is equal to the carrying amounts shown. With the exception of the foreign currency hedging mentioned above, the Group has no other securities that would reduce the default risk.
Financial market risk
Since 2008, the risk management activities of CANCOM SE have included continuous analysis of potential risks arising from the financial market crisis.
Dealing in financial instruments and structured products is not a core business of the company, and is only used – if at all – as a means of safeguarding sound underlying transactions that are exposed to currency risks. Foreign exchange exposures of USD 15.2 million, CHF 2.3 million and NOK 1.0 million were hedged as at the reporting date. The financial market risk is confined to the price risk of the currency futures concluded by the company as at the reporting date (€ 194 thousand).
Only the Executive Board (Chief Executive Officer and Chief Financial Officer) are authorized to purchase or sell structured products through banks. This is intended to avert the possibility of any inexperienced person carrying out transactions of this kind.
C. Notes to the consolidated balance sheet
1. Cash and cash equivalents
Cash and cash equivalents consist exclusively of cash in banks payable on demand and cash on hand.
2. Assets held for sale
A hereditary building right for an undeveloped property was sold on August 18, 2016. The owner of the property contested the sale within the period prescribed for objections on the basis of a formal error for which the purchaser was responsible. The hereditary building right was consequently not regarded as having been sold as at the reporting date, although the Group still intends to sell it.
The property (finance lease), which was previously recognized in the balance sheet under property, plant and equipment, was reclassified as asset held for sale. The related liability was also reclassified as held for sale.
NOTES TO THE CONSOLIDATED FINANCIAL STATEMENTS

93
3. Trade accounts receivable
The trade accounts receivable are as follows:
Dec. 31, 2017 € ‘000
Dec. 31, 2016 € ‘000
Accounts receivable before write-downs 224,226 182,946
Write-downs 554 513
Carrying amount of accounts receivable 223,672 182,433
The accounts receivable are written down uniformly throughout the Group, depending on their age structure.
Group receivables are written down on the basis of their age struc-ture, the likely necessity of legal proceedings, or the most positive outcome to be expected regarding defaults.
Generally, all outstanding Group receivables that are more than two years old are written off in full. At the reporting date, outstanding receivables that were more than two years old amounted to € 72 thousand.
Receivables are automatically written down after 120 days. An age analysis of receivables that are overdue but not impaired shows that those between one and two years old are written down by 50 percent, if no other reasons or circumstances are known to suggest they will not be paid. At the reporting date, the value of these receivables was less than 0.1 percent of total receivables.
Before taking on a new client, the Group uses a system of internal and external credit scoring to assess the credit rating of potential clients and to set their credit limits. The credit ratings of clients and their credit limits are reviewed at least annually.
When assessing the impairment of trade accounts receivable, every change in credit rating is taken into account, from the time the credit was granted up to the balance sheet date. There is no significant concentration of credit risk because the client base is broad and there is little correlation. The management therefore believes that no provision for risks is necessary beyond the impair-ments already included.
In 2017, the impairments included trade accounts receivable amounting to € 9 thousand (2016: € 0 thousand) in which insol-vency proceedings had been instituted against the debtors. The impairment included was the difference between the carrying amount of the receivable and the present value of the anticipated liquidation proceeds. The Group has no security for these balances.
Impairment of accounts receivable includes additions of € 264 thousand (2016: € 190 thousand), and reductions for receivables written off as uncollectible, amounting to € 2016 thousand (2016: € 97 thousand).
There were no impairments for trade accounts receivable, which total € 51,433 thousand (2016: € 40,641 thousand) and were due at the reporting date, because no major change in the credit rating of these debtors was established and the outstanding amounts are expected to be paid. Of the overdue accounts receivable, € 50,530 thousand is less than three months overdue; € 809 thousand more than three but less than six months overdue; €55 thousand more than six but less than twelve months overdue; and € 39 thousand more than twelve months overdue. The accounts receivable that were due at the reporting date included bills that were payable immediately without reduction.
The fair value of the trade accounts receivable is equal to the carrying amount. Additions to the provisions in the fiscal year are posted in the statement of income under other operating expenses, while reversals are shown under other operating income.
The trade accounts receivable are due within a year.
4. Other current financial assets
This item includes receivables from banks (€ 12,000 thousand; 2016: € 86,000 thousand), bonuses due from suppliers (€ 5,912 thousand; 2016: € 2,821 thousand) claims to the payment of a purchase price relating to lease projects (€ 5,235 thousand; 2016: € 5,632 thousand), marketing revenue (€ 1,054 thousand; 2016: € 824 thousand), creditors with a debit balance (€ 526 thousand; 2016: € 487 thousand), claims to the payment of a purchase price from the disposal of companies (€ 200 thousand; 2016: € 200 thou-sand), assets relating to financial derivatives (€ 194 thousand; 2016: € 0 thousand), receivables from staff (€ 172 thousand; 2016: € 98 thousand), and claims in respect of loans (€ 1 thousand; 2016: € 0 thousand).
NOTES TO THE CONSOLIDATED FINANCIAL STATEMENTS

94
5. Inventories
Inventories consist almost exclusively of merchandise, particularly hardware components and software.
Inventories consist of the following (company-specific break-down):
Dec. 31, 2017 € ‘000
Dec. 31, 2016 € ‘000
Finished products and goods 22,686 22,222
Prepayments made 237 302
22,923 22,524
The cost of goods, raw materials and supplies in the fiscal year 2017 was € 788,926 thousand (2016: € 686,649 thousand).
Inventories were written down by € 590 thousand (2016: € 607 thousand) owing to excess inventory, obsolescence, reduced marketability or follow-up costs for finished products.
Inventories will be essentially converted into cash within the next 12 months.
No inventories were pledged as security.
6. Contracts in progress
The contracts in progress are orders calculated according to the percentage of completion method. They amount to € 981 thousand (2016: € 417 thousand). The costs accumulated for current projects as at the balance sheet date amounted to € 672 thousand (2016: € 398 thousand). Profits resulting from current projects as at the reporting date totaled € 309 thousand (2016: € 19 thousand).
7. Prepaid expenses and other current assets
This item mainly consists of other current assets such as tax refunds (€ 2,780 thousand; 2016: € 1,992 thousand), commission income (€ 583 thousand; 2016: € 326 thousand), insurance refunds (€ 206 thousand; 2016: € 207 thousand) and receivables from social insurance institutions (€ 161 thousand; 2016: € 13 thousand).
The prepaid expenses (€ 3,339 thousand; 2016: € 2,746 thousand) include deferred insurance premiums and expenses paid in advance.
8. Non-current assets
Changes in, and the composition of, non-current assets in fiscal 2017 are shown in the consolidated statement of changes in non-current assets (Appendix 5, Page 92).
8.1 Property, plant and equipment (tangible assets)
Property, plant and equipment mainly consists of motor vehicles (€ 17,910 thousand), prepayments made for assets under construc-tion (€ 11,903 thousand), land and buildings (€ 10,806 thousand) and operating and office equipment, IT data centers (€ 8,841 thousand), the unified communications and collaboration (UCC) system (€ 704 thousand), assets held for rental (€ 501 thousand), and operating equipment for the logistics center (€ 167 thousand). Computer equipment, tenant’s fittings and office equipment are also shown under this item. Motor vehicles valued at € 1,552 thou-sand were pledged as security for the loans from Stadtsparkasse Augsburg.
The prepayments made for assets under construction include construction costs for a new logistics center in Jettingen-Schep-pach, Germany (€ 10,798 thousand).
8.2 Intangible assets
The intangible assets include client lists (€ 29,157 thousand; 2016: € 13,243 thousand), purchased software (€ 5,161 thousand; 2016: € 3,653 thousand), orders in hand (€ 4,305 thousand; 2016: € 246 thousand), restraint on competition (€ 321 thousand; 2016: € 1,057 thousand), brand name (€ 1,125 thousand; 2016: € 1,227 thousand), prepayments made (€ 14,001 thousand; 2016: € 7,133 thousand) and capitalized development costs (€ 2,402 thousand; 2016: € 1,748 thousand).
Client lists, orders in hand, restraint on competition and brand name are mainly based on acquisitions made in prior years and in 2017. They are written down over their expected useful lives.
8.3 Goodwill
Goodwill totaling € 115,219 thousand (2016: € 73,230 thousand) as at the reporting date is attributable to Synaix Gesellschaft für angewandte Informations-Technologien mbH (€ 38,185 thousand; 2016: € 0 thousand), CANCOM GmbH (€ 31,825 thousand; 2016: € 27,808 thousand), the Pironet AG group (€ 19,974 thousand; 2016: € 19,974 thousand), HPM Incorporated (€ 12,446 thousand; 2016: € 14,160 thousand), CANCOM on line GmbH (€ 7,049 thousand; 2016: € 7,049 thousand), CANCOM ICT Service GmbH (formerly NSG ICT Service GmbH) (€ 2,522 thousand; 2016: € 2,522 thou-sand), CANCOM a+d IT solutions GmbH (€ 1,717 thousand; 2016: € 1,717 thousand) and c.a.r.u.s. Information Technology GmbH Hannover (€ 1,501 thousand; 2016: € 0 thousand).
NOTES TO THE CONSOLIDATED FINANCIAL STATEMENTS
95
The goodwill for CANCOM GmbH comprises CGU Cloud Solutions (€ 5,157 thousand; 2016: € 5,157 thousand) and CGU IT Solutions (€ 26,668 thousand; 2016: € 22,651 thousand). The increase in goodwill for CGU IT Solutions in the fiscal year 2017 is the result of the acquisitions of antauris-Aktiengesellschaft (€ 3,819 thou-sand) and forwerts GmbH (€ 198 thousand).
Translation of the financial statements of HPM Incorporated into the presentation currency in line with IAS 21 and IFRS 3 resulted in a decrease in the value of the goodwill by € 1,714 thousand.
The Group checks these figures once a year by testing for impair-ments in accordance with IAS 36. The recoverable amount is calculated on the basis of the value in use.
The value in use is calculated by means of valuation methods based on discounted cash flows.
These discounted cash flows are based on five-year forecasts which are drawn up in accordance with finance plans approved by the management. The cash flow forecasts take into consideration the experiences of the past and are based on the management’s best estimate of future developments. External market studies were also taken into account. The cash flow forecasts are prepared on the basis of sales forecasts of the individual companies.
The sales growth forecasts for the major companies in the CANCOM Group for the fiscal year 2018, not taking into account non-recurring items, were calculated at between 2.2 percent (CANCOM a+d IT Solutions GmbH) and 12.6 percent (CGU Cloud Solutions CC GmbH). For the years 2019 to 2022, it is assumed that sales revenues will grow steadily at rates between 2.3 percent and 6.2 percent.
Cash flows outside the planning period are extrapolated without growth rates. The most important assumptions on which the calculation of value in use is based are as follows:
2017 2016
Risk-free interest 1.33 % 1.04 %
Market risk premium 7.00 % 7.00 %
Beta coefficient 0.82 0.91
Capitalization rate (weighted average cost of capital - WACC) 6.98 % 6.95 %
Input tax -WACC 10.16 % 10.00 %
The impairment tests carried out in the fiscal year 2017 did not result in any write-downs. There was therefore no impairment charge at the end of the reporting period (at the start of the reporting period there were accumulated impairment charges of € 0 thousand).
These premises and the underlying methodology may have a considerable effect on the respective values and ultimately on the amount of a possible impairment of the goodwill.
Sensitivity analyses are carried out on the key assumptions used in the impairment tests conducted for the cash generating units. These confirm that, as in the previous year, no write-down is necessary.
8.4 Financial assets
The financial assets include investments in medium-term notes amounting to € 4,000 thousand and other investments in non-con-solidated companies amounting to € 1,321 thousand.
8.5 Investments accounted for using the equity method
The CANCOM Group held a 19.88 percent interest in prudsys AG, Chemnitz, Germany, through its subsidiary Pironet AG. As employees of the CANCOM Group are members of the supervisory board of prudsys AG, the Group had a controlling interest in the associate.
The shares were sold with effect from October 23, 2017 following an acceptance offer on August 23, 2017 and receipt of payment of the purchase price of € 1,104 thousand. After deduction of the carrying amount of € 589 thousand, the proceeds from the disposal amount to € 515 thousand.
The company’s pro rata net income for the fiscal year as at September 30, 2017 was € 566 thousand (2016: € 247 thousand). The related profit from the equity-accounted investment is there-fore € 112 thousand (2016: € 49 thousand).
NOTES TO THE CONSOLIDATED FINANCIAL STATEMENTS

96
Summarized financial information on the associate prudsys AG on the basis of the preliminary IFRS quarterly financial statements as at September 30, 2017:
2017 € ‘000
2016 € ‘000
Sales revenues 3,256 3,610
Earnings after taxes from continuing operations 566 247
Comprehensive income 566 247
Comprehensive income attributable to the group 112 49
Current assets 0 3,225
Non-current assets 0 184
Current liabilities 0 -890
Non-current liabilities 0 0
Net assets 0 2,519
Group's share of the long-term equity investment's net assets at the start of the year 501 451
Comprehensive income attributable to the Group 112 50
Adjustments to the previous year's final earnings figure -14 0
Dividends received during the year -10 0
Group's share of the long-term equity investment's net assets at the end of the year 589 501
Eliminiation of unrealized profits from downstream sales -589 0
Carrying amount of the investment in the long-term equity investment at the end of the year 0 501
prudsys AG develops and distributes software for retail e-com-merce applications by means of a licensing system that includes service. The prudsys software analyses client behavior (in realtime), enabling product recommendations to be made and dynamic pricing used during the shopping process. This increases the online store operator’s client retention rate.
8.6 Loans
The loans consist of loans to former subsidiaries (€ 1,202 thou-sand; 2016:€1,807 thousand) and the asset value from reinsurance, amounting to € 113 thousand (2016: € 105 thousand).
9. Other non-current financial assets
This item mainly includes long-term claims to the payment of purchase prices relating to lease projects (€ 7,883 thousand; 2016: € 10,100 thousand), claims to the payment of a purchase price from the disposal of companies (€ 400 thousand; 2016: € 600 thousand) and receivables from staff (€ 25 thousand; 2016: € 16 thousand). In 2016 the other non-current financial assets also included receiv-ables from banks (€ 2,000 thousand).
10. Deferred tax assets
The deferred tax assets are as follows:
Deferred tax from Temporary differences
€ ‘000
Tax loss carryovers
€ ‘000
As at January 1, 2017 2,665 1,605
Addition owing to recognition of assets, directly in equity because of first-time inclusion in consolidated financial statements 1,945 91
Derecognition owing to recognition of acturial losses from pension provisions, directly in equity* -19 0
Tax expense/income from statement of income 442 -1,334
Currency exchange gains/losses * -10 0
As at December 31, 2017 5,023 362
As at January 1, 2016 2,398 2,983
Derecognition owing to deconsolidation, directly in equity -1 0
Addition owing to recognition of acturial losses from pension provisions, directly in equity* 57 0
Tax expense/income from statement of income 208 -1.378
Currency exchange gains/losses * 3 0
As at December 31, 2016 2,665 1,605
* directly recognized in equity
As at December 31, 2017 the CANCOM Group had corporate tax loss carryovers of € 0.4 million (2016: € 4.6 million) and trade tax loss carryovers of € 1.8 million (2016: € 5.3 million). On the basis of the planned tax results, it is expected that the capitalized deferred tax benefits from loss carryovers will be realized.
NOTES TO THE CONSOLIDATED FINANCIAL STATEMENTS

97
The deferred taxes from temporary differences are mainly the result of differences in prepaid expenses (€ 2,221 thousand; 2016: € 18 thousand), property, plant and equipment (€ 806 thousand; 2016: € 841 thousand), intangible assets (€ 594 thousand; 2016: € 673 thousand), pension provisions (€ 582 thousand; 2016: € 447 thousand), other financial liabilities (€ 386 thousand; 2016: € 391 thousand), other provisions (€ 302 thousand; 2016: € 166 thousand) and other liabilities (€ 115 thousand; 2016: € 123 thousand).
11. Short-term loans and current portion of long-term loans
This item shows liabilities to banks. These comprise the utilization of credit facilities provided by banks, and those parts of the long-term loans that are due for repayment within one year.
12. Other current financial liabilities
Other current financial liabilities includes liabilities to former affiliated companies (€ 2,776 thousand; 2016: € 2,778 thousand), debtors with a credit balance (€ 2,174 thousand; 2016: € 2,168 thousand), purchase price liabilities for the shares in synaix Gesellschaft für angewandte Informations-Technologien mbH (€ 1,660 thousand; 2016: € 0 thousand), outstanding bills of charge (€ 559 thousand; 2016: € 795 thousand), leasing purchase price liabilities (€ 431 thousand; 2016: € 300 thousand), Supervisory Board remuneration (€ 286 thousand; 2016: € 296 thousand) and rent obligations (€ 93 thousand; 2016: € 88 thousand).
13. Other provisions
The changes in other provisions during 2017 are detailed below:
The total provisions include long-term provisions of € 3,022 thou-sand (2016: € 3,451 thousand), which are recognized under other non-current liabilities. They are mainly for guarantees and warran-ties (€ 1,153 thousand; 2016: € 692 thousand), copyright fees (€ 1,013 thousand; 2016: € 1,191 thousand), anniversaries (€ 299 thousand; 2016: € 296 thousand), contingent risks (€ 164 thousand; 2016: € 0 thousand), termination payments, for which a provision is legally mandatory in Austria (€ 150 thousand; 2016: € 98 thousand), decom-missioning and restoration liability (€ 130 thousand; 2016: € 123 thousand), and archiving costs (€ 80 thousand; 2016: € 80 thousand). In 2016 a provision of € 944 thousand was also included for a contin-gent purchase price (earn-out) for the shares of HPM Incorporated.
The allocation of these provisions to long-term liabilities is based on their expected due dates, as shown below.
Expected due date
Provisions for guarantees and warranties
Warranty by law or contract
Provisions for copyright fees 2 to 5 years
Provisions for anniversary payments With salary payments
Uncertain risiks 2 to 3 years
Provisions for termination payments Date of termination of the employ-ment of relevant staff member
Decommissioning and restoration liability
1 to 2 years
Archiving costs 1 to 6 years
14. Deferred income
In addition to deferred sales revenues, this item includes deferrals for government grants. The latter are based on discounted interest rate differences (differences between the market rates and the contractually agreed rates over the entire remaining term), and amount to a total of € 953 thousand (see information under E.2. Other operating income).
NOTES TO THE CONSOLIDATED FINANCIAL STATEMENTS
Jan. 1, 2017
€ ‘000
First-time consolidation
(addition) € ‘000
Used
€ ‘000
Reversal and transfer
€ ‘000
Addition
€ ‘000
Currency
€ ‘000
Dec. 31, 2017
€ ‘000
Purchase price of shares in affiliated entities 3,358 0 2,448 184 12 -238 500
Guarantees and warranties 1,449 198 770 21 1,386 0 2,242
Copyright fees 1,190 0 9 118 10 0 1,073
Interest expenses 534 0 0 0 370 0 904
Uncertain risks 166 0 166 0 567 0 567
Termination payments, salaries 737 0 276 15 112 0 558
Financial statement costs 167 39 187 4 172 0 187
Decommissioning and restoration liability 123 0 0 0 7 0 130
Archiving costs 107 5 9 0 0 0 103
Others 503 0 67 126 23 0 333
8,334 242 3,932 468 2,659 -238 6,597

98
15. Income tax liabilities
Income tax liabilities mainly consist of obligations for 2016 and 2017.
16. Other current liabilities
Other current liabilities mainly include sales tax (€ 12,271 thousand; 2016: € 9,394 thousand), staff bonus payments (€ 11,606 thousand; 2016: € 10,777 thousand), holiday and overtime entitlements (€ 3,242 thousand; 2016: € 2,786 thousand), tax on salaries and church tax (€ 2,877 thousand; 2016: € 2,417 thousand), capital gains tax (€ 791 thousand; 2016: € 0 thousand), employers’ liability insurance association (€ 763 thousand; 2016: € 741 thou-sand), compensation levy for non-employment of the severely handicapped (€ 293 thousand; 2016: € 235 thousand), wages and salaries (€ 289 thousand; 2016: € 236 thousand), social security contributions (€ 158 thousand; 2016: € 248 thousand) and traveling expenses (€ 140 thousand; 2016: € 79 thousand). Interest liabilities relating to the convertible bond (€ 299 thousand) were included in 2016.
17. Long-term loans
Long-term loans consist purely of liabilities due to banks with a remaining term of at least one year. The part of these loans that is due for repayment within the next twelve months is shown under ‘short-term loans and current portion of long-term loans’.
All loans are valued by the effective interest rate method. Interest subsidies from Germany’s publicly-owned development bank, Kreditanstalt für Wiederaufbau (KfW), for the loans are distrib-uted over the term. The market interest rate when the loans were taken out was between 4.5 percent and 5.53 percent.
18. Convertible bonds
CANCOM SE issued a convertible bond for a total nominal amount of € 45,000 thousand in March 2014. The bonds mature in March 2019 and the holders are entitled to convert their bonds into a total of up to 1,055,510 new no-par value bearer shares in CANCOM SE. The denomination per unit is € 100,000. The initial conversion price is € 42.6334 per share. The conversion ratio is therefore 2,345.5788 shares per bond at the relevant nominal amount of € 100,000. The conversion right for the bonds can be exercised throughout its term to maturity.
CANCOM SE was entitled to redeem the convertible bond in accor-dance with section 5 (b) of the issuing conditions of March 20, 2014, by notifying the bondholders, giving notice of at least 30 and at most 60 calendar days before the call redemption date specified in the notification. The bond could only be redeemed if, on at least 20 trading days within a period of 30 consecutive trading days, ending not earlier than five trading days before publication of the notification, the stock price (the volume-weighted average price in Xetra, or the Xetra closing price, in line with section 1 of the issuing conditions) was at least 130 percent of the conversion price applicable on those days (since June 21, 2017, this was € 42.3297). In the event of such a redemption, CANCOM SE had to repay the bondholders on the call redemption date. The bondholders had conversion rights. The conversion period and the procedure for exercising the conversion rights were set out in the issuing condi-tions.
The bond had a coupon of 0.875 percent. Interest was paid annu-ally on March 27, starting on March 27, 2015.
On the balance sheet, the convertible bond is split into an equity component and a liability component.
CANCOM SE called all the convertible bonds on September 5, 2017, and notified bondholders that they would be repaid on October 6, 2017 (call redemption date). The last day on which bondholders could exercise their conversion rights was September 29, 2017. By the end of the conversion period, holders of 410 convertible bonds, each with a nominal value of € 100,000, had converted their bonds into 968,574 CANCOM shares. This resulted in an increase in the capital stock of € 968,574.
Convertible bonds of holders who had not accepted the conversion option (40 convertible bonds at a nominal value of € 100,000 each) were redeemed on October 6, 2017.
An effective interest expense of € 1,166 thousand was recognized for the bond in the fiscal year 2017, and the nominal interest payments amounted to € 412 thousand.
NOTES TO THE CONSOLIDATED FINANCIAL STATEMENTS

99
19. Subordinated loans
Capital from subordinated loans includes two subordinated loans from Sparkasse Günzburg-Krumbach of € 756,250.00 (loan proceeds € 1,000,000.00, minus repayment of € 128,800.00 in 2012) and € 865,654.11 (loan proceeds € 1,000,000.00); and four subordinated loans from Stadtsparkasse Augsburg of € 1,221,052.65 (loan proceeds € 1,995,600.00), € 239,800.57 (loan proceeds € 392,500.00), € 1,289,012.54 (loan proceeds € 1,621,000.00) and € 673,175.19 (loan proceeds € 846,000.00). The subordinated loans from Sparkasse Günzburg-Krumbach and the subordinated loans from Stadtsparkasse Augsburg are valued by the effective interest rate method. By this method, the interest advantages granted from Germany’s publicly-owned development bank, Kreditanstalt für Wiederaufbau (KfW), for the loans from Sparkasse Günzburg-Krumbach and Stadtsparkasse Augsburg are distributed over the terms. The market interest rate was between 10 percent and 10.5 percent when the loans were concluded.
Two loans of € 1,000,000.00 each (loan proceeds) were granted by Sparkasse Günzburg-Krumbach on December 21, 2010. Interest of 5.1 percent per annum is payable on the loan. These are specif-ic-purpose loans out of funds from Germany’s publicly-owned development bank, Kreditanstalt für Wiederaufbau (KfW). The scheduled start of repayment is March 30, 2018, with 11 quarterly instalments of € 83,334.00 on each loan, followed by a final instal-ment of € 83,326.00 on each loan. An unscheduled repayment of € 128,800 was made on one of the loans on April 10, 2012. The scheduled repayments for this loan will be reduced to € 72,600.00 per quarter from March 30, 2018.
A loan of € 1,995,600.00 (loan proceeds) from Stadtsparkasse Augsburg was granted in tranches of € 1,500,000.00 on September 23, 2009 and € 495,600.00 on December 8, 2009. Interest of 4.25 percent per annum is payable on the loan. This is another specif-ic-purpose loan out of funds from Kreditanstalt für Wiederaufbau (KfW). Repayment, in 12 quarterly instalments of € 166,300.00, has started on December 30, 2016.
A further loan of € 392,500.00 (loan proceeds) from Stadtspar-kasse Augsburg was granted on December 8, 2009. Again, this is a specific-purpose loan from Kreditanstalt für Wiederaufbau (KfW), on which the annual rate of interest is 4 percent. Repayment has started on December 30, 2016, with payment of 11 quarterly instal-ments of € 32,709.00 followed by a final instalment of € 32,701.00.
A further loan of € 1,621,000.00 (loan proceeds) was granted by Stadtsparkasse Augsburg on November 26, 2010, at an interest rate of 2.9 percent per annum. This is a further specific-purpose loan out of funds from Kreditanstalt für Wiederaufbau (KfW). Repayment will begin on March 30, 2018, with 11 quarterly instalments of € 135,084.00 each, followed by a final instalment of € 135,076.00.
A further loan of € 846,000.00 (loan proceeds) from Stadtspar-kasse Augsburg was granted on December 2, 2010, at an interest rate of 2.9 percent per annum. Again, this is a specific-purpose loan out of funds from Kreditanstalt für Wiederaufbau (KfW). Repayment will begin on March 30, 2018 in 12 quarterly instal-ments of € 70,500.00.
20. Deferred tax liabilities
The deferred tax liabilities are as follows:
€ ‘000
As at January 1, 2017 7,550
Addition owing to recognition of liabilities, directly in equity because of first-time inclusion 11,161
Tax expense/income from statement of income -1,976
Tax expense/income from statement of income relating to discontinued operations -120
Currency gains/losses * -704
As at December 31, 2017 15,911
As at January 1, 2016 8,891
Addition owing to recognition of liabilities, directly in equity because of first-time inclusion 339
Income tax/expense from statement of income -1,745
Income tax/expense from from statement of income relating to discontinued operations -120
Currency exchange gains/losses* 185
As at December 31, 2016 7,550
* directly recognized in equity
NOTES TO THE CONSOLIDATED FINANCIAL STATEMENTS

100
The deferred tax liabilities arise from deviations from the tax balance sheets. They are the result of the recognition and revalu-ation of intangible assets (€ 10,628 thousand; 2016: € 4,453 thou-sand), deferred income (€ 2,399 thousand; 2016: € 0 thousand), other financial assets (€ 1,114 thousand; 2016: € 926 thousand), software development costs (€ 751 thousand; 2016: € 540 thou-sand), property, plant and equipment (€ 405 thousand; 2016: € 387 thousand); goodwill (€ 320 thousand; 2016: € 354 thousand), contracts in progress (€ 93 thousand; 2016: € 6 thousand), loans to affiliated companies (€ 80 thousand; 2016: € 640 thousand), other financial liabilities (€ 45 thousand; 2016: € 45 thousand), other provisions (€ 22 thousand; 2016: € 17 thousand), other liabilities (€ 22 thousand; 2016: € 9 thousand), prepaid expenses (€ 21 thou-sand; 2016: € 49 thousand) and pension provisions (€ 11 thousand; 2016: € 0 thousand). In the previous year the deferred tax liabilities also included convertible bonds (€ 118 thousand), equity-accounted investments (€ 5 thousand) and long-term securities (€ 1 thou-sand).
An explanation of the differences arising from first-time inclusion in the consolidated financial statements can be found in section A.3.
In line with IAS 12.39, deferred tax liabilities are not recognized for temporary differences connected with shareholdings in subsid-iaries, which amount to € 21,063 thousand.
Recognition is based on an individual tax rate of between 25 percent (Austrian subsidiary) and 39.83 percent (German subsid-iaries, based in Munich, Germany).
21. Pension provisions
This item only includes provisions for staff pensions (€ 2,042 thou-sand; 2016: € 1,942 thousand) based on defined benefit obligations assumed as a result of acquisitions.
The pension obligations for pension schemes in Germany are measured according to the number of years of service and the remuneration of the employee in question, or by firm commit-ments.
No significant risks associated with the defined benefit obligations are expected.
The projected unit credit method is used as an actuarial valuation method, in line with IAS 19.67-68.
The changes in the benefit obligation and the asset value of the funds for the defined benefit schemes are shown below:
2017 € ‘000
2016 € ‘000
Changes in pension obligation
Defined benefit obligation (DBO) as at January 1, 2017 2,462 2,181
Service cost: present value of claims accrued in 2017 66 59
Adjustments: acturial gain/loss arising from financial assumptions -63 186
Interest expenses 49 51
Pension payments -16 -15
Business combinations 976 0
Defined benefit obligation (DBO) as at December 31, 2017 3,474 2,462
Changes in plan assets
Fair value of plan assets as at January 1, 2017 520 437
Income/expenses on plan assets 11 7
Employer's contributions 89 79
Pension payments -3 -3
Business combinations 815 0
Fair value of plan assets as at December 31, 2017 1,432 520
Composition
Present value of pension obligations 3,474 2,462
Fair value of plan assets -1,432 -520
Pension obligations reported on the balance sheet 2,042 1,942
The plan assets mainly include reinsurance policies.
NOTES TO THE CONSOLIDATED FINANCIAL STATEMENTS

101
The above sensitivity analyses were carried out using a method of actuarial computation that shows the impact on the defined benefit obligation at the end of the reporting period resulting from realistic changes in the most important assumptions.
The pension payment expense in the fiscal year 2018 is expected to be € 171 thousand (2016: € 111 thousand), and the contributions to plan assets € 406 thousand (2016: € 79 thousand). Benefit payments in the fiscal year 2018 are expected to be the same as the payments made in 2017. The average term of the pension liabilities is 19.6 years (2116: 21.6 years).
22. Other non-current financial liabilities
Other non-current financial liabilities includes purchase price liabilities for the shares in synaix Gesellschaft für angewandte Informations-Technologien mbH (€ 4,332 thousand; 2016: € 0 thou-sand), rent obligations of € 380 thousand (2016: € 413 thousand) and leasing purchase price liabilities of € 518 thousand (2016: € 216 thousand).
23. Equity
Changes in equity are shown in Appendix 4.
Capital stock
In accordance with the by-laws, the company’s capital stock at December 31, 2017 was € 16,553,245 (2016: € 16,367,531), divided into 16,553,245 (2016: 16,367,531) notional no-par value shares. However, the conversion of CANCOM SE’s convertible bonds into shares in the company increased the capital stock further during the fiscal year. The company’s contingent capital 2013/I was used for this increase, in line with the company’s by-laws. The change to the company’s by-laws associated with this conversion had not yet been recorded in the commercial register on the reporting date. The company’s capital stock as at the time of publication of this report is € 17,521,819, divided into 17,521,819 no-par value shares.
Computation of the actuarial pension scheme obligations was based on the following assumptions:
2017 %
2016 %
Interest rate 1.90 1.90
Salary trend*) 2.00 2.00
Pension trend 1.0 - 1.5 1.50
*) for pension commitments dependant on current remuneration
The total cost of the pension schemes according to IAS 19 is broken down as follows:
2017 € ‘000
2016 € ‘000
Current service costs 66 59
Actuarial gains/losses due to changes in financial assumptions -63 186
Interest cost 38 44
41 289
NOTES TO THE CONSOLIDATED FINANCIAL STATEMENTS
Sensitivity analyses:A change in the assumptions on which the above figures are based would increase or reduce the DBO as follows:
2016 2017 Sensitivity Total increase Total decrease
€ ‘000 € ‘000
Assumed interest rate 1.90% 1.90% +/-1.00% 0.90% 765 2.90% -589
Salary trend 2.00% 2.00% +/-0.50% 2.50% 25 1.50% -24
Pension trend 1.50% 1.50% +/-0.25% 1.75% 94 1.25% -89

102
Authorized and conditional capital
In conformity with the corporate by-laws, the company’s autho-rized capital stock totaled € 5,766,116 as at December 31, 2017. The details of the authorized capital are as follows:
A resolution passed at the general meeting of stockholders on June 18, 2015 authorizes the Executive Board to increase the capital stock once or in several steps by up to a total of € 7,439,787 by issuing up to 7,439,787 new notional no-par value bearer shares for a cash or non-cash consideration (authorized capital I/2015). The shares must be issued by June 17, 2020 and any issue of shares is subject to the approval of the Supervisory Board. In general, stockholders will be granted subscription rights, but the Exec-utive Board is authorized to exclude the stockholders’ statutory subscription rights in the following cases with the approval of the Supervisory Board:
• for fractional amounts;
• if a capital increase for a cash consideration does not exceed 10 percent of the capital stock and the issue price of the new shares is not significantly lower than the stock market price (Section 186, paragraph 3, sentence 4 of the German Stock Corporation Act). If this authorization is used and stockholders‘ subscrip-tion rights are excluded in accordance with the above Act, the disapplication of subscription rights on the basis of other authorizations in accordance with the same Act must be taken into account;
• for capital increases for a non-cash consideration to grant new shares for the purpose of acquiring companies or equity interests in companies or parts of companies, or for a debt-for-equity swap.
The Executive Board will determine the nature of the relevant rights conferred by the shares and the conditions for carrying out capital increases, subject to the approval of the Supervisory Board.
The Executive Board used the above authorization as follows in 2017:
The Executive Board has made partial use of the authorization granted by resolution of the general meeting of stockholders of CANCOM SE on June 18, 2015 to increase the company’s capital stock by issuing up to 7,439,787 new no-par value bearer shares (authorized capital 2015/I). On July 10, 2017, with the agreement of the Supervisory Board, it decided to increase the company’s capital stock by € 185,754, from € 16,367,531 to € 16,553,245, for a non-cash consideration by issuing 185,714 new no-par value bearer
shares, with each share representing € 1 of the capital stock. The new shares were issued against non-cash contributions and carry dividend rights from January 1, 2018. Stockholder subscription rights were disapplied pursuant to section 4, paragraph 4, sentence 3, second indent, of the corporate by-laws (Section 186, paragraph 3, sentence 4 of the German Stock Corporation Act. Following the capital increase, the company’s capital stock was € 16,553,245, divided into 16,553,245 no-par value bearer shares. Each share had an accounting par value of € 1 of the capital stock. Of the autho-rized capital (2015/I), € 5,766,116 remains unused.
In accordance with the corporate by-laws, the conditional capital at December 31, 2017 amounted to € 1,450,000. The details of the conditional capital are as follows:
The capital stock has been increased conditionally by up to € 1,450,000 by the issue of up to 1,450,000 new no-par value shares (contingent capital 2013/I). The conditional increase in capital will only be implemented to the extent that holders of the convertible bond issued on March 27, 2014 exercise their conversion rights in line with the terms and conditions of the bond. The shares will be issued at the relevant conversion price under the terms and conditions of the bond. The new shares will carry dividend rights from the beginning of the fiscal year for which, at the time of their issue, no resolution of the general meeting of stockholders has been passed on the appropriation of the net retained profit.The Executive Board is authorized to determine the other details for the implementation of the conditional capital increase with the approval of the Supervisory Board.
The exercising of conversion rights by holders of the convertible bond issued by CANCOM SE resulted in the issue of 968,574 new no-par value bearer shares in the fiscal year 2017. This increased the capital stock of CANCOM SE by € 968,574 to € 17,521,819. The increase in the capital stock had not yet been recorded in the commercial register on the reporting date. Of the contingent capital (2013/I), € 481,426 remains unused.
The Executive Board is not aware of any restrictions on voting rights or on the transfer of shares.
Net retained profit
In accordance with the resolution of the general meeting of stock-holders, a dividend of € 0.50 per share (total € 8,184 thousand) was paid in 2017 from the net retained profit generated in the previous year.
NOTES TO THE CONSOLIDATED FINANCIAL STATEMENTS
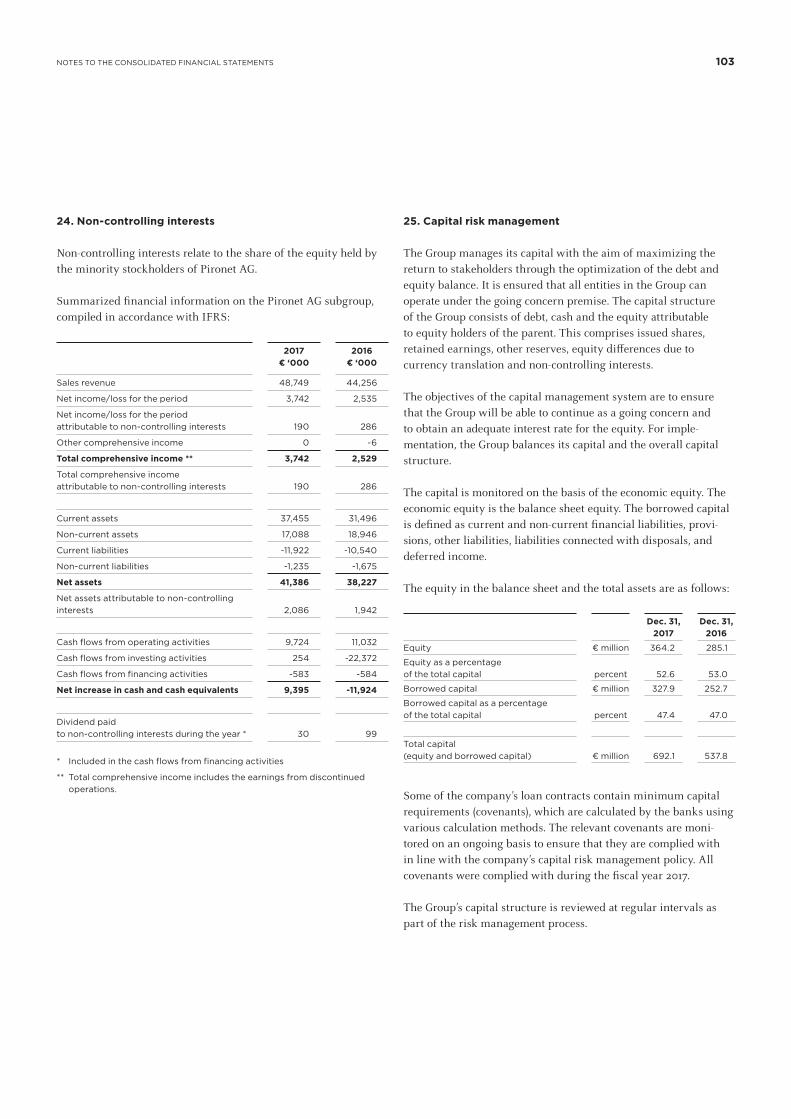
24. Non-controlling interests
Non-controlling interests relate to the share of the equity held by the minority stockholders of Pironet AG.
Summarized financial information on the Pironet AG subgroup, compiled in accordance with IFRS:
2017 € ‘000
2016 € ‘000
Sales revenue 48,749 44,256
Net income/loss for the period 3,742 2,535
Net income/loss for the period attributable to non-controlling interests 190 286
Other comprehensive income 0 -6
Total comprehensive income ** 3,742 2,529
Total comprehensive income attributable to non-controlling interests 190 286
Current assets 37,455 31,496
Non-current assets 17,088 18,946
Current liabilities -11,922 -10,540
Non-current liabilities -1,235 -1,675
Net assets 41,386 38,227
Net assets attributable to non-controlling interests 2,086 1,942
Cash flows from operating activities 9,724 11,032
Cash flows from investing activities 254 -22,372
Cash flows from financing activities -583 -584
Net increase in cash and cash equivalents 9,395 -11,924
Dividend paid to non-controlling interests during the year * 30 99
* Included in the cash flows from financing activities
** Total comprehensive income includes the earnings from discontinued operations.
25. Capital risk management
The Group manages its capital with the aim of maximizing the return to stakeholders through the optimization of the debt and equity balance. It is ensured that all entities in the Group can operate under the going concern premise. The capital structure of the Group consists of debt, cash and the equity attributable to equity holders of the parent. This comprises issued shares, retained earnings, other reserves, equity differences due to currency translation and non-controlling interests.
The objectives of the capital management system are to ensure that the Group will be able to continue as a going concern and to obtain an adequate interest rate for the equity. For imple-mentation, the Group balances its capital and the overall capital structure.
The capital is monitored on the basis of the economic equity. The economic equity is the balance sheet equity. The borrowed capital is defined as current and non-current financial liabilities, provi-sions, other liabilities, liabilities connected with disposals, and deferred income.
The equity in the balance sheet and the total assets are as follows:
Dec. 31, 2017
Dec. 31, 2016
Equity € million 364.2 285.1
Equity as a percentage of the total capital percent 52.6 53.0
Borrowed capital € million 327.9 252.7
Borrowed capital as a percentage of the total capital percent 47.4 47.0
Total capital (equity and borrowed capital) € million 692.1 537.8
Some of the company’s loan contracts contain minimum capital requirements (covenants), which are calculated by the banks using various calculation methods. The relevant covenants are moni-tored on an ongoing basis to ensure that they are complied with in line with the company’s capital risk management policy. All covenants were complied with during the fiscal year 2017.
The Group’s capital structure is reviewed at regular intervals as part of the risk management process.
103NOTES TO THE CONSOLIDATED FINANCIAL STATEMENTS

104
D. Segment information
Segment information is disclosed according to IFRS 8 Operating Segments. The segment information is based on the segmentation used for internal control purposes (management approach). The Group reports on two operating segments: cloud solutions and IT solutions.
Description of the segments subject to mandatory reporting
The cloud solutions operating segment comprises CANCOM Pironet AG & Co. KG (formerly PIRONET Datacenter AG & Co. KG), PIRONET Enterprise Solutions GmbH, Pironet AG, Synaix Gesellschaft für angewandte Informations-Technologien mbH, synaix Service GmbH and the divisions of CANCOM GmbH allocated to the cloud solutions segment. This operating segment comprises the CANCOM Group’s cloud and shared managed services business, including project-related cloud hardware, software and services business. The product and service portfolio comprises analysis, consulting, delivery, implementation and services, thus providing clients with the necessary orientation and support for transformation of their corporate IT systems to cloud computing. As part of its range of services, the CANCOM Group is able to run parts of, or entire, IT departments for its clients, using scalable cloud and managed services – especially shared managed services. Distribution costs allocated to cloud distribution are included in the segment. The cloud business also benefits from synergies with CANCOM’s general sales and marketing service, the costs of which are allocated to the IT solutions reportable segment.
The IT solutions operating segment comprises CANCOM GmbH, CANCOM Computersysteme GmbH, CANCOM a+d IT solutions GmbH, CANCOM (Switzerland) AG, CANCOM ICT Service GmbH (formerly NSG ICT Service GmbH), CANCOM SCS GmbH, CANCOM ICP GmbH, CANCOM on line GmbH, Cancom on line B.V.B.A., c.a.r.u.s. Information Technology GmbH Hannover, CANCOM physical infrastructure GmbH, CANCOM Inc., HPM Incorporated, with the exception of the divisions of CANCOM GmbH allocated to the cloud solutions and other companies segment. This operating segment of the CANCOM Group offers comprehensive support for IT infrastructure and applications. The range of services offered includes IT strategy consulting, project planning and implementation, system integration, IT procurement via e-procurement services or as part of a project, in addition to professional IT services and support.
The ‘other companies’ are CANCOM SE, CANCOM VVM GmbH, CANCOM Financial Services GmbH and the divisions of CANCOM GmbH allocated to the ‘other companies’ segment. CANCOM SE and the divisions of CANCOM GmbH allocated to this segment perform the staff and/or management functions for the Group. As such, they provide a range of services for the subsidiaries. The costs of central management of the Group and its investments in internal Group projects also fall within this segment.
Basis of valuation of the profit of the segments The accounting methods used for internal segment reporting are in line with the accounting policies described in section A. 4. The only differences arise from the translation of foreign currency, and these give rise to slight deviations between the data for internal reporting and the relevant disclosures for the external presenta-tions of financial statements.
Internal sales are recorded on the basis of either their cost or their current market prices, depending on the type of service or product sold.
The segment assets, liabilities and investments are not presented, as the internal reporting system is only based on earnings figures, broken down into segments for the purpose of Group manage-ment.
Reconciliation Reconciliation shows items not directly connected with the operating segments and the other companies. They include sales within the segments, and the income tax expense.
The income tax expense is not a component of the earnings of the operating segments. Since the tax expense is allocated to the parent company where the parent company is the taxable entity, the allocation of the income tax does not exactly correspond to the structure of the segments.
NOTES TO THE CONSOLIDATED FINANCIAL STATEMENTS

105
Information on geographical regions
Sales revenue according to customer location
Sales revenue according to company location
Jan. 1 - Dec. 31,
2017 € ‘000
Jan. 1 - Dec. 31,
2016 € ‘000
Jan. 1 - Dec. 31,
2017 € ‘000
Jan. 1 - Dec. 31,
2016 € ‘000
Germany 982,107 849,997 1,047,864 914,199
Outside Germany 179,133 173,110 113,376 108,908
Group 1,161,240 1,023,107 1,161,240 1,023,107
Non-current assets
31.12.2017 € ‘000
31.12.2016 € ‘000
Germany 227,335 142,603
Outside Germany 15,989 19,262
Group 243,324 161,865
Non-current assets include property, plant and equipment (tangible assets), intangible assets, goodwill, and other non-current assets. Financial instruments and deferred tax claims are not included.
E. Notes to the consolidated statement of income
1. Sales revenues
The sales revenues are broken down as follows:
2017 € ‘000
2016 € ‘000
From the sale of goods 904,285 781,124
From the provision of services 256,955 241,983
Total 1,161,240 1,023,107
The sales revenues include order revenue of € 1,789 thousand calculated using the POC method.
2. Other operating income
Other operating income consists of the following items:
2017 € ‘000
2016 € ‘000
Negative goodwill arising from first-time consolidation 0 593
Income not relating to the period 1,596 1,683
Government grants 622 590
Compensation for damages 200 1
Other operating income 53 228
Total 2,471 3,095
Income not relating to the period mainly includes the proceeds from the sale of non-current assets (€ 511 thousand), and income from the derecognition of debtors with a credit balance (€ 461 thousand).
Government grants include the benefit allocated to the fiscal year 2017 from availing of loans at a favorable interest rate.
For more information see details on loans in sections C. 17 and C. 19.
3. Other own work capitalized
This item includes in-house services connected with the purchase and manufacture of non-current assets, as well as capitalized development costs in the intangible assets.
Other own work capitalized comprises the following:
2017 € ‘000
2016 € ‘000
Capitalized development costs 1,141 1,073
Own work capitalized for acquired intangible assets 1,939 1,295
Own work capitalized for acquired property, plant and equipment (tangible assets) 139 68
Total 3,219 2,436
Research and development costs were not capitalized if they did not meet the criteria for recognition under IAS 38. They amounted to less than € 0.1 million (2016: € 0.1 million).
NOTES TO THE CONSOLIDATED FINANCIAL STATEMENTS

106
4. Human resources expenses
The human resources expenses consist of the following:
2017 € ‘000
2016 € ‘000
Wages and salaries 164,207 153,380
Social security contributions 26,316 24,816
Pension expenses 458 369
Total 190,981 178,565
5. Other operating expenses
The other operating expenses consist of the following items:
2017 € ‘000
2016 € ‘000
Premises costs 11,114 10,238
Insurance and other charges 1,239 1,372
Motor vehicle costs 3,475 4,323
Advertising costs 2,587 2,456
Stock exchange and entertainment costs 282 377
Hospitality and travelling expenses 6,774 5,153
Delivery costs 3,641 3,489
Third-party services 3,696 2,220
Repairs, maintenance, leasing 3,861 2,956
Communication and office expenses 2,746 2,481
Professional development and training costs 1,553 1,669
Legal and consultancy fees 2,338 1,632
Fees, costs of money transactions 247 675
Adjustments of accounts receivable 197 211
Other operating expenses 2,597 2,019
Total 46,347 41,271
6. Interest income and expenses
Interest income mainly consists of interest on cash in banks and interest income from clients.
7. Other financial result – income and expenses
The other financial result mainly includes income from currency futures, income from the reversal of provisions for variable purchase prices for subsidiaries, and expenses arising from the change in the conversion price for the convertible bond.
8. Write-downs of financial assets
The write-downs of financial assets in the previous year, which amounted to € 350 thousand, related exclusively to the impairment of a long-term financial receivable from a subsidiary that has been sold.
9. Income taxes
The rate of income tax for the German companies was 31.3 percent (2016: 30.9 percent). This is made up of corporate tax, trade tax and solidarity surcharge. The slight increase in the income tax rate is owing to the increase in the average rate of trade tax.
The divergence between the tax expenses reported and those at the tax rate of CANCOM SE is shown below:
2017 € ‘000
2016 € ‘000
Earnings before tax 58,732 49,500
Expected tax expense at rate for German companies (31.3 percent; 2016: 30.9 percent) 18,383 15,296
- Difference from tax paid outside Germany 41 132
- Change in value adjustment of deferred tax assets on loss carryforwards -98 1
- Tax-exempt incomet /non tax-relevant losses on disposals -80 -84
- Actual income tax not relating to the period 245 108
- Permanent differences -27 -415
- Non-deductible operating expenses, as well as trade tax add-backs and deductions 284 388
- Income from negative goodwill 0 -182
- Effects of tax rate changes -327 -4
- Miscellaneous 31 27
Total Group income tax expenses 18,452 15,267
NOTES TO THE CONSOLIDATED FINANCIAL STATEMENTS

107
The actual tax rate is calculated as follows:
2017 € ‘000
2016 € ‘000
Income before tax 58,732 49,500
Income tax 18,452 15,267
Actual tax expense rate 31.42% 30.84%
Income tax comprises the income tax paid or owed in the indi-vidual countries, and the deferred taxes:
2017 € ‘000
2016 € ‘000
Actual income tax expense 19,519 15,400
Deferred taxes:
Assets 892 1.170
Liabilities -1,976 -1,745
-1,084 -575
Deferred taxes recognized directly in equity 17 442
Group income tax expense 18,452 15,267
The calculation of income tax in accordance with IAS 12 takes account of tax deferrals resulting from different methods of measurement used for the tax balance sheet, as well as from real-izable loss carryforwards, from differences in the results produced by the measurement of tax in the single-entity financial state-ments of the consolidated subsidiaries and those produced by the Group’s standard method, and from the consolidation processes, in as far as these balance out over the course of time. Deferred tax claims relating to the carrying forward of tax losses which have not yet been utilized are capitalized if results can be expected to be positive within the next five years. The deferred taxes are calculated on the basis of the tax rates expected to apply in the period in which an asset is realized or a liability satisfied. The tax rates are those that apply or will apply on the balance sheet date. Deferred taxes on items charged directly to equity relate to the costs of increasing the capital stock.
10. Discontinued operations
The impact of discontinued operations on the statement of income was a loss of € 259 thousand (2016: loss of € 582 thousand). Of this amount, a loss of € 13 thousand is attributable to minority interests (2016: loss of € 30 thousand).
This amount consists of expenditure of € 379 thousand and a loss before taxes of € 379 thousand. The respective tax income amounts to € 120 thousand. The loss after taxes from discontinued operations amounts to € 259 thousand.
The discontinued operations only include the costs connected with the sale of Pirobase Imperia GmbH.
11. Non-controlling interests
Minority interests account for 5.08 percent (start of the year) and 5.04 percent (end of the year) of the net income of the period of Pironet AG subgroup (€ 190 thousand). Please see Appendix 4 for changes in non-controlling interests in equity.
12. Earnings per share
Basic earnings per share
The table below shows the change in the number of shares for calculation of the basic earnings per share: 2016 fiscal year 16,111,407
Effect of capital increase (pro rata) 600,158
2017 fiscal year 16,711,565
The amount used as the numerator in calculating the basic earn-ings per share was € 40,090 thousand.
NOTES TO THE CONSOLIDATED FINANCIAL STATEMENTS

108
Diluted earnings per share
On top of the number of shares taken to calculate the basic earn-ings, the figure for diluted earnings per share includes an addi-tional 772,163 shares. This is the number of shares, in the period up to the time when the convertible bonds were converted or the bondholders were repaid in the fiscal year 2017 that would have been issued if all the bonds had been converted. The net income for the period was accordingly adjusted by the effective interest (after tax) recognized as an expense, which amounts to € 801 thousand.
F. Notes to the statement of cash flows
The consolidated statement of cash flows is prepared in accor-dance with IAS 7 Statement of Cash Flows. This requires that a distinction be made between cash flows from operating activities, investing activities and financing activities. The cash and cash equivalents shown in the statement of cash flows comprise cash on hand and cash at banks.
The indirect method was used to establish the cash flow from current operating activities. There was an increase of € 76.8 million in the cash flow from ordinary activities in comparison with the previous year.
The cash resources of € 157,619 thousand (2016: € 63,590 thousand) include the cash and cash equivalents shown in the balance sheet. This comprises cash on hand and cash in banks.
Financial liabilities
G. Other disclosures
1. Related party disclosures
CANCOM SE has prepared these consolidated financial state-ments as the parent company with ultimate control. They are not included in the consolidated financial statements of any other group.
For the purposes of IAS 24, Klaus Weinmann can be considered a related party who can exercise a significant influence on the CANCOM Group as an Executive Board member of CANCOM SE. Furthermore, the Executive Board members Rudolf Hotter, Thomas Volk and Thomas Stark each are considered as related parties for the purposes of IAS 24, as are the members of the Supervisory Board. Other related persons under IAS 24.9 b are:
• PRIMEPULSE SE (formerly AL-KO SE) and its subsidiaries;• Polecat Intelligence Ltd.;• tyntec Group Ltd. and its subsidiaries; • ABCON Holding GmbH and its subsidiaries;• ABCON Vermögensverwaltung GmbH and its subsidiaries;• DV Immobilien Management GmbH;• Elber GmbH,• Athanor Gesellschaft für Beratung und Beteiligungen mbH and
its subsidiaries; • Wild Consult LLC;• Electronic Online Services GmbH;• Accelerate Commerce GmbH, Munich, Germany (formerly
Spacelab Invest GmbH);• MediaMarktSaturn Retail Group and its subsidiaries;• SBF AG and its subsidiaries; and• Digitales Gründerzentrum der Region Ingolstadt GmbH.
NOTES TO THE CONSOLIDATED FINANCIAL STATEMENTS
Dec. 31, 2016 Cash- effective
Cash-effective Dec. 31, 2017
Acquisitions Currency effect
Other effects1 Changes in Fair Value2
€ ‘000 € ‘000 € ‘000 € ‘000 € ‘000 € ‘000 € ‘000
Bonds 41.778 -4.000 0 0 37.778 0 0
Loans 9.093 419 71 -28 0 609 10.164
Lease liabilities3 1.288 376 0 0 0 54 1.718
Total debt from financing activities
52.159 -3.205 71 -28 37.778 663 11.882
1) Cumulative effect from disposal of bonds (especially capital increase)2) Including interest3) Including added leasing contracts

109
With regard to persons related to affiliated companies, please see section A.3. Reporting entity, and the statement of ownership in section G.12. With regard to persons related to affiliated companies accounted for using the equity method, please see section C.8.4. of these notes for information regarding prudsys AG.
Transactions with related persons were settled in the same way as arm’s length transactions, and the payment terms are net 10 to 30 days.
The transaction volumes of goods sold and services provided to related parties under IAS 24 were as follows: AL-KO Kober SE (a subsidiary of PRIMEPULSE SE) and its subsidiaries purchased goods/services amounting to € 2,167 thousand (gross) (2016: € 3,049 thousand), of which € 281 thousand (2016: € 428 thousand) was still outstanding on the reporting date. Stemmer Imaging AG (a subsidiary of PRIMEPULSE SE) and its subsidiaries purchased goods/services amounting to € 139 thousand (gross) (2016: € 0 thousand), of which € 10 thousand (2016: € 0 thousand) was still outstanding on the reporting date.
There were no transactions concerning goods and services purchased from related parties under IAS 24.
The emoluments paid to members of the Executive Board in the fiscal year amounted to € 3,042 thousand (2016: € 2,749 thousand). The emoluments were regarded as short-term employee benefits. As in the previous year, no post-employment benefit plans or termination benefits, other long-term benefits or share-based payments were provided.
The emoluments of the Supervisory Board members consisted of a base salary and an additional remuneration for their activities as committee members. They amounted to € 244 thousand (2016: € 265 thousand) in total, including attendance fees.
Details of the emoluments paid to individual members of the Executive Board and the Supervisory Board are presented in the remuneration report, which is part of the combined management report.
As in the previous year, there were no further significant transac-tions involving the company and the members of the Executive and Supervisory Boards.
2. Shares held by members of the Executive and Supervisory Boards (at the balance sheet date)
Stockholder Number of no-par value
shares
percentage
Klaus Weinmann 10,000 0.0611
Dominik Eberle 10,000 0.0611
3. Guarantees, contingent liabilities and other financial obligations
The financial obligations of the companies in the CANCOM Group under tenancy, leasing and telecommunication agreements were as follows:
As at December 31, 2017:
Due 2018 € ‘000
2019 € ‘000
2020 € ‘000
2021 € ‘000
2022 € ‘000
Later € ‘000
Total € ‘000
Under tenancy agreements 7,945 5,827 4,730 4,331 3,349 6,702 32,884
Under leasing agreements 700 271 108 44 13 0 1.136
Under telecom-munication agreements 1,658 579 318 31 23 0 2,609
10,303 6,677 5,156 4,406 3,385 6,702 36,629
As at December 31, 2016:
Due 2017 € ‘000
2018 € ‘000
2019 € ‘000
2020 € ‘000
2021 € ‘000
Later € ‘000
Total € ‘000
Under tenancy agreements
6,848
4,109
3,225
2,906
2,632
4,013
23,733
Under leasing agreements
546
182
81
33
18
8
868
Under telecom-munication agreements
1,103
659
316
108
18
0
2,204
8,497 4,950 3,622 3,047 2,668 4,021 26,805
The leasing agreements are for operating leases.
NOTES TO THE CONSOLIDATED FINANCIAL STATEMENTS

110
4. Declaration of conformity with the German Corporate Governance Code
In the Supervisory Board meeting on December 5, 2017, the Exec-utive Board and the Supervisory Board issued a joint declaration of conformity with the German Corporate Governance Code in accordance with Section 161, paragraph 1 of the German Stock Corporation Act, which was published immediately. The declara-tion is permanently displayed on the company’s website for public access.
5. Auditors’ fees
The following fees (total fees plus expenses, excluding input value-added tax) were charged in the fiscal year 2017 by the auditors appointed in accordance with Section 318 of the German Commercial Code, including affiliated companies and subsidiaries as defined by Section 271, paragraph 2 of the same Code:
2017 € ‘000
2016 € ‘000
a) Financial statements* 140 130
b) Other audit-related services 0 29
c) Tax consultancy 0 2
d) Other services 0 7
* thereof attributable to fiscal year 2016: € 15 thousand (2015: € 5 thousand)
6. Staff
2017 2016
Average number of employees during the year 2,820 2,742
Number of employees at the reporting date 2,913 2,654
The average number of employees is divided between the following functions: professional services (1,782; 2016: 1,842), sales (584; 2016: 508), and central services (454; 2016: 392).
7. Details of equity interests in CANCOM SE
As at 31 December 2017 the company had received the following notifications regarding major holdings of voting rights in accor-dance with Sections 33 et seq of the German Stock Corporation Act:
On January 16, 2014, Allianz Global Investors Luxembourg S.A., Senningerberg, Luxembourg, informed us that its share of the voting rights in CANCOM SE, held directly or indirectly, had fallen below the 5 percent threshold on January 15, 2014 and on that day amounted to 4.87 percent (equivalent to 711,270 voting rights).
Allianz Global Investors GmbH, Frankfurt am Main, Germany, informed us on March 27, 2015 that its share of the voting rights in CANCOM SE, held directly or indirectly, had fallen below the 10 percent threshold on March 26, 2015 and on that day amounted to 9.93 percent (equivalent to 1,477,079 voting rights).
Die PRIMEPULSE Beteiligungs GmbH (formerly AL-KO Beteili-gungs GmbH), Munich, Germany, informed us on May 23, 2017 that its total share of the voting rights in CANCOM SE, held directly or indirectly, had exceeded the 10 percent threshold on May 23, 2017 and on that day amounted to 10.056 percent (equiva-lent to 1,646,000 voting rights).
8. Members of the Executive Board and Supervisory Board
The members of the Executive Board are:
• Klaus Weinmann, graduate in business administration (Diplom-Kaufmann), Munich, Germany (CEO)
• Rudolf Hotter, graduate in business economics (Diplom-Betriebswirt), Rosshaupten, Germany
• Thomas Volk, graduate in computer science (Diplom-Informatiker), Inning, Germany (since November 1, 2017)
• Thomas Stark, graduate in industrial engineering (Diplom-Wirtschaftsingenieur), Wittislingen, Germany (since January 1, 2018)
All members of the Executive Board are authorized to represent the company jointly with another Executive Board member or a person holding general commercial power of attorney (Prokura under German commercial law).
NOTES TO THE CONSOLIDATED FINANCIAL STATEMENTS

111NOTES TO THE CONSOLIDATED FINANCIAL STATEMENTS
The following members of the Executive Board are members of statutory supervisory boards or comparable controlling boards in commercial enterprises in Germany or other countries:
• Klaus Weinmann: - PRIMEPULSE SE - AL-KO Kober SE - CANCOM GmbH - CANCOM ICT Service GmbH (formerly NSG ICT Service GmbH) - Stemmer Imaging AG
• Rudolf Hotter: - Pironet AG - CANCOM ICT Service GmbH (formerly NSG ICT Service GmbH
• Thomas Volk: - Polecat Intelligence Ltd., Ireland - tyntec Group Ltd., United Kingdom
• Thomas Stark: - AL-KO Kober SE - Pironet AG
Supervisory Board
The members of the Supervisory Board are: • Dr. Lothar Koniarski, graduate in business administration
(Diplom-Kaufmann), managing director of Elber GmbH, Regensburg, Germany -Chairperson-
• Uwe Kemm, independent organizational, sales and marketing consultant -Deputy Chairperson-
• Regina Weinmann, graduate in business administration (Diplom-Kauffrau), managing director of ABCON Holding GmbH, Munich, Germany, ABCON Vermögensverwaltung GmbH, Munich, Germany, and Inter-Connect GmbH, Munich, Germany
• Marlies Terock, graduate translator, self-employed management consult specializing in information technology (since June 20, 2017)
• Dominik Eberle, online marketing and e-commerce consultant• Martin Wild, Chief Innovation Officer ofMediaMarktSaturn
Retail Group, Ingolstadt, Germany (since March 27, 2017)• Walter Krejci, managing director of AURIGA Corporate
Finance GmbH, Munich, Germany (until March 20, 2017)
The following members of the Supervisory Board are members of other statutory supervisory boards or comparable controlling boards in commercial enterprises in Germany or other countries:
• Dr. Lothar Koniarski: - SBF AG - DV Immobilien Gruppe - Alfmeier SE
• Martin Wild, - Digitales Gründerzentrum der Region Ingolstadt GmbH
9. Significant events after the reporting date
There were no significant events after the reporting date.
10. Proposal for the appropriation of net retained profit of CANCOM SE
The Executive Board has resolved to propose to the Supervi-sory Board and the general meeting of stockholders that the € 38,033,690.90 net retained profit from the fiscal year 2017 be used for a dividend payment of € 1.00 per eligible notional no-par value share, and that the balance of the retained profit remaining after the dividend payment be transferred to other reserves.
11. Approval of consolidated financial statements in accordance with IAS 10.17
These consolidated financial statements were approved for publica-tion by the Executive Board on March 2, 2018..

112
CANCOM GmbH and CANCOM ICT Service GmbH have availed of the exemption option provided by Section 264, paragraph 3 of the German Commercial Code.
Munich, Germany, March 2, 2018
Klaus Weinmann Rudolf Hotter Thomas Volk Thomas Stark
The Executive Board of CANCOM SE
NOTES TO THE CONSOLIDATED FINANCIAL STATEMENTS
12. Statement of ownership in accordance with Section 313 of the German Commercial Code
Subsidiaries: Sitz der Gesellschaft Beteiligungsquote in %
1. CANCOM GmbH and its subsidiaries • CANCOM (Switzerland) AG • CANCOM Computersysteme GmbH and its subsidiary • CANCOM a + d IT solutions GmbH
Jettingen-Scheppach, Germany
Caslano, Switzerland Graz, Austria
Perchtoldsdorf, Austria
100,0
100.0 100.0
100.0
2. CANCOM ICT Service GmbH Munich, Germany 100.0
3. CANCOM on line GmbH Berlin, Germany 100.0
4. Synaix Gesellschaft für angewandte Informations-Technologien mbH Aachen, Germany 100.0
5. synaix Service GmbH Aachen, Germany 100.0
6. Pironet AG and its subsidiaries • PIRONET Datacenter AG & Co. KG • PIRONET Enterprise Solutions GmbH • PIRONET NDH LLC • PIRONET NDH Beteiligungs GmbH
Cologne, Germany
Hamburg, Germany Cologne, Germany
Atlanta, U.S.A. Cologne, Germany
94.96
94.96 94.96 94.96 94.96
7. CANCOM SCS GmbH Munich, Germany 100.0
8. CANCOM ICP GmbH Munich, Germany 100.0
9. c.a.r.u.s. Information Technology GmbH Hannover Hanover, Germany 100.0
10. CANCOM physical infrastructure GmbH Jettingen-Scheppach, Germany 100.0
11. CANCOM, Inc. and its subsidiary • HPM Incorporated
Palo Alto, U.S.A.
Pleasanton, U.S.A.
100.0
100.0
12. Cancom on line BVBA Elsene, Belgium 100.0
13. CANCOM Ltd London, U.K. 100.0
14. CANCOM Financial Services GmbH Jettingen-Scheppach, Germany 100.0
15. CANCOM VVM GmbH Jettingen-Scheppach, Germany 100.0

113RESPONSIBILITY STATEMENT OF THE CONSOLIDATED FINANCIAL STATEMENT
Responsibility Statement
The members of the Executive Board have assured that, to the best of their knowledge and in accordance with the applicable reporting principles, the financial statements and the management report of CANCOM SE and of CANCOM Group give a true and fair view of the assets, liabilities, financial position and profit or loss of the company, give a true overall picture of the company’s situation, and present an accurate view of the opportunities and risks of future development of the group.
Munich, Germany, March 2, 2018
Klaus Weinmann Rudolf Hotter Thomas Volk Thomas Stark
The Executive Board of CANCOM SE

114 AUDITORS‘ REPORT
Auditor’s report
to CANCOM SE, Munich, Germany
Report on the audit of the consolidated financial statements and the Group management report
Audit opinions
We have audited the consolidated financial statements of CANCOM SE, Munich, Germany, and its subsidiaries (the Group) – consisting of the consolidated balance sheet at December 31, 2017 and the consolidated statement of income, the consolidated statement of comprehensive income, the consolidated statement of changes in equity, the consolidated cash flow statement for the fiscal year from January 1 to December 31, 2017, and the notes to the consolidated accounts, including a summary of significant accounting methods. We also audited the Group management report of CANCOM SE, which is combined with the management report for the company, for the fiscal year from January 1 to December 31, 2017.
In our opinion, based on the information we obtained during our audit,
• the accompanying consolidated financial statements conform in all material respects with International Financial Reporting Standards (IFRS) as applicable in the European Union, and with the requirements of German law pursuant to Section 315e, paragraph 1 of the German Commercial Code (Handelsgesetz-buch, HGB), and give a true and fair view of the assets and the financial situation of the Group as at December 31, 2017 and of its earnings for the fiscal year from January 1 to December 31, 2017 in compliance with these requirements; and
• the accompanying Group management report gives a true overall picture of the Group’s situation. The Group management report is consistent with the consolidated financial statements in all material respects. It complies with German legal require-ments and presents an accurate view of the opportunities and risks of future development.
In line with Section 322, paragraph 3, sentence 1 of the German Commercial Code, we declare that our audit did not give rise to any objections as to the legal compliance of the consolidated finan-cial statements or of the Group management report.
Basis for the audit opinions
We conducted our audit of the consolidated financial statements and the Group management report in accordance with Section 317 of the German Commercial Code and European Union Regulation (EU) No. 537/2014 on specific requirements regarding statutory audit of public-interest entities, and in compliance with the German Generally Accepted Standards on Auditing (Grundsätze ordnungsgemäßer Abschlussprüfung) laid down by the German Institute of Public Auditors in Germany (Institut der Wirtschafts-prüfer, IDW). Our responsibility pursuant to these provisions and principles is described in more detail in the section of this auditor’s report headed ‘Auditor’s responsibility for auditing the consolidated financial statements and the Group management report’. We are independent of the company, in compliance with the provisions of European law and German commercial and professional regulations, and we have fulfilled our other German professional obligations in compliance with these requirements. We also declare, in line with Article 10, paragraph 2 (f) of European Union Regulation (EU) No. 537/2014, that we have not provided any of the non-audit services prohibited under Article 5 of the above Regulation. We believe the audit evidence collected by us is sufficient and appropriate as a basis for our audit opinions on the consolidated financial statements and the Group manage-ment report.
Key audit matters in the auditing of the consolidated financial statements
Key audit matters are those that, in our professional judgement, were of most significance in our audit of the consolidated financial statements for the fiscal year from January 1 to December 31, 2017. We took these facts into account in the context of our audit of the consolidated financial statements as a whole and in forming our audit opinion; we do not issue separate audit opinions on these facts.
In our view, the key audit matters are:
1) impairment of goodwill;2) accounting for acquisitions made in the fiscal year.
115AUDITORS‘ REPORT
We structured our presentation of these key audit matters as follows:
1) reasons for designation as a key audit matter and risk for the financial statements;
2) conduct of the audit;3) conclusions and further information.
1) Impairment of goodwill
1) Goodwill of € 115,219 thousand is shown in the consolidated financial statements of CANCOM SE under non-current assets. Goodwill is tested for impairment at least once every fiscal year. The basis for these measurements is usually the present value of the future cash flows of the cash generating unit to which the goodwill concerned is to be allocated. The measure-ments are derived from the forecasts of the individual cash generating units, which are based on the budgets approved by the management. The values are discounted at the weighted average cost of capital of the relevant cash generating unit. No write-downs were carried out as a result of the impairment test.
The result of the measurements is dependent, in particular, on the estimation of future cash flows by the legal representatives and on the discount rate used. The valuations are therefore subject to some uncertainty.
2) We are satisfied that the future cash flows on which the measurements are based, and the discount rates used, are an appropriate basis overall for the impairment tests of the indi-vidual cash generating units. Our estimate was based, among other things, on a comparison with general and sector-specific market expectations, and the management’s comments on the key value drivers of the plans. In view of the fact that even rela-tively small changes in the discount rate used can sometimes have a considerable impact on values, we also evaluated the parameters employed in determining the discount rate used and evaluated the calculation model. We also conducted our own sensitivity analyses for the cash generating units with a low carrying amount to present value ratio in order to estimate any potential impairment risk in the event of a potential change in one of the key assumptions on which the measure-ment is based.
3) We believe the measurement parameters and assumptions used by the management to test for impairment are appropriate. Please see section C.8.3. of the notes to the consolidated finan-cial statements.
2) Accounting for acquisitions made in the fiscal year
1) CANCOM made acquisitions worth a total of € 69.9 million in the fiscal year 2017. The acquired assets and liabilities are recognized at their fair values at the date of acquisition. The amount recognized as goodwill is the remaining portion of the purchase price not allocated to the acquired assets and liabili-ties in the purchase price allocation. For certain assets acquired, especially brands and client relationships, there are no observ-able market prices available. Complex measurement models based on assumptions are therefore used to determine the relevant fair values. The result of the measurement is highly dependent on the estimated future cash flows and on the cost of capital used, and is subject to considerable uncertainty due to its discretionary nature. In view of this and the underlying complexity of the measurement models, there is a risk for the financial statements that the fair values (especially the intan-gible assets) might not have been determined appropriately. In addition there is a risk that the disclosures pursuant to IFRS 3 in the notes to the consolidated financial statements might not be appropriate.
2) With the help of our measurement specialists, we evaluated the appropriateness of the measurement models and the forecasts on which measurement is based. This involved assessing the mathematical accuracy of the measurement models as well as evaluating the expectations regarding the future short-, medium- and long-term trend in sales revenues and costs, on the basis of external market data and by consulting the management. In our audit we also focused on the identifica-tion of value drivers for the identified intangible assets to be measured. We assessed whether the assumptions regarding the value drivers for client relationships (grouping of clients, duration, attrition rates, risk premiums) are appropriate and in line with those observable in the market. For the goodwill resulting from the purchase price allocation, we analyzed the key synergy drivers and assessed them on the basis of the information and evidence provided to us. We also focused on the assumptions and parameters used to determine the

116 AUDITORS‘ REPORT
weighted costs of capital, especially the appropriate peer group determination for establishing the costs of equity, and we eval-uated the calculation model.
We also assessed whether the disclosures in accordance with IFRS 3 in the notes to the consolidated financial statements were appropriate.
3) Overall, the company acquisitions displayed in the consolidated financial statements were made on the basis of appropriate measurement models, assumptions and figures. Please see also section A.3. of the notes to the consolidated financial state-ments.
The disclosures made in the notes to the consolidated financial statements are complete and correct.
Other information
The legal representatives are responsible for the other information. The other information comprises
• the Group corporate governance declaration; and
• the other parts of the annual report, with the exception of the audited consolidated financial statements and Group manage-ment report and this auditor’s report.
Our audit opinions on the consolidated financial statements and the Group management report do not extend to the other informa-tion, and we therefore do not give any audit opinion or draw any other form of conclusions on it.
In the context of our audit we are responsible for reading the other information and evaluating whether
• there are any substantial inconsistencies between it and the consolidated financial statements, the Group management report or the knowledge we have gained during the audit; or
• it is substantially misrepresented in any other way.
If, on the basis of the work we have carried out, we reach the conclusion that this other information has been substantially misrepresented, we are obliged to report this. We have nothing to report in this respect.
Responsibility of the legal representatives and the Supervi-sory Board for the consolidated financial statements and the Group management report
The legal representatives are responsible for the preparation of the consolidated financial statements, which comply in all material respects with IFRS as applicable in the European Union, and with the provisions of German law under Section 315e, paragraph 1 of the German Commercial Code, and for ensuring that the consoli-dated financial statements give a true and fair view of the assets, financial and earnings situation of the Group in compliance with these requirements. The legal representatives are also responsible for the internal controls they have deemed necessary to enable the preparation of consolidated financial statements free from material misstatement, either intended or unintended.
When drawing up the consolidated financial statements, the legal representatives are responsible for assessing the Group’s capacity to continue operating as a going concern. They are also responsible for disclosing, where relevant, any facts connected with the future of the enterprise as a going concern. Additionally, they are respon-sible for accounting on the basis of the going concern principle, unless the intention is to liquidate the Group or cease business activities, or there is no realistic alternative.

117AUDITORS‘ REPORT
The legal representatives are also responsible for preparing the Group management report, which gives a true overall picture of the Group’s situation and is in all material respects consistent with the consolidated financial statements, complies with German legal requirements and presents an accurate view of the opportunities and risks of future development. Additionally, the legal repre-sentatives are responsible for all the arrangements and measures (systems) they have deemed necessary to enable the preparation of a Group management report in compliance with the applicable German legal requirements and the provision of sufficient and appropriate evidence to support the statements in the Group management report.
The Supervisory Board is responsible for overseeing the Group’s accounting process for the preparation of the consolidated finan-cial statements and of the Group management report.
Auditor’s responsibility for auditing the consolidated financial statements and the Group management report
Our objective is to provide reasonable assurance that the consol-idated financial statements as a whole are free from material misstatement, whether intended or unintended, and that the Group management report gives a true overall picture of the Group’s situation and is in all material respects consistent with the consolidated financial statements and with the knowledge we have gained during the audit; that it complies with German legal requirements and presents an accurate view of the opportunities and risks of future development; and to issue an auditor’s report containing our audit opinion regarding the consolidated financial statements and the Group management report.
Reasonable assurance is a high level of assurance, but not a guar-antee, that an audit conducted in accordance with Section 317 of the German Commercial Code and European Union Regulation (EU) No. 537/2014 and in compliance with the German Generally Accepted Standards on Auditing laid down by the German Insti-tute of Public Auditors will always reveal any material misstate-ment. Misstatements may result from errors or fraud and are considered material if they could reasonably be expected, either individually or together, to influence the economic decisions of users taken on the basis of these consolidated financial statements and the Group management report.
Throughout the audit process, we exercise professional judgement and apply professional skepticism. Additionally, we
• identify and assess the risks of material misstatement – whether intended or unintended – in the consolidated financial state-ments and the Group management report, plan and conduct audit procedures in response to these risks, and collect sufficient appropriate audit evidence as a basis for our audit opinions. The risk of material misstatements not being detected is greater in cases of fraud than in cases of error, as fraud may involve collu-sion, forgery, deliberate omissions, misleading representations or the bypassing of internal controls;
• gain an understanding of the internal control system relevant to the audit of the consolidated financial statements and of the arrangements and measures relevant to the audit of the Group management report, which enables us to plan audit procedures that are appropriate to the circumstances, although not with the objective of providing an audit opinion on the effectiveness of such systems;
• assess whether the accounting methods used by the legal repre-sentatives are appropriate and whether the estimated values and related disclosures presented by the legal representatives are reasonable;
• draw conclusions as to whether the going concern principle is appropriate as a basis for accounting by the legal representatives and – on the basis of the audit evidence collected – whether there is a material uncertainty in connection with events or circumstances which could raise significant doubts as to the Group’s capacity to continue operating as a going concern. If we conclude that there is a material uncertainty, we are obliged to draw attention to the related disclosures in the consolidated financial statements and Group management report in our auditor’s report or, if these disclosures are inappropriate, to modify the relevant audit opinion. We draw our conclusions on the basis of the audit evidence collected up to the date of our auditor’s report. However, future events or circumstances may lead to the Group no longer being able to continue as a going concern;

118 AUDITORS‘ REPORT
• assess the overall presentation, structure and content of the consolidated financial statements, including the disclosures, and whether the financial statements present the underlying transac-tions and events in such a way that the consolidated financial statements give a true and fair view of the assets, financial and earnings situation of the Group in compliance with IFRS as applicable in the European Union and with the provisions of German law under Section 315e, paragraph 1 of the German Commercial Code;
• obtain sufficient appropriate audit evidence regarding the accounting information of the entities or business activities within the Group to express opinions on the consolidated finan-cial statements and on the Group management report. We are responsible for directing, overseeing and conducting the audit of the consolidated financial statements. We bear sole responsibi-lity for our audit opinions;
• assess whether the Group management report is consistent with the consolidated financial statements and complies with the law, and evaluate the view it presents of the Group’s situation;
• carry out audit procedures on the forward-looking statements presented by the legal representatives in the Group management report. On the basis of sufficient appropriate audit evidence, we examine the significant assumptions on which the forward-loo-king statements by the legal representatives are based, and assess the appropriateness of these assumptions as a basis for the forward-looking statements. We do not provide any separate audit opinion on the forward-looking statements or on the underlying assumptions. There is a considerable and unavoi-dable risk that future events might differ materially from those presented in the forward-looking statements.
We discuss with those charged with governance the planned scope and scheduling of the audit, in addition to significant audit findings, including any deficiencies in the internal control system that we establish in the course of our audit.
We provide those charged with governance with a declaration that we meet the relevant independence requirements and discuss with them all relationships and other matters that may reasonably be considered to have a bearing on our independence, and the related safeguards.
From the matters discussed with those charged with governance, we determine those matters that were of most significance in the audit of the consolidated financial statements for the period under review and are therefore the key audit matters. We describe these matters in the auditor’s report, unless laws or other regulations preclude the public disclosure of such matters.

119AUDITORS‘ REPORT
Other legal and regulatory requirements
Other disclosures in line with Article 10 of European Union Regulation (EU) No. 537/2014
We were appointed by the general meeting of stockholders on June 20, 2017 to audit the consolidated financial statements. We were engaged by the Audit Committee on December 5, 2017. We have audited the consolidated financial statements of CANCOM SE every year since the fiscal year 1998.
We declare that the audit opinions in this report are in line with the additional report to the Supervisory Board required under Article 11 of European Union Regulation (EU) No. 537/2014.
Auditor responsible for the audit
The auditor responsible for the audit is Ulrich Stauber.
Augsburg, Germany, March 2, 2018
S&P GmbH Wirtschaftsprüfungsgesellschaft
Stauber ThomasWirtschaftsprüfer (Certified auditor) Wirtschaftsprüfer (Certified auditor)

120 COMPANY FINANCIAL STATEMENTS
SE Company balance sheet as at December 31, 2017
ASSETS
Dec. 31, 2017 €
Dec. 31, 2016 €
A. FIXED ASSETS
I. Intangible fixed assets
purchased concessions, industrial and similar rights and assets, and licenses in such rights and assets 138,822 187,672
II. Property, plant and equipment (tangible fixed assets)
1. Technical equipment and machinery 50,059 71,110
2. Other equipment, operating and office equipment 479,000 424,324
529,059 495,434
III. Long-term financial assets
1. Shares in affiliated companies 246,163,438 182,521,127
2. Loans to affiliated companies 13,461,987 11,363,704
3. Long-term equity investments (Stockholding of less than 20 percent) 200,067 100,000
4. Long-term securities 5,047,852 630,232
264,873,343 194,615,063
B. CURRENT ASSETS
I. Accounts receivable and other assets
1. Trade accounts payable 10,147 69,020
2. Accounts receivable from affiliated companies 54,311,165 47,985,790
3. Other assets 660,286 1,483,795
54,981,598 49,538,605
II. Cash in hand, central bank balances, cash on banks and checks 56,739,605 95,769,012
C. PREPAID EXPENSES 92,765 67,163
377,355,191 340,672,949

121COMPANY FINANCIAL STATEMENTS
EQUITY AND LIABILITIES
Dec. 31, 2017 €
Dec. 31, 2016 €
A. EQUITY
I. Capital stock 17,521,819 16,367,531
II. Capital reserves 225,244,173 177,328,367
III. Revenue reserves
1. Statutory reserves 6,666 6,666
2. Other reserves 81,985,487 62,924,684
81,992,153 62,931,350
IV. Net retained profit/ net accumulated loss 38,033,691 27,244,568
362,791,836 283,871,816
B. PROVISIONS
1. Tax provisions 9,245,294 8,531,923
2. Other provisions 2,862,932 2,569,373
12,108,226 11,101,296
C. LIABILITIES
1. Bonds
a) Convertible bonds 0 42,160,877
b) Subordinated loans 1,592,064 2,189,091
2. Liabilities to banks 597,007 820,891
3. Trade accounts receivable 119,451 112,234
4. Liabilities to affiliated companies 65 11
5. Other liabilities 138,985 407,591
2,447,572 45,690,695
D. DEFERRED INCOME 7,558 9,142
377,355,191 340,672,949

122 COMPANY FINANCIAL STATEMENTS
Statement of income for the period from January 1 to December 31, 2017
2017 €
2016 €
1. Sales revenues 7,696,982 7,778,787
2. Other operating income 873,667 948,191
3. Human resources expenses
a) Wages and salaries -6,376,052 -5,895,852
b) Social security, pension, and other staff benefit costs -583,711 -521,097
-6,959,763 -6,416,949
4. Depreciation, amortization and write-downs:
Amortization and write-downs of intangible fixed assets, and depreciation and write-downs of property, plant and equipment (tangible fixed assets) -230,041 -245,554
5. Other operating expenses -2,972,614 -3,865,995
6. Income from long-term equity investments 7,519,996 1,645,114
7. Profits received under a profit transfer agreement 45,761,615 38,967,447
8. Interest and similar income 1,930,723 1,370,203
9. Interest and similar expenses -1,211,198 -1,735,648
10. Income taxes -14,373,932 -11,199,599
11. Earnings after taxes 38,035,435 27,245,997
12. Other taxes -1,744 -1,429
13. Net income for the year 38,033,691 27,244,568
14. Retained profit/accumulated loss brought forward from previous year 27,244,568 30,638,473
15. Allocation to revenue reserves/to other revenue reserves -19,060,803 -22,454,708
16. Distribution -8,183,766 -8,183,766
17. Net retained profit 38,033,691 27,244,568


124
Schedule of changes in fixed assets
ACQUISITION/PRODUCTION COSTS AMORTIZATION, DEPRECIATION AND WRITE-DOWNS CARRYING AMOUNTS
Balance as at Jan 1, 2017
€
Additions 2017
€
Disposals 2017
€
Balance as at Dec. 31, 2017
€
Balance as at Jan. 1, 2017
€
Additions 2017
€
Disposals 2017
€
Balance as at Dec. 31, 2017
€
Balance as at Dec. 31, 2017
€
Balance as at Dec. 31,2016
€
I. Intangible fixed assets
Purchased concessions, industrial and similar rights and assets, and licenses in such rights and assets 301,772.16 21,950.00 43,380.00 280,342.16 114,099.99 70,800.53 43,380.00 141,520.52 138,821.64 187,672.17
301,772.16 21,950.00 43,380.00 280,342.16 114,099.99 70,800.53 43,380.00 141,520.52 138,821.64 187,672.17
II. Property, plant and equipment (tangible fixed assets)
1. Technical equipment and machinery 324,193.43 0.00 0.00 324,193.43 253,083.27 21,050.93 0.00 274,134.20 50,059.23 71,110.16
2. Other equipment, operating and office equipment 948,993.50 211,749.26 187,388.19 973,354.57 524,669.26 138,189.72 168,504.31 494,354.67 478,999.90 424,324.24
1,273,186.93 211,749.26 187,388.19 1,297,548.00 777,752.53 159,240.65 168,504.31 768,488.87 529,059.13 495,434.40
III. Long-term financial assets
1. Shares in affiliated companies 182,521,127.27 63,642,310.30 0.00 246,163,437.57 0.00 0.00 0.00 0.00 246,163,437.57 182,521,127.27
2. Loans to affiliated companies 11,363,703.70 2,098,282.94 0.00 13,461,986.64 0.00 0.00 0.00 0.00 13,461,986.64 11,363,703.70
3. Long-term equity investments (stockholding of less than 20 percent) 100,000.00 100,067.10 0.00 200,067.10 0.00 0.00 0.00 0.00 200,067.10 100,000.00
4. Long-term securities 630,231.75 4,417,620.00 0.00 5,047,851.75 0.00 0.00 0.00 0.00 5,047,851.75 630,231.75
194,615,062.72 70,258,280.34 0.00 264,873,343.06 0.00 0.00 0.00 0.00 264,873,343.06 194,615,062.72
Total 196,190,021.81 70,491,979.60 230,768.19 266,451,233.22 891,852.52 230,041.18 211,884.31 910,009.39 265,541,223.83 195,298,169.29
COMPANY FINANCIAL STATEMENTS

125
Schedule of changes in fixed assets
ACQUISITION/PRODUCTION COSTS AMORTIZATION, DEPRECIATION AND WRITE-DOWNS CARRYING AMOUNTS
Balance as at Jan 1, 2017
€
Additions 2017
€
Disposals 2017
€
Balance as at Dec. 31, 2017
€
Balance as at Jan. 1, 2017
€
Additions 2017
€
Disposals 2017
€
Balance as at Dec. 31, 2017
€
Balance as at Dec. 31, 2017
€
Balance as at Dec. 31,2016
€
I. Intangible fixed assets
Purchased concessions, industrial and similar rights and assets, and licenses in such rights and assets 301,772.16 21,950.00 43,380.00 280,342.16 114,099.99 70,800.53 43,380.00 141,520.52 138,821.64 187,672.17
301,772.16 21,950.00 43,380.00 280,342.16 114,099.99 70,800.53 43,380.00 141,520.52 138,821.64 187,672.17
II. Property, plant and equipment (tangible fixed assets)
1. Technical equipment and machinery 324,193.43 0.00 0.00 324,193.43 253,083.27 21,050.93 0.00 274,134.20 50,059.23 71,110.16
2. Other equipment, operating and office equipment 948,993.50 211,749.26 187,388.19 973,354.57 524,669.26 138,189.72 168,504.31 494,354.67 478,999.90 424,324.24
1,273,186.93 211,749.26 187,388.19 1,297,548.00 777,752.53 159,240.65 168,504.31 768,488.87 529,059.13 495,434.40
III. Long-term financial assets
1. Shares in affiliated companies 182,521,127.27 63,642,310.30 0.00 246,163,437.57 0.00 0.00 0.00 0.00 246,163,437.57 182,521,127.27
2. Loans to affiliated companies 11,363,703.70 2,098,282.94 0.00 13,461,986.64 0.00 0.00 0.00 0.00 13,461,986.64 11,363,703.70
3. Long-term equity investments (stockholding of less than 20 percent) 100,000.00 100,067.10 0.00 200,067.10 0.00 0.00 0.00 0.00 200,067.10 100,000.00
4. Long-term securities 630,231.75 4,417,620.00 0.00 5,047,851.75 0.00 0.00 0.00 0.00 5,047,851.75 630,231.75
194,615,062.72 70,258,280.34 0.00 264,873,343.06 0.00 0.00 0.00 0.00 264,873,343.06 194,615,062.72
Total 196,190,021.81 70,491,979.60 230,768.19 266,451,233.22 891,852.52 230,041.18 211,884.31 910,009.39 265,541,223.83 195,298,169.29
COMPANY FINANCIAL STATEMENTS

126
Notes to the company accountsfor the fiscal year 2017
A. General information
CANCOM SE is based in Munich, Germany, and is registered in the commercial register of Munich Local Court (Amtsgericht) under HRB 203845.
The company is a large joint-stock company, for the purposes of Section 267, paragraph 3 of the German Commercial Code (Handelsgesetzbuch, HGB). The accounting and valuation methods are subject to the provisions of the German Commercial Code on financial reporting for joint-stock companies, as amended by the German Accounting Directive Implementation Act (Bilanzricht-linie-Umsetzungsgesetz, BilRUG), in addition to the supplementary provisions of the German Stock Corporation Act (Aktiengesetz, AktG), and Council Regulation (EC) No. 2157/2001 on the Statute for a European Company (SE).
The financial statements were drawn up in euro. Rounding of figures may result in apparent inconsistencies between totals and sums of constituent parts. For the same reason, percentages may not exactly match the aggregate values shown or total 100 percent.
B. Accounting and valuation principles
Intangible fixed assets
Intangible fixed assets subject to amortization are valued at acqui-sition cost less pro-rata amortization according to plan (based on a useful life of three years). Items are written down according to the straight-line method of amortization.
Property, plant and equipment (tangible fixed assets)
Property, plant and equipment (tangible fixed assets) are recog-nized at cost less depreciation according to plan or write-downs. Depreciation is calculated by the straight-line method.
A useful life of between 3 and 14 years is applied to property, plant and equipment (tangible fixed assets). Assets will be written down if their impairment is expected to be permanent.
Low-value assets with acquisition costs of € 150 or less are written off in full as operating costs in the year of their acquisition.
Since January 1, 2008, assets with acquisition costs of between € 150 and € 1,000 are capitalized in a collective item. All assets for the whole year are accumulated in this collective item and depreci-ated over five years by the straight-line method.
Long-term financial assets
Long-term financial assets are valued at acquisition cost or at the lower fair value in the event of permanent impairment.
Accounts receivable and other assets
Accounts receivable and other assets are carried at their nominal value and, where applicable, at their lower fair value.
Cash and cash equivalents (liquid funds)
Cash and cash equivalents (liquid funds) have been valued at their nominal value.
Equity
Subscribed capital has been valued at its nominal value.
Provisions
Provisions have been measured at their settlement values according to reasonable commercial assessment, and take account of all identifiable risks, contingent liabilities and anticipated losses.
Liabilities
Liabilities are recognized at their settlement values.
NOTES TO THE COMPANY ACCOUNTS

127
Deferred taxes
If a tax burden is expected overall in future fiscal years, an excess of deferred tax liabilities is recognized for the differences between the financial and tax recognition of assets, liabilities and prepaid expenses/deferred income. If a future tax benefit is expected overall, the company does not recognize deferred tax assets, which is an option offered by Section 274, paragraph 1, sentence 2 of the German Commercial Code. Loss carryovers are taken into account to the extent that they can be offset against taxable income within the next five years. Additionally, differences between the financial and tax recognition of the assets, liabilities and prepaid expenses/deferred income of subsidiaries are taken into account to the extent that future tax burdens and tax benefits are anticipated from the reversal of temporary differences at the parent company, CANCOM SE.
Deferred taxes are measured on the basis of the tax rates appli-cable in the future fiscal year in which the temporary differences in measurement are reversed, provided that the future tax rates are already known. The income tax rate is 31.1 percent (2016: 30.6 percent) and consists of corporate tax and trade tax as well as the solidarity surcharge. The slight increase in the income tax rate on the previous year is due to a higher average rate of trade tax connected with the merger of Antauris-Aktiengesellschaft into CANCOM GmbH and the increase in the trade tax rates in some cities.
Basis for currency conversion
Accounts payable and receivable in currencies other than the euro within the Group are converted at the average spot rate on the balance sheet date. Monetary balance sheet items in currencies other than the euro were also converted at the rate applicable on the reporting date.
Accounts payable and receivable with a remaining term to matu-rity of less than one year are converted at the average spot rate on the reporting date in line with Section 256a of the German Commercial Code. Accounts payable with a remaining term to maturity of more than one year are converted at the higher rate if applicable, while accounts receivable and other monetary assets with a remaining term to maturity of more than one year are converted at the lower rate on the reporting date, where applicable. This can give rise to gains or losses from exchange rate fluctua-tions.
C. Explanations and disclosures concerning individual balance sheet items
Fixed assets
Changes in fixed assets are shown in the statement of changes in fixed assets (Appendix 3, page 11).
For the composition of the financial assets and the net income/(loss) for the year of the individual subsidiaries, please see the statement of stockholdings in companies (Appendix 3, page 13).
Loans to affiliated companies relate to a long-term loan to CANCOM Inc. of € 13,462 thousand (2016: 11,364 thousand).
Accounts receivable and other assets
All accounts receivable and other assets have a residual term of less than one year.
Accounts receivable from affiliated companies amount to € 54,311 thousand (2016: € 47,986 thousand). These relate to CANCOM GmbH (€ 35,613 thousand; 2016: € 41,082 thousand), CANCOM ICT Service GmbH – formerly NSG ICT Service GmbH – (€ 7,917 thousand; 2016: € 4,731 thousand), CANCOM on line GmbH (€ 5,074 thousand; 2016: € 165 thousand), synaix Gesellschaft für angewandte Informations-Technologien mbH (€ 2,209 thousand; 2016: € 0 thousand), CANCOM SCS GmbH (€ 2,143 thousand; 2016: € 258 thousand), CANCOM Computersysteme GmbH (€ 674 thousand; 2016: € 1,242 thousand), CANCOM physical infrastruc-ture GmbH (€ 621 thousand; 2016: € 381 thousand), CANCOM Pironet AG & Co. KG – formerly PIRONET Datacenter AG & Co. KG – (€ 23 thousand; 2016: € 38 thousand), CANCOM a+d IT solutions GmbH (€ 22 thousand; 2016: € 22 thousand), CANCOM ICP GmbH (€ 11 thousand; 2016: € 61 thousand), PIRONET Enterprise Solu-tions GmbH (€ 3 thousand; 2016: € 3 thousand), Pironet AG (€ 1 thousand; 2016: € 2 thousand), and CANCOM on line BVBA (€ 0 thousand; 2016: € 1 thousand).
Of the accounts receivable from affiliated companies, loans account for € 8,424 thousand (2016: € 7,462 thousand), other current assets for € 47,970 thousand (2016: € 39,360 thousand) and trade accounts receivable (offset against other assets) for minus € 2,083 thousand (2016: € 1,164 thousand).
NOTES TO THE COMPANY ACCOUNTS

128
Capital stock
In accordance with the by-laws, the company’s capital stock at December 31, 2017 was € 16,553,245 (2016: € 16,367,531), divided into 16,553,245 (2016: 16,367,531) no-par value shares. However, the conversion of CANCOM SE’s convertible bonds into shares in the company increased the capital stock further during the fiscal year. The company’s contingent capital 2013/I was used for this increase, in line with the company’s by-laws. The change to the company’s by-laws associated with this conversion had not yet been recorded in the commercial register on the reporting date. The company’s capital stock as at the time of publication of this report is € 17,521,819, divided into 17,521,819 no-par value shares.
Authorized and conditional capital
In conformity with the corporate by-laws, the company’s autho-rized capital stock totaled € 5,766,116 as at December 31, 2017; and is regulated as follows:
A resolution passed at the general meeting of shareholders on June 18, 2015 authorizes the Executive Board to increase the capital stock once or in several steps by up to a total of € 7,439,787 by issuing up to 7,439,787 new notional no-par value bearer shares for a cash or non-cash consideration (authorized capital I/2015). The shares must be issued by June 17, 2020 and any issue of shares is subject to the approval of the Supervisory Board. In general, shareholders will be granted subscription rights, but the Exec-utive Board is authorized to exclude the shareholders’ statutory subscription rights in the following cases with the approval of the Supervisory Board:
• for fractional amounts;• if a capital increase for a cash consideration does not exceed 10
percent of the capital stock and the issue price of the new shares is not significantly lower than the stock market price (Section 186, paragraph 3, sentence 4 of the German Stock Corporation Act). If this authorization is used and shareholders‘ subscription rights are excluded in accordance with the above Act, the exclu-sion of subscription rights on the basis of other authorizations in accordance with the same Act must be taken into account;
• for capital increases for a non-cash consideration to grant new shares for the purpose of acquiring companies or equity interests in companies or parts of companies, or for a debt-for-equity swap.
The Executive Board will determine the nature of the relevant rights conferred by the shares and the conditions for carrying out capital increases, subject to the approval of the Supervisory Board.
The Executive Board made use of the above authorization as follows during the fiscal year 2017:
The Executive Board has made partial use of the authorization granted by resolution of the general meeting of stockholders of CANCOM SE on June 18, 2015 to increase the company’s capital stock by issuing up to 7,439,787 new no-par value bearer shares (authorized capital 2015/I). On July 10, 2017, with the agreement of the Supervisory Board, it decided to increase the company’s capital stock by € 185,754, from € 16,367,531 to € 16,553,245, for a non-cash consideration by issuing 185,714 new no-par value bearer shares, with each share representing € 1 of the capital stock. The new shares were issued against non-cash contributions and carry dividend rights from January 1, 2018. Stockholder subscrip-tion rights were disapplied pursuant to section 4, paragraph 4, sentence 3, second indent, of the corporate by-laws (Section 186, paragraph 3, sentence 4 of the German Stock Corporation Act). Following the capital increase, the company’s capital stock was € 16,553,245, divided into 16,553,245 no-par value bearer shares. Each share had an accounting par value of € 1 of the capital stock. Of the authorized capital (2015/I), € 5,766,116 remains unused.
In accordance with the corporate by-laws, the conditional capital at December 31, 2017 amounted to € 1,450,000. The details of the conditional capital are as follows:
The capital stock is increased conditionally by up to € 1,450,000 by the issue of up to 1,450,000 new no-par value shares (contingent capital 2013/I). The conditional increase in capital will only be implemented to the extent that holders of the convertible bond issued on March 27, 2014 exercise their conversion rights in line with the terms and conditions of the bond. The shares will be issued at the relevant conversion price under the terms and conditions of the bond. The new shares will carry dividend rights from the beginning of the fiscal year for which, at the time of their issue, no resolution of the general meeting of stockholders has been passed on the appropriation of the net retained profit. The Executive Board is authorized to determine the other details for the implementation of the conditional capital increase with the approval of the Supervisory Board.
The exercising of conversion rights by holders of the convertible bond issued by CANCOM SE resulted in the issue of 968,574 new no-par value bearer shares in the fiscal year 2017. This increased the capital stock of CANCOM SE by € 968,574 to € 17,521,819. The increase in the capital stock had not yet been recorded in the commercial register of the Munich local court (HRB 203845) on the reporting date. Of the contingent capital (2013/I), € 481,426 remains unused.
The Executive Board is not aware of any restrictions on voting rights or on the transfer of shares..
NOTES TO THE COMPANY ACCOUNTS

129
Capital reserves
The capital reserves consist of the following:
2017 € ‘000
2016 € ‘000
Capital reserves at January 1, 2017 177,328 112,602
Increase in capital stock 9,814 64,726
Increase in capital stock 38,102 0
Capital reserves 225,244 177,328
Other revenue reserves
The other revenue reserves consist of the following:
2017 € ‘000
2016 € ‘000
Other revenue reserves at January 1, 2017 62,925 40,470
Allocation from net retained profit 19,060 22,455
Other revenue reserves 81,985 62,925
Net retained profit
The net retained profit breaks down as follows:
2017 € ‘000
2016 € ‘000
Profit brought forward at January 1, 2017 27,245 30,638
Dividend distribution -8,184 -8,183
Reclassification to other revenue reserves -19,061 -22,455
Net income for the year 38,034 27,245
Net retained profit 38,034 27,245
Other provisions
The other provisions comprise bonus payments (€ 2,030 thou-sand; 2016: € 1,850 thousand), emoluments to Supervisory Board members (€ 205 thousand; 2016: € 205 thousand), financial statements and audit fees (€ 161 thousand; 2016: € 138 thousand), outstanding bills (€ 172 thousand; 2016: € 120 thousand), storage obligations (€ 98 thousand; 2016: 98 thousand), variable salary components (€ 93 thousand; 2016: € 46 thousand), future tax
audits (€ 41 thousand; 2016: € 35 thousand), vacation entitlements (€ 26 thousand; 2016: € 34 thousand), benefit from rent-free period (€ 26 thousand; 2016: € 32 thousand) and provisions for the German employers’ liability insurance association (€ 11 thousand; 2016: € 11 thousand).
Liabilities
For a breakdown of liabilities, please see the statement of liabilities (Appendix 3, page 14).
The position Bonds comprises subordinated loans and, as in the previous year, convertible bonds.
The position subordinated loans includes two subordinated loans of € 1,330,400 (2016: € 1,829,300) and € 261,664 (2016: € 359,791) towards Stadtsparkasse Augsburg.
A loan of € 1,995,600 from Stadtsparkasse Augsburg was granted in tranches of € 1,500,000 on September 23, 2009 and € 495,600 on December 8, 2009, at an interest rate of 4.25 percent per annum. This is a specific-purpose loan out of funds from Germa-ny’s publicly-owned development bank, Kreditanstalt für den Wiederaufbau (KfW). Repayment in 12 quarterly instalments of € 166,300 each has commenced on December 30, 2016.
A loan of € 392,500 from Stadtsparkasse Augsburg was granted on December 8, 2009, at an interest rate of 4 percent per annum. This is another specific-purpose loan from Kreditanstalt für den Wiederaufbau (KfW). Repayment in 11 quarterly instalments of € 32,709 each and a final instalment of € 32,701 has commenced on December 30, 2016.
CANCOM SE issued a convertible bond for a total nominal amount of € 45,000 thousand in March 2014. The bonds mature in March 2019 and the holders are entitled to convert their bonds into a total of up to 1,055,510 new no-par value bearer shares in CANCOM SE. The denomination per unit is € 100,000. The initial conversion price is € 42.6334 per share. The conversion ratio is therefore 2,345.5788 shares per bond at the relevant nominal amount of € 100,000. The conversion right for the bonds can be exercised throughout its term to maturity.
CANCOM SE was entitled to redeem the convertible bond in accor-dance with section 5 (b) of the issuing conditions of March 20, 2014, by notifying the bondholders, giving notice of at least 30 and
NOTES TO THE COMPANY ACCOUNTS

130
at most 60 calendar days before the call redemption date specified in the notification. The bond could only be redeemed if, on at least 20 trading days within a period of 30 consecutive trading days, ending not earlier than five trading days before publication of the notification, the stock price (the volume-weighted average price in Xetra, or the Xetra closing price, in line with section 1 of the issuing conditions) was at least 130 percent of the conversion price applicable on those days (since June 21, 2017, this was € 42.3297). In the event of such a redemption, CANCOM SE had to repay the bondholders on the call redemption date. The bondholders had
conversion rights. The conversion period and the procedure for exercising the conversion rights were set out in the issuing condi-tions.
The bond had a coupon of 0.875 percent. Interest was paid annu-ally on March 27, starting on March 27, 2015.
On the balance sheet, the convertible bond is split into an equity component and a liability component.
NOTES TO THE COMPANY ACCOUNTS
SCHEDULE OF LIABILITIES (DECEMBER 31, 2016)
Remaining term Secured by lien or similar rights
up to 1 year €
more than 1 year €
more than 5 years €
Dec. 31, 2016 €
€
Type
1. Bonds
Assignment of motor vehicle as security
a) Convertible bonds 0.00 42,160,877.21 0.00 42,160,877.21
b) Profit participation rights and subordinated loans 796,036.00 1,393,055.00 0.00 2,189,091.00
2. Liabilities to banks 298,516.00 522,375.00 0.00 820,891.00 820,891.00
3. Trade accounts payable 112,234.38 0.00 0.00 112,234.38 0.00
4. Liabilities to affiliated companies 10.56 0.00 0.00 10.56 0.00
5. Other liabilities 407,590.71 0.00 0.00 407,590.71 0.00
(of which taxes) 99,780.21 0.00 0.00 99,780.21
(of which social security contributions) 1,019.76 0.00 0.00 1,019.76
1,614,387.65 44,076,307.21 0.00 45,690,694.86 820,891.00
SCHEDULE OF LIABILITIES (DECEMBER 31, 2017)
Remaining term Secured by lien or similar rights
up to 1 year €
more than 1 year €
more than 5 years €
Dec. 31, 2017 €
€
Type
1. Bonds
Assignment of motor vehicle as security
Profit-paticipation capital and subordinated loans 995,045.00 597,019.00 0.00 1,592,064.00
2. Liabilities to banks 373,145.00 223,861.90 0.00 597,006.90 597,004.00
3. Trade accounts payable 119,451.09 0.00 0.00 119,451.09 0.00
4. Liabilities to affiliated companies 64.69 0.00 0.00 64.69 0.00
5. Other liabilities 138,985.01 0.00 0.00 138,985.01 0.00
(of which taxes) 105,985.51 0.00 0.00 105,985.51
(of which social security contributions) 0.00 0.00 0.00 0.00
1,626,690.79 820,880.90 0.00 2,447,571.69 597,004.00
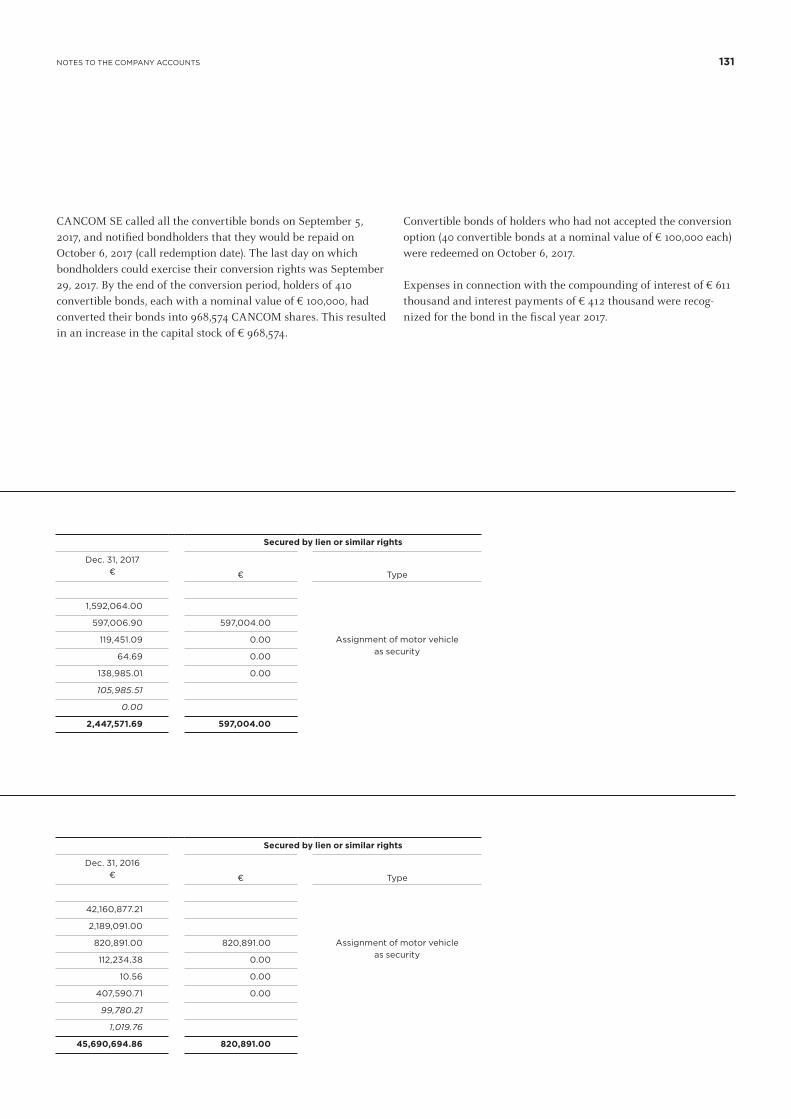
131
CANCOM SE called all the convertible bonds on September 5, 2017, and notified bondholders that they would be repaid on October 6, 2017 (call redemption date). The last day on which bondholders could exercise their conversion rights was September 29, 2017. By the end of the conversion period, holders of 410 convertible bonds, each with a nominal value of € 100,000, had converted their bonds into 968,574 CANCOM shares. This resulted in an increase in the capital stock of € 968,574.
Convertible bonds of holders who had not accepted the conversion option (40 convertible bonds at a nominal value of € 100,000 each) were redeemed on October 6, 2017.
Expenses in connection with the compounding of interest of € 611 thousand and interest payments of € 412 thousand were recog-nized for the bond in the fiscal year 2017.
NOTES TO THE COMPANY ACCOUNTS
SCHEDULE OF LIABILITIES (DECEMBER 31, 2016)
Remaining term Secured by lien or similar rights
up to 1 year €
more than 1 year €
more than 5 years €
Dec. 31, 2016 €
€
Type
1. Bonds
Assignment of motor vehicle as security
a) Convertible bonds 0.00 42,160,877.21 0.00 42,160,877.21
b) Profit participation rights and subordinated loans 796,036.00 1,393,055.00 0.00 2,189,091.00
2. Liabilities to banks 298,516.00 522,375.00 0.00 820,891.00 820,891.00
3. Trade accounts payable 112,234.38 0.00 0.00 112,234.38 0.00
4. Liabilities to affiliated companies 10.56 0.00 0.00 10.56 0.00
5. Other liabilities 407,590.71 0.00 0.00 407,590.71 0.00
(of which taxes) 99,780.21 0.00 0.00 99,780.21
(of which social security contributions) 1,019.76 0.00 0.00 1,019.76
1,614,387.65 44,076,307.21 0.00 45,690,694.86 820,891.00
SCHEDULE OF LIABILITIES (DECEMBER 31, 2017)
Remaining term Secured by lien or similar rights
up to 1 year €
more than 1 year €
more than 5 years €
Dec. 31, 2017 €
€
Type
1. Bonds
Assignment of motor vehicle as security
Profit-paticipation capital and subordinated loans 995,045.00 597,019.00 0.00 1,592,064.00
2. Liabilities to banks 373,145.00 223,861.90 0.00 597,006.90 597,004.00
3. Trade accounts payable 119,451.09 0.00 0.00 119,451.09 0.00
4. Liabilities to affiliated companies 64.69 0.00 0.00 64.69 0.00
5. Other liabilities 138,985.01 0.00 0.00 138,985.01 0.00
(of which taxes) 105,985.51 0.00 0.00 105,985.51
(of which social security contributions) 0.00 0.00 0.00 0.00
1,626,690.79 820,880.90 0.00 2,447,571.69 597,004.00

132
D. Explanations and disclosures concerning the statement of income
The statement of income was prepared according to the total cost accounting principle.
Revenues for 2017 mainly consist of Group allocations (€ 7,494 thousand; 2016: € 7,534 thousand).
Other operating income includes income not relating to the period, amounting to € 33 thousand (2016: € 64 thousand), as well as income arising from currency conversion totaling € 23 thousand (2016: € 32 thousand). It also comprises income from the reversal of provisions (€ 29 thousand; 2016: € 48 thousand) and accounting profits from the sale of property plant and equipment (tangible fixed assets) (€ 4 thousand; 2016: € 16 thousand). In 2016, this item also included income from the disposal of financial assets amounting to € 310 thousand.
The other operating expenses include extraordinary expenses of € 53 thousand (2016: € 1,429 thousand). These relate to the issuing costs connected with the acquisition of synaix Gesellschaft für angewandte Informations-Technologien mbH (capital increase against non-cash contributions) (€ 24 thousand) and orders for conversion of bonds (€ 29 thousand). In the previous year the extraordinary expenses were in relation to issuing costs connected with the capital increase carried out in fiscal 2016.
Profits received under a profit transfer agreement consists of CANCOM GmbH’s net income for the year (€ 37,905 thousand; 2016: € 34,242 thousand) and that of CANCOM ICT Service GmbH (formerly NSG ICT Service GmbH) (€ 7,856 thousand; 2016: € 4,726 thousand), which were transferred to CANCOM SE.
Interest and similar income comprises mainly interest income of € 1,895 thousand (2016: € 1,348 thousand) from affiliated companies.
Interest and other expenses includes expenses in connection with the compounding of interest, which amounts to € 611 thousand (2016: € 1.586 thousand).
E. Other disclosures
Disclosures in compliance with Section 285 No. 29 of the German Commercial Code
In the fiscal year 2017 there were differences between the finan-cial balance sheet and the tax balance sheet which would have given rise to both deferred tax assets and deferred tax liabilities. However, there is an excess of deferred tax assets over deferred
tax liabilities. Section 274, paragraph 1, sentence 2 of the German Commercial Code offers an option to capitalize these assets, but the company did not exercise this option.
The net deferred tax assets mainly result from taxable temporary differences in the recognition of equity investments, and from deductible temporary differences in the recognition of the good-will and other provisions of a subsidiary.
Other financial obligations
Obligations under current tenancy and lease agreements are as follows:
Due in 2018 € ‘000
Total € ‘000
Tenancy agreements 195 562
of which from affiliated companies 97 97
Contingent liabilities
As at the reporting date, there are guarantees for CANCOM GmbH (€ 60,542 thousand; 2016: € 11,642 thousand), CANCOM ICT Service GmbH – formerly NSG ICT Services GmbH – (€ 5,192 thousand; 2016: € 5,192 thousand), CANCOM on line GmbH (€ 3,000 thousand; 2016: € 3,000 thousand), CANCOM Pironet GmbH & Co. KG (€ 1,000 thousand; 2016: € 0 thousand), CANCOM phys-ical infrastructure GmbH (€ 150 thousand; 2016: € 150 thousand), CANCOM Inc. (US$ 2,500 thousand; 2016: US$ 2,500 thousand), and a joint guarantee (€ 200 thousand; 2016: € 200 thousand) for CANCOM GmbH, CANCOM physical infrastructure GmbH, CANCOM SCS GmbH and CANCOM ICP GmbH.
In 2014, CANCOM SE provided a parent company guarantee on behalf of CANCOM Pironet AG & Co. KG (formerly PIRONET Datacenter AG & Co. KG) for a € 4.5 million project for a major client. The company does not currently expect any claim to be made under the guarantee, as the project is progressing well and CANCOM Pironet AG & Co. KG (formerly PIRONET Datacenter AG & Co. KG) has a strong financial standing.
Dec. 31, 2017 € ‘000
Dec. 31, 2016 € ‘000
Joint and several liability for financial guarantees and other loans 4,158 5,276
NOTES TO THE COMPANY ACCOUNTS

133
The guarantees, which amount to € 4,158 thousand (2016: € 5,276 thousand) relate entirely to affiliated companies.
CANCOM SE only gives guarantees or other commitments after careful assessment of the risks, and strictly only in respect of its own business activities or in connection with the business activ-ities of affiliated companies. Based on the company’s continuous assessment of the risk situation regarding the guarantees or other commitments it has given, and in consideration of its observations up to the time that these financial statements were compiled, CANCOM SE anticipates at present that the commitments on which the guarantees are based can be fulfilled by the relevant principal debtors. CANCOM SE therefore assesses the likelihood of a loss on any of the guarantees listed as remote.
Management
The members of the Executive Board are:
• Klaus Weinmann, graduate in business administration (Diplom-Kaufmann), Munich, Germany - Chief Executive Officer -
• Rudolf Hotter, graduate in business economics (Diplom-Betriebswirt), Roßhaupten, Germany
• Thomas Volk, graduate in computer science (Diplom-Informatiker), Inning, Germany (since November 1, 2017)
• Thomas Stark, graduate in industrial engineering (Diplom-Wirtschaftsingenieur), Wittislingen, Germany (since January 1, 2018)
All members of the Executive Board are authorized to represent the company jointly with another Executive Board member or a person holding general commercial power of attorney (Prokura under German commercial law).
The following members of the Executive Board are members of statutory supervisory boards or comparable controlling boards in commercial enterprises in Germany or other countries:
• Klaus Weinmann: - PRIMEPULSE SE - AL-KO Kober SE - CANCOM GmbH - CANCOM ICT Service GmbH (formerly NSG ICT Service GmbH) - Stemmer Imaging AG
• Rudolf Hotter: - Pironet AG - CANCOM ICT Service GmbH (formerly NSG ICT Service GmbH)
• Thomas Volk: - Polecat Intelligence Ltd., Ireland - tyntec Group Ltd., United Kingdom
• Thomas Stark: - AL-KO Kober SE - Pironet AG
Supervisory Board
The members of the Supervisory Board are: • Dr. Lothar Koniarski, graduate in business administration
(Diplom-Kaufmann), managing director of DV Immobilien Managament GmbH and Elber GmbH, Regensburg, Germany -Chairperson-
• Uwe Kemm, independent organizational, sales and marketing consultant -Deputy Chairperson-
• Regina Weinmann, graduate in business administration (Diplom-Kauffrau), managing director of ABCON Holding GmbH, Munich, Germany, ABCON Vermögensverwaltung GmbH, Munich, Germany, and Inter-Connect GmbH, Munich, Germany
• Marlies Terock, graduate translator, self-employed management consult specializing in information technology (since June 20, 2017)
• Dominik Eberle, online marketing and e-commerce consultant• Martin Wild, Chief Innovation Officer of MediaMarktSaturn
Retail Group, Ingolstadt, Germany (since March 27, 2017)• Walter Krejci, managing director of AURIGA Corporate
Finance GmbH, Munich, Germany (until March 20, 2017)
The following members of the Supervisory Board are members of other statutory supervisory boards or comparable controlling boards in commercial enterprises in Germany or other countries:
• Dr. Lothar Koniarski: - SBF AG - DV Immobilien Gruppe - Alfmeier SE
• Martin Wild, - Digitales Gründerzentrum der Region Ingolstadt GmbH
NOTES TO THE COMPANY ACCOUNTS

134
Staff
The average number of employees working for the company during 2017 was 79 (2016: 71). This includes part-time employees but excludes trainees, interns and the members of the Executive Board.
Auditors’ fees
The disclosures according to Section 285 No. 17 of the German Commercial Code are omitted because they are included in the consolidated financial statements of CANCOM SE.
Declaration of conformity with the Corporate Governance Code
In the Supervisory Board meeting on December 5, 2017, the Exec-utive Board and the Supervisory Board issued a joint declaration of conformity with the German Corporate Governance Code in accordance with Section 161, paragraph 1 of the German Stock Corporation Act, which was published immediately. The declara-tion is permanently displayed on the company’s website for public access.
Total emoluments paid to the Executive Board and the Supervisory Board
The total emoluments paid to the Executive Board in 2017 amounted to € 3,042 thousand (2016: 2,749 thousand).
The total emoluments paid to members of the Executive Board are subdivided into fixed and variable components. The variable components are dependent on the attainment of defined perfor-mance targets. No stock options were granted to the members of the Executive Board in 2017.
Full disclosures in compliance with Section 285, No. 9a, sentences 5 to 8 of the German Commercial Code (Handelsgesetzbuch, HGB) can be found in the management report.
The total emoluments of the Supervisory Board in 2017 amounted to € 244 thousand (2016: 265 thousand).
Details of long-term equity interests in CANCOM SE
As at December 31, 2017, the company has the following details of equity interests subject to mandatory disclosure in accordance with Sections 33 ff. of the German Securities Trading Act (Wertpa-pierhandelsgesetz, WpHG):
On January 16, 2014, Allianz Global Investors Luxembourg S.A., Senningerberg, Luxembourg, informed us that its share of the voting rights of CANCOM SE, held directly or indirectly, had fallen below the 5 percent threshold on January 15, 2014 and on that day amounted to 4.87 percent (equivalent to 711,270 voting rights).
Allianz Global Investors GmbH, Frankfurt am Main, Germany, informed us on March 27, 2015 that its share of the voting rights in CANCOM SE, held directly or indirectly, had fallen below the 10 percent threshold on March 26, 2015 and on that day amounted to 9.93 percent (equivalent to 1,477,079 voting rights).
PRIMEPULSE Beteiligungs GmbH (formerly AL-KO Beteiligungs GmbH), Munich, Germany, informed us on May 23, 2017 that its total share of the voting rights of CANCOM SE, held directly or indirectly, had exceeded the 10 percent threshold on May 23, 2017 and on that day amounted to 10.056 percent (equivalent to 1,646,000 voting rights).
Supplementary report
There were no significant events after the reporting date.
Proposal for the appropriation of net retained profit
The Executive Board has resolved to propose to the Supervisory Board and the general meeting of stockholders that the net retained profit of € 38,033,690.90 for the fiscal year 2017 be used for a dividend payment of € 1.00 per eligible no-par value share and that the balance of the retained profit remaining after the dividend payment be transferred to other reserves.
Parent company
CANCOM SE, Munich, Germany, is the company that prepares the consolidated financial statements. The consolidated financial state-ments of CANCOM SE are published on the company’s website. They are also available on the electronic German Federal Gazette (Bundesanzeiger).
NOTES TO THE COMPANY ACCOUNTS

135NOTES TO THE COMPANY ACCOUNTS
Munich, Germany, March 2, 2018
Klaus Weinmann (CEO) Rudolf Hotter (COO) Thomas Volk Thomas Stark
The Executive Board of CANCOM SE
STATEMENT OF STOCKHOLDINGS
Name and registered seat of company Stockholding as a percentage
Equity capital per Dec. 31, 2017
€ ‘000
Net income/loss 2017
€ ‘000
Beteiligungen über 20 %
1. CANCOM GmbH, Jettingen-Scheppach, Germany 100.0 59.389 0 *1
2. CANCOM ICT Service GmbH (formerly NSG ICT Services GmbH), Munich, Germany 100.0 1,347 0 *1
3. CANCOM on line GmbH, Berlin, Germany 100.0 10,082 2,673
4. Cancom on line BVBA, Elsene, Belgium 100.0 81 44
5. CANCOM physical infrastructure GmbH, Jettingen-Scheppach, Germany 100.0 938 255
6. CANCOM SCS GmbH, Munich, Germany 100.0 1,645 946
7. CANCOM ICP GmbH, Munich, Germany 100.0 597 155
8. CANCOM Financial Services GmbH, Jettingen-Scheppach, Germany 100.0 92 -1
9. CANCOM VVM GmbH, Jettingen-Scheppach, Germany 100.0 40 -3
10. CANCOM Computersysteme GmbH, Graz, Austria 100.0 A) 2,193 563
11. CANCOM a+d IT solutions GmbH, Perchtoldsdorf, Austria 100.0 B) 2,370 1,001
12. CANCOM (Switzerland) AG, Caslano, Switzerland 100.0 A) 0 1) 0
13. CANCOM, Inc., Palo Alto, U.S.A. 100.0 946 2) -438
14. HPM Incorporated, Pleasanton, U.S.A. 100.0 C) 23,066 2) 2.658
15. CANCOM LTD, London, UK 100.0 6 3) 0
16. Synaix Gesellschaft für angewandte Informations-Technologien mbH, Aachen, Germany 100.0 4,119 2,305
17. synaix Service GmbH, Aachen, Germany 100.0 44 6
18. c.a.r.u.s. Information Technology GmbH Hannover, Germany 100.0 618 -46
19. Pironet AG, Cologne, Germany 94.9 35,917 4) 5,590
20. CANCOM Pironet AG & Co. KG (formerly PIRONET Datacenter AG & Co. KG), Hamburg, Germany 94.9 D) 3,068 4) 0
21. PIRONET Enterprise Solutions GmbH, Cologne, Germany 94.9 D) 3,105 698
22. PIRONET NDH LLC, Atlanta, U.S.A. 94.9 D) 0 0
23. PIRONET NDH Beteiligungs GmbH, Cologne, Germany 94.9 D) 30 1
149,693 16,407
A) Indirect stockholding through CANCOM GmbH
B) Indirect stockholding through CANCOM Computersysteme GmbH
C) Indirect stockholding through CANCOM Inc.
D) Indirect stockholding through Pironet AG
1) Conversion at reporting date - CHF 1 = EUR 1,17
2) Conversion at reporting date - USD 1 = EUR 1,20
3) Conversion at reporting date - GBP 1 = EUR 0,89
4) After crediting to the stockholder account
*1 Profit transfer agreement with CANCOM SE
136 RESPONSIBILITY STATEMENT OF THE FINANCIAL STATEMENT
Responsibility statement
The members of the Executive Board have assured that, to the best of their knowledge and in accordance with the applicable reporting principles, the financial statements and the management report of CANCOM SE give a true and fair view of the assets, liabilities, financial position and profit or loss of the company, give a true overall picture of the company’s situation, and present an accurate view of the opportunities and risks of future development of the company.
Munich, Germany, March 2, 2018
Klaus Weinmann Rudolf Hotter Thomas Volk Thomas Stark
The Executive Board of CANCOM SE

137AUDITORS’ REPORT
Report of the independent auditor
to CANCOM SE, Munich, Germany
Report on the audit of the annual financial statements and the management report
Audit opinions
We have audited the annual financial statements of CANCOM SE, Munich, Germany, consisting of the balance sheet as at December 31, 2017, the statement of income for the fiscal year from January 1 to December 31, 2017, and the notes to the accounts, including the information on the accounting and valuation policies. We also audited the management report of CANCOM SE, which is combined with the Group management report, for the fiscal year from January 1 to December 31, 2017.
In our opinion, based on the information we obtained during our audit,
• the accompanying annual financial statements comply in all material respects with the provisions of German commercial law applicable to joint-stock companies and with German Generally Accepted Standards of Accounting (Grundsätze ordnungsgemäßer Buchführung), and give a true and fair view of the company’s assets and financial situation as at December 31, 2017 and its earnings situation for the year from January 1 to December 31, 2017; and
• the accompanying management report gives a true overall picture of the company’s situation. The management report is consistent with the financial statements in all material respects. It complies with German legal requirements and presents an accurate view of the opportunities and risks of future develop-ment.
In line with Section 322, paragraph 3, sentence 1 of the German Commercial Code, we declare that our audit did not give rise to any objections as to the legal compliance of the annual financial statements or of the management report.
Basis for the audit opinions
We conducted our audit of the annual financial statements and the management report in accordance with Section 317 of the German Commercial Code and European Union Regulation (EU) No. 537/2014 on specific requirements regarding statutory audit of public-interest entities, and in compliance with the German Generally Accepted Standards of Accounting laid down by the German Institute of Public Auditors in Germany (Institut der Wirtschaftsprüfer, IDW). Our responsibility pursuant to these provisions and principles is described in more detail in the section of this auditor’s report headed ‘Auditor’s responsibility for auditing the financial statements and the management report’.
We are independent of the company, in compliance with the provi-sions of European law and German commercial and professional regulations, and we have fulfilled our other German professional obligations in compliance with these requirements. We also declare, in line with Article 10, paragraph 2 (f) of European Union Regulation (EU) No. 537/2014, that we have not provided any of the non-audit services prohibited under Article 5 of the above Regulation. We believe the audit evidence collected by us is sufficient and appropriate as a basis for our audit opinions on the annual financial statements and the management report.
Key audit matters in the auditing of the annual financial statements
Key audit matters are those that, in our professional judgement, were of most significance in our audit of the annual financial statements for the fiscal year from January 1 to December 31, 2017. We took these facts into account in the context of our audit of the annual financial statements as a whole and in forming our audit opinion; we do not issue separate audit opinions on these facts.
In our view, the key audit matter is:
• impairment of shares in affiliated companies.

138 AUDITORS’ REPORT
We structured our presentation of this key audit matter as follows:
1) reasons for designation as a key audit matter and risk for the financial statements;
2) conduct of the audit;3) conclusions.
Impairment of shares in affiliated companies
1) The annual financial statements of CANCOM SE report shares in affiliated companies to a value of € 246.163 thousand (64.7 percent of the total assets) as at December 31, 2017. CANCOM SE conducted an impairment test on its equity investments as at the reporting date. The company carried out its own evaluations to determine the fair values associated with each of the carrying amounts. The calculations provided by the company and other documentation did not indicate any need for write-downs in the fiscal year 2017. The fair values of the shares in affiliated companies were determined in each case as the present value of the expected future cash flows by means of discounted cash flow (DCF) models, based on the forecasts drawn up by the legal representatives. The result of these measurements is dependent, in particular, on the estimation of future cash flows by the management and on the discount rates used in each case. The valuations are therefore subject to some uncertainty. Against this background, and in view of its fundamental importance for the assets and earnings position of CANCOM SE, this matter was of special significance for our audit.
2) In relation to the assessments carried out by CANCOM SE, we are satisfied that the fair values were determined appropriately using the DCF method in compliance with the relevant valua-tion standards. We did this by testing whether the underlying future cash flows and the costs of capital recognized are an appropriate basis overall. Our estimate was based, among other things, on a comparison with general and sector-specific market expectations, and on extensive explanations by the legal representatives with regard to the key value drivers of the plan. In view of the fact that even relatively small changes in the discount rate used can sometimes have a considerable impact on values, we also tested the parameters used to determine the discount rate applied and evaluated the calculation model.
3) We believe the measurement parameters and assumptions used by the management to test for impairment are appropriate.
Other information
The legal representatives are responsible for the other information. The other information comprises
• the Group corporate governance declaration;
• the other parts of the annual report, with the exception of the audited consolidated financial statements and Group manage-ment report and this auditor’s report.
Our audit opinions on the annual financial statements and the management report do not extend to the other information, and we therefore do not give any audit opinion or draw any other form of conclusions on it.
In the context of our audit we are responsible for reading the other information and evaluating whether
• there are any substantial inconsistencies between it and the annual financial statements, the management report or the knowledge we have gained during the audit; or
• it is substantially misrepresented in any other way.
If, on the basis of the work we have carried out, we reach the conclusion that this other information has been substantially misrepresented, we are obliged to report this. We have nothing to report in this respect.

139AUDITORS’ REPORT
Responsibility of the legal representatives and the Supervisory Board for the annual financial statements and the management report
The legal representatives are responsible for preparing the annual financial statements, which comply in all material respects with the provisions of German commercial law applicable to joint-stock companies, and for ensuring that the annual financial statements comply with the German Generally Accepted Standards of Accounting and give a true and fair view of the company’s asset, financial and earnings position.
The legal representatives are also responsible for the internal controls they have deemed necessary, pursuant to the German Generally Accepted Standards of Accounting, to enable the prepa-ration of annual financial statements free from material misstate-ment, either intended or unintended.
When drawing up the annual financial statements, the legal repre-sentatives are responsible for assessing the company’s capacity to continue operating as a going concern. They are also responsible for disclosing, where relevant, any facts connected with the future of the enterprise as a going concern. Furthermore they are respon-sible for accounting on the basis of the going concern principle, unless this is prevented by factual or legal circumstances.
The legal representatives are also responsible for preparing the management report, which gives a true overall picture of the company’s situation and is in all material respects consistent with the annual financial statements, complies with German legal requirements and presents an accurate view of the opportunities and risks of future development. Additionally, the legal repre-sentatives are responsible for all the arrangements and measures (systems) they have deemed necessary to enable the preparation of a management report in compliance with the applicable German legal requirements and the provision of sufficient and appropriate evidence to support the statements in the management report.
The Supervisory Board is responsible for overseeing the compa-ny’s accounting process for the preparation of the annual financial statements and of the management report.
Auditor’s responsibility for auditing the annual financial statements and the management report
Our objective is to provide reasonable assurance that the annual financial statements as a whole are free from material misstate-ment, whether intended or unintended, and that the management report gives a true overall picture of the company’s situation and is in all material respects consistent with the annual financial state-ments and with the knowledge we have gained during the audit; that it complies with German legal requirements and presents an accurate view of the opportunities and risks of future develop-ment; and to issue an auditor’s report containing our audit opinion regarding the annual financial statements and the management report.
Reasonable assurance is a high level of assurance, but not a guar-antee, that an audit conducted in accordance with Section 317 of the German Commercial Code and European Union Regulation (EU) No. 537/2014 and in compliance with the German generally accepted standards for the audit of financial statements laid down by the German Institute of Public Auditors will always reveal any material misstatement. Misstatements may result from errors or fraud and are considered material if they could reasonably be expected, either individually or together, to influence the economic decisions of users taken on the basis of these annual financial statements and the management report.
Throughout the audit process, we exercise professional judgement and apply professional skepticism. Additionally, we
• identify and assess the risks of material misstatement – whether intended or unintended – in the annual financial statements and the management report, plan and conduct audit procedures in response to these risks, and collect sufficient appropriate audit evidence as a basis for our audit opinions. The risk of material misstatements not being detected is greater in cases of fraud than in cases of error, as fraud may involve collusion, forgery, deliberate omissions, misleading representations or the bypas-sing of internal controls;

140 AUDITORS’ REPORT
• gain an understanding of the internal control system relevant to the audit of the annual financial statements and of the arrange-ments and measures relevant to the audit of the management report, which enables us to plan audit procedures that are appro-priate to the circumstances, although not with the objective of providing an audit opinion on the effectiveness of such systems of the company;
• assess whether the accounting methods used by the legal repre-sentatives are appropriate and whether the estimated values and related disclosures presented by the legal representatives are reasonable;
• draw conclusions as to whether the going concern principle is appropriate as a basis for accounting by the legal representatives and – on the basis of the audit evidence collected – whether there is a material uncertainty in connection with events or circumstances which could raise significant doubts as to the company’s capacity to continue operating as a going concern. If we conclude that there is a material uncertainty, we are obliged to draw attention to the related disclosures in the annual financial statements and management report in our auditor’s report or, if these disclosures are inappropriate, to modify the relevant audit opinion. We draw our conclusions on the basis of the audit evidence collected up to the date of our auditor’s report. However, future events or circumstances may lead to the company no longer being able to continue as a going concern;
• assess the overall presentation, structure and content of the annual financial statements, including the disclosures, and whether the annual financial statements present the underlying transactions and events in such a way that the annual financial statements give a true and fair view of the assets, financial and earnings situation of the company in compliance with the German Generally Accepted Standards of Accounting;
• assess whether the management report is consistent with the annual financial statements and complies with the law, and evaluate the view it presents of the company’s situation;
• carry out audit procedures on the forward-looking statements presented by the legal representatives in the management report. On the basis of sufficient appropriate audit evidence, we examine the significant assumptions on which the forward-loo-king statements by the legal representatives are based, and assess the appropriateness of these assumptions as a basis for the forward-looking statements. We do not provide any separate audit opinion on the forward-looking statements or on the underlying assumptions. There is a considerable and unavoi-dable risk that future events might differ materially from those presented in the forward-looking statements.
We discuss with those charged with governance the planned scope and scheduling of the audit, in addition to significant audit findings, including any deficiencies in the internal control system that we establish in the course of our audit.
We provide those charged with governance with a declaration that we meet the relevant independence requirements and discuss with them all relationships and other matters that may reasonably be considered to have a bearing on our independence, and the related safeguards.
From the matters discussed with those charged with governance, we determine those matters that were of most significance in the audit of the annual financial statements for the period under review and are therefore the key audit matters. We describe these matters in the auditor’s report, unless laws or other regulations preclude the public disclosure of such matters.

141AUDITORS’ REPORT
Other legal and regulatory requirements
Other disclosures in line with Article 10 of European Union Regulation (EU) No. 537/2014
We were appointed by the general meeting of stockholders on June 20, 2017 to audit the financial statements. We were engaged by the Audit Committee on December 5, 2017. We have audited the financial statements of CANCOM SE every year since the fiscal year 1998.
We declare that the audit opinions in this report are in line with the additional report to the Supervisory Board required under Article 11 of European Union Regulation (EU) No. 537/2014.
Auditor responsible for the audit
The auditor responsible for the audit is Ulrich Stauber.
Augsburg, Germany, March 2, 2018
S & P GmbHWirtschaftsprüfungsgesellschaft
Stauber ThomasWirtschaftsprüfer (Certified auditor) Wirtschaftsprüfer (Certified auditor)

142 FINANCIAL CALENDAR
CANCOM SE financial calendar
2018
14 May 2018 Interim Statement 1st Quarter 2018
14 June 2018 Annual General shareholders’ meeting in Munich, Germany Location: Alte Kongresshalle Theresienhöhe 15 80339 München
13 August 2018 Half-year Report 2018
12 November 2018 Interim Statement 3rd Quarter 2018
26-28 November 2018 Analysts‘ Conference at the German Equity Forum in Frankfurt/Main, Germany Location: Sheraton Frankfurt Airport Hotel and Conference Center Airport/Terminal 1, Hugo-Eckener-Ring 15 60594 Frankfurt am Main
Note: Subject to change. Art 17 of the European Market Abuse Regulation (MAR) requires issuers to promptly publish any information which will significantly impact share price. This means that we might publish our quarterly or fiscal-year-end results before the dates listed above.

143
Publication Details
Published byCANCOM SEErika-Mann-Straße 69D-80636 MünchenGermany www.cancom.de
Investor RelationsSebastian BucherPhone: +49 89 54054 [email protected]
Designed and produced byCANCOM SE, München, [email protected]
Photos© CANCOM SE
TranslationVerbum versus Verbum, Rosbach v. d. H.E-Mail: [email protected]
PUBLICATION DETAILS
This is a translation of CANCOM SE‘s annual report. Only the German version of the report is legally binding. Every effort was made to ensure the accuracy of the translation, however, no warranty is made as to the accuracy of the translation and the company assumes no liability with respect thereto. The company cannot be held responsible for any misunderstandings or mi-sinterpretation arising from this translation.

CANCOM SEErika-Mann-Straße 6980636 MünchenPhone +49 89 54054–[email protected]
ANNUAL REPORTCANCOM SE
CA
NC
OM
SE
AN
NU
AL
RE
PO
RT
2017
2017