2017 ANNUAL COMPOSITE PROGRESS REPORT
31
1 AYENSUANO DISTRICT ASSEMBLY 2017 ANNUAL COMPOSITE PROGRESS REPORT
Transcript of 2017 ANNUAL COMPOSITE PROGRESS REPORT

1
AYENSUANO DISTRICT
ASSEMBLY
2017
ANNUAL COMPOSITE
PROGRESS REPORT

2
TABLE OF CONTENT
TABLE OF CONTENT ....................................................................................................................... 1 CHAPTER ONE .................................................................................................................................. 4
ANNUAL COMPOSITE PROGRESS REPORT ............................................................................... 4 (JANUARY - DECEMBER 2017) ...................................................................................................... 4
1.0 Introduction ................................................................................................................................ 4 1.1 Key Monitoring and Evaluation (M&E) Objectives for 2017 ................................................... 5 1.2 Processes Involved and Difficulties Encountered in Monitoring and Evaluation ..................... 5
1.2.1 Processes involved in M&E; ............................................................................................... 5 1.2.2 Difficulties Encountered in M&E ....................................................................................... 6
1.3 Implementation Status of the Medium Term Development Plan (MTDP) ................................ 6 CHAPTER TWO ................................................................................................................................. 5 MONITORING AND EVALUATION ACTIVITIES ........................................................................ 5
2.0 Introduction ................................................................................................................................ 5
2.1 Projects/ Programme Status for the year 2017 ........................................................................... 5 2.2 Update on Core District Indicators and Targets (Categorized By GSGDA Thematic Areas) ... 8 2.4 Update on Funding and Disbursements of Funds .................................................................... 12
2.5 Efforts to Generate Funds ........................................................................................................ 14 2.5.1 Challenges of Generating Funds ....................................................................................... 14
2.6 Update on Critical Development and Poverty Issues .............................................................. 14 2.6.1 The School Feeding Programme ....................................................................................... 14 2.6.2 Educational Sponsorship ................................................................................................ 15
2.5.2 West Africa Senior Secondary Certificate Examination (WASSCE) ................................... 16
2.6.3 Performance of Pupils in the 2017 BECE ..................................................................... 16 2.6.4 Local Economic Development .......................................................................................... 16 2.6.5 Support for People with Disabilities and OVCs ............................................................... 17
2.6.5.1 Registration and Disbursement of Funds to Persons with Disabilities (PWDs) ............ 17 2.6.8.1 LEAP Beneficiary Households and Fund Disbursement ............................................... 18
2.6.9 Health Situation in the District ......................................................................................... 19 2.6 Support for Disease Control Programmes in the District ........................................................ 19
2.6.10 Family Planning and Reproductive and Child Health Issues in the District................... 20 2.6.2.1 Family Planning Acceptance in the District .................................................................. 20
2.6.2.2 Reproduction and Child Health Issues in the District .................................................... 20 2.6.12 Agriculture and food security ............................................................................................. 21
2.6.12.1 Rainfall and Its Effects on Crop and Livestock during the year .................................. 21
2.6.12.2 Impact of Pest & Diseases in Crop Performance within the District ........................... 21 2.6.12.3 Food Availability and Access ...................................................................................... 23
2.7.3 Increased Competitiveness and Enhanced Integration into Domestic and International
Market 23
2.6.12.5 Science and Technology in Food and Agriculture Development ... Error! Bookmark not
defined. 2.6.12.5.1 Technologies Demonstrated...................................... Error! Bookmark not defined.
2.6.12.5.2: Agricultural Mechanization and Tractor Services ... Error! Bookmark not defined. 2.6.12.5.3 Fertilizer Subsidy ...................................................... Error! Bookmark not defined.

3
2.6.12.5.4 Agro Processing in the District ................................. Error! Bookmark not defined.
2.6.13 Farmer Sensitization and Training on Additional Livelihood Activities . Error! Bookmark
not defined. 2.6.14 Farmer’s Day Celebration ................................................................................................... 23
2.6.15 Natural Resources Management ......................................................................................... 24 2.8.0 Natural Resources Management ........................................................................................... 24
2.8.1 Protection and Mitigation Measures (Sustainable Land Use Management) ..................... 24 2.16.6 Planting for Food and Jobs Programme .......................................................................... 25
3.3Agro Input Distributions under PFJ ......................................................................................... 26
3.3.1Fertilizer and Seed distribution .......................................... Error! Bookmark not defined. 2.6.16 Public Health Promotion and Education ......................................................................... 27 2.6.18 Participatory Monitoring and Evaluation ........................................................................ 27
CHAPTER THREE ........................................................................................................................... 28
THE WAY FORWARD .................................................................................................................... 28 3.0 Introduction .................................................................................................................................. 28
3.1 Key Issues Addressed and those yet to be addressed .............................................................. 28 3.2 Recommendations .................................................................................................................... 28

4
CHAPTER ONE
ANNUAL COMPOSITE PROGRESS REPORT
(JANUARY - DECEMBER 2017)
1.0 Introduction
The Ayensuano District is one of the twenty-six (26) administrative Districts in the Eastern Region
of Ghana which was carved out from the then Suhum Kraboa Coaltar District Assembly by
Legislative Instrument Number 2052 and was inaugurated on 28th June, 2012. The District has its
capital at Coaltar.
Politically, the District has only one Constituency called the Ayensuano Constituency with twenty-
seven (27) electoral areas. Ayensuano District is made up of three (3) Area Councils which are known
as Obesua, Anum Apapam and Kraboa-Coaltar.
The District covers a land size of approximately 499km2 with a population of 77,193 (GSS, PHC
2010). This is constituted by 38,440(49.8%) males and 38,753(50.2%). But as at 2017, the projected
population of the District was 95,232 people. This comprised of 47,423 males and 47,809 females.
The preparation of the 2017 Annual Composite Progress Report is in pursuance of the National
Development Planning System Act, 1993, Act 480, and L.I 1961as well as National Development
Planning System Act, 2016, and LI 2232. The report brings to light programmes and activities carried
out in the Ayensuano District by the various Departments of the Assembly within the framework of
the Medium Term Development Plan (2014 - 2017) and the 2017 Composite Annual Action Plan.
During the period under review, the District continued to implement projects and programmes in line
with the Ghana’s Shared Growth Development Agenda II (GSGDA 2014-2017). In the year, 2017,
the Assembly continued the implementation of its physical development projects of which some
direct GOG projects through the Ministry of Education, GetFund.
It is worth mentioning that the projects have reached appreciable levels of completion with some even
completed within the year.
The projects and programmes which were undertaken by the Assembly were funded by the District
Assemblies’ Common Fund (DACF), District Development Fund (DDF) and a direct Government of
Ghana transfer to support specific projects.
The major development partner of the Assembly in the period under review was the Commonwealth
Local Government Forum (CLGF).
This annual report covers the status of implementation of programmes, projects and policies
undertaken in the Ayensuano District during the period of 1stJanuary – 31st December, 2017 within
the framework of the Medium Term Development Plan (2014-2017) and the 2017 Composite Annual
Action Plan.

5
In the period under review, 59.1% of activities earmarked in the 2017 Composite Annual Action were
implemented but this runs into 14.78% of the proportion of the 2014-2017 DMTDP implemented by
the Assembly. However, the cumulative proportion of the 2014-2017 DMTDP implemented by the
Assembly within the plan period was 67.74%.
1.1 Key Monitoring and Evaluation (M&E) Objectives for 2017
The following objectives were set for Monitoring and Evaluation activities in the year, 2017 to enable
the Assembly monitor the progress of projects and programmes during its implementation.
To monitor all proposed programmes and projects with the view of making sure that planned
targets are achieved
To assess whether the targets set out in the DMTDP are being met.
To identify achievements, constraints and failures so that improvements can be made to the
DMTDP and project designs to achieve better impact.
To document lessons learned from the implementation of programmes and projects so as to
improve future planning.
To ensure judicious utilization of scarce resources.
To provide information for effective coordination of the development of the District at the
regional and national levels.
To ensure value for money in the implementation of the DMTDP
To reinforce ownership of the DMTDP and build M&E capacity for DPCU members and
other stakeholders within the District.
To identify the appropriate interventions that will increase the responsiveness of targeted
beneficiaries
To demonstrate results to stakeholders as part of accountability and transparency
To ensure effective participation of all stakeholders in the development process
To establish feedback processes to ensure use of monitoring results and a follow up on the
implementation of evaluation recommendations.
1.2 Processes Involved and Difficulties Encountered in Monitoring and Evaluation
The District Planning Co-ordinating Unit (DPCU) used different approaches in its monitoring and
evaluation activities during the period under review. It also faced a number of difficulties which
negatively affected effective monitoring and evaluation in the period. Below were some of the
processes involved in the monitoring and evaluation activities and challenges encountered.

6
1.2.1 Processes involved in M&E;
Documentation review of various national and district documents with regards to indicators,
priority interventions, mechanism and approaches toward developing a comprehensive M&E
Report.
Consultative meetings with community level development actors including traditional
authorities, Area Councils, Unit Committees and community members to gain an
understanding of the status of the implementation of the DMTDP.
Consultative meetings with various stakeholders from districts, MDAs, development partners,
NGOs to establish the monitoring and evaluation mechanisms and recommendations of the
proposed mechanisms.
Data collection, collation and analysis.
Joint stakeholders meetings at project sites
1.2.2 Difficulties Encountered in M&E
Limited resources (funds) for effective monitoring of the implementation of AAPs and
DMTDP
Inadequate capacity of personnel for M&E activities
Lack of appropriate logistics (vehicle) for performing M&E activities within the District
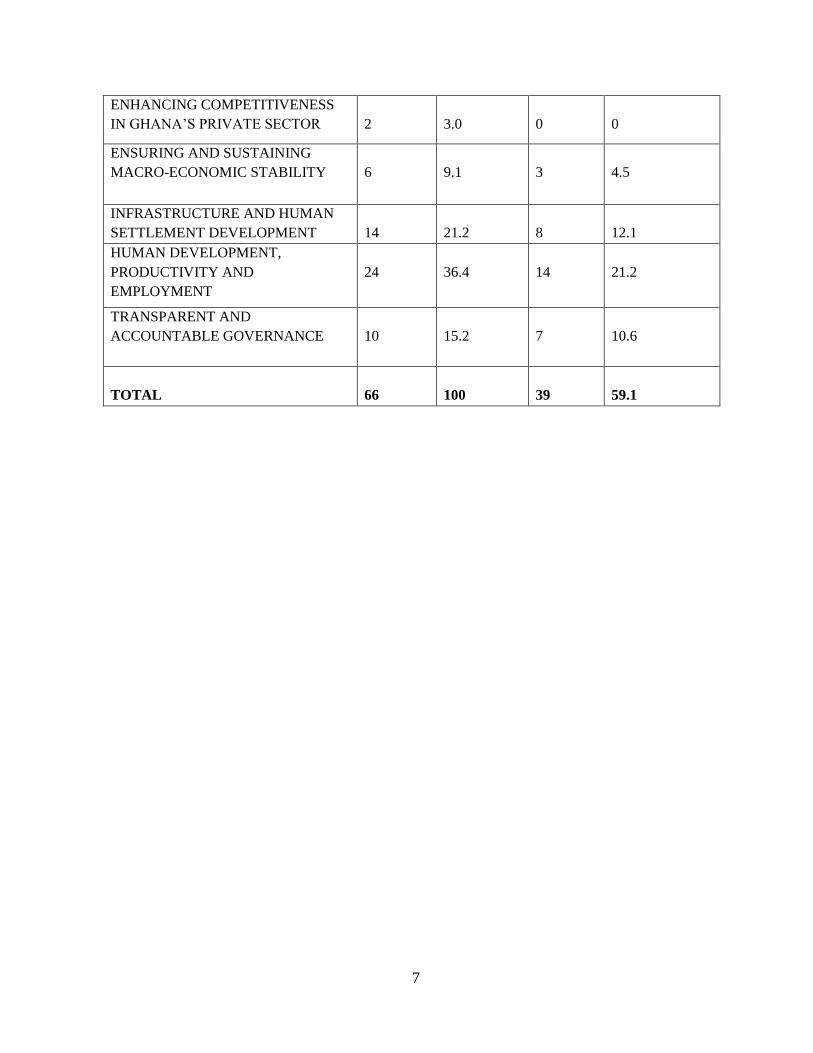
1.3 Implementation Status of the Medium Term Development Plan (MTDP)
Projects and programmes were implemented from the 2014-2017 District Medium Term
Development Plan (DMTDP) which was in line with the Ghana’s Shared Growth
Development Agenda II (GSGDA II). During the period under review, the Ayensuano District
Assembly’s performance in the implementation of its 2017 Composite Annual Action Plan
was satisfactory as indicated in Table 1.1
Table 1.1: Implementation Status for 2017 Annual Action Plan under the GSGDA II
THEMATIC AREA 2017 ANNUAL
ACTION PLAN
IMPLEMENTATION
STATUS
No. of
Projects
% by
Thematic
Areas
Overall Thematic
Performance in the year
NO. Percentage (%)
ACCELERATED AGRICULTURAL
TRANSFORMATION AND
SUSTAINABLE NATURAL
RESOURCES RESOURCE
MANAGEMENT
10
15.2
7
10.6
7
ENHANCING COMPETITIVENESS
IN GHANA’S PRIVATE SECTOR
2
3.0
0
0
ENSURING AND SUSTAINING
MACRO-ECONOMIC STABILITY
6
9.1
3
4.5
INFRASTRUCTURE AND HUMAN
SETTLEMENT DEVELOPMENT
14
21.2
8
12.1
HUMAN DEVELOPMENT,
PRODUCTIVITY AND
EMPLOYMENT
24
36.4
14
21.2
TRANSPARENT AND
ACCOUNTABLE GOVERNANCE
10
15.2
7
10.6
TOTAL
66
100
39
59.1

5
CHAPTER TWO
MONITORING AND EVALUATION ACTIVITIES
2.0 Introduction
Monitoring and evaluation is a process that provides systematic and objective information which
is transparent, credible and useful to aid management decision-making with regards to programmes
and projects implementation
This chapter outlines the status of programmes and projects undertaken in the District in the year
2017. In addition to the programmes and projects updates, it also gives an overview of funds
receipts from sources, disbursement from funding sources, update on indicators and targets as well
as update on critical development and poverty issues carried out in the District.
2.1 Projects/ Programme Status for the year 2017
The District Assembly continued to implement a number of projects and programmes with the
support of its development partners which included the Government of Ghana and Commonwealth
Local Government Forum. The District also benefited from the District Development Facility
(DDF) which helped in the implementation of planned projects. In the period under review,
standstill projects which were rolled over to 2017 were completed. Also rolled over and new
projects that were initiated within the period are progressing steadily and some of the projects were
completed and handed over for usage.
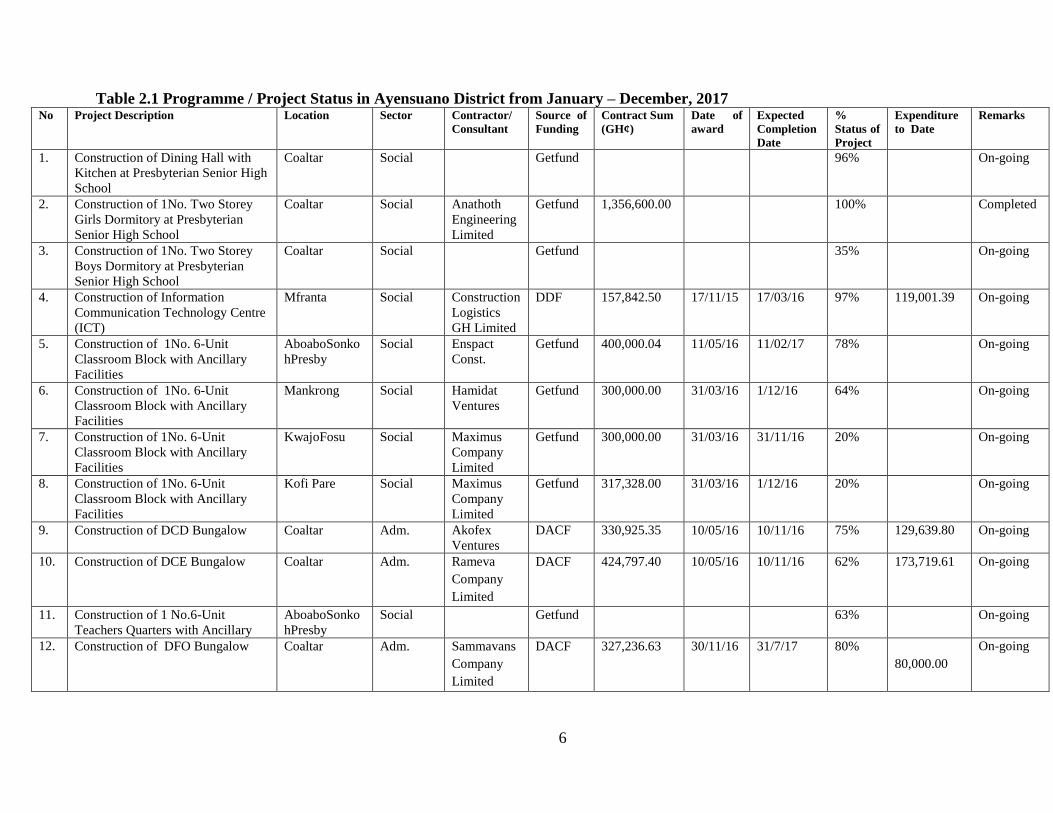
Table 2.1 provides a summary of programmes and projects that were rolled over, on-going and
completed in the period under review.
6
Table 2.1 Programme / Project Status in Ayensuano District from January – December, 2017 No Project Description Location Sector Contractor/
Consultant
Source of
Funding
Contract Sum
(GH¢)
Date of
award
Expected
Completion
Date
%
Status of
Project
Expenditure
to Date
Remarks
1. Construction of Dining Hall with
Kitchen at Presbyterian Senior High
School
Coaltar Social Getfund 96% On-going
2. Construction of 1No. Two Storey
Girls Dormitory at Presbyterian
Senior High School
Coaltar Social Anathoth
Engineering
Limited
Getfund 1,356,600.00 100% Completed
3. Construction of 1No. Two Storey
Boys Dormitory at Presbyterian
Senior High School
Coaltar Social Getfund 35% On-going
4. Construction of Information
Communication Technology Centre
(ICT)
Mfranta Social Construction
Logistics
GH Limited
DDF 157,842.50 17/11/15 17/03/16 97% 119,001.39 On-going
5. Construction of 1No. 6-Unit
Classroom Block with Ancillary
Facilities
AboaboSonko
hPresby
Social Enspact
Const.
Getfund 400,000.04 11/05/16 11/02/17 78% On-going
6. Construction of 1No. 6-Unit
Classroom Block with Ancillary
Facilities
Mankrong Social Hamidat
Ventures
Getfund 300,000.00 31/03/16 1/12/16 64% On-going
7. Construction of 1No. 6-Unit
Classroom Block with Ancillary
Facilities
KwajoFosu Social Maximus
Company
Limited
Getfund 300,000.00 31/03/16 31/11/16 20% On-going
8. Construction of 1No. 6-Unit
Classroom Block with Ancillary
Facilities
Kofi Pare Social Maximus
Company
Limited
Getfund 317,328.00 31/03/16 1/12/16 20% On-going
9. Construction of DCD Bungalow Coaltar Adm. Akofex
Ventures
DACF
330,925.35 10/05/16 10/11/16 75% 129,639.80 On-going
10. Construction of DCE Bungalow Coaltar Adm. Rameva
Company
Limited
DACF
424,797.40 10/05/16 10/11/16 62% 173,719.61 On-going
11. Construction of 1 No.6-Unit
Teachers Quarters with Ancillary
AboaboSonko
hPresby
Social Getfund 63% On-going
12. Construction of DFO Bungalow Coaltar Adm. Sammavans
Company
Limited
DACF 327,236.63 30/11/16 31/7/17 80%
80,000.00
On-going

7
No Project Description Location Sector Contractor/
Consultant
Source of
Funding
Contract Sum
(GH¢)
Date of
award
Expected
Completion
Date
%
Status of
Project
Expenditure
to Date
Remarks
13 Re-roofing of 3-Units Classroom
block with Office and Store at Budu
D/A Primary School
Budu Social Sammavans
Company
Ltd
DACF 45,389.08 25/09/17 25/10/17 100% 40,850.17 Completed
14 Re-roofing of Krabokese 1N0. 3-
Units Classroom block, office and
store
Krabokese Social Sammavans
Company
Ltd
DACF 42,822.27 12/10/17 13/11/17 100% 38,540.05 Completed
15 Reshaping of Asuboi Ningo Feeder
Road and others(19.0km)
Asuboi-Ningo,
Mankron
junction –
Mankron,
Teacher Mante
- Govinakrom
Social RoadVp
Construction
Company
Ltd
DACF 65,516.00 29/09/17 30/10/17 100% 65,516.00 Completed
16 Reshaping of Marfo Junction –
Coaltar Feeder Road and
others(24.0km)
Marfo junc-
Coaltar,Kyeky
erewe, Dome-
abobrie,
Kuano-
Achiansah
Social RoadVp
Construction
Company
Ltd
DACF 129,330.00 29/09/17 30/10/17 100% 129,330.00 Completed

8
2.2 Update on Core District Indicators and Targets (Categorized By GSGDA
Thematic Areas)
This section elaborates on the core district indicators that were identified and monitored in the year
under review.
It provides a summary of assessment of performance on the GSGDA II.
Table 2.2: Update on Core District Indicators and Targets
No
SECTOR
2018
Target
2015
Indicator
Level
2016 Indicator
Level
2017 Indicator
Level
ACCELERATED AGRICULTURAL TRANSFORMATION AND SUSTAINABLE
NATURAL RESOURCE MANAGEMENT
1 Percentage (%) increase in
yield of selected crops,
livestock and fish
Crops:
Maize
Rice (milled)
Cassava
Cocoyam
Plantain
Yam
Livestock:
Goat
Sheep
Cattle
Pig
Poultry (Local & Exotic fowl)
0.30%
-
4.20%
0.12%
0.48%
3.10%
NUMBER
5.5%
4.1%
32.5%
12.0
2.0%
(*These are expected %
increase for the
year)
METRIC
TONNES
9,384
-
33,875
2,162
12,548
631
NUMBER
36,079
13,355
1,303
914
190,228
METRIC
TONNES
9,397
-
33,475
2,258
12,348
692
NUMBER
36,568
13,543
1,403
987
191,332
METRIC
TONNES
9,456
-
34,231
2,945
12,866
935
NUMBER
37,543
14,678
1,761
1032
198,763
2 Hectares of degraded forest,
mining, dry and wet lands
rehabilitated/restored:
Forest
Mining
Dry and wetland
0
0
0
0
0
0
0
0
0
INFRASTRUCTURE AND HUMAN SETTLEMENT DEVELOPMENT
3 No. of towns with schemes 3 0 0 1

9
4 Proportion/length of roads
maintained/rehabilitated
Trunk Roads (in km)
Urban Roads (in km)
Feeder Roads (km)
i. Maintenance
(Reshape)
ii. Spot Improvement
-
-
100km
30km
-
-
21.80km
-
-
-
45.50km
5.30km
43
5 No. of culverts constructed 4 0 2 0
6 No. of market structures
constructed
2 1 2 1
7 % of streets and properties
named and numbered
30% - - 0
8 % change in number of
households with access to
electricity
12%
-
-
5%
9 Proportion of population with
access to improved sanitation
(flush toilets, KVIP,
household latrines)
35% - - 13%
10 Proportion of population with
sustainable access to safe
water sources
55% - - 45%
11 Teledensity/Penetration - - 0
HUMAN DEVELOPMENT, PRODUCTIVITY AND EMPLOYMENT
12 No. of class room blocks
constructed
5 3 6 0
13 No. of teachers’
accommodation constructed
1 0 1 0
14 No. of mock exams organized
for JHS 3 Pupils
1 - 1 1
15 % change in students with
passes in BECE
80% 60% 76%
16 % change in students with
passes in WASCE
60% - - 63.9%
17 No. of health facilities
constructed.
2 1 1

10
18 HIV/AIDS prevalence rate (%
of adult population, 15-49
yrs. HIV positive) – **the
figures are absolute as a result of
changes in population
0 15 (0.67%) 25 (1.1%) 12
19 Maternal Mortality ratio
(Number of deaths due to
pregnancy and childbirth per
100,000 live births)
0 0 0 0
20 Under-five mortality rate
(Number of deaths occurring
between birth and exact age
five per 1000 live births)
0 0 0 0
21 Malaria case fatality in
children under five years per
10,000 population
0 0 0 0
22 Gross Enrolment Rate
(Indicates the number of
pupils/students at a given
level of schooling-regardless
of age-as a proportion of the
number of children in the
relevant age group)
KG
Primary
JHS
SHS
Net Admission Rate in
Primary Schools (Indicate
Primary One enrolment of
pupils aged 6 years)
96.0%
90.0%
75.0%
55.0%
85%
93.7%
84.5%
70.7%
46.0%
82.5%
123%
85%
69.0%
48.0%
85.0%
122%
87%
70.0%
49.0%
86.0%
23 Gender Parity Index (Ratio
between girls’ and boys’
enrolment rates, the balance
of parity is 1.00)
KG
Primary
JHS
SHS
1.0
1.0
1.0
1.0
1.0
1.0
1.0
0.96
1.0
1.0
1.0
0.98
1.0
1.0
1.0
0.99
24 Proportion of unemployed
youth benefiting from
skills/apprenticeship and
entrepreneurial training
20%
0
-
0

11
ENHANCING COMPETITIVENESS IN GHANA’S PRIVATE SECTOR
25 % Change in tourist arrivals 5% 0% 0% 0%
26 No of SMEs benefiting from
technical , managerial, credit
management and marketing
skills
30 27 25 0
TRANSPARENT AND ACCOUNTABLE GOVERNANCE
27 Total Amount of Internally
Generated Revenue
GH¢
GH¢
402,992.14
GH¢
528,698.35
GH¢
378,757.09
28 Proportion of Development
Partner and NGO funds
contribution to DMTDP
implementation
- - -
29 Proportion of DA expenditure
within the DMTDP budget
(How much of DA’s
expenditure was not in the
annual budget?)
0
0
0
0
30 Number of reported cases of
abuse (children, women and
men)
Children
Women
Men
-
-
-
4
0
0
0
0
0
0
0
0
31 Police citizen ratio 1:2,000 1: 8,153
1:7,166 1:5290
32 No. of area councils offices
constructed and furnished
2 0
0 0

12
2.3 Update on Funding and Disbursements of Funds
The Ayensuano District Assembly obtained its revenue for development from different sources.
These included the District’s Internally Generated Fund (IGF), the District Assemblies’ Common
Fund (DACF), District Development Facility (DDF), Government of Ghana Grants and
Commonwealth Local Government Fund (CLGF) which supports specific programmes/projects.
The funds received in the District were disbursed to finance on-going and new programmes,
projects and for service delivery. Funds were disbursed in line with the 2017 Annual Action Plan
and Annual Budget.
The tables below indicate the update on receipts, update on expenditure by funding source and
disbursement by sector in the year under review.
Table 2.3: Update on Receipt of Funding in the year 2017 (January- December, 2017)
SOURCE 2016 ACTUAL
RECEIPT (GH¢)
2017 ANNUAL
BUDGET (GH¢)
2017 ACTUAL
RECEIPT (GH¢)
DACF 1,871,353.79 3,708,488.00 1,146,355.10
IGF 528,698.35 740,200.00 378,757.09
GOG GRANT 710,799.73 785,000.00 458,976.71
DDF 588,233.37 700,000.00 85,000.00
SCHOOL FEEDING PROG. - - -
DISABILITY TRANSFER 96,643.79 110, 000.00 5,000.00
HIV / AIDS 13,316.29 13,316.29 -
DONORS - 7000.00 15,045.89
MP’S COMMON FUND 118,574.68 140,000.00 157,812.72
TOTAL REVENUE
3,927,620.00
6,094,004.29
2,246,947.51
Table 2.4: Expenditure by Funding Source in the year 2017 (January- December, 2017)
SOURCE 2016 ACTUAL
EXPENDITURE (GH¢)
2017 ACTUAL
EXPENDITURE (GH¢)
DACF 2,247,631.28 1,216,955.22
IGF 486,060.56 378,265.24
GOG GRANT 710,799.73 454,746.71
DDF 541,538.42 133,152.78
SCHOOL FEEDING PROGRAMME - -
DISABILITY TRANSFER 96,225.44 -
HIV/AIDS 15,123.00 -
DONOR - 75,001.50
MP,S COMMON FUND 118,574.68 91,034.21
TOTAL
4,215,953.11
2,349,155.66

13
Table 2.5: Disbursement by Sector in the year 2017 (January – December, 2017)
FUND
EDUCATION
ROADS
ECONOMIC
WATER
WORKS
HEALTH
SANITATION
GOVERNANCE
DACF 113841.00 540,560.00 106,578.79 37,600.97 124,978.57 160,000.00 45,651.00 76,425.00
DDF - - - - 131,382.78 - - -
UDG - - - - - - - -
IGF 41,200.00 2,072.00 96,286.41 23,660.00 31,007.01 3,356.21 61,862.34 12,111.76
Others
(MP)
42,672.07 6,935.14 7,362.00 5,272.00 10,560.00 7,500.00 6,000.00 4,728.50

14
2.4 Efforts to Generate Funds
As part of the efforts to help increase revenue generation, the Assembly constituted Revenue
Mobilization Task Force to help boost revenue generation in the District. Also in line with the
District’s IGF, revenue collectors were given targets to achieve. Furthermore, management
decided to provide revenue collectors with ID cards, wellington boots, umbrella to ensure easy
identification and protection. The construction of market stalls at Anum Apapam, Dokrochiwa,
Amanase and Asuboi were all geared towards increasing internal revenue generation.
2.4.1 Challenges of Generating Funds
The challenges hindering revenue generation in the district are outlined below:
Lack of reliable data for revenue collection
Poor road network and surface conditions
Inadequate logistics to support revenue collectors e.g. Motorbikes, bicycles, etc
2.5 Update on Critical Development and Poverty Issues
2.5.1 The School Feeding Programme
The school feeding programme in the District did not see any new enrollment. The schools
benefiting from the programme were Sixteen (16) schools which comprised of Seven (7)
Kindergarten and Nine (9) Primary Schools in the period under review. It is worthy to note that
out of a total of fifty-eight (58) KGs and sixty-six (66) Primary Schools, only sixteen (16) schools
are currently benefiting from the programme. The total beneficiaries of the programme in the year
under review were 2,771 comprising of 1,494 (54%) boys and 1,277 (46%) girls.
The programme has contributed immensely to school enrolment and retention in the rural areas. It
is hoped that it will be extended to cover majority of deprived schools in the District.
The statistics of schools currently benefiting from the programme are outlined in the table below;

15
Table 2.6: Beneficiary Schools for School Feeding Programme
2.5.2 Educational Sponsorship
As part of the Government’s policy of investing in people and in line with the Assembly’s objective
to support the needy and vulnerable, only one (1) female brilliant but needy student was given
sponsorship to pursue her education in the year under the Member of Parliament’s Common Fund.
It is hoped that, there would be enough funds to help champion education by supporting more poor
and the needy to attain some significant level of education. It is hoped that the support would be
sustained to yield the needed benefits.
2.5.3 Update on free SHS Policy in the District
The Coaltar Presbyterian Senior High School enrolled a total of 512 students with 397 being
boarders and 115 being day students under Free SHS Policy.
This has been the highest number of students the school has ever enrolled in first year since its
establishment.
S/N NAME OF SCHOOL ENROLMENT
BOYS GIRLS TOTAL
1 Amanase D/A KG 75 78 153
2 Asuboi D/A KG 74 68 142
3 Coaltar D/A KG 53 47 100
4 Coaltar Presby K/G 36 27 63
5 Duodokrom D/A KG 37 38 75
6 Kofi Pare D/A KG 81 73 154
7 Otoase D/A KG 23 23 46
8 Amanase Presby Primary ‘A’ 164 138 302
9 Amanase Presby Primary ‘B’ 164 130 294
10 Asuboi Presby Primary 156 119 275
11 Asuboi Methodist Primary 135 118 253
12 Coaltar R/C Primary 115 94 209
13 Coaltar Presby Primary 144 123 267
14 Duodukrom D/A Primary 76 64 140
15 Kofi Pare R/C Primary 65 43 108
16 Otoase D/A Primary 96 94 190
TOTAL
1,494
1,277
2,771
16
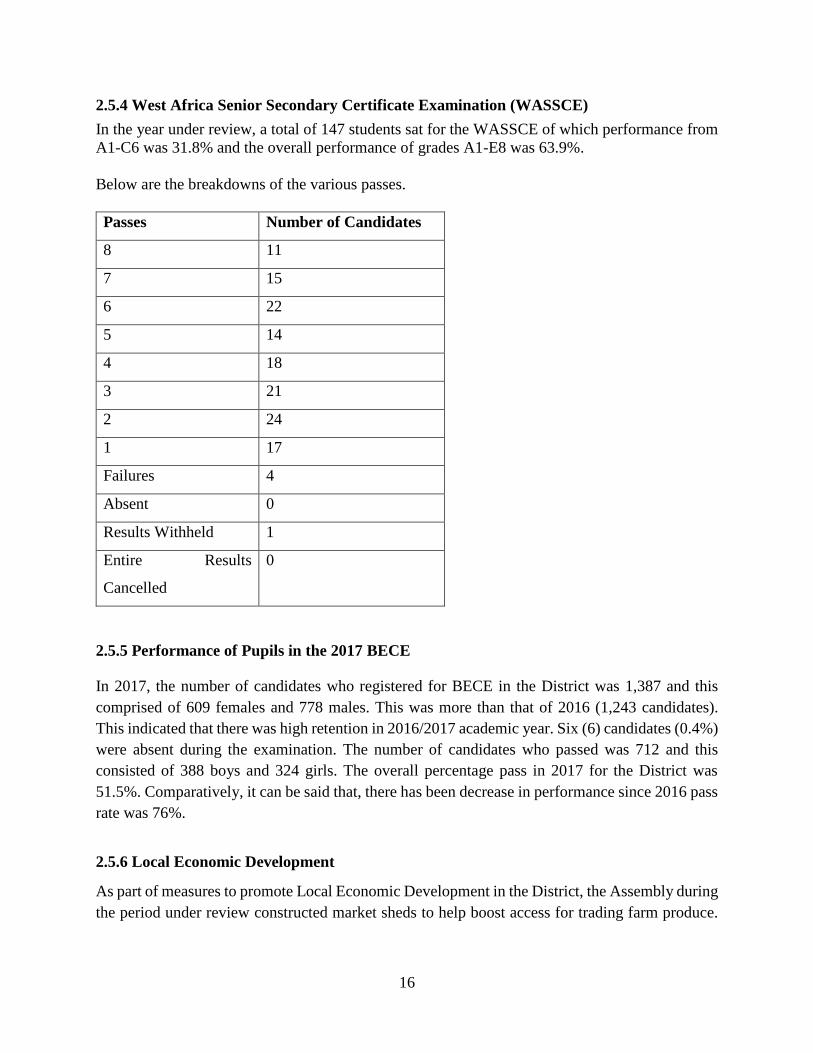
2.5.4 West Africa Senior Secondary Certificate Examination (WASSCE)
In the year under review, a total of 147 students sat for the WASSCE of which performance from
A1-C6 was 31.8% and the overall performance of grades A1-E8 was 63.9%.
Below are the breakdowns of the various passes.
Passes Number of Candidates
8 11
7 15
6 22
5 14
4 18
3 21
2 24
1 17
Failures 4
Absent 0
Results Withheld 1
Entire Results
Cancelled
0
2.5.5 Performance of Pupils in the 2017 BECE
In 2017, the number of candidates who registered for BECE in the District was 1,387 and this
comprised of 609 females and 778 males. This was more than that of 2016 (1,243 candidates).
This indicated that there was high retention in 2016/2017 academic year. Six (6) candidates (0.4%)
were absent during the examination. The number of candidates who passed was 712 and this
consisted of 388 boys and 324 girls. The overall percentage pass in 2017 for the District was
51.5%. Comparatively, it can be said that, there has been decrease in performance since 2016 pass
rate was 76%.
2.5.6 Local Economic Development
As part of measures to promote Local Economic Development in the District, the Assembly during
the period under review constructed market sheds to help boost access for trading farm produce.

17
These were the construction of market sheds in Anum Appam and Asuboi. This was aimed to
assist farmers have access and market their produce.
Also, the construction of a palm oil milling factory in Kwaboanta and training of enterprise groups
in soap making which was sponsored by Commonwealth Local Government Forum under the
Local Economic Development was completed and commissioned. This is to support and boost the
operations of palm oil extraction at Kwaboanta and its environs to enable the women groups’ use
modern technology in oil production to produce the oil in commercial quantities.
Moreover, a new project which is the construction of gari and cassava dough processing centre at
Amanase Ababo was commenced through the sponsorship of CLGF. This was aimed to reduce
youth and women unemployment in the District and the lessen the plight of community members
who are into the processing of gari and cassava dough but still uses obsolete means of production.
2.5.7Trade fair and Exhibition
During the year under review, the District took part in the trade fair and exhibition organized by
the Ministry of Trade and Industry under the auspices of the MoTI Eastern Regional Office,
Koforidua. Items exhibited by the the various enterprise groups from the District included palm
oil, liquid soap, bar soap, bleach, soya bean gari etc. the District Assembly also exhibited the
investment potentials areas within the District. Among such investment potentials were the
undeveloped tourist site at obuoho, cocoa, cassava and pawpaw plantations which needed the
requisite factories to turned them into finished and semi-finished products.
2.5.8 Support for People with Disabilities and OVCs
The Assembly, in the year under review, made significant contributions to the welfare of people
with disabilities and Orphan and Vulnerable Children in the District.
2.5.8.1 Registration and Disbursement of Funds to Persons with Disabilities (PWDs)
The Department of Social Development for the year under review collaborated with the Common
Fund Administrator to undertake a verification exercise on PWDs within the District. This exercise
led to the re-registration of a total of Four Hundred and Eighty-Nine (489) PWDs.
Table 2.7 Gender disaggregation of the re-registration exercise for PWDs
Category Number of PWDs Registered
Male
226
Female
207
Children
56
18
Total
489
Unfortunately, during the period under review, the Assembly and the Disability Fund Management
committee did not disburse any fund to registered PWDs due to non-release of funds from the
central government.
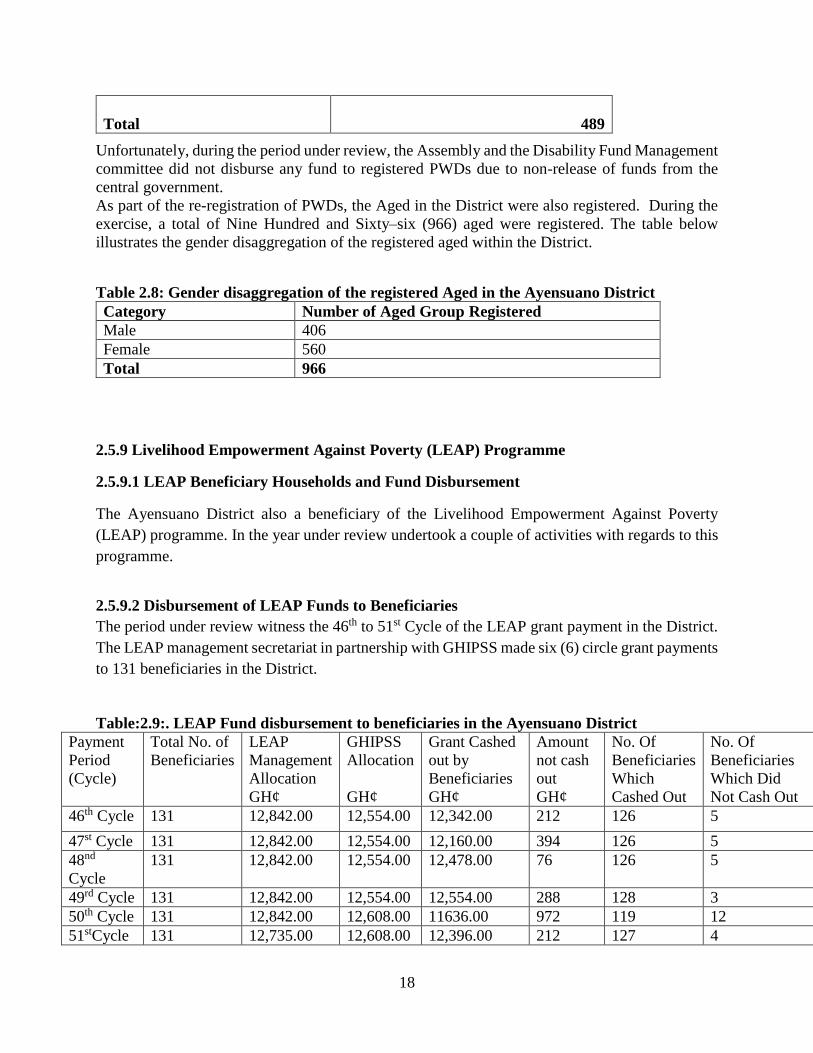
As part of the re-registration of PWDs, the Aged in the District were also registered. During the
exercise, a total of Nine Hundred and Sixty–six (966) aged were registered. The table below
illustrates the gender disaggregation of the registered aged within the District.
Table 2.8: Gender disaggregation of the registered Aged in the Ayensuano District
Category Number of Aged Group Registered
Male 406
Female 560
Total 966
2.5.9 Livelihood Empowerment Against Poverty (LEAP) Programme
2.5.9.1 LEAP Beneficiary Households and Fund Disbursement
The Ayensuano District also a beneficiary of the Livelihood Empowerment Against Poverty
(LEAP) programme. In the year under review undertook a couple of activities with regards to this
programme.
2.5.9.2 Disbursement of LEAP Funds to Beneficiaries
The period under review witness the 46th to 51st Cycle of the LEAP grant payment in the District.
The LEAP management secretariat in partnership with GHIPSS made six (6) circle grant payments
to 131 beneficiaries in the District.
Table:2.9:. LEAP Fund disbursement to beneficiaries in the Ayensuano District
Payment
Period
(Cycle)
Total No. of
Beneficiaries
LEAP
Management
Allocation
GH¢
GHIPSS
Allocation
GH¢
Grant Cashed
out by
Beneficiaries
GH¢
Amount
not cash
out
GH¢
No. Of
Beneficiaries
Which
Cashed Out
No. Of
Beneficiaries
Which Did
Not Cash Out
46th Cycle 131 12,842.00 12,554.00 12,342.00 212 126 5
47st Cycle 131 12,842.00 12,554.00 12,160.00 394 126 5
48nd
Cycle
131 12,842.00 12,554.00 12,478.00 76 126 5
49rd Cycle 131 12,842.00 12,554.00 12,554.00 288 128 3
50th Cycle 131 12,842.00 12,608.00 11636.00 972 119 12
51stCycle 131 12,735.00 12,608.00 12,396.00 212 127 4

19
Total 76945.00 75432.00 73566.00 2154 34
The table below shows the gender distribution of the LEAP beneficiaries for the 46th to 51st LEAP
payment cycle:
Table 2.10: Gender Distribution of LEAP Beneficiaries in the District
From the table above, it is evident that the female beneficiaries were more than their male
counterparts. The female beneficiaries covered 76 households, representing 58% of the total
beneficiaries while their male counterparts covered 55 households which also represented 42% of
the total beneficiaries.
2.5.10 Health Situation in the District
The District Assembly has serious challenges from its inception to date. As at the end of 2017, a
District which has four hundred and thirty-five (435) communities and hamlets had a total health
facilities of only twenty-five (25) which comprised of seven (7) health centres and twelve (18)
functional CHPs compounds out of twenty-seven (27) demarcated CHPs zones.
2.5.10.1 Support for Disease Control Programmes in the District
As part of efforts to promote a healthy work force to run the District economy, the Assembly has
been supporting the District Health Administration to undertake preventive and curative disease
control programmes such as immunization and community based surveillance. Children due for
immunization were all vaccinated with the various antigens in the year under review.
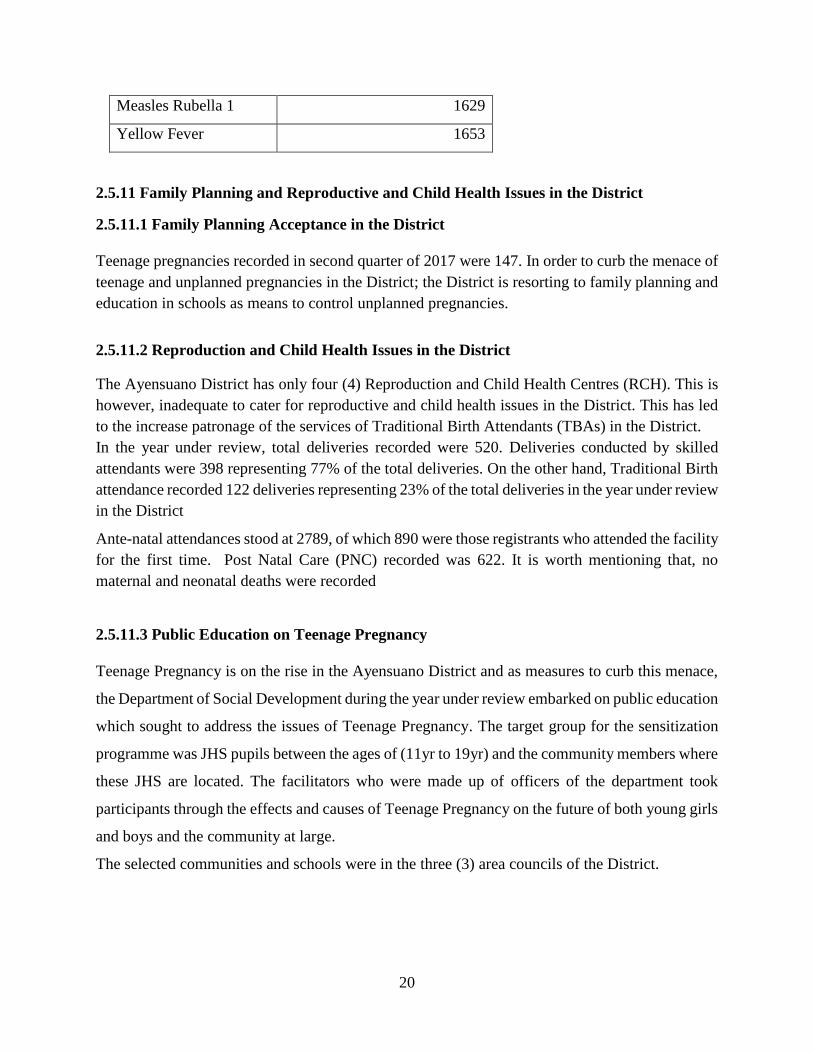
Table 2:11 Antigens administered in the year, 2017
Type of Antigen Number
BCG 1678
Opv 1 1741
Opv 3 1639
Penta 1 1739
Penta 3 1639
Gender Number Percentage (%)
Male 55 42
Female 76 58
Total 131 100
20
Measles Rubella 1 1629
Yellow Fever 1653
2.5.11 Family Planning and Reproductive and Child Health Issues in the District
2.5.11.1 Family Planning Acceptance in the District
Teenage pregnancies recorded in second quarter of 2017 were 147. In order to curb the menace of
teenage and unplanned pregnancies in the District; the District is resorting to family planning and
education in schools as means to control unplanned pregnancies.
2.5.11.2 Reproduction and Child Health Issues in the District
The Ayensuano District has only four (4) Reproduction and Child Health Centres (RCH). This is
however, inadequate to cater for reproductive and child health issues in the District. This has led
to the increase patronage of the services of Traditional Birth Attendants (TBAs) in the District.
In the year under review, total deliveries recorded were 520. Deliveries conducted by skilled
attendants were 398 representing 77% of the total deliveries. On the other hand, Traditional Birth
attendance recorded 122 deliveries representing 23% of the total deliveries in the year under review
in the District
Ante-natal attendances stood at 2789, of which 890 were those registrants who attended the facility
for the first time. Post Natal Care (PNC) recorded was 622. It is worth mentioning that, no
maternal and neonatal deaths were recorded
2.5.11.3 Public Education on Teenage Pregnancy
Teenage Pregnancy is on the rise in the Ayensuano District and as measures to curb this menace,
the Department of Social Development during the year under review embarked on public education
which sought to address the issues of Teenage Pregnancy. The target group for the sensitization
programme was JHS pupils between the ages of (11yr to 19yr) and the community members where
these JHS are located. The facilitators who were made up of officers of the department took
participants through the effects and causes of Teenage Pregnancy on the future of both young girls
and boys and the community at large.
The selected communities and schools were in the three (3) area councils of the District.

21
Table:2.12: Gender disaggregation during the sensitization exercise
Area Councils Total Participants Pupils Male Female
Kraboa - Coaltar
122
37
65
Obeasua 266 60 65
Anum Apapam 400 98 124
TOTAL 788 195 254
2.5.12 Agriculture and food security
The activities of the Department of Agriculture centered around field visits by Agricultural
Extension Agents (AEAs), Farmer trainings, farmers’ forum, animal health activities, sustainable
land use and management, food supply and price trucking, crop and livestock disease and pest
surveillance, monitoring of special demonstrations and programmes and other crosscutting issues.
2.5.12.1 Rainfall and Its Effects on Crop and Livestock during the year
Rainfalls in the district during the period under review did not start early but the rainfall pattern
and distribution were very propitious to both crop and livestock development. However, there were
few cases of flooding in low land areas.
Generally, the rainfall in 2017 increased agricultural commodities in the district especially maize,
plantain, cocoyam and forage and fodder growth for livestock. Over the period, the Ayensuano
District recorded a total of 58 rainy days in the year. Comparing this to 2016 which had 47 rainy
days, the district recorded an extra 11 rainy days in 2017 which was 23% above that of 2016.
2.5.12.2 Impact of Pest & Diseases in Crop Performance within the District
Fall army worm was the major pest that destroyed maize farms especially in the major season. The
Ministry of Food and Agriculture responded quickly by supplying chemicals to the affected
farmers to combat the situation. This was sponsored by the Ministry through the National attack
on the Fall Army Worm infestation in the country by supplying chemicals to the Department to
signify the onset of the attack to combat the worm infestation.
During the period under review, 346 hectares of maize fields were affected by fall army and about
34.6 hectares were completely destroyed. However, the interventions put in place by the
Agriculture department through the support of MoFA redeemed about 90% of the total crop area
affected.

22
Notwithstanding this, due to low knowledge of Non-Planting for Food and Jobs (PFJ) farmers on
the fall army worm at the initial stages of the infestation, meaningful numbers of acres of maize
farms were destroyed.
The fall army worm infestation scared most farmers to patronize the minor season maize project.
The cob size of the Wang-data maize also discouraged most farmers from participating in the
minor season programme.
Table 2.13: Fall Army Worm Infestation, other pest and diseases, flood, bushfire Type of
disaster
Type of
enterprise
affected
(crop, etc)
No of
Farmers
affected
Total
farm area
cropped
(Ha)
Area
Affected
Period of
infestation /
damage
(Month)
Area
destroyed
completely
Estimated
value of
crop
destroyed
Actions
taken
Fall Army
Worm
Infestation
Maize
farms
340 449.2 346
hectares
Apr-
May
Sep-
Oct.
34.6
hectares
GHȼ
86,500.00
Chemicals
were
supplied to
farmers to
combat the
menace by
central
government
Source: DAD, 2017. ***Provision of figures above was on PFJ programme only.
Table 2.14:: Chemical distribution for fall army worm control Name of chemical Quantity
received
(litres)
Quantity
supplied
(litres)
Beneficiaries
Male Female Total
Viper 9.6 4.9 27 - 27
Suppertop 60 60 140 5 145
Condifor 120 120 92 28 84
Ema star 40 40 38 - 48
Pyrineo quick 424EC 16 16 20 - 20
Pyrineo quick 286EC 24 24 16 - 16
KD 215 48 - - - -
Eradict T.GH 20 - - - -
Agoo 40satchets - - - -
Source: DAD, 2017

23
2.5.12.3 Food Availability and Access
Access to food in the District has three main sources namely, local daily and weekly food markets
for locally produce food; consumption from household own farms and food from import sources.
Food availability and access, are attributes of food security, hence the number of markets in the
District gives an indication of how easily food markets are accessible to community members.
Local weekly and daily food markets and outlets in the District was 23 (5 major and 18 minor
markets). It is worthy to note that, alternative economic and social safety food sources such as food
assistance did not take place in the District since there was no case of food production shortage.
The District did not experience deficit in any of the major foods apart from rice and fish which
were taken care of through import from other Districts.
2.5.13 Increased Competitiveness and Enhanced Integration into Domestic and
International Market
The department organized trainings during the year for some, FBOs, CBOs by AEAs on food
safety techniques as a way of increasing their competitiveness to meet the requirement of both the
local and the international markets. These training programmes were supported by the Hunger
Project and German Technical Cooperation. The areas covered included the following:
a. climate resilient crops
b. Post – harvest technology
c. Sensitization of actors in the value chain on the need for collaboration as a way to meet
the demands of both the domestic and the international markets.
d. Farm records keeping and crop budgeting
e. Selection of high yielding varieties
f. Post – harvest technology
g. Group savings and access to loans
h. Correct handling of agrochemical and other inputs and its effects on their farm
enterprises.
i. Farm hygiene and good agricultural practices
j. Standardization, sorting and grading of commodities.
During the training, a total of 1416 farmers comprising 1059 male and 357 females benefited from
the trainings
2.5.14 Farmer’s Day Celebration

24
The Ayensuano District Assembly and the Department of Agriculture organised a successful
Farmers’ Day celebration at Coaltar and awarded various prizes to deserving farmers. This was in
pursuant of the National Farmers’ Day Celebration to honour famers who continually supply food
to feed the growing population.
During the celebration, eighteen (18) individuals and groups were awarded. The prizes varied
among the following; motor cycle, refrigerators, certificates, television set, cutlasses, wellington
boots, agrochemicals, spraying machines, wheel barrows among others.
2.5.15 Natural Resources Management
As part of its management programs, the Department of Agriculture over the period carried out 12
natural resource management activities in the period under review. The programme recorded a
total of 737 participants and this comprised of 513 males and 224 females. Some of the activities
it under took include among others;
Zero tillage
Tree planting to improve the vegetation
Erosion control measures eg. planting of cover crops
Application of organic and inorganic fertilizer.
Furthermore, the National Disaster and Management Organisation (NADMO) has planted six
hundred different species of trees seedlings in four communities in the District to serve as wind
break and mitigate excessive climate change. These communities were Amanase, Mankrong,
Asuboi, kyekyewere.
2.5.16 Natural Resources Management
2.5.16.1 Protection and Mitigation Measures (Sustainable Land Use Management)
Declining soil fertility in the District is caused by continuous cropping of the same crops on the
same lands without good agricultural practices by farmers. Soil erosion is also one of the major
causes of land degradation on farm lands and settlement areas of the District. Destruction of
vegetative cover and food crops by bushfire and sand winning are annual problems in the district.
The effect of all these factors is declining soil fertility, erratic rainfall, poor crop growth and lower
yields and massive land degradation. Livestock production is not well managed as farmers have
inadequate knowledge on the use of farm yard manure.
Consequently, in the year under review, four (4) community fora were organized and farmers were
sensitized on the need to preserve the environment. A total of 443 farmers (308 male and 135
females) were covered during the sessions and the education covered the following areas;

25
a. Prevention of soil erosion.
b. Crating of fire belt around farms.
c. Planting of vegetative materials to improve soil fertility.
d. Effect of river valley dry season farming on the environment.
e. Soil and water management.
f. Mulching and its benefit
2.5.17 Planting for Food and Jobs Programme
The Government of Ghana in the quest to ensure food security and also create jobs, launched the
‘Planting for Food and Jobs’ Programme. The Ayensuano District also benefitted from this
programme by supporting farmers through various means which included the distribution of maize
seeds and fertilizers at subsidized prices. During the implementation of the PFJ, 422 farmers were
registered and benefited and this comprised of 389 males and 33 females
2.5.17.1 Crop Performance in District
Cassava is the most prominent crop extensively grown in the district. The district has comparative
advantage in cassava production than any crop in the distinct followed by maize, plantain and
vegetables.
Table 2.15 Major Crop Performance (PFJ and Non PFJ) Crop Area Cropped (ha) Average Yield
(MT/Ha)
Estimated Production
(MT)
2016 2017 2016 2017 2016 2017
Maize 8,407 1.66 13,955.62
Rice (milled)
Cassava 7,218 17.23 124,366.14
Yam 788 15.20 11,977.6
Cocoyam 29 8.42 244.18
Plantain 8,619 10.23 88,344.75
Groundnuts 9.3 2.3 21.39
Cowpea 6.7 1.66 11,122
Soybean - - - - -
Tomatoes 998 2.77 2,764
Pepper 750 1.1 825
Onion - - - - -
Okro 618 1.86 1149.48
Others
Table 2.16: Performance of Planting for Food & Jobs (PFJ) farms Crops Variety No of Farmers

26
Area
cropped
(Ha)
Average
yield
(MT/Ha)
Estimated
production
(MT)
Male Female Total
Maize Wang-
data
271.2 1.66 450.2 295 18 313
Obatampa 64 1.66 106.24
94
15
109
Sanzalima 33.5 1.66 556.1
Total 368.7 389 33 422
Rice
(Paddy)
N/A
Total
Tomatoes N/A
Total
Pepper N/A
Total
Onion N/A
Total
Source: DAD, 2017
2.5.18 Agro Input Distributions under PFJ
The table below indicates the input distribution of the PFJ programme for 2017
Table 2.17: Agro Input Distribution under PFJ Kind of
inputs
Type/Variety
of Input
Unit Quantity No of beneficiaries
Received Distributed Male Female Total
Fertilizer NPK 50 kg 2500 1676 389 33 422
Urea 50 kg 1250 838 389 33 422
Seed
(Maize)
45kg 241 167 389 33 422
Rice seed N/A
Vegetable N/A
Pepper N/A
Tomato N/A
Onion N/A
Source: DADs, 2017
2.5.18.1 Total Recovery under Planting Food and Jobs PFJ

27
Table 2.18 Total Recovery under Planting Food and Jobs PFJ Type of Input Cost of input given
out to farmers (GHȼ)
Amount Recovered
(GHȼ)
Balance (GHȼ) Comments
NPK 136,416.00 68,208.00 68,208.00 The recovery of debt is becoming
a challenge due to the fall army
worm infestation which affected
most of the fields and also due to
the small cob size of the Wang-
data maize
UREA 48,604.00 24,302.00 24,302.00
Seed(Maize) 5,344.00 2,672.00 2,672.00
Total
Source: DADs, 2017
Table 2.19: District Allocation of Subsidized Fertilizer
Urea No of beneficiaries NPK No of beneficiaries
Quantity (MT) Male Female Total Quantity
(MT)
Male Female Total
13.45 100 23 123 21.7 140 29 169
269 (50kg) 434(50kg)
Source: DAD, 2017
2.5.19 Public Health Promotion and Education
The Department of Social Development in collaboration with the District Health Directorate
organised a sensitization programme on healthy eating for the LEAP beneficiaries during the 48th
Cycle payment at the various pay points. The beneficiaries were educated on how to use the local
vegetables they have around their community in their diet. Additionally, they were also educated
on regular exercising of their body as well as drinking a lot of water. The total number of
participants that participated in program was one hundred and twenty- six (126) and it comprised
of 59 male, 67 females.
Consequently, USAID, with support from the Health Directorate and the GES distributed about
96 bales of mosquito nets to various schools to improve the health of the school pupils and to
protect them from malaria. Thus about 4800 mosquito nets were distributed. This was done under
school health education carried out in the District in the year under review.
2.5.20 Participatory Monitoring and Evaluation
In the year under review, the District Planning and Coordinating Unit (DPCU) established strong
partnerships with development partners working in the District with the view of pursuing a
common development agenda. The DPCU conducted series of participatory Monitoring and
Evaluation exercises where the team met Project Contractors, Project Consultants and the
beneficiary communities at Project sites to deliberate on observations and made recommendations
for a successful completion of projects.
Focus Group Discussions and Community Score Scards as tools were used during the evaluation
exercises.
28
CHAPTER THREE
THE WAY FORWARD
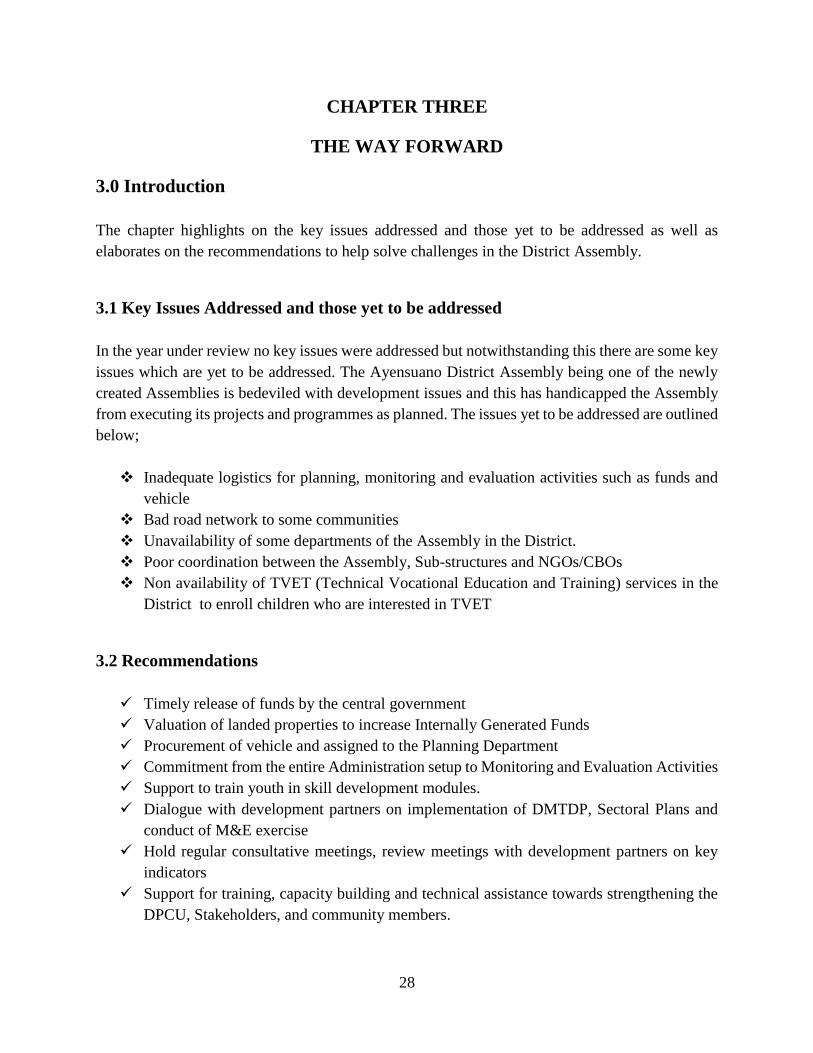
3.0 Introduction
The chapter highlights on the key issues addressed and those yet to be addressed as well as
elaborates on the recommendations to help solve challenges in the District Assembly.
3.1 Key Issues Addressed and those yet to be addressed
In the year under review no key issues were addressed but notwithstanding this there are some key
issues which are yet to be addressed. The Ayensuano District Assembly being one of the newly
created Assemblies is bedeviled with development issues and this has handicapped the Assembly
from executing its projects and programmes as planned. The issues yet to be addressed are outlined
below;
Inadequate logistics for planning, monitoring and evaluation activities such as funds and
vehicle
Bad road network to some communities
Unavailability of some departments of the Assembly in the District.
Poor coordination between the Assembly, Sub-structures and NGOs/CBOs
Non availability of TVET (Technical Vocational Education and Training) services in the
District to enroll children who are interested in TVET
3.2 Recommendations
Timely release of funds by the central government
Valuation of landed properties to increase Internally Generated Funds
Procurement of vehicle and assigned to the Planning Department
Commitment from the entire Administration setup to Monitoring and Evaluation Activities
Support to train youth in skill development modules.
Dialogue with development partners on implementation of DMTDP, Sectoral Plans and
conduct of M&E exercise
Hold regular consultative meetings, review meetings with development partners on key
indicators
Support for training, capacity building and technical assistance towards strengthening the
DPCU, Stakeholders, and community members.