
2016Asset Liability Review - Rhode...
26
Rhode Island SIC July 13, 2016 Allan Emkin | John Burns, CFA 2016Asset Liability Review
Transcript of 2016Asset Liability Review - Rhode...

Rhode Island SIC
July 13, 2016
Allan Emkin | John Burns, CFA
2016Asset Liability Review

Rhode Island SIC • 2016 Asset Liability Review 1
Rhode Island Asset Liability Review Calendar
Today’s Discussion
Topic Date1 Liabilities Briefing May 25, 2016
a. Review of liability profile and other actuarial considerations
2 Benchmarking Briefing June 22, 2016 a. Peer institutional fund reviewb. ERSRI Plan asset portfolio reviewc. PCA Briefing on how the model works
3 Risks and Risk Preferences July 13, 2016
a. Financial condition of planb. Risk sensitivities and definitions of success
4 Translating Risk Appetite into Investment Constraints Aug 1, 2016 a. Define investment objectives and determine model
variablesb. New concept review (asset class)
5 Asset Class Modeling Aug 1, 2016a. Role of assetsb. Capital market assumptions
6 First Run of Model Sept 8, 2016a. Model output review - SIC feedbackb. Issues for further review
7 Second Run of Model Sept 28, 2016
a. Model output review
8 Adoption of Strategic Asset Allocation Sept 28, 2016

Rhode Island SIC • 2016 Asset Liability Review
Investment Challenge

Rhode Island SIC • 2016 Asset Liability Review 3
• Risk is primarily managed strategically• Publicly-traded stock and bond portfolios are primarily managed to provide market exposure
Funding Ratio (%)
Return Target (%)
Net Cash Flow (% of Assets)
60 7.5 - 5%
Lower than average Average Higher than
average
Employees Retirement System of Rhode Island (ERSRI)
Policy Allocation (%) Rebalancing Range (%)
Global Equity 38% +/- 2%HF - Equity 8 +/- 2%Private Equity 7 +/- 2%infrastructure 5 +/- 2%Real Estate 8 +/- 2%Credit / TIPS 9 +/- 2%Real Return HF 7 +/- 2%Fixed Income 15 +/- 2%Cash 3% +/- 2%Total 100%
Rhode Island SIC • 2016 Asset Liability Review 4
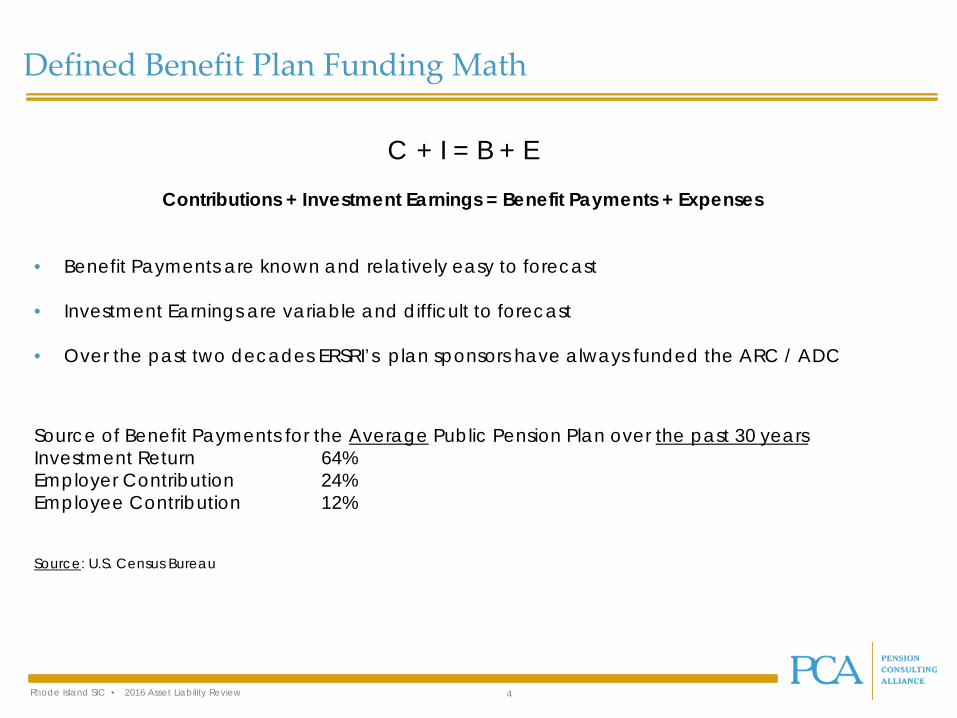
Defined Benefit Plan Funding Math
C + I = B + E
Contributions + Investment Earnings = Benefit Payments + Expenses
• Benefit Payments are known and relatively easy to forecast
• Investment Earnings are variable and difficult to forecast
• Over the past two decades ERSRI’s plan sponsors have always funded the ARC / ADC
Source of Benefit Payments for the Average Public Pension Plan over the past 30 years Investment Return 64% Employer Contribution 24% Employee Contribution 12%
Source: U.S. Census Bureau

Rhode Island SIC • 2016 Asset Liability Review 5
ERSRI Plan Revenues and Expenditures • The red bars reflect investment gains and losses, which vacillate as financial markets fluctuate.
• Blue bars indicate contributions, from employees and employers, and green bars show benefit payments.
• Growth in levels of contributions and benefits is mostly stable and predictable over time.
• Investment earnings, comprising over 56% percent of plan revenues over the past seventeen years,fluctuate depending on market performance. In a low expected return environment – investmentearnings as percent of revenues could decline.
C + I = B + E
(1,500,000,000)
(1,000,000,000)
(500,000,000)
-
500,000,000
1,000,000,000
1,500,000,000
Contributions
Investment Earnings
Benefits paid
Source: GRS
Rhode Island SIC • 2016 Asset Liability Review 6
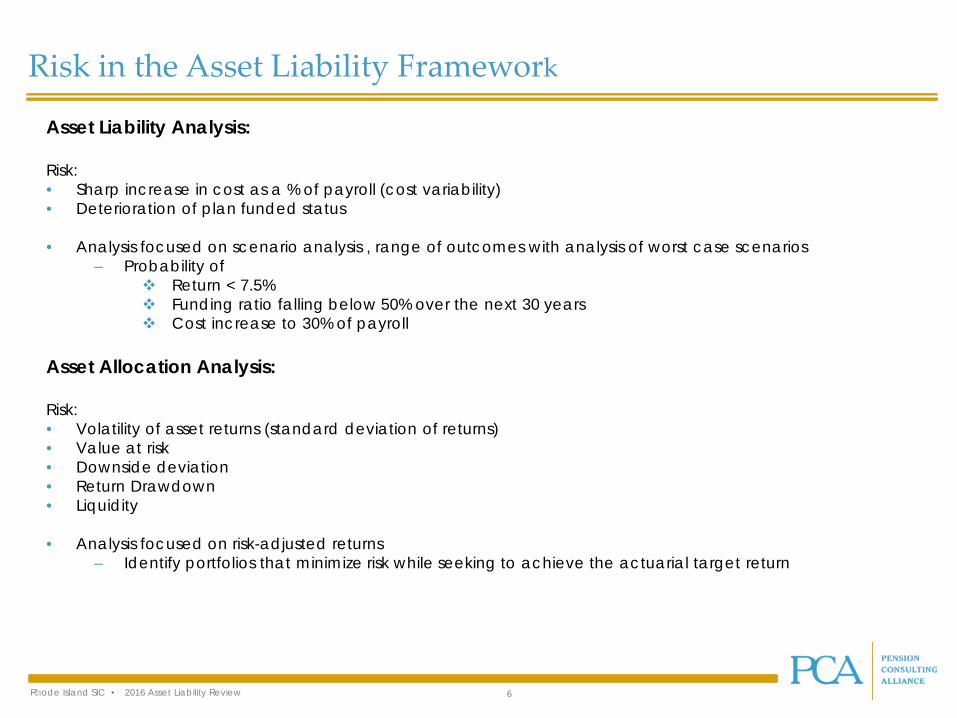
Risk in the Asset Liability Framework
Asset Liability Analysis:
Risk: • Sharp increase in cost as a % of payroll (cost variability) • Deterioration of plan funded status
• Analysis focused on scenario analysis , range of outcomes with analysis of worst case scenarios – Probability of
Return < 7.5% Funding ratio falling below 50% over the next 30 years Cost increase to 30% of payroll
Asset Allocation Analysis:
Risk: • Volatility of asset returns (standard deviation of returns)• Value at risk • Downside deviation • Return Drawdown • Liquidity
• Analysis focused on risk-adjusted returns – Identify portfolios that minimize risk while seeking to achieve the actuarial target return

Rhode Island SIC • 2016 Asset Liability Review 7
Low Expected Return Environment For All Savers
The current investment environment very challenging for long-term institutional investors
• Historically low(and negative in some geographies)level of interest rates
• Central banks’ monetary policy appears to have reached the end of its effectiveness in stimulating economic growth and risk assets,
• Abnormally low level of economic growth around the world,
• Relatively high levels of equity valuations, and
• Unusually high level of political uncertainty that exists globally
These factors are reflected in intuitional investors’ 10-year capital market return expectations.
Rhode Island SIC • 2016 Asset Liability Review 8
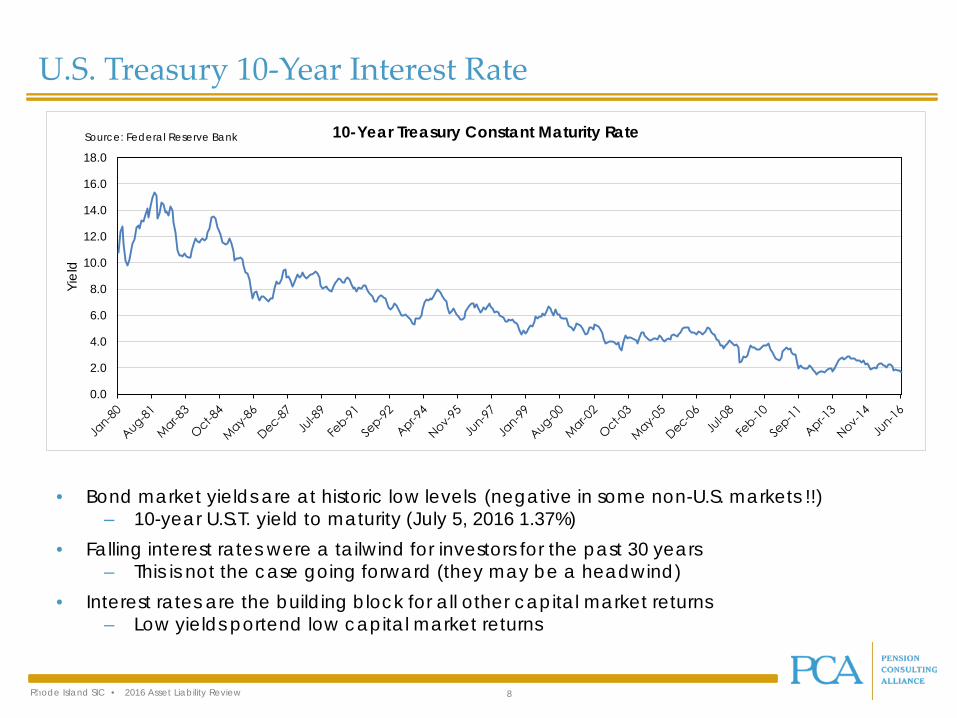
U.S. Treasury 10-Year Interest Rate
• Bond market yields are at historic low levels (negative in some non-U.S. markets !!) – 10-year U.S.T. yield to maturity (July 5, 2016 1.37%)
• Falling interest rates were a tailwind for investors for the past 30 years – This is not the case going forward (they may be a headwind)
• Interest rates are the building block for all other capital market returns – Low yields portend low capital market returns
0.0
2.0
4.0
6.0
8.0
10.0
12.0
14.0
16.0
18.0
Yiel
d
10-Year Treasury Constant Maturity RateSource: Federal Reserve Bank

Rhode Island SIC • 2016 Asset Liability Review 9
U.S. Equity Market: Good Long-term Returns Entail Risk
• Equity investors are rewarded with high returns in the long term • However, Equity Investors experienced two “once in a hundred year” negative events in a 10-
year period
-43%-46%

Rhode Island SIC • 2016 Asset Liability Review 10
13.64
2.320.65
12.07
5.41
7.24
17.46
8.91
1.01
6.04
02468
1012141618
Total Return % Long-term Average
Global Equity & Bond Returns (1926 – 2016)
• 60% global equity / 40% global bonds portfolio
• Investors are usually rewarded for taking investment risk; however returns are variable
Data source: BONY Mellon

Rhode Island SIC • 2016 Asset Liability Review 11
• Investors are usually rewarded for taking investment risk; however returns are variable
60 / 40 Portfolio Returns
Risk can be unrewarded for extended periods

Rhode Island SIC • 2016 Asset Liability Review 12
• Long-term investors face a bumpy ride to capture the equity return premium
Equity Market Returns are Rarely “Average”

Rhode Island SIC • 2016 Asset Liability Review 13
Source: Public Pension Funding Practices Report 2016 - Rockefeller Institute of Government State University of New York
DB Plans Must Take Risk to Achieve Their Actuarial Return Targets
Possible to achieve return objective without taking significant equity risk
Investor must take risk to achieve return objective
Rhode Island SIC • 2016 Asset Liability Review 14
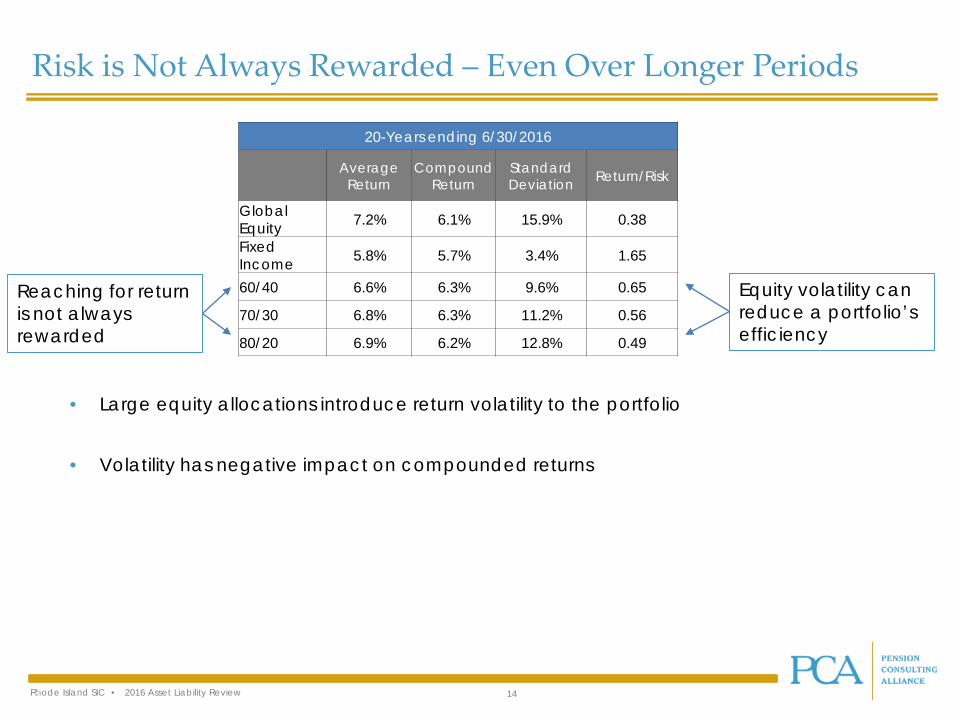
Risk is Not Always Rewarded – Even Over Longer Periods
20-Years ending 6/30/2016
Average Return
Compound Return
Standard Deviation Return/Risk
Global Equity 7.2% 6.1% 15.9% 0.38
Fixed Income 5.8% 5.7% 3.4% 1.65
60/40 6.6% 6.3% 9.6% 0.65
70/30 6.8% 6.3% 11.2% 0.56
80/20 6.9% 6.2% 12.8% 0.49
• Large equity allocations introduce return volatility to the portfolio
• Volatility has negative impact on compounded returns
Reaching for return is not always rewarded
Equity volatility can reduce a portfolio’s efficiency
Rhode Island SIC • 2016 Asset Liability Review 15
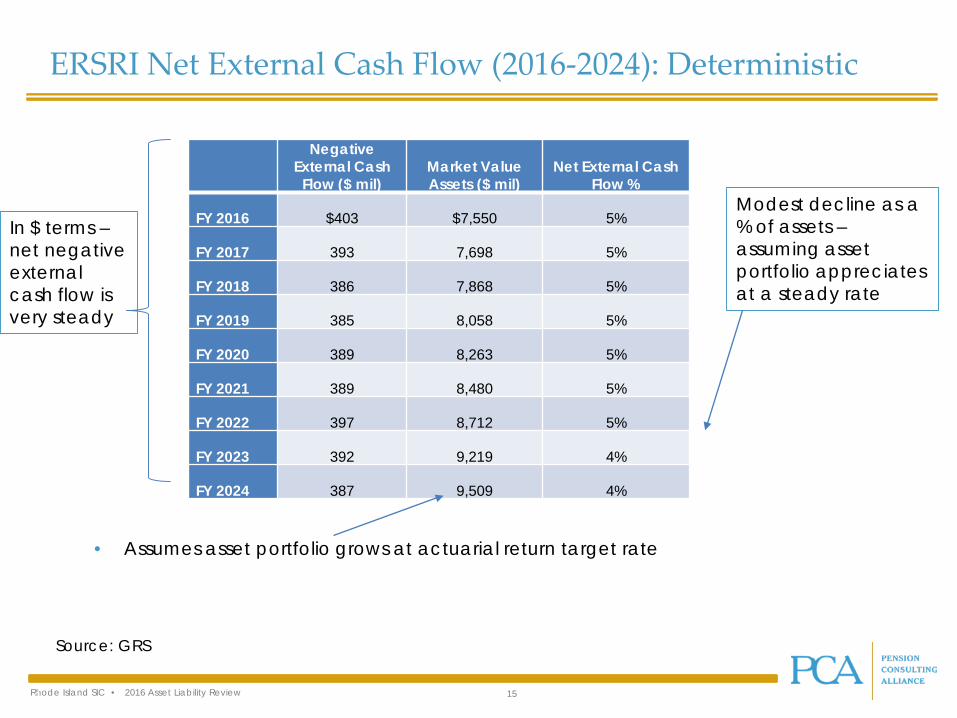
Negative External Cash
Flow ($ mil)Market Value Assets ($ mil)
Net External Cash Flow %
FY 2016 $403 $7,550 5%
FY 2017 393 7,698 5%
FY 2018 386 7,868 5%
FY 2019 385 8,058 5%
FY 2020 389 8,263 5%
FY 2021 389 8,480 5%
FY 2022 397 8,712 5%
FY 2023 392 9,219 4%
FY 2024 387 9,509 4%
Source: GRS
ERSRI Net External Cash Flow (2016-2024): Deterministic
• Assumes asset portfolio grows at actuarial return target rate
In $ terms –net negative external cash flow is very steady
Modest decline as a % of assets –assuming asset portfolio appreciates at a steady rate
Rhode Island SIC • 2016 Asset Liability Review 16
Net Negative External Cash Flow: Investment Implications
Large net negative external cash flow (ERSRI ~ -5%) per year may reduce a mature DB plan’s management flexibility
Large negative market movements (drawdowns) are particularly harmful to plan solvency for mature funds
• Under the worst case scenarios, investors are forced to liquidate long-dated assets in down markets or are forced sellers of illiquid assets – at price concessions
• Net cash outflows are assets not available to invest in lower valuation assets and represent an opportunity cost if financial markets rebound
• Negative market returns could cause a Plan’s funding ratio to drop to unsustainable levels where the plan can not recover in the long-term

Rhode Island SIC • 2016 Asset Liability Review 17
Net Negative External Cash Flow: Investment Implications
Given that portfolio returns are volatile and the plan anticipates a large net negative external cash flow for the next decade (at least):
• Achieving the actuarial return target on average may not be sufficient – even if ADCs are made – to maintain plan sustainability
– Compounded returns are what matter
• Since the portfolio is vulnerable to large negative equity market movements, the investor’s ability to take risk may be constrained
The asset liability review will address these issues

Rhode Island SIC • 2016 Asset Liability Review 18
Historical Traditional Mix Portfolio Outcomes
• Equities drive investment results in traditional portfolios
• Net negative cash flows have a significant impact on portfolio valuation in negative market environments
• A more diversified portfolio including illiquid investment assets would likely have produced better results
0.70
0.80
0.90
1.00
1.10
1.20
1.30
1.40
1.50
1.60
Jun-
96Ja
n-97
Aug
-97
Mar
-98
Oct
-98
May
-99
Dec
-99
Jul-0
0Fe
b-01
Sep-
01A
pr-0
2N
ov-0
2Ju
n-03
Jan-
04A
ug-0
4M
ar-0
5O
ct-0
5M
ay-0
6D
ec-0
6Ju
l-07
Feb-
08Se
p-08
Apr
-09
Nov
-09
Jun-
10Ja
n-11
Aug
-11
Mar
-12
Oct
-12
May
-13
Dec
-13
Jul-1
4Fe
b-15
Sep-
15A
pr-1
6
20-Year Growth of $1as of 6/30/2016 – Includes -5% Annual Cash Flows
60/40 80/20

Rhode Island SIC • 2016 Asset Liability Review 19
Mature PlanStable Market Volatile Market
Return ValueAnnualPayout Return Value
Annual Payout
$100 $100
Year 1 -6% $89 -$5 -20% $76 -$5
Year 2 14% $96 -$5 24% $88 -$5
Year 3 4% $95 -$5 6% $88 -$5
Year 4 8% $97 -$5 10% $91 -$5Average
return 5.0% 5.0%Compound
return 4.7% 3.7%StandardDeviation 8.4% 18.4%
Volatility reduces compounded return
Volatile markets have adverse effects on portfolio value when combined with net negative cash flows
Net Negative External Cash Flow and Volatile Returns
Rhode Island SIC • 2016 Asset Liability Review 20
Summary:
• The asset liability review will explore the trade-offs (contributions, funding levels, investment risk and return) policy-makers face to provide retirement security for ERSRI active members and beneficiaries
• In the current investment environment institutional investors must assume significant investment risk (volatility) in seeking to achieve the actuarial return target
• The desire to achieve the return target must be balanced against the negative impact that large negative capital market returns can have on the Plan’s sustainability
• The asset liability review will analyze how capital market return volatility could impact plan financial health in the near and long-term given the Plan’s funding level and large net negative external cash flow
Rhode Island SIC • 2016 Asset Liability Review
Appendix:

Rhode Island SIC • 2016 Asset Liability Review 22
Arithmetic Returns• Sum of annual returns divided by the number of annual returns • Also know as simple average • Average return in any given year
Geometric Returns• The average of a set of products defined as "the 'n'th root product of 'n' numbers",
• Where 'n' represents the number of returns in the series• Also know as average compounded returns• Total annual return over the entire holding period • Value is negatively impacted by return volatility (standard deviation)
Modeling Terms

Rhode Island SIC • 2016 Asset Liability Review 23
Risk in the Asset Liability Framework
• Standard Deviation: A measure of a security's stability over a given period of time. While there are various ways to calculate it, the most common way is to compute the average deviation from the average price over the period of time one wishes to measure. Generally, securities with a higher historical volatility carry more risk.
• VaR (Value at Risk): A measure of the potential loss in value of a risky asset or portfolio over a defined period for a given confidence interval. It is used to capture the potential loss in value of a portfolio from adverse market movements over a specified period.
• Downside Deviation: Downside deviation is a risk statistic measuring volatility. It is a measure of downside risk that focuses on returns that fall below a minimum threshold or minimum acceptable return.
• Return Drawdown: The gradual decline in the price of a security or other investment between its high and low over a given period. A drawdown is measured from the time a retrenchment begins to when a new high is reached. This method is used because a valley can't be measured until a new high occurs. Once the new high is reached, the percentage change from the old high to the smallest trough is recorded. Drawdowns help determine an investment's financial risk.
• Liquidity: Liquidity describes the degree to which an asset or security can be quickly bought or sold in the market without affecting the asset's price.
• Efficient Frontier: The efficient frontier is the set of optimal portfolios that offers the highest expected return for a defined level of risk or the lowest risk for a given level of expected return. Portfolios that lie below the efficient frontier are sub-optimal, because they do not provide enough return for the level of risk. Portfolios that cluster to the right of the efficient frontier are also sub-optimal, because they have a higher level of risk for the defined rate of return.

Rhode Island SIC • 2016 Asset Liability Review 24
Risk in the Asset Liability Framework
• Sharpe Ratio: A measure of a portfolio's excess return relative to the total variability of the portfolio. The Sharpe ratio indicates whether a portfolio's returns are due to smart investment decisions or are a result of excess risk. The greater a portfolio's Sharpe ratio is, the better its risk-adjusted performance has been.
• Funding Ratio: The ratio of a pension plan's assets to its liabilities. A funding ratio above 1 indicates that the pension or annuity is able to cover all payments it is obligated to make.
• Cost as a Percent of Payroll: A measure of pension contributions as a weight of payroll expense.
• Monte Carlo Simulation: Model the probability of different outcomes in a process that cannot easily be predicted due to the intervention of random variables such as future capital market returns. The process simulates multiple outcome paths of a series of random events.

Rhode Island SIC • 2016 Asset Liability Review 25
DISCLOSURES: This document is provided for informational purposes only. It does not constitute an offer of securities of any of the issuers that may be described herein. Informationcontained herein may have been provided by third parties, including investment firms providing information on returns and assets under management, and may not have beenindependently verified. The past performance information contained in this report is not necessarily indicative of future results and there is no assurance that the investment in question willachieve comparable results or that the Firm will be able to implement its investment strategy or achieve its investment objectives. The actual realized value of currently unrealizedinvestments (if any) will depend on a variety of factors, including future operating results, the value of the assets and market conditions at the time of disposition, any related transactioncosts and the timing and manner of sale, all of which may differ from the assumptions and circumstances on which any current unrealized valuations are based.
Neither PCA nor PCA’s officers, employees or agents, make any representation or warranty, express or implied, in relation to the accuracy or completeness of the information contained inthis document or any oral information provided in connection herewith, or any data subsequently generated herefrom, and accept no responsibility, obligation or liability (whether direct orindirect, in contract, tort or otherwise) in relation to any of such information. PCA and PCA’s officers, employees and agents expressly disclaim any and all liability that may be based on thisdocument and any errors therein or omissions therefrom. Neither PCA nor any of PCA’s officers, employees or agents, make any representation of warranty, express or implied, that anytransaction has been or may be effected on the terms or in the manner stated in this document, or as to the achievement or reasonableness of future projections, management targets,estimates, prospects or returns, if any. Any views or terms contained herein are preliminary only, and are based on financial, economic, market and other conditions prevailing as of thedate of this document and are therefore subject to change.
The information contained in this report may include forward-looking statements. Forward-looking statements include a number of risks, uncertainties and other factors beyond the control ofthe Firm, which may result in material differences in actual results, performance or other expectations. The opinions, estimates and analyses reflect PCA’s current judgment, which maychange in the future.
Any tables, graphs or charts relating to past performance included in this report are intended only to illustrate investment performance for the historical periods shown. Such tables, graphsand charts are not intended to predict future performance and should not be used as the basis for an investment decision.
All trademarks or product names mentioned herein are the property of their respective owners. Indices are unmanaged and one cannot invest directly in an index. The index dataprovided is on an “as is” basis. In no event shall the index providers or its affiliates have any liability of any kind in connection with the index data or the portfolio described herein. Copyingor redistributing the index data is strictly prohibited.
The Russell indices are either registered trademarks or trade names of Frank Russell Company in the U.S. and/or other countries.
The MSCI indices are trademarks and service marks of MSCI or its subsidiaries.
Standard and Poor’s (S&P) is a division of The McGraw-Hill Companies, Inc. S&P indices, including the S&P 500, are a registered trademark of The McGraw-Hill Companies, Inc.
CBOE, not S&P, calculates and disseminates the BXM Index. The CBOE has a business relationship with Standard & Poor's on the BXM. CBOE and Chicago Board Options Exchange areregistered trademarks of the CBOE, and SPX, and CBOE S&P 500 BuyWrite Index BXM are servicemarks of the CBOE. The methodology of the CBOE S&P 500 BuyWrite Index is owned by CBOEand may be covered by one or more patents or pending patent applications.
The Barclays Capital indices (formerly known as the Lehman indices) are trademarks of Barclays Capital, Inc.
The Citigroup indices are trademarks of Citicorp or its affiliates.
The Merrill Lynch indices are trademarks of Merrill Lynch & Co. or its affiliates.


![· Web viewPost Until: [Date] PRODUCT RECALL. PRODUCT RECALL. PRODUCT RECALL. PRODUCT LIABILITY EVALUATION. PRODUCT LIABILITY EVALUATION. PRODUCT LIABILITY EVALUATION. PRODUCT LIABILITY](https://static.fdocuments.us/doc/165x107/5e58b356d7aea8615859438c/web-view-post-until-date-product-recall-product-recall-product-recall-product.jpg)


