2016/17 BUDGET MONITORING - Modern Mindsetwatford.moderngov.co.uk/documents/s13125/Finance... ·...
35
0 FINANCE DIGEST 2016/17 BUDGET MONITORING Period 8 (30 November) Watford Borough Council · TOWN HALL · WATFORD, HERTS WD17 3EX
Transcript of 2016/17 BUDGET MONITORING - Modern Mindsetwatford.moderngov.co.uk/documents/s13125/Finance... ·...

0
FINANCE DIGEST2016/17
BUDGET MONITORING
Period 8 (30 November)
Watford Borough Council · TOWN HALL · WATFORD, HERTS WD17 3EX

1
A table of contents is shown below together with the appropriate page number.
SECTION CONTENTS PAGE
Executive Summary 2
1 Revenue Budget 5
2 Capital Programme 9
3 Council Income 11
4 Treasury Management 15
5 Key Risks 15

2
Executive Summary
This Finance Digest shows the expected financial position (forecast outturn) for the current financial year based on the Council’s actual financial performance at the end of Period 8 (November) 2016. It also includes trend analysis for comparisons with previous years.The 2016/17 revenue forecast outturn shows an unfavourable variance of £0.657 million when compared to the latest budget. The variance is mainly due to:
Variance £’000Extra demand for Temporary Accommodation 450Loss of planning application income 150Delay in Health Campus dividend 217Reserve funding income adjustment (Veolia) 97Major projects works for property review 100Garage works 39Watford 2020 55Investment property rental income (260)Parking income from suspension of parking bays (178)Other smaller variances 80Total service variance 750Funding variance – Transition Grant (93)Period 8 variance 657
Also shown above is additional government funding relating to a transition grant for Council tax of £0.93 million which is a favourable funding variance. The net position is £0.657 million unfavourable.
The variance of £0.657million affects the following reserves:
Reserve £’000Programme Management Board reserve 326LA Business Growth Incentive reserve 54High Street Innovation reserve 90contribution to Car Parking Zone reserve 130Economic Impact reserve 57
In addition, it is likely that the £0.700 million budget allocated from the pension reserve to contribute to funding past service deficits will be deferred to 2017/18. This was included in the budget in anticipation of the results of the tri-ennial valuation by the scheme actuary of the Hertfordshire Pension Fund. The results of this valuation have only just been issued, and the funds are not required immediately so additional time is required to assess the best use of this resource.
The table below shows a summary of the Council’s revised use / contributions to reserve for 2016/17. This report purely concentrates on setting the revised budget for 2016/17. The impact of how these variances affect the funding gap to 2019/20 are included in the separate ‘financial planning’ report, which is included on this agenda. Some of the variances reported are ‘one off’ in 2016/17 and do not reoccur in future years.

3
Medium Term Financial Strategy 2016/17Latest Budget 17,225,400Variances previously reported 806,758Variances this period (Appendix 1A) (57,145)Forecast Outturn 17,975,013Funding (income from business rates, grants and council tax) (15,293,070)Additional Funding Variance (92,587)Budgeted use of reserves (761,500)Brought forward budget 2015/16 (1,190,340)Total 637,516
Use/(Contribution) to reserves as per original MTFS (19,510)Additional Funding Gap 657,026Revised use/(contribution) to reserves 637,516
The 2016/17 capital budget shows a decrease of £1.999 million when compared to the latest budget. The variance is primarily due to the rephasing of the Watford Business Park project to 2018/19 of £2.416 million, increase of £1.159 million on the Health Campus and a rephasing of £0.600 million to 2017/18 for the Colosseum roof.
In April 2015, the Council set up its internal Property Investment Board (PIB) to review the Council’s property portfolio, with the remit of disposing of uneconomical assets and reinvesting in property that creates regeneration and delivers a rate of return greater than 5%. PIB have purchased an investment property costing £10.044 million using its ring-fenced receipts from previous disposals.
The effect of both the revenue and capital variances upon on each reserve is shown in the table below. A full list of reserve balances is shown at Appendix 9.
Balance at
1 April
Agreed use of
Reserves
Previously reported
Movement
Reported Movement
this time
Total Balance at 31 March
2017
Description
£000 £000 £000 £000 £000 £000Capital Financing (6,275) 549 (1) 21 569 (5,706)Earmarked Reserves (17,547) 1,933 805 (150) 2,588 (14,959)General Fund (1,350) 0 0 0 0 (1,350)Total (25,172) 2,482 804 (129) 3,157 (22,015)

4
The financial balanced scorecard
REVENUE
Services are forecasting an unfavourable outturn variance of £0.657 million.
Additional cost of temporary accommodation is estimated at £0.550 million
Reduction in planning fees of £0.150 million
CAPITAL
There is a rephasing of £2.417 million to later years for the Watford Business Park scheme.
To date just over half of the planned budget has been spent.
Increase in rental income of £265,000 from the purchase of an investment property and new lettings
Collection rates for business rates and council tax are on target
INCOME
The annual funding gap at the end of the year (2016/17) is forecasted to be £0.638 million
FUNDING GAP

5
1.0 Revenue Budget
1.1 Budget monitoring report is a key tool in scrutinising the Council’s financial performance and is designed to provide an overview to all relevant stakeholders. It is essential that the council monitors its budgets throughout the year to ensure that it is meeting its strategic objectives within its resource limits and, where necessary, corrective action is taken. A key principle of budgetary control is to align the budget holders’ financial responsibilities and their management responsibilities.
1.2 The latest budget is £17.225 million. The forecast outturn is now estimated to be £17.975 million which results in an unfavourable service variance of £0.750 million which excludes the additional transition grant funding. When the additional government funding relating to a transition grant for Council tax of £0.93 million is included the total forecast variance is £0.657 million.
1.3 The latest budget and forecast outturn for the current financial year (2016/17) at the end of November are plotted on the graph below;
0 Quarter 1 Quarter 2 Quarter 3 Quarter 415
15.5
16
16.5
17
17.5
18
18.5
Latest Approved Budget Forecast Outtrun
Mill
ions
1.4 The table below compares the latest budget to the forecast outturn and shows the variance against each service. The figures in the table relate to direct costs and incomes for each service. The ‘Adjustment under Statute’ figure in the table represents the accounting treatment of indirect service costs such as internal recharges and capital financing charges that do not impact on service provision. The additional funding (transition grant) of £93,000 is not reported as part of net service expenditure and therefore not included in the table below.
6
Revenue Account 2016/17
Latest Budget
Forecast Outturn VarianceService Area
£000 £000 £000Corporate Strategy & Client Services 7,578 7,417 (161)Community & Customer Services 4,500 5,020 520Democracy & Governance 3,418 3,405 (13)Regeneration & Development (4,769) (4,786) (17)Managing Director 660 660 0Human Resources 576 576 0Strategic Finance 5,639 6,060 421Adjustment Under Statute (377) (377) 0Net Expenditure (services) 17,225 17,975 750
Additional grant funding 0 (93) (93)Totals 17,225 17,882 657
1.5 The detail of comparing the forecast outturn to the latest budget, together with an explanation for the variance by service is shown at Appendix 1. Services with significant variances have provided the narratives below:
Corporate Strategy & Client Services1.5.1 There is a saving of £25,000 in Clinical Waste service due to the rationalisation
of the service. A £40,000 saving on leased vehicles as the Council has ceased this arrangement having completed a successful procurement exercise. There is also additional income from the HCC contract of £55,480 and saving on employee costs of £63,000.
Community & Customer Services1.5.2 A £450,000 pressure remains on temporary accommodation as previously
reported. Similarly, expenditure of £25,000 is still required to complete the temporary accommodation project; this will be met from allocating funds from the Programme Management Board (PMB) reserve. There is a reduction in income from the printing service of £35,000. There is an additional cost of £100,000 for obtaining private sector properties and a saving of £75,000 on employee costs.
Regeneration & Development1.5.3 There is an increase in rental income of £370,000 from the purchase of an
investment property and rent reviews during the year. It should be noted that £129,000 of investment income was removed from the original 2016/17 budget due to the disposal of piecemeal properties as part of the Property Investment Board’s agreed rationalisation of the Council’s property portfolio. The increased revenue stream from the new purchase more than offsets this reduction.

7
1.5.4 A net additional cost of £39,340 has been identified for the Watford Business Park project as a result of the outsourcing of the property management services (£92,000) offset by increased rental income of £52,660.
1.5.5 Further expenditure of £80,000 is required to complete the project relating to the review of the Council’s property services. This will be met from allocating funds from Programme Management Board (PMB) reserve.
1.5.6 There is a positive variance in the building control inspection fee of £72,000; however there is an unfavourable variance in planning fee income of £174,000. There is also a predicted reduction in pre-application advice income of £20,000.
1.5.7 Additional contributions of £45,000 and £9,000 are to be made to the Chamber of Commerce and to Skillmakers respectively from the LABGI reserve.
1.5.8 There is the use of £90,000 from the High Street Innovation Fund reserve to fund the monitoring of the town centres’ footfall and agreed payment to BID for town centre projects.
1.5.9 There is a predicted reduction in the land charges search fee of £20,000 due to the slowdown in the housing market.
1.5.10 Additional expenditure of £48,000 was approved by Cabinet on 12 September 2016 for implementation of new parking bays, which will be funded from the CPZ reserve.
1.5.11 Additional one off income of £178,000 from the suspension of parking bays to allow works to be carried out by an external contractor will be credited to the CPZ reserve.
1.5.12 Staffing costs have increase by £70,000 due to agency staff.
Strategic Finance1.5.13. There is an unfavourable variance of £0.217 million relating to the timing of
the dividend payable to the Council for the Health Campus project. This will be paid in 2017/18.
1.5.14 Additional interest of £30,000 due to an improved cashflow position, brought about by increased receipts and lower spending on capital projects than anticipated at this time of year.
1.5.15 Additional cost of £31,000 on postage, printing and stationery relating to Council tax billing.
1.5.16 Revised salary projections for 2016/17 have now been accounted for and the £95,000 vacancy provision has been removed.

8
1.5.17 Funded from the Programme Management Board Reserve is a revenue contribution of £39,000 towards garage works and £54,000 for the additional resource on the Watford 2020 project.
Spend to Date and Profiles
1.6 To enable further scrutiny of the Council’s financial position, budgets are profiled to allow comparisons to be made between the actual spend/income against expected spend/income to date. This helps to inform if the Council’s spending plans are on track. Budget profiling spreads the latest budget across the months of the year where income/expenditure is anticipated.
1.7 The table below compares the profiled budget to date to the actual net expenditure to date and the variance between the two for each service for Period 8.
Profiled Budget Actual VarianceService Area
£000 £000 £000Corporate Strategy & Client Services 4,638 4,546 (92)Community & Customer Services 2,938 2,996 57Democracy & Governance 2,319 2,072 (247)Regeneration & Development (2,873) (2,633) 240Managing Director 266 245 (21)Human Resources 496 467 (29)Strategic Finance 3,997 4,224 227Net Expenditure 11,782 11,916 135
1.8 The significant reasons for the variance are shown below.
Corporate Strategy & Client Services1.8.1 There is lower spend on projects of £40,000 at this stage, however it is
anticipated that this will be spent by the year end. Payments of grants are under by £20,000. Income in advance from Hertfordshire Police and Crime Commissioner’s office equals £25,000.
Community & Customer Services1.8.2 Additional cost of £257,000 for temporary accommodation.
Grant monies of £30,000 received from Herts County Council in advance of spending on public health. There is also income received in advance for licensing totalling approx. £30,000 which relates to 2017/18. There is an underspend on staffing of £84,000 due to a long term sickness and vacancies and additional Income from pest control contract of £32,000.
Democracy & Governance1.8.3 Government grant of £102,000 received for EU referendum still awaiting
supplier’s invoices to spend against this income, the majority of this is expected to be cleared in October. Underspend on the Neighbourhood forums of £30,000. Underspend of £85,000 on property maintenance. This is expected to be spent by the end of the year.

9
Regeneration & Development1.8.4 Lower planning application fees of £140,000. Increase in building control fees
of £42,000. Increase rent of £65,000 primarily from new lettings at Watford Business Park and a receipt of back rent.Payments of grant monies to organisations (Skill makers, Chamber of Commerce) of £54,000 which are being funded from earmarked reserves. There is the use of £32,400 from the High Street Innovation Fund reserve to fund the monitoring of the town centres’ footfall and £48,000 for implementing new parking bays, which is funded from the CPZ reserve. Additional spend of £51,000 on agency and interim staff.
Strategic Finance1.8.5 Higher ICT costs have been incurred in the two thirds of the year. A variance
of £217,000 has occurred due to the timing of the dividend payable to the Council for the Health Campus project, which will now be paid in 2017/18. There is also a timing difference between the amount of housing benefit grant received from the government and payments made to claimants.
1.9 The graph below shows a trend analysis of the forecast outturn variance by period including approved carry forwards for the last two years and the current financial year.
Period 3
Period 4
Period 5
Period 6
Period 7
Period 8
Period 9
Period 10
Period 11
Outturn
-1,500
-1,000
-500
0
500
1,000
1,500
2014/15
2015/16
2016/17
Thou
sand
s
1.10 The chart below compares the actual outturn position by service area for 2014/15 and 2015/16 and the current forecast outturn.
CS&CS C&CS D&G R&D MD HR Finance
-4
-2
0
2
4
6
8
10
2014/15 outturn
2015/16 outturn
2016/17 forecast
Mill
ions
2.0 Capital Investment Programme

10
2.1 The Council has an approved capital investment programme that is designed to support the core services. The original investment programme for 2016/17 (as approved by Council in January 2016) was £13.280 million. The latest budget is £23.049 million which includes re-phasing of £9.125 million from the 2015/16 programme and portfolio approval for an increase of £0.495 million to complete the refurbishment of the Gaelic football club facility.
2.2 The forecast outturn is estimated to be £21.050 million which is £1.999 million lower than the latest budget. Variances previously reported total £2.009 million the main contributors to this variance are the rephasing of the Watford Business Park project to 2018/19 of £2.417 million, increase of £1.160 million on the Health Campus and a rephasing of £0.600 million to 2017/18 for the Colosseum roof.
2.3 The table below summarises the change to the Council’s approved capital programme for 2016/17.The impact of how these variances affect the capital programme over the medium term (to 2019/20) are included in the separate ‘financial planning’ report, which is included elsewhere on this agenda. Some of the variances reported are ‘one off’ in 2016/17 and do not reoccur in future years.
Approved Capital Programme 2016/17£000
Latest Budget 23,049
Variances previously reported (2,009)
Variances this period 10
Forecast Outturn 21,050
2.4 The Council’s medium term capital investment programme for 2016-2017 is shown at summary level in Appendix 2 and by each scheme at Appendix 3, together with an update on each scheme.
2.5 As at end of period 8 (30 November) services have spent £10.892 million against the latest budget of £23.049 million, which represents 47% of the annual budget. Of the total spend to date, £4.057 million relates to the Health Campus project and £2.869 million relates to the Cassiobury Park restoration project.
2.6 The graph below shows the Council’s latest budget, forecast outturn and the actual spend to date for the current financial year (2016/17). The expenditure to date has been extrapolated (dashed line) to show it meeting the forecast position.
Quarter 0 Quarter 1 Quarter 2 Quarter 3 Quarter 40
5
10
15
20
25
Latest Budget Forecast Outturn
Spend to Date
11
Funding the Approved Capital Programme
2.7 The approved capital programme is mainly supported by three income streams; capital receipts (derived from the sales of assets), grants and contributions, and the use of reserves. Services can also make a contribution to capital from surplus revenue funds if needed.
2.8 The largest source of funding is from the capital receipts reserve which has accumulated over the years by the disposal of the Council’s surplus assets including the receipt received from the sale of ex-council dwellings to Watford Community Housing Trust under the stock transfer agreement.
2.9 The table below shows the forecasted position of the capital receipts reserve as it supports the capital spending. The details of each funding stream are shown at Appendix 4.
Capital Receipts Reserve 2016/17£000
Balance at 1 April 2016 (13,444)
In Year Receipts (4,873)
Used to Finance Capital Spend 13,979
Balance at 31 March 2017 (4,338)
Property Investment Board (PIB)
2.10 Under its delegated authority the PIB approved the purchase of investment properties that total £10.061 million (including tax and costs). These have been funded from receipts achieved from the rationalisation of the investment portfolio and the Council’s own internal borrowing. This has produced a net increase in rental income of £136,000 over that lost from the disposals.
3.0 Council Income
3.1 In providing its services to the public, the Council receives income from the Government, its Council tax payers and customers who pay a fee or charge for using a particular Council service.
3.2 The total of all these sources of income for 2016/17 is £28.270 million. The two biggest sources of income are council tax, and commercial property rents fees. It should be noted that although the Council will receive £1.310 million in Revenue Support Grant for 2016/17 although this will reduce to zero by 2019/20.

12
3.3 The chart below shows the percentage of the total amount of income for each source of income.
Revenue Support Grant 5%
Business Rates Funding 9%
Council Tax 29%
New Homes Bonus 12%
Other Grants 2%
Commercial Rent 26%
Fees & Charges 17%
Sources of Income 2016/17
3.4 The table below shows the current figures for the significant sources of service income.
Department Income Stream
Latest Budget
2016/17
Forecast 2016/17
Actuals to date
Income Description
Rent £6,774,930 £7,138,640 £4,118,036
Rents form commercial property including Intu as well as rental income from multi storey car parks.
Car Parking £1,008,950 £1,186,450 £970,236
Income largely from Avenue, Town Hall & Longspring car parks as well as the Parking Shop
Regeneration & Development
Development Section
£1,038,850 £916,850 £601,358Income from planning applications, building control and land charges

13
Community & Customer Service
Environmental Health & Licensing
£338,620£581,539
£557,184
Income from all Licensing activities including Hackney Carriage (taxis), pest control and fixed penalty notices for environmental crime. Includes income relating to 17/18 which will be moved at year end.
Debtors (invoicing)
3.5 The Council charges its customers for various services by raising a debtor invoice. The customer is given 21 days to pay and unless there is a dispute, a reminder is issued. If the debt remains outstanding, then a variety of recovery methods are employed including: rearranging the payment terms; stopping the provision of the service or pursuing the debt through legal recovery processes.
3.6 As at the 30 November 2016 the total outstanding value of debt was £1.239 million of which £0.722 million (58%) is less than one month old and therefore it is anticipated that this will be recovered. Outstanding debt over a year old is £0.223 million and equates to eighteen per cent of the total. The table below shows a summary of the outstanding debt by the three main aged categories and further detail can be found at Appendix 5.
Aged Debtors At the end of November
Under 1 Month
Over 1 month to
Year
Over a Year Total
Service £ £ £ £Community & Customer Service 183,588 93,688 31,633 308,909
Democracy & Governance 660 1,000 3,176 4,836Regeneration & Development 255,857 181,532 188,240 625,629Managing Director 11,281 1,598 0 12,879Human Resources 10,237 4,603 0 14,840Finance 260,642 9,868 0 270,510Recovery Charges 240 975 480 1,695Total 722,505 293,264 223,529 1,239,298

14
Council Tax and Business Rates Collection
Council Tax Collection
3.8 The Council’s performance in the collection of Council Tax can be seen in the following chart. It shows the collection % to date along with the target for the year. The actual income collected as at 30 November 2016 is 73.25 % of the annual target which is above the profiled target of 72.85%. Further information can be found at Appendix 6.
April May
June
July
August
September
October
November
December
January
February
March
5%
25%
45%
65%
85%
105%Target Actual
Business Rates Collection
3.9 The Council’s performance for business rates collection is shown in the following chart. The actual income collected as at 30 November 2016 is 76.52% of the annual target which is just above the profiled target of 75.80%. Further information can also be found at Appendix 6.
AprilMay
JuneJuly
August
September
October
November
December
January
February
March
0%
20%
40%
60%
80%
100%
120%Target Actual

15
4.0 Treasury Management
4.1 The interest earned on the investments made by the Council supports the funding of the services it provides. The target rate of earning interest rate was previously 0.62%, however since the reduction in the bank base rate in August to 0.25% the target has been revised to 0.37%. Up to the end of Period 8 (30 November), the average annualised interest rate earned on investments was 0.72%.
4.2 The Council set a budget of £220,000 on investment interest for 2016/.17. The amount earned up to Period 8 was £218,000, which now gives a forecast position of £250,000. The increase is due to the Council having higher cash balances than estimated at this stage of the year; however this is unlikely to continue as large sums will be released to support the Councils major capital projects. Furthermore with the bank base rate falling it will mean that any sums invested now will be at the lower rates; it is therefore an increase in the forecast position of £30,000 is considered prudent at this stage.
5.0 Key Risk Areas
5.1 Resources are allocated in the revenue and capital budgets to support the achievement of the Council’s corporate plan. The Council’s budget is exposed to risks that can potentially impact on service level provision. The key financial risks are shown at Appendix 7 together with a risk matrix that shows the likelihood and impact of each risk if they were to materialise.
5.2 Particular service areas of risk are monitored monthly; these are predominantly income generating where demand for a particular service can fluctuate depending on the economic climate, popularity and affordability i.e. planning fees.
5.3 The main 3 risks that are considered the most critical and their financial position are shown in the table below. The latest position of all the key risks is shown in Appendix 8.
Latest Budget
Forecast Outturn
VarianceRisk Area
£000 £000 £000Comment
Temporary Accommodation
410 860 450 Increased demand has resulted in an additional budget pressure
Development Control Fees
(708) (534) 174 Reduction in planning fees due to uncertainty in the housing market
Commercial Rent
(6,775) (7,139) (364) Increase from acquisition of investment property and new lettings at WBP

16
Report prepared by: Nigel Pollard – Section Head (Accountancy)Pritesh Shah – Finance Manager
Background Papers2015/16 Outturn reportBudget returns from Heads of ServiceQuarter 2 Finance DigestQuarter 1 Finance DigestPeriod 4 & 5 budget monitoring reports
APPENDICES
Appendix 1 Revenue Summary – By Service and explanations Appendix 1A Variances Reported – Period 8 (November) 2016 Appendix 2 Capital Programme (2016/17) SummaryAppendix 3 Capital Programme (2016/17) Detail Appendix 4 Capital Funding Appendix 5 Aged Debtor AnalysisAppendix 6 Collection Rates for Council Tax & Business RatesAppendix 7 Key Financial & Budgetary RisksAppendix 8 Key Service Budget Risks Appendix 9 Reserves

17
18
APPENDIX 1REVENUE SERVICES – FINANCIAL POSITION AT PERIOD 8
Service AreaLatest
ApprovedForecast Outturn
Variance Latest budget profiled
Actual Variance
£ £ £ £ £ £
Corp Strategy & Client ServiceManagement & Support 112,890 112,890 0 75,260 66,592 -8,668Contract Monitoring 263,020 346,530 83,510 190,127 233,430 43,303Parks And Open Spaces 1,362,220 1,266,740 -95,480 762,443 728,938 -33,505Leisure 544,310 534,310 -10,000 434,274 383,634 -50,640Grants 750,870 750,870 0 527,223 502,932 -24,291Street Cleansing 1,794,480 1,794,480 0 1,046,798 1,048,217 1,419Waste And Recycling 2,080,990 1,987,500 -93,490 1,218,454 1,265,764 47,310Partnerships & Performance 669,900 623,900 -46,000 383,600 316,713 -66,887
Totals - Corp Strategy & Client Service 7,578,680 7,417,220 -161,460 4,638,179 4,546,219 -91,960
Community & Customer Service Customer Services 900,120 842,120 -58,000 600,080 480,151 -119,929Housing 1,196,030 1,780,800 584,770 828,731 1,089,090 260,359Environmental Hlth & Licensing 1,325,460 1,318,783 -6,677 772,978 611,512 -161,466Culture & Play 1,078,010 1,078,010 0 736,049 813,638 77,589
Totals - Community & Customer Service 4,499,620 5,019,713 520,093 2,937,838 2,994,391 56,553
Democracy & Governance Legal And Democratic 1,880,410 1,867,060 -13,350 1,256,408 1,110,231 -146,177Buildings And Projects 1,511,070 1,511,070 0 1,064,737 949,747 -114,990Procurement 26,990 26,990 0 -2,007 12,672 14,679
Totals - Democracy & Governance 3,418,470 3,405,120 -13,350 2,319,138 2,072,650 -246,488
Budgets & Forecast at 30 November P8 Actuals compared to profiled budget at 30 November P8
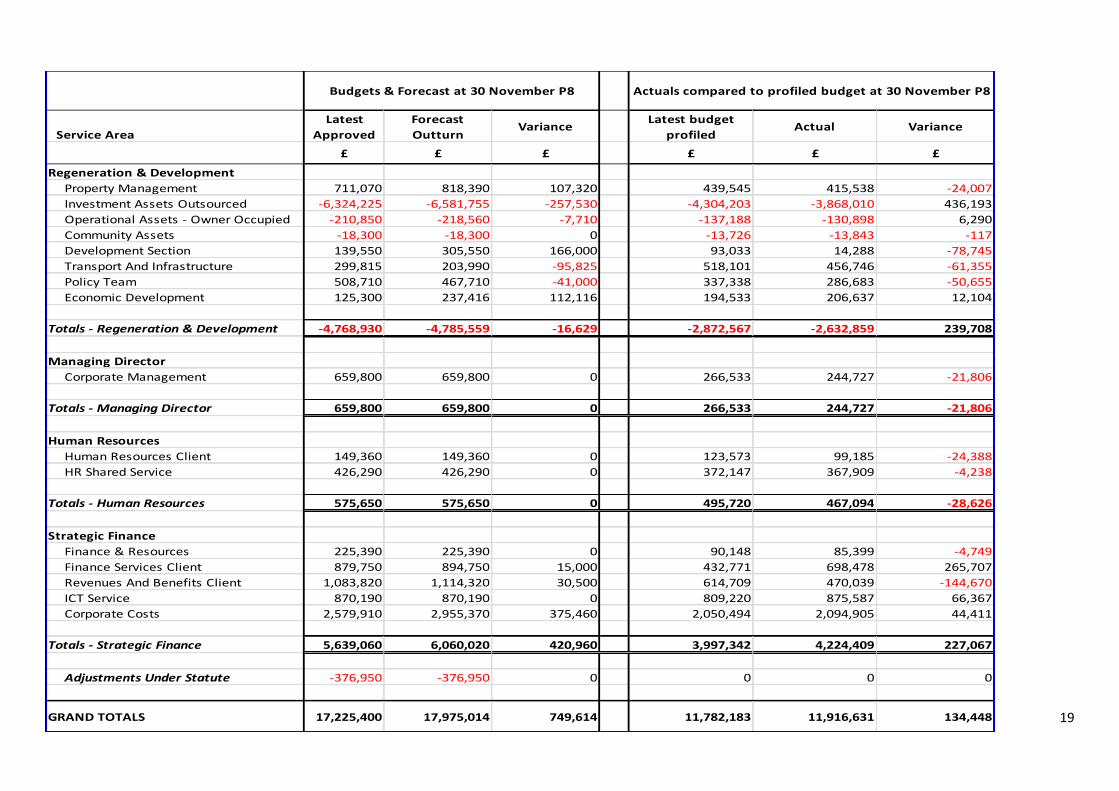
19
Service AreaLatest
ApprovedForecast Outturn
Variance Latest budget profiled
Actual Variance
£ £ £ £ £ £
Regeneration & Development Property Management 711,070 818,390 107,320 439,545 415,538 -24,007Investment Assets Outsourced -6,324,225 -6,581,755 -257,530 -4,304,203 -3,868,010 436,193Operational Assets - Owner Occupied -210,850 -218,560 -7,710 -137,188 -130,898 6,290Community Assets -18,300 -18,300 0 -13,726 -13,843 -117Development Section 139,550 305,550 166,000 93,033 14,288 -78,745Transport And Infrastructure 299,815 203,990 -95,825 518,101 456,746 -61,355Policy Team 508,710 467,710 -41,000 337,338 286,683 -50,655Economic Development 125,300 237,416 112,116 194,533 206,637 12,104
Totals - Regeneration & Development -4,768,930 -4,785,559 -16,629 -2,872,567 -2,632,859 239,708
Managing DirectorCorporate Management 659,800 659,800 0 266,533 244,727 -21,806
Totals - Managing Director 659,800 659,800 0 266,533 244,727 -21,806
Human Resources Human Resources Client 149,360 149,360 0 123,573 99,185 -24,388HR Shared Service 426,290 426,290 0 372,147 367,909 -4,238
Totals - Human Resources 575,650 575,650 0 495,720 467,094 -28,626
Strategic FinanceFinance & Resources 225,390 225,390 0 90,148 85,399 -4,749Finance Services Client 879,750 894,750 15,000 432,771 698,478 265,707Revenues And Benefits Client 1,083,820 1,114,320 30,500 614,709 470,039 -144,670ICT Service 870,190 870,190 0 809,220 875,587 66,367Corporate Costs 2,579,910 2,955,370 375,460 2,050,494 2,094,905 44,411
Totals - Strategic Finance 5,639,060 6,060,020 420,960 3,997,342 4,224,409 227,067
Adjustments Under Statute -376,950 -376,950 0 0 0 0
GRAND TOTALS 17,225,400 17,975,014 749,614 11,782,183 11,916,631 134,448
Budgets & Forecast at 30 November P8 Actuals compared to profiled budget at 30 November P8

20
Service Area Description Details of Outturn Variance to Latest Budget £
Parks & Open Spaces Vehicle leasing no longer required, vehicles have been procured (40,000)
Clinical Waste Savings made due to rationalisation of service (25,000)Recycling - Kerbside Savings made due to rationalisation of service (50,000)Highways Increased income from HCC - maintenance contract (55,480)Partnership & Performance
Funds allocated for staffing, no longer required (63,000)
Removal of Reserve Funding allocated to Veolia contract 97,790Other minor variances (25,310)
TOTAL (161,000)
Environmental Health Team
New post for 2016/17 as part of new contract for pest services with TRDC from April'16 and increase in agency costs to cover vacant posts in the current structure. See below for income from TRDC
55,000
Legal advice regarding accident at work 7,000Additional income from Primary Authority Partnership (4,000)
Pest Control Additional income from the pest control contract with TRDC (contract cost plus call outs) (76,800)Housing Standards Recovery of court costs from successful prosecutions (4,000)Taxi Licensing Legal advice costs 2,000Housing Supply Additional cost of temporary accommodation 450,000Homelessness Additional costs in obtaining private sector properties 100,000Printing Section Expected income from print work will not be achieved 35,000Temporary Accommodation
Further expenditure required to complete temporary accommodation project. This is funded from the PMB reserve 24,770
Employee Costs Salary Underspend due to staff sickness, vacancy & maternity (75,000)Other minor variances 6,123
TOTAL 520,093
Committee Services Employee costs - Savings based on revised salaries 2016/17 (13,000)Other minor variances (350)
TOTAL (13,350)
Corporate Strategy & Client Service
Explanation of Revenue Variance at Period 8 (November) 2016/17
Health & Safety at Work
Community & Customer Service
Democracy & Governance

21
Service Area Description Details of Outturn Variance to Latest Budget £Increased rental income mainly due to two new lettings at 28-30 Greenhill Crescent & 40 Caxton Way
(52,660)
Additional cost of outsourcing property management services 92,000Marriott House Rental income for 9 months following the purchase as approved by PIB (197,800)The Parade (Nos 38/46) Increase due to rent review (15,550)Timberlake Introduction of car park charges (8,500)Cardiff Road Accrued income for Cardiff Road 15/16 has been revised downwards 50,00029/31 High St. 1st Floor & 29 Charter Place rental income (43,110)Green Travel Plan Reduction from staff parking income as spaces allocated to NHS 11,000Parking Service Cabinet approved scheme (12/09/16) to implement new parking bays funded from CPZ reserve 48,000Land Charges Reduction in the number of searches mainly due to Brexit 20,000Business Improvement District
Funding agreed for BID, funded from High Street Innovation Reserve 57,715
Parkhouse Interchange Additional rental income for the year (102,000)Parking Service Income from suspension of parking bays for access works by Thames Water (178,000)Policy Team Underspend on Local Plan MP12 (55,000)Building Control Increase in application fees (72,000)
Cost of Traffic Engineer 2 days a week from Hertsmere 16,000Loss of project work income 10,000Contribution to the Chamber of Commerce and Skill Makers - funded from LABGI reserve 54,000Use of High Street Innovation reserve to fund the monitoring of the town centre footfall. 32,400Reduction in planning application fees 159,000Increase in CIL monitoring income (7,500)Increase in fees for unilateral undertaking drafting fees (4,000)Income target on planning application fees unlikely to be achieved 20,000Increase in cost of staff pool cars 8,000
Employee Costs Additional staff costs due to employing agency staff 54,000Valuation & Estates Expenditure funded as part of agreed PMB project 80,000
Other minor variances 7,375TOTAL (16,630)
Dividend Received Dividend for Health Campus will now be received in 2017/18 217,000
Employee Costs Vacancy provision reversed as part of the revised salary exercise at period 8 95,180
Watford 2020 - Projects funded as part of PMB 94,000
Other Minnor Variances 14,320TOTAL 420,500
GRAND TOTAL 749,613
Strategic Finance
Implementation Team
Watford Business Park
Economic Development
Regeneration and Development
Development Control
Explanation of Revenue Variance at Period 8 (November) 2016/17

22
APPENDIX 1A
Service Area Description Details of Changes Reported £Partnership & Performance Staff allocation not required (63,000)Recycling - Kerbside Savings identified in year as part of budget realignment (50,000)Leavesden Green Community centreReduction of management fee to WCHT (10,000)Communications Interim staff costs 15,000Highways Increased income from HCC (55,480)
Removal of Reserve funding allocated to Veolia contract 97,790Other Variances 2,000
TOTAL (63,690)Customer Service Centre Salary underspend due to vacancy, staff sickness & Maternity (75,000)Homelessness Homelessness project - additional cost in obtaining private sector properties 100,000Homelessness Hart Homes - Part of PMB fundied project 10,000
TOTAL 35,000Committee Services Savings based on revised salary expenditure 2016/17 (13,000)
Other Variances (350)
TOTAL (13,350)Business Improvement District Funding agreed from High St Innovation fund 57,715Development Control Reduced income from pre-application fees 9,000Parkhouse Interchange New rental Income Dec - Mar 2016/17 -102,000.00Parking Service Parking bay suspension one off Income - Thames Water -178,000.00Policy Team Underspend on Local Plan MP12 -55,000.00Employee Costs Overspend on salaries based on revised salary expenditure 2016/17 67,000
Other Variances -3,500.00TOTAL (204,785)
Interest Income Additional interest due to lower expected fund of funds and additional receipts in year (30,000)Supplies & Services Additional cost of postage / stationery costs as part of Shared Service charges 30,500Employee Costs Vacancy provision reversed as part of the revised salary exercise at period 8 95,180
Watford 2020 - Part of PMB funded project 94,000TOTAL 189,680
GRAND TOTAL (57,145)
Strategic Finance
Explanation of Revenue Variance Reported for Period 8 (November) 2016/17
Regeneration and Development
Community & Customer Service
Corporate Strategy & Client Service
Democracy & Governance

23
APPENDIX 2
CAPITAL INVESTMENT PROGRAMME - SUMMARY
Capital SchemeLatest
Approved 2016/17
Forecast Outturn
Variance Actual
£ £ £ £
Key Projects 4,665,160 5,774,160 1,109,000 4,299,012
Environmental Services 408,950 362,850 (46,100) 260,581
Community & Leisure Services 9,862,759 9,743,664 (119,095) 4,511,220
Housing Services 816,370 888,370 72,000 349,870
Parking Services 19,507 19,507 0 0
Asset Management 5,300,548 2,205,398 (3,095,150) 310,325
ICT 404,496 404,496 0 76,911
ICT Shared Services 924,000 924,000 0 952,609
Section 106 Funded Schemes 94,389 174,841 80,452 131,635
Corp Serv / Project Mgt 552,470 552,470 0 0
TOTAL CAPITAL PROGRAMME 23,048,649 21,049,756 (1,998,893) 10,892,163

24
APPENDIX 3CAPITAL INVESTMENT PROGRAMME – DETAIL
Capital SchemeLatest
Approved 2016/17
Forecast Outturn
Forecast Variance
Actual
£ £ £ £Key Projects
New Market 122,573 122,573 0 105,552CSI Project 247,500 182,500 (65,000) 15,200 Rephasing review due to project update
Campus-Client Side & Land Assy 449,847 484,847 35,000 107,693Forecast reviewed due to expected amendments to legal agreements
Campus-Equity 3,600,000 4,724,000 1,124,000 3,950,000 Additional costs for completion of infrastructure and master planning work. Road now operational
Green Spaces Strategy 74,000 89,000 15,000 101,177 Rephasing from 2017/18 based on project needs E.G. Garston Park
Website Enhancement 3,400 3,400 0 732Cultural Quarter Phase 1 167,840 167,840 0 18,659
Environmental ServicesReplacement Domestic Bins 42,185 0 (42,185) 0 Rephasing request due to future service changesElectric Vehicle Charging Units 27,265 11,884 (15,381) 6,083 Rephasing into 2017/18 requested by serviceTransit Vans x 2 48,000 33,706 (14,294) 33,706 Capital cost implication lower than expected Pest Control Van 13,560 13,560 0 13,578
Wood Chipper / Shredder 0 15,500 15,500 15,300 Replacing old with new. Funded by vehicle replacement reserve
Cricket Pitch Roller 0 11,100 11,100 10,700 Replacement required due condition issues. Funded by vehicle replacement reserve
Caged Vehicle / Bulky Lorry 0 15,000 15,000 15,000 Lease vehicle purchase providing better value than buying new. Funded by vehicle replacement reserve
Pedestrian Aerator 0 7,650 7,650 8,983 Replacement required due condition issues. Funded by vehicle replacement reserve
Mounted Aerator 0 24,450 24,450 24,450 Replacement required due condition issues. Funded by vehicle replacement reserve
Electric Van 0 25,000 25,000 0 Acquisition funded by vehicle replacement reserveRecycling Boxes 36,940 0 (36,940) 0 Rephasing request due to future service changesAdditional Green Waste Bins 36,000 0 (36,000) 0 Rephasing request due to future service changesDecent Homes Assistance 205,000 205,000 0 132,781
Scheme Update

25
Capital SchemeLatest
Approved 2016/17
Forecast Outturn
Forecast Variance
Actual
£ £ £ £Community & Leisure Services
Town Hall Subway CCTV 17,300 12,300 (5,000) 7,867 Capital cost implication lower than expected Clarendon Road Street Improvements-Relocation of CCTV
18,000 0 (18,000) 0Rephasing request due to Herts County Council scheme being delayed
Watford Museum HLF Matchfunding
125,000 25,000 (100,000) 0 Rephasing request due to review of project completion date
Meriden Community Centre Redevelopments
444,000 444,000 0 444,033
Play Review 1,400,000 1,400,000 0 200,118Allotments & Parks Upgrades 416,990 416,990 0 317,083Farm Terrace Allotments 552,874 552,874 0 54,475Town Centre CCTV Camera Replacement
22,711 26,616 3,905 24,766 Camera failure not in original capital programme
Gaelic Football Relocation 865,886 865,886 0 494,230Improvements Community Centres
159,160 159,160 0 100,000
Cassiobury Park HLF Project 5,640,838 5,640,838 0 2,868,649 Project to complete this financial year
Cassiobury Dev't (Fullerians) 200,000 200,000 0 0Housing Services
Garages Project (incl Parking) 0 72,000 72,000 0Parking works to be carried out at Water Lane, Prince Street and Sutton Road. Part funded by Watford FC
Retained Housing Stock 163,800 163,800 0 13,079Mand Disabled Facilities Grant 652,570 652,570 0 336,791 Demand led and subject to application criteria
Scheme Update

26
Capital SchemeLatest
Approved 2016/17
Forecast Outturn
Forecast Variance
Actual
£ £ £ £Parking Services
Upgrading/Resurfacing Car Parks
19,507 19,507 0 0
Asset Management
Watford Business Park Redevelopment
3,964,216 1,547,400 (2,416,816) 170,162
Although on schedule and out to tender for construction, the development at Caxton Way will not commence until March. Expected purchases of leasehold interests in Zone A have been delayed.
Private Sector Stock Condition Survey
150,000 150,000 0 0
Atrium / GIS 16,988 16,988 0 16,847
Pop Up Toilets Refurbishment 35,000 5,000 (30,000) 0 Rephasing request due to implications of future service delivery expected in 2017/18
Non PIB - Strategy & Prog Disposal
16,796 16,796 0 0
Match Funding Capital Projects 67,378 19,044 (48,334) 7,118 Rephasing request due to bulk of work expected to be undertaken in 2017/18
Veolia Capital Improvements 93,170 93,170 0 53,343
Building Investment Programme 957,000 357,000 (600,000) 62,855 Major project to Colosseum likely to oocur in 2017/18 as well as delays with the Museum HLF bid
ICTICT-Hardware Replacement Programme
160,000 160,000 0 847
ICT - Document Management Process
4,036 4,036 0 0
ICT-Env Health 13,460 13,460 0 7,936ICT-Project Management Provision
227,000 227,000 0 68,128
Scheme Update

27
Capital SchemeLatest
Approved 2016/17
Forecast Outturn
Forecast Variance
Actual
£ £ £ £ICT Shared Services 0
ShS-Business Application Upgrade
243,000 243,000 0 0
ShS-IT Modernisation 603,000 603,000 0 948,960ShS-Hardware Replace Programme
78,000 78,000 0 3,649
Section 106 Funded Schemes
Himalayan Way Play Area 7,100 67,100 60,000 72,740 S106 funding rephased from 2018/19 due to worsening conditions of play area
Berry Avenue Play Area 6,025 6,025 0 8,957
Ridgehurst Avenue Play Area 4,266 29,266 25,000 18,767 S106 funding rephased from 2018/19 due to worsening conditions of play area
Colne River Project 11,450 11,450 0 7,284Local Nature Reserves 6,350 6,350 0 260Lower High St Cycle Scheme 15,393 15,393 0 0Abbey Way Cycle Scheme 28,175 23,627 (4,548) 23,627 Project underspendGarston Park Cycle Scheme 15,630 15,630 0 0
Corporate Services / Project Management
Support Services 552,470 552,470 0 0 Allocated at year end as part of the internal recharge process
TOTAL CAPITAL PROGRAMME 23,048,649 21,049,756 (1,998,893) 10,892,163
Scheme Update

28
APPENDIX 4
CAPITAL INVESTMENT PROGRAMME – FUNDING
FUNDING THE APPROVED CAPITAL PROGRAMME
FUNDING TYPEForecast Outturn
£Grants & Contributions 4,981,250
Reserves 408,306
Capital Receipts 13,978,053
Section 106 & CIL Contributions 1,522,011
Local Enterprise Partnership Loan 160,136
TOTAL CAPITAL FUNDING APPLIED 21,049,756
CAPITAL BALANCES AFTER FUNDING THE APPROVED CAPITAL PROGRAMME
FUNDING TYPEForecast Outturn
£
Grants & Contributions 51,362
Reserves 5,707,900
Capital Receipts 4,338,328
Section 106 & CIL Contributions 986,792
Local Enterprise Partnership Loan 0
TOTAL CAPITAL FUNDING AVAILABLE 11,084,383

29

30
APPENDIX 5AGED DEBT ANALYSIS
0 - 1 2 - 3 4 - 6 7 - 9 10 - 12 Over 12Grand Total
Community Standard 155,622 10,131 26,570 30,934 10,807 28,038 262,102Community and Customer Service 150 150Env Services-Premises Licence 26,863 940 5,570 790 970 3,445 38,578Community Services - Pitch Hire 150 150Environmental Health 953 6,677 100 200 7,929
Democracy and Governance Democracy and Governance 660 1,000 3,176 4,836Property - Standard 98,913 240 99,153Property - Commmercial Rents 40,820 76,607 16,680 17,758 178,862 330,727Property - Service Charges 28,620 28,620 9,378 66,618Property - Garages 572 3 575Property - Parking Spaces 129 233 362Planning - Standard 108,072 8,029 4,743 120,843Planning - Inspection Fees 7,352 7,352
Managing Director Corporate Service 11,281 330 1,268 12,879Human Resources 10,237 4,603 14,840
Finance 260,642 9,868 270,511Other Recovery Charges 240 600 175 175 25 480 1,695
Grand Total 722,505 41,181 111,763 82,142 58,179 223,529 1,239,298
58.30% 3.32% 9.02% 6.63% 4.69% 18.04% 100.00%
Regeneration & Development
Percentage of Amount Outstanding
Invoices Outstanding from 1st December 2015 to 30th November 2016
Service Area Description
Invoices outstanding by age of debt
Community & Customer Service

31
APPENDIX 6
COLLECTION RATES FOR COUNCIL TAX AND BUSINESS RATES
Council Tax Collection - Percentage of current year council tax collected by period
Annual Apr May Jun July Aug Sept Oct Nov Dec Jan Feb Mar
Target 96.0 11.3 20.2 29.0 35.3 47.0 54.9 63.8 72.8 81.9 90.2 93.7 96.0
2016/17 Actual 11.5 20.5 29.3 36.7 45.8 54.9 64.1 73.3
On Target
Business Rates - Percentage of current year business rates collected by period
Annual Apr May Jun July Aug Sept Oct Nov Dec Jan Feb Mar
Target 97.7 11.7 21.0 31.9 36.3 49.1 57.9 66.5 75.8 85.1 90.9 94.9 97.7
2016/17 Actual 12.5 23.3 31.3 40.2 49.0 58.0 64.6 76.5
On Target
‘On target' has a RAG rating whereby the underachievement of the target is based on the following thresholds.
RAG % below target
Red More than 5%
Amber 2% to 5%
Green Less than 2%

32
KEY FINANCIAL & BUDGETARY RISKS
APPENDIX 7KEY FINANCIAL RISKS
No. Type of Risk Comment Likelihood ImpactOverall Score
1 Revenue balances insufficient to meet estimate pay award increases
The medium term planning period takes into account the pay increases for the period 2016/17 - 2018/19 2 2 4
2 Revenue balances insufficient to meet estimate of Employers' pension contributions
Employee revenue contributions have been included in the budgets. 2 2 4
3 Revenue balances insufficient to meet other inflationary increases Other than contractual agreements, budgets have been cash limited where possible. 2 2 4
4Interest rates resulting in significant variations in estimated interest income
The interest rate has a significant impact on the proceeds from capital receipts that are invested in the money market. The volatility of the global economy following the EU referendum continues to place uncertainty on the investment strategy.
3 3 9
5 Inaccurate estimates of fees and charges income See Key Income Streams are shown in the latest Finance Digest 2 3 6
6Revenue balances insufficient to meet loss of partial exemption for VAT
If the council's expenditure on functions for which it receives income that is exempt for VAT purposes exceeds 5% of its total vat able expenditure, then the Council may lose its ability to recover VAT on all of its exempt inputs.
2 3 6
7 Major emergency Major Emergency requires funds beyond Bellwin scheme and causes serious drain on balances 1 1 1
8 The estimated cost reductions and additional income gains are not achieved
Savings identified in 2016/17 are monitored as part of the monthly budget monitoring process. 2 3 6
9 The income received from Commercial rents decreases The rental income received from the Councils property portfolio is a significant proportion of the total income the Council receives.
2 4 8
10 The Council is faced with potential litigation and other employment related risks
The Council has one outstanding litigation case. 2 3 6
11 The amount of government grant is adversely affected The provisional grant settlement for 2017/18 & 2018/19 have been factored into the MTFS . The council decided to accept the government offer of a 4 year settlement. This risk has now bben downgraded.
2 3 6
12 The amount of New Homes Bonus grant is adversely affectedThe grant for 2016/17 has been factored into the MTFS . The Government are carrying out a review on the allocation process in 2016/17. Until the review is concluded, it has been assumed that the Council will receive £2M pa in future years.
3 4 12
13 Fluctuations in Business Rates Retention The Council is legally obliged to cover the first 7.5% loss on its pre determined baseline level. The Council is currently in a safety net position
2 2 4
14 Right to Buy Receipts & VAT Shelter ReceiptsUnder the Housing stock transfer with Watford Community Housing Trust (WCHT) the Council is entitled to use its share of the proceeds to fund the capital programme. The level of activity on both these income streams are outside the Council's control.
2 3 6
1= VERY LOW RISK 4 = VERY HIGH RISK

33
APPENDIX 8Key Service Budget Risks
£000's £000's £000's £000's
Parks, Street & Waste Services 5,875 5,875 0 3,335 Expenditure is expected to be on target.
Kerbside Recycling Expenditure and Income
(211) (175) 36 0 The Herts CC (Alternative Financial Model) income for Kerbside Recycling across the County is not received until the end of the year.
Temporary Accommodation (net) 410 860 450 438 There is a budget pressure in Temporary accommodation due to increased demand
Development Control Fee Income (708) (534) 174 (319) Forecasted income from planning application fees has been reduced by £150,000
Building Control Fee Income (197) (269) (72) (211) Increase in Building Control application fees.
Land Charges Fee Income (120) (100) 20 (66) Income is expected to be lower than budgeted.
Commercial rent income (6,836) (7,200) (364) (4,164)Due to the outsourcing of the property management contract there is a timing difference in the receipt of rental income. Income relating to November will be received in December .
The Council is exposed to risks in certain key areas. These risks include economic conditions, demographics and dependency on demand. The table below shows those risks that are closely monitored each month and the variances between the latest budget and the forecast outturn at Period 8 - November 2016
Service AreaLatest
BudgetActuals to
DateForecast Outturn
CommentsForecast Variance Period 8

34
APPENDIX 9RESERVE BALANCES
Balance at 1 April 2016 Agreed Use
Movement Previously Reported
Movement this period
Total Movement Balance
£000 £000 £000 £000 £000 £000
CAPITAL RESERVES
Capital Fund (810) 160 0 0 160 (650)
Development Sites Decontamination (446) 0 0 0 0 (446)
New Homes Bonus (4,069) 0 0 0 0 (4,069)
Performance Reward Grant (191) 50 0 50 (141)
Project and Programme Management (291) 291 (75) 10 226 (65)
Vehicle Replacement (310) 48 74 11 133 (177)
Weekly Collection Support Grant (158) 0 0 0 0 (158)
Total Capital Reserves (6,275) 549 (1) 21 569 (5,706)
REVENUE RESERVES
Earmarked
Budget Carry Forward (1,190) 1,009 0 180 1,190 0
Business Rates (4,661) 0 0 0 0 (4,661)
Car Parking Zones (775) 0 48 (178) (130) (905)
Charter Place Tenants (160) 0 0 0 0 (160)
Climate Change (57) 0 0 0 0 (57)
Homelessness Prevention (113) 0 0 0 0 (113)
Leisure Structured Maintenance (423) 0 0 0 0 (423)
Le Marie Centre Repairs (12) 0 0 0 0 (12)
Multi-Storey Car Park Repair (181) 0 0 0 0 (181)
Parks, Waste & Street Strategy (60) 0 0 0 0 (60)
Rent Deposit Guarantee Scheme (100) 0 0 0 0 (100)
Area Based Grant (85) 0 0 0 0 (85)
Crematorium (50) 0 0 0 0 (50)
Economic Impact (4,029) (20) 568 (196) 352 (3,677)
High Street Innovation (90) 0 32 58 90 0
Housing Benefit Subsidy (996) 0 0 0 0 (996)
Housing Planning Delivery Grant (266) 0 0 0 0 (266)
Invest to Save (839) 0 0 0 0 (839)
LA Business Growth Incentive (LABGI) (570) 12 54 0 66 (504)
Local Development Framework (178) 50 0 (55) (5) (183)
Pension Funding (2,249) 700 0 0 700 (1,549)
Performance Reward Grant (29) 0 0 0 0 (29)
Project and Programme Management (404) 182 103 41 326 (78)
Weekly Collection Support Grant (30) 0 0 0 0 (30)
Total Earmarked Reserves (17,547) 1,933 805 (150) 2,589 (14,958)
General Fund Working Balance (1,350) 0 0 0 0 (1,350)
Total Revenue Reserves (18,897) 1,933 805 (150) 2,589 (16,308)
Total (25,172) 2,482 804 (129) 3,158 (22,014)
Description