20160622 Reacfin White Paper - Introduction to Machine ...€¦ · 3 | Page A Reacfin White Paper...
24
TVA: BE 0862.986.729 BNP Paribas 001-4174957-56 RPM Nivelles Tel: +32 (0)10 84 07 50 [email protected] www.reacfin.com Reacfin s.a./n.v. Place de l’Université 25 B-1348 Louvain-la-Neuve ABSTRACT Machine Learning (“ML”) techniques, a sub-field of Artificial Intelligence, become increasingly popular within the financial industry to tackle issues involving large amounts of data. In this paper we aim at providing the reader with a basic introduction to key ML concepts and techniques, explain how such approaches differ from the more traditional statistical analysis approach and illustrate this theoretical presentation with some simple yet very practical application within the financial industry. We also illustrate our point with a case-study: a practical application of decision trees to build predictive LGD models in loan books management. We wrap-up this paper with a high-level comparison between traditional statistical inference methods and ML techniques A Reacfin White Paper on Artificial Intelligence applications to Finance: Introduction to Machine Learning techniques used in the financial industry and a practical case study By Arnaud Deltour and François Ducuroir © Reacfin s.a. –June 2016
Transcript of 20160622 Reacfin White Paper - Introduction to Machine ...€¦ · 3 | Page A Reacfin White Paper...

TVA: BE 0862.986.729
BNP Paribas 001-4174957-56
RPM Nivelles
Tel: +32 (0)10 84 07 50
www.reacfin.com
Reacfin s.a./n.v.
Place de l’Université 25
B-1348 Louvain-la-Neuve
ABSTRACT
Machine Learning (“ML”) techniques, a sub-field of Artificial Intelligence, become
increasingly popular within the financial industry to tackle issues involving large
amounts of data.
In this paper we aim at providing the reader with a basic introduction to key ML
concepts and techniques, explain how such approaches differ from the more
traditional statistical analysis approach and illustrate this theoretical presentation
with some simple yet very practical application within the financial industry.
We also illustrate our point with a case-study: a practical application of decision
trees to build predictive LGD models in loan books management.
We wrap-up this paper with a high-level comparison between traditional
statistical inference methods and ML techniques
A Reacfin White Paper on Artificial Intelligence applications to Finance:
Introduction to Machine Learning techniques used in the financial industry and a practical case study By Arnaud Deltour and François Ducuroir © Reacfin s.a. –June 2016

2 | P a g e
A Reacfin White Paper on Artificial Intelligence applications to Finance
Introduction to machine learning techniques used in the financial industry and a practical case study By Arnaud Deltour and François Ducuroir
© Reacfin s.a. – June 2016
This page is left blank intentionally

3 | P a g e
A Reacfin White Paper on Artificial Intelligence applications to Finance
Introduction to machine learning techniques used in the financial industry and a practical case study By Arnaud Deltour and François Ducuroir
© Reacfin s.a. – June 2016
Table of ContentsTable of ContentsTable of ContentsTable of Contents
ABSTRACT ............................................................................................................. 1
INTRODUCTION .................................................................................................... 4
DIFFERENCES BETWEEN “MACHINE LEARNING” AND “STATISTICAL”
TECHNIQUES ........................................................................................................ 5
Basic concept illustration ...................................................................................... 5
OVERVIEW OF SOME SIMPLE MACHINE LEARNING TECHNIQUES ..... 6
a) Decision trees ............................................................................................... 7
b) Ensemble methods and Random forests ...................................................... 9
c) Support Vector Machines (SVM): ............................................................... 10
PRACTICAL CASE STUDY: LOSS GIVEN DEFAULT MODELING ........... 12
a) Context ........................................................................................................ 12
b) Method and example .................................................................................. 13
CONCLUSIONS - COMPARING ML AND STATISTICAL MODELING ...... 16
REACFIN’S SUPPORT ....................................................................................... 17
CONTACT DETAILS ........................................................................................... 22

4 | P a g e
A Reacfin White Paper on Artificial Intelligence applications to Finance
Introduction to machine learning techniques used in the financial industry and a practical case study By Arnaud Deltour and François Ducuroir
© Reacfin s.a. – June 2016
INTRODUCTION
Machine Learning (“ML”) techniques become
increasingly popular within the financial industry to
tackle issues involving large amounts of data.
Machine Learning is a sub-field of Artificial
Intelligence which derives from pattern recognition.
Essentially, ML techniques are a set of mathematical
methods which were developed to enable computers
to autonomously:
o make predictions based on sets of various
types of observations (some of which
could prove irrelevant),
o progressively improve such predictions as
they are faced with stable (stationary)
conditions,
o adapt their results when faced with
changing (transitory) conditions.
Such ML techniques share many similarities with
classical statistical modeling techniques starting from
the fact that they both deal with data. However, the
key difference, between statistical techniques and
ML techniques lies in the goal of these approaches.
While statisticians start assuming a given model can
best explain the behavior of the phenomenon
considered and try to validate such assumption, ML
techniques rather aim at finding by themselves the
method that best predicts the outcome of the
studied phenomenon.
In this paper we aim at providing the reader with a
high level introduction to key ML concepts and
techniques, explain how such approaches differ from
the more traditional statistical analysis approach and
illustrate this theoretical presentation with some
simple yet very practical application within the
financial industry.
Authors
Arnaud Deltour
Consultant
MSc in Applied Mathematics
Engineering (Magna Cum Laude)
and a MSc in Actuarial Sciences
(Magna Cum Laude) from the
Université of Louvain.
Member of Reacfin’s Life, Health
and Pensions Centre of
Excellence.
François Ducuroir
Managing Partner
Master’s degrees in Applied
Mathematics and Applied
Economics.
Over 20 years’ experience in
Financial Markets.
Teaching “Management of Banks
and Financial institutions at the
University of Louvain.

5 | P a g e
A Reacfin White Paper on Artificial Intelligence applications to Finance
Introduction to machine learning techniques used in the financial industry and a practical case study By Arnaud Deltour and François Ducuroir
© Reacfin s.a. – June 2016
DIFFERENCES BETWEEN “MACHINE LEARNING” AND
“STATISTICAL” TECHNIQUES
When applying inference techniques, statisticians will typically1 start by assuming
the explanatory model is known and key explaining variables are known. The
objective of the statistical technique becomes then to confirm the model
assumption and calibrate as accurately as possible the model parameters so that
errors can be minimized.
Machine Learning (“ML”) techniques on the contrary start from lesser
assumption. The objective is that it is the ML algorithm itself that identifies the
key explanatory variables and their impact on the response variable.
Basic concept illustration
Assume we observe a (possibly large) set of variables x (the vector of inputs) and
an output “response” variable y.
Statistical inference techniques aim at calibrating the pre-assumed function �����
so that all that remains is an as limited as possible stochastic error (e.g. normally
distributed).
The general form of statistical model can be written as:
�� � ����� � � where the residuals (� ) are “white noises”, that is to say, where � are iid
2 �0, ��.
Figure 1: How statistical modelling works
1 Although using some techniques which are bridges between Statistical inference and Machine Learning,
identification of key variables may also be performed using statistical methods. For instance one could think of
backward or forward regression approach which are also recursive algorithms.. 2 “iid” =independent and identically distributed

6 | P a g e
A Reacfin White Paper on Artificial Intelligence applications to Finance
Introduction to machine learning techniques used in the financial industry and a practical case study By Arnaud Deltour and François Ducuroir
© Reacfin s.a. – June 2016
On the other side Machine Learning techniques rather consists of algorithms
which operate on x to predict the best possible response y. It does not pre-
assume a given model. Furthermore the algorithm (being typical a recursive
technique) can grow in size if data complexity justifies it.
Figure 2 schematizes the views of machine learning techniques. Two particular
methods that will be developed later on as case studies for this paper are cited for
illustration purposes only.
Figure 2: How machine learning works.
Two concepts must be well differentiated:
• Supervised Learning where a response variable y exist.
o In such case a set of simultaneous observations of y and x (the
“training sample”) are used to define and calibrate the model that
can best predict future realizations of y given the then prevailing
outcomes of x.
• Unsupervised Learning that deals with issues for which no response
variable y exist.
o In this case the objective is to understand the relationships
between the different variables or between the observations.
“Clustering” (i.e. grouping observations) is a typical aim of
Unsupervised Machine Learning techniques.
OVERVIEW OF SOME SIMPLE MACHINE LEARNING
TECHNIQUES
In this paper we focus on three simple supervised learning techniques:
• Decision trees
• Random Forests
• Support Vector Machines
We typically distinguish two main types of problem to solve:
• Classification: the response variable y is qualitative (categorical)
• Regression: the response variable y is quantitative.

7 | P a g e
A Reacfin White Paper on Artificial Intelligence applications to Finance
Introduction to machine learning techniques used in the financial industry and a practical case study By Arnaud Deltour and François Ducuroir
© Reacfin s.a. – June 2016
a) Decision trees
A decision tree-based method aims at segmenting the predictor space into
regions with a single predicted value.
In other words, the objective here is to find ranges of values in the explanatory
variables (x) which give typical value for the variable to be predicted (y).
This can be best illustrated with a graphical example in which one wants to predict
y given x:
Figure 3 - Example of segmentation approach – graph 1
Obviously, realizations of x and y’s come frequently “per groups” (segments):
o If the value of x lies between 1 and 2, y will typically lies between 3 and 4
o When x lies between 3.5 and 5.5, y will typically lie between 5 and 6
o When x ranges between 6 and 8, y will rather be small, between 1 and 2
o If x ranges between 9 and 11, y seems to range between 8 and 9
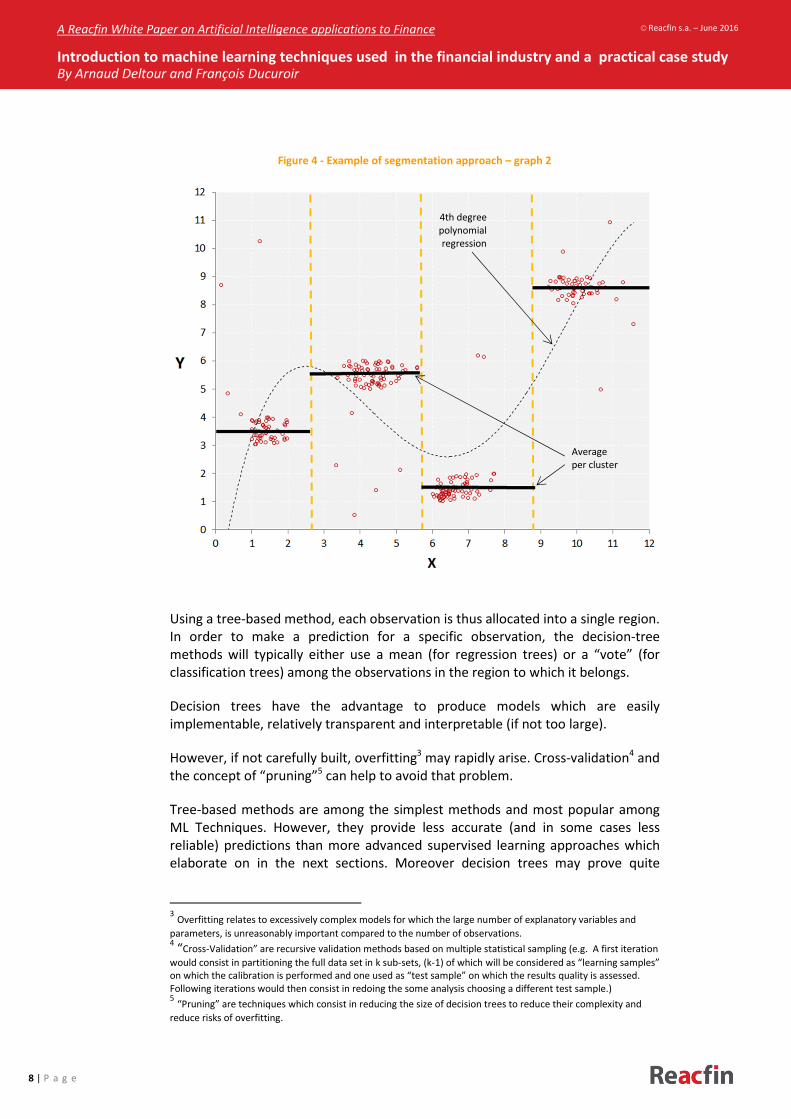
One could then consider that the prediction for each segment is its average value
of y.
Such simple segmentation-based average will obviously prove a much better
predictor than more classical regression technique (even if using complex non-
linear techniques, as graphically illustrated in figure 4).
8 | P a g e
A Reacfin White Paper on Artificial Intelligence applications to Finance
Introduction to machine learning techniques used in the financial industry and a practical case study By Arnaud Deltour and François Ducuroir
© Reacfin s.a. – June 2016
Figure 4 - Example of segmentation approach – graph 2
Using a tree-based method, each observation is thus allocated into a single region.
In order to make a prediction for a specific observation, the decision-tree
methods will typically either use a mean (for regression trees) or a “vote” (for
classification trees) among the observations in the region to which it belongs.
Decision trees have the advantage to produce models which are easily
implementable, relatively transparent and interpretable (if not too large).
However, if not carefully built, overfitting3 may rapidly arise. Cross-validation
4 and
the concept of “pruning”5 can help to avoid that problem.
Tree-based methods are among the simplest methods and most popular among
ML Techniques. However, they provide less accurate (and in some cases less
reliable) predictions than more advanced supervised learning approaches which
elaborate on in the next sections. Moreover decision trees may prove quite
3 Overfitting relates to excessively complex models for which the large number of explanatory variables and
parameters, is unreasonably important compared to the number of observations. 4 “Cross-Validation” are recursive validation methods based on multiple statistical sampling (e.g. A first iteration
would consist in partitioning the full data set in k sub-sets, (k-1) of which will be considered as “learning samples”
on which the calibration is performed and one used as “test sample” on which the results quality is assessed.
Following iterations would then consist in redoing the some analysis choosing a different test sample.) 5 “Pruning” are techniques which consist in reducing the size of decision trees to reduce their complexity and
reduce risks of overfitting.
4th degree
polynomial
regression
Average
per cluster

9 | P a g e
A Reacfin White Paper on Artificial Intelligence applications to Finance
Introduction to machine learning techniques used in the financial industry and a practical case study By Arnaud Deltour and François Ducuroir
© Reacfin s.a. – June 2016
inefficient when the objective is to give predictions beyond the range of
observable data.
Decision trees should nevertheless not be overlooked for applications in finance
as their results prove to be among the easier to interpret (which is key in finance
where expert-based validation and corrections may prove critical success factors).
Such methods will also enable robust validation using statistical inference
methods which may prove a must-have in a set of application within the financial
industry.
To summarize it, the key advantages and disadvantages of Decision Trees are:
Pros:
• Easily interpretable
• Non-linear decision boundary possible (see exhibit above)
Cons:
• Overfitting if not carefully built (pruning and cross-validation needed)
• Does not predict beyond the range observable in the data
• Although non-linear decision boundary can be modelled, it only
restricts to “rectangular” classification boxes.
Specifically, decision tree methods will prove particularly adequate in credit risk
assessment problems thanks to the type of results they provide. These consist in
a set of classification clusters based on a set of (possibly limited) ex-ante observed
variables. As such the results prove relatively comprehensive for credit analysts,
origination staff and their controllers or managers so that it can be implemented
in banking organization while limiting the related operational risks which could be
induced by more complex methods. For instance, they prove to be quite efficient
alternatives to logistic regressions for banking applications such as:
• the determination of basic internal rating models (i.e. ex-ante
categorizations of debtors for their expected probability of default)
• The ex-ante assessment of expected Loss-Given-Default (both through-
the-cycle or in down-turn conditions) for advanced LGD models.
In these applications, the fact that decision trees result in simple tables of
categories which often remain quite interpretable make them easy to deploy in
the context of credit origination process.
b) Ensemble methods and Random forests
Random forests belong to “ensemble methods” which combine the predictions of
several based estimators built with a specific learning algorithm in order to
improve predictive power and/or robustness with respect to a single estimator.
Bagging, boosting and random forests are the most common ensemble methods.
Random forests, as its name indicates, is based on the decision tree methods we
discussed above. Such algorithm randomly produces multiple trees which are then
combined to give a single prediction (the average through all trees for regression
or a vote for classification problems).

10 | P a g e
A Reacfin White Paper on Artificial Intelligence applications to Finance
Introduction to machine learning techniques used in the financial industry and a practical case study By Arnaud Deltour and François Ducuroir
© Reacfin s.a. – June 2016
Combining a large number of trees improves the prediction accuracy but often
make the interpretation of results more challenging.
While the relevance of each explanatory variable can be assessed6, statistical
inference validation is far less efficient for random forests than with single
decision tree methods.
To sum-it up, main advantages and disadvantages of Random Forest methods can
broadly be summarized as follows:
Pros:
• Higher predictive power than the single underlying estimator (i.e. than
single decision trees).
• Within the random forest algorithm an inner cross-validation process
exists, without any additional computing burden (“out-of-bag error”
computation)7
• High capacity to handle large datasets (with lots of input variables and/or
lots of observations)
Cons:
• Black-box method: lack of transparency of results. Expert judgement is
thus difficult to incorporate in practice.
• When based on regression trees, random forest may prove inefficient for
predictions beyond the range observable in the data.
In finance, while Random Forest may help beef-up credit assessment methods (for
instance in the context of debtors “Scoring” applications), we have rather
observed that their usual applications rather concentrates in fields such as
algorithmic trading or modeling of retail customers behaviors and preferences.
Among others we could observe pretty efficient results in the modeling of
Residential Mortgages prepayments or that of lapses in Life Insurance. They also
give good results in the insurance industry when used to build complex pricing
frameworks aimed at better predicting future claims risks of particular policies.
c) Support Vector Machines (SVM):
SVM methods are used for classification problems. The basic algorithms are
dedicated to binary classification8 (i.e. when the response variable has two
classes).
6 E.g. through “variable-importance plots”
7 For more details see for instance “The Elements of Statistical Learning: Data Mining, Inference, and Prediction”
by Trevor Hastie, Robert Tibshirani & Jerome Friedman, section “15.3 Details of Random Forests”, pp 592 & 593,
Second Edition, Springer, 2008. 8 However, method extensions exist which will enable to handle cases with more than two response classes.
These go beyond the scope of the very high-level introduction paper.
11 | P a g e
A Reacfin White Paper on Artificial Intelligence applications to Finance
Introduction to machine learning techniques used in the financial industry and a practical case study By Arnaud Deltour and François Ducuroir
© Reacfin s.a. – June 2016
The basic method9 is to find an optimal hyperplane to linearly separate the two
classes. Support vector machines extend that idea to pattern that are not linearly
separable with the help of the Kernel function (i.e. a similarity function which may
be non-linear and used to separate the classes).
A particularity of SVM comes from the fact that only the “difficult points” (close to
the hyperplane) influence the optimum (as opposed to other techniques such as
neural networks and linear regression where every point influence the solution).
Like for the random trees methods a main drawback of SVM is that results
interpretation may prove difficult.
Originally built to solve classification problems, some generalized versions exist to
solve regression problems (e.g. SVR: support vector regression).
The main advantages and disadvantages of SVM methods can be summarized as
follows:
Pros:
• Unique solution (global optimum)
• Flexibility: can deal with lots of data patterns through the Kernel functions
• Extensions exist for categorical response variable with more than two
classes
Cons:
• Black-box method: lack of transparency of results (only graphical
visualizations). Expert judgement is thus difficult to incorporate in
practice.
With regard to practical application in the finance industry, our experience shows
that the SVM prove particularly effective in:
• Predictive operational risks models
• Claims predictions in Health and P&C insurance (e.g. car insurance, fire
insurance)
• Predictive anti-money laundering models
• Like for decision trees and ensemble methods, they are also often used to
refine predictive credit performance models (e.g. scorecards). However,
their less intuitive interpretation may make them harder to implement in
the context for pre-established banking processes and organizations.
9 called “Support Vector Classifier”

12 | P a g e
A Reacfin White Paper on Artificial Intelligence applications to Finance
Introduction to machine learning techniques used in the financial industry and a practical case study By Arnaud Deltour and François Ducuroir
© Reacfin s.a. – June 2016
PRACTICAL CASE STUDY: LOSS GIVEN DEFAULT MODELING
In this section, we present a simple real-world application of decision tree and
random forest algorithm recently deployed by Reacfin to assess and predict Loss-
Given-Default parameters of credit models used by a European commercial bank.
a) Context
Under Basel III (i.e. CRR & CRD IV), banks may calculate their credit risk capital
requirements using an internal ratings based approach (IRB).
For corporate credit, the directives distinguish between two possible alternatives:
• Foundation IRB approach which broadly consist in estimating ratings
scales only based on probabilities of default and adequately allocating
each of the corporate loans to a specific rating class
• Advanced IRB where the ratings scale is established considering not only
the PD’s by also all other credit parameters including Loss-Given-Default
(LGD), Maturity adjustments, Exposure-at-Default Conversion factors,
etc.)
Figure 6 recalls the fundamental relation in Credit Risk.
Figure 6: fundamental relation of Credit Risk
Given this decomposition of the expected loss and knowing that using advanced
IRB approaches, reductions in LGD estimates by 10% or more10
are relatively
standard, one will easily understand the relevance for banks of using best
predictive techniques to assess such parameter.
For instance, per € 1Bn EAD, a 10% reduction in LGD induces (at same pricing
level) a positive P&L impact:
• For BB rated debtors (i.e. 1Y-PD~2-3%) of about + €2-3Mn/Year
• For B rated debtors (i.e. 1Y-PD~3-5%) of about + €3-5Mn/Year
10
Compared to assumptions taken under the Foundation IRB approach

13 | P a g e
A Reacfin White Paper on Artificial Intelligence applications to Finance
Introduction to machine learning techniques used in the financial industry and a practical case study By Arnaud Deltour and François Ducuroir
© Reacfin s.a. – June 2016
b) Method and example The LGD values being a continuous value between 0 and 1, regression trees
techniques can be used (given the loan’s & the debtor’s characteristics, market
parameters, etc.).
A possible resulting regression tree is presented in figure 7 below11
.
Figure 7: regression tree.
Decision trees are generally presented upside down, with the root node at the
top and the leaves nodes at the bottom.
The root node contains all observations of the original data set. In the example
illustrated in figure 7, we consider a sample of 1000 observations (equal to 100%
of the dataset). A parent node can be split in two branches which results in two
children nodes. This “splitting process” continues until we reach a leaf, which is a
node that is not further split.
Associated with each non-leaf node will be a test or question that splits the data
in different subgroups. In our example, the first splitting criterion is based on the
Exposure-at-default (EAD). The first rule is: “is the EAD of the loan inferior to EUR
500 000?”). Thus, if, for a given loan, the EAD is smaller than EUR 500 000, this
loan belongs to node 2 (40% belongs to this node). If it is bigger, that loan belongs
to node 3 (60% belongs to this node). Node 2 and 3 are classical nodes and the
splitting process is thus repeated again and again until the leaf nodes are reached.
11
Every amount or value is given for illustration purpose only.
3 2

14 | P a g e
A Reacfin White Paper on Artificial Intelligence applications to Finance
Introduction to machine learning techniques used in the financial industry and a practical case study By Arnaud Deltour and François Ducuroir
© Reacfin s.a. – June 2016
Note that a particular variable can be used several times as splitting variable (i.e.
it can appear in several splitting rules through the tree). At each node, several
questions arise:
• On which variable should the split be based? And what is the best splitting
point for this variable?
• How do we define this notion of “best” splitting variable/point?
• How is it decided to stop the splitting process (i.e. when is a node
considered as a leaf or not)?
The process to get the deepest tree possible, which might be large and (overly)
complex, is described below12
. In order to decide which variable should be used to
determine the splitting criteria and the optimal splitting point, the notion of
“impurity of a node” is introduced.
Suppose a continuous variable �� and splitting point� are chosen in order to split
the dataset so that the dataset is divided into ����, �� and����, ��:
�����, �� � ��|�� � ������, �� � ��|�� � ��
Then typically residual sum of square is used as the “node impurity” measure for
continuous response variables.
We have the following facts:
• Each observation �belongs to one specific group.
• Each observation having its own value for the ��� response variable
(�����, we can compute the mean ���� and ���� for each group ����, �� and����, ��.
Then, the residual sum of square of a node � can be computed as:
!!" � # ����� $ ��� "���∈&'()"
Where ��� " is the mean of the response variable ��� observed in node �. Let’s
denote a parent node * and its two children nodes �� and ��. The optimal
splitting variable and point are then obtained through the maximisation of:
Δ- � !!. $ �!!"/ � !!"0�
The desired split thus corresponds to the split that results in the largest impurity
reduction going from (1) the impurity of the parent node and (2) the sum of the
two children nodes impurities. Each variable �� and all possible splitting points �
are examined and the split with the biggest Δ- is chosen. Intuitively, that
corresponds to group observations in regions with homogenous ��� values.
12
As already mentioned, this tree will likely cause overfitting. Cross-validation and pruning, which can help to
solve that problem, are not tackled in that text.

15 | P a g e
A Reacfin White Paper on Artificial Intelligence applications to Finance
Introduction to machine learning techniques used in the financial industry and a practical case study By Arnaud Deltour and François Ducuroir
© Reacfin s.a. – June 2016
In a next step, the child node becomes a parent node and the above process is
repeated. In this way, the deepest regression tree can be built until each leaf node
corresponds to the lowest impurity or when some minimum node size13
is
reached.
Regression trees give thus an easy rule to predict the ��� of a specific
observation. Each loan can thus be classified easily by following the subsequent
rules.
It’s also possible to know in which segment most of the data are situated. In figure
7, 55% of the data have an exposure-at-default higher than 500 000 euros and
with a debtor working in the agriculture sector.
For example, take a loan with the following characteristics:
• Exposure-at-default = EUR 650 000
• Debtor_Size = Medium
• Leverage = 55%
The regression tree gives a LGD prediction of 0.7. That means that, on average, a
loan with the above characteristics will lose 70% of its Exposure-at-default in case
of default. In our specific case, that represents a loss of EAD*LGD = 0.7*650 000=
EUR 455 000.
A fast exploration of the tree gives some insight on the riskiness of some classes.
For example, let’s take a loan with the following characteristics:
• EAD = EUR 700 000
• Debtor_Size = Small
• Leverage = 125%
The regression tree gives a LGD prediction of 0.9. That means that, on average, a
loan with the above characteristics will lose 90% of its Exposure-at-default in case
of default. In our specific case, that represents a loss equal to EAD*LGD = 0.9 *700
000=630 000. On the opposite, the safest class has a predicted LGD of 10%.
13
The node size is measured by the number of observations contained in that node.

16 | P a g e
A Reacfin White Paper on Artificial Intelligence applications to Finance
Introduction to machine learning techniques used in the financial industry and a practical case study By Arnaud Deltour and François Ducuroir
© Reacfin s.a. – June 2016
CONCLUSIONS - COMPARING ML AND STATISTICAL
MODELING
Having explained the fundamental difference between both ML & statistical
modeling approaches and having illustrate those with examples of methods and
practical application, we wrap-up this paper by providing the reader with an
overall comparison between the approaches highlighting their main pros and
cons.
Machine
learning
Statistical
modeling Possibility to limit the number of assumptions + - Inference: Assessing the reliability of modeling
assumptions - +
Prediction: ability to extrapolate future or unobserved
realizations of a variable given other explanatory
observations
+ -
“Big Data”: ability to handle large sets of data both in
terms of number of observations (“rows”) or variables
(“columns”)
+ -
Human interactions: ability/need of incorporating
material users ex-ante opinions (e.g. Expert Judgment) - +
Table 8: comparison of both worlds
Usually, statistical modelling gives better insight for inference but the framework
of statistical modelling typically needs many assumptions.
• First, one needs to take a main assumption over a particular model for the
“nature” dynamic (linear regression, logistic regression, etc.).
• Secondly, one will have, for each model, an associated set of derived
assumptions (which may often be overlooked):
o For example, in linear regression, the error term must be of zero
mean, normally distributed, independent of x and of constant
variance.
While all of these assumptions could obviously be criticized in practice statistical
techniques such as linear regression nevertheless became common market
practice.
On the other side machine learning techniques do not rely on as many
assumptions. All is about the data and what they could tell the algorithm: one
searches the best algorithm to predict the response variable y with the best
accuracy. As a result properly used ML techniques may prove to produce the best
predicting models.
Results however will need careful attentions as they derive from automated
procedures and could induce conclusions which do not match business logic.
Machine learning techniques are usually seen as “black boxes” to be opposed to
“white-boxes” models of usual statistical modeling culture. In-depth practical
experience remains thus a must-have to adequately implement ML algorithms.

17 | P a g e
A Reacfin White Paper on Artificial Intelligence applications to Finance
Introduction to machine learning techniques used in the financial industry and a practical case study By Arnaud Deltour and François Ducuroir
© Reacfin s.a. – June 2016
REACFIN’S SUPPORT
Reacfin is a consulting firm specialized in Risk Management, Actuarial Science,
Portfolio Modeling and Quantitative Finance. We regularly support financial
institutions in the development, the implementation and the validation of their
new models.
With this White Paper we aim at illustrating the themes of some of our recent
missions and research work.
We deeply believe that risk taking & innovation are inherent to the business
models of financial institutions yet only scrupulous & systematic approaches can
ensure the adequacy and robust implementation of new models.
To that extend we offer unrivalled modeling and validation support which
combine the academic excellence of our consultants with high-end benchmarking
services. As we illustrate it in this white paper, we indeed have an efficient access
to a large network of professionals and practitioners of the financial industry
which enable us to clearly define standard- and best practices. Access to such
comparable otherwise proves quite challenging to most banks, asset managers
and insurance companies.
We look forward having the opportunity to also serve your company soon.
In the following exhibits, we illustrate our focus and provide a few additional
examples of our recent assignments.

18 | P a g e
A Reacfin White Paper on Artificial Intelligence applications to Finance
Introduction to machine learning techniques used in the financial industry and a practical case study By Arnaud Deltour and François Ducuroir
© Reacfin s.a. – June 2016
Reacfin s.a. is a Belgian-based actuary, risk & portfolio
management consulting firm.
We develop innovative solutions and robust tools for
Risk and Portfolio management.
The company started its activities in 2004 as a spin-off of the
University of Louvain, focused on actuarial consultancy to Belgian
insurers, pension funds and mutual organizations. Rapidly, Reacfin
expanded its business internationally and broadened its scope to
various aspects of quantitative & qualitative risk management,
financial modeling and strategic advice to financial institutions.
Spread over its 3 offices in Louvain-La-Neuve, Antwerp and
Luxembourg, Reacfin employs a team of high-end consultants
most of which hold PhD’s or highly specialized university degrees.
What we do
• Modeling
• Risk implementation advisory
• Validation & model reviews
• Specialized strategic risk
consulting
Excellence: our outstanding feature
To deliver more than is expected from us, we attract the best people and develop their skills to the most
cutting-hedging techniques supported by a robust and rigorous knowledge management framework.
Innovation: our founding ambition
Leveraging on our profound academic roots, we are dedicated on creating inventive solutions by
combining our extensive professional experience with the latest scientific research.
Integrity: our commitment
We put work ethics, client's best interest and confidentiality as the foundation of our work. We are fully
independent and dedicated at telling the truth.
Solution-driven: our focus
We produce for our clients’ tangible long-term sustainable value. We help our clients not only to reach
the top, we help them reaching the stable top.
Reliability: our characteristic
We never compromise on the quality of our work, the respect of deadlines & budgets and our other
commitments. We don’t produce reports, we deliver results!
We put great emphasis at strictly articulating our work around 5 fundamental driving values:

19 | P a g e
A Reacfin White Paper on Artificial Intelligence applications to Finance
Introduction to machine learning techniques used in the financial industry and a practical case study By Arnaud Deltour and François Ducuroir
© Reacfin s.a. – June 2016
Reacfin’s 4 core fields of expertise:
ALM, Portfolio Management &
Quantitative Finance
� Implementation and calibration of
stochastic models for valuation,
trading and risk Management
purposes
� Times series analysis & modelling
� Pricing of financial instruments &
development of ALM models
� Design/review/implementation of
systematic trading & hedging
strategies
� Business intelligence in ALM or
Portfolio Management
� Tools development (Valuation,
Pricing, hedging, portfolio replication,
etc.)
� Design of Capital Management
solutions
Insurance specialties
Life, Health and Pension
� DFA* Models
� Capital Requirement assessment
� Business valuation support
� Product development (pricing,
profitability, ... ) & Reserving
� Model validation
Non-Life
� Reserving: triangle methods,
individual claims modelling
� Pricing: frequency and severity
modelling, large claims analysis,
credibility methods, commercial
constraints
� DFA models: cash-flows projection,
calibration of models
� Reinsurance: modelling covers,
optimal reinsurance programs
Qualitative Risk Management,
Restructuring & Operations
� Organization & Governance
� Businesses restructuring & change
management
� Implementation and industrialization
of processes
� Internal & regulatory reporting (KRI’s
& KPI’s dashboards)
� Model Review frameworks
� Model Documentation
(*) DFA = Dynamic Financial Analysis
Risk & Portfolio Management

20 | P a g e
A Reacfin White Paper on Artificial Intelligence applications to Finance
Introduction to machine learning techniques used in the financial industry and a practical case study By Arnaud Deltour and François Ducuroir
© Reacfin s.a. – June 2016
What we deliver
Balanced
and
pragmatic
approach
No black
box
Solutions
Document-
ation,
coaching &
training
� Client-centric solutions focussed on deliverables � Respecting the principle of proportionality
� Cost efficient within tight pre-agreed budgets
� We deliver results, not reports! � Open source solutions
� Close cooperation with our clients
� Clear & comprehensive documentation compliant existing or upcoming regulation
� Adapted trainings at all levels of the organisation � Coaching support for implementation and operationnalisation of
processes
Clearly
structured
processes
� Lean & efficient tailored project management � Regular progress reviews
� Close cooperation with our clients
State of the
art technicaltechnicaltechnicaltechnical
skills
� Expertise in most advanced quantitative modelling & academic excellence of a spin-off
� All our consultants hold multiple masters or Phd. � Best-in-class qualitative risk management leveraging on highly
experienced senior consultants Hands-on implementation solutions, tested for real-world conditions

21 | P a g e
A Reacfin White Paper on Artificial Intelligence applications to Finance
Introduction to machine learning techniques used in the financial industry and a practical case study By Arnaud Deltour and François Ducuroir
© Reacfin s.a. – June 2016
• Client: European Bank in a new EU country with a large portfolio of SME loans
• Under review by ECB (Systemic Bank)
• Experienced recent distressed credit environment
• Using a simple ‘One-Fits-All’ average LGD for all loans
• Ambition to switch to Advanced-IRB approaches for regulatory purposes
Client Situation
Issues
• Too simple LGD model generates adverse selection in loans origination
• Challenging remarks from local regulator and ECB on LGD modeling (to compliant with
CRR/CRD IV requirements)
• Issues with data quality
• Limited model development culture (material gaps in model lifecycle processes, uneven
documentation of recovery process, etc.)
Reacfin’s Contribution
• Context review: loan portfolio mix, Recovery processes, PD/Internal Rating Models, etc.
• Benchmarking vs. European peers standard & best practices
• Segmentation of the loan book and clustering of the recovery process using Machine
learning algorithms (incl. Regression Trees and Random Forest algorithms)
• Modeling of distribution based Work-Out & Implied Market LGD approaches
• Development & deployment of user-friendly automated tools to compute the LGD under
the new proposed method (incl. data collection tools, testing & design of processes)
� Development of a Model Management & model Governance Framework policy.
• Documentation and support with presentation to local regulator
Example of a recent mission
Results & Benefits
• More accurate pricing of new loans (materially reducing adverse selection of debtors) and
better risk quantification and segmentation;
• Advancement towards A-IRB approach (and significant reductions in capital requirements
• Increased management awareness regarding organizational and data management issues.

22 | P a g e
A Reacfin White Paper on Artificial Intelligence applications to Finance
Introduction to machine learning techniques used in the financial industry and a practical case study By Arnaud Deltour and François Ducuroir
© Reacfin s.a. – June 2016
CONTACT DETAILS
François Ducuroir
Managing Partner
T +32 472 72 32 05
Reacfin s.a./n.v.
Place de l'Université 25
B-1348 Louvain-la-Neuve

23 | P a g e
A Reacfin White Paper on Artificial Intelligence applications to Finance
Introduction to machine learning techniques used in the financial industry and a practical case study By Arnaud Deltour and François Ducuroir
© Reacfin s.a. – June 2016
This page is left blank intentionally

24 | P a g e
A Reacfin White Paper on Artificial Intelligence applications to Finance
Introduction to machine learning techniques used in the financial industry and a practical case study By Arnaud Deltour and François Ducuroir
© Reacfin s.a. – June 2016
Reacfin s.a. is a Belgian-based
actuary, risk & portfolio
management consulting firm.
We develop innovative solutions
and robust tools for Risk- and
Portfolio management.
Linking Academic Excellence
with Market Best Practice
www.reacfin.com
+ 32 (0)10 84 07 50