20160113 icr presentation vfinal
25
ICR Conference January 13, 2016
-
Upload
syscoinvestors -
Category
Investor Relations
-
view
1.790 -
download
3
Transcript of 20160113 icr presentation vfinal

ICR Conference
January 13, 2016
© 2016 All Rights Reserved. Sysco Corporation.
P A G E 2
Forward-Looking StatementsCertain statements made herein that look forward in time or express management’s expectations or beliefs with respect to the occurrence of future events are forward-looking statements under the Private Securities Litigation Reform Act of 1995. They include, but are not limited to, statements regarding Sysco’s market potential in the U.S. and Canada; opportunities across market segments; our plans to repurchase $3 billion in Sysco common stock; Sysco’s targeted financial results for FY15-FY18 and the estimated CAGR during that period for those financial metrics; our plans to grow operating income at least $400 million by accelerating local case growth, increasing gross profit, stabilizing gross margins, leveraging supply chain costs and reducing administrative costs; our capital allocation expectations, including projected adjusted operating cash flow and free cash flow; and Sysco’s plans to achieve ROIC target of 15% by improving working capital management, managing capital spend in a rigorous manner and assessing business segment strategic value and ROIC. These statements involve risks and uncertainties and are based on management's current expectations and estimates. Forward looking statements are not guarantees of future performance and our actual results may differ materially. Factors impacting these forward-looking statements include the general risks associated with our business, including the risks of interruption of supplies due to lack of long-term contracts, severe weather, crop conditions, work stoppages, intense competition, technology disruptions, dependence on large regional and national customers, inflation risks, the impact of fuel prices, adverse publicity, and labor issues. Risks and uncertainties also include risks impacting the economy generally, including the risks that the current general economic conditions will deteriorate, or consumer confidence in the economy or consumer spending, particularly on food-away-from-home, may decline. Market conditions may not improve. If sales from our locally managed customers do not grow at the same rate as sales from regional and national customers, our gross margins may decline. Our ability to meet our long-term strategic objectives depends largely on the success of our various business initiatives. There are various risks related to these efforts, including the risk that these efforts may not provide the expected benefits in our anticipated time frame, if at all, and may prove costlier than expected; the risk that the actual costs of any initiatives may be greater or less than currently expected; and the risk of adverse effects to our business, results of operations and liquidity if past and future undertakings, and the associated changes to our business, do not prove to be cost effective or do not result in the cost savings and other benefits at the levels that we anticipate. Our plans related to and the timing of any initiatives are subject to change at any time based on management’s subjective evaluation of our overall business needs. If we are unable to realize the anticipated benefits from our efforts, we could become cost disadvantaged in the marketplace, and our competitiveness and our profitability could decrease. Capital expenditures may vary based on changes in business plans and other factors, including risks related to the implementation of various initiatives, the timing and successful completion of acquisitions, construction schedules and the possibility that other cash requirements could result in delays or cancellations of capital spending. Periods of high inflation, either overall or in certain product categories, can have a negative impact on us and our customers, as high food costs can reduce consumer spending in the food-away-from-home market, and may negatively impact our sales, gross profit, operating income and earnings, and periods of deflation can be difficult to manage effectively. Fluctuations in inflation and deflation, as well as fluctuations in the value of foreign currencies, are beyond our control and subject to broader market forces. Expanding into international markets presents unique challenges and risks, including compliance with local laws, regulations and customs and the impact of local political and economic conditions, and such expansion efforts may not be successful. Any business that we acquire may not perform as expected, and we may not realize the anticipated benefits of our acquisitions. Expectations regarding the accounting treatment of any acquisitions may change based on management’s subjective evaluation. Expectations regarding share repurchases are subject to various factors beyond management’s control, including fluctuations in the stock market, and decisions regarding share repurchases are subject to change based on management’s subjective evaluation of the Company’s needs.Estimates related to future years are particularly difficult to forecast with accuracy and investors should take caution with respect to estimates related to FY16-FY18, as future periods will be impacted by general economic conditions and numerous factors beyond our control. Also, management’s plans with respect to any specific strategies and goals are subject to change based on the needs of our company in general. For a discussion of additional factors impacting Sysco’s business, see the Risk Factors contained in Sysco’s Annual Report on Form 10-K for the year ended June 27, 2015, as filed with the Securities and Exchange Commission, and Sysco’s subsequent filings with the SEC. Except where otherwise noted, the forward-looking statements contained herein speak as of the date of this Presentation. We do not undertake to update the forward-looking statements contained in this Presentation. This presentation shall not constitute an offer to sell or the solicitation of an offer to buy securities, and shall not constitute an offer, solicitation or sale in any jurisdiction in which such offer, solicitation or sale would be unlawful prior to the registration or qualification under the securities laws of such jurisdiction.
0 1 . 1 3 . 1 6
I C R C O N F E R E N C E

© 2016 All Rights Reserved. Sysco Corporation.
P A G E 3
Contents
Financial perspective
Market context and Sysco overview
Strategic plan update: 2016 - 2018
Market Context and Sysco
Overview
Bill DeLaneyJanuary 13, 2016
© 2016 All Rights Reserved. Sysco Corporation.
P A G E 5
Our vision
0 1 . 1 3 . 1 6
I C R C O N F E R E N C E

© 2016 All Rights Reserved. Sysco Corporation.
P A G E 6
57%
50%
42%
50%
40%
45%
50%
55%
60%
Away from home foodservice sales trending favorably
Retail
Foodservice
Source: US Census Bureau (2015)
1 Retail Sales Equivalent Share; Retail includes grocery and other food/beverage sales (excluding foodservice) at all retail establishments
0 1 . 1 3 . 1 6
I C RC O N F E R E N C E
% of total food spend; retail sales equivalent1
1997 2008 20151982
© 2016 All Rights Reserved. Sysco Corporation.
P A G E 7
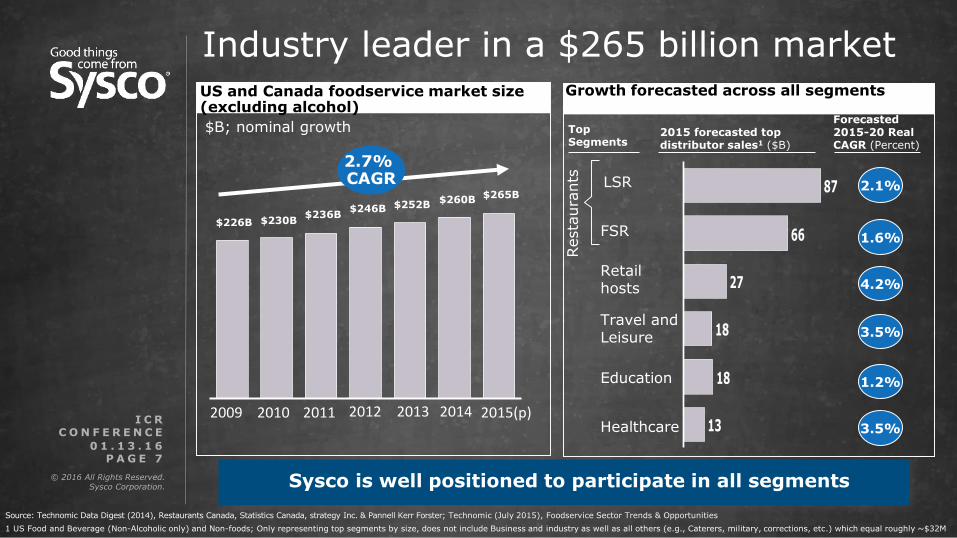
2015 forecasted top distributor sales1 ($B)
vv
Industry leader in a $265 billion market
$226B $230B$236B
$246B $252B$260B
$265B
2.7%CAGR
2015(p)2009
US and Canada foodservice market size (excluding alcohol)
$B; nominal growth
Source: Technomic Data Digest (2014), Restaurants Canada, Statistics Canada, strategy Inc. & Pannell Kerr Forster; Technomic (July 2015), Foodservice Sector Trends & Opportunities
0 1 . 1 3 . 1 6
I C R C O N F E R E N C E
2010 2011 2012 2013 2014
Forecasted 2015-20 Real CAGR (Percent)
2.1%
1.6%
3.5%
4.2%
1.2%
3.5%
Resta
ura
nts
Top Segments
13
18
18
27
66
87
Travel andLeisure
Education
Healthcare
FSR
LSR
Retailhosts
1 US Food and Beverage (Non-Alcoholic only) and Non-foods; Only representing top segments by size, does not include Business and industry as well as all others (e.g., Caterers, military, corrections, etc.) which equal roughly ~$32M
Growth forecasted across all segments
Sysco is well positioned to participate in all segments

© 2016 All Rights Reserved. Sysco Corporation.
P A G E 8
Our industry is fragmented and highly competitive
Source: Technomic, Sysco 2014 10-K, Goldman Sachs, Restaurant Canada, STRATEGY Inc.1 Does not include distribution of alcohol, expressed in USD; 2 Includes Food Services of America, Ben E. Keith Co., and Shamrock Foods
Sysco’s competitive landscape in the US and Canada, 2014 (~$260B core foodservice distribution market1)
0 1 . 1 3 . 1 6
I C R C O N F E R E N C E Reinhart ~3%
3 Regionals~3%2
GFS ~4%
PFG ~5%
US Foods ~9%
Sysco ~18%
Other(~15,000) ~58%
© 2016 All Rights Reserved. Sysco Corporation.
P A G E 9
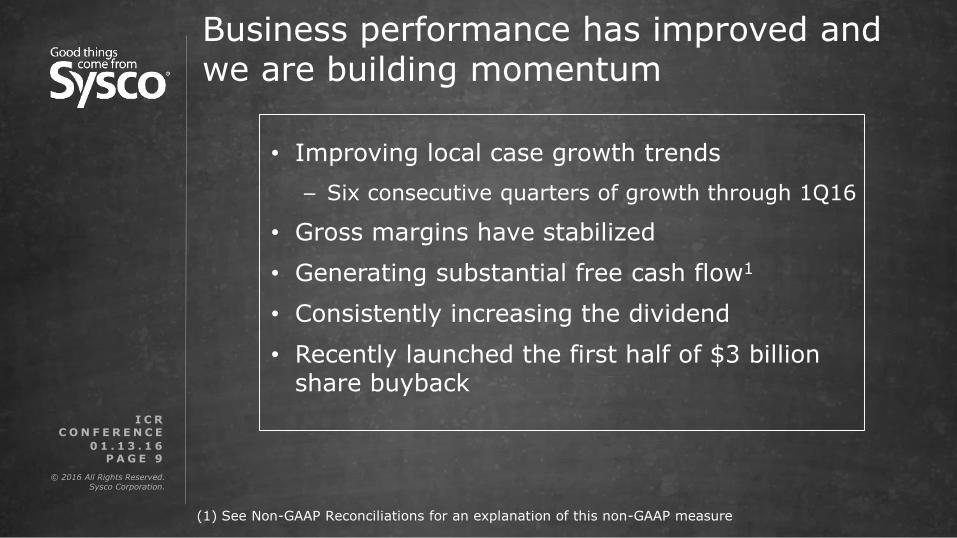
Business performance has improved and we are building momentum
0 1 . 1 3 . 1 6
I C R C O N F E R E N C E
• Improving local case growth trends
− Six consecutive quarters of growth through 1Q16
• Gross margins have stabilized
• Generating substantial free cash flow1
• Consistently increasing the dividend
• Recently launched the first half of $3 billion share buyback
(1) See Non-GAAP Reconciliations for an explanation of this non-GAAP measure

© 2016 All Rights Reserved. Sysco Corporation.
P A G E 1 0
Contents
Financial perspective
Market context and Sysco overview
Strategic plan update: 2016 - 2018
© 2016 All Rights Reserved. Sysco Corporation.
P A G E 1 1
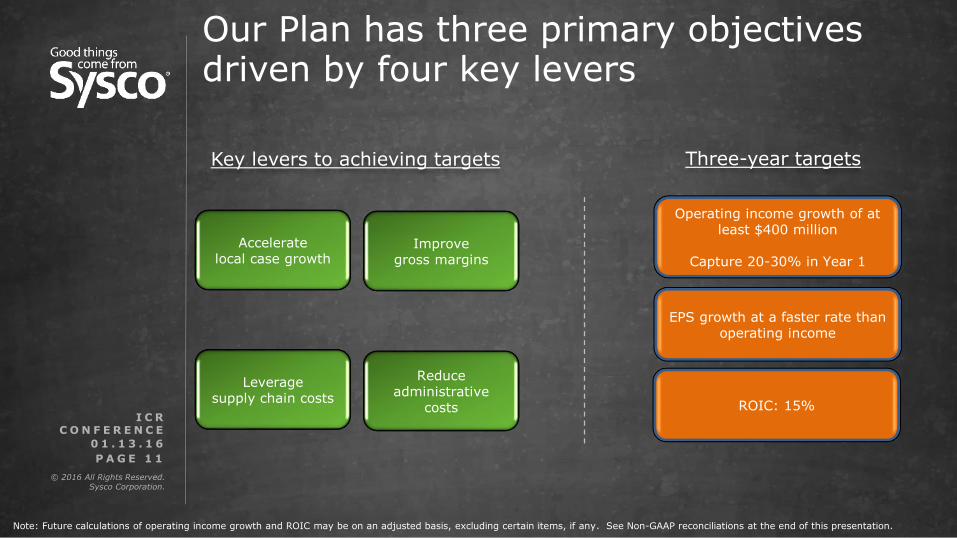
Key levers to achieving targets
Reduce administrative
costs
Leverage supply chain costs
Improve gross margins
Accelerate local case growth
Note: Future calculations of operating income growth and ROIC may be on an adjusted basis, excluding certain items, if any. See Non-GAAP reconciliations at the end of this presentation.
ROIC: 15%
Our Plan has three primary objectives driven by four key levers
0 1 . 1 3 . 1 6
I C R C O N F E R E N C E
Operating income growth of at least $400 million
Capture 20-30% in Year 1
Three-year targets
EPS growth at a faster rate than operating income
© 2016 All Rights Reserved. Sysco Corporation.
P A G E 1 2
We are assessing opportunities to exceed our plan
I C RC O N F E R E N C E
0 1 . 1 3 . 1 6
• Pleased with local case growth
• Persistent deflationary pressure
• More aggressive approach to expense management

© 2016 All Rights Reserved. Sysco Corporation.
P A G E 1 3
Sysco is well positioned for the future
I C RC O N F E R E N C E
0 1 . 1 3 . 1 6
Targeted Results
• Improve the customer experience
• Enhance associate engagement
• Achieve our financial objectives

Strategic Plan Update and
Financial Perspective
Joel GradeJanuary 13, 2016
© 2016 All Rights Reserved. Sysco Corporation.
P A G E 1 5
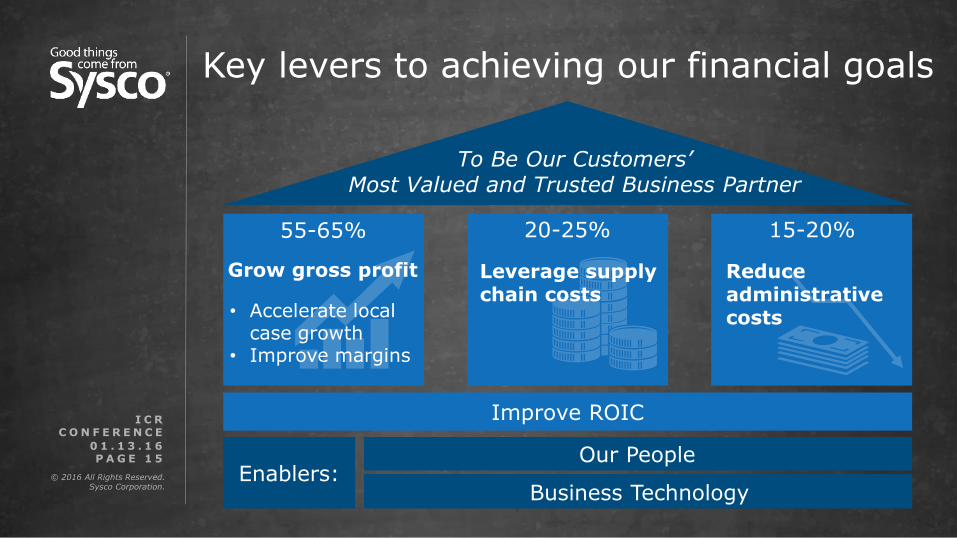
Key levers to achieving our financial goals
0 1 . 1 3 . 1 6
I C R C O N F E R E N C E
To Be Our Customers’ Most Valued and Trusted Business Partner
Improve ROIC
Enablers:
Grow gross profit Leverage supply chain costs
Reduce administrative costs• Accelerate local
case growth• Improve margins
Our People
Business Technology
55-65% 20-25% 15-20%

© 2016 All Rights Reserved. Sysco Corporation.
P A G E 1 6
Expected timeline for operating income improvements
Cumulative Capture by Year, %
FY2018FY2017FY2016
Operating Income Benefit
20-30% 50-60% 100%
0 1 . 1 3 . 1 6
I C R C O N F E R E N C E
Operating income impact is net of incremental costs

© 2016 All Rights Reserved. Sysco Corporation.
P A G E 1 7
We plan to achieve our ROIC target of 15% by focusing on 3 key activities
1) Improve working capital management
2) Continue to manage capital spend in a rigorous manner
3) Continually assess business segment strategic value and ROIC
2
3
1
The path to 15% ROIC will not be linear
I C R C O N F E R E N C E
0 1 . 1 3 . 1 6
© 2016 All Rights Reserved. Sysco Corporation.
P A G E 1 8
Contents
Financial perspective
Market context and Sysco overview
Strategic plan update: 2016 - 2018
© 2016 All Rights Reserved. Sysco Corporation.
P A G E 1 9
I C R C O N F E R E N C E
0 1 . 1 3 . 1 6
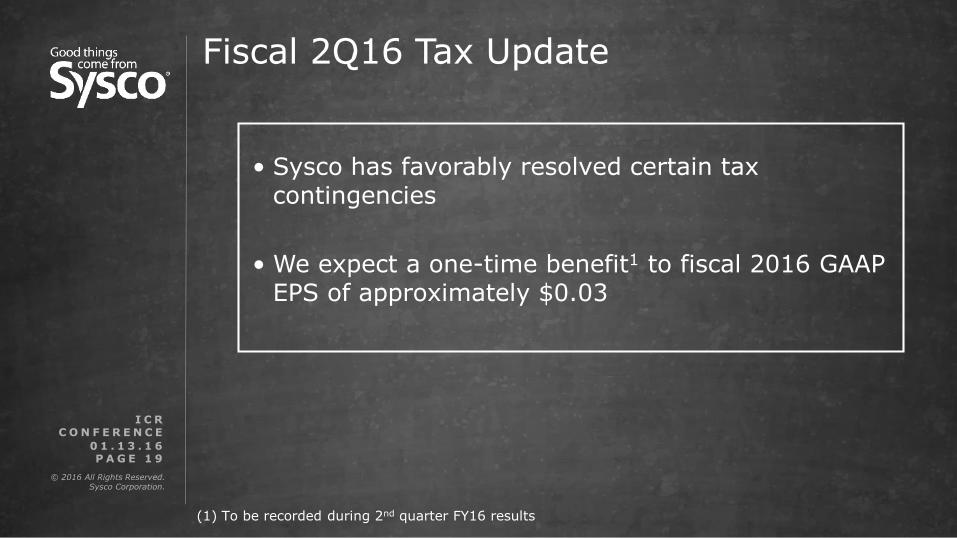
• Sysco has favorably resolved certain tax contingencies
• We expect a one-time benefit1 to fiscal 2016 GAAP EPS of approximately $0.03
Fiscal 2Q16 Tax Update
(1) To be recorded during 2nd quarter FY16 results
© 2016 All Rights Reserved. Sysco Corporation.
P A G E 2 0
Closing thoughts
I C R C O N F E R E N C E
0 1 . 1 3 . 1 6
• Making good progress toward our three-year plan
• Assessing opportunities to exceed our plan
• More aggressive approach to expense management

Q&A

Non-GAAP ReconciliationsICR Conference
January 13, 2016

© 2016 All Rights Reserved. Sysco Corporation.
P A G E 2 30 9 . 1 5 . 1 5
I N V E S T O R D A Y
Impact of Certain Items - Fiscal 2015
Non-GAAP Reconciliation (Unaudited)
Sysco Corporation and its Consolidated Subsidiaries
(In Thousands, Except for Share and Per Share Data)
Sysco’s results of operations are impacted by certain items that include multiemployer withdrawal charges (MEPP), severance charges, integration planning, litigation and termination costs in connection with the merger that had been proposed with US Foods, Inc. (US Foods), charges from facility closures and US Foods related financing costs. These items are collectively referred to as "Certain Items." Management believes that adjusting its operating expenses, operating expenses as a percentage of sales, operating income, operating income as a percentage of sales, interest expense, net earnings and diluted earnings per share to remove these charges provides an important perspective of underlying business trends and results and provides meaningful supplemental information to both management and investors that is indicative of the performance of the company's underlying operations and facilitates comparisons on a year-over-year basis
The company uses these non-GAAP measures when evaluating its financial results, as well as for internal planning and forecasting purposes. These financial measures should not be used as a substitute for GAAPmeasures in assessing the company’s results of operations for the periods presented. An analysis of any non-GAAP financial measure should be used in conjunction with results presented in accordance with GAAP. As a result, in the tables that follow, fiscal 2015 is adjusted to remove the Certain Items noted above
52-Week Period Ended Jun. 27,
2015
Sales (GAAP) $ 48,680,752
Operating expenses (GAAP) $ 7,322,154
Impact of severance charge (5,598)
Impact of US Foods merger and integration planning costs (554,667)
Impact of facility closure charges (2,203)
Subtotal - Impact of Certain Items on operating expenses (562,468)
Operating expenses adjusted for Certain Items (Non-GAAP) $ 6,759,687
Operating expenses as a percentage of sales (GAAP) 15.0%
Adjusted operating expenses as a percentage of sales (Non-GAAP) 13.9%
Operating income (GAAP) $ 1,229,362
Impact of Certain Items on operating income 562,468
Operating income adjusted for Certain Items (Non-GAAP) $ 1,791,830
Operating income as a percentage of sales (GAAP) 2.5%
Adjusted operating income as a percentage of sales (Non-GAAP) 3.7%
Interest Expense (GAAP) 254,807
Impact of US Foods financing costs (138,422)
Adjusted Interest Expense (Non-GAAP) 116,385
Net earnings (GAAP)1 686,773
Impact of severance charge (net of tax) 3,302
Impact of US Foods merger and integration planning costs (net of tax) 327,149
Impact of facility closure charges (net of tax) 1,299
Impact of US Foods Financing Costs (net of tax) 81,643
Subtotal - Impact of Certain Items on net earnings 413,393
Net earnings adjusted for Certain Items (Non-GAAP)1 1,100,166
Diluted earnings per share (GAAP) 1 1.15
Impact of severance charge 0.01
Impact of US Foods merger and integration planning costs 0.55
Impact of US Foods Financing Costs 0.14
Diluted EPS adjusted for Certain Items (Non-GAAP)12 1.84
Diluted shares outstanding 596,849,034
1 The net earnings and diluted earnings per share impacts are shown net of tax. Tax impact of adjustments for Certain Items was $287,497 for the 52-week periods ended June 27, 2015. The amount is calculated by multiplying the pretax impact of each Certain Item by the statutory rates in effect for each jurisdiction
2 Individual components of diluted earnings per share may not add to the total presented due to rounding. Total diluted earnings per share is calculated using adjusted net earnings for certain items divided by diluted shares outstanding

© 2016 All Rights Reserved. Sysco Corporation.
P A G E 2 40 9 . 1 5 . 1 5
I N V E S T O R D A Y
Sysco Corporation and its Consolidated Subsidiaries
Non-GAAP Reconciliation (Unaudited)
Return on Invested Capital (ROIC) and Adjusted ROIC
(In Thousands)
We calculate ROIC as net earnings divided by (i) stockholder’s equity, computed as the average of adjusted stockholders’ equity at the beginning of the year and at the end of each fiscal quarter during the year; and (ii) long-term debt, computed as the average of the long-term debt at the beginning of the year and at the end of each fiscal quarter during the year. All components of our ROIC calculation are impacted by Certain Items. As a result, in the non-GAAPreconciliation below for fiscal 2015, adjusted total invested capital is computed as the sum of (i) adjusted stockholder’s equity, computed as the average of adjusted stockholders’ equity at the beginning of the year and at the end of each fiscal quarter during the year; and (ii) adjusted long-term debt, computed as the average of the adjusted long-term debt at the beginning of the year and at the end of each fiscal quarter during the year. Sysco considers adjusted ROIC to be a measure that provides useful information to management and investors in evaluating the efficiency and effectiveness of the company's long-term capital investments, and we have used ROIC as a performance criteria in our managment incentive programs. It is possible that a different definition of ROIC may be used by other companies since it can be defined differently. An analysis of any non-GAAP financial measure should be used in conjunction with results presented in accordance with GAAP. In the table that follows, adjusted ROIC for fiscal 2015 is reconciled to a GAAP based calculation of ROIC.
With respect to our target adjusted ROIC of 15%, which we expect to achieve by FY18, we cannot provide a quantitative reconciliation to the most directly comparable GAAP measure without unreasonable effort due to uncertainty related to the timing of achieving such results. However, we would expect to calculate adjusted ROIC in the same manner that we calculated FY15 adjusted ROIC as described above and reflected in the table below.
Fiscal 2015
Net earnings (GAAP) $ 686,773
Impact of Certain Items on net earnings 413,393
Adjusted net earnings (Non-GAAP) $ 1,100,166
Invested Capital (GAAP) $ 10,985,527
Adjustments to invested capital (1) (2,565,346)
Adjusted Invested capital (GAAP) $ 8,420,181
Return on invested capital (GAAP) 6.3%
Return on invested capital (Non-GAAP) 13.1%
(1) Adjustments to invested capital includes the removal of excess cash obtained from debt incurred for the US Foods merger that had been proposed and the debt issuance costs and hedge settlement borrowings that would not have been borrowed absent this merger-related debt. Shareholder's equity adjustments include the impact of Certain Items from earnings and removal of foreign currency translation adjustments that arose in fiscal 2015.

© 2016 All Rights Reserved. Sysco Corporation.
P A G E 2 50 9 . 1 5 . 1 5
I N V E S T O R D A Y
Sysco Corporation and its Consolidated Subsidiaries
Non-GAAP Reconciliation (Unaudited)
Free Cash Flow and Adjusted Free Cash Flow
(In Thousands)
Free cash flow represents net cash provided from operating activities less purchases of plant and equipment and includes proceeds from sales of plant and equipment. Sysco considers free cash flow to be a liquidity measure that provides useful information to management and investors about the amount of cash generated by the business after the purchases and sales of buildings, fleet, equipment and technology, which may potentially be used to pay for, among other things, strategic uses of cash including dividend payments, share repurchases and acquisitions. However, free cash flow may not be available for discretionary expenditures, as it may be necessary that we use it to make mandatory debt service or other payments. Free cash flow should not be used as a substitute for the most comparable GAAP measure in assessing the company’s liquidity for the periods presented. An analysis of any non-GAAP financial measure should be used in conjunction with results presented in accordance with GAAP. In the table that follows, free cash flow for fiscal 2015 is reconciled to net cash provided by operating activities.
52-Week Period Ended Jun. 27, 2015
Net cash provided by operating activities (GAAP) $ 1,555,484
Additions to plant and equipment (542,830)
Proceeds from sales of plant and equipment 24,472
Free Cash Flow (Non-GAAP) $ 1,037,126
Cash impact of Certain Items 230,837
Adjusted Free Cash Flow (Non-GAAP) $ 1,267,963