
2016 TRANSURBAN ANNUAL REPORT · PDF file2016 ransurban Annual Report 1 ... Following the...
122
transurban.com 2016 TRANSURBAN ANNUAL REPORT
Transcript of 2016 TRANSURBAN ANNUAL REPORT · PDF file2016 ransurban Annual Report 1 ... Following the...
transurban.com
2016TRANSURBANANNUAL REPORT

Contents
Transurban Group financial statements 1
Security holder information 114
Corporate Governance StatementTransurban’s 2016 Corporate Governance Statement is located at www.transurban.com/corporate-governance-statement

12016 Transurban Annual Report
Transurban Holdings Limited and Controlled EntitiesABN 86 098 143 429
(Including Transurban International Limited and Transurban Holding Trust)
Annual reportfor the year ended 30 June 2016
Transurban Holdings Limited and Controlled EntitiesABN 86 098 143 429
(Including Transurban International Limited and Transurban Holding Trust)
Annual reportfor the year ended 30 June 2016
2016 Transurban Annual Report2 2
Contents
Directors’ report ....................................................................................................................................................... 3
Section A: Group financial statements................................................................................................................... 44
Section B: Notes to the Group financial statements .............................................................................................. 50
Section C: Transurban Holding Trust (‘THT’) and Transurban International Limited (‘TIL’) financial statements 94
Section D: Notes to the THT and TIL financial statements ………………………………………………………….. .. 99
Section E: Signed reports.................................................................................................................................... 111

32016 Transurban Annual Report3
Directors’ reportThe Directors of Transurban Holdings Limited (‘the Company’, ‘the Parent’ or ‘THL’) and its controlled entities (‘Transurban Group’ or ‘the Group’), Transurban International Limited and its controlled entities (‘TIL’), and Transurban Infrastructure Management Limited (‘TIML’), as responsible entity of Transurban Holding Trust and its controlled entities (‘THT’), present their report on the Transurban Group for the financial year ended 30 June 2016 (‘FY16’). The controlled entities of THL include the other members of the stapled group being TIL and THT.
ResultStatutory results
Revenue from ordinary activities increased 18.8 per cent to $2,210 million;
Profit from ordinary activities after tax increased from a loss of $373 million to a profit of $22 million;
Profit from ordinary activities after tax excluding significant items increased 228.9 per cent to $148million;
Earnings before depreciation and amortisation, net finance costs, equity accounted investments and income taxes (‘EBITDA’) increased 59.6 per cent to $1,248 million;
EBITDA excluding significant items increased 13.9 per cent to $1,379 million;
Statutory net profit attributable to security holders of the stapled group increased from a loss of $182 million to a profit of $99 million; and
Statutory net profit attributable to security holders of the stapled group excluding significant itemsincreased 114.5 per cent to $178 million.
Proportional results Toll revenue increased 17.5 per cent to $1,946 million;
EBITDA increased by 37.5 per cent to $1,398 million;
EBITDA excluding significant items increased by 14.8 per cent to $1,480 million; and
Free cash increased 20.6 per cent to $926 million.
Distributions
Amount per security
Cents
Franked amount per security
%
Final distribution (declared prior to reporting date) 19.5 –Final dividend (declared prior to reporting date) 3.5 100
23.0
Interim distribution for the current year 19.0 –Interim dividend for the current year 3.5 100
22.5
Final distribution (prior year) 17.0 –Final dividend (prior year) 3.5 100
20.5
Record date for determining entitlements to distribution and dividend 30 June 2016
Date of payment of final distribution and dividend 12 August 2016
2016 Transurban Annual Report4 4
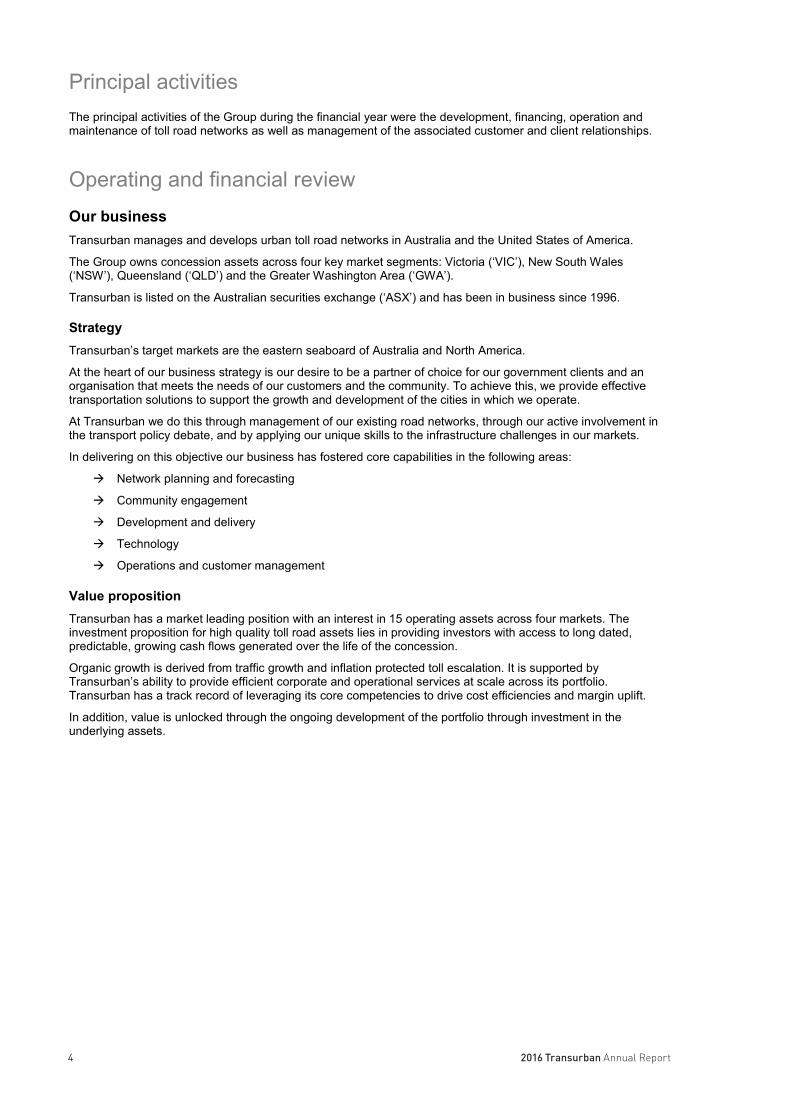
Principal activitiesThe principal activities of the Group during the financial year were the development, financing, operation and maintenance of toll road networks as well as management of the associated customer and client relationships.
Operating and financial review Our businessTransurban manages and develops urban toll road networks in Australia and the United States of America.
The Group owns concession assets across four key market segments: Victoria (‘VIC’), New South Wales(‘NSW’), Queensland (‘QLD’) and the Greater Washington Area (‘GWA’).
Transurban is listed on the Australian securities exchange (‘ASX’) and has been in business since 1996.
StrategyTransurban’s target markets are the eastern seaboard of Australia and North America.
At the heart of our business strategy is our desire to be a partner of choice for our government clients and an organisation that meets the needs of our customers and the community. To achieve this, we provide effective transportation solutions to support the growth and development of the cities in which we operate.
At Transurban we do this through management of our existing road networks, through our active involvement in the transport policy debate, and by applying our unique skills to the infrastructure challenges in our markets.
In delivering on this objective our business has fostered core capabilities in the following areas:
Network planning and forecasting
Community engagement
Development and delivery
Technology
Operations and customer management
Value propositionTransurban has a market leading position with an interest in 15 operating assets across four markets. The investment proposition for high quality toll road assets lies in providing investors with access to long dated, predictable, growing cash flows generated over the life of the concession.
Organic growth is derived from traffic growth and inflation protected toll escalation. It is supported by Transurban’s ability to provide efficient corporate and operational services at scale across its portfolio. Transurban has a track record of leveraging its core competencies to drive cost efficiencies and margin uplift.
In addition, value is unlocked through the ongoing development of the portfolio through investment in the underlying assets.
52016 Transurban Annual Report5
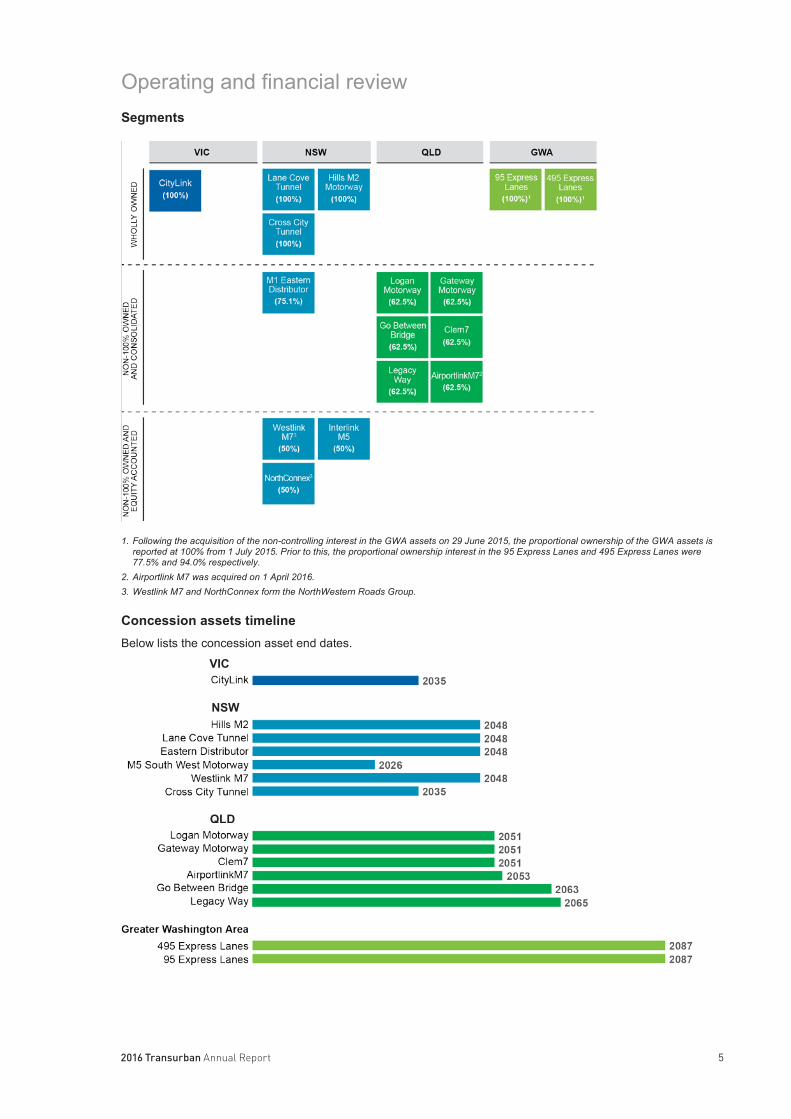
Operating and financial review Segments
1. Following the acquisition of the non-controlling interest in the GWA assets on 29 June 2015, the proportional ownership of the GWA assets is reported at 100% from 1 July 2015. Prior to this, the proportional ownership interest in the 95 Express Lanes and 495 Express Lanes were 77.5% and 94.0% respectively.
2. Airportlink M7 was acquired on 1 April 2016.3. Westlink M7 and NorthConnex form the NorthWestern Roads Group.
Concession assets timeline Below lists the concession asset end dates.
VIC
NSW
QLD
2016 Transurban Annual Report6 6
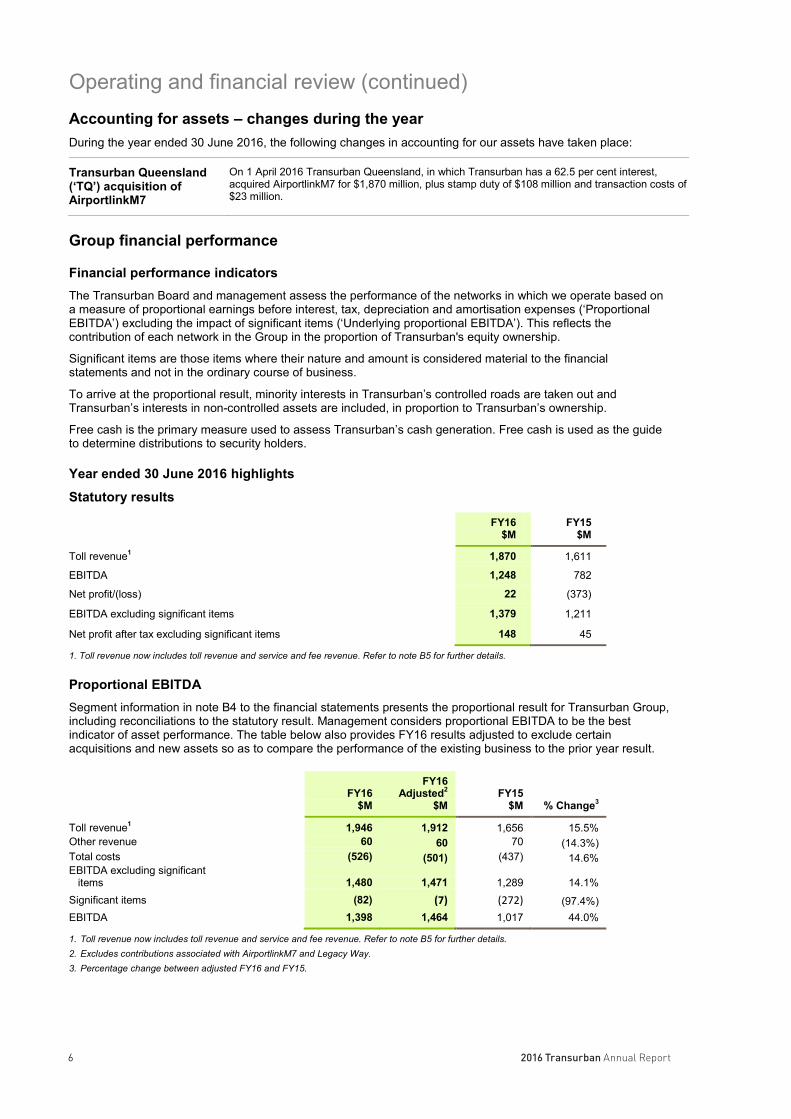
Operating and financial review (continued)Accounting for assets – changes during the yearDuring the year ended 30 June 2016, the following changes in accounting for our assets have taken place:
Transurban Queensland(‘TQ’) acquisition of AirportlinkM7
On 1 April 2016 Transurban Queensland, in which Transurban has a 62.5 per cent interest,acquired AirportlinkM7 for $1,870 million, plus stamp duty of $108 million and transaction costs of $23 million.
Group financial performance
Financial performance indicatorsThe Transurban Board and management assess the performance of the networks in which we operate based on a measure of proportional earnings before interest, tax, depreciation and amortisation expenses (‘Proportional EBITDA’) excluding the impact of significant items (‘Underlying proportional EBITDA’). This reflects the contribution of each network in the Group in the proportion of Transurban's equity ownership.
Significant items are those items where their nature and amount is considered material to the financial statements and not in the ordinary course of business.
To arrive at the proportional result, minority interests in Transurban’s controlled roads are taken out and Transurban’s interests in non-controlled assets are included, in proportion to Transurban’s ownership.
Free cash is the primary measure used to assess Transurban’s cash generation. Free cash is used as the guide to determine distributions to security holders.
Year ended 30 June 2016 highlights
Statutory results
FY16$M
FY15$M
Toll revenue1 1,870 1,611
EBITDA 1,248 782
Net profit/(loss) 22 (373)
EBITDA excluding significant items 1,379 1,211
Net profit after tax excluding significant items 148 45
1. Toll revenue now includes toll revenue and service and fee revenue. Refer to note B5 for further details.
Proportional EBITDASegment information in note B4 to the financial statements presents the proportional result for Transurban Group, including reconciliations to the statutory result. Management considers proportional EBITDA to be the best indicator of asset performance. The table below also provides FY16 results adjusted to exclude certain acquisitions and new assets so as to compare the performance of the existing business to the prior year result.
FY16$M
FY16 Adjusted2
$MFY15
$M % Change3
Toll revenue1 1,946 1,912 1,656 15.5%Other revenue 60 60 70 (14.3%)Total costs (526) (501) (437) 14.6%EBITDA excluding significant
items 1,480 1,471 1,289 14.1%Significant items (82) (7) (272) (97.4%)EBITDA 1,398 1,464 1,017 44.0%
1. Toll revenue now includes toll revenue and service and fee revenue. Refer to note B5 for further details. 2. Excludes contributions associated with AirportlinkM7 and Legacy Way.3. Percentage change between adjusted FY16 and FY15.

72016 Transurban Annual Report7
Operating and financial review (continued)Financial position
FY16M
FY15M
Market capitalisation – 30 June $24,406 $17,800
Shares on issue – 30 June 2,036 1,914
Cash and cash equivalents $834 $1,249
Transurban’s operating assets are primarily long-life intangible assets (concession assets), representing the provision by Government entities for the right to toll customers for the use of the assets. Concession assets represent 78 per cent of the total assets of the Group. The total duration of the concessions typically range from approximately 30 to 80 years, and for accounting purposes the carrying values are amortised on a straight line basis over the duration of the concession.
Free cash and cash flows from operations
FY16 FY15 % Change
Free cash $926M $768M 20.6%
Weighted average securities eligible for distribution1 1,978M 1,910M 3.6%
Free cash per security (cents) 46.8 40.2 16.4%
1. New securities issued during the year are included only to the extent they were eligible for the interim and/or final distribution.
Movements in free cash during the period have been influenced by:
$81 million growth in EBITDA from 100 per cent owned Australian assets
$58 million contribution from Greater Washington Area assets (100% owned from 29 June 2015)
$26 million decrease in net finance costs paid (from 100% owned Australian assets) due to timing of cash flows on new and refinanced debt
($29 million) increase in maintenance provision on 100% owned Australian assets
($18 million) decrease in non-100% owned assets distributions received due to lower distributions from M5 ($28 million) associated with the timing of payment of FY16 distributions and Transurban Queensland ($10 million) due to the timing of interest payments in FY16, partially offset by an increase in Eastern Distributor distributions ($13 million) and the NorthWestern Roads Group distributions ($7 million), noting that the FY15 NorthWestern Roads Group distribution included a $23 million debt service reserve release that did not recur in FY16
$40 million favourable year on year movement in working capital
The weighted average securities eligible for distribution have increased due to the half year impact of the equity issued in December 2015 to support the acquisition of AirportlinkM7. These securities issued in December 2015 were eligible for the FY16 2nd half distributions only.
Note B10 to the statutory accounts provides a detailed calculation of free cash.
2016 Transurban Annual Report8 8
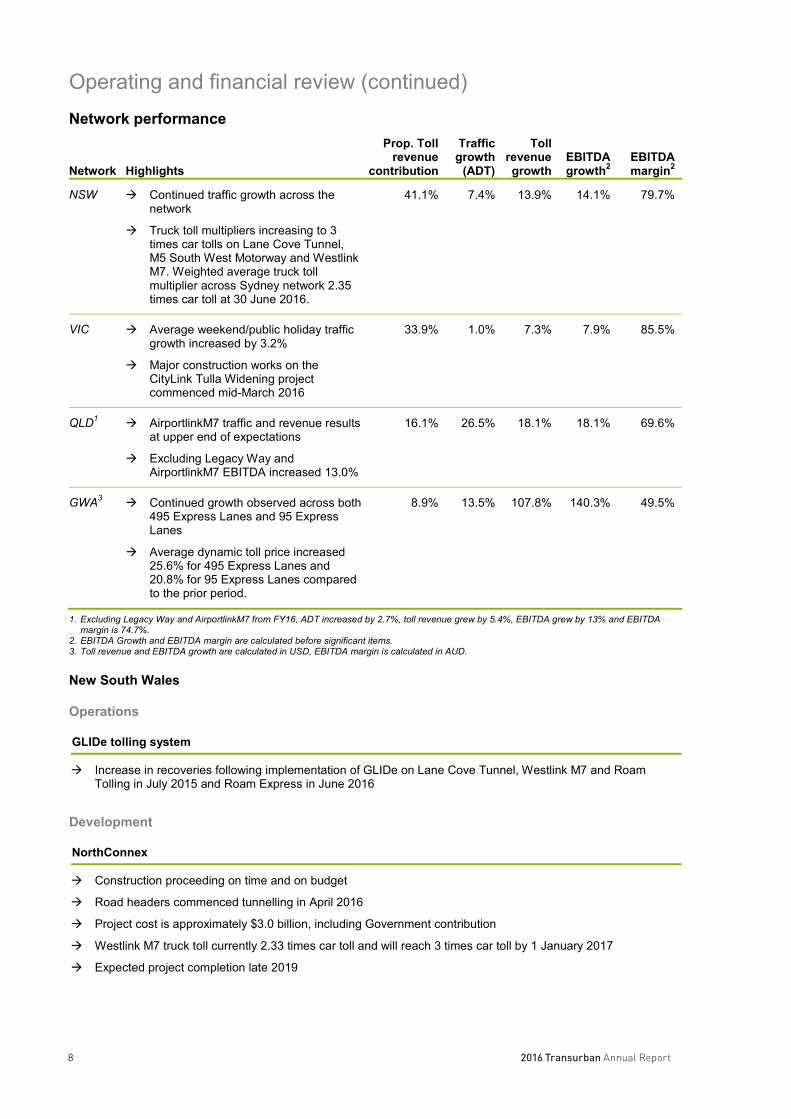
Operating and financial review (continued)Network performance
Network Highlights
Prop. Toll revenue
contribution
Traffic growth
(ADT)
Tollrevenue growth
EBITDA growth2
EBITDA margin2
NSW Continued traffic growth across the network
Truck toll multipliers increasing to 3times car tolls on Lane Cove Tunnel, M5 South West Motorway and Westlink M7. Weighted average truck toll multiplier across Sydney network 2.35 times car toll at 30 June 2016.
41.1% 7.4% 13.9% 14.1% 79.7%
VIC Average weekend/public holiday trafficgrowth increased by 3.2%
Major construction works on the CityLink Tulla Widening project commenced mid-March 2016
33.9% 1.0% 7.3% 7.9% 85.5%
QLD1 AirportlinkM7 traffic and revenue results at upper end of expectations
Excluding Legacy Way and AirportlinkM7 EBITDA increased 13.0%
16.1% 26.5% 18.1% 18.1% 69.6%
GWA3 Continued growth observed across both 495 Express Lanes and 95 Express Lanes
Average dynamic toll price increased 25.6% for 495 Express Lanes and20.8% for 95 Express Lanes compared to the prior period.
8.9% 13.5% 107.8% 140.3% 49.5%
1. Excluding Legacy Way and AirportlinkM7 from FY16, ADT increased by 2.7%, toll revenue grew by 5.4%, EBITDA grew by 13% and EBITDA margin is 74.7%.
2. EBITDA Growth and EBITDA margin are calculated before significant items.3. Toll revenue and EBITDA growth are calculated in USD, EBITDA margin is calculated in AUD.
New South Wales
Operations
GLIDe tolling system
Increase in recoveries following implementation of GLIDe on Lane Cove Tunnel, Westlink M7 and Roam Tolling in July 2015 and Roam Express in June 2016
Development
NorthConnex
Construction proceeding on time and on budget
Road headers commenced tunnelling in April 2016
Project cost is approximately $3.0 billion, including Government contribution
Westlink M7 truck toll currently 2.33 times car toll and will reach 3 times car toll by 1 January 2017
Expected project completion late 2019
92016 Transurban Annual Report9
Operating and financial review (continued)Victoria
Operations
CityLink Operations
Introduction of a Freeway Management System (‘FMS’) that enables Transurban to move from an attendance to an immediate clearance incident response model
Development
CityLink Tulla Widening Western Distributor
Major works commenced in mid-March 2016
Construction proceeding on time and on budget
Project cost is approximately $1.3 billion
Expected project completion early 2018
The Western Distributor is a proposed tunnel and elevated motorway that connects the West Gate Freeway with the Port of Melbourne, CityLink and the central business district, providing an alternative river crossing and easing pressure on West Gate Bridge.
The Reference Design and Request for Tender has been issued to market
Works to commence on Monash Freeway Upgrade in September 2016
Financial close expected by late 2017
Total project cost expected to be approximately $5.5 billion
Queensland
Operations
AirportlinkM7
Financial close reached 1 April 2016
Integration of AirportlinkM7 into Transurban Queensland is largely complete
Customer accounts transitioned to Transurban Queensland in June 2016
Development
Inner City Bypass (‘ICB’) Gateway Upgrade North Logan Enhancement Project
Brisbane City Council has entered into discussions with Transurban Queensland for the potential delivery of the ICB upgrade
Project cost expected to be $80 million
Completion expected in 2018
Transurban Queensland is managing the project on behalf of the Queensland and Federal Governments
Completion is expected in 2018
Entered exclusive negotiationsand design and construction procurement underway
Final business case to be submitted shortly
Project cost expected to be $450 million
Construction expected to commence early 2017 and be completed early 2019
2016 Transurban Annual Report10 10
Operating and financial review (continued)Greater Washington Area
Operations
95 Express Lanes
Full year of operation
Continued ramp up increasing toll pricing and traffic volumes
Development
I-66 I-395 Southern Extensions to 95 Express Lanes
Competitive process underway to design, build, finance, operate and maintain Express Lanes system on I-66
Transurban shortlisted to participate in Request for Proposal (‘RFP’) process
Proposals due October 2016
Agreed development framework with Virginia Department of Transportation (‘VDOT’) to progress 395 Express Lanes project
Estimated project cost approximately US$250 to $300 million
Financial close expected in mid-2017
In-principle agreement with VDOT to extend 95 Express Lanes by 3 kilometres
Capital contribution of US$25 million
Construction to commence September 2016 and is expected to be completed by late 2018
Additional 14 kilometre extension to Fredericksburg under negotiation with VDOTas part of the AtlanticGateway Project
112016 Transurban Annual Report11
Operating and financial review (continued)Equity issueDuring December 2015, the Group successfully completed the fully underwritten institutional and retail components of its renounceable 1 for 18 pro rata entitlement offer. The institutional component raised $726 million and the retail component raised $280 million at an issue price of $9.60 per security. The total proceeds from the entitlement offer were approximately $1,006 million and were used to fund the Group’s equity contribution to the Transurban Queensland acquisition of AirportlinkM7 which occurred in April 2016.
Financing activitiesDuring the reporting period Transurban completed a number of financing activities including:
July 2015 Interlink Roads (operator of the M5) refinanced $742 million of senior secured debt.
September 2015 Transurban Queensland issued USD$641 million of 10, 12 and 15 year US private placement notes and AUD$70 million of 15 year US private placement notes.
November 2015 USD$550 million of corporate senior secured 10 year notes were issued in the US 144A bond market.
March 2016 Transurban Queensland raised AUD$950 million of term bank debt to fund the acquisition of AirportlinkM7.
May 2016 Capital Beltway Express (operator of 495 Express Lanes) refinanced USD$225 million Letters of Credit which support the 495 Express Lane’s senior secured Private Activity Bonds.
May 2016 Lane Cove Tunnel refinanced AUD$260 million of debt facilities and raised an additional AUD$200 million of non-recourse debt facilities.
June 2016 Transurban Queensland issued AUD$280 million of senior secured 7 year notes in the Swiss market.
There were no changes to the Transurban Group ratings provided by Standard and Poor’s Financial Services LLC rating service, Moody’s Investors Services Inc. or Fitch Ratings Inc. during the period.
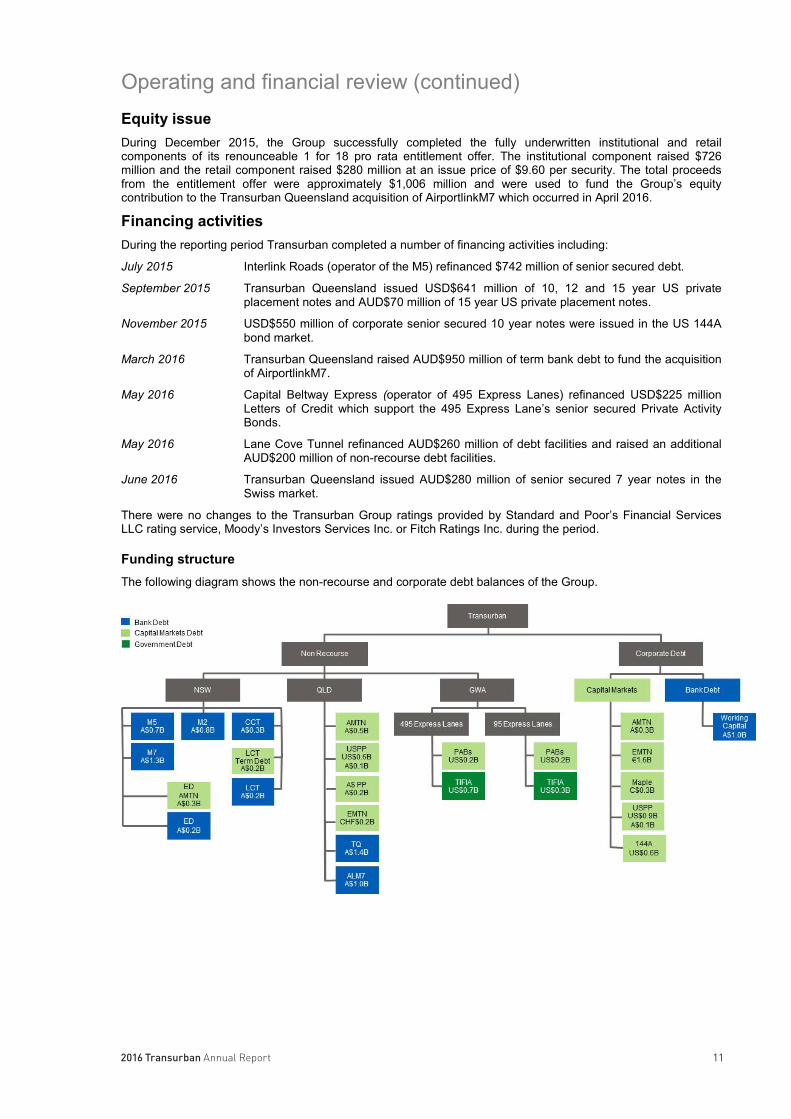
Funding structureThe following diagram shows the non-recourse and corporate debt balances of the Group.

2016 Transurban Annual Report12 12
Operating and financial review (continued)Debt maturity profilesThe following charts show the Group’s current debt maturity profile based on the total facilities available. The charts show the debt in the financial year it matures and in the case of the non-recourse debt, the full value of the debt facilities has been shown as this is the value of debt for refinancing purposes.
The debt values are shown at 30 June 2016, with US, Euro, Canadian and Swiss denominated debt converted at the hedged rate where cross currency swaps are in place. Unhedged US dollar debt has been converted to Australian dollars at spot exchange rate ($0.74 at 30 June 2016).
Corporate debt maturity profile
Non-recourse debt maturity profile
Financial risk managementTransurban’s exposure to financial risk management and its policies for managing that risk can be found in the Financial Risk Management notes in the financial statements – note B15. This section discusses Transurban’s hedging policies, credit risk, interest rate risk and liquidity and funding policies.
132016 Transurban Annual Report13
Operating and financial review (continued)Corporate activities
PeopleAt Transurban we aim to create an environment where our people are encouraged to reach their full potential, and are recognised and rewarded for their achievements. We strive to maintain an open culture where diversity is welcomed and accepted. We want everyone in our workplace to be treated fairly and to feel their contribution is valued. The safety and wellbeing of our employees are central to everything we do as a business. We recognise that, ultimately, our future successes are a direct result of the people who work with us and the contribution they make every day.
We have over 1200 employees located in our four regions, Melbourne, Sydney, Brisbane and Washington, DC. This year, our internal employee opinion survey showed that 77% of employees are proud to work for Transurban. The way we work together and engage with our customers is guided by our values of Integrity, Collaboration, Accountability, Ingenuity and Respect and our survey told us that 90% of our employees believe in the values of the Group.
LeadershipWe support our employees’ career aspirations by offering personal and professional development opportunities. We offer a range of career planning and support programs to suit the many different needs and learning styles of our workforce. We support and encourage eligible employees to pursue further education related to their specific discipline or future career path at Transurban. Through our learning and development framework, eligible employees have access to both study/exam leave and financial assistance.
We are dedicated to the ongoing development of our existing and future leaders. This year, 35 senior leaders attended the annual Senior Leadership Program. The key theme of the program continues to be striving for sustained high performance. There has also been a focus on building greater leadership capability through the middle management group. Activities to support this include the cascading of activities from the Senior Leadership Program; the People Leader Fundamentals program and the continuation of the Realise your Potential program for female managers.
Transurban conducts a bi-annual talent review with the Executive and Senior Leadership teams. This review helps identify high potential individuals who have the ability to move into Senior Leadership or Executive roles, or those who may be able to move laterally outside of their area of technical expertise. In addition, we recognise those individuals with exceptional technical skills that are highly valued by the organisation.
CapabilityWe continue to identify ways to build capability at all layers within the organisation. A key activity throughout FY16 has been to develop a Professional/Technical Career Framework to help support employees in these roles articulate their career pathways and identify development opportunities aligned with this. The inaugural Transurban Graduate Program commenced in February 2016 with Graduates working across Engineering, Technology, Business (Finance), Marketing and HR disciplines. The aim of the program is to attract the next generation of Transurban leaders and professional/technical experts.
We have developed relationships with key universities enabling the establishment of summer internships for engineering and business graduates.
PerformanceAt Transurban we focus on developing a high performance culture through differentiating performance. The Short Term Incentive (‘STI’) program includes formal performance comparisons against peers, which strengthens the link between individual employee performance and Group performance. We offer a range of employee benefits including an employee share scheme and group insurance including salary continuance, death and permanent disablement insurance cover.

2016 Transurban Annual Report14 14
Operating and financial review (continued)WellbeingAt Transurban, we believe that healthy employees contribute to a high performing company. We are committed to keeping our employees safe, and promoting their health and wellbeing so they can enjoy fit and healthy lives, both at work and at home. Our Wellbeing program has five essential elements: health; work; financial; values and staying connected. Creating awareness and education on Mental Health issues has been a focus throughout 2016 and we have trained over sixty employees to be Mental Health First Aiders in every office location in Australia.
The employee volunteer program has continued, which includes the ability for all employees to take one day of paid volunteer leave each year. The Transurban Annual Awards function held in October 2015, recognises achievements of employees in the categories of customer service, diversity, ingenuity, safety, sustainability and overall business excellence.
SustainabilityTransurban's vision ‘to strengthen communities through transport’ is closely supported by our sustainability strategy. We are committed to making sure that our roads help make our cities great places to live and work —both now and in the future.
Transurban’s sustainability strategy has three key pillars:
Be good neighbours: We will work with communities to create shared value with our business by anticipating, listening and responding to community needs;
Use less: We will minimise natural resource use and create resource efficiencies during development, operations and maintenance to reduce the impacts of our operations on the community and environment; and
Think long term: We will look for innovative transport solutions that will create efficient, safe transport networks and thriving cities.
During the period Transurban continued with a range of sustainability initiatives including:
Community partnerships and grants programs;
Two major innovation projects (a more effective road safety barrier design and a noise cancellation and transformation project);
An energy efficiency roadmap to deliver on our ‘10-in-10’ commitment to reduce our energy consumption by 10% by 2023;
Two major road corridor regeneration projects (one each in Melbourne and Sydney); and
Continued public reporting of our sustainability performance.
Transurban provides regular progress reports to the Board on our focus areas. The annual Sustainability Report summarises the year’s activities and outlines commitments for the coming years.
The 2016 Sustainability Report will be published in October 2016 and will be available via the Transurban website.
SafetySafety continues to be a key focus of our business and during this financial year, we worked to integrate and strengthen the links between health, safety and environment (‘HSE’) in order to consider all elements through a holistic risk management approach.
An integrated HSE Policy replaced the previous safety and environment policies. A new event reporting system, Enablon was introduced and implemented during the financial year, to capture and report on HSE events that can be used for trend analysis and to support development of improvement strategies in HSE performance.
There were no employee lost time injuries recorded, and the contractor recordable injury frequency rate finished below target. The employee recordable injury frequency rate finished at 1.1, above our target of 0 and the Road Incident Crash Index finished at 4.6, also slightly above the 4.3 target.
152016 Transurban Annual Report15
Operating and financial review (continued)Business risks and opportunitiesThe following are key opportunities that may impact Transurban’s financial and operating result in future periods:
Ability to leverage capabilities to enhance motorway networks;
Greater than forecast traffic volumes;
Integration of consistent technology and systems to enhance network footprint;
Ability to harness knowledge and experience to drive operations and maintenance;
Identification of new business opportunities in Transurban’s target markets; and
Application of sustainability initiatives to enhance road user and local community experiences.
The following are key risks that may impact Transurban’s financial and operating result in future periods:
Reduced traffic volumes or an inability to grow traffic volumes;
Change in government policies;
Competitor growth or behaviour;
Access to suitable financing arrangements;
Safety incidents through operations or driver behaviour;
Dependency on the services of key contractors and counterparties;
Unfavourable changes to market or operating conditions;
Cyber and information protection; and
Failure of technical infrastructure.
Risk managementManaging risk is an essential part of our business. Key risks are regularly reviewed by the Board, the Audit and Risk Committee and our Executive Committee.
Transurban has a business-wide risk framework in place to help create a consistent and rigorous approach to identifying, analysing and evaluating risks. This framework has various policies, standards and guidelines attached to it, including the Risk Management Policy which can be found in the Corporate Governance section of our website (transurban.com).
The framework is overseen by the Audit and Risk Committee and is actively managed by the Executive Committee. It is consistent with AS/NZ31000:2009 and is subject to regular review by internal audit. Our Audit and Risk Committee Charter is also available in the Corporate Governance section of our website.
Company secretariesAmanda Street LLB (Hons), BComm
Amanda joined Transurban in September 2008 and was appointed as Company Secretary in February 2011. Before joining Transurban, Amanda was Assistant Company Secretary at AusNet Services, and Senior Corporate Counsel at National Australia Bank. She has over 16 years of legal, company secretariat and other relevant experience. Prior to her in-house work, Amanda was a solicitor specialising in M&A work with Australian law firm King & Wood Mallesons.
Julie Galligan LLB, BA
Julie joined Transurban in November 2008 and was appointed as General Counsel in February 2012. Julie has over 16 years' legal experience in private practice and in-house roles in both Australia and the United Kingdom. Prior to joining Transurban, Julie worked in-house at Associated British Ports and at law firms, SJ Berwin LLP and MinterEllison.
2016 Transurban Annual Report16 16
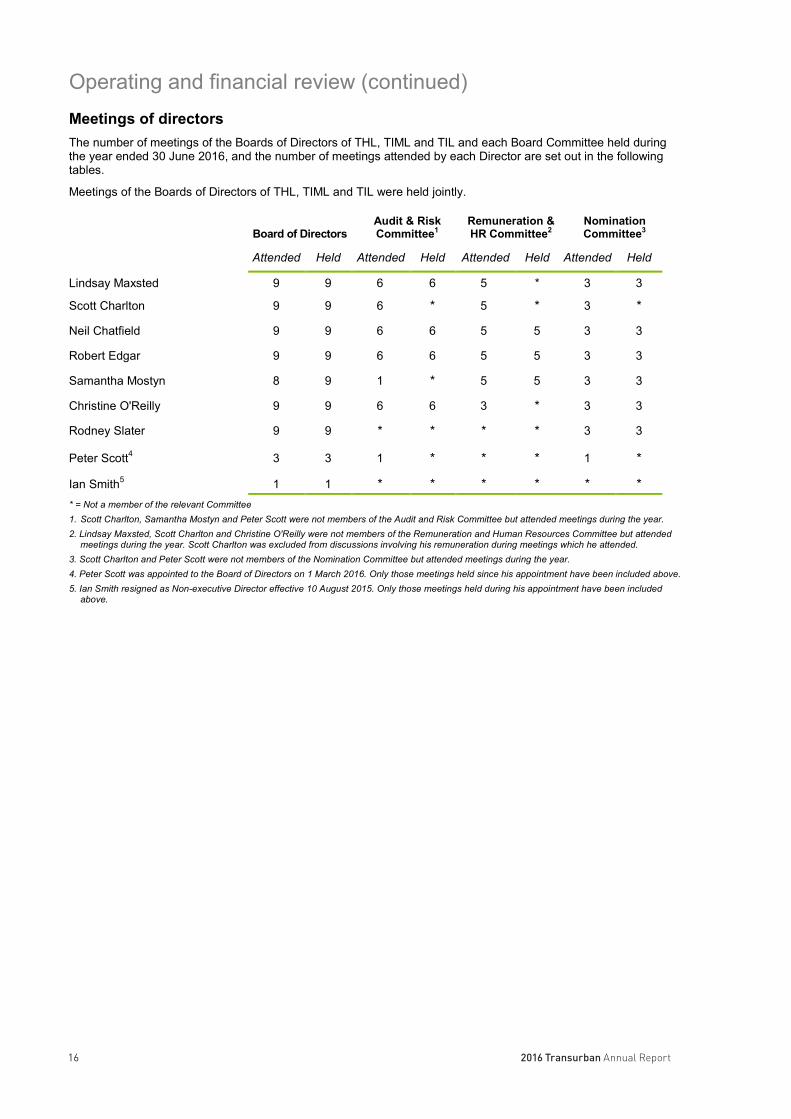
Operating and financial review (continued)Meetings of directorsThe number of meetings of the Boards of Directors of THL, TIML and TIL and each Board Committee held during the year ended 30 June 2016, and the number of meetings attended by each Director are set out in the following tables.
Meetings of the Boards of Directors of THL, TIML and TIL were held jointly.
Board of DirectorsAudit & RiskCommittee1
Remuneration &HR Committee2
NominationCommittee3
Attended Held Attended Held Attended Held Attended Held
Lindsay Maxsted 9 9 6 6 5 * 3 3
Scott Charlton 9 9 6 * 5 * 3 *
Neil Chatfield 9 9 6 6 5 5 3 3
Robert Edgar 9 9 6 6 5 5 3 3
Samantha Mostyn 8 9 1 * 5 5 3 3
Christine O'Reilly 9 9 6 6 3 * 3 3
Rodney Slater 9 9 * * * * 3 3
Peter Scott4 3 3 1 * * * 1 *
Ian Smith5 1 1 * * * * * ** = Not a member of the relevant Committee1. Scott Charlton, Samantha Mostyn and Peter Scott were not members of the Audit and Risk Committee but attended meetings during the year.2. Lindsay Maxsted, Scott Charlton and Christine O'Reilly were not members of the Remuneration and Human Resources Committee but attended
meetings during the year. Scott Charlton was excluded from discussions involving his remuneration during meetings which he attended.3. Scott Charlton and Peter Scott were not members of the Nomination Committee but attended meetings during the year.4. Peter Scott was appointed to the Board of Directors on 1 March 2016. Only those meetings held since his appointment have been included above.5. Ian Smith resigned as Non-executive Director effective 10 August 2015. Only those meetings held during his appointment have been included
above.

172016 Transurban Annual Report17
DirectorsThe following persons were Directors of THL, TIML and TIL during the whole of the financial year and up to the date of this report, unless otherwise stated:
Lindsay MaxstedDip Bus, FCA, FAICDChair and independent Non-executive Director
Director since 1 March 2008. Chair since 12 August 2010.
Chair of the Nomination Committee and a member of the Audit and Risk Committee.
Lindsay is currently Chair and a Non-executive Director of Westpac Banking Corporation, and a Non-executive Director of BHP Billiton Limited and BHP Billiton plc. He is the Managing Director of Align Capital Pty Limited and the Honorary Treasurer of Baker IDI Heart and Diabetes Institute.
Lindsay was formerly a partner of KPMG Australia and was the CEO of that firm from 2001 to 2007. His principal area of practice prior to this was in the corporate recovery field managing a number of Australia’s largest insolvency / workout / turnaround engagements.
As at the date of this report, Lindsay holds interests in 70,258 stapled securities.
Scott CharltonBSci, MBAChief Executive Officer and Executive Director
Director since 16 July 2012. CEO since 16 July 2012.
Scott joined Transurban from Lend Lease, where he was Group COO and Group Director of Operations.
Prior to this, Scott held several senior appointments across a range of infrastructure entities and financial institutions, including as CFO of Leighton Holdings Limited and as Managing Director of Deutsche Bank in Australia and Hong Kong.
Scott is currently Deputy Chair of Infrastructure Partnerships Australia and is a member of the Monash Industry Council of Advisors, the Business Council of Australia, and of Roads Australia.
As at the date of this report, Scott holds interests in 1,047,562 stapled securities, 1,019,868 performance awards (unlisted) and 117,926 STI deferred awards (unlisted).

2016 Transurban Annual Report18 18
Directors (continued)
Neil ChatfieldM.Bus, FCPA, FAICD
Independent Non-executive Director
Director since 18 February 2009.
Chair of the Audit and Risk Committee and a member of the Remuneration and Human Resources Committee and the Nomination Committee.
Neil is an established Executive and Non-executive Director with extensive experience across all facets of company management, and with specific expertise in financial management, capital markets, mergers and acquisitions, and risk management.
Neil is currently the Chair and a Non-executive Director of Seek Limited and Costa GroupHoldings Limited. Neil is also a Non-executive Director of Iron Mountain Inc. and Chair of Launch Housing, a not-for-profit organisation. He was previously a Non-executive Director of Recall Holdings Limited (to May 2016), Chair and a Non-executive Director of Virgin Australia Holdings Limited (to May 2015) and a Non-executive Director of Grange Resources Limited (to April 2014).
Neil previously served as Executive Director and the CFO of Toll Holdings (from 1997 to 2008).
As at the date of this report, Neil holds interests in 59,728 stapled securities.
Robert EdgarBEc (Hons), PhD, FAICD
Independent Non-executive Director
Director since 21 July 2009.
Chair of the Remuneration and Human Resources Committee and a member of the Audit and Risk Committee and the Nomination Committee.
Bob has over 30 years’ experience as a senior executive, with 25 years at ANZ Banking Group in various senior roles, including Deputy CEO, Senior Managing Director, COO, and Chief Economist.
Bob is currently a Non-executive Director of Asciano Group, Linfox Armaguard Pty Ltd and Djerriwarhh Investments. He is Chair of the Hudson Institute of Medical Research. Bob was previously Chair and a Non-executive Director of Federation Centres (to June 2015).
As at the date of this report, Bob holds interests in 32,009 stapled securities.
192016 Transurban Annual Report19
Directors (continued)
Samantha MostynBA, LLBIndependent Non-executive Director
Director since 8 December 2010.
Member of the Nomination Committee and a member of Remuneration and Human Resources Committee.
Sam has significant experience in the Australian corporate sector both in Executive and Non-executive capacities, in particular in the areas of human resources, corporate and government affairs, sustainability management, and diversity.
Sam is currently Chair and a Non-executive Director of Citigroup Pty Limited and a Non-executive Director of Virgin Australia Holdings Limited, Cover-More Group Limited, and the Mirvac Group. She is President of the Australian Council for International Development. Sam is also a Non-executive Director of Australia Council for the Arts and Chair of Carriageworks.
Sam is currently Deputy Chair of the Diversity Council of Australia, and is a member of the NSW Climate Change Council, the advisory boards of ClimateWorks Australia, the Crawford School of Government and Economics, Australian National University and Commissioner of the Business and Sustainable Development Commission.
As at the date of this report, Sam holds interests in 18,215 stapled securities.
Christine O'ReillyBBusIndependent Non-executive Director
Director since 12 April 2012.
Member of the Audit and Risk Committee and the Nomination Committee.
Christine has over 30 years’ experience in the finance and infrastructure sectors in various roles including as Co-Head of Unlisted Infrastructure at Colonial First State Global Asset Management and as CEO of the GasNet Australia Group.
Christine is currently a Non-executive Director of CSL Limited, Energy Australia Holdings Limited, and Medibank Private Limited. She is also a Non-executive Director of Baker IDI Heart and Diabetes Institute and is the Deputy Chair of CARE Australia.
As at the date of this report, Christine holds interests in 20,406 stapled securities.
2016 Transurban Annual Report20 20
Directors (continued)
Rodney SlaterJ.D., BSIndependent Non-executive Director
Director since 22 June 2009.
Member of the Nomination Committee.
Rodney is a partner in the Government Relations and Lobbying, Transportation, Infrastructure and Local Government, and Construction project groups of Washington, DC firm Squire Patton Boggs (US) LLP where he has been a leader of its transportation practice since 2001. He served as US Secretary of Transportation from 1997 until the end of the Clinton Administration in January 2001 and was the Administrator of the Federal Highway Administration between 1993 and 1996.
In the US, Rodney’s current directorships include Kansas City Southern (railroads), Verizon Communications Inc. and Southern Development Bancorporation. He was previously a Director of Parsons Brinckerhoff, Delta Airlines, Northwest Airlines, WS Atkins plc and ICx Technologies Inc. Rodney is a Director of the Congressional Awards Foundation and United Way Worldwide.
As at the date of this report, Rodney holds interests in 3,000 stapled securities.
Peter ScottBE (Hons), M.Eng.Sc, Hon FIEAust, MICEIndependent Non-executive Director
Director since 1 March 2016.
Member of the Nomination Committee from 8 August 2016.
Peter has over 20 years’ of senior business experience in publicly listed companies and considerable breadth and expertise in the engineering and finance sectors. He was formerly the CEO of MLC and head of National Australia Bank’s Wealth Management Division and has held a number of senior positions with Lend Lease.
Peter is currently Chair and a Non-executive Director of Perpetual Limited and of Perpetual Equity Investment Company Limited, Chair of Igniting Change Limited, a not-for-profit organisation and a member of the Prime Minister’s Community Business Partnership. He was previously a Non-executive Director of Stockland Corporation Limited (to August 2016).
As at the date of this report, Peter holds interests in 20,000 stapled securities.
212016 Transurban Annual Report21
Directors (continued)
Ian SmithBE Mining (Hons), BFin AdminIndependent Non-executive Director
Director from 1 January 2012 to 10 August 2015
Ian was previously the Managing Director and CEO of Orica Limited (to March 2015), Managing Director and CEO of Newcrest Mining, the Global Head of Operational and Technical Excellence at Rio Tinto, based in London, and Managing Director of Comalco Aluminium Smelting within the Rio Tinto Group. Prior to this, Ian held senior operational and project management roles with WMC Resources, Pasminco Limited and CRA Limited.
Ian was previously the President of The Australian Mines and Metals Association, Chairman of the Minerals Council of Australia, and a Director of the Australian Chamber of Commerce and Industry.
Ian is a Fellow of both the Institute of Engineers Australia and the Australasian Institute of Mining and Metallurgy - from which he was awarded its highest honour, the Institute Medal, in June 2012.
As at the date of his resignation, Ian held interests in 94,785 stapled securities.
2016 Transurban Annual Report22 22
2016 Remuneration report (audited)IntroductionThe Board is pleased to present the Remuneration Report for the Transurban Group (the Group) for the year ended 30 June 2016 (‘FY16’), prepared in accordance with the Corporations Act 2001 and its regulations. This report contains detailed information regarding the remuneration arrangements for the Directors and senior executives who were key management personnel (‘KMP’) of the Group during FY16.
Key Management Personnel The following table details the Group’s KMP during FY16.
Non-executive Directors
Lindsay Maxsted, Chair
Neil Chatfield
Robert Edgar
Samantha Mostyn
Christine O'Reilly
Peter Scott (from 1 March 2016)
Rodney Slater
Former Non-executive DirectorsIan Smith1
Current senior executives
Scott Charlton, Executive Director and Chief Executive Officer (‘CEO’)
Tony Adams, Group General Manager, Project Delivery and Operational Excellence
Jennifer Aument, Group General Manager, North America
Wesley Ballantine, Group General Manager, Queensland
Andrew Head, Group General Manager, New South Wales
Michele Huey, Group General Manager, Strategy
Sue Johnson, Group General Manager, Customer Operations and Human Resources
Lisa Tobin, Group General Manager, Technology
Vin Vassallo, Group General Manager, Victoria
Adam Watson, Chief Financial Officer
1. Ian Smith resigned as a Non-executive Director effective 10 August 2015.
Contents
Section Page1. Remuneration snapshot 232. Remuneration governance 243. Senior executive remuneration policy and structure 254. Group performance, security holder wealth and remuneration 305. Senior executive remuneration outcomes for FY16 316. Service agreements 33
7. Non-executive Director remuneration 348. Statutory tables 36

232016 Transurban Annual Report23
Remuneration report (continued)1. Remuneration snapshotThe Transurban Board is committed to an executive remuneration framework that is focused on driving a performance culture and linking pay to the achievement of the Group’s strategy and business objectives that in turn drive long term security holder value.
Transurban’s remuneration framework is reviewed annually taking into consideration security holder and other stakeholder feedback, market expectations and regulatory developments.
At the 2015 annual general meeting (‘AGM’), the remuneration framework received strong support from security holders, with a 99.52% vote in favour of the resolution to adopt the 2015 Remuneration Report.
The Board considers that the current remuneration framework offers a range of mechanisms to balance sensible risk management and motivate executives to deliver outstanding results.
The core strategy of the Group is to partner with governments to provide effective and innovative urban road infrastructure. Consistent with this strategy, the Group has significantly expanded its portfolio with acquisitions and development projects in Australia and the USA, leveraging its urban networks and partnering with Governments to develop transport solutions in our core markets of the east coast of Australia and North America. These activities have helped deliver against the Group’s stated objective of growing distributions for security holders.
The remuneration outcomes this year reflect Transurban’s strong financial results and achievements across the Group’s operational and development activities. These results are outlined in more detail in the Operating and Financial Review within the Directors’ Report.
In comparison with the previous financial year, the following results were achieved in FY16:
14.8% increase in underlying proportional EBITDA;
16.4% increase in free cash flow per security;
13.8% increase in distributions paid to security holders;
28.9% increase in security price; and
26.7% increase in proportional net costs (excluding significant items) to support growth in traffic and business activity and the continued focus on technology and customer initiatives.
The Board and the Board’s Remuneration and Human Resources Committee believe that the remuneration outcomes reflect alignment between rewarding senior executive efforts in meeting key targets and recognising security holder outcomes.

2016 Transurban Annual Report24 24
Remuneration report (continued)2. Remuneration governanceA. Board and Remuneration and Human Resources Committee responsibilitiesThe Remuneration and Human Resources Committee assists the Board in fulfilling its responsibilities relating to the remuneration of Non-executive Directors, the remuneration of, and incentives for, the CEO and other senior executives, remuneration budgets for all employees and remuneration practices, strategies and disclosures generally.
It is critical that the Remuneration and Human Resources Committee is independent of management when making decisions affecting employee remuneration. Accordingly, the Committee comprises Non-executive Directors, all of whom are independent. Where appropriate, the CEO and the Group General Manager, Customer Operations and Human Resources attend Committee meetings, however they do not participate in formal decision making.
The members of the Committee are Robert Edgar (Chair), Samantha Mostyn and Neil Chatfield. Further details regarding the Committee are set out in the Directors’ Report.
B. Use of remuneration consultantsThe Remuneration and Human Resources Committee may seek and consider advice from independent remuneration consultants where appropriate. Any advice from consultants is used to guide the Remuneration and Human Resources Committee and the Board, but does not serve as a substitute for thorough consideration by Non-executive Directors.
The Group has a protocol in place governing the appointment of remuneration consultants and the manner in which any recommendations made by those consultants concerning the remuneration of KMP are to be provided to the Group, and in particular the circumstances in which management may be given access to those recommendations. The purpose of the protocol is to ensure that any remuneration recommendations provided by consultants are provided without undue influence by KMP.
During FY16, consultants did not provide the Remuneration and Human Resources Committee with remuneration recommendations relating to KMP. Benchmark data only was provided to the Committee.
C. Dealing in securitiesIn accordance with the Group’s Dealing in Securities Policy, employees who have awards under a Group equity plan may not hedge against those awards. In addition, senior executives may not hedge against entitlements that have vested but remain subject to a holding lock. Employees and Directors are not permitted to obtain margin loans using Transurban securities (either solely or as part of a portfolio) as security for loans.

252016 Transurban Annual Report25
Remuneration report (continued)3. Senior executive remuneration policy and structureThe Group’s executive remuneration strategy is designed to attract, retain and motivate a highly qualified and experienced management team with the necessary skills and attributes to lead the Group in achieving its business objectives. The strategy also aims to encourage management to strive for superior performance by rewarding the achievement of targets that are challenging, clearly understood, and within the control of individuals to achieve through their own success.
A. Remuneration frameworkThe Group’s remuneration framework provides a combination of incentives intended to drive performance against the Group’s short and longer term objectives. The framework for each senior executive comprises three components:
• Total Employment Cost (‘TEC’): fixed remuneration component comprising salary, superannuation and other prescribed benefits;
• Short Term Incentive (‘STI’): an ‘at risk’ component, awarded on performance over a 12 month period against pre-determined individual and Group performance measures that comprises both a cash component and a component deferred into equity; and
• Long Term Incentive (‘LTI'): an ‘at risk’ equity component, awarded on the achievement of pre-determined internal and external performance measures over a three year period.
B. Remuneration mixA significant proportion of senior executive remuneration is ‘at risk’ to provide alignment with the interests of security holders and to drive performance. The remuneration mix is designed to achieve a balanced reward for achievement of immediate objectives and the creation of long term sustainable value. The remuneration mix at target performance for senior executives is outlined in the diagram below.
C. Fixed total employment cost (‘TEC’)Fixed TEC is set with reference to the market median, using the ASX 10-30 as the primary reference.Remuneration packages (including TEC levels) are reviewed annually by the Remuneration and Human Resources Committee taking into consideration an individual's role, experience and performance, as well as relevant comparative market data provided by remuneration consultants. TEC levels are also reviewed on a change in role.
Changes to CEO remuneration package effective FY2017
Following a review of the CEO’s FY2016 remuneration package with the relevant comparator group, the Board has approved a revised remuneration package for the CEO, effective 1 July 2016. The revised package includes an increase in the CEO’s fixed remuneration of 3.69% to $2.2 million as well as a revised remuneration mixresulting in an increase to his total remuneration package. The revised package better aligns the CEO’s total remuneration to the market through an appropriate weighting for each remuneration component, strongly aligningthe achievement of the Group’s strategy and security holder value. The revised remuneration mix is weighted 33% for fixed annual remuneration; 33% for variable STI (50% continues to be deferred); and 34% for variable LTI.
40%
15%15%
30%
CEO target remuneration mix
45%
15%
15%
25%
Senior executive target remuneration mix
Fixed annual remuneration
Variable STI - cash
Variable STI - deferred
Variable LTI

2016 Transurban Annual Report26 26
Remuneration report (continued)D. Short term incentive (‘STI’)
Description Eligible permanent Group employees, including the CEO and other senior executives, participate in the annual STI plan, which puts a proportion of remuneration 'at risk' subject to meeting specific pre-determined Group and individual performance measures linked to Group objectives.
Performance Period
The performance period is the financial year preceding the payment date (i.e. 1 July 2015 – 30 June 2016).
Opportunity For ‘at-target’ performance, the CEO has the opportunity to receive 75% of TEC and all other senior executives have the opportunity to receive 67% of TEC. The minimum STI an individual can receive is 0% (if targets are not met) and the maximum is 150% of the STI opportunity, which is only awarded for exceptional performance.
Payment and deferral
The awarded STI for the CEO and other senior executives is settled 50% in cash and 50% is deferred. For Australian employees, the deferral component is into fully paid Transurban securities, which are held on trust for two years following the performance year and are restricted from trading until vesting. USA employees are awarded deferred cash awards (due to legal restrictions on the issue of securities to USA residents). The deferred securities and deferred cash awards participate in dividends and/or distributions paid.
The number of securities or awards is determined by dividing the amount to be deferred by a 20 day Volume Weighted Average Price (VWAP) of securities up to and including the last business day of the performance period.
Performance measures
Performance measures are a mix of Group and individual measures. The diagram below illustrates the weighting of the two performance measures.
Individual KPIs are unique to the individual’s area of accountability. Individuals have a clear line of sight to KPIs and are able to directly affect outcomes through their own actions.
The total STI performance outcome is calculated: (Individual STI Outcome % + (Individual STI Outcome % x Group Outcome %)) ÷ 2.
How is the annual pool determined
The Board approves a total pool to be distributed which is the sum of all eligible employees’ possible STI outcomes at target (TEC x STI opportunity). One half of this sum represents the individual component of the STI (capped at 100%) and the second half is multiplied by the Group’s performance outcome to represent the Group’s performance component (capped at 150%). The overall pool is capped at 125%. The Board has discretion as to the proportion of the pool that will be distributed each year.
Vesting Performance against Group measures is assessed by the Board and the results of key elements are independently validated.
The Board confirms final outcomes for individual and Group performance and has discretion to make adjustments to the performance conditions and outcomes.
Payment of STI The payment of the cash component and the allocation of deferred securities and cash awards (USA residents) will occur in August 2016 following finalisation and approval of the audited Group results and the Board’s approval of individual outcomes.
Cessation of employment
If employment ceases before performance is assessed, generally there is no entitlement to receive any STI award. Any unvested deferred securities will lapse, unless the plan rules provide otherwise or the Board otherwise resolves.
Clawback Fraudulent or dishonest behaviour will result in the forfeiture or clawback of any unvested awards. Further, at the discretion of the Board awards are subject to forfeiture or clawback where there is a financial misstatement circumstance or the allocation of awards was made in error, on the basis of the misrepresentation or an omission, or on the basis of facts or circumstances that were later proven to be untrue or inaccurate.
272016 Transurban Annual Report27
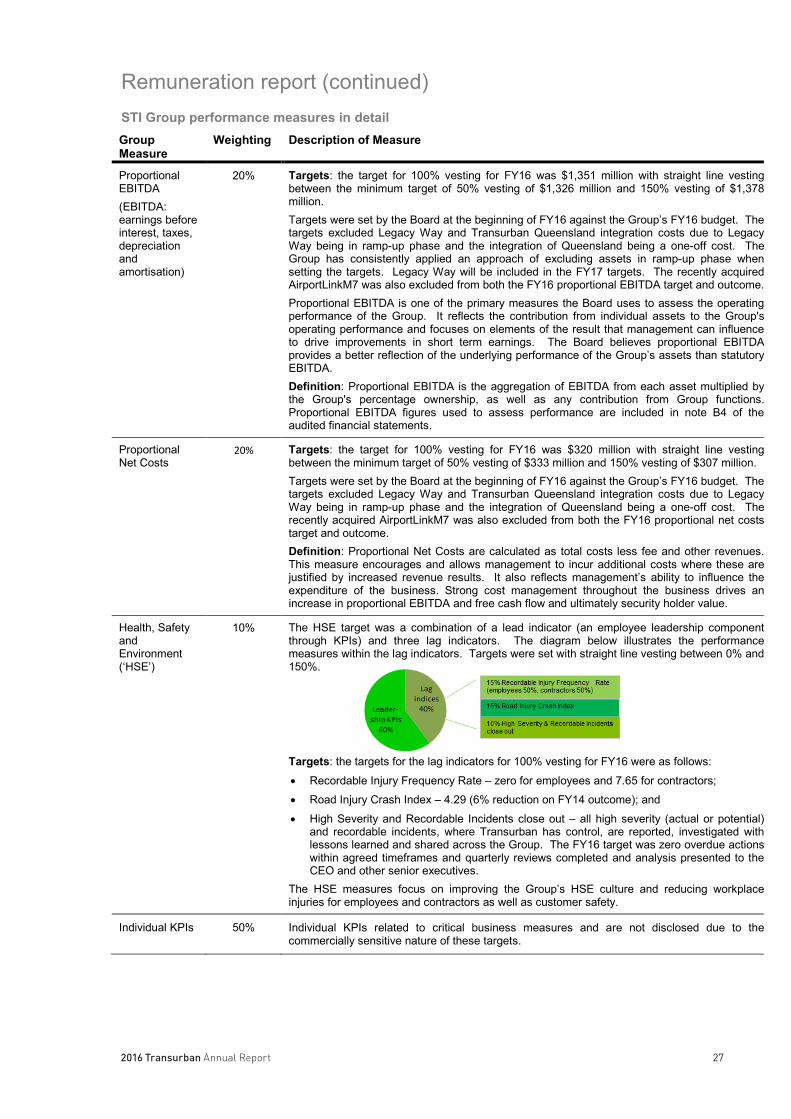
Remuneration report (continued)STI Group performance measures in detailGroup Measure
Weighting Description of Measure
Proportional EBITDA (EBITDA: earnings before interest, taxes, depreciation andamortisation)
20% Targets: the target for 100% vesting for FY16 was $1,351 million with straight line vesting between the minimum target of 50% vesting of $1,326 million and 150% vesting of $1,378 million.Targets were set by the Board at the beginning of FY16 against the Group’s FY16 budget. The targets excluded Legacy Way and Transurban Queensland integration costs due to Legacy Way being in ramp-up phase and the integration of Queensland being a one-off cost. The Group has consistently applied an approach of excluding assets in ramp-up phase when setting the targets. Legacy Way will be included in the FY17 targets. The recently acquired AirportLinkM7 was also excluded from both the FY16 proportional EBITDA target and outcome. Proportional EBITDA is one of the primary measures the Board uses to assess the operating performance of the Group. It reflects the contribution from individual assets to the Group's operating performance and focuses on elements of the result that management can influence to drive improvements in short term earnings. The Board believes proportional EBITDA provides a better reflection of the underlying performance of the Group’s assets than statutory EBITDA.Definition: Proportional EBITDA is the aggregation of EBITDA from each asset multiplied by the Group's percentage ownership, as well as any contribution from Group functions. Proportional EBITDA figures used to assess performance are included in note B4 of the audited financial statements.
Proportional Net Costs
20% Targets: the target for 100% vesting for FY16 was $320 million with straight line vesting between the minimum target of 50% vesting of $333 million and 150% vesting of $307 million.Targets were set by the Board at the beginning of FY16 against the Group’s FY16 budget. The targets excluded Legacy Way and Transurban Queensland integration costs due to Legacy Way being in ramp-up phase and the integration of Queensland being a one-off cost. The recently acquired AirportLinkM7 was also excluded from both the FY16 proportional net costs target and outcome. Definition: Proportional Net Costs are calculated as total costs less fee and other revenues. This measure encourages and allows management to incur additional costs where these are justified by increased revenue results. It also reflects management’s ability to influence the expenditure of the business. Strong cost management throughout the business drives an increase in proportional EBITDA and free cash flow and ultimately security holder value.
Health, Safety andEnvironment (‘HSE’)
10% The HSE target was a combination of a lead indicator (an employee leadership component through KPIs) and three lag indicators. The diagram below illustrates the performance measures within the lag indicators. Targets were set with straight line vesting between 0% and 150%.
Targets: the targets for the lag indicators for 100% vesting for FY16 were as follows:
• Recordable Injury Frequency Rate – zero for employees and 7.65 for contractors;
• Road Injury Crash Index – 4.29 (6% reduction on FY14 outcome); and
• High Severity and Recordable Incidents close out – all high severity (actual or potential) and recordable incidents, where Transurban has control, are reported, investigated with lessons learned and shared across the Group. The FY16 target was zero overdue actions within agreed timeframes and quarterly reviews completed and analysis presented to the CEO and other senior executives.
The HSE measures focus on improving the Group’s HSE culture and reducing workplace injuries for employees and contractors as well as customer safety.
Individual KPIs 50% Individual KPIs related to critical business measures and are not disclosed due to the commercially sensitive nature of these targets.

2016 Transurban Annual Report28 28
Remuneration report (continued)E. Long term incentive (‘LTI’)
Description Participation in the LTI plan is offered to the CEO and other senior executives, and a very limited number of other employees nominated by the CEO and approved by the Board.
Grants are made in the form of performance awards at no cost to the recipient. Each performance award is an entitlement to receive a fully paid Transurban security, or an equivalent cash payment, on terms and conditions determined by the Board, subject to the achievement of vesting conditions.
Performance Period
The three financial years commencing on 1 July in the year the grant is issued.
Opportunity The CEO’s opportunity is 75% of TEC and the opportunity for all other senior executives is 56% of TEC.
Performance measures
Two performance measures are used to determine the number of awards that will vest at the end of the performance period; relative Total Shareholder Return (‘TSR’) against a bespoke comparator group, and Free Cash Flow (‘FCF’) (each with a 50% weighting).
Allocation TSR component: An independently determined fair value allocation valuation is applied to this component of the LTI.
FCF component: An independently determined face value allocation valuation (discounted for distributions and/or dividends foregone throughout the performance period) is applied to this component of the LTI.
The Board regularly considers the most appropriate measures for the Group and believe that fair value is the correct measure for the TSR component of the LTI awards as it’s a market based measure and the inclusion of market forces within the discounting calculation is appropriate. Whereas the non-market based performance measure of FCF is more suited to a face value valuation when allocating LTI awards.
Vesting TSR component
The Group uses an independent report that sets out the Group's TSR growth and that of each company in the bespoke comparator group. A VWAP of securities for the 20 trading days up to and including the testing date is used to calculate TSR.
The level of TSR growth achieved by the Group is given a percentile ranking having regard to the Group’s performance compared to the performance of other companies in the comparator group (the highest ranking company is ranked at the 100th percentile). This ranking determines the extent to which performance awards subject to this target vest.
FCF component
The Group's FCF per security percentage growth rate is calculated based on the FCF per security over the three year performance period.
The Board determines in its absolute discretion whether the performance awards are settled in Transurban securities or a cash payment of equivalent value. Due to legal restrictions on the issue of securities to USA residents, the USA senior executive receives a cash payment upon vesting.
The maximum vesting following these tests is capped at 100% of awards issued.
Following testing, any awards that do not vest, lapse and any awards that vest are automatically exercised.
Cessation of employment
If employment ceases before the performance measures are tested, generally there is no entitlement to unvested performance awards. Any unvested awards will lapse, unless the plan rules provide otherwise or the Board otherwise resolves.
Clawback Fraudulent or dishonest behaviour will result in the forfeiture or clawback of any unvested awards. Further, at the discretion of the Board awards are subject to forfeiture or clawback where there is a financial misstatement circumstance or the allocation of awards was made in error, on the basis of the misrepresentation or an omission, or on the basis of facts or circumstances that were later proven to be untrue or inaccurate.

292016 Transurban Annual Report29
Remuneration report (continued)LTI performance measures in detail
Group Measure Weighting Description of measure
Relative TSR 50% TSR is a relative, external, market-based performance measure against those companies with which the Group competes for capital. It provides a direct link between executive reward and security holder return. TSR measures total return on investment of a security, taking into account both capital appreciation and distributed income which was reinvested on a pre-tax basis.
Relative TSR is measured against a bespoke comparator group comprising companies in the transport, utilities, real estate, construction and infrastructure Global industry classification standards (‘GICS’) sectors of the ASX 150. The 36 companies in this group for grants made during FY16 were:
Abacus Property Group, AGL Energy Limited, Asciano Limited, APA Group, Aurizon Holdings Limited, Aveo Group, BWP Trust, CIMIC Group Limited, Cromwell Property Group, Charter Hall Group, Charter Hall Retail REIT, DUET Group, Dexus Property Group, Federation Centres, Goodman Group, GPT Group, Growthpoint Properties Australia Limited, iiNet Limited, Investa Office Fund, Lend Lease Group, M2 Group Limited, Macquarie Atlas Roads Group, Mirvac Group, Qantas Airways Limited, Qube Holdings Limited, Scentre Group Limited, Shopping Centres Australasia Property Group, Stockland, Spark Infrastructure Group, Spark New Zealand Limited, AusNet Services, Sydney Airport, Transurban Group, Telstra Corporation Limited, TPG Telecom Limited, Westfield Corporation.
The TSR component of performance awards granted during FY16, will vest on a straight line basis in accordance with the following table:
The Group’s relative TSR ranking in the comparator group % of performance awards that vest
At or below the 50th percentile Zero
Above the 50th percentile but below the 75th percentile
Straight line vesting between 50 and 100
At or above the 75th percentile 100
Growth in FCF per security
50% Growth in FCF per security reflects the Group’s continued focus on the maximisation of free cash.
The FCF calculation is included in note B10 of the audited financial statements.
The FCF per security component of performance awards granted during FY16 will vest based on the Group’s compound annual growth targets translated into annual FCF per security over the three year performance period, as set out below:
% annual growth in FCF per security (FCF base of 40.2 cents per security) % of performance awards that vest
Less than 8% ZeroBetween 8% and 11% Straight line vesting between 50 and 10011% or more 100
For performance awards granted during FY17, the performance target range for growth in FCF per security is between 9% and 12% per annum. This is calculated using the FY16distribution of 45.5 cents per security as the base.
The target reflects the Group’s focus on the maximisation of free cash to drive security holder return. Transurban’s distribution policy has been to align distributions with FCF per security; however, free cash coverage may vary from year to year. Owing to a range of factors, the distribution is considered the best point of alignment with security holders’ expectation for growth in free cash.1
1. Using FY16 reported FCF of 46.8 cents per security as the base, the performance target range for growth in FCF per security is between7.5% and 10.5% per annum. The Group’s compound annual growth targets over the three year performance period remain the same regardless of which base is used.

2016 Transurban Annual Report30 30
Remuneration report (continued)4. Group performance, security holder wealth and remuneration
A. Financial highlights for FY16The Group’s network portfolio delivered strong EBITDA growth which was mainly caused by increased traffic across our networks and disciplined cost control. The Group recorded proportional EBITDA excluding significant items of $1,480 million for the financial year ended 30 June 2016, an underlying increase of 14.8% on the prior corresponding period.
B. Overview of Group performanceThe variable (or 'at risk') remuneration of the CEO and other senior executives is linked to the Group’s performance through the use of measures based on the operating performance of the business. The graphs below show the Group’s performance over the past five years including metrics used to determine components of STI and LTI awards.
Financial measures
160 163 183
270
342
0
50
100
150
200
250
300
350
400
2012 2013 2014 2015 2016
Proportional Net Costs excluding significant items ($ millions)
784 828934
1,289 1,480
0
200
400
600
800
1,000
1,200
1,400
1,600
2012 2013 2014 2015 2016
Underlying proportional EBITDA ($ millions)
29.8 30.1
33.9
40.2
46.8
25
30
35
40
45
50
2012 2013 2014 2015 2016
Free Cash per security (cents)
29.5 31.0
35.0
40.0
45.5
20
25
30
35
40
45
50
2012 2013 2014 2015 2016
Distributions paid per security (cents)
5.696.76 7.39
9.30
11.99
0
2
4
6
8
10
12
14
2012 2013 2014 2015 2016
Security price at year end ($)
15
25
17
3235
0
10
20
30
40
2012 2013 2014 2015 2016
Total security holder return performance (%)

312016 Transurban Annual Report31
Remuneration report (continued)5. Senior executive remuneration outcomes for FY16
A. STI Outcomes for FY16Group performance in respect of the proportional EBITDA, proportional Net Costs and HSE STI performance measures for FY16 was assessed by the Board as 116.5% of the possible STI opportunity.
Measure Performance Outcome
Proportional EBITDA1 $1,471 million 150.0%Proportional net costs1 $319 million 104.6%HSE – 73.4%
Overall Group Performance – 116.5%
1. For FY16 Legacy Way and the Transurban Queensland transaction and integration costs were excluded from the Proportional EBITDA and Proportional net costs targets and actual outcomes. Also excluded from the performance outcomes is the AirportlinkM7 which was acquired by Transurban Queensland in April 2016.
The Group achieved the following HSE outcomes which are linked to the Group’s STI awards.
Measure Score Outcome % STI Outcome %
Leadership 3.1 79.0 47.4Recordable Injury Frequency Rate (‘RIFR’)1 – employees 1.1 85.3 6.4Recordable Injury Frequency Rate (‘RIFR’)1 – contractors 7.1 111.0 8.3Road Injury Crash Index (‘RICI’)2 4.6 0.0 0.0High Severity and Recordable Incidents 30 incidents 113.3 11.3Overall HSE Outcome 73.4
1. RIFR: recordable injuries (fatalities, lost time and medical treatment injuries) per million work hours.
2. RICI: serious road injury (requiring medical treatment or where emergency medical care is required, other than first aid) crashes per 100 million vehicle kilometres travelled.
The individual STI performance outcomes and awards for the CEO and senior executives for FY16 are detailed in the following table:
1. Jennifer Aument is remunerated in USA Dollars. Her awarded STI has been translated to Australian Dollars using the exchange rate at 30 June 2016.
2. The maximum possible total value of the FY16 STI award is the combined value of the cash and deferred STI award and is capped at 150% of the STI opportunity. In accordance with this cap, the STI opportunities for Scott Charlton, Wes Ballantine and Vin Vassallo have been capped at 150% and the STI awarded as shown in the table above is in accordance with this cap. The minimum possible total value of the grant is zero.
3. The total STI performance outcome is calculated: (Individual STI Outcome % + (Individual STI Outcome % x Group Outcome %)) ÷ 2. The Group’s percentage outcome is 116.5%.
4. 50% is paid in cash and 50% is deferred for two years following the performance year.
STI outcome (%) STI awarded4 ($) STI forfeited (%)
Current senior executives Individual KPIs Total3
S Charlton2 140.0 150.0 2,386,950 –T Adams 110.0 119.1 426,550 –J Aument1 120.0 129.9 572,313 –W Ballantine2 140.0 150.0 552,750 –A Head 93.0 100.7 444,750 –M Huey 120.0 129.9 429,500 –S Johnson 110.0 119.1 422,900 –L Tobin 93.0 100.7 375,400 –V Vassallo2 150.0 150.0 603,000 –A Watson 93.0 100.7 450,700 –

2016 Transurban Annual Report32 32
Remuneration report (continued)STI deferred securities and cash awards granted in FY16
Balanceat startof year
Granted during year as remuneration
Maturedand paid
during year
Forfeited during
the year
Balance at the end
of year
Current senior executives
S Charlton 245,695 117,926 108,486 – 255,135
T Adams 40,979 20,574 18,754 – 42,799
J Aument 35,722 27,073 14,282 – 48,513
W Ballantine 44,687 24,322 17,328 – 51,681
A Head 54,018 30,513 15,202 – 69,329
M Huey1 – 7,398 – – 7,398
S Johnson 39,349 20,932 21,288 – 38,993
L Tobin 29,674 23,693 6,612 – 46,755
V Vassallo 36,751 26,643 6,612 – 56,782
A Watson1 – 12,847 – – 12,8471. Michele Huey and Adam Watson had a zero opening balance at the beginning of FY16, as they joined the Group during FY15. Their STI
outcome for FY15 was pro-rated in accordance with their commencement dates.
B. LTI Outcomes for FY16Eligible senior executives (excluding the CEO) received performance awards with a grant date of 17 August 2015. Following the receipt of security holder approval at the 2015 AGM, the CEO received performance awardswith a grant date of 2 November 2015. All performance awards granted in FY16 may vest subject to a performance period from 1 July 2015 through to 30 June 2018.
The relevant values of the grants are as follows:
Recipient Grant date Value of awardsat grant date
Closing security price at grant date
Relative TSR1
FCF per security
Eligible senior executives 17 August 2015 $4.52 $8.65 $9.77
CEO 2 November 2015 $5.12 $9.33 $10.44
1. Fair value in accordance with AASB 2 treatment of market conditions.
Performance awards granted in FY16
Number of performance awards granted
Potential value of grant yet to vest1
($)Current senior executives
S Charlton 292,441 1,933,027
T Adams 55,019 328,836
J Aument 65,155 389,417
W Ballantine 56,603 338,304
A Head 67,857 405,566
M Huey 50,784 303,524
S Johnson 54,545 326,005
L Tobin 57,273 342,309
V Vassallo 61,749 369,060
A Watson 68,768 411,0111. The maximum value of the grant has been estimated based on the award valuations at grant date (a fair value approach for the TSR
component and a face value approach discounted for distributions/and or dividends for the FCF component). The minimum total value of the grant, if the applicable performance measures are not met, is zero.

332016 Transurban Annual Report33
Remuneration report (continued)Value of performance awards vested and lapsed in FY16
The FY13 LTI plan vested on 13 August 2015 (performance period 1 July 2012 to 30 June 2015).
The outcome of the performance tests were as follows:
Test type Result of test % units vest
TSR Transurban ranked 8 out of 31 companies (76.66%) 100%Cash Flow 104.2 cents adjusted to 108.3 cents
(100% vesting target was 106.5 cents) 100%Overall vesting 100%
Senior Executive Awards Vested Value ($)1
S Charlton 448,400 1,848,114A Head 112,754 427,605
1. Based on the fair value at date of grant.
Financial close of the Transurban Queensland (‘TQ’) (formerly, Queensland Motorways) acquisition occurred in July 2015. The associated capital raising (the issue of 404.5 million new securities) occurred in May 2015. The timing of these events (two different financial years) impacted the calculation of the FCF for FY14 and the FCF performance calculation against the FCF targets for the three LTI plans on foot at that time (the FY12, FY13 and FY14 plans).
Consistent with the treatment of the FY12 LTI plan, as disclosed in the FY14 Remuneration Report, the Board exercised its discretion to ensure that participants in the FY13 LTI plan were neither advantaged nor disadvantaged as a result of the TQ acquisition and associated capital raising. The Board exercised its discretion to, in effect, exclude the new securities issued from the number of securities used to calculate the FY14 FCF per security for the purposes of calculating the FCF outcome for the FY13 LTI plan. Interest income on the equity raised prior to financial close was similarly excluded from the calculation. The targets set at the beginning of the performance period (1 July 2012) were not adjusted.
Value of performance awards vested and lapsed in FY17
Initial vesting calculations indicate that 100% of awards on issue for the FY14 plan will vest for all remaining participants.
6. Service agreementsThe remuneration and other terms of employment for the CEO and other senior executives are formalised in service agreements that have no specified term. Under these agreements, the CEO and other senior executives are eligible to participate in STI and LTI plans. Some other key aspects of the agreements in place for FY16 are outlined below:
Period of notice to terminate (executive)
Period of notice to terminate (the Group)1
CEO 6 months 12 monthsOther senior executives 3 months 6 months1. Payment in lieu of the notice period may be provided (based on the executive's fixed remuneration). The Group may also terminate at any time
without notice for serious misconduct.

2016 Transurban Annual Report34 34
Remuneration report (continued)7. Non-executive Director remuneration
A. Remuneration policyThe diagram below sets out the key objectives of the Group’s Non-executive Director remuneration policy and how they are achieved through the Group’s remuneration framework:
Securing and retaining talented, qualified Directors
Preserving independence and impartiality
Aligning Director and security holder interests
Director fee levels are set with regards to: the responsibilities and risks attached to the role, the time commitment and workload expected, the Director’s experience and expertise, and market benchmark data.
Director remuneration consists of base (Director) fees and Committee fees. No element of Director remuneration is 'at risk' (i.e. fees are not based on the performance of the Group or individual Directors from year to year).
Directors are encouraged to hold Transurban securities and the Board has recently endorsed guidelines in respect of Director security holdings.
B. Remuneration arrangementsThe Remuneration and Human Resources Committee regularly reviews Non-executive Director remuneration arrangements, which includes periodic benchmarking against other publicly listed entities of similar size and complexity to Transurban.
The amount of aggregate remuneration that may be paid to Non-executive Directors in any year is capped at a level approved by security holders. The current aggregate fee pool of $2,400,000 per year (inclusive of superannuation contributions) was approved by security holders at the 2010 AGM.
A review of Non-executive Director fees (base Director and Committee fees) was undertaken during FY16 having regard to both the remuneration policy described above and market benchmark data. Following the review, certain fees were increased (effective 1 January 2016) in line with market benchmarks. A review of the aggregate fee pool was subsequently undertaken and as a result, the Board has approved that security holder approval be sought at the 2016 AGM to increase the aggregate fee pool to $3,000,000. The increase is required to ensure adequate headroom allowing the Board flexibility to make additional Non-executive Director appointments, and to facilitate appropriate and coordinated Board succession planning.
Base Director and Committee fees per year are set out below:
1 July 2015 1 January 2016
Board Fees Chair 505,000 550,000
Member 170,000 185,000Committee Fees Audit and Risk Committee
Chair 48,000 50,000Member 25,000 25,000Remuneration and Human Resources CommitteeChair 35,000 40,000Member 20,000 20,000Nomination Committee 10,000 10,000
The Chair of the Board does not receive any additional fees for Committee responsibilities.
The Chair of each Committee only receives the Chair fee (and not a member fee).
Non-executive Directors are permitted to be paid additional fees for special duties or exertions. No such fees were paid during FY16. Non-executive Directors are also entitled to be reimbursed for all business related expenses, including travel, as may be incurred in the discharge of their duties.
Non-executive Directors are not entitled to any retirement benefits.
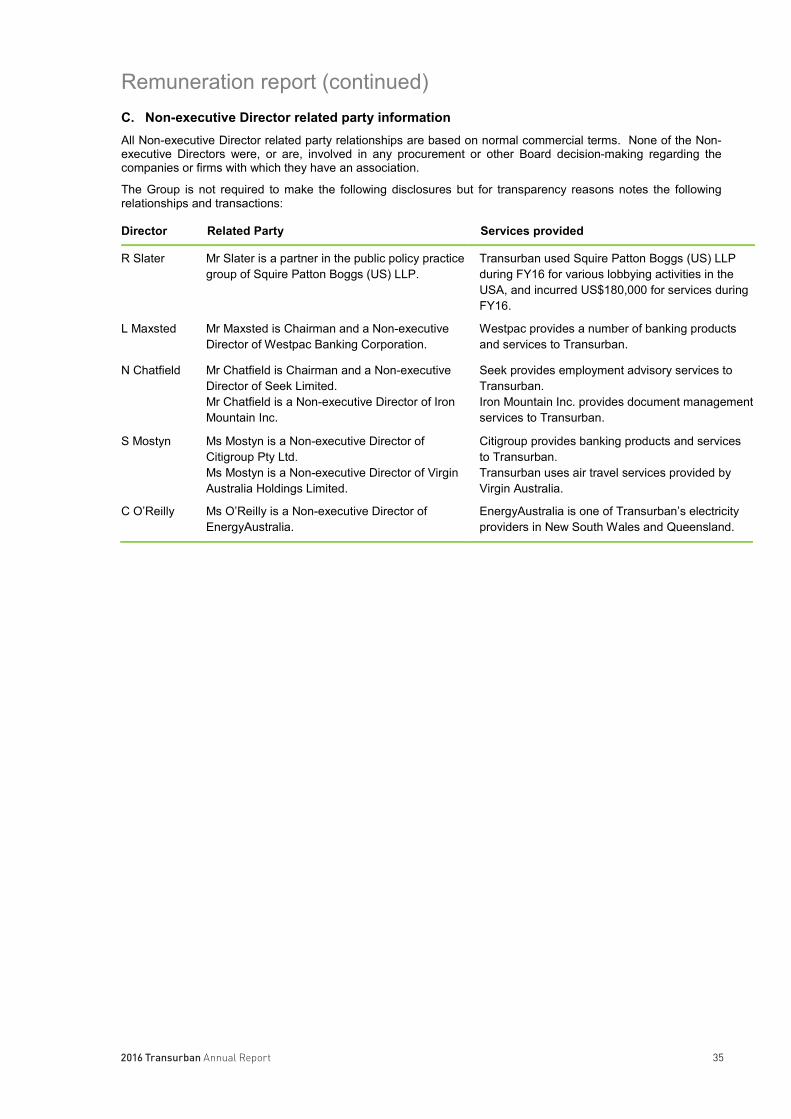
352016 Transurban Annual Report35
Remuneration report (continued)C. Non-executive Director related party informationAll Non-executive Director related party relationships are based on normal commercial terms. None of the Non-executive Directors were, or are, involved in any procurement or other Board decision-making regarding the companies or firms with which they have an association.
The Group is not required to make the following disclosures but for transparency reasons notes the following relationships and transactions:
Director Related Party Services provided
R Slater Mr Slater is a partner in the public policy practice group of Squire Patton Boggs (US) LLP.
Transurban used Squire Patton Boggs (US) LLP during FY16 for various lobbying activities in the USA, and incurred US$180,000 for services during FY16.
L Maxsted Mr Maxsted is Chairman and a Non-executive Director of Westpac Banking Corporation.
Westpac provides a number of banking products and services to Transurban.
N Chatfield Mr Chatfield is Chairman and a Non-executive Director of Seek Limited.Mr Chatfield is a Non-executive Director of Iron Mountain Inc.
Seek provides employment advisory services to Transurban.Iron Mountain Inc. provides document management services to Transurban.
S Mostyn Ms Mostyn is a Non-executive Director of Citigroup Pty Ltd. Ms Mostyn is a Non-executive Director of Virgin Australia Holdings Limited.
Citigroup provides banking products and services to Transurban.Transurban uses air travel services provided by Virgin Australia.
C O’Reilly Ms O’Reilly is a Non-executive Director of EnergyAustralia.
EnergyAustralia is one of Transurban’s electricity providers in New South Wales and Queensland.

2016 Transurban Annual Report36 36
Remuneration report (continued)8. Statutory tables
A. Senior executive remuneration
Short-term employee benefits Deferred STI5
Post-employment
benefits
Long-term
benefitsShare based
benefits6 Total
Cash salary
and feesCash STI3
Non-monetary benefits4
SuperannuationLong
service leave
Equity awards
Cash awards
Current CEOS Charlton2016 2,102,392 1,193,475 13,024 1,120,400 19,308 8,463 1,821,975 – 6,279,0372015 2,045,112 1,160,975 5,814 592,517 18,783 – 1,939,196 – 5,762,397
Current other senior executivesT Adams1
2016 515,292 213,275 1,983 191,142 19,308 10,052 214,874 – 1,165,9262015 552,978 200,500 136,789 129,188 18,783 8,929 100,314 – 1,147,481
J Aument2
2016 668,904 286,157 1,459 361,400 14,521 – – 992,155 2,324,5962015 656,643 266,525 1,608 134,454 12,548 – – 458,905 1,530,683
W Ballantine2016 530,692 276,375 2,034 228,708 19,308 10,353 313,368 – 1,380,8382015 491,711 239,450 123,974 108,383 18,783 9,033 195,951 – 1,187,285A Head2016 640,042 222,375 4,306 298,267 19,308 12,486 413,050 – 1,609,8342015 622,524 300,400 2,444 132,485 18,783 11,437 419,998 – 1,508,071M Huey2016 474,142 214,750 1,784 48,550 19,308 – 291,326 – 1,049,8602015 208,293 72,825 770 – 9,392 – 159,956 – 451,236
S Johnson2016 510,692 211,450 2,869 182,983 19,308 9,963 304,768 – 1,242,0332015 458,525 191,375 1,685 93,892 18,783 8,620 191,708 – 964,588L Tobin2016 537,192 187,700 2,012 213,725 19,308 2,168 348,614 – 1,310,7192015 522,517 233,250 1,724 73,225 18,783 – 229,019 – 1,078,518V Vassallo2016 529,323 301,500 2,065 250,958 19,308 2,344 360,869 – 1,466,3672015 541,217 262,300 1,724 91,092 18,783 – 232,625 – 1,147,741A Watson2016 648,892 225,350 1,829 84,317 19,308 – 310,998 – 1,290,6942015 368,210 126,475 1,001 – 10,957 – 154,762 – 661,405
TOTAL2016 7,157,563 3,332,407 33,365 2,980,450 188,293 55,829 4,379,842 992,155 19,119,9042015 6,467,730 3,054,075 277,533 1,355,236 164,378 38,019 3,623,529 458,905 15,439,405
1. Amounts shown as ‘cash salary and fees’ in 2015 for Tony Adams includes $58,824 in relocation costs from the USA to Australia. 2. Jennifer Aument is remunerated in USA Dollars. The amounts shown in the table above have been converted to Australian Dollars using the
average exchange rate over the reporting period. Amounts disclosed as ‘cash salary and fees’ for FY15 includes $67,506 of annual leave cashed out.
3. The amount represents the cash STI payment to the senior executive for FY16, which will be paid in August 2016.4. Non-monetary benefits include Group insurance and relocation allowances (where relevant).5. A component of STI award is deferred into securities. In accordance with accounting standards, the deferred component will be recognised
over the three year service period. The amount recognised in this table is the FY16 accounting charge for unvested grants. 6. In accordance with the requirements of the accounting standards, remuneration includes a proportion of the fair value of equity compensation
granted or outstanding during the year (i.e. performance awards under the LTI plan). The fair value of equity instruments is determined as at the grant date and is progressively allocated over the performance period. The amount included as remuneration may be different to the benefit (if any) that senior executives may ultimately realise should the equity instruments vest. The fair value of performance awards at the date of their grant has been independently determined in accordance with accounting standards. The fair value of the performance awards has been valued applying a Monte Carlo simulation (using a Black-Scholes framework) to model Transurban’s security price and where applicable, the TSR performance against the comparator group performance.
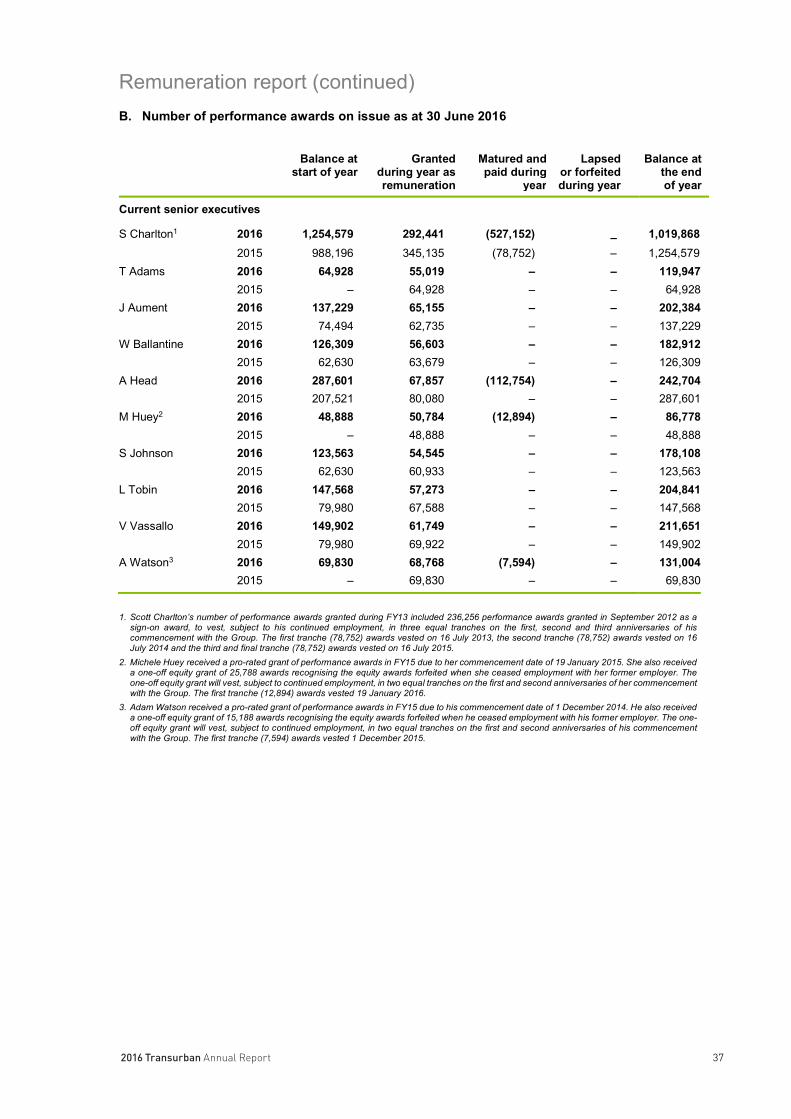
372016 Transurban Annual Report
37
Remuneration report (continued) B. Number of performance awards on issue as at 30 June 2016
Balance at start of year
Granted during year as remuneration
Matured and paid during
year
Lapsed or forfeited during year
Balance at the end of year
Current senior executives
S Charlton1 2016 1,254,579 292,441 (527,152) – 1,019,868 2015 988,196 345,135 (78,752) – 1,254,579 T Adams 2016 64,928 55,019 – – 119,947 2015 – 64,928 – – 64,928J Aument 2016 137,229 65,155 – – 202,384 2015 74,494 62,735 – – 137,229W Ballantine 2016 126,309 56,603 – – 182,912 2015 62,630 63,679 – – 126,309A Head 2016 287,601 67,857 (112,754) – 242,704 2015 207,521 80,080 – – 287,601M Huey2 2016 48,888 50,784 (12,894) – 86,778 2015 – 48,888 – – 48,888S Johnson 2016 123,563 54,545 – – 178,108 2015 62,630 60,933 – – 123,563L Tobin 2016 147,568 57,273 – – 204,841 2015 79,980 67,588 – – 147,568V Vassallo 2016 149,902 61,749 – – 211,651 2015 79,980 69,922 – – 149,902A Watson3 2016 69,830 68,768 (7,594) – 131,004 2015 – 69,830 – – 69,830
1. Scott Charlton’s number of performance awards granted during FY13 included 236,256 performance awards granted in September 2012 as a
sign-on award, to vest, subject to his continued employment, in three equal tranches on the first, second and third anniversaries of his commencement with the Group. The first tranche (78,752) awards vested on 16 July 2013, the second tranche (78,752) awards vested on 16 July 2014 and the third and final tranche (78,752) awards vested on 16 July 2015.
2. Michele Huey received a pro-rated grant of performance awards in FY15 due to her commencement date of 19 January 2015. She also received a one-off equity grant of 25,788 awards recognising the equity awards forfeited when she ceased employment with her former employer. The one-off equity grant will vest, subject to continued employment, in two equal tranches on the first and second anniversaries of her commencement with the Group. The first tranche (12,894) awards vested 19 January 2016.
3. Adam Watson received a pro-rated grant of performance awards in FY15 due to his commencement date of 1 December 2014. He also received a one-off equity grant of 15,188 awards recognising the equity awards forfeited when he ceased employment with his former employer. The one-off equity grant will vest, subject to continued employment, in two equal tranches on the first and second anniversaries of his commencement with the Group. The first tranche (7,594) awards vested 1 December 2015.

2016 Transurban Annual Report38 38
Remuneration report (continued)C. Securities held by senior executives as at 30 June 2016
Balance at start of year
Changes during year
Balance at end of year
Current senior executivesS Charlton 2016 213,374 696,979 910,353
2015 134,622 78,752 213,374T Adams 2016 5,090 4,278 9,368
2015 5,0901 – 5,090J Aument 2016 – – –
2015 – – –W Ballantine 2016 5,794 (2,110) 3,684
2015 4,685 1,109 5,794A Head 2016 75,661 923 76,584
2015 87,760 (12,099) 75,661M Huey 2016 – 12,894 12,894
2015 – – –S Johnson 2016 30,099 17,745 47,844
2015 43,763 (13,664) 30,099L Tobin 2016 – 9,576 9,576
2015 – – –V Vassallo 2016 11,557 7,114 18,671
2015 11,048 509 11,557A Watson 2016 – 8,307 8,307
2015 – – –1. Opening balance held prior to the senior executive becoming a member of KMP.
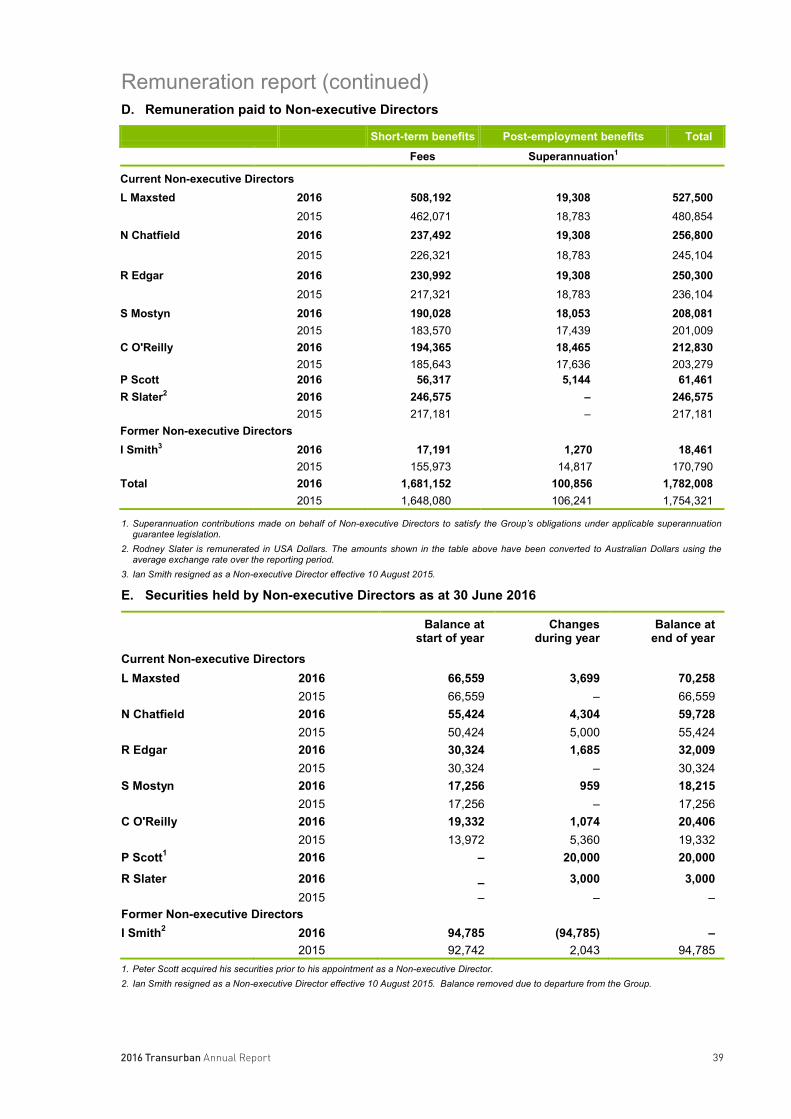
392016 Transurban Annual Report39
Remuneration report (continued)D. Remuneration paid to Non-executive Directors
Short-term benefits Post-employment benefits Total
Fees Superannuation1
Current Non-executive DirectorsL Maxsted 2016 508,192 19,308 527,500
2015 462,071 18,783 480,854N Chatfield 2016 237,492 19,308 256,800
2015 226,321 18,783 245,104
R Edgar 2016 230,992 19,308 250,3002015 217,321 18,783 236,104
S Mostyn 2016 190,028 18,053 208,0812015 183,570 17,439 201,009
C O'Reilly 2016 194,365 18,465 212,8302015 185,643 17,636 203,279
P Scott 2016 56,317 5,144 61,461R Slater2 2016 246,575 – 246,575
2015 217,181 – 217,181Former Non-executive DirectorsI Smith3 2016 17,191 1,270 18,461
2015 155,973 14,817 170,790Total 2016 1,681,152 100,856 1,782,008
2015 1,648,080 106,241 1,754,321
1. Superannuation contributions made on behalf of Non-executive Directors to satisfy the Group’s obligations under applicable superannuation guarantee legislation.
2. Rodney Slater is remunerated in USA Dollars. The amounts shown in the table above have been converted to Australian Dollars using the average exchange rate over the reporting period.
3. Ian Smith resigned as a Non-executive Director effective 10 August 2015.
E. Securities held by Non-executive Directors as at 30 June 2016
Balance at start of year
Changes during year
Balance at end of year
Current Non-executive DirectorsL Maxsted 2016 66,559 3,699 70,258
2015 66,559 – 66,559N Chatfield 2016 55,424 4,304 59,728
2015 50,424 5,000 55,424R Edgar 2016 30,324 1,685 32,009
2015 30,324 – 30,324S Mostyn 2016 17,256 959 18,215
2015 17,256 – 17,256C O'Reilly 2016 19,332 1,074 20,406
2015 13,972 5,360 19,332P Scott1 2016 – 20,000 20,000
R Slater 2016 – 3,000 3,0002015 – – –
Former Non-executive DirectorsI Smith2 2016 94,785 (94,785) –
2015 92,742 2,043 94,7851. Peter Scott acquired his securities prior to his appointment as a Non-executive Director. 2. Ian Smith resigned as a Non-executive Director effective 10 August 2015. Balance removed due to departure from the Group.

2016 Transurban Annual Report40
40
AuditorPricewaterhouseCoopers continues in office in accordance with section 327 of the Corporations Act 2001.
Non-audit servicesThe Company has an "External Auditor Independence" policy which is intended to support the independence of the external auditor by regulating the provision of services by the external auditor. The external auditor will not be engaged to perform any service that may impair or be perceived to impair the external auditor's judgment or independence.
The external auditor will only provide a permissible non-audit service where there is a compelling reason for it to do so.
All non-audit services must be pre-approved by the CFO (services less than $5,000) or the Chair of the Audit and Risk Committee (in all other cases).
The Board has considered the position and, in accordance with advice received from the Audit and Risk Committee, is satisfied that the provision of the non-audit services during the period is compatible with the general standard of independence for auditors imposed by the Corporations Act 2001. The Directors are satisfied that the provision of non-audit services by the auditor, as set out below, did not compromise the auditor independence requirements of the Corporations Act 2001 for the following reasons:
the Audit and Risk Committee reviews the non-audit services to ensure they do not impact the impartiality and objectivity of the auditor; and
none of the services undermine the general principles relating to auditor independence as set out in APES 110 Code of Ethics for Professional Accountants, including reviewing or auditing the auditor’s own work, acting in a management or a decision making capacity for the Group, acting as advocate for the Group or jointly sharing economic risk and rewards.
During the year the following fees were paid or payable for audit and non-audit services provided by the auditor of THL, its related practices and non-related audit firms:
2016$
2015$
Amounts received or due and receivable by PricewaterhouseCoopersAudit and other assurance services:
Audit and review of financial reports 2,190,000 2,293,000Other assurance services 444,300 173,600
2,634,300 2,466,600Other consulting services – 243,915Total remuneration for PricewaterhouseCoopers 2,634,300 2,710,515Total auditors remuneration 2,634,300 2,710,515
Indemnification and insuranceEach officer (including each director) of the Group is indemnified, to the maximum extent permitted by law, against any liabilities incurred as an officer of the Group pursuant to agreements with the Group. Each officer is also indemnified against reasonable costs (whether legal or otherwise) incurred in relation to relevant proceedings in which the officer is involved because the officer is or was an officer.
The Group has arranged to pay a premium for a Director’s and officer’s liability insurance policy to indemnify Directors and officers in accordance with the terms and conditions of the policy.
This policy is subject to a confidentiality clause which prohibits disclosure of the nature of the liability covered, the name of the insurer, the limit of liability and the premium paid for this policy.
Auditor's independence declarationA copy of the auditor's independence declaration as required under section 307C of the Corporations Act 2001 is set out on page 42.
412016 Transurban Annual Report
2016 Transurban Annual Report42
Auditor’s Independence DeclarationAs lead auditor for the audit of the Transurban Group, THT and TIL for the year ended 30 June 2016, I declare that to the best of my knowledge and belief, there have been:
a) no contraventions of the auditor independence requirements of the Corporations Act 2001 in relation to the audit; and
b) no contraventions of any applicable code of professional conduct in relation to the audit.
This declaration is in respect of the Transurban Group and the entities it controlled during the period, THT and the entities it controlled during the period and TIL and the entities it controlled during the period.
Chris Dodd MelbournePartnerPricewaterhouseCoopers
9 August 2016
PricewaterhouseCoopers, ABN 52 780 433 757Freshwater Place, 2 Southbank Boulevard, SOUTHBANK VIC 3006, GPO Box 1331, MELBOURNE VIC 3001T: 61 3 8603 1000, F: 61 3 8603 1999, www.pwc.com.au
Liability limited by a scheme approved under Professional Standards Legislation.
42

432016 Transurban Annual Report 43
Transurban Holdings Limited ABN 86 098 143 429ContentsSection A: Group financial statementsConsolidated statement of comprehensive incomeConsolidated balance sheetConsolidated statement of changes in equityConsolidated statement of cash flows
Section B: Notes to the Group financial statementsBasis of preparation and significant changes
B1Corporate information
B2Summary of significant changes in the current period
B3Basis of preparation
Operating performance
B4Segment information
B5Revenue
B6Significant items
B7Income tax
B8Working capital
Security holder outcomes
B9Earnings per stapled security
B10Dividends/ distributions and free cash
Capital and borrowings
B11Contributed equity
B12Reserves
B13Net finance costs
B14Borrowings
B15Derivatives and financial riskmanagement
Network summary B16Intangible assets
B17Maintenance provision
B18Other liabilities –concession and promissory notes
Group structure B19Principles of consolidation
B20Material subsidiaries
B21Business combinations
B22Equity accounted investments
B23Non-controlling interests – other
B24Deed of cross and intragroup guarantees
Items not recognised
B25Contingencies
B26Commitments
B27Subsequent events
Other B28Related party transactions
B29Key management personnelcompensation
B30Remuneration of auditors
B31Parent entity disclosures
Section C: Transurban Holdings Trust (‘THT’) and Transurban International Limited (‘TIL’) financial statementsConsolidated statement of comprehensive incomeConsolidated balance sheetConsolidated statement of changes in equityConsolidated statement of cash flows
Section D: Notes to the THT and TIL financial statements
Section E: Signed reportsDirectors’ declarationIndependent auditor’s report to the stapled security holders

2016 Transurban Annual Report44
Transurban Holdings Limitedfor the year ended 30 June 2016
44
Section A: Group financial statements

452016 Transurban Annual Report
Transurban Holdings LimitedConsolidated statement of comprehensive income
for the year ended 30 June 2016
45
Note2016
$M2015
$MRevenue B5 2,210 1,860ExpensesEmployee benefits expense (149) (130)Road operating costs (309) (243)Construction costs (282) (185)Transaction and integration costs (131) (429)Corporate and other expenses (91) (91)Total expenses (962) (1,078)
Earnings before depreciation, amortisation, net finance costs, equity accounted investments and income taxes 1,248 782
Amortisation B16 (527) (513)Depreciation (57) (38)Total depreciation and amortisation (584) (551)
Net finance costs B13 (728) (611)Share of net profits of equity accounted investments B22 17 17
Loss before income tax (47) (363)
Income tax benefit/(expense) B7 69 (10)Profit/(loss) for the year 22 (373)
Profit/(loss) attributable to:Ordinary security holders of the stapled group- Attributable to THL 44 (57) - Attributable to THT/TIL 55 (125)
99 (182)Non-controlling interests - other B23 (77) (191)
22 (373)Other comprehensive incomeItems that may be reclassified to profit or loss in the futureChanges in the fair value of cash flow hedges, net of tax (79) (50)Share of other comprehensive income of equity accounted investments, net of tax (11) –Exchange differences on translation of US operations, net of tax (12) (10)Other comprehensive income for the year, net of tax (102) (60)Total comprehensive income for the year (80) (433)
Total comprehensive income for the year is attributable to:Ordinary security holders of the stapled group- Attributable to THL 48 (81)- Attributable to THT/TIL (26) (176)
Non-controlling interests – other (102) (176)(80) (433)
Cents CentsEarnings per security attributable to ordinary security holders of the stapled group:Basic and diluted earnings/(loss) per stapled security B9 5.0 (9.5)
The above consolidated statement of comprehensive income should be read in conjunction with the accompanying notes.

2016 Transurban Annual Report46
Transurban Holdings Limited Consolidated balance sheet
for the year ended 30 June 2016
46
ASSETS Note
2016 $M
2015 $M
Current assets Cash and cash equivalents B8 834 1,249 Trade and other receivables B8 122 117 Derivative financial instruments B15 – 4 Total current assets 956 1,370 Non-current assets Equity accounted investments B22 971 1,092 Held-to-maturity investments 369 165 Derivative financial instruments B15 121 82 Property, plant and equipment 268 249 Deferred tax assets B7 1,097 961 Intangible assets B16 19,248 17,320 Total non-current assets 22,074 19,869 Total assets 23,030 21,239 LIABILITIES Current liabilities Trade and other payables B8 410 340 Borrowings B14 405 628 Derivative financial instruments B15 17 4 Maintenance provision B17 94 82 Distribution provision B10 516 438 Other provisions 31 27 Other liabilities 132 116 Total current liabilities 1,605 1,635 Non-current liabilities Borrowings B14 12,468 11,471 Deferred tax liabilities B7 981 969 Maintenance provision B17 826 733 Other provisions 47 61 Derivative financial instruments B15 393 325 Other liabilities 252 49 Total non-current liabilities 14,967 13,608 Total liabilities 16,572 15,243 Net assets 6,458 5,996 EQUITY Contributed equity B11 1,422 1,237 Reserves B12 (66) (70) Accumulated losses (3,129) (3,034) Non-controlling interests held by security holders of the stapled group (THT/TIL) 6,808 6,636 Equity attributable to security holders of the stapled group 5,035 4,769 Non-controlling interests – other B23 1,423 1,227 Total equity 6,458 5,996
The above consolidated balance sheet should be read in conjunction with the accompanying notes.
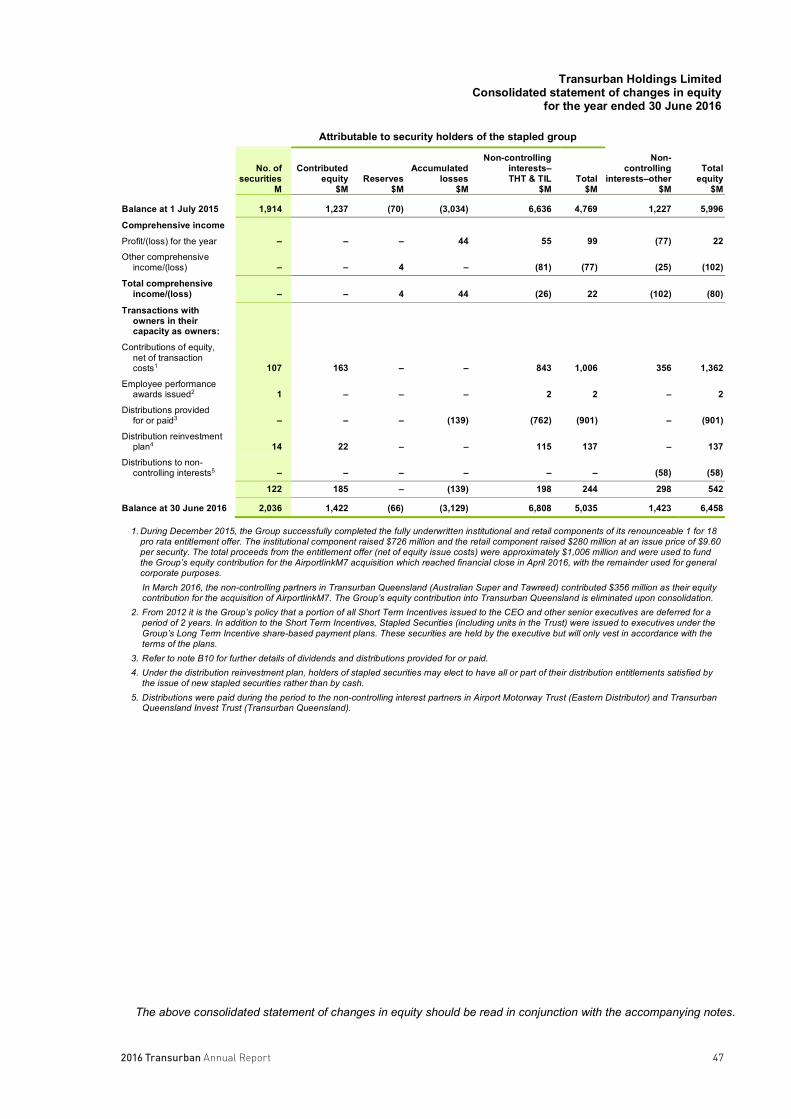
472016 Transurban Annual Report
Transurban Holdings Limited Consolidated statement of changes in equity
for the year ended 30 June 2016
47
Attributable to security holders of the stapled group
No. of securities
M
Contributed equity
$M Reserves
$M
Accumulated losses
$M
Non-controlling interests– THT & TIL
$M Total
$M
Non-controlling
interests–other $M
Total equity
$M
Balance at 1 July 2015 1,914 1,237 (70) (3,034) 6,636 4,769 1,227 5,996
Comprehensive income
Profit/(loss) for the year – – – 44 55 99 (77) 22 Other comprehensive
income/(loss) – – 4 – (81) (77) (25) (102)
Total comprehensive income/(loss) – – 4 44 (26) 22 (102) (80)
Transactions with owners in their capacity as owners:
Contributions of equity, net of transaction costs1 107 163 – – 843 1,006 356 1,362
Employee performance awards issued2 1 – – – 2 2 – 2
Distributions provided for or paid3 – – – (139) (762) (901) – (901)
Distribution reinvestment plan4 14 22 – – 115 137 – 137
Distributions to non-controlling interests5 – – – – – – (58) (58)
122 185 – (139) 198 244 298 542
Balance at 30 June 2016 2,036 1,422 (66) (3,129) 6,808 5,035 1,423 6,458
1. During December 2015, the Group successfully completed the fully underwritten institutional and retail components of its renounceable 1 for 18 pro rata entitlement offer. The institutional component raised $726 million and the retail component raised $280 million at an issue price of $9.60 per security. The total proceeds from the entitlement offer (net of equity issue costs) were approximately $1,006 million and were used to fund the Group’s equity contribution for the AirportlinkM7 acquisition which reached financial close in April 2016, with the remainder used for general corporate purposes. In March 2016, the non-controlling partners in Transurban Queensland (Australian Super and Tawreed) contributed $356 million as their equity contribution for the acquisition of AirportlinkM7. The Group’s equity contribution into Transurban Queensland is eliminated upon consolidation.
2. From 2012 it is the Group’s policy that a portion of all Short Term Incentives issued to the CEO and other senior executives are deferred for a period of 2 years. In addition to the Short Term Incentives, Stapled Securities (including units in the Trust) were issued to executives under the Group’s Long Term Incentive share-based payment plans. These securities are held by the executive but will only vest in accordance with the terms of the plans.
3. Refer to note B10 for further details of dividends and distributions provided for or paid. 4. Under the distribution reinvestment plan, holders of stapled securities may elect to have all or part of their distribution entitlements satisfied by
the issue of new stapled securities rather than by cash. 5. Distributions were paid during the period to the non-controlling interest partners in Airport Motorway Trust (Eastern Distributor) and Transurban
Queensland Invest Trust (Transurban Queensland).
The above consolidated statement of changes in equity should be read in conjunction with the accompanying notes.
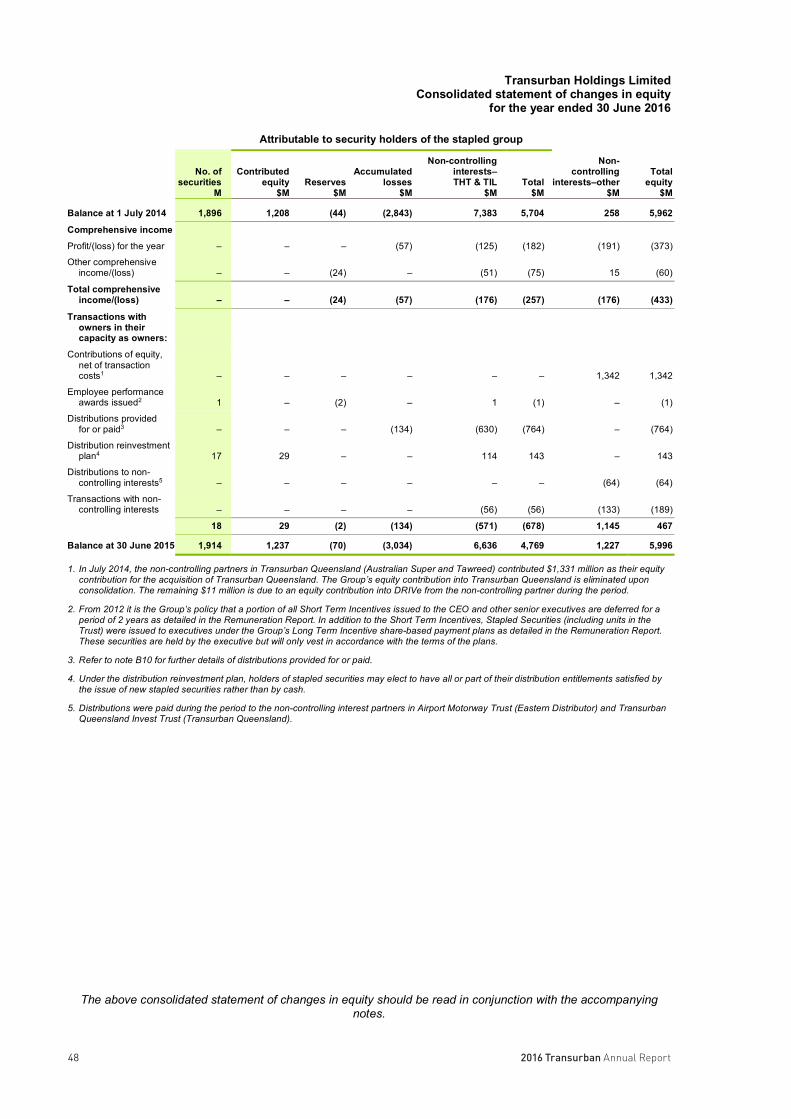
2016 Transurban Annual Report48
Transurban Holdings Limited Consolidated statement of changes in equity
for the year ended 30 June 2016
48
Attributable to security holders of the stapled group
No. of securities
M
Contributed equity
$M Reserves
$M
Accumulated losses
$M
Non-controlling interests– THT & TIL
$M Total
$M
Non-controlling
interests–other $M
Total equity
$M
Balance at 1 July 2014 1,896 1,208 (44) (2,843) 7,383 5,704 258 5,962
Comprehensive income
Profit/(loss) for the year – – – (57) (125) (182) (191) (373)
Other comprehensive income/(loss) – – (24) – (51) (75) 15 (60)
Total comprehensive income/(loss) – – (24) (57) (176) (257) (176) (433)
Transactions with owners in their capacity as owners:
Contributions of equity, net of transaction costs1 – – – – – – 1,342 1,342
Employee performance awards issued2 1 – (2) – 1 (1) – (1)
Distributions provided for or paid3 – – – (134) (630) (764) – (764)
Distribution reinvestment plan4 17 29 – – 114 143 – 143
Distributions to non-controlling interests5 – – – – – – (64) (64)
Transactions with non- controlling interests – – – – (56) (56) (133) (189)
18 29 (2) (134) (571) (678) 1,145 467
Balance at 30 June 2015 1,914 1,237 (70) (3,034) 6,636 4,769 1,227 5,996
1. In July 2014, the non-controlling partners in Transurban Queensland (Australian Super and Tawreed) contributed $1,331 million as their equity contribution for the acquisition of Transurban Queensland. The Group’s equity contribution into Transurban Queensland is eliminated upon consolidation. The remaining $11 million is due to an equity contribution into DRIVe from the non-controlling partner during the period.
2. From 2012 it is the Group’s policy that a portion of all Short Term Incentives issued to the CEO and other senior executives are deferred for a period of 2 years as detailed in the Remuneration Report. In addition to the Short Term Incentives, Stapled Securities (including units in the Trust) were issued to executives under the Group’s Long Term Incentive share-based payment plans as detailed in the Remuneration Report. These securities are held by the executive but will only vest in accordance with the terms of the plans.
3. Refer to note B10 for further details of distributions provided for or paid.
4. Under the distribution reinvestment plan, holders of stapled securities may elect to have all or part of their distribution entitlements satisfied by the issue of new stapled securities rather than by cash.
5. Distributions were paid during the period to the non-controlling interest partners in Airport Motorway Trust (Eastern Distributor) and Transurban Queensland Invest Trust (Transurban Queensland).
The above consolidated statement of changes in equity should be read in conjunction with the accompanying notes.
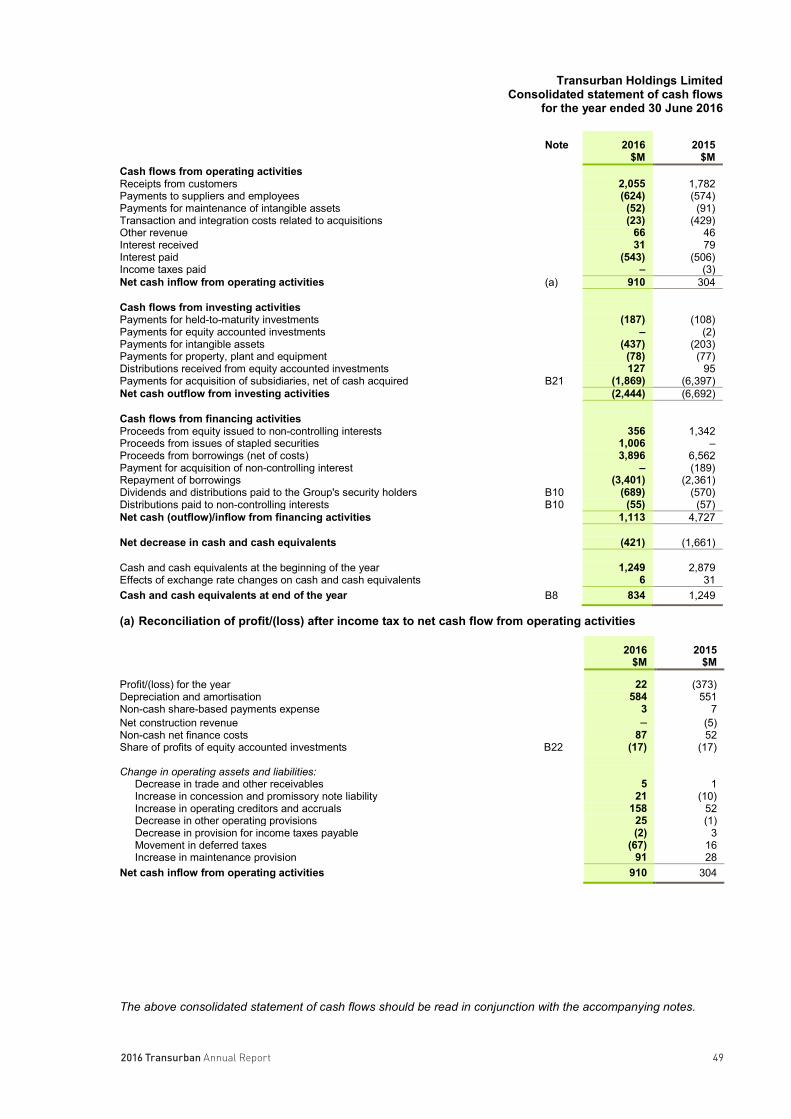
492016 Transurban Annual Report
Transurban Holdings LimitedConsolidated statement of cash flows
for the year ended 30 June 2016
49
Note 2016$M
2015$M
Cash flows from operating activitiesReceipts from customers 2,055 1,782Payments to suppliers and employees (624) (574)Payments for maintenance of intangible assets (52) (91)Transaction and integration costs related to acquisitions (23) (429)Other revenue 66 46Interest received 31 79Interest paid (543) (506)Income taxes paid – (3)Net cash inflow from operating activities (a) 910 304
Cash flows from investing activitiesPayments for held-to-maturity investments (187) (108)Payments for equity accounted investments – (2)Payments for intangible assets (437) (203)Payments for property, plant and equipment (78) (77)Distributions received from equity accounted investments 127 95Payments for acquisition of subsidiaries, net of cash acquired B21 (1,869) (6,397)Net cash outflow from investing activities (2,444) (6,692)
Cash flows from financing activitiesProceeds from equity issued to non-controlling interests 356 1,342Proceeds from issues of stapled securities 1,006 –Proceeds from borrowings (net of costs) 3,896 6,562Payment for acquisition of non-controlling interest – (189)Repayment of borrowings (3,401) (2,361)Dividends and distributions paid to the Group's security holders B10 (689) (570)Distributions paid to non-controlling interests B10 (55) (57)Net cash (outflow)/inflow from financing activities 1,113 4,727
Net decrease in cash and cash equivalents (421) (1,661)
Cash and cash equivalents at the beginning of the year 1,249 2,879Effects of exchange rate changes on cash and cash equivalents 6 31Cash and cash equivalents at end of the year B8 834 1,249
(a) Reconciliation of profit/(loss) after income tax to net cash flow from operating activities
2016$M
2015$M
Profit/(loss) for the year 22 (373)Depreciation and amortisation 584 551Non-cash share-based payments expense 3 7Net construction revenue – (5)Non-cash net finance costs 87 52Share of profits of equity accounted investments B22 (17) (17)
Change in operating assets and liabilities:Decrease in trade and other receivables 5 1Increase in concession and promissory note liability 21 (10)Increase in operating creditors and accruals 158 52Decrease in other operating provisions 25 (1)Decrease in provision for income taxes payable (2) 3Movement in deferred taxes (67) 16Increase in maintenance provision 91 28
Net cash inflow from operating activities 910 304
The above consolidated statement of cash flows should be read in conjunction with the accompanying notes.

2016 Transurban Annual Report50
Transurban Holdings Limitedfor the year ended 30 June 2016
for the year ended 30 J
50
Section B: Notes to the Group financial statements
512016 Transurban Annual Report
Transurban Holdings LimitedNotes to the consolidated financial statements
for the year ended 30 June 2016
51
Basis of preparation and significant changesB1 Corporate informationTransurban Holdings Limited (‘the company’, ‘the parent’ or ‘THL’) is a company incorporated in Australia and limited by shares that are publicly traded on the Australian Securities Exchange. These financial statements have been prepared as a consolidation of the financial statements of Transurban Holdings Limited and its controlled entities (‘Transurban Group’ or ‘the Group’). The controlled entities of THL include the other members of the stapled group being Transurban International Limited and its controlled entities (‘TIL’) and Transurban Holding Trust and its controlled entities (‘THT’). The equity securities THL, THT and TIL are stapled and cannot be traded separately. Entities within the Group are domiciled and incorporated in Australia and the United States of America.
The consolidated financial statements of Transurban Group for the year ended 30 June 2016 were authorised for issue in accordance with a resolution of the Directors on 9 August 2016. Directors have the power to amend and reissue the financial report.
B2 Summary of significant changes in the current reporting periodThe financial position and performance of the Group was particularly affected by the following events and transactions during the reporting period:
Equity issuanceDuring December 2015, the Group successfully completed the fully underwritten institutional and retail components of its renounceable 1 for 18 pro rata entitlement offer. The institutional component raised $726 million and the retail component raised $280 million at an issue price of $9.60 per security. The total proceeds from the entitlement offer were $1,006 million and were used to fund the Group’s equity contribution to the Transurban Queensland acquisition of AirportlinkM7 which reached financial close in April 2016, with the remainder used for general corporate purposes.
Transurban Queensland acquisition of AirportlinkM7On 1 April 2016, Transurban Queensland, in which Transurban has a 62.5 per cent interest, acquired AirportlinkM7 for $1,870 million, plus stamp duty of $108 million and transaction costs of $10 million. The details of the assets and liabilities acquired on 1 April 2016 have been detailed in note B21 and are reflected in the operating results and financial position of the Group from 1 April 2016.
B3 Basis of preparation The Group financial statements are general purpose financial statements which:
Have been prepared in accordance with the Corporations Act 2001, Australian accounting standards, and other authoritative pronouncements of the Australian Accounting Standards Board;
Have adopted all accounting policies in accordance with Australian accounting standards, and where a standard permits a choice in accounting policy, the policy adopted by the Group has been disclosed in these financial statements;
Have applied the option under ASIC Corporations (Stapled Group Reports) Instrument 2015/838 topresent the consolidated financial statements in one section (Section A), and all other reporting groupmembers in a separate section (Section C).
Do not early adopt any accounting standards or interpretations that have been issued or amended but are not yet effective;
Comply with International financial reporting standards (‘IFRS’) as issued by the International Accounting Standards Board (‘IASB’);
Have been prepared under the historical cost convention, as modified by the revaluation of other financial assets and liabilities (including derivative financial instruments);
Are presented in Australian dollars, which is THL’s functional and presentation currency.
Have been rounded to the nearest million dollars, unless otherwise stated, in accordance with ASICCorporations (Rounding in Financial/Director’s Reports) Instrument 2016/191; and
The presentation of comparative amounts have been restated, where applicable, to conform to the current period presentation.

2016 Transurban Annual Report52
Transurban Holdings LimitedNotes to the consolidated financial statements
for the year ended 30 June 2016
52
B3 Basis of preparation (continued)
Going concernThe financial report has been prepared on a going concern basis, which assumes the continuity of normal operations. This is based on the following:
The Group has generated positive cash inflows from operating activities of $910 million (2015: $304 million), after payment of $23 million (2015: $429 million) in transaction and integration costs relating to acquisitions;
The Group has available a total of $527 million of undrawn borrowing facilities with maturities beyond 12 months across a number of finance providers. The Group has a further $349 million of undrawn borrowing facilities, the majority of which are expected to be refinanced within the next 12 months.
Foreign currency translation
Transactions and balancesForeign currency transactions are translated into the functional currency using the exchange rates prevailing at the dates of the transactions. Foreign exchange gains and losses resulting from the settlement of such transactions, and from the translation at year end exchange rates of monetary assets and liabilities denominated in foreign currencies, are recognised in profit or loss, except when they are deferred in equity as qualifying cash flow hedges and qualifying net investment hedges or are attributable to part of the net investment in a foreign operation.
Non-monetary items that are measured at fair value in a foreign currency are translated using the exchange rates at the date when the fair value was determined. Translation differences on assets and liabilities carried at fair value are reported as part of the fair value gain or loss. For example, translation differences on non-monetary assets and liabilities such as equities held at fair value through profit or loss are recognised in profit or loss as part of the fair value gain or loss and translation differences on non-monetary assets such as equities classified as available-for-sale financial assets are recognised in the fair value reserve in equity.
Foreign operationsThe results and financial position of all of the Group entities that have a functional currency different from the presentation currency are translated into the presentation currency as follows:
assets and liabilities are translated at the closing rate at the reporting date;
income and expenses are translated at average exchange rates (unless this is not a reasonable approximation of the cumulative effect of the rates prevailing on the transaction dates, in which case income and expenses are translated at the dates of the transactions); and
all resulting exchange differences are recognised in other comprehensive income.
On consolidation, exchange differences arising from the translation of any net investment in foreign entities, and of borrowings and other financial instruments designated as hedges of such investments, are taken to other comprehensive income.
New and amended standardsThe Group has not changed or amended any accounting policies as a result of new or revised accounting standards during the annual reporting period commencing 1 July 2015. There were no new or amended accounting standards issued during the annual reporting period that are effective for the report period commencing 1 July 2015.

532016 Transurban Annual Report
Transurban Holdings LimitedNotes to the consolidated financial statements
for the year ended 30 June 2016
53
B3 Basis of preparation (continued)
Accounting standards and interpretations issued but not yet effectiveCertain new accounting standards and interpretations have been published but are not mandatory for 30 June 2016 reporting periods. The Group's assessment of the impact of these new standards and interpretations is set out below.
Reference Description Impact on the Group
Application of the standard
Application by the Group
AASB 9 Financial instruments
AASB 9 addresses the classification, measurement and derecognition of financial assets and financial liabilities.It also includes an expected loss impairment model and a reformed approach to hedge accounting.
Management has undertaken an assessment of the impact of this standard on the Group’s financial statements and does not believe that the impact will be significant to the accounting for the Group’s financial assets and liabilities.
1 January 2018
1 July 2018
AASB 15 Revenue from contracts with customers
AASB 15 establishes principles forreporting useful information to users of financial statements about the nature, amount, timing and uncertainty of revenue and cash flows arising from an entity’s contracts with customers. AASB 15 supersedes a number of current revenue standards.
Management has undertaken an assessment of the impact of this standard and does not believe that the impact will be material.
1 January 2018
1 July 2018
AASB 16Leases
AASB 16 modifies accounting for leases by removing the current distinction between operating andfinancing leases. The standard requires recognition of an asset and a financial liability for all leases, with exemptions for short term and low value leases.
Management has undertaken an assessment of the impact of this standard on the Group’s financial statements and does not believe that the impact will be significant to the accounting of leases in the Group financial statements.
1 January 2019
1 July 2019
AASB 2015-1 These amendments clarify various Australian accounting standards.
The impact of the application of this standard will not be material to the Group.
1 January 2016
1 July 2016
AASB 2015-2 These amendments are designed to further encourage companies to apply professional judgment in determining what information to disclose in the financial statements.
The impact of the application of this standard will not be material to the Group.
1 January 2016
1 July 2016
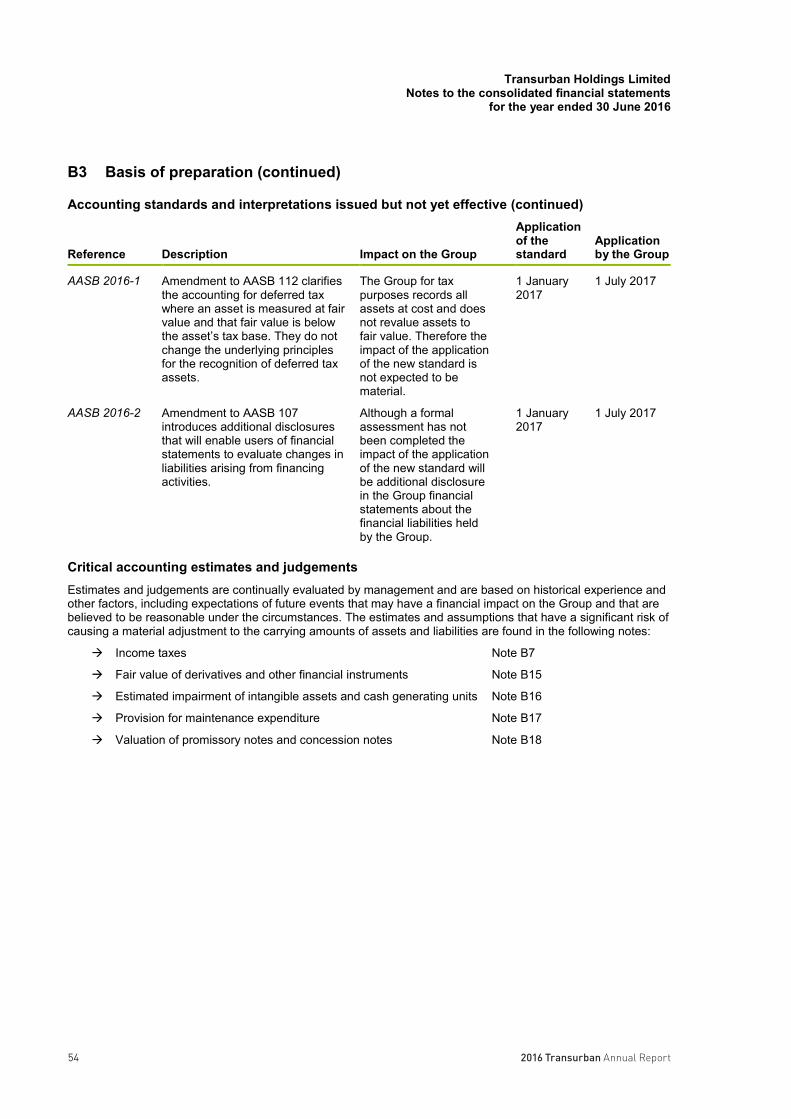
2016 Transurban Annual Report54
Transurban Holdings LimitedNotes to the consolidated financial statements
for the year ended 30 June 2016
54
B3 Basis of preparation (continued)
Accounting standards and interpretations issued but not yet effective (continued)
Reference Description Impact on the Group
Application of the standard
Application by the Group
AASB 2016-1 Amendment to AASB 112 clarifiesthe accounting for deferred tax where an asset is measured at fair value and that fair value is below the asset’s tax base. They do not change the underlying principles for the recognition of deferred tax assets.
The Group for tax purposes records all assets at cost and does not revalue assets to fair value. Therefore the impact of the application of the new standard is not expected to be material.
1 January 2017
1 July 2017
AASB 2016-2 Amendment to AASB 107 introduces additional disclosures that will enable users of financial statements to evaluate changes in liabilities arising from financing activities.
Although a formal assessment has not been completed the impact of the application of the new standard will be additional disclosure in the Group financial statements about the financial liabilities held by the Group.
1 January 2017
1 July 2017
Critical accounting estimates and judgements Estimates and judgements are continually evaluated by management and are based on historical experience and other factors, including expectations of future events that may have a financial impact on the Group and that are believed to be reasonable under the circumstances. The estimates and assumptions that have a significant risk of causing a material adjustment to the carrying amounts of assets and liabilities are found in the following notes:
Income taxes Note B7
Fair value of derivatives and other financial instruments Note B15
Estimated impairment of intangible assets and cash generating units Note B16
Provision for maintenance expenditure Note B17
Valuation of promissory notes and concession notes Note B18

552016 Transurban Annual Report
Transurban Holdings LimitedNotes to the consolidated financial statements
for the year ended 30 June 2016
55
Operating performanceB4 Segment information
In the segment information provided to the Executive Committee (chief operating decision maker), segments are defined by the geographical networks in which the Group operates being Victoria (‘VIC’), New South Wales (‘NSW’), Queensland (‘QLD’) and the Greater Washington Area (‘GWA’). The Group's corporate function is not an operating segment under the requirements of AASB 8 as its revenue generating activities are only incidental to the business.
The Executive Committee assess the performance of the networks based on a measure of proportional earnings before interest, tax, depreciation and amortisation expenses (‘Proportional EBITDA’) excluding the impact of significant items (‘Underlying proportional EBITDA’). This reflects the contribution of each network in the Group in the proportion of Transurban's equity ownership. Interest income and expenses are allocated to the networks where the amounts are related specifically to the assets. Otherwise they are allocated to the Corporate function.
Significant items are those items where their nature and amount is considered material to the financial statements and not in the ordinary course of business. Refer to note B6 for further details.
The diagram below shows the assets included in each geographical network, together with the ownership interests held by the Group for the current financial year:
1. Following the acquisition of the non-controlling interest in the GWA assets on 29 June 2015, the proportional ownership of the GWA assets is reported at 100% from July 2015. Prior to this, the proportional ownership interest in the 95 Express Lanes and 495 Express Lanes were 77.5% and 94.0% respectively.
2. AirportlinkM7 was acquired on 1 April 2016 (refer note B21).3. Westlink M7 and NorthConnex form the NorthWestern Roads Group.
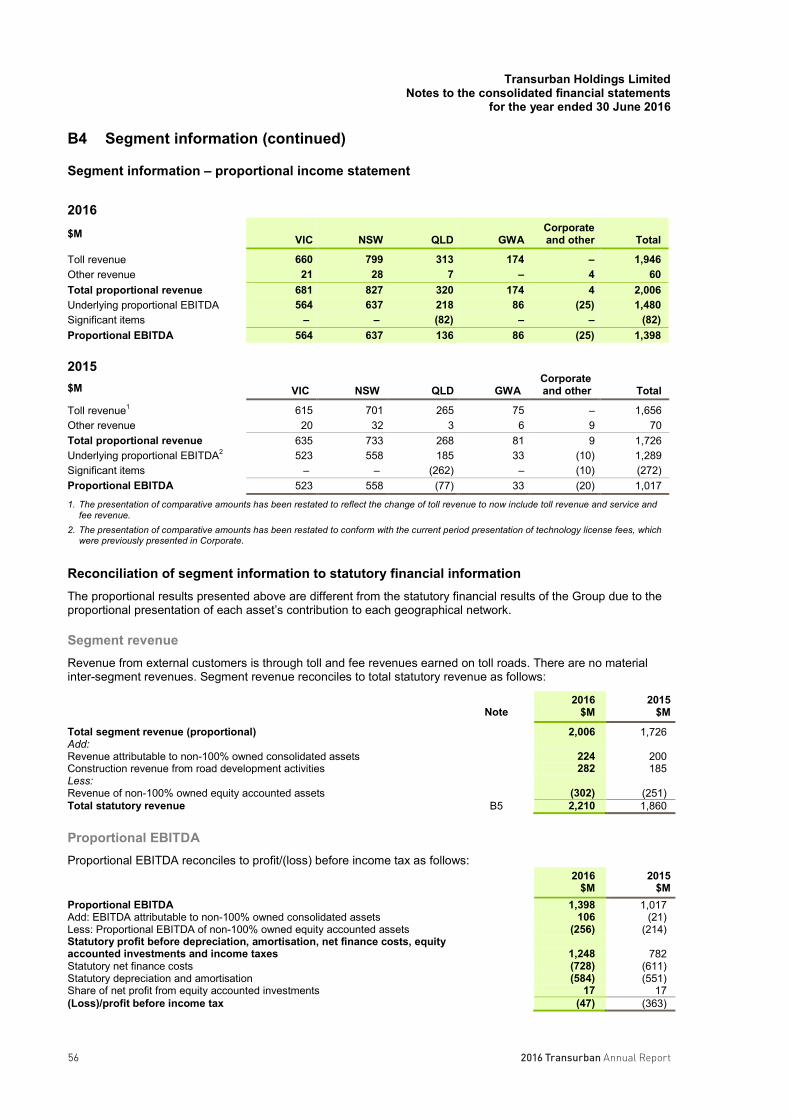
2016 Transurban Annual Report56
Transurban Holdings LimitedNotes to the consolidated financial statements
for the year ended 30 June 2016
56
B4 Segment information (continued)
Segment information – proportional income statement
2016$M VIC NSW QLD GWA
Corporate and other Total
Toll revenue 660 799 313 174 – 1,946Other revenue 21 28 7 – 4 60Total proportional revenue 681 827 320 174 4 2,006Underlying proportional EBITDA 564 637 218 86 (25) 1,480Significant items – – (82) – – (82)Proportional EBITDA 564 637 136 86 (25) 1,398
2015$M VIC NSW QLD GWA
Corporate and other Total
Toll revenue1 615 701 265 75 – 1,656Other revenue 20 32 3 6 9 70Total proportional revenue 635 733 268 81 9 1,726Underlying proportional EBITDA2 523 558 185 33 (10) 1,289Significant items – – (262) – (10) (272)Proportional EBITDA 523 558 (77) 33 (20) 1,017
1. The presentation of comparative amounts has been restated to reflect the change of toll revenue to now include toll revenue and service and fee revenue.
2. The presentation of comparative amounts has been restated to conform with the current period presentation of technology license fees, which were previously presented in Corporate.
Reconciliation of segment information to statutory financial informationThe proportional results presented above are different from the statutory financial results of the Group due to the proportional presentation of each asset’s contribution to each geographical network.
Segment revenue Revenue from external customers is through toll and fee revenues earned on toll roads. There are no materialinter-segment revenues. Segment revenue reconciles to total statutory revenue as follows:
Note2016
$M2015
$M
Total segment revenue (proportional) 2,006 1,726Add:Revenue attributable to non-100% owned consolidated assets 224 200Construction revenue from road development activities 282 185Less:Revenue of non-100% owned equity accounted assets (302) (251)Total statutory revenue B5 2,210 1,860
Proportional EBITDAProportional EBITDA reconciles to profit/(loss) before income tax as follows:
2016$M
2015$M
Proportional EBITDA 1,398 1,017Add: EBITDA attributable to non-100% owned consolidated assets 106 (21)Less: Proportional EBITDA of non-100% owned equity accounted assets (256) (214)Statutory profit before depreciation, amortisation, net finance costs, equityaccounted investments and income taxes 1,248 782Statutory net finance costs (728) (611)Statutory depreciation and amortisation (584) (551)Share of net profit from equity accounted investments 17 17(Loss)/profit before income tax (47) (363)

572016 Transurban Annual Report
Transurban Holdings LimitedNotes to the consolidated financial statements
for the year ended 30 June 2016
57
B5 Revenue
2016$M
2015$M
Toll revenue1 1,870 1,611Construction revenue 282 190Other revenue 58 59Total revenue 2,210 1,8601. The presentation of comparative amounts has been restated to reflect the change of toll revenue to now include toll revenue and service and
fee revenue.
Accounting policyThe Group generates the following types of revenue:
Revenue type Recognition
Toll revenue Recognised when the charge is incurred by the user and the amount is determined to be recoverable by the Group.
Construction revenue Revenue for the construction of service concession infrastructure assets is recognised in accordance with the percentage of completion method, which is measured by reference to costs incurred to date as a percentage of total forecast costs for each project.
Other revenue Includes management fee revenue, business development revenue and other road revenue, and is recognised to the extent that incurred costs will be recovered.
B6 Significant items Significant items are those items where their nature and amount is considered material to the financial statements and not in the ordinary course of business. Such items which have been included in transaction and integration costs within the Group's result for the year and are detailed below:
2016 2015Statutory
$MProportional
$MStatutory
$MProportional
$M
Stamp duty on acquisitions (a) 108 67 384 240
Other transaction fees on acquisitions (a) 10 6 23 18
Integration costs relating to acquisitions (b) 13 9 22 14
Significant items included within EBITDA 131 82 429 272
Significant items included within net finance costs (a) 5 3 – –
Total significant items 136 85 429 272
Income tax benefit associated with transaction and integration costs of acquisitions (10) (6) (11) (7)
Net significant items 126 79 418 265
(a) Stamp duty and other transaction fees
The Transurban Queensland consortium acquisition of AirportlinkM7 was completed on 1 April 2016. The consortium incurred stamp duty and other transaction costs during the year ended 30 June 2016 as a result of the acquisition. The stamp duty is payable in the year ended 30 June 2017. Significant items included within finance costs relate to premiums paid on interest rate swap option contracts entered into as part of the Airportlink M7 acquisition that were not exercised.
The acquisition of Queensland Motorways Group (Transurban Queensland) by a Transurban-led consortium was completed on 2 July 2014. The consortium incurred stamp duty and other transaction costs during the year ended 30 June 2015 as a result of the acquisition.
(b) Integration costs relating to Transurban Queensland and AirportlinkM7
Since acquisition, the Group has incurred costs to integrate Transurban Queensland and AirportlinkM7 into Transurban. These costs include employee costs, consulting and legal fees.
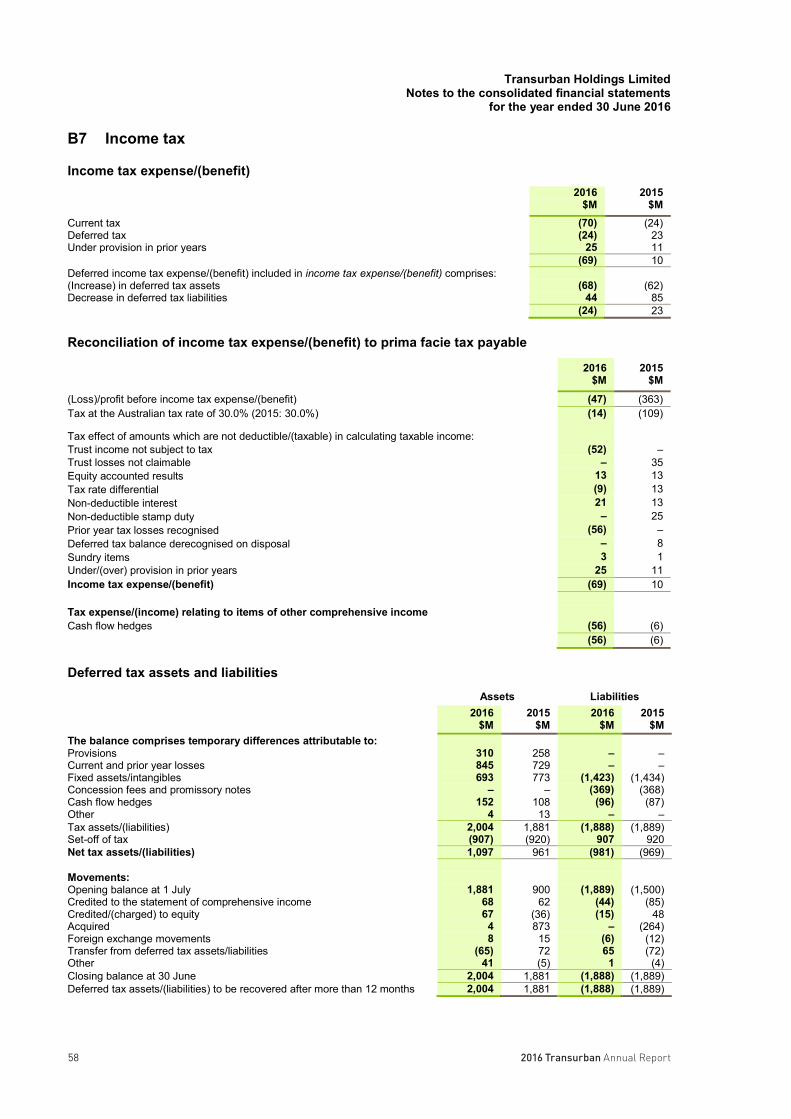
2016 Transurban Annual Report58
Transurban Holdings LimitedNotes to the consolidated financial statements
for the year ended 30 June 2016
58
B7 Income tax
Income tax expense/(benefit)2016
$M2015
$MCurrent tax (70) (24)Deferred tax (24) 23Under provision in prior years 25 11
(69) 10Deferred income tax expense/(benefit) included in income tax expense/(benefit) comprises:(Increase) in deferred tax assets (68) (62)Decrease in deferred tax liabilities 44 85
(24) 23
Reconciliation of income tax expense/(benefit) to prima facie tax payable
2016$M
2015$M
(Loss)/profit before income tax expense/(benefit) (47) (363)Tax at the Australian tax rate of 30.0% (2015: 30.0%) (14) (109)
Tax effect of amounts which are not deductible/(taxable) in calculating taxable income:Trust income not subject to tax (52) –Trust losses not claimable – 35Equity accounted results 13 13Tax rate differential (9) 13Non-deductible interest 21 13Non-deductible stamp duty – 25Prior year tax losses recognised (56) –Deferred tax balance derecognised on disposal – 8Sundry items 3 1Under/(over) provision in prior years 25 11Income tax expense/(benefit) (69) 10
Tax expense/(income) relating to items of other comprehensive incomeCash flow hedges (56) (6)
(56) (6)
Deferred tax assets and liabilities
Assets Liabilities2016
$M2015
$M2016
$M2015
$MThe balance comprises temporary differences attributable to:Provisions 310 258 – –Current and prior year losses 845 729 – –Fixed assets/intangibles 693 773 (1,423) (1,434)Concession fees and promissory notes – – (369) (368)Cash flow hedges 152 108 (96) (87)Other 4 13 – –Tax assets/(liabilities) 2,004 1,881 (1,888) (1,889)Set-off of tax (907) (920) 907 920Net tax assets/(liabilities) 1,097 961 (981) (969)
Movements:Opening balance at 1 July 1,881 900 (1,889) (1,500)Credited to the statement of comprehensive income 68 62 (44) (85)Credited/(charged) to equity 67 (36) (15) 48Acquired 4 873 – (264)Foreign exchange movements 8 15 (6) (12)Transfer from deferred tax assets/liabilities (65) 72 65 (72)Other 41 (5) 1 (4)Closing balance at 30 June 2,004 1,881 (1,888) (1,889)Deferred tax assets/(liabilities) to be recovered after more than 12 months 2,004 1,881 (1,888) (1,889)

592016 Transurban Annual Report
Transurban Holdings LimitedNotes to the consolidated financial statements
for the year ended 30 June 2016
59
B7 Income tax (continued)
Accounting policyThe income tax expense/benefit for the period is the tax payable or benefit on the current period's taxable income based on the applicable income tax rate for each jurisdiction, adjusted by changes in deferred tax assets and liabilities attributable to temporary differences and to unused tax losses.
The current income tax expense is calculated on the basis of the tax laws enacted or substantively enacted at the end of the reporting period in the countries where the Company operates and generates taxable income. Management periodically evaluates positions taken in tax returns with respect to situations in which applicable tax regulation is subject to interpretation. It establishes provisions where appropriate on the basis of amounts expected to be paid to the tax authorities.
The Transurban stapled group comprises two corporate entities (THL and TIL) and a trust (THT). THT operates as a flow-through trust, and is not liable to pay tax itself. Instead, security holders pay tax on the distributions they receive from the trust at their individual marginal tax rates. The Group is structured in this way because the initial heavy capital investment and associated debt funding required for infrastructure investments results in accounting losses being generated in the initial years which would otherwise prevent a company from paying dividends. The trust enables distributions to be made to security holders throughout the life of the asset.
Deferred income tax is provided in full, using the liability method, on temporary differences arising between the tax bases of assets and liabilities and their carrying amounts in the consolidated financial statements. However, deferred income tax is not accounted for if it arises from the initial recognition of an asset or liability in a transaction other than a business combination that at the time of the transaction affects neither accounting nor taxable profit or loss. Deferred income tax is determined using tax rates (and laws) that have been enacted or substantially enacted by the reporting date and are expected to apply when the related deferred income tax asset is realised or the deferred income tax liability is settled.
Deferred tax assets are recognised for deductible temporary differences and unused tax losses only if it is probable that future taxable amounts will be available to utilise those temporary differences and losses.
Deferred tax assets and liabilities are not recognised for temporary differences between the carrying amount and tax bases of investments in foreign operations where the Company is able to control the timing of the reversal of the temporary differences and it is probable that the differences will not reverse in the foreseeable future.
Deferred tax assets and liabilities are offset when there is a legally enforceable right to offset current tax assets and liabilities and when the deferred tax balances relate to the same taxation authority. Current tax assets and tax liabilities are offset where the entity has a legally enforceable right to offset and intends either to settle on a net basis, or to realise the asset and settle the liability simultaneously.
Current and deferred tax is recognised in profit or loss, except to the extent that it relates to items recognised in other comprehensive income or directly in equity.
Investment allowancesCompanies within the Group may be entitled to claim special tax deductions for investments in qualifying assets (investment allowances). The Group accounts for such allowances as tax credits, which means that the allowance reduces income tax payable and current tax expense. A deferred tax asset is recognised for unclaimed tax credits that are carried forward as tax losses.
Tax consolidation legislationThe Transurban Group has adopted the Australian tax consolidation legislation for THL and its wholly-owned Australian entities from 1 July 2005.
All entities within the Australian tax consolidated groups continue to account for their own current and deferred tax amounts. These tax amounts are measured as if each entity in the tax consolidation group is a separate taxpayer within the tax consolidated group.

2016 Transurban Annual Report60
Transurban Holdings LimitedNotes to the consolidated financial statements
for the year ended 30 June 2016
60
B7 Income tax (continued)
Tax consolidation legislation (continued) The tax consolidated groups within the Group are summarised as follows:
1. Entity is classified as a partnership for tax purposes.2. There are no tax groups under THT.
THL tax consolidated groupThe entities in the THL tax consolidated group entered into a tax sharing agreement (‘TSA’) effective from 29 April 2009.
The entities in the THL tax consolidated group have also entered into a tax funding agreement (‘TFA’) effective from 1 July 2008. Under the TFA the wholly-owned entities fully compensate THL for any current tax payable assumed and are compensated by THL for any current tax receivable and deferred tax assets relating to tax losses. The funding amounts are determined by reference to the amounts recognised in the wholly-owned entities’ financial statements.
The amount receivable/payable under the TFA is calculated at the end of the financial year for each wholly-owned entity. THL determines and communicates the amount payable/receivable to each wholly-owned entity along with the method of calculation and any other information deemed necessary.
Transurban Queensland tax consolidated groupThe entities in the Transurban Queensland Holdings 1 Pty Ltd (‘TQH1’) tax consolidated group entered into a TSA effective from 2 July 2014. The entities in the TQH1 tax consolidated group have also entered into a TFA effective from 2 July 2014. APL Hold Co Pty Ltd (‘AirportlinkM7’) and its controlled entities entered the Transurban Queensland tax consolidated group effective from 23 November 2015.
Under the TFA the wholly-owned entities fully compensate TQH1 for any current tax payable assumed and are compensated by TQH1 for any current tax receivable and deferred tax assets relating to tax losses. The funding amounts are determined by reference to the amounts recognised in the wholly-owned entities financial statements.
The amount receivable/payable under the TFA is calculated at the end of the financial year for each wholly-owned entity. TQH1 determines and communicates the amount payable / receivable to each wholly-owned entity along with the method of calculation and any other information deemed necessary.

612016 Transurban Annual Report
Transurban Holdings LimitedNotes to the consolidated financial statements
for the year ended 30 June 2016
61
B7 Income tax (continued)
Transurban DRIVe tax consolidated groupTransurban DRIVe Holdings LLC (‘TDH’) is the head company of the DRIVe tax consolidated group. The DRIVe tax consolidated group is consolidated for US tax purposes in the sense that the 100% subsidiaries of TDH haveelected to be treated as disregarded entities for US tax purposes. This treatment means that those entities are ignored for US tax purposes and that TDH, as head entity, carries any tax liability or benefits arising in the group. The DRIVe tax consolidated group currently owns partnership interests in both 495 Express Lanes and 95 Express Lanes and includes its share of each asset’s profits or losses in its US tax return.
The acquisition of the non-controlling interest on 29 June 2015 had no impact on the composition of the Transurban DRIVe tax consolidated group.
Goods and Services Tax (‘GST’)Revenues, expenses and assets are recognised net of the amount of associated GST, unless the GST incurred is not recoverable from the taxation authority. In this case it is recognised as part of the cost of acquisition of the asset or as part of the expense.
Receivables and payables are stated inclusive of the amount of GST receivable or payable. The net amount of GST recoverable from, or payable to, the taxation authority is included with other receivables or payables in the balance sheet.
Cash flows are presented on a gross basis. The GST components of cash flows arising from investing or financing activities which are recoverable from, or payable to the taxation authority, are presented as operating cash flows.
Key estimate
The Group is subject to income taxes in Australia and the USA. Significant judgement is required in determining the provision for income taxes. There are many transactions and calculations undertaken during the ordinary course of business for which the ultimate tax determination is uncertain. The Group recognises liabilities for anticipated tax audit issues based on whether additional taxes will be due. Where the final tax outcome of these matters is different from the amounts that were initially recorded, such differences will impact the current and deferred tax assets and liabilities in the period in which such determination is made.
The Group has recognised deferred tax assets relating to carried forward tax losses to the extent there are sufficient taxable temporary differences relating to the same taxation authority against which the unused tax losses can be utilised. However, the utilisation of tax losses also depends on the ability of the Group to satisfy certain tests at the time the losses are recouped. In the USA tax losses generally expire after a 20 year period. Management has reviewed the potential future taxable profits and has recognised deferred tax assets in relation to tax losses.

2016 Transurban Annual Report62
Transurban Holdings LimitedNotes to the consolidated financial statements
for the year ended 30 June 2016
62
B8 Working capital The Group’s working capital balances are summarised as follows:
2016$M
2015$M
Current assetsCash and cash equivalents 834 1,249
Trade receivables 76 61Other receivables 35 45Prepayments 11 11
122 117956 1,366
Current liabilitiesTrade payables and accruals (302) (222)Legacy Way consideration payable – (118)Stamp duty payable on AirportlinkM7 acquisition (108) –
(410) (340)
Net working capital 546 1,026
Cash and cash equivalentsFor the purpose of presentation in the consolidated statement of cash flows, cash and cash equivalents includes cash on hand, deposits held at call with financial institutions, other short-term, highly liquid investments with original maturities of three months or less that are readily convertible to known amounts of cash and which are subject to an insignificant risk of changes in value, and bank overdrafts. Bank overdrafts are shown within borrowings in current liabilities. All cash balances are interest bearing.
The amount shown in cash and cash equivalents includes $376 million not available for general use at 30 June 2016 (2015: $202 million) of which $209 million (2015: $140 million) belongs to TIL. This comprises amounts required to be held under maintenance and funding reserves and prepaid tolls, which are not available for general use.
Trade and other receivablesLoans and receivables are non-derivative financial assets with fixed or determinable payments that are not quoted in an active market. They are included in current assets, except for those with maturities greater than 12 months after the reporting date which are classified as non-current assets. Trade receivables are recognised initially at fair value and subsequently measured at amortised cost using the effective interest method, less allowance for impairment. Trade receivables are due for settlement no more than 30 days from revenue recognition.
Collectability of trade receivables is reviewed on an ongoing basis. Debts which are known to be unrecoverable are written off by reducing the carrying amount of trade debtors directly. An allowance for impairment is used when there is evidence that the Group will not be able to collect all amounts due according to the original terms of the receivables. The amount of the allowance for impairment is the difference between the carrying amount and the amount expected to be recoverable. The additional amount of the allowance for doubtful debtors is recognised in profit or loss.
As at 30 June 2016, the Group held an allowance for doubtful debtors of $2 million (2015: $7 million), recognised for current trade receivables that were considered potentially unrecoverable. As at 30 June 2016, trade receivables of $20 million (2015: $19 million) were overdue but the Group still believe that these overdue amounts will be received in full. The other classes within trade and other receivables do not contain amounts that are considered to be potentially unrecoverable.
The carrying amount of trade and other receivables approximates their fair value.
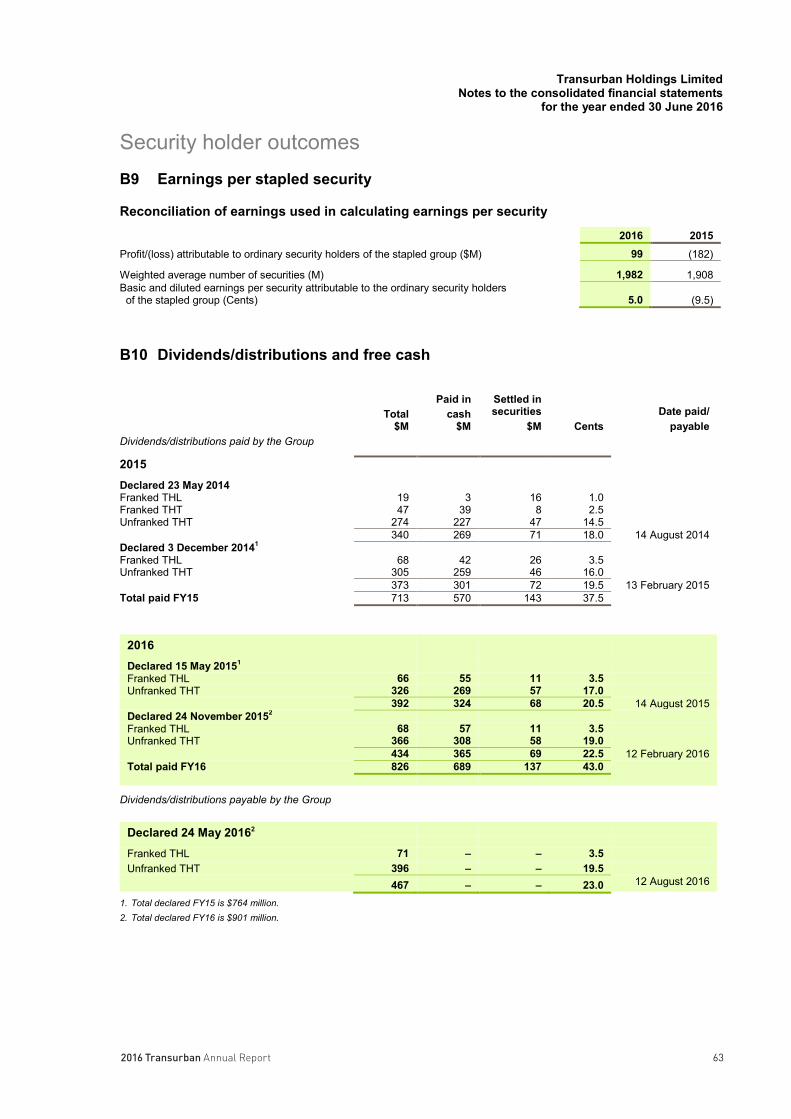
632016 Transurban Annual Report
Transurban Holdings LimitedNotes to the consolidated financial statements
for the year ended 30 June 2016
63
Security holder outcomesB9 Earnings per stapled security
Reconciliation of earnings used in calculating earnings per security
2016 2015Profit/(loss) attributable to ordinary security holders of the stapled group ($M) 99 (182)
Weighted average number of securities (M) 1,982 1,908Basic and diluted earnings per security attributable to the ordinary security holders
of the stapled group (Cents) 5.0 (9.5)
B10 Dividends/distributions and free cash
Total$M
Paid in cash
$M
Settled in securities
$M CentsDate paid/
payableDividends/distributions paid by the Group
2015Declared 23 May 2014Franked THL 19 3 16 1.0Franked THT 47 39 8 2.5Unfranked THT 274 227 47 14.5
340 269 71 18.0 14 August 2014Declared 3 December 20141
Franked THL 68 42 26 3.5Unfranked THT 305 259 46 16.0
373 301 72 19.5 13 February 2015Total paid FY15 713 570 143 37.5
2016Declared 15 May 20151
Franked THL 66 55 11 3.5Unfranked THT 326 269 57 17.0
392 324 68 20.5 14 August 2015Declared 24 November 20152
Franked THL 68 57 11 3.5Unfranked THT 366 308 58 19.0
434 365 69 22.5 12 February 2016Total paid FY16 826 689 137 43.0
Dividends/distributions payable by the Group
Declared 24 May 20162
Franked THL 71 – – 3.5Unfranked THT 396 – – 19.5
467 – – 23.0 12 August 2016
1. Total declared FY15 is $764 million. 2. Total declared FY16 is $901 million.

2016 Transurban Annual Report64
Transurban Holdings LimitedNotes to the consolidated financial statements
for the year ended 30 June 2016
64
B10 Dividends/distributions and free cash (continued)
Distribution policy and free cash calculation The Group's distribution policy is to align distributions with free cash from operations. The Group calculates free cash as follows:
2016$M
2015$M
Cash flows from operating activities 910 304Add back transaction and integration costs related to acquisitions (non 100% owned entities) 23 419Add back payments for maintenance of intangible assets 52 91Less cash flow from operating activities from consolidated non 100% owned entities (284) (338)Less allowance for maintenance of intangible assets for 100% owned assets (60) (11)
Adjust for distributions and interest received from non 100% owned entitiesM1 Eastern Distributor distribution 44 31M5 distribution and term loan note interest 39 67Transurban Queensland distribution and shareholder loan note interest 108 118NWRG distribution and M7 term loan note interest 94 87Free cash 926 768
Weighted average securities on issue (millions)1 1,978 1,910Free cash per security (cents) – weighted average securities 46.8 40.2
1. The weighting applied to securities is based on their eligibility for distributions during the year.
Franking credits
2016$M
2015$M
Franking credits available for subsequent periods based on a tax rate of 30.0% (2015: 30.0%) 193 246
Distribution provisionA provision for distribution is recognised for any distribution declared and authorised on or before the end of the reporting period, but not distributed by the end of the reporting period. These distributions are provided for once they are approved by the board, are announced to equity holders and are no longer at the discretion of the entity.
Movements in distribution provision Movements in the distribution provision during the financial year are set out below:
Distribution to security holders
$M
Distributions to non-controllinginterest – other
$MTotal
$M
Balance at 1 July 2014 340 40 380Additional provision recognised 764 64 828Amounts paid (570) (57) (627)Amounts reinvested (143) – (143)Balance at 30 June 2015 391 47 438Additional provision recognised 901 58 959Amounts paid (689) (55) (744)Amounts reinvested (137) – (137)Balance at 30 June 2016 466 50 516

652016 Transurban Annual Report
Transurban Holdings LimitedNotes to the consolidated financial statements
for the year ended 30 June 2016
65
Capital and borrowingsB11 Contributed equity
2016$M
2015$M
Fully paid stapled securities 1,422 1,2371,422 1,237
Stapled securities Stapled securities are classified as equity and entitle the holder to participate in distributions and on winding up of the Group in proportion to the number of securities held. Every holder of a stapled security present at a meeting, in person or by proxy, is entitled to one vote. The issued units of the Group are made up of a parcel of stapled securities, each parcel comprising one share in THL, one unit in THT and one share in TIL. The individual securities comprising a parcel of stapled securities cannot be traded separately.
Other contributed equity attributable to security holders of the Group relating to THT and TIL of $10,822 million is included within non-controlling interests – THT / TIL.
B12 Reserves
Cash flow hedges
$M
Share-based payments
$M
Foreign currency
translation$M
Transactions with non-
controlling interests
$MTotal
$MBalance 1 July 2014 (55) 2 8 1 (44)Revaluation – gross (43) (2) – – (45)Deferred tax 6 – – – 6Currency translation differences – – 15 – 15Transfers to profit or loss (2) – – – (2)Balance 30 June 2015 (94) – 23 1 (70)Revaluation – gross 18 – (1) – 17Deferred tax (2) – – – (2)Share of other comprehensive income of equity accounted investments, net of tax (11) – – – (11)Balance 30 June 2016 (89) – 22 1 (66)
Nature of reserves Purpose of reserves
Cash flow hedges Used to record gains or losses on cash flow hedging instruments, which are used by the Group to mitigate the risk of movements in exchange rates and interest rates. Amounts are reclassified to profit or loss when the transaction to which the hedge is linked (such as the payment of interest) affects profit or loss.
Share-based payments Used to recognise the fair value of long-term incentives issued but not exercised.
Foreign currencytranslation
Exchange differences arising on translation of the US operations of the Group are recognised in this reserve.
Transactions with non-controlling interests
The Group uses the economic entity approach when accounting for transactions with non-controlling interests.
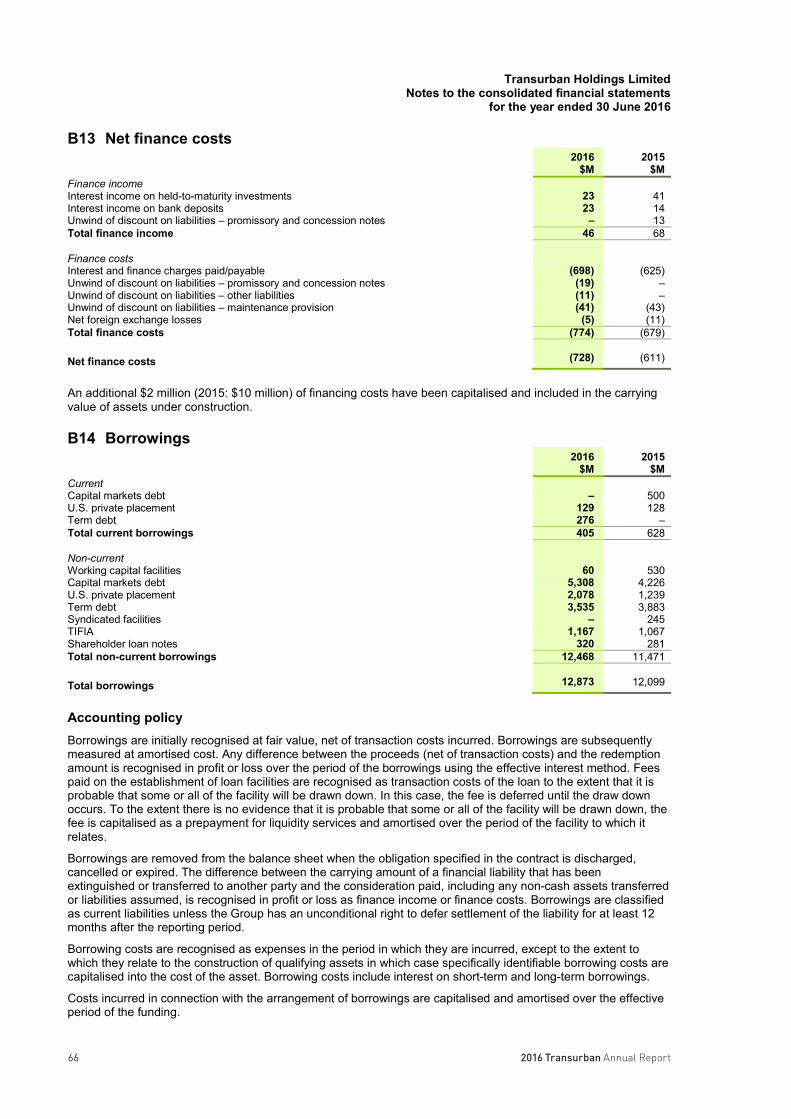
2016 Transurban Annual Report66
Transurban Holdings LimitedNotes to the consolidated financial statements
for the year ended 30 June 2016
66
B13 Net finance costs2016
$M2015
$MFinance incomeInterest income on held-to-maturity investments 23 41Interest income on bank deposits 23 14Unwind of discount on liabilities – promissory and concession notes – 13Total finance income 46 68
Finance costsInterest and finance charges paid/payable (698) (625)Unwind of discount on liabilities – promissory and concession notes (19) –Unwind of discount on liabilities – other liabilities (11) –Unwind of discount on liabilities – maintenance provision (41) (43)Net foreign exchange losses (5) (11)Total finance costs (774) (679)
Net finance costs (728) (611)
An additional $2 million (2015: $10 million) of financing costs have been capitalised and included in the carrying value of assets under construction.
B14 Borrowings2016
$M2015
$MCurrent Capital markets debt – 500U.S. private placement 129 128Term debt 276 –Total current borrowings 405 628
Non-currentWorking capital facilities 60 530Capital markets debt 5,308 4,226U.S. private placement 2,078 1,239Term debt 3,535 3,883Syndicated facilities – 245TIFIA 1,167 1,067Shareholder loan notes 320 281Total non-current borrowings 12,468 11,471
Total borrowings 12,873 12,099
Accounting policyBorrowings are initially recognised at fair value, net of transaction costs incurred. Borrowings are subsequently measured at amortised cost. Any difference between the proceeds (net of transaction costs) and the redemption amount is recognised in profit or loss over the period of the borrowings using the effective interest method. Fees paid on the establishment of loan facilities are recognised as transaction costs of the loan to the extent that it is probable that some or all of the facility will be drawn down. In this case, the fee is deferred until the draw down occurs. To the extent there is no evidence that it is probable that some or all of the facility will be drawn down, the fee is capitalised as a prepayment for liquidity services and amortised over the period of the facility to which it relates.
Borrowings are removed from the balance sheet when the obligation specified in the contract is discharged, cancelled or expired. The difference between the carrying amount of a financial liability that has been extinguished or transferred to another party and the consideration paid, including any non-cash assets transferred or liabilities assumed, is recognised in profit or loss as finance income or finance costs. Borrowings are classified as current liabilities unless the Group has an unconditional right to defer settlement of the liability for at least 12 months after the reporting period.
Borrowing costs are recognised as expenses in the period in which they are incurred, except to the extent to which they relate to the construction of qualifying assets in which case specifically identifiable borrowing costs are capitalised into the cost of the asset. Borrowing costs include interest on short-term and long-term borrowings.
Costs incurred in connection with the arrangement of borrowings are capitalised and amortised over the effective period of the funding.

672016 Transurban Annual Report
Transurban Holdings LimitedNotes to the consolidated financial statements
for the year ended 30 June 2016
67
B14 Borrowings (continued)
Financing arrangements and credit facilities Credit facilities are provided as part of the overall debt funding structure of the Group. The drawn component of each facility is shown below:
Maturity Carrying value
2016$M
2015$M
Corporate debt
Working capital facilities drawnAUD 125m facility Aug 2016 – 124AUD 125m facility Aug 2016 – 88AUD 100m facility Dec 2016 – 94AUD 100m facility Apr 2017 – 91AUD 125m facility Jun 2017 – 118AUD 100m facility Jun 2018 62 –Net capitalised borrowing costs (2) (2)
Capital markets debtDomestic wrapped bond AUD 300m Nov 2015 – 300Domestic unwrapped bond AUD 200m Jun 2016 – 200Domestic wrapped bond AUD 300m Nov 2017 300 300EMTN CAD 250m Mar 2019 260 262EMTN EUR 500m Oct 2020 746 728EMTN EUR 600m Sep 2024 896 874EMTN EUR 500m Aug 2025 746 728US 144A USD 550m Feb 2026 741 –Net capitalised borrowing costs (27) (23)
Syndicated facilitiesSyndicated debt USD 93m1 May 2017 – 120Syndicated debt AUD 125m1 Aug 2017 – 125
U.S. private placementAug 2005 – Tranche A USD 98m Aug 2015 – 128Nov 2006 – Tranche A USD 43m (plus accreted interest) Nov 2016 77 74Dec 2004 – Tranche B USD 39m Dec 2016 52 51Aug 2005 – Tranche B USD 126m Aug 2017 169 164Nov 2006 – Tranche B USD 136m (plus accreted interest) Nov 2018 244 236Dec 2004 – Tranche C USD 109m Dec 2019 146 141Dec 2004 – Tranche D AUD 72m Dec 2019 72 72Aug 2005 – Tranche C USD 157m Aug 2020 211 204Nov 2006 – Tranche C USD 121m (plus accreted interest) Nov 2021 218 211Nov 2006 – Tranche D USD 50m (plus accreted interest) Nov 2026 91 88Net capitalised borrowing costs (1) (2)
Total corporate debt, net of capitalised borrowing costs 5,001 5,4941. These facilities were repaid during FY16.
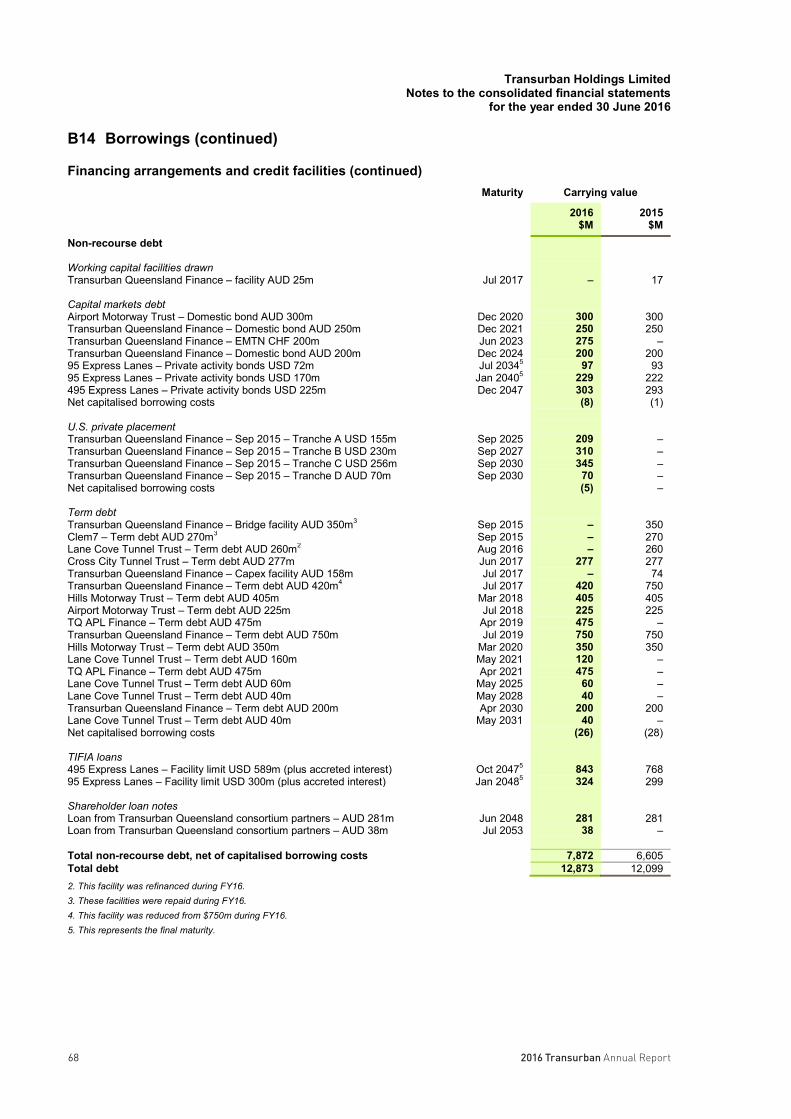
2016 Transurban Annual Report68
Transurban Holdings LimitedNotes to the consolidated financial statements
for the year ended 30 June 2016
68
B14 Borrowings (continued)
Financing arrangements and credit facilities (continued)Maturity Carrying value
2016$M
2015$M
Non-recourse debt
Working capital facilities drawnTransurban Queensland Finance – facility AUD 25m Jul 2017 – 17
Capital markets debtAirport Motorway Trust – Domestic bond AUD 300m Dec 2020 300 300Transurban Queensland Finance – Domestic bond AUD 250m Dec 2021 250 250Transurban Queensland Finance – EMTN CHF 200m Jun 2023 275 –Transurban Queensland Finance – Domestic bond AUD 200m Dec 2024 200 20095 Express Lanes – Private activity bonds USD 72m Jul 20345 97 9395 Express Lanes – Private activity bonds USD 170m Jan 20405 229 222495 Express Lanes – Private activity bonds USD 225m Dec 2047 303 293Net capitalised borrowing costs (8) (1)
U.S. private placementTransurban Queensland Finance – Sep 2015 – Tranche A USD 155m Sep 2025 209 –Transurban Queensland Finance – Sep 2015 – Tranche B USD 230m Sep 2027 310 –Transurban Queensland Finance – Sep 2015 – Tranche C USD 256m Sep 2030 345 –Transurban Queensland Finance – Sep 2015 – Tranche D AUD 70m Sep 2030 70 –Net capitalised borrowing costs (5) –
Term debtTransurban Queensland Finance – Bridge facility AUD 350m3 Sep 2015 – 350Clem7 – Term debt AUD 270m3 Sep 2015 – 270Lane Cove Tunnel Trust – Term debt AUD 260m2 Aug 2016 – 260Cross City Tunnel Trust – Term debt AUD 277m Jun 2017 277 277Transurban Queensland Finance – Capex facility AUD 158m Jul 2017 – 74Transurban Queensland Finance – Term debt AUD 420m4 Jul 2017 420 750Hills Motorway Trust – Term debt AUD 405m Mar 2018 405 405Airport Motorway Trust – Term debt AUD 225m Jul 2018 225 225TQ APL Finance – Term debt AUD 475m Apr 2019 475 –Transurban Queensland Finance – Term debt AUD 750m Jul 2019 750 750Hills Motorway Trust – Term debt AUD 350m Mar 2020 350 350Lane Cove Tunnel Trust – Term debt AUD 160m May 2021 120 –TQ APL Finance – Term debt AUD 475m Apr 2021 475 –Lane Cove Tunnel Trust – Term debt AUD 60m May 2025 60 –Lane Cove Tunnel Trust – Term debt AUD 40m May 2028 40 –Transurban Queensland Finance – Term debt AUD 200m Apr 2030 200 200Lane Cove Tunnel Trust – Term debt AUD 40m May 2031 40 –Net capitalised borrowing costs (26) (28)
TIFIA loans495 Express Lanes – Facility limit USD 589m (plus accreted interest) Oct 20475 843 76895 Express Lanes – Facility limit USD 300m (plus accreted interest) Jan 20485 324 299
Shareholder loan notesLoan from Transurban Queensland consortium partners – AUD 281m Jun 2048 281 281Loan from Transurban Queensland consortium partners – AUD 38m Jul 2053 38 –
Total non-recourse debt, net of capitalised borrowing costs 7,872 6,605Total debt 12,873 12,0992. This facility was refinanced during FY16.3. These facilities were repaid during FY16.4. This facility was reduced from $750m during FY16.5. This represents the final maturity.

692016 Transurban Annual Report
Transurban Holdings LimitedNotes to the consolidated financial statements
for the year ended 30 June 2016
69
B14 Borrowings (continued)
Working capital facilities The corporate facilities are secured by first ranking charges over the cash flows of the Group;
The Transurban Queensland Finance facilities are secured against the respective rights of Transurban Queensland Holdings 1 Pty Limited, Transurban Queensland Holdings 2 Pty Limited, Transurban Queensland Invest Trust and their assets; and
The AirportlinkM7 facility is fully secured against the respective rights of APL Hold Co Pty Limited, APL Co Pty Limited, TQ APL Hold Trust, TQ APL Asset Trust and their assets. At 30 June 2016 the facility was undrawn.
Capital markets debt The corporate domestic bonds are secured by first ranking charges over the cash flows of the Group;
A corporate secured EMTN program was established in October 2011 with a program limit of USD $2billion, which increased to USD $5 billion in May 2015. Under the program the Group may from time to time issue notes denominated in any currency. These facilities are secured by first ranking charges over the cash flows of the Group;
The Airport Motorway Trust domestic bond is secured against the respective rights of Airport Motorway Limited and Airport Motorway Trust and their assets;
The Transurban Queensland Finance domestic bonds are secured against the respective rights of Transurban Queensland Holdings 1 Pty Limited, Transurban Queensland Holdings 2 Pty Limited, Transurban Queensland Invest Trust and their assets;
A Transurban Queensland EMTN program was established in March 2016 with a program limit of USD$2 billion. Under the program, Transurban Queensland may from time to time issue notes denominated in any currency. These facilities are secured against the respective rights of Transurban Queensland Holdings 1 Pty Limited, Transurban Queensland Holdings 2 Pty Limited, Transurban Queensland Invest Trust and their assets;
The 95 Express Lanes Private Activity Bonds (‘PABs’) are secured against the rights of 95 ExpressLanes LLC and its assets;
The 495 Express Lanes PABs are secured against the rights of Capital Beltway Express LLC and its assets; and
The US 144A notes are secured by first ranking charges over the cashflows of the Group.
Syndicated facilities The corporate syndicated bank debt was secured by first ranking charges over the cash flows of the
Group.
U.S. private placement Corporate U.S. private placement facilities are secured by a first ranking charge over the cash flows of
the Group; and
The Transurban Queensland U.S private placement facilities are secured against the respective rights of Transurban Queensland Holdings 1 Pty Limited, Transurban Queensland Holdings 2 Pty Limited, Transurban Queensland Invest Trust and their assets.

2016 Transurban Annual Report70
Transurban Holdings LimitedNotes to the consolidated financial statements
for the year ended 30 June 2016
70
B14 Borrowings (continued)
Term debt The Airport Motorway facility is fully secured against the respective rights of Airport Motorway Limited
and the Airport Motorway Trust and their assets;
The Hills Motorway Trust facilities are fully secured against the respective rights of Hills Motorway Limited and Hills Motorway Trust and their assets;
The Lane Cove Tunnel facility is fully secured against the respective rights of LCT-MRE Pty Limited and LCT-MRE Trust and their assets;
The Cross City Tunnel facility is fully secured against the respective rights of Transurban CCT Pty Limited and Transurban CCT Trust and their assets;
The Clem7 facility was fully secured against the respective rights of the Project T Partnership and their assets;
The AirportlinkM7 facility is fully secured against the respective rights of APL Hold Co Pty Limited, APL Co Pty Limited, TQ APL Hold Trust, TQ APL Asset Trust and their assets; and
The Transurban Queensland Finance facilities are secured against the respective rights of Transurban Queensland Holdings 1 Pty Limited, Transurban Queensland Holdings 2 Pty Limited, Transurban Queensland Invest Trust and their assets.
Transportation Infrastructure Finance and Innovation Act (‘TIFIA’) The 495 Express Lanes TIFIA facility is secured against the rights of Capital Beltway Express LLC and
its assets; and
The 95 Express Lanes TIFIA facility is secured against the rights of 95 Express Lanes LLC and its assets.
Shareholder loan notes The loans to Transurban Queensland from the non-Transurban Group acquisition consortium partners
are unsecured.
Letters of credit and corporate credit facilities
2016$M
2015$M
MaturityFacility amount
Amount issued
Facility amount
Amount issued
Letter of credit facility Nov 2016 60 39 60 37Letter of credit facility Dec 2019 240 240 240 240General credit facility1 Aug 2017 4 3 4 3Total 304 282 304 2801. The general credit facility covers corporate requirements including credit card facilities, online banking and an overdraft facility.
Letters of credit and bank guarantees to the value of $56 million (2015: $17 million) have also been issued under multi-option facilities and working capital facilities. A separate cash-backed letter of credit to the value of $108 million has been issued in relation to stamp duty payable on the AirportlinkM7 acquisition. All letters of credit are currently undrawn and therefore no liability is recorded.

712016 Transurban Annual Report
Transurban Holdings LimitedNotes to the consolidated financial statements
for the year ended 30 June 2016
71
B14 Borrowings (continued)
Covenants A number of the Group's consolidated borrowings include covenants, some of which are listed below. There have been no breaches of any of these covenants during the year.
Corporate Debt
Covenant ThresholdSenior interest coverage ratio Greater than 1.25 timesGroup Market Capitalisation Gearing must not exceed 60%1
CityLink Interest Coverage Ratio Greater than 1.1 times
Non-Recourse Debt
Covenant ThresholdAirport Motorway Trust Interest Coverage Ratio Greater than 1.15 timesHills Motorway Trust Interest Coverage Ratio Greater than 1.15 timesLane Cove Tunnel Trust Interest Coverage Ratio Greater than 1.15 timesCross City Tunnel Trust Senior Debt Service Coverage Ratio Greater than 1.15 timesTransurban Queensland Finance Interest Coverage Ratio Greater than 1.20 timesAirportlinkM7 Finance Interest Coverage Ratio2 Greater than 1.20 times495 Express Lanes Senior Debt Service Coverage Ratio Greater than 1.15 times95 Express Lanes Senior Debt Service Coverage Ratio3 Greater than 1.30 times1. Based on the balance sheet as at 30 June 2016, the Group’s security price would need to close below $4.26 (2015: $5.23) per security for 20
consecutive days to trigger this clause.2. The first relevant calculation date for this ratio was 30 June 2016.3. The first relevant calculation date is in December 2017, three years from project substantial completion.
B15 Derivatives and financial risk management
Derivatives
2016$M
2015$M
Current Non-current Current Non-currentAssetsInterest rate swap contracts – cash flow hedges – – – 16Forward exchange contracts – cash flow hedges – – 4 –Cross-currency interest rate swap contracts – cash flow hedges – 121 – 66Total derivative financial instrument assets – 121 4 82
LiabilitiesInterest rate swap contracts – cash flow hedges 12 279 3 227Forward exchange contracts – cash flow hedges 2 – – –Cross-currency interest rate swap contracts – cash flow hedges 3 46 1 41Cross-currency interest rate swap contracts – net investment hedge – 68 – 57Total derivative financial instrument liabilities 17 393 4 325

2016 Transurban Annual Report72
Transurban Holdings LimitedNotes to the consolidated financial statements
for the year ended 30 June 2016
72
B15 Derivatives and financial risk management (continued)
Accounting policyDerivatives are initially recognised at fair value on the date a derivative contract is entered into and are subsequently remeasured to their fair value at the end of each reporting period. The accounting for subsequent changes in fair value depends on whether the derivative is designated as a hedging instrument, and if so, the nature of the item being hedged. The Group designates certain derivatives as either:
hedges of the fair value of recognised assets or liabilities or a firm commitment (fair value hedges);
hedges of a particular risk associated with the cash flows of recognised assets and liabilities and highly probable forecast transactions (cash flow hedges); or
hedges of a net investment in a foreign operation (net investment hedges).
At the inception of the hedging transaction the Group documents the relationship between hedging instruments and hedged items, as well as its risk management objective and strategy for undertaking various hedge transactions. The Group also documents its assessment, both at hedge inception and on an ongoing basis, of whether the derivatives that are used in hedging transactions have been and will continue to be highly effective in offsetting changes in fair values or cash flows of hedged items.
The fair values of various derivative financial instruments used for hedging purposes are disclosed in this note. Movements in the cash flow hedging reserve in shareholders' equity are shown in note B12. The full fair value of a hedging derivative is classified as a non-current asset or liability when the remaining maturity of the hedged item is more than 12 months.
Fair value hedges
Changes in the fair value of derivatives that are designated and qualify as fair value hedges are recorded in profit or loss, together with any changes in the fair value of the hedged asset or liability that are attributable to the hedged risk. The gain or loss relating to the effective portion of interest rate swaps and cross currency swaps hedging fixed rate borrowings is recognised in profit or loss within finance costs, together with changes in the fair value of the hedged fixed rate borrowings attributable to interest rate risk. The gain or loss relating to theineffective portion is recognised in profit or loss.
If the hedge no longer meets the criteria for hedge accounting, the adjustment to the carrying amount of a hedged item for which the effective interest method is used is amortised to profit or loss over the period to maturity using a recalculated effective interest rate.
Cash flow hedges
The effective portion of changes in the fair value of derivatives that are designated and qualify as cash flow hedges is recognised in other comprehensive income and accumulated in reserves in equity. The gain or loss relating to the ineffective portion is recognised immediately in profit or loss.
Amounts accumulated in equity are reclassified to profit or loss in the periods when the hedged item affects profit or loss.
When a hedging instrument expires or is sold or terminated, or when a hedge no longer meets the criteria for hedge accounting, any cumulative gain or loss existing in equity at that time remains in equity and is recognised when the forecast transaction is ultimately recognised in profit or loss. When a forecast transaction is no longer expected to occur, the cumulative gain or loss that was reported in equity is immediately transferred to profit or loss.
Net investment hedges
Hedges of net investments in foreign operations are accounted for similarly to cash flow hedges.
Any gain or loss on the hedging instrument relating to the effective portion of the hedge is recognised in other comprehensive income and accumulated in reserves in equity. The gain or loss relating to the ineffective portion is recognised immediately in profit or loss.
Gains and losses accumulated in equity are included in profit or loss when the foreign operation is partially disposed of or sold.
Derivatives that do not qualify for hedge accounting
Certain derivative instruments do not qualify for hedge accounting. Changes in the fair value of any derivative instrument that does not qualify for hedge accounting are recognised immediately in profit or loss.
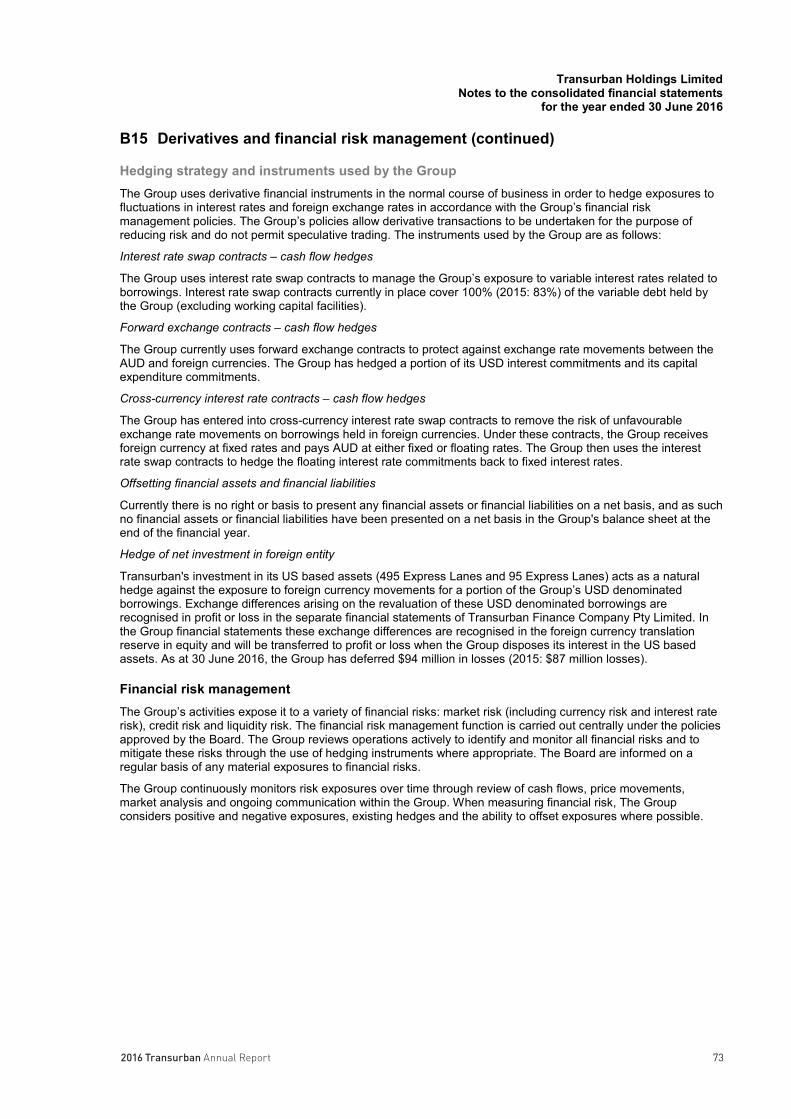
732016 Transurban Annual Report
Transurban Holdings LimitedNotes to the consolidated financial statements
for the year ended 30 June 2016
73
B15 Derivatives and financial risk management (continued)
Hedging strategy and instruments used by the Group The Group uses derivative financial instruments in the normal course of business in order to hedge exposures to fluctuations in interest rates and foreign exchange rates in accordance with the Group’s financial risk management policies. The Group’s policies allow derivative transactions to be undertaken for the purpose of reducing risk and do not permit speculative trading. The instruments used by the Group are as follows:
Interest rate swap contracts – cash flow hedges
The Group uses interest rate swap contracts to manage the Group’s exposure to variable interest rates related to borrowings. Interest rate swap contracts currently in place cover 100% (2015: 83%) of the variable debt held by the Group (excluding working capital facilities).
Forward exchange contracts – cash flow hedges
The Group currently uses forward exchange contracts to protect against exchange rate movements between the AUD and foreign currencies. The Group has hedged a portion of its USD interest commitments and its capital expenditure commitments.
Cross-currency interest rate contracts – cash flow hedges
The Group has entered into cross-currency interest rate swap contracts to remove the risk of unfavourable exchange rate movements on borrowings held in foreign currencies. Under these contracts, the Group receives foreign currency at fixed rates and pays AUD at either fixed or floating rates. The Group then uses the interest rate swap contracts to hedge the floating interest rate commitments back to fixed interest rates.
Offsetting financial assets and financial liabilities
Currently there is no right or basis to present any financial assets or financial liabilities on a net basis, and as such no financial assets or financial liabilities have been presented on a net basis in the Group's balance sheet at the end of the financial year.
Hedge of net investment in foreign entity
Transurban's investment in its US based assets (495 Express Lanes and 95 Express Lanes) acts as a natural hedge against the exposure to foreign currency movements for a portion of the Group’s USD denominated borrowings. Exchange differences arising on the revaluation of these USD denominated borrowings are recognised in profit or loss in the separate financial statements of Transurban Finance Company Pty Limited. In the Group financial statements these exchange differences are recognised in the foreign currency translation reserve in equity and will be transferred to profit or loss when the Group disposes its interest in the US based assets. As at 30 June 2016, the Group has deferred $94 million in losses (2015: $87 million losses).
Financial risk management The Group’s activities expose it to a variety of financial risks: market risk (including currency risk and interest rate risk), credit risk and liquidity risk. The financial risk management function is carried out centrally under the policies approved by the Board. The Group reviews operations actively to identify and monitor all financial risks and to mitigate these risks through the use of hedging instruments where appropriate. The Board are informed on a regular basis of any material exposures to financial risks.
The Group continuously monitors risk exposures over time through review of cash flows, price movements, market analysis and ongoing communication within the Group. When measuring financial risk, The Group considers positive and negative exposures, existing hedges and the ability to offset exposures where possible.

2016 Transurban Annual Report74
Transurban Holdings LimitedNotes to the consolidated financial statements
for the year ended 30 June 2016
74
B15 Derivatives and financial risk management (continued)Market risk Foreign exchange risk
The Group operates internationally and is exposed to foreign exchange risk when future transactions and recognised assets and liabilities are denominated in a currency that is not the entity’s functional currency.
Foreign currency exposures are viewed as either investment exposures or operating exposures. Exposures from investments in foreign assets are generally managed using foreign currency debt. All known material operatingexposures out to 12 months are hedged, either using hedging instruments, or are offset by drawing on foreign currency funds.
Exposure to foreign currency risk at the reporting date, denominated in the currency in which the risk arises, was as follows:
2016$M
2015$M
USD EUR CAD CHF USD EUR CAD CHFNet investment in foreign operation 1,192 – – – 1,093 – – –Borrowings (2,094) (1,600) (250) (200) (1,484) (1,600) (250) –Cross-currency interest rate swaps 1,122 1,600 250 200 529 1,600 250 –Net exposure 220 – – – 138 – – –
Sensitivity
Sensitivity to exchange rate movements based on the translation of financial instruments held at the end of the period is as follows:
2016$M
2015$M
Movement inpost-tax profit
Increase / (decrease) in
equityMovement in
post-tax profitIncrease /
(decrease) inequity
AUD/USD+ 10 cents – (68) – (36)- 10 cents – 93 – 50
AUD/EUR+ 5 cents – (45) – (42)- 5 cents – 58 – 56
AUD/CAD+ 10 cents – (2) – (2)- 10 cents – 3 – 3
AUD/CHF+ 10 cents – (10) – –- 10 cents – 17 – –
The Group revalues its foreign currency denominated borrowings each period using market spot rates and, where these borrowings have been appropriately hedged, defers these movements in the cash flow hedge reserve in equity. The volatility in the cash flow hedge reserve is caused mainly by fair value movements of the cross currency interest rate swaps, which are affected by changes in forward Australian dollar/foreign currency exchange rates.
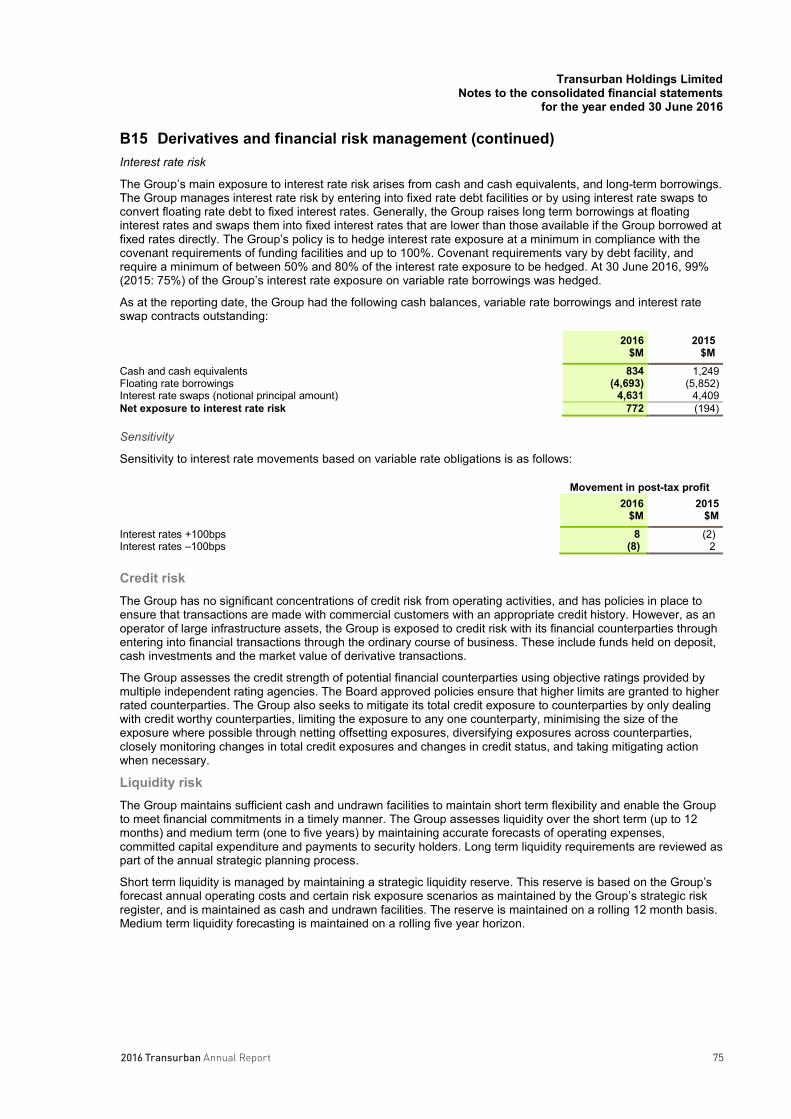
752016 Transurban Annual Report
Transurban Holdings LimitedNotes to the consolidated financial statements
for the year ended 30 June 2016
75
B15 Derivatives and financial risk management (continued)Interest rate risk
The Group’s main exposure to interest rate risk arises from cash and cash equivalents, and long-term borrowings. The Group manages interest rate risk by entering into fixed rate debt facilities or by using interest rate swaps to convert floating rate debt to fixed interest rates. Generally, the Group raises long term borrowings at floating interest rates and swaps them into fixed interest rates that are lower than those available if the Group borrowed at fixed rates directly. The Group’s policy is to hedge interest rate exposure at a minimum in compliance with the covenant requirements of funding facilities and up to 100%. Covenant requirements vary by debt facility, and require a minimum of between 50% and 80% of the interest rate exposure to be hedged. At 30 June 2016, 99%(2015: 75%) of the Group’s interest rate exposure on variable rate borrowings was hedged.
As at the reporting date, the Group had the following cash balances, variable rate borrowings and interest rate swap contracts outstanding:
2016$M
2015$M
Cash and cash equivalents 834 1,249Floating rate borrowings (4,693) (5,852)Interest rate swaps (notional principal amount) 4,631 4,409Net exposure to interest rate risk 772 (194)
Sensitivity
Sensitivity to interest rate movements based on variable rate obligations is as follows:
Movement in post-tax profit2016
$M2015
$MInterest rates +100bps 8 (2)Interest rates –100bps (8) 2
Credit risk The Group has no significant concentrations of credit risk from operating activities, and has policies in place to ensure that transactions are made with commercial customers with an appropriate credit history. However, as an operator of large infrastructure assets, the Group is exposed to credit risk with its financial counterparties through entering into financial transactions through the ordinary course of business. These include funds held on deposit, cash investments and the market value of derivative transactions.
The Group assesses the credit strength of potential financial counterparties using objective ratings provided by multiple independent rating agencies. The Board approved policies ensure that higher limits are granted to higher rated counterparties. The Group also seeks to mitigate its total credit exposure to counterparties by only dealing with credit worthy counterparties, limiting the exposure to any one counterparty, minimising the size of the exposure where possible through netting offsetting exposures, diversifying exposures across counterparties, closely monitoring changes in total credit exposures and changes in credit status, and taking mitigating action when necessary.
Liquidity risk
The Group maintains sufficient cash and undrawn facilities to maintain short term flexibility and enable the Group to meet financial commitments in a timely manner. The Group assesses liquidity over the short term (up to 12 months) and medium term (one to five years) by maintaining accurate forecasts of operating expenses, committed capital expenditure and payments to security holders. Long term liquidity requirements are reviewed as part of the annual strategic planning process.
Short term liquidity is managed by maintaining a strategic liquidity reserve. This reserve is based on the Group’s forecast annual operating costs and certain risk exposure scenarios as maintained by the Group’s strategic risk register, and is maintained as cash and undrawn facilities. The reserve is maintained on a rolling 12 month basis. Medium term liquidity forecasting is maintained on a rolling five year horizon.

2016 Transurban Annual Report76
Transurban Holdings LimitedNotes to the consolidated financial statements
for the year ended 30 June 2016
76
B15 Derivatives and financial risk management (continued)Financing arrangements
The Group had access to the following undrawn borrowing facilities at the end of the reporting period:
2016$M
2015$M
Floating rateExpiring within one year 349 –Expiring beyond one year 527 356
876 356
As at 30 June 2016, the Group has letter of credit facilities and general credit facilities in place with undrawn capacity of $22 million (2015: $24 million). The facilities are committed for the term of the facility and cannot be withdrawn by the lenders without notice.
Contractual maturities of financial liabilities
The amounts disclosed in the table are the contractual undiscounted cash flows of the Group’s financial liabilities. For interest rate swaps, the cash flows have been estimated using forward interest rates applicable at the end of the reporting period.
2016$M
1 year or less
Over 1 to 2 years
Over2 to 3years
Over3 to 4 years
Over 4 to 5 years
Over 5years
Total contractual cash flows
Carrying amount
Trade payables 410 – – – – – 410 410Borrowings 652 1,738 1,615 1,677 2,293 11,249 19,224 12,873Interest rate swaps 81 69 55 33 18 78 334 291Cross-currency swaps 93 80 54 74 51 (419) (67) (2)Concession and
promissory notes – – – – – 466 466 67Other liabilities – 45 155 – – – 200 177Total 1,236 1,932 1,879 1,784 2,362 11,374 20,567 13,816
2015$M
1 yearor less
Over1 to 2 years
Over 2 to 3years
Over3 to 4years
Over4 to 5years
Over 5years
Total contractualcash flows
Carryingamount
Trade payables 340 – – – – – 340 340Borrowings 903 2,266 2,113 1,042 1,577 10,166 18,067 12,099Interest rate swaps 88 70 39 23 8 7 235 214Cross-currency swaps 47 72 64 35 60 (345) (67) 29Concession and
promissory notes – – – – – 440 440 46Total 1,378 2,408 2,216 1,100 1,645 10,268 19,015 12,728
Capital risk management The Group is subject to a gearing ratio covenant imposed by senior secured lenders and monitors capital on the basis of the gearing ratio to ensure compliance with the covenant. There have been no breaches of the covenant during the current financial year. For further information refer to the Borrowings note B14.
The Group's objectives when managing capital is to safeguard its ability to continue as a going concern and to maintain an optimal capital structure to reduce the cost of capital, so that it can continue to provide returns to security holders and benefits for other stakeholders.
772016 Transurban Annual Report
Transurban Holdings LimitedNotes to the consolidated financial statements
for the year ended 30 June 2016
77
B15 Derivatives and financial risk management (continued)Fair value measurementsThe carrying value of the Group’s financial assets and liabilities approximate fair value. This is also generally the case with borrowings since either the interest payable on those borrowings is close to current market rates or the borrowings are of a short-term nature. The fair values of non-current borrowings are determined based on discounted cash flows using a current borrowing rate. They are classified as level 2 fair values in the fair valuehierarchy due to the use of observable inputs.
Fair value is categorised within the fair value hierarchy based on the lowest level of input that is significant to the fair value measurement as a whole:
Level 1 – quoted prices (unadjusted) in active markets for identical assets or liabilities
Level 2 – inputs other than quoted prices included within level 1 that are observable for the asset or liability, either directly (as prices) or indirectly (derived from prices)
Level 3 – inputs for the asset or liability that are not based on observable market data (unobservable inputs).
All of the Group’s financial instruments measured, recognised and disclosed at fair value were valued using market observable inputs (Level 2). There were no transfers between levels during the period and there has been no change in the valuation techniques applied.
Key estimateThe fair value of financial instruments that are not traded in an active market (for example, over-the-counter derivatives) is determined using valuation techniques. The Group uses its judgement to select a variety of methods and makes assumptions that are mainly based on market conditions existing at each reporting date. The fair value of both cross-currency interest rate swaps and interest rate swaps is calculated as the present value of the estimated future cash flows. The fair value of forward exchange contracts is determined using forward exchange market rates at the end of the reporting period.
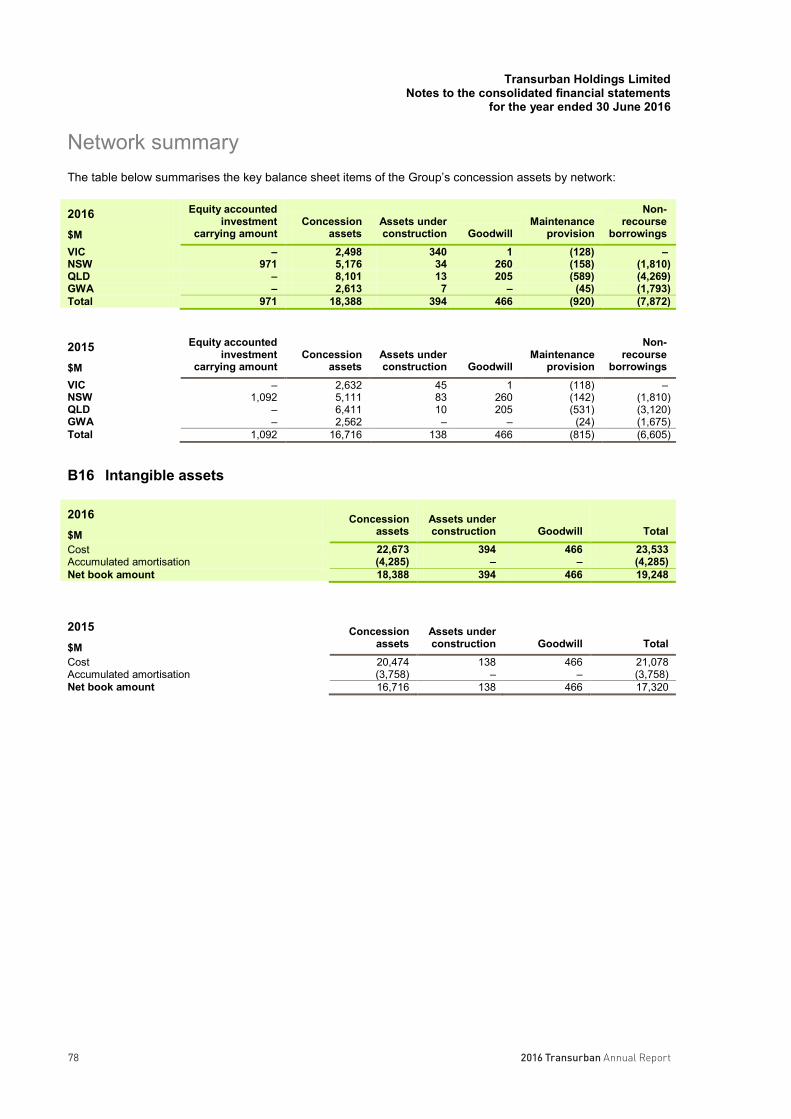
2016 Transurban Annual Report78
Transurban Holdings LimitedNotes to the consolidated financial statements
for the year ended 30 June 2016
78
Network summaryThe table below summarises the key balance sheet items of the Group’s concession assets by network:
2016$M
Equity accounted investment
carrying amountConcession
assetsAssets under construction Goodwill
Maintenance provision
Non-recourse
borrowingsVIC – 2,498 340 1 (128) –NSW 971 5,176 34 260 (158) (1,810)QLD – 8,101 13 205 (589) (4,269)GWA – 2,613 7 – (45) (1,793)Total 971 18,388 394 466 (920) (7,872)
2015$M
Equity accounted investment
carrying amountConcession
assetsAssets under construction Goodwill
Maintenanceprovision
Non-recourse
borrowingsVIC – 2,632 45 1 (118) –NSW 1,092 5,111 83 260 (142) (1,810)QLD – 6,411 10 205 (531) (3,120)GWA – 2,562 – – (24) (1,675)Total 1,092 16,716 138 466 (815) (6,605)
B16 Intangible assets
2016$M
Concessionassets
Assets underconstruction Goodwill Total
Cost 22,673 394 466 23,533Accumulated amortisation (4,285) – – (4,285)Net book amount 18,388 394 466 19,248
2015$M
Concessionassets
Assets underconstruction Goodwill Total
Cost 20,474 138 466 21,078Accumulated amortisation (3,758) – – (3,758)Net book amount 16,716 138 466 17,320

792016 Transurban Annual Report
Transurban Holdings LimitedNotes to the consolidated financial statements
for the year ended 30 June 2016
79
B16 Intangible assets (continued)
Movement in intangible assetsConcession
assets$M
Assets underconstruction
$MGoodwill
$MTotal
$MOpening balance 1 July 2014 9,315 810 261 10,386Additions 140 212 – 352Acquisition of subsidiary 6,431 – 205 6,636Currency and other adjustments 297 162 – 459Transfers 1,046 (1,046) – –Amortisation charge (513) – – (513)Net book amount 30 June 2015 16,716 138 466 17,320Additions 165 332 – 497Acquisition of subsidiary 1,880 – – 1,880Currency and other adjustments 78 – – 78Transfers 76 (76) – –Amortisation charge (527) – – (527)Net book amount 30 June 2016 18,388 394 466 19,248
Concession assets Concession assets represent the Group's rights to operate roads under Service Concession Arrangements. All concession assets are classified as intangible assets and are amortised on a straight line basis over the term of the right to operate the asset.
Transurban has the right to toll the concession assets for the concession period. Extensions to the concession period have been granted during the period for a number of individual concessions as a result of road development projects and improvements. At the end of the concession period, all concession assets are returned to the respective Government. The remaining terms of the right to operate are reflected below:
2016Years
2015Years
VIC – Victorian State Government 19 20NSW – New South Wales State Government 20 – 32 21 – 33QLD – Queensland State Government and Brisbane City Council 35 – 49 36 – 50GWA – Virginia State Government 71 72
Assets under construction Assets under construction include upgrade works as part of the CityLink-Tulla Widening project and Hills M2 –NorthConnex Integration works in New South Wales, Australia. Construction costs relating to completed works are transferred to the concession asset upon final completion of the projects.
Goodwill Goodwill primarily relates to the Group's NSW Network and Queensland Network and has arisen from the acquisition of Hills Motorway Group, Tollaust Pty Limited and the Sydney Roads Group in NSW and the Queensland Motorways Group in Queensland.
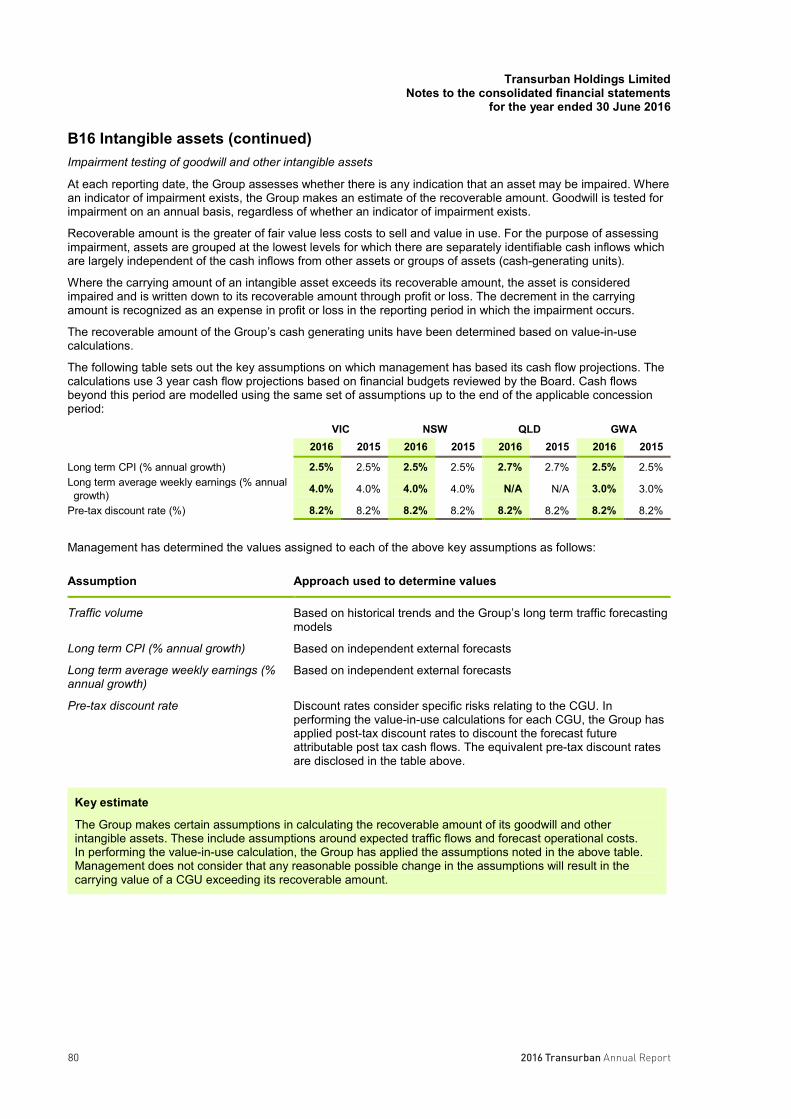
2016 Transurban Annual Report80
Transurban Holdings LimitedNotes to the consolidated financial statements
for the year ended 30 June 2016
80
B16 Intangible assets (continued)Impairment testing of goodwill and other intangible assets
At each reporting date, the Group assesses whether there is any indication that an asset may be impaired. Where an indicator of impairment exists, the Group makes an estimate of the recoverable amount. Goodwill is tested for impairment on an annual basis, regardless of whether an indicator of impairment exists.
Recoverable amount is the greater of fair value less costs to sell and value in use. For the purpose of assessing impairment, assets are grouped at the lowest levels for which there are separately identifiable cash inflows which are largely independent of the cash inflows from other assets or groups of assets (cash-generating units).
Where the carrying amount of an intangible asset exceeds its recoverable amount, the asset is considered impaired and is written down to its recoverable amount through profit or loss. The decrement in the carrying amount is recognized as an expense in profit or loss in the reporting period in which the impairment occurs.
The recoverable amount of the Group’s cash generating units have been determined based on value-in-use calculations.
The following table sets out the key assumptions on which management has based its cash flow projections. The calculations use 3 year cash flow projections based on financial budgets reviewed by the Board. Cash flows beyond this period are modelled using the same set of assumptions up to the end of the applicable concession period:
VIC NSW QLD GWA2016 2015 2016 2015 2016 2015 2016 2015
Long term CPI (% annual growth) 2.5% 2.5% 2.5% 2.5% 2.7% 2.7% 2.5% 2.5%Long term average weekly earnings (% annual
growth) 4.0% 4.0% 4.0% 4.0% N/A N/A 3.0% 3.0%
Pre-tax discount rate (%) 8.2% 8.2% 8.2% 8.2% 8.2% 8.2% 8.2% 8.2%
Management has determined the values assigned to each of the above key assumptions as follows:
Assumption Approach used to determine values
Traffic volume Based on historical trends and the Group’s long term traffic forecasting models
Long term CPI (% annual growth) Based on independent external forecasts
Long term average weekly earnings (% annual growth)
Based on independent external forecasts
Pre-tax discount rate Discount rates consider specific risks relating to the CGU. In performing the value-in-use calculations for each CGU, the Group has applied post-tax discount rates to discount the forecast future attributable post tax cash flows. The equivalent pre-tax discount rates are disclosed in the table above.
Key estimate
The Group makes certain assumptions in calculating the recoverable amount of its goodwill and other intangible assets. These include assumptions around expected traffic flows and forecast operational costs. In performing the value-in-use calculation, the Group has applied the assumptions noted in the above table. Management does not consider that any reasonable possible change in the assumptions will result in the carrying value of a CGU exceeding its recoverable amount.

812016 Transurban Annual Report
Transurban Holdings LimitedNotes to the consolidated financial statements
for the year ended 30 June 2016
81
B17 Maintenance provision
Movement in maintenance provisionCurrent
$MNon-current
$MCarrying value at 1 July 2014 77 211Additional provision recognised 80 –Acquisition of subsidiary 28 468Amounts paid/utilised (91) –Unwinding of discount – 43Transfer (10) 10Movement in foreign exchange (2) 1Carrying value at 30 June 2015 82 733Additional provision recognised 97 –Acquisition of subsidiary 4 10Amounts paid/utilised (50) –Unwinding of discount – 41Transfer (42) 42Movement in foreign exchange 3 –Carrying value at 30 June 2016 94 826
Key estimateAs part of its obligations under the service concession arrangements, the Group assumes responsibility for the maintenance and repair of installations of the publicly owned roads it operates. The Group records a provision for its present obligation to maintain the motorways held under concession deeds. The provision is included in the financial statements at the present value of expected future payments. The calculations to discount these amounts to their present value are based on the estimated timing and profile of expenditure occurring on the roads.
B18 Other liabilities – concession and promissory notes2016
$M2015
$M
M1 Eastern Distributor concession note 33 26M2 Motorway promissory note 34 20Total 67 46
Key estimate
The Group has non-interest bearing long term debt, represented by promissory notes and concession notes payable to the Government, measured at the present value of expected future payments. The calculations to discount these notes to their present value are based on the estimated timing and profile of the repayments. Assumptions are made in determining the timing and profile, based on expected available equity cash flows of the Group's cash generating units. A discount rate is used to value the promissory notes and concession notes to their present value, which is determined through reference to other facilities in the market with similar characteristics. A discount rate of 12% (2015: 12%) has been used, which recognises the subordinated nature of these notes.

2016 Transurban Annual Report82
Transurban Holdings LimitedNotes to the consolidated financial statements
for the year ended 30 June 2016
82
B18 Other liabilities – concession and promissory notes (continued)
M1 Eastern DistributorThe Eastern Distributor project deed between Airport Motorway Limited, Airport Motorway Trust and the New South Wales Roads and Maritime Services (‘RMS’) provides for annual concession fees of $15 million during the construction phase and for the first 24 years after completion of construction of the M1 Eastern Distributor. Until a certain threshold return is achieved, payments of concession fees due under the Project Deed will be satisfied by means of the issue of non-interest bearing concession notes.
The face value of concession notes on issue at 30 June 2016 is $285 million (2015: $270 million).
M2 Motorway The Hills Motorway Trust has entered into leases with the RMS. Annual lease liabilities under these leases total $7 million (2015: $7 million), indexed annually to the consumer price index over the estimated period that the M2 Motorway will be used. Until such time as a threshold return is achieved, payments under these leases can be made at any time at the discretion of the trustee of the Hills Motorway, by means of the issue of non-interest bearing promissory notes to the RMS.
The face value of promissory notes on issue at 30 June 2016 is $181 million (2015: $170 million).

832016 Transurban Annual Report
Transurban Holdings LimitedNotes to the consolidated financial statements
for the year ended 30 June 2016
83
Group structure
B19 Principles of consolidation
SubsidiariesSubsidiaries are fully consolidated from the date the Group gains control of the subsidiary and are de-consolidated from the date that control ceases.
In preparing the consolidated financial statements of the Group, all inter-entity transactions and balances have been eliminated. The accounting policies adopted by the individual entities comprising the Group are consistent with the parent company.
Non-controlling interests consist of two components: Non-controlling interest – other: external non-controlling interests relating to Transurban Queensland and
Eastern Distributor in the results and equity of subsidiaries are shown separately in the Group financial statements. The external non-controlling interests related to the 495 Express Lanes and 95 Express Lanes were acquired on 29 June 2015 and accordingly the external non-controlling interest balances have been de-recognised from this date.
Non-controlling interests that relate to THT and TIL are presented separately, but relate to equity holders of the stapled group.
Associates and joint ventures Associates are all entities over which the Group has significant influence but not control and relate to the Group’s investments in Interlink M5 and the NorthWestern Roads Group (which holds the Westlink M7 and NorthConnex assets).
The Group's share of the post-acquisition profits or losses in associates is recognised in profit or loss and its share of post-acquisition movements in reserves is recognised in other comprehensive income. These post-acquisition movements are adjusted against the carrying amount of the investment. When the Group’s cumulative share of losses in an associate exceeds its investment in the asset, the Group does not recognise any further losses from this point. Dividends received from the assets listed above reduce the carrying amount of the investment.
Changes in ownership interest The Group treats transactions with non-controlling interests that do not result in a loss of control, as transactions with equity owners of the Group. A change in ownership interest results in an adjustment between the carrying amounts of the controlling and non-controlling interests to reflect their relative interests in the subsidiary. Any difference between the amount of the adjustment to non-controlling interests and any consideration paid or received is recognised in a separate reserve within equity.

2016 Transurban Annual Report84
Transurban Holdings LimitedNotes to the consolidated financial statements
for the year ended 30 June 2016
84
B20 Material subsidiariesThe Group’s material subsidiaries are outlined in the Group structure diagram below.
1. Acquisition of non-controlling interest occurred on 29 June 2015.2. Acquisition of AirportlinkM7 occurred on 1 April 2016.
B21 Business combinations
Accounting policyBusiness combinations are accounted for using the acquisition method. The consideration transferred for the acquisition of a subsidiary comprises the fair values of the assets transferred, the liabilities incurred and the equity interests issued by the Group. The consideration transferred also includes the fair value of any contingent consideration arrangement and the fair value of any pre-existing equity interest in the subsidiary. Acquisition-related costs are expensed as incurred. Identifiable assets acquired and liabilities and contingent liabilities assumed in a business combination are, with limited exceptions, measured initially at their fair values at the acquisition date. On an acquisition-by-acquisition basis, the Group recognises any non-controlling interest in the acquiree either at fair value or at the non-controlling interest's proportionate share of the acquiree's net identifiable assets.
The excess of the consideration transferred, the amount of any non-controlling interest in the acquiree and the acquisition-date fair value of any previous equity interest in the acquiree over the fair value of the Group's share of the net identifiable assets acquired is recorded as goodwill. If those amounts are less than the fair value of the net identifiable assets of the subsidiary acquired and the measurement of all amounts has been reviewed, the difference is recognised directly in profit or loss as a bargain purchase.

852016 Transurban Annual Report
Transurban Holdings LimitedNotes to the consolidated financial statements
for the year ended 30 June 2016
85
B21 Business combinations (continued)
Accounting policy (continued)Where settlement of any part of cash consideration is deferred, the amounts payable in the future are discounted to their present value as at the date of exchange. The discount rate used is the entity's incremental borrowing rate, being the rate at which a similar borrowing could be obtained from an independent financier under comparable terms and conditions.
Contingent consideration is classified either as equity or a financial liability. Amounts classified as a financial liability are subsequently remeasured to fair value with changes in fair value recognised in profit or loss.
AirportlinkM7On 24 November 2015 the Group announced that Transurban Queensland (in which the Group holds a 62.5% equity interest) had reached agreement to acquire the AirportlinkM7 concession. The acquisition was completed on 1 April 2016.
AirportlinkM7 is an urban tunnel in Brisbane, Australia and is adjacent to three assets owned and operated by Transurban Queensland. The tunnel is complementary to the Transurban Queensland network and contributes additional scale, a long dated concession ending June 2053, investment potential and strategic value to the Group’s current portfolio.
Purchase consideration
$M
Cash paid 1,870Total purchase consideration 1,870
The consideration of $1,870 million was paid on 1 April 2016. This has been reflected in the Group’s current year financial statements.
Reconciliation of purchase consideration to cash acquired
$M
Cash paid 1,870Less: cash acquired (1)Payment for business combination, net of cash 1,869
Acquisition-related costs
Total acquisition and integration costs incurred to date are $120 million, inclusive of $108 million of stamp duty,$10 million of transaction costs and $2 million of integration costs. The total costs have been incurred in the current financial year. These acquisition costs are not included in the purchase consideration disclosed above.

2016 Transurban Annual Report86
Transurban Holdings LimitedNotes to the consolidated financial statements
for the year ended 30 June 2016
86
B21 Business combinations (continued)
AirportlinkM7 (continued)Identifiable assets acquired and liabilities assumed
The final fair values of the assets and liabilities of AirportlinkM7 as at acquisition date are as follows:
Fair value $M
Cash and cash equivalents 1Trade and other receivables 2Deferred tax assets 4Intangible assets 1,880Trade and other payables (3)Provisions (14)Total identified assets acquired 1,870
Revenue and profit contribution
From the date of acquisition to 30 June 2016, revenue of $27 million and a statutory loss after taxation of $125million was included in the profit or loss with regard to AirportlinkM7. Excluding significant items related to the acquisition, AirportlinkM7 contributed a net loss after taxation of $5 million.
If the acquisition had occurred on 1 July 2015, annualised revenue of $109 million and a statutory loss after taxation of $140 million would have been recognised for the year ended 30 June 2016. Excluding significant items related to the acquisition, the net loss after taxation would have been $20 million. These amounts have been calculated using the subsidiaries’ results and adjusting for one-off costs not related to the ongoing operations of the business.
B22 Equity accounted investmentsBelow is the reconciliation of the equity accounted carrying value of investments:
NorthWestern Roads Group M5 Motorway Total
2016$M
2015$M
2016$M
2015$M
2016$M
2015$M
Opening carrying value 1 July 872 – 220 268 1,092 268Transfer of Westlink M7 Term loan note
balance into equity accounted investment
– 892 – – – 892
Costs capitalised on creation of NWRG – 10 – – – 10Group’s share of net profits – – 17 17 17 17Group’s recognised share of other
comprehensive income – – (11) – (11) –
Dividends received (94) (30) (33) (65) (127) (95)Closing carrying value 778 872 193 220 971 1,092
Cumulative losses not recognised 534 624 – – 534 624
Joint venturesNorthWestern Roads Group (50% ownership interest)
The Group has a 50% ownership interest in the NorthWestern Roads Group, which holds 100% of the Westlink M7 Group and the NorthConnex Group. Westlink M7 holds the concession to design, construct, finance and operate the Westlink M7 Motorway in Sydney for a period of 43 years from the date of operation (16 December 2005) until June 2048, and NorthConnex holds the concession to design, construct, finance and operate the NorthConnex Tunnel in Sydney until 2048.
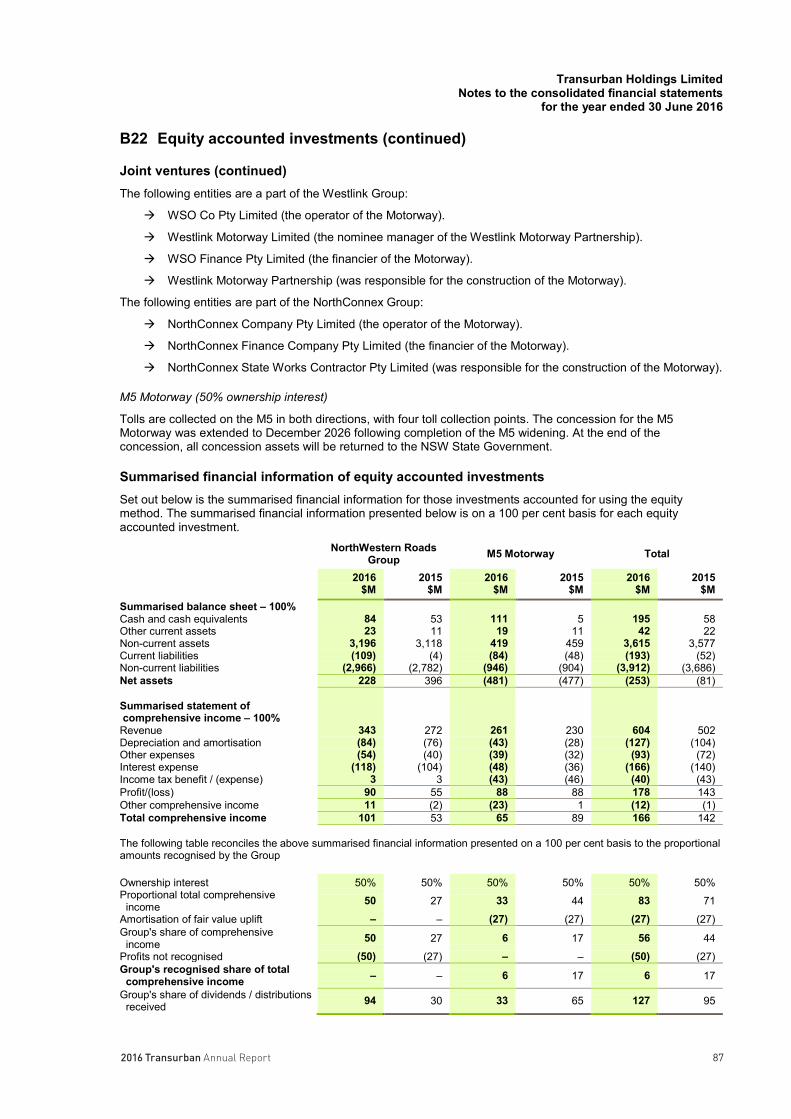
872016 Transurban Annual Report
Transurban Holdings LimitedNotes to the consolidated financial statements
for the year ended 30 June 2016
87
B22 Equity accounted investments (continued)
Joint ventures (continued)The following entities are a part of the Westlink Group:
WSO Co Pty Limited (the operator of the Motorway).
Westlink Motorway Limited (the nominee manager of the Westlink Motorway Partnership).
WSO Finance Pty Limited (the financier of the Motorway).
Westlink Motorway Partnership (was responsible for the construction of the Motorway).
The following entities are part of the NorthConnex Group:
NorthConnex Company Pty Limited (the operator of the Motorway).
NorthConnex Finance Company Pty Limited (the financier of the Motorway).
NorthConnex State Works Contractor Pty Limited (was responsible for the construction of the Motorway).
M5 Motorway (50% ownership interest)
Tolls are collected on the M5 in both directions, with four toll collection points. The concession for the M5 Motorway was extended to December 2026 following completion of the M5 widening. At the end of the concession, all concession assets will be returned to the NSW State Government.
Summarised financial information of equity accounted investmentsSet out below is the summarised financial information for those investments accounted for using the equity method. The summarised financial information presented below is on a 100 per cent basis for each equity accounted investment.
NorthWestern Roads Group M5 Motorway Total
2016$M
2015$M
2016$M
2015$M
2016$M
2015$M
Summarised balance sheet – 100%Cash and cash equivalents 84 53 111 5 195 58Other current assets 23 11 19 11 42 22Non-current assets 3,196 3,118 419 459 3,615 3,577Current liabilities (109) (4) (84) (48) (193) (52)Non-current liabilities (2,966) (2,782) (946) (904) (3,912) (3,686)Net assets 228 396 (481) (477) (253) (81)
Summarised statement ofcomprehensive income – 100%
Revenue 343 272 261 230 604 502Depreciation and amortisation (84) (76) (43) (28) (127) (104)Other expenses (54) (40) (39) (32) (93) (72)Interest expense (118) (104) (48) (36) (166) (140)Income tax benefit / (expense) 3 3 (43) (46) (40) (43)Profit/(loss) 90 55 88 88 178 143Other comprehensive income 11 (2) (23) 1 (12) (1)Total comprehensive income 101 53 65 89 166 142
The following table reconciles the above summarised financial information presented on a 100 per cent basis to the proportional amounts recognised by the Group
Ownership interest 50% 50% 50% 50% 50% 50%Proportional total comprehensive
income 50 27 33 44 83 71
Amortisation of fair value uplift – – (27) (27) (27) (27)Group's share of comprehensive
income 50 27 6 17 56 44
Profits not recognised (50) (27) – – (50) (27)Group's recognised share of total
comprehensive income – – 6 17 6 17
Group's share of dividends / distributionsreceived 94 30 33 65 127 95
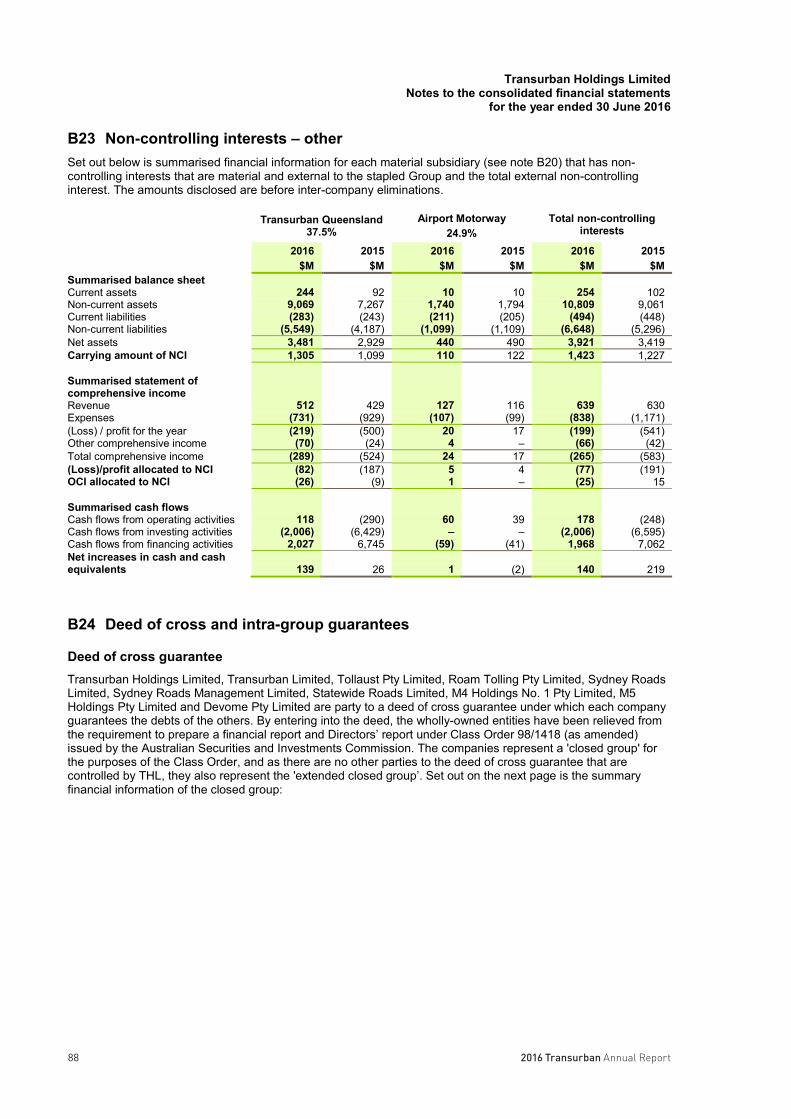
2016 Transurban Annual Report88
Transurban Holdings LimitedNotes to the consolidated financial statements
for the year ended 30 June 2016
88
B23 Non-controlling interests – other Set out below is summarised financial information for each material subsidiary (see note B20) that has non-controlling interests that are material and external to the stapled Group and the total external non-controlling interest. The amounts disclosed are before inter-company eliminations.
Transurban Queensland 37.5%
Airport Motorway 24.9%
Total non-controlling interests
2016$M
2015$M
2016$M
2015$M
2016$M
2015$M
Summarised balance sheetCurrent assets 244 92 10 10 254 102Non-current assets 9,069 7,267 1,740 1,794 10,809 9,061Current liabilities (283) (243) (211) (205) (494) (448)Non-current liabilities (5,549) (4,187) (1,099) (1,109) (6,648) (5,296)Net assets 3,481 2,929 440 490 3,921 3,419Carrying amount of NCI 1,305 1,099 110 122 1,423 1,227
Summarised statement of comprehensive incomeRevenue 512 429 127 116 639 630Expenses (731) (929) (107) (99) (838) (1,171)(Loss) / profit for the year (219) (500) 20 17 (199) (541)Other comprehensive income (70) (24) 4 – (66) (42)Total comprehensive income (289) (524) 24 17 (265) (583)(Loss)/profit allocated to NCI (82) (187) 5 4 (77) (191)OCI allocated to NCI (26) (9) 1 – (25) 15
Summarised cash flowsCash flows from operating activities 118 (290) 60 39 178 (248)Cash flows from investing activities (2,006) (6,429) – – (2,006) (6,595)Cash flows from financing activities 2,027 6,745 (59) (41) 1,968 7,062Net increases in cash and cash equivalents 139 26 1 (2) 140 219
B24 Deed of cross and intra-group guarantees
Deed of cross guaranteeTransurban Holdings Limited, Transurban Limited, Tollaust Pty Limited, Roam Tolling Pty Limited, Sydney Roads Limited, Sydney Roads Management Limited, Statewide Roads Limited, M4 Holdings No. 1 Pty Limited, M5 Holdings Pty Limited and Devome Pty Limited are party to a deed of cross guarantee under which each company guarantees the debts of the others. By entering into the deed, the wholly-owned entities have been relieved from the requirement to prepare a financial report and Directors’ report under Class Order 98/1418 (as amended) issued by the Australian Securities and Investments Commission. The companies represent a 'closed group' for the purposes of the Class Order, and as there are no other parties to the deed of cross guarantee that are controlled by THL, they also represent the 'extended closed group’. Set out on the next page is the summary financial information of the closed group:
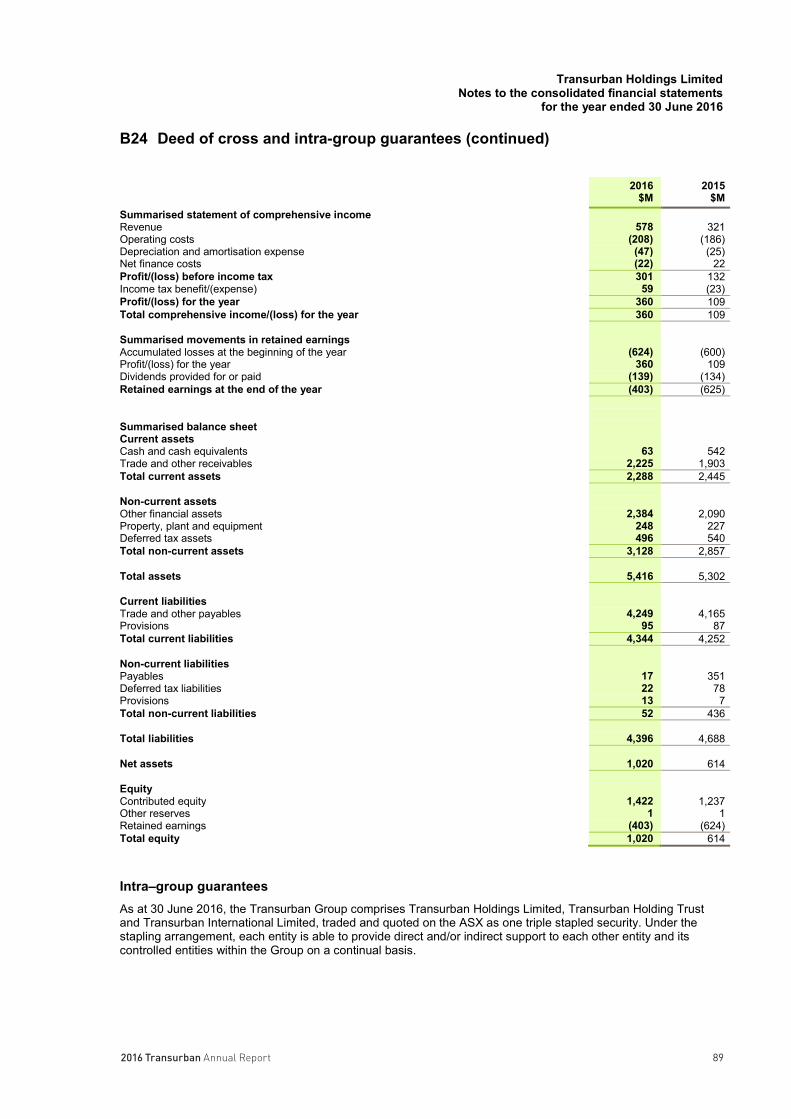
892016 Transurban Annual Report
Transurban Holdings LimitedNotes to the consolidated financial statements
for the year ended 30 June 2016
89
B24 Deed of cross and intra-group guarantees (continued)
2016$M
2015$M
Summarised statement of comprehensive incomeRevenue 578 321Operating costs (208) (186)Depreciation and amortisation expense (47) (25)Net finance costs (22) 22Profit/(loss) before income tax 301 132Income tax benefit/(expense) 59 (23)Profit/(loss) for the year 360 109Total comprehensive income/(loss) for the year 360 109
Summarised movements in retained earningsAccumulated losses at the beginning of the year (624) (600)Profit/(loss) for the year 360 109Dividends provided for or paid (139) (134)Retained earnings at the end of the year (403) (625)
Summarised balance sheetCurrent assetsCash and cash equivalents 63 542Trade and other receivables 2,225 1,903Total current assets 2,288 2,445
Non-current assetsOther financial assets 2,384 2,090Property, plant and equipment 248 227Deferred tax assets 496 540Total non-current assets 3,128 2,857
Total assets 5,416 5,302
Current liabilitiesTrade and other payables 4,249 4,165Provisions 95 87Total current liabilities 4,344 4,252
Non-current liabilitiesPayables 17 351Deferred tax liabilities 22 78Provisions 13 7Total non-current liabilities 52 436
Total liabilities 4,396 4,688
Net assets 1,020 614
EquityContributed equity 1,422 1,237Other reserves 1 1Retained earnings (403) (624)Total equity 1,020 614
Intra–group guarantees As at 30 June 2016, the Transurban Group comprises Transurban Holdings Limited, Transurban Holding Trust and Transurban International Limited, traded and quoted on the ASX as one triple stapled security. Under the stapling arrangement, each entity is able to provide direct and/or indirect support to each other entity and its controlled entities within the Group on a continual basis.
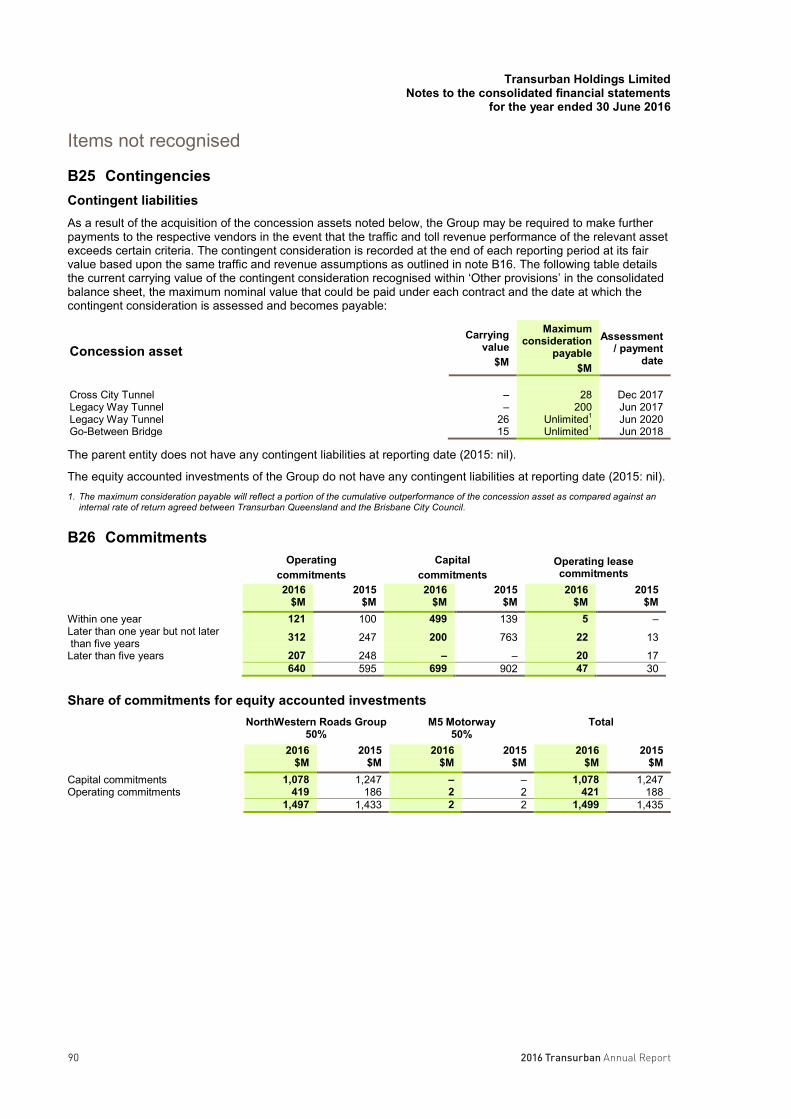
2016 Transurban Annual Report90
Transurban Holdings LimitedNotes to the consolidated financial statements
for the year ended 30 June 2016
90
Items not recognised
B25 ContingenciesContingent liabilities As a result of the acquisition of the concession assets noted below, the Group may be required to make further payments to the respective vendors in the event that the traffic and toll revenue performance of the relevant asset exceeds certain criteria. The contingent consideration is recorded at the end of each reporting period at its fair value based upon the same traffic and revenue assumptions as outlined in note B16. The following table details the current carrying value of the contingent consideration recognised within ‘Other provisions’ in the consolidated balance sheet, the maximum nominal value that could be paid under each contract and the date at which the contingent consideration is assessed and becomes payable:
Concession assetCarrying
value$M
Maximum consideration
payable$M
Assessment / payment
date
Cross City Tunnel – 28 Dec 2017Legacy Way Tunnel – 200 Jun 2017Legacy Way Tunnel 26 Unlimited1 Jun 2020Go-Between Bridge 15 Unlimited1 Jun 2018
The parent entity does not have any contingent liabilities at reporting date (2015: nil).
The equity accounted investments of the Group do not have any contingent liabilities at reporting date (2015: nil).1. The maximum consideration payable will reflect a portion of the cumulative outperformance of the concession asset as compared against an
internal rate of return agreed between Transurban Queensland and the Brisbane City Council.
B26 CommitmentsOperating
commitmentsCapital
commitmentsOperating leasecommitments
2016$M
2015$M
2016$M
2015$M
2016$M
2015$M
Within one year 121 100 499 139 5 –Later than one year but not later than five years 312 247 200 763 22 13
Later than five years 207 248 – – 20 17640 595 699 902 47 30
Share of commitments for equity accounted investmentsNorthWestern Roads Group
50%M5 Motorway
50%Total
2016$M
2015$M
2016$M
2015$M
2016$M
2015$M
Capital commitments 1,078 1,247 – – 1,078 1,247Operating commitments 419 186 2 2 421 188
1,497 1,433 2 2 1,499 1,435
912016 Transurban Annual Report
Transurban Holdings Limited Notes to the consolidated financial statements
for the year ended 30 June 2016
91
B27 Subsequent events The following events have occurred subsequent to year end:
On 7 July 2016, Westlink M7 priced $500 million of secured notes (‘Notes’) under its Australian Medium Term Note Programme. The Notes will be issued in two tranches, consisting of $400 million secured fixed rate 7-year notes and $100 million of secured floating rate 10-year medium term notes. The floating rate notes will be fully hedged.
Approximately $150 million of the proceeds raised will be used to repay existing Westlink M7 debt that begins to reach maturity from August 2017. Approximately $350 million of proceeds will be utilised for general corporate purposes by the NorthWestern Roads Group (‘NWRG’). Settlement of the Notes occurred on 14 July 2016. Transurban holds a 50% interest in NWRG with the investment recorded within the equity accounted investments balance.
On 12 July 2016, Transurban Finance Company priced a private placement of NOK$750 million (AUD$117 million) of senior secured 11 year notes under its Euro Medium Term Note Programme. The proceeds will be used to repay existing debt. Settlement occurred on 26 July 2016 and is subject to certain closing conditions.
On 20 July 2016, Lane Cove Tunnel drew down $200 million of funds that were raised as part of the Lane Cove Tunnel debt refinancing that was announced in May 2016. The funds will be used to repay existing debt at the Transurban Group level.
Other than what is noted above, there has not arisen in the interval between the end of the financial year and the date of this report any matter or circumstance that has significantly affected, or may significantly affect, the operations of the Group, and results of those operations, or the state of affairs of the Group, in future financial years.

2016 Transurban Annual Report92
Transurban Holdings LimitedNotes to the consolidated financial statements
for the year ended 30 June 2016
92
Other
B28 Related party transactionsJoint ventures
2016$’000
2015$’000
Transactions with related partiesRevenue from services 14,657 13,346Interest income 23,283 41,113Repayment of M5 debt notes – 11,683
Outstanding balances with related partiesM5 debt notes 70,000 70,000NorthConnex shareholder loan notes 298,964 95,253
No provision for doubtful debts has been raised in relation to any outstanding balances, and no expense has been recognised in respect of bad or doubtful debts from related parties.
M5 debt notes
The M5 debt notes are Transurban’s debt funding contribution to the M5 West Widening Project. The fixed maturity date of the notes is 10 years after financial close of the Project. The interest rate charged on these notes is fixed at 5.0% for the first three years following financial close.
NorthConnex shareholder loan notes
The Shareholder loan notes (‘SLNs’) earn interest at a fixed rate of 9.0% until the final day of the NorthConnex concession period. Any unpaid interest is capitalised and deemed to subscribe for further loan notes with an aggregate principal amount equal to that unpaid interest.
The SLNs are classified as a held-to-maturity receivable. It is not classified as an investment for equity accounting purposes, and therefore has not been affected by equity accounting losses from the associate. All SLNs are denominated in Australian currency.
B29 Key management personnel compensationThe remuneration amounts below represent the entire amounts paid by the Group.
2016$
2015$
Short-term employee benefits 12,204,487 11,573,323Post-employment benefits 289,149 280,011Long-term benefits 55,829 (83,978)1
Share-based payments 5,371,997 3,631,691Deferred short term incentives 2,980,450 1,279,396Termination benefits – 347,272
20,901,912 17,027,715
1. Includes a reversal of accrued long service leave due to the departure of key management personnel during the year.
Detailed remuneration disclosures including the key management personnel are made in the remuneration report in the Directors' report.

932016 Transurban Annual Report
Transurban Holdings LimitedNotes to the consolidated financial statements
for the year ended 30 June 2016
93
B30 Remuneration of auditors During the year the following fees were paid or payable for services provided by the auditor of the Group and its related practices:
Amounts received or due and receivable by PricewaterhouseCoopers
2016$
2015$
Audit and other assurance servicesAudit and review of financial reports 2,190,000 2,293,000Other assurance services 444,300 173,600
2,634,300 2,466,600Other consulting services – 243,915Total remuneration for PricewaterhouseCoopers 2,634,300 2,710,515Total auditors remuneration 2,634,300 2,710,515
B31 Parent entity disclosuresThe financial information for the parent entity, Transurban Holdings Limited, has been prepared on the same basis as the consolidated financial statements, except as set out below.
Investments in subsidiaries, associates and joint ventures
Investments in subsidiaries, associates and joint ventures are accounted for at cost in the parent entity financial statements of Transurban Holdings Limited. Dividends received from associates are recognised in the parent entity's profit or loss, rather than being deducted from the carrying amount of these investments.
Tax consolidation legislation
In addition to its own current and deferred tax amounts, Transurban Holdings Limited also recognises the current tax liabilities (or assets) and the deferred tax assets arising from unused tax losses and unused tax credits assumed from controlled entities in the tax consolidated group.
Assets or liabilities arising under tax funding agreements with the tax consolidated entities are recognised as amounts receivable from or payable to other entities in the Group. Any difference between the amounts assumed and amounts receivable or payable under the tax funding agreement are recognised as a contribution to (or distribution from) wholly owned tax consolidated entities.
Summary financial information
The individual financial statements for the parent entity report the following aggregate amounts:
2016$M
2015$M
Balance sheetCurrent assets 2,259 1,933Total assets 5,868 5,826Current liabilities (124) (117)Total liabilities (4,149) (4,531)Net assets 1,719 1,295
Shareholders' equityContributed equity 1,422 1,237Reserves 1 1Retained earnings 296 57Total equity 1,719 1,295
Profit for the year 376 104Total comprehensive income 376 104
Guarantees entered into by the parent entity
There are cross guarantees given by Transurban Holdings Limited, Transurban Limited, Tollaust Pty Limited, Roam Tolling Pty Limited, Sydney Roads Limited, Sydney Roads Management Limited, Statewide Roads Limited, M4 Holdings No 1 Pty Limited, Devome Pty Limited and M5 Holdings Pty Limited as described in note B24.

2016 Transurban Annual Report94
Transurban Holdings Limitedfor the year ended 30 June 2016
for the year ended 30 June 2
94
Section C: Transurban Holding Trust (‘THT’) and Transurban International Limited (‘TIL’)financial statementsConsolidated statement of comprehensive incomeConsolidated balance sheetConsolidated statement of changes in equityConsolidated statement of cash flows
Section D: Notes to the THT and TIL financial statementsBasis of preparation and significant changes
D1Introduction
D2Trust formation and termination
Operating performance
D3Segment information
D4Revenue
D5Income tax
Security holder outcomes
D6Distributions
D7Earnings per stapled security
Capital and borrowings
D8Reserves
D9Net finance costs
D10Borrowings
D11Derivatives and financial riskmanagement
Network summary
D12Intangible assets
D13Other liabilities –concession and promissory notes
Group structure D14Equity accounted investments
D15Non-controlling interests
Other D16Related party transactions
D17Parent entity financial information
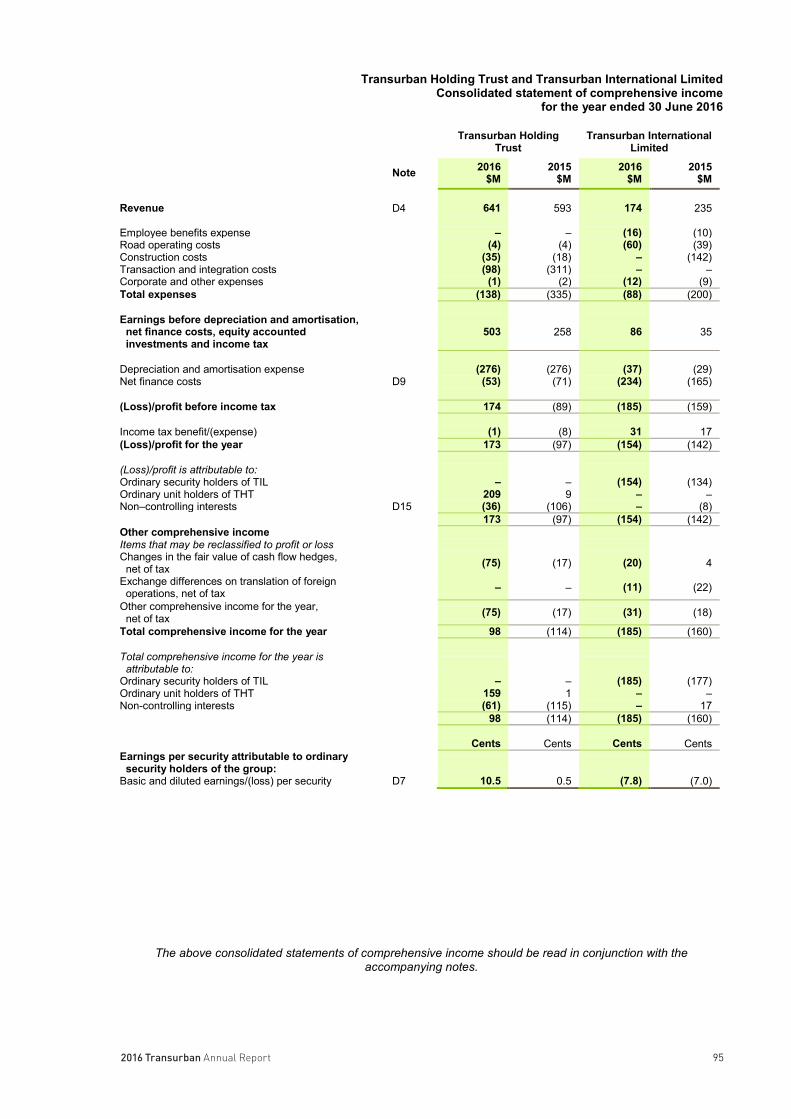
952016 Transurban Annual Report
Transurban Holding Trust and Transurban International LimitedConsolidated statement of comprehensive income
for the year ended 30 June 2016
95
Transurban Holding Trust
Transurban International Limited
Note 2016$M
2015$M
2016$M
2015$M
Revenue D4 641 593 174 235
Employee benefits expense – – (16) (10)Road operating costs (4) (4) (60) (39)Construction costs (35) (18) – (142)Transaction and integration costs (98) (311) – –Corporate and other expenses (1) (2) (12) (9)Total expenses (138) (335) (88) (200)
Earnings before depreciation and amortisation, net finance costs, equity accounted investments and income tax
503 258 86 35
Depreciation and amortisation expense (276) (276) (37) (29)Net finance costs D9 (53) (71) (234) (165)
(Loss)/profit before income tax 174 (89) (185) (159)
Income tax benefit/(expense) (1) (8) 31 17(Loss)/profit for the year 173 (97) (154) (142)
(Loss)/profit is attributable to:Ordinary security holders of TIL – – (154) (134)Ordinary unit holders of THT 209 9 – –Non–controlling interests D15 (36) (106) – (8)
173 (97) (154) (142)Other comprehensive incomeItems that may be reclassified to profit or lossChanges in the fair value of cash flow hedges,
net of tax (75) (17) (20) 4
Exchange differences on translation of foreign operations, net of tax – – (11) (22)
Other comprehensive income for the year, net of tax (75) (17) (31) (18)
Total comprehensive income for the year 98 (114) (185) (160)
Total comprehensive income for the year is attributable to:
Ordinary security holders of TIL – – (185) (177)Ordinary unit holders of THT 159 1 – –Non-controlling interests (61) (115) – 17
98 (114) (185) (160)
Cents Cents Cents CentsEarnings per security attributable to ordinary
security holders of the group:Basic and diluted earnings/(loss) per security D7 10.5 0.5 (7.8) (7.0)
The above consolidated statements of comprehensive income should be read in conjunction with the accompanying notes.

2016 Transurban Annual Report96
Transurban Holding Trust and Transurban International LimitedConsolidated balance sheet
for the year ended 30 June 2016
96
Transurban HoldingTrust
Transurban International Limited
Note 2016$M
2015$M
2016$M
2015$M
ASSETSCurrent assetsCash and cash equivalents 229 156 245 179Loans to related parties 2,377 2,468 8 17Trade and other receivables 2 1 16 12Total current assets 2,608 2,625 269 208
Non-current assetsEquity accounted investments D14 768 862 – –Derivative financial instruments – 16 – –Related party receivables 5,966 5,701 – –Concession notes 961 866 – –Property, plant and equipment – – 4 3Deferred tax assets D5 41 – 352 163Intangible assets D12 9,920 8,414 2,620 2,562Total non-current assets 17,656 15,859 2,976 2,728
Total assets 20,264 18,484 3,245 2,936
LIABILITIESCurrent liabilitiesRelated party payables – 629 1,560 1,398Trade and other payables 142 30 29 39Borrowings D10 276 – – –Maintenance provision – – 3 2Distribution payable D6 446 372 – –Derivative financial instruments D11 11 2 – –Other liabilities 44 38 5 6Total current liabilities 919 1,071 1,597 1,445
Non–current liabilitiesMaintenance provision – – 42 22Deferred tax liabilities D5 – – 282 134Related party payables 5,101 4,944 – –Borrowings D10 5,483 4,394 1,793 1,675Derivative financial instruments D11 148 76 87 54Other liabilities 89 20 – –Total non–current liabilities 10,821 9,434 2,204 1,885
Total liabilities 11,740 10,505 3,801 3,330
Net assets/(liabilities) 8,524 7,979 (556) (394)
EQUITYContributed equity – – 302 279Issued units 10,520 9,584 – –Reserves D8 (92) (43) (176) (145)Accumulated losses (3,132) (2,579) (682) (528)Non-controlling interests D15 1,228 1,017 – –Total equity 8,524 7,979 (556) (394)
The above consolidated balance sheets should be read in conjunction with the accompanying notes.
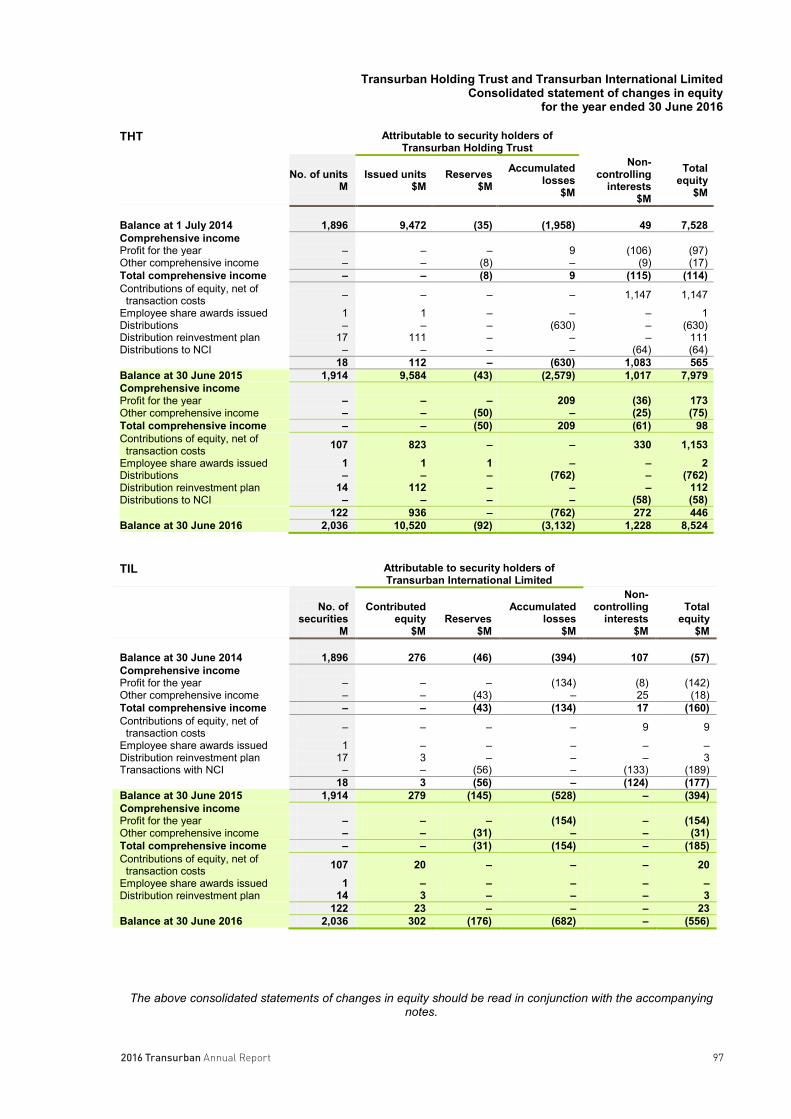
972016 Transurban Annual Report
Transurban Holding Trust and Transurban International LimitedConsolidated statement of changes in equity
for the year ended 30 June 2016
97
THT Attributable to security holders of Transurban Holding Trust
No. of unitsM
Issued units$M
Reserves$M
Accumulated losses
$M
Non-controlling
interests$M
Total equity
$M
Balance at 1 July 2014 1,896 9,472 (35) (1,958) 49 7,528Comprehensive incomeProfit for the year – – – 9 (106) (97)Other comprehensive income – – (8) – (9) (17)Total comprehensive income – – (8) 9 (115) (114)Contributions of equity, net of
transaction costs – – – – 1,147 1,147
Employee share awards issued 1 1 – – – 1Distributions – – – (630) – (630)Distribution reinvestment plan 17 111 – – – 111Distributions to NCI – – – – (64) (64)
18 112 – (630) 1,083 565Balance at 30 June 2015 1,914 9,584 (43) (2,579) 1,017 7,979Comprehensive incomeProfit for the year – – – 209 (36) 173Other comprehensive income – – (50) – (25) (75)Total comprehensive income – – (50) 209 (61) 98Contributions of equity, net of
transaction costs 107 823 – – 330 1,153Employee share awards issued 1 1 1 – – 2Distributions – – – (762) – (762)Distribution reinvestment plan 14 112 – – – 112Distributions to NCI – – – – (58) (58)
122 936 – (762) 272 446Balance at 30 June 2016 2,036 10,520 (92) (3,132) 1,228 8,524
TIL Attributable to security holders of Transurban International Limited
No. of securities
M
Contributed equity
$MReserves
$M
Accumulated losses
$M
Non-controlling
interests$M
Total equity
$M
Balance at 30 June 2014 1,896 276 (46) (394) 107 (57)Comprehensive incomeProfit for the year – – – (134) (8) (142)Other comprehensive income – – (43) – 25 (18)Total comprehensive income – – (43) (134) 17 (160)Contributions of equity, net of
transaction costs – – – – 9 9
Employee share awards issued 1 – – – – –Distribution reinvestment plan 17 3 – – – 3Transactions with NCI – – (56) – (133) (189)
18 3 (56) – (124) (177)Balance at 30 June 2015 1,914 279 (145) (528) – (394)Comprehensive incomeProfit for the year – – – (154) – (154)Other comprehensive income – – (31) – – (31)Total comprehensive income – – (31) (154) – (185)Contributions of equity, net of
transaction costs 107 20 – – – 20Employee share awards issued 1 – – – – –Distribution reinvestment plan 14 3 – – – 3
122 23 – – – 23Balance at 30 June 2016 2,036 302 (176) (682) – (556)
The above consolidated statements of changes in equity should be read in conjunction with the accompanying notes.

2016 Transurban Annual Report98
Transurban Holding Trust and Transurban International LimitedConsolidated statement of cash flows
30 June 2016
98
TransurbanHolding Trust
Transurban International Limited
Note 2016$M
2015$M
2016$M
2015$M
Cash flows from operating activitiesReceipts from customers 574 551 167 105Payments to suppliers (2) (42) (70) (83)Payments for maintenance of intangibles – – (1) (1)Transaction costs related to acquisitions – (311) – –Interest received 220 127 – –Interest paid (495) (413) (28) (24)Income taxes (paid)/refunds received – (3) – –Net cash outflow from operating activities (a) 297 (91) 68 (3)
Cash flows from investing activitiesPayments for acquisition of subsidiary (1,710) (5,240) – –Payments for property, plant and equipment – – (1) –Payments for intangible assets (23) (21) (19) (166)Distributions received from equity accounted investments 94 – – –Net cash outflow from investing activities (1,639) (5,261) (20) (166)
Cash flows from financing activitiesLoans (to)/from related parties (278) (1,590) 18 236Repayment of loans from/(to) related parties (160) 3,892 (26) (4)Proceeds from issue of shares 821 – 20 9Proceeds from borrowings(net of cost) 2,541 3,612 – 117Repayment of borrowings (1,205) (1,056) – –Payment for acquisition of non-controlling interest – – – (189)Distributions paid to Transurban Group's security
holders (579) (515) – –
Distributions paid to non-controlling interests in Subsidiaries (55) (57) – –
Proceeds from equity issued to non-controlling interests 330 1,147 – –Net cash inflow from financing activities 1,415 5,433 12 169
Net increase/(decrease) in cash and cash equivalents 73 81 60 –
Cash and cash equivalents at the beginning of the year 156 75 179 147Effects of exchange rate changes on cash and cash
equivalents – – 6 32
Cash and cash equivalents at end of year 229 156 245 179
(a) Reconciliation of (loss)/profit after income tax to net cash inflow from operation activitiesTHT TIL
2016$M
2015$M
2016$M
2015$M
Profit/(loss) for the year 173 (97) (154) (142)Depreciation and amortisation 276 276 37 29Non-cash net finance costs 36 (3) 82 65Capitalised interest income (95) (76) – –Net construction revenue – – – (5)
Change in operating assets and liabilities:(Increase)/decrease in trade and other receivables (1) 43 (4) (10)(Decrease)/increase in related party operating loans (208) (260) 115 80Increase/(decrease) in unearned income – 1 – (10)Increase/(decrease) in trade creditors and accruals 112 20 2 (1)Increase/(decrease) in other operating provisions – – – 10Increase/(decrease) in provision for income taxes
payable 1 5 (31) (19)
Increase/(decrease) in maintenance provision – – 21 –Increase/(decrease) in other liabilities 3 – – –Net cash outflow from operating activities 297 (91) 68 (3)
The above consolidated statements of cash flows should be read in conjunction with the accompanying notes.

992016 Transurban Annual Report
Transurban Holding Trust and Transurban International LimitedNotes to the THT and TIL financial statements
30 June 2016
99
Basis of preparation and significant changesD1 IntroductionThe Transurban Holding Trust Group consists of Transurban Holding Trust (‘THT’) and the entities it controls (‘THT Group’) and the Transurban International Limited Group consists of Transurban International Limited (‘TIL’) and the entities it controls (‘TIL Group’). THT and TIL form part of the stapled Transurban Group.
THT is registered as a managed investment scheme under Chapter 5C of the Corporations Act 2001, and as a result requires a responsible entity. The responsible entity of the THT is Transurban Infrastructure Management Limited (‘TIML’). TIML is the responsible entity of the Trust and is responsible for performing all functions that are required under the Corporations Act 2001 of a responsible entity.
THT is a Trust registered and domiciled in Australia.
TIL is a public company limited by shares and incorporated in Australia.
Going concernTIL’s current liabilities exceed its current assets by $1,328 million as at 30 June 2016. This is primarily attributable to a $1,560 million loan payable to another entity within the Transurban Group. Excluding this loan, the TIL Group has net current assets of $232 million.
Under the stapling arrangement, each entity is able to provide direct and / or indirect support to each other entity and its controlled entities within the Transurban Group.
The financial reports have been prepared on a going concern basis, which assumes the continuity of normal operations.
D2 Trust formation and termination The Transurban Holding Trust was established on 15 November 2001 and has no termination date. The Trust was registered as a managed investment scheme by the Australian Securities and Investments Commission on 28 November 2001.
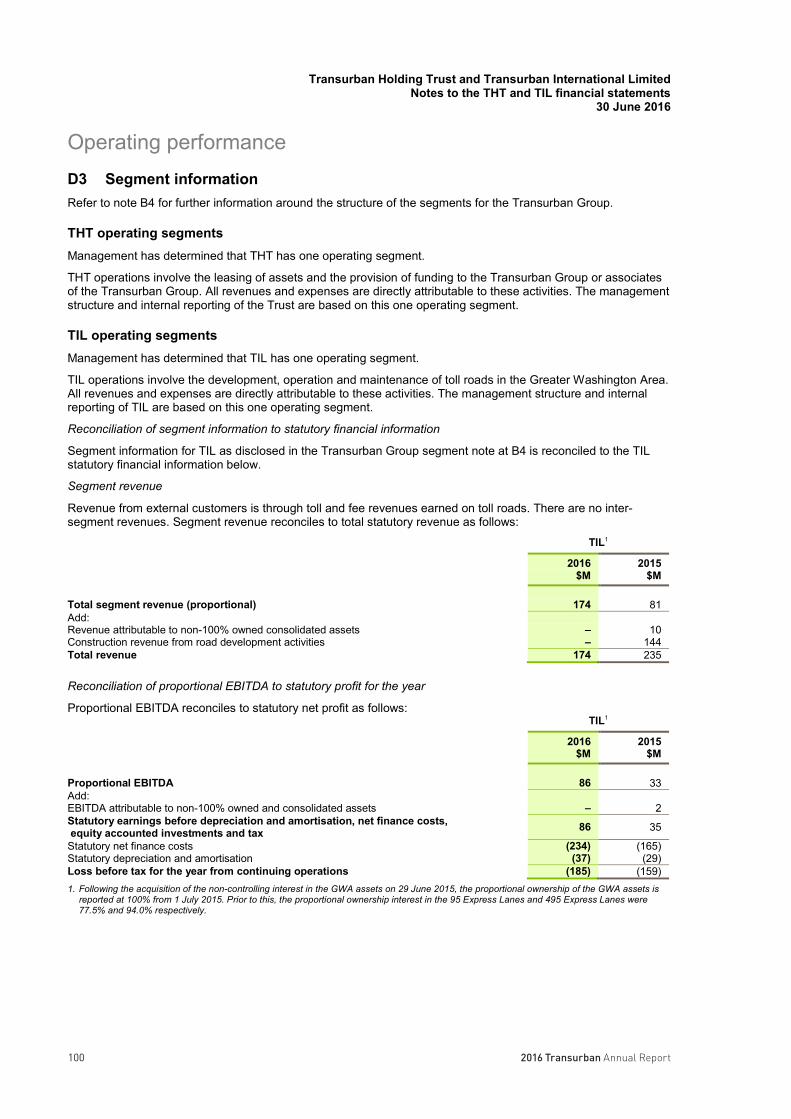
2016 Transurban Annual Report100
Transurban Holding Trust and Transurban International LimitedNotes to the THT and TIL financial statements
30 June 2016
100
Operating performanceD3 Segment informationRefer to note B4 for further information around the structure of the segments for the Transurban Group.
THT operating segmentsManagement has determined that THT has one operating segment.
THT operations involve the leasing of assets and the provision of funding to the Transurban Group or associates of the Transurban Group. All revenues and expenses are directly attributable to these activities. The management structure and internal reporting of the Trust are based on this one operating segment.
TIL operating segmentsManagement has determined that TIL has one operating segment.
TIL operations involve the development, operation and maintenance of toll roads in the Greater Washington Area.All revenues and expenses are directly attributable to these activities. The management structure and internal reporting of TIL are based on this one operating segment.
Reconciliation of segment information to statutory financial information
Segment information for TIL as disclosed in the Transurban Group segment note at B4 is reconciled to the TIL statutory financial information below.
Segment revenue
Revenue from external customers is through toll and fee revenues earned on toll roads. There are no inter-segment revenues. Segment revenue reconciles to total statutory revenue as follows:
TIL1
2016$M
2015$M
Total segment revenue (proportional) 174 81Add:Revenue attributable to non-100% owned consolidated assets – 10Construction revenue from road development activities – 144Total revenue 174 235
Reconciliation of proportional EBITDA to statutory profit for the year
Proportional EBITDA reconciles to statutory net profit as follows:TIL1
2016$M
2015$M
Proportional EBITDA 86 33Add:EBITDA attributable to non-100% owned and consolidated assets – 2Statutory earnings before depreciation and amortisation, net finance costs, equity accounted investments and tax 86 35
Statutory net finance costs (234) (165)Statutory depreciation and amortisation (37) (29)Loss before tax for the year from continuing operations (185) (159)1. Following the acquisition of the non-controlling interest in the GWA assets on 29 June 2015, the proportional ownership of the GWA assets is
reported at 100% from 1 July 2015. Prior to this, the proportional ownership interest in the 95 Express Lanes and 495 Express Lanes were77.5% and 94.0% respectively.
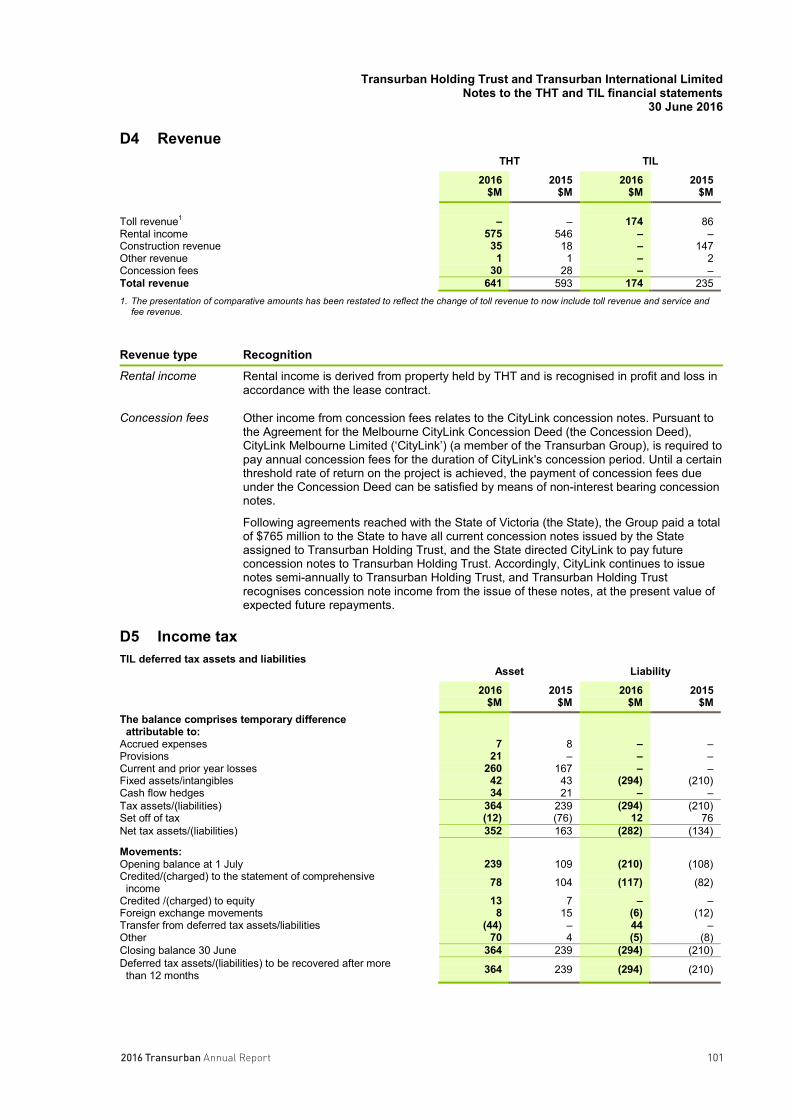
1012016 Transurban Annual Report
Transurban Holding Trust and Transurban International LimitedNotes to the THT and TIL financial statements
30 June 2016
101
D4 RevenueTHT TIL
2016$M
2015$M
2016$M
2015$M
Toll revenue1 – – 174 86Rental income 575 546 – –Construction revenue 35 18 – 147Other revenue 1 1 – 2Concession fees 30 28 – –Total revenue 641 593 174 2351. The presentation of comparative amounts has been restated to reflect the change of toll revenue to now include toll revenue and service and
fee revenue.
Revenue type Recognition
Rental income Rental income is derived from property held by THT and is recognised in profit and loss in accordance with the lease contract.
Concession fees Other income from concession fees relates to the CityLink concession notes. Pursuant to the Agreement for the Melbourne CityLink Concession Deed (the Concession Deed), CityLink Melbourne Limited (‘CityLink’) (a member of the Transurban Group), is required to pay annual concession fees for the duration of CityLink's concession period. Until a certain threshold rate of return on the project is achieved, the payment of concession fees due under the Concession Deed can be satisfied by means of non-interest bearing concession notes.
Following agreements reached with the State of Victoria (the State), the Group paid a total of $765 million to the State to have all current concession notes issued by the State assigned to Transurban Holding Trust, and the State directed CityLink to pay future concession notes to Transurban Holding Trust. Accordingly, CityLink continues to issue notes semi-annually to Transurban Holding Trust, and Transurban Holding Trust recognises concession note income from the issue of these notes, at the present value of expected future repayments.
D5 Income tax TIL deferred tax assets and liabilities
Asset Liability
2016$M
2015$M
2016$M
2015$M
The balance comprises temporary difference attributable to:
Accrued expenses 7 8 – –Provisions 21 – – –Current and prior year losses 260 167 – –Fixed assets/intangibles 42 43 (294) (210)Cash flow hedges 34 21 – –Tax assets/(liabilities) 364 239 (294) (210)Set off of tax (12) (76) 12 76Net tax assets/(liabilities) 352 163 (282) (134)
Movements:Opening balance at 1 July 239 109 (210) (108)Credited/(charged) to the statement of comprehensive
income 78 104 (117) (82)
Credited /(charged) to equity 13 7 – –Foreign exchange movements 8 15 (6) (12)Transfer from deferred tax assets/liabilities (44) – 44 –Other 70 4 (5) (8)Closing balance 30 June 364 239 (294) (210)Deferred tax assets/(liabilities) to be recovered after more
than 12 months 364 239 (294) (210)
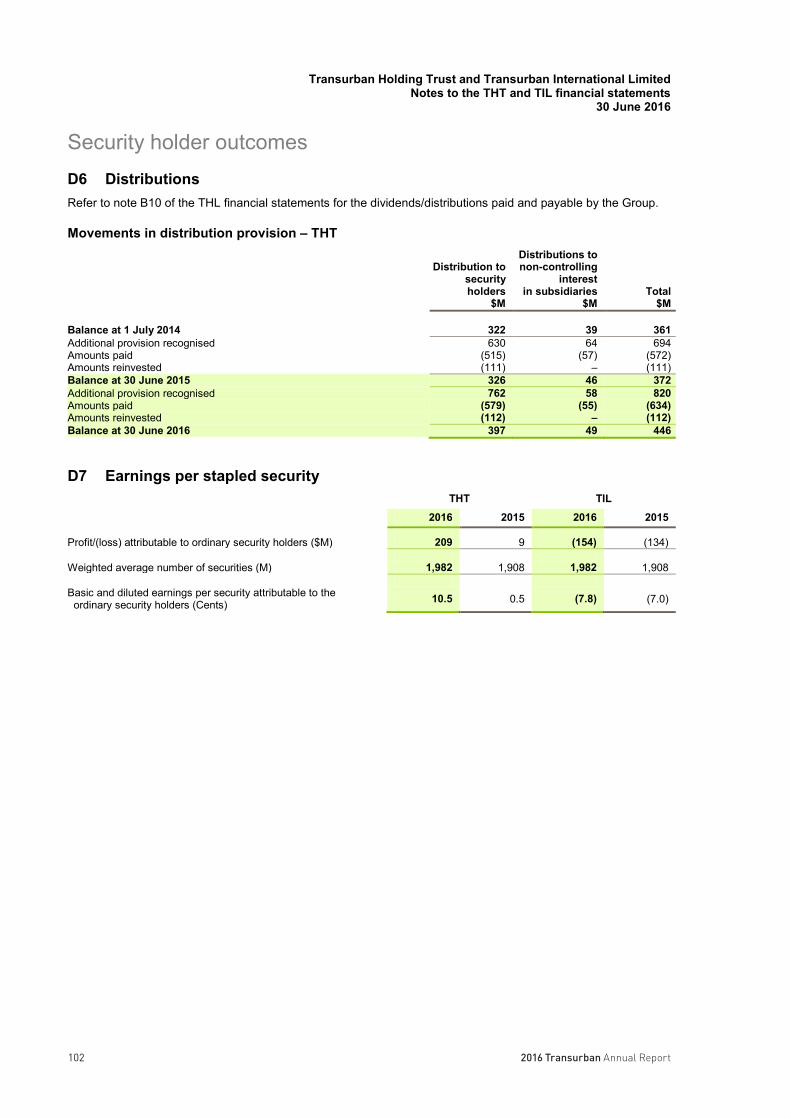
2016 Transurban Annual Report102
Transurban Holding Trust and Transurban International LimitedNotes to the THT and TIL financial statements
30 June 2016
102
Security holder outcomesD6 Distributions Refer to note B10 of the THL financial statements for the dividends/distributions paid and payable by the Group.
Movements in distribution provision – THT
Distribution to security holders
$M
Distributions to non-controlling
interest in subsidiaries
$MTotal
$M
Balance at 1 July 2014 322 39 361Additional provision recognised 630 64 694Amounts paid (515) (57) (572)Amounts reinvested (111) – (111)Balance at 30 June 2015 326 46 372Additional provision recognised 762 58 820Amounts paid (579) (55) (634)Amounts reinvested (112) – (112)Balance at 30 June 2016 397 49 446
D7 Earnings per stapled securityTHT TIL
2016 2015 2016 2015
Profit/(loss) attributable to ordinary security holders ($M) 209 9 (154) (134)
Weighted average number of securities (M) 1,982 1,908 1,982 1,908
Basic and diluted earnings per security attributable to the ordinary security holders (Cents) 10.5 0.5 (7.8) (7.0)

1032016 Transurban Annual Report
Transurban Holding Trust and Transurban International Limited Notes to the THT and TIL financial statements
30 June 2016
103
Capital and borrowings
D8 Reserves Refer to note B12 for a description of the nature and purpose of each reserve.
THT
Cash flow hedges
$M
Share-based payments
$M Total
$M Balance 1 July 2014 (40) 5 (35) Revaluation (8) – (8) Balance 30 June 2015 (48) 5 (43) Revaluation (50) 1 (49) Balance 30 June 2016 (98) 6 (92)
TIL
Cash flow hedges
$M
Share-based
payments $M
Foreign currency
translation $M
Transactions with non-
controlling interests
$M Total
$M Balance 1 July 2014 – – (44) (2) (46) Revaluation, net of tax 4 – – – 4 Currency translation differences – – (47) – (47) Transactions with NCI – – – (56) (56) Balance 30 June 2015 4 – (91) (58) (145) Revaluation, net of tax (20) – – – (20) Currency translation differences – – (11) – (11) Balance 30 June 2016 (16) – (102) (58) (176)
D9 Net finance income and costs THT TIL
2016
$M 2015
$M 2016
$M 2015
$M Finance income Interest income from related parties 477 371 – – Other interest income 8 1 – – Net foreign exchange gains 2 9 – – Re-measurement of promissory note payable – 6 – – Re-measurement of concession notes receivable 63 44 – – Total finance income 550 431 – – Finance costs Interest and finance charges paid/payable (587) (502) (230) (154) Unwind of discount on liabilities – other liabilities (3) – – – Unwind of discount on liabilities – promissory note (13) – – – Net foreign exchange losses – – (4) (11) Total finance costs (603) (502) (234) (165) Net finance costs (53) (71) (234) (165)
Re-measurement of concession notes Re-measurement of concession notes represents the discount unwinding over the passage of time on these notes and the change in the payment profile of the concession notes.
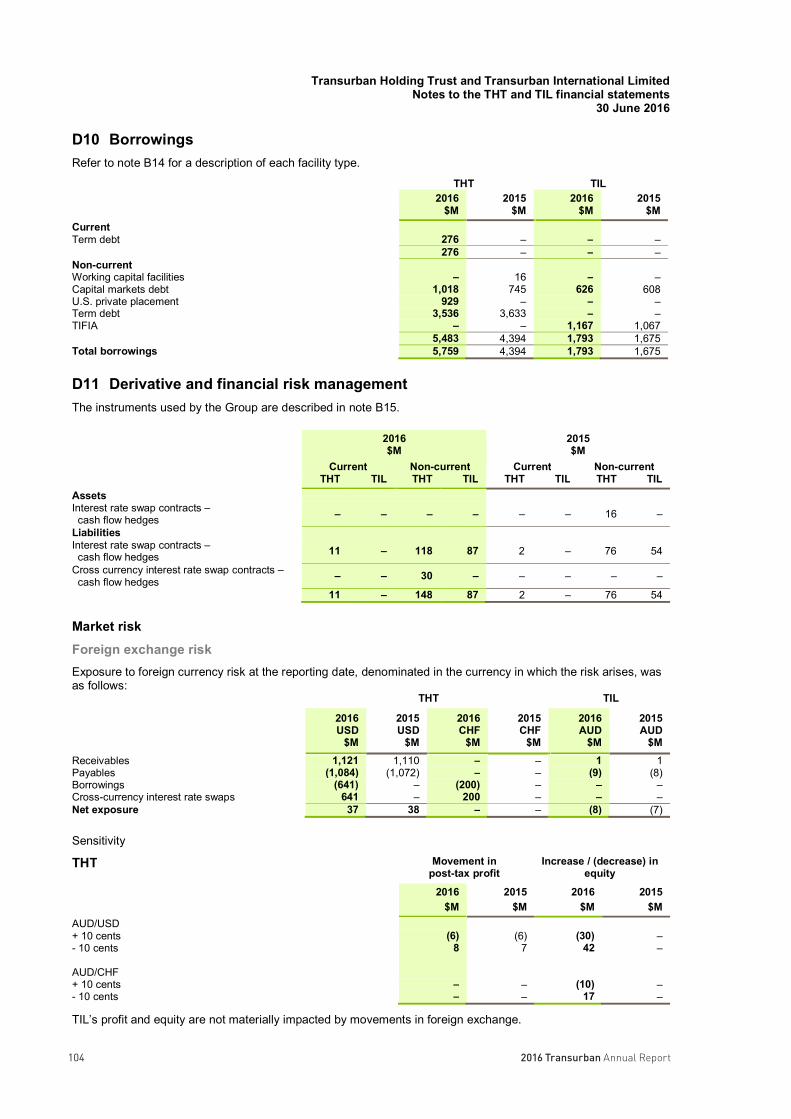
2016 Transurban Annual Report104
Transurban Holding Trust and Transurban International Limited Notes to the THT and TIL financial statements
30 June 2016
104
D10 Borrowings Refer to note B14 for a description of each facility type.
THT TIL
2016
$M 2015
$M 2016
$M 2015
$M Current Term debt 276 – – – 276 – – – Non-current Working capital facilities – 16 – – Capital markets debt 1,018 745 626 608 U.S. private placement 929 – – – Term debt 3,536 3,633 – – TIFIA – – 1,167 1,067 5,483 4,394 1,793 1,675 Total borrowings 5,759 4,394 1,793 1,675
D11 Derivative and financial risk management The instruments used by the Group are described in note B15.
2016 $M
2015 $M
Current Non-current Current Non-current THT TIL THT TIL THT TIL THT TIL Assets Interest rate swap contracts – cash flow hedges – – – – – – 16 –
Liabilities Interest rate swap contracts – cash flow hedges 11 – 118 87 2 – 76 54
Cross currency interest rate swap contracts – cash flow hedges – – 30 – – – – –
11 – 148 87 2 – 76 54
Market risk Foreign exchange risk Exposure to foreign currency risk at the reporting date, denominated in the currency in which the risk arises, was as follows: THT TIL 2016
USD $M
2015 USD
$M
2016 CHF
$M
2015 CHF
$M
2016 AUD
$M
2015 AUD
$M Receivables 1,121 1,110 – – 1 1 Payables (1,084) (1,072) – – (9) (8) Borrowings (641) – (200) – – – Cross-currency interest rate swaps 641 – 200 – – – Net exposure 37 38 – – (8) (7)
Sensitivity
THT Movement in post-tax profit
Increase / (decrease) in equity
2016 $M
2015 $M
2016 $M
2015 $M
AUD/USD + 10 cents (6) (6) (30) – - 10 cents 8 7 42 – AUD/CHF + 10 cents – – (10) – - 10 cents – – 17 –
TIL’s profit and equity are not materially impacted by movements in foreign exchange.

1052016 Transurban Annual Report
Transurban Holding Trust and Transurban International LimitedNotes to the THT and TIL financial statements
30 June 2016
105
D11 Derivative and financial risk management (continued)
Interest rate riskTHT and TIL are not materially impacted by movements in interest rates. As at the reporting date, the Group had the following variable rate borrowings and interest rate swap contracts outstanding:
2016$M
2015$M
THT TIL THT TIL
Cash and cash equivalents 229 245 156 179Floating rate borrowings (3,957) (303) (3,857) (293)Interest rate swaps (notional principal amount) 3,957 303 3,417 293Net exposure to interest rate risk 229 245 (284) 179
Liquidity risk
Contractual maturities of financial liabilitiesThe amounts disclosed in the table are the contractual undiscounted cash flows of the Group’s financial liabilities. For interest rate swaps, the cash flows have been estimated using forward interest rates applicable at the end of the reporting period. For further information refer to note B15.
THT
2016$M
1 year or less
Over1 to 2years
Over2 to 3years
Over 3 to 4 years
Over 4 to 5years
Over 5years
Total contractual cash flows
Carryingamount
Trade payables 142 – – – – – 142 142Borrowings 443 1,003 858 1,222 996 2,615 7,137 5,759Related party loans 634 763 655 409 1,172 3,123 6,756 5,101Interest rate swaps 44 37 26 10 7 18 142 129Cross-currency swaps 22 21 21 21 20 (106) (1) 30Concession and
promissory notes – – – – – 181 181 34Other liabilities – 14 46 – – – 60 53Total 1,285 1,838 1,606 1,662 2,195 5,831 14,417 11,248
2015$M
1 year or less
Over 1 to 2 years
Over 2 to 3 years
Over 3 to 4 years
Over 4 to 5 years
Over 5 years
Total contractual cash flows
Carrying amount
Trade payables 30 – – – – – 30 30Borrowings 137 1,031 1,348 313 1,156 1,114 5,099 4,394Related party loans 1,055 991 796 617 375 3,348 7,182 5,573Interest rate swaps 44 31 13 3 (2) (31) 58 62Concession and
promissory notes – – – – – 170 170 20
Total 1,266 2,053 2,157 933 1,529 4,601 12,539 10,079
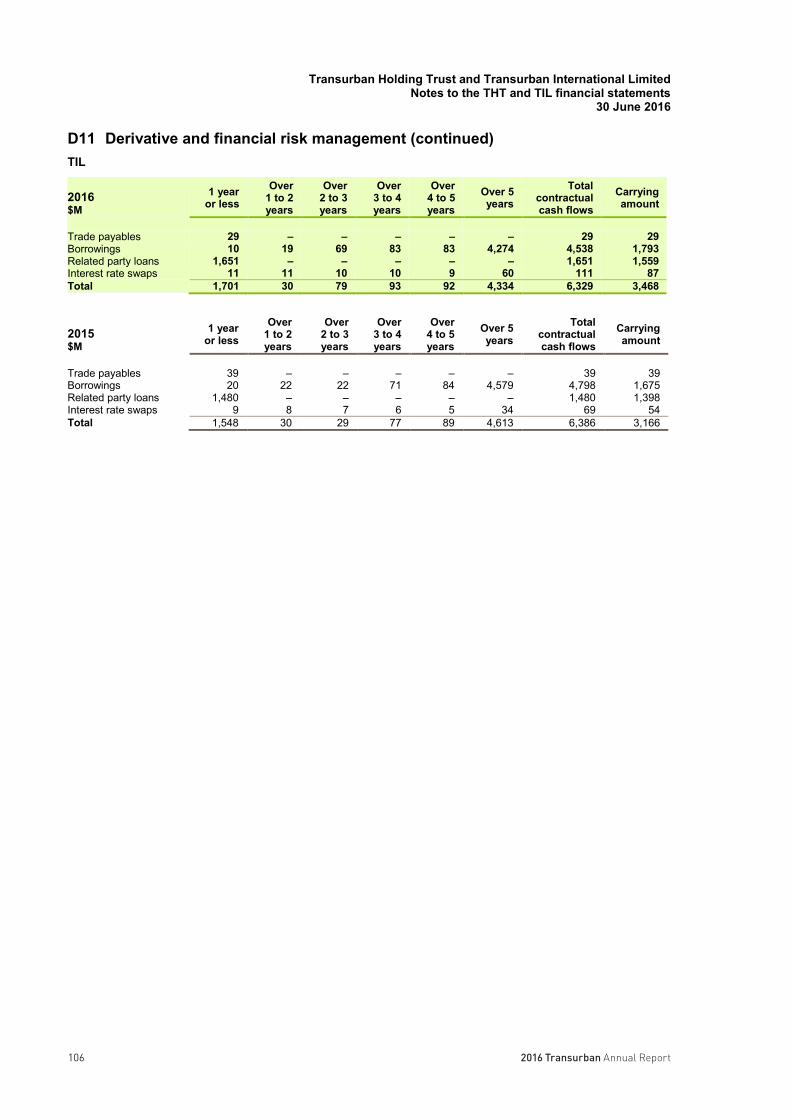
2016 Transurban Annual Report106
Transurban Holding Trust and Transurban International LimitedNotes to the THT and TIL financial statements
30 June 2016
106
D11 Derivative and financial risk management (continued)TIL
2016$M
1 yearor less
Over1 to 2 years
Over2 to 3years
Over3 to 4years
Over4 to 5years
Over 5years
Totalcontractualcash flows
Carryingamount
Trade payables 29 – – – – – 29 29Borrowings 10 19 69 83 83 4,274 4,538 1,793Related party loans 1,651 – – – – – 1,651 1,559Interest rate swaps 11 11 10 10 9 60 111 87Total 1,701 30 79 93 92 4,334 6,329 3,468
2015$M
1 year or less
Over 1 to 2 years
Over 2 to 3 years
Over 3 to 4 years
Over 4 to 5 years
Over 5 years
Total contractual cash flows
Carrying amount
Trade payables 39 – – – – – 39 39Borrowings 20 22 22 71 84 4,579 4,798 1,675Related party loans 1,480 – – – – – 1,480 1,398Interest rate swaps 9 8 7 6 5 34 69 54Total 1,548 30 29 77 89 4,613 6,386 3,166

1072016 Transurban Annual Report
Transurban Holding Trust and Transurban International Limited Notes to the THT and TIL financial statements
30 June 2016
107
Network summary Refer to the Network summary section of the Group financial statements for the intangible assets, maintenance provision, goodwill, and concession and promissory note accounting policies.
D12 Intangible assets 2016 $M Concession assets Assets under construction Total
THT TIL THT TIL THT TIL Cost 11,505 2,681 31 7 11,536 2,688 Accumulated amortisation (1,616) (68) – – (1,616) (68) Net book amount 9,889 2,613 31 7 9,920 2,620
2015 $M Concession assets Assets under construction Total
THT TIL THT TIL THT TIL Cost 9,671 2,593 83 – 9,754 2,593 Accumulated amortisation (1,340) (31) – – (1,340) (31) Net book amount 8,331 2,562 83 – 8,414 2,562
Movement in intangible assets Concession assets Assets under construction Total $M $M $M THT TIL THT TIL THT TIL Opening balance 1 July 2014 3,586 1,289 55 676 3,641 1,965 Additions – – 19 142 19 142 Acquisition of subsidiary 5,240 – – – 5,240 – Currency and other adjustments – 323 – 161 – 484 Transfer (219) 979 9 (979) (210) – Amortisation charge (276) (29) – – (276) (29) Net book amount 30 June 2015 8,331 2,562 83 – 8,414 2,562 Additions 50 – 22 7 72 7 Acquisition of subsidiary 1,710 – – – 1,710 – Currency and other adjustments – 88 – – – 88 Transfer 74 – (74) – – – Amortisation charge (276) (37) – – (276) (37) Net book amount 30 June 2016 9,889 2,613 31 7 9,920 2,620
D13 Other liabilities – concession and promissory notes M2 Motorway
The face value of promissory notes on issue at 30 June 2016 is $181 million (2015: $170 million). The net present value at 30 June 2016 of the redemption payments relating to these promissory notes is $34 million (2015: $20 million).
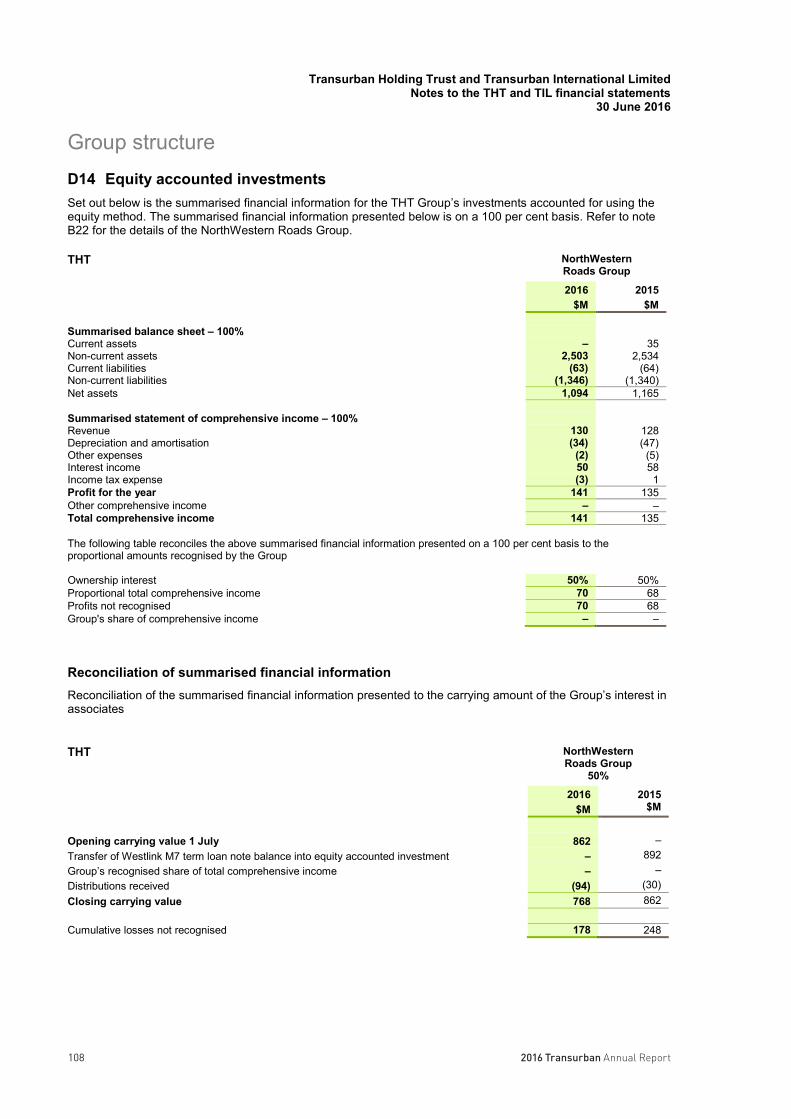
2016 Transurban Annual Report108
Transurban Holding Trust and Transurban International LimitedNotes to the THT and TIL financial statements
30 June 2016
108
Group structureD14 Equity accounted investmentsSet out below is the summarised financial information for the THT Group’s investments accounted for using the equity method. The summarised financial information presented below is on a 100 per cent basis. Refer to note B22 for the details of the NorthWestern Roads Group.
THT NorthWesternRoads Group
2016$M
2015$M
Summarised balance sheet – 100%Current assets – 35Non-current assets 2,503 2,534Current liabilities (63) (64)Non-current liabilities (1,346) (1,340)Net assets 1,094 1,165
Summarised statement of comprehensive income – 100%Revenue 130 128Depreciation and amortisation (34) (47)Other expenses (2) (5)Interest income 50 58Income tax expense (3) 1Profit for the year 141 135Other comprehensive income – –Total comprehensive income 141 135
The following table reconciles the above summarised financial information presented on a 100 per cent basis to the proportional amounts recognised by the Group
Ownership interest 50% 50%Proportional total comprehensive income 70 68Profits not recognised 70 68Group's share of comprehensive income – –
Reconciliation of summarised financial information Reconciliation of the summarised financial information presented to the carrying amount of the Group’s interest in associates
THT NorthWesternRoads Group
50%
2016$M
2015$M
Opening carrying value 1 July 862 –Transfer of Westlink M7 term loan note balance into equity accounted investment – 892Group’s recognised share of total comprehensive income – –Distributions received (94) (30)Closing carrying value 768 862
Cumulative losses not recognised 178 248

1092016 Transurban Annual Report
Transurban Holding Trust and Transurban International LimitedNotes to the THT and TIL financial statements
30 June 2016
109
D15 Non-controlling interestsSet out below is summarised financial information for each material subsidiary that has non-controlling interests that are material to THT. The amounts disclosed for each subsidiary are before inter-company eliminations.
THTTransurban Queensland
37.5%
Airport Motorway Trust24.9%
Total
2016$M
2015$M
2016$M
2015$M
2016$M
2015$M
Summarised balance sheetCurrent assets 265 117 21 21 286 138Non-current assets 7,106 5,114 881 867 7,987 5,981Current liabilities (145) (21) (198) (186) (343) (207)Non-current liabilities (4,064) (2,606) (536) (539) (4,600) (3,145)Net assets 3,162 2,604 168 163 3,330 2,767Carrying amount of NCI 1,186 976 42 41 1,228 1,017 Summarised statement of comprehensive incomeRevenue 259 240 106 103 365 343Profit/(loss) for the year (144) (327) 72 69 (72) (258)Other comprehensive income/(loss) (70) (24) 4 – (66) (24)Total comprehensive income/(loss) (214) (351) 76 69 (138) (282)Profit/(loss) allocated to NCI (54) (123) 18 17 (36) (106)OCI allocated to NCI (26) (9) 1 – (25) (9)
Summarised cash flowsCash flows from operating activities 104 (152) 59 41 163 (111)Cash flows from investing activities (1,710) (5,240) – – (1,710) (5,240)Cash flows from financing activities 1,630 5,417 (59) (41) 1,571 5,376Net increases in cash and cash equivalents 24 25 – – 24 25
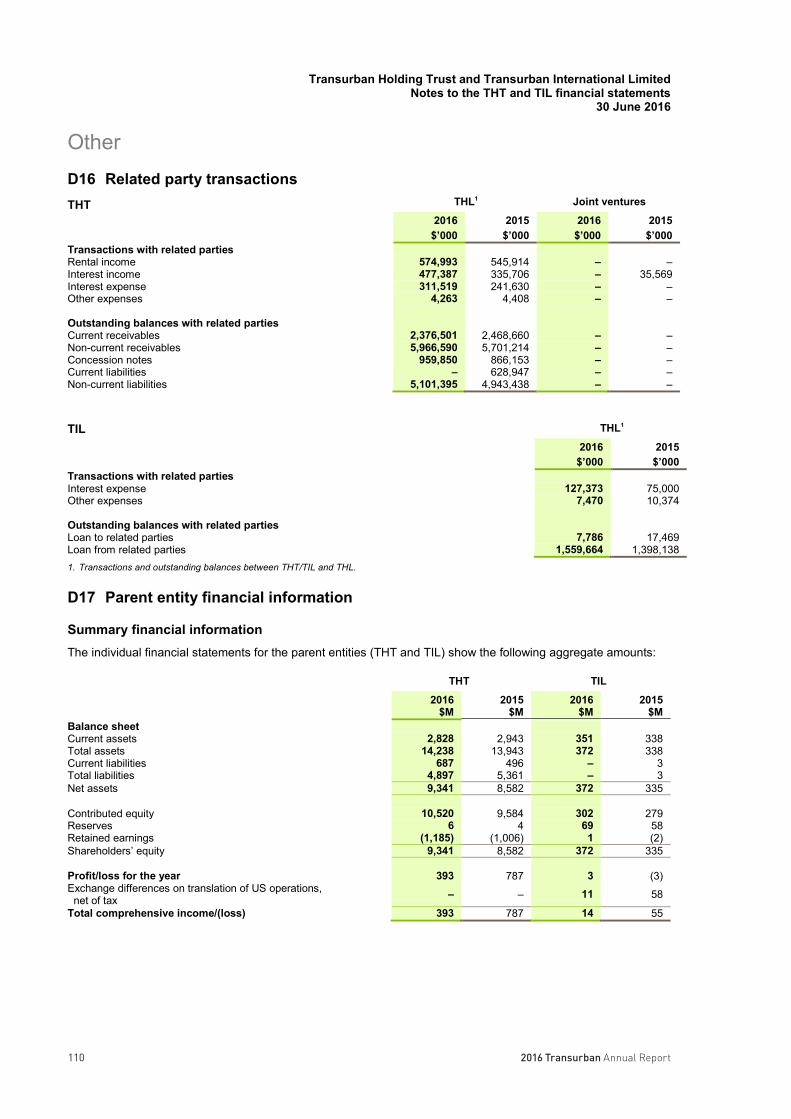
2016 Transurban Annual Report110
Transurban Holding Trust and Transurban International LimitedNotes to the THT and TIL financial statements
30 June 2016
110
OtherD16 Related party transactionsTHT THL1 Joint ventures
2016$’000
2015$’000
2016$’000
2015$’000
Transactions with related partiesRental income 574,993 545,914 – –Interest income 477,387 335,706 – 35,569Interest expense 311,519 241,630 – –Other expenses 4,263 4,408 – –
Outstanding balances with related partiesCurrent receivables 2,376,501 2,468,660 – –Non-current receivables 5,966,590 5,701,214 – –Concession notes 959,850 866,153 – –Current liabilities – 628,947 – –Non-current liabilities 5,101,395 4,943,438 – –
TIL THL1
2016$’000
2015$’000
Transactions with related partiesInterest expense 127,373 75,000Other expenses 7,470 10,374
Outstanding balances with related partiesLoan to related parties 7,786 17,469Loan from related parties 1,559,664 1,398,1381. Transactions and outstanding balances between THT/TIL and THL.
D17 Parent entity financial information
Summary financial informationThe individual financial statements for the parent entities (THT and TIL) show the following aggregate amounts:
THT TIL
2016$M
2015$M
2016$M
2015$M
Balance sheetCurrent assets 2,828 2,943 351 338Total assets 14,238 13,943 372 338Current liabilities 687 496 – 3Total liabilities 4,897 5,361 – 3Net assets 9,341 8,582 372 335
Contributed equity 10,520 9,584 302 279Reserves 6 4 69 58Retained earnings (1,185) (1,006) 1 (2)Shareholders’ equity 9,341 8,582 372 335
Profit/loss for the year 393 787 3 (3)Exchange differences on translation of US operations,
net of tax – – 11 58
Total comprehensive income/(loss) 393 787 14 55
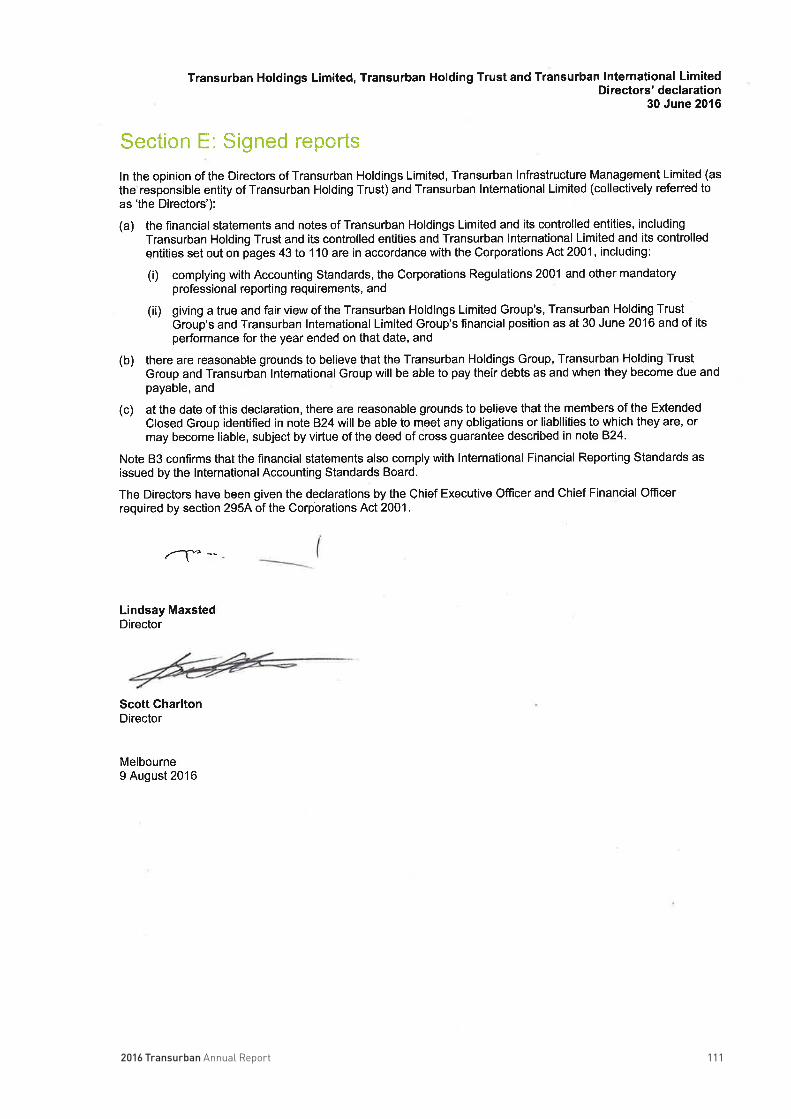
1112016 Transurban Annual Report

2016 Transurban Annual Report112
Independent auditor’s report to the stapled security holders of the Transurban Group
Report on the financial reportWe have audited the accompanying financial report which comprises;
• Transurban Holdings Limited (the Company), which comprises the consolidated balance sheet as at 30 June 2016, the consolidated statement of comprehensive income, consolidated statement of changes in equity and consolidated statement of cash flows for the year ended on that date, a summary of significant accounting policies, other explanatory notes and the directors’ declaration for Transurban Holdings Limited and its controlled entities (the Transurban Group). The Transurban Group comprises the Company and the entities it controlled at year’s end or from time to time during the financial year including the other members of the stapled group being Transurban International Limited and Transurban Holding Trust and their controlled entities.
• Transurban Holding Trust (the Trust), which comprises the consolidated balance sheet as at 30June 2016, the consolidated statement of comprehensive income, consolidated statement ofchanges in equity and consolidated statement of cash flows for the year ended on that date, asummary of significant accounting policies, other explanatory notes and the directors’ declarationfor Transurban Holding Trust and its controlled entities (THT). THT comprises the Trust and theentities it controlled at year’s end or from time to time during the financial year.
• Transurban International Limited (the International Company), which comprises theconsolidated balance sheet as at 30 June 2016, the consolidated statement of comprehensiveincome, consolidated statement of changes in equity and consolidated statement of cash flows forthe year ended on that date, a summary of significant accounting policies, other explanatory notesand the directors’ declaration for Transurban International Limited and its controlled entities(TIL). TIL comprises the International Company and the entities it controlled at year’s end orfrom time to time during the financial year.
Directors’ responsibility for the financial reportThe directors of the Transurban Holdings Limited, Transurban International Limited and Transurban Infrastructure Management the responsible entity of Transurban Holding Trust (collectively referred to as “the directors”) are responsible for the preparation of the financial report that gives a true and fair view in accordance with Australian Accounting Standards, the Corporations Act 2001 and for such internal control as the directors determine is necessary to enable the preparation of the financial report that is free from material misstatement, whether due to fraud or error. In Note B3, the directors also state, in accordance with Accounting Standard AASB 101 Presentation of Financial Statements, that the financial statements comply with International Financial Reporting Standards.
Auditor’s responsibilityOur responsibility is to express an opinion on the financial report based on our audit. We conducted our audit in accordance with Australian Auditing Standards. Those standards require that we comply with relevant ethical requirements relating to audit engagements and plan and perform the audit to obtain reasonable assurance whether the financial report is free from material misstatement.
PricewaterhouseCoopers, ABN 52 780 433 757Freshwater Place, 2 Southbank Boulevard, SOUTHBANK VIC 3006, GPO Box 1331, MELBOURNE VIC 3001T: 61 3 8603 1000, F: 61 3 8603 1999, www.pwc.com.au
Liability limited by a scheme approved under Professional Standards Legislation.
112

1132016 Transurban Annual Report
An audit involves performing procedures to obtain audit evidence about the amounts and disclosures in the financial report. The procedures selected depend on the auditor’s judgement, including the assessment of the risks of material misstatement of the financial report, whether due to fraud or error. In making those risk assessments, the auditor considers internal control relevant to the Transurban Group’s preparation and fair presentation of the financial report in order to design audit procedures that are appropriate in the circumstances, but not for the purpose of expressing an opinion on the effectiveness of the Transurban Group’s internal control. An audit also includes evaluating the appropriateness of accounting policies used and the reasonableness of accounting estimates made by the directors, as well as evaluating the overall presentation of the financial report.
We believe that the audit evidence we have obtained is sufficient and appropriate to provide a basis for our audit opinion.
IndependenceIn conducting our audit, we have complied with the independence requirements of the Corporations Act 2001.
Auditor’s opinionIn our opinion:
(a) the financial reports of the Transurban Group, THT and TIL are in accordance with the Corporations Act 2001, including:
(i) giving a true and fair view of the Transurban Group, THT and TIL financial position as at 30 June 2016 and of their performance for the year ended on that date; and
(ii) complying with Australian Accounting Standards (including the Australian Accounting Interpretations), the Corporations Regulations 2001 and
(b) the financial report and notes also comply with International Financial Reporting Standards as disclosed in Note B3.
Report on the Remuneration ReportWe have audited the remuneration report included in pages 22 to 39 of the directors’ report for the year ended 30 June 2016. The directors of the Company are responsible for the preparation and presentation of the remuneration report in accordance with section 300A of the Corporations Act 2001. Our responsibility is to express an opinion on the remuneration report, based on our audit conducted in accordance with Australian Auditing Standards.
Auditor’s opinionIn our opinion, the remuneration report of the Transurban Group for the year ended 30 June 2016 complies with section 300A of the Corporations Act 2001.
PricewaterhouseCoopers
Chris Dodd MelbournePartner 9 August 2016
113
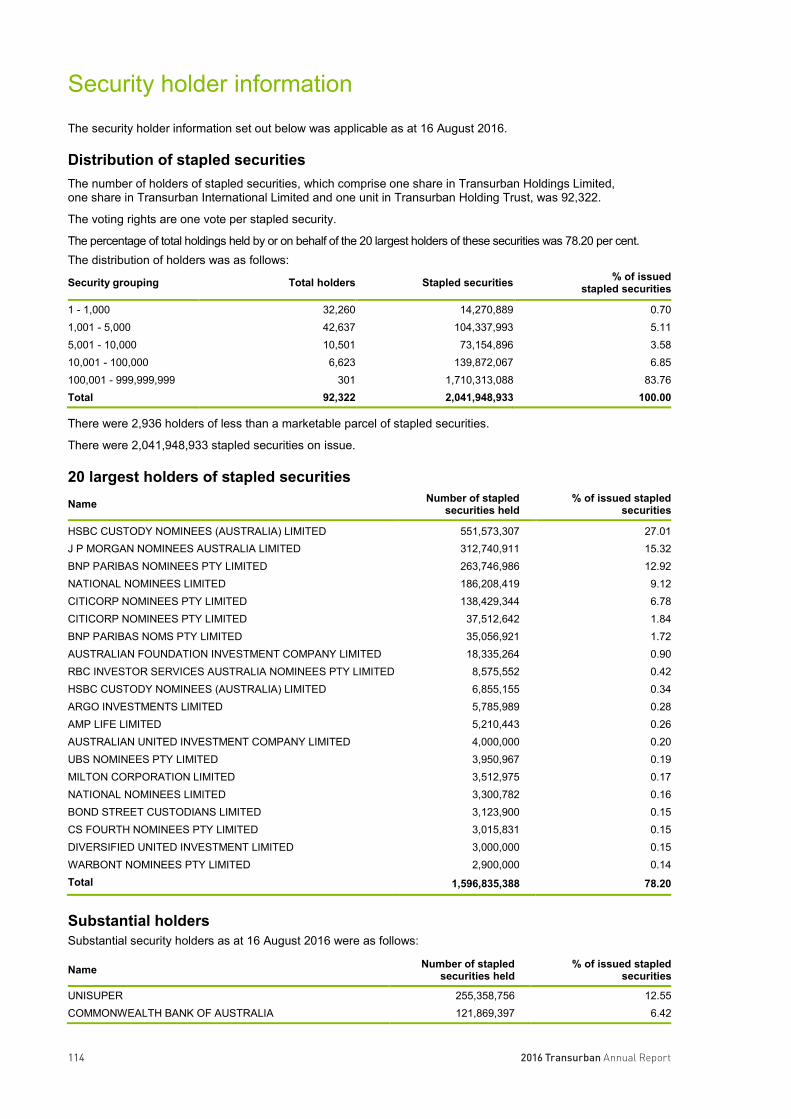
2016 Transurban Annual Report114
Security holder information
The security holder information set out below was applicable as at 16 August 2016.
Distribution of stapled securities The number of holders of stapled securities, which comprise one share in Transurban Holdings Limited, one share in Transurban International Limited and one unit in Transurban Holding Trust, was 92,322.
The voting rights are one vote per stapled security.
The percentage of total holdings held by or on behalf of the 20 largest holders of these securities was 78.20 per cent. The distribution of holders was as follows:
Security grouping Total holders Stapled securities % of issued stapled securities
1 - 1,000 32,260 14,270,889 0.70 1,001 - 5,000 42,637 104,337,993 5.11 5,001 - 10,000 10,501 73,154,896 3.58 10,001 - 100,000 6,623 139,872,067 6.85 100,001 - 999,999,999 301 1,710,313,088 83.76 Total 92,322 2,041,948,933 100.00
There were 2,936 holders of less than a marketable parcel of stapled securities.
There were 2,041,948,933 stapled securities on issue.
20 largest holders of stapled securities Name Number of stapled
securities held % of issued stapled
securities
HSBC CUSTODY NOMINEES (AUSTRALIA) LIMITED 551,573,307 27.01 J P MORGAN NOMINEES AUSTRALIA LIMITED 312,740,911 15.32 BNP PARIBAS NOMINEES PTY LIMITED 263,746,986 12.92 NATIONAL NOMINEES LIMITED 186,208,419 9.12 CITICORP NOMINEES PTY LIMITED 138,429,344 6.78 CITICORP NOMINEES PTY LIMITED 37,512,642 1.84 BNP PARIBAS NOMS PTY LIMITED 35,056,921 1.72 AUSTRALIAN FOUNDATION INVESTMENT COMPANY LIMITED 18,335,264 0.90 RBC INVESTOR SERVICES AUSTRALIA NOMINEES PTY LIMITED 8,575,552 0.42 HSBC CUSTODY NOMINEES (AUSTRALIA) LIMITED 6,855,155 0.34 ARGO INVESTMENTS LIMITED 5,785,989 0.28 AMP LIFE LIMITED 5,210,443 0.26 AUSTRALIAN UNITED INVESTMENT COMPANY LIMITED 4,000,000 0.20 UBS NOMINEES PTY LIMITED 3,950,967 0.19 MILTON CORPORATION LIMITED 3,512,975 0.17 NATIONAL NOMINEES LIMITED 3,300,782 0.16 BOND STREET CUSTODIANS LIMITED 3,123,900 0.15 CS FOURTH NOMINEES PTY LIMITED 3,015,831 0.15 DIVERSIFIED UNITED INVESTMENT LIMITED 3,000,000 0.15 WARBONT NOMINEES PTY LIMITED 2,900,000 0.14 Total 1,596,835,388 78.20
Substantial holders Substantial security holders as at 16 August 2016 were as follows:
Name Number of stapled securities held
% of issued stapled securities
UNISUPER 255,358,756 12.55 COMMONWEALTH BANK OF AUSTRALIA 121,869,397 6.42

1152016 Transurban Annual Report
This page intentionally left blank.

2016 Transurban Annual Report116
This page intentionally left blank.

1172016 Transurban Annual Report
This page intentionally left blank.

2016 Transurban Annual Report118
This page intentionally left blank.
Enquiries
Enquiries about your Transurban stapled securities
The stapled securities register is maintained by Computershare Investor Services Pty Ltd.
If you have a question about your Transurban securities or distributions please contact:
ComputershareYarra Falls 452 Johnston Street Abbotsford, Victoria 3067 Australia
MailThe Registrar Computershare Investor Services Pty Ltd GPO Box 2975 Melbourne, Victoria 3001 Australia
Phone(Australia ) 1300 555 159 (Overseas) +61 3 9415 4062
AUSTRALIA
MELBOURNE (HEAD OFFICE)
Level 23Tower One, Collins Square727 Collins StreetDocklands Victoria 3008
SYDNEY
Level 91 Chifley SquareSydney New South Wales 2000
BRISBANE
7 Brandl StreetEight Mile PlainsQueensland 4113
MAILING ADDRESS
Locked Bag 28 South Melbourne Victoria 3205
Phone +61 3 8656 8900 Fax +61 3 8656 8585
UNITED STATES
WASHINGTON DC AREA
6440 General Green WayAlexandria VA 22312United States
Phone 571 419 6100
Email [email protected]