2016 - The New England Councilnewenglandcouncil.com/...October-2016-FINAL-Single... · October 2016...
60
2016 THE NEW ENGLAND ENERGY LANDSCAPE HISTORY, CHALLENGES & OUTLOOK
Transcript of 2016 - The New England Councilnewenglandcouncil.com/...October-2016-FINAL-Single... · October 2016...

2016 THE NEW ENGLAND ENERGY LANDSCAPE
H I S T O R Y , C H A L L E N G E S & O U T L O O K

Prepared for The New England Council by Peter J. Howe
Front cover photos in this report were included courtesy of the following NEC members:
(clockwise from top right): DONG Energy, Eversource, Dominion Resources, Brightfields Development

Table of ContentsINTRODUCTION ............................................................................................................................................................................ 4
FROM THE HEADLINES ................................................................................................................................................................. 6
CONTEXT: THE COST OF ENERGY IN NEW ENGLAND .................................................................................................................... 7
SETTING THE AGENDA: NEW ENGLAND GOVERNORS’ 2013 STATEMENT .................................................................................... 10
HISTORY: HOW NEW ENGLAND’S ENERGY MARKETS GOT HERE ................................................................................................ 11
BACKGROUND ON THE NEW ENGLAND POWER GRID ................................................................................................................. 13
MAJOR POWER PLANTS IN NEW ENGLAND ................................................................................................................................ 14
HOW GAS HAS COME TO DOMINATE THE ELECTRIC GRID .......................................................................................................... 16
THE UNPREDICTABLE INTERCONNECTEDNESS OF FUEL-SOURCE CHOICES ............................................................................... 19
HOW NEW ENGLAND GETS NATURAL GAS ................................................................................................................................. 20
NATURAL GAS PIPELINES ........................................................................................................................................................... 21
GAS OUTLOOK: AMPLE SUPPLY, AMPLE DEMAND, CONSTRAINTS .............................................................................................. 24
EXPANDING THE GAS NETWORK: PLANS MOVING, PLANS DROPPED ......................................................................................... 26
SHOULD ELECTRIC CUSTOMERS BE BILLED FOR GAS UPGRADES? ........................................................................................... 27
CT, ME, NH, RI ON ELECTRIC CUSTOMERS PAYING FOR GAS ...................................................................................................... 30
ENVIRONMENTALIST OPPOSITION TO NATURAL GAS .................................................................................................................. 31
HEATING OIL AS A CONTINUING, RELIABLE, GREENER FUEL SOURCE ........................................................................................ 32
NEW ENGLAND’S ENERGY/ENVIRONMENTAL FRAMEWORK: RPS’S, RGGI, AND GLOBAL CLIMATE CHANGE LAWS ..................... 32
CONNECTICUT/MASSACHUSETTS/RHODE ISLAND CLEAN ENERGY RFP .................................................................................... 36
WIND POWER WITHIN NEW ENGLAND AND OFF THE COAST ....................................................................................................... 37
RENEWABLE ENERGY PLANS NEED NEW TRANSMISSION .......................................................................................................... 38
OPERATIONAL CHALLENGES OF RENEWABLES IN THE GRID—NOT ALL MEGAWATTS ARE CREATED EQUAL .............................. 40
WHO DECIDES WHAT GETS BUILT, AND HOW? ISO, FERC, STATE REGULATORS, AND INVESTORS’ ROLES ................................. 42
THE FEDERAL ENERGY REGULATORY COMMISSION AND STATES’ ROLES .................................................................................. 45
THE FUTURE OF NUCLEAR POWER IN NEW ENGLAND ................................................................................................................ 47
WHAT ARE “SOLAR NET METERING CAPS” AND WHY ARE THEY SUCH A HOT ISSUE IN SO MANY NEW ENGLAND STATES? ....... 48
DEMAND RESPONSE/ENERGY EFFICIENCY ................................................................................................................................. 49
ENERGY STORAGE AND RENEWABLE ENERGY GROWTH ............................................................................................................ 51
CONCLUSION ............................................................................................................................................................................. 52
UPCOMING DATES ...................................................................................................................................................................... 56
ACKNOWLEDGMENTS ................................................................................................................................................................. 57

Photo courtesy of Dong Energy.

October 2016
NEC Members & Friends:
The New England Council—the nation’s oldest regional business association—is
dedicated to promoting economic growth and a high quality of life in the New England
region. One of the key ways that the Council works toward this goal is by supporting
policies designed to ensure that businesses and organizations throughout the region
receive the reliable and cost effective electric power service that is needed to maintain
and expand economic growth and employment in the region. The Council firmly
believes that the best way to develop policy for New England is through regional
collaboration, and through cooperation and communication between the public and
private sectors.
The Council prides itself on being a resource to leaders in federal, state, and local
government as they seek to develop policy that will address our region’s energy
challenges and ensure a reliable energy market for New England. Over the years,
we have developed and published a number of reports and briefing papers—often
in collaboration with other organizations or issue experts—on a range of important
energy issues, including energy supply and demand, LNG supplies, nuclear energy,
climate change, and low income energy assistance. Our goal with each of these
publications, as with the report that follows, is to provide thorough, reliable, and
unbiased information that will help educate and inform decision makers at all levels
of government.
The report that follows presents what we believe to be a very comprehensive overview
of the history of our region’s electric power market, some of the key challenges we
face, and the outlook for the coming years. In the course of developing this document,
over 30 stakeholders, including a wide range of energy businesses, as well as industry
organizations, were consulted and asked to share information and insights. We are
grateful to all of those who contributed to the development of this report and believe
that the broad spectrum of sources and perspectives makes this a valuable guide to
understanding the current energy landscape in New England.
We hope that our policymakers and other stakeholders will find this report to be a
useful resource as continue to work toward our shared goals of ensuring affordable,
reliable, and sustainable energy for the New England region.
Best Regards,
James T. Brett
President & CEO

INTRODUCTION
New England’s energy system has reached its most complex
crossroads in history. In coming months and years, legislators,
regulators, and policymakers will have to make challenging,
interrelated, and far-reaching decisions about how the region
meets its future power needs and environmental policy mandates,
from what energy sources, and at what cost for businesses and
consumers across the region.
The decisions don’t amount to picking which one direction to take.
Rather, they are decisions about what mix of multiple pathways and
approaches should be best combined to ensure the most reliable,
affordable energy supply that also meets aggressive goals and
mandates in all six states for mitigating pollution and climate impacts
over the next three decades. New England has voted through its
democratic processes and elected representatives for an energy
supply that is affordable, reliable, and environmentally friendly. But in
the near term, until some major technological breakthroughs prove
workable at large scale and financially viable, trade-offs appear
unavoidable—and challenging to quantify—among cost, reliability,
and environmental impact.
At the policy level, legislators, regulators—and now judges—are weighing proposals from New
England governors to allow electric utilities to have customers pay for more natural gas capacity as
a strategy to improve electric and gas supply reliability and lower costs. Also under consideration
and taking effect are new proposals and laws to allow those utilities to enter into long-term contracts
for renewable energy such as offshore and onshore wind and large-scale hydropower, including big
imports from Canada. Power-grid managers are bracing for the imminent planned shutdowns of New
England’s biggest coal-fired power plant and yet another nuclear plant, with likely more shutdowns
to come, while also preparing for billions of dollars in proposed new energy infrastructure, much of it
for renewable energy. States and grid managers are working to improve the finances and mechanics
of incorporating more wind power, large- and small-scale solar, and energy storage into the grid, and
the most effective ways to promote energy efficiency and targeted conservation and “smart-grid”
technology. This is all happening within mandates in all six states to reduce overall carbon-dioxide
emissions, with key deadlines coming in just 3 years, and to meet requirements for getting energy
from renewable sources.
The New England Council believes it is critical for policymakers to understand that all of these
policy decisions are tightly interrelated, even if the connections are not immediately obvious. No one
decision—or vote—about New England’s energy future can be made in a vacuum. Like pushing on a
balloon, pushing on one side of the energy market in hopes of driving one policy or price goal will make
something pop up on the other side of the energy market that impacts other policy and price goals.
Given that natural gas delivered 43 percent of New England’s electric consumption in 2014, and in the
workings of the competitive market gas sets the wholesale price 70 percent of the time, according
to Independent System Operator (ISO) New England’s 2016 “Regional Energy Outlook,” proposals
for increased pipeline capacity to lower the cost of electric generation will change the economics
of renewables and nuclear power, as well as of liquefied natural gas delivered by ship to meet peak
local needs. Adding large-scale offshore wind and imported Canadian hydropower to the grid would
Photo courtesy of DONG Energy.
4 | THE NEW ENGL AND ENERGY L ANDSCAPE

change the economics for nuclear power and the need for and price of gas. Both sets of decisions
have major implications for whether and when the six states meet their 2020 and 2050 goals
for reducing greenhouse-gas emissions from electric generation and meeting renewable energy
standards. That includes how viable non-carbon-emitting nuclear generation remains, especially after
the closure of the four Yankee nuclear plants in Connecticut, Maine, Massachusetts, and Vermont, and
the June 2019 planned shutdown of Pilgrim Station in Plymouth. Availability of and prices for natural
gas driven by electric demand will also affect demand for and the price of home heating oil and the
economics of homeowners and business converting from oil to gas—and also whether some New
England utilities can lift moratoria on new gas service because of supply constraints.
The six New England states’ decisions are also profoundly interrelated as a matter of local physical
realities. Because of the way the six New England states’ electric networks function as a single
unified grid, decisions made in one state capital often mean visible, tangible impacts in other
states. A hunger in Massachusetts, Rhode Island, and Connecticut for more renewable energy from
hydroelectric or land-based wind sources may well require construction of controversial new and
expanded electric transmission lines in Maine, New Hampshire, and Vermont. A hunger in Maine for
more natural gas supply to keep manufacturing viable and lower heating costs may well require
construction of controversial pipeline upgrades in Massachusetts and Connecticut. And what are
essentially political and policy choices about the preferred levels of renewable power, and where
and how to site it, will have to be implemented through a regional power-grid management system
whose first priority is always reliable service. New England and its energy system managers have
only started to work out policies and procedures to accommodate much heavier flows of renewable
energy and the operational challenges that the variability of wind and solar energy can create on a
grid first built for steadily-running nuclear, coal, and oil plants.
This report aims to offer an impartial, unbiased explanation of the fundamental
issues facing policymakers, regulators, and legislators in the New England
energy debate. Perhaps the central question in this whole debate: How much
can New England trust a free market, with policies that don’t pick winners and
losers, will solve problems of high price and supply and meet our emissions
and climate-change goals? What intervention by policymakers is required to
ensure New England has reliable, affordable energy supplies that also meet the
environmental goals and mandates set by governors and legislators as shaped
by advocates and stakeholders?
If, as now seems likely, the answer is a mix of free-market forces and policy
direction: What’s the right mix? How do we get there? And what changes are
needed in the processes and procedures for translating multiple states’ energy
and environmental policies into planning and running a single regional power
grid and gas supply network?
Beyond that, The New England Council commissioned this report in hopes of helping everyone who
depends on the flow of energy—that is to say, everyone in New England—better understand:
• how the electric grid and gas supply network function,
• what determines retail prices,
• and who decides which power plants, pipelines, and transmission lines get built, how, and
how stakeholders can get involved in shaping those decisions.
Photo courtesy of Eversource.
4 | THE NEW ENGL AND ENERGY L ANDSCAPE THE NEW ENGL AND ENERGY L ANDSCAPE | 5

FROM THE HEADLINES
This report is being published as the news has been filled with major headlines about energy issues in
New England so far in 2016:
• Massachusetts, Connecticut, and Rhode Island are jointly moving to acquire more renewable
energy, including on- and off-shore wind from throughout New England and hydroelectric
power from Quebec and other areas of Canada, through a three-state Request for Proposals
that has generated more than 30 initial responses from energy developers. In Massachusetts,
Governor Charlie Baker on August 8, 2016, signed legislation that directs the state’s utilities
to solicit contracts for 1,600 megawatts of offshore wind generation and 9.45 million
megawatt-hours per year of “clean energy,” most likely Canadian hydropower—in all, about
30 to 40 percent of the state’s electric demand.
• Massachusetts’ highest court has ruled illegal under state law a plan to have electric
ratepayers billed to pay for more gas capacity intended to reduce electric rates—something
Connecticut, Maine, New Hampshire, and Rhode Island have all been considering or moving
forward with doing, but based on an expectation the region’s biggest state would also be
helping shoulder the cost of major pipeline upgrades.
• Kinder Morgan’s Tennessee Gas has announced it is abandoning a $3.3 billion pipeline
project across Western Massachusetts and New Hampshire amid intense local and
regional opposition.
• More than $2 billion worth of other gas pipeline upgrades by Kinder Morgan and Spectra
Energy and their partners are well under way, but often facing controversy and lawsuits.
• This past winter, New England avoided a repeat of the dire winter of 2013-14. But the region’s
power-grid operators remain deeply concerned that New England may be too reliant on
natural gas for producing electricity and could face major reliability problems during a
prolonged winter cold snap or gas supply interruption.
• 2020 deadlines in several states for reducing Greenhouse Gas emissions are rapidly
approaching, and Massachusetts’ highest court this spring ruled that the state’s Global
Warming Solutions Act contains binding limits for 2020 that must be enforced by regulators.
Still to be answered is how much electric generation will have to further reduce emissions
compared to the transportation or building sectors.
• Owners of the Pilgrim nuclear generating station in Massachusetts announced in the autumn
of 2015 that it will close in June 2019. This came soon after Vermont Yankee shut down at
the end of 2014. Losing the nuclear plants will make it even harder for New England states
to attain their goals and mandates for reducing carbon-dioxide emissions. The trend also
aggravates concerns that New England is losing diversity and resiliency in its generation
mix—especially if other policies promoting hydroelectricity imports and gas supply increases
further challenge the economic viability of nuclear power in New England.
• Huge plans are unfolding for wind power in northern New England and off the coast,
supported by billions of dollars in proposed new transmission lines. Many of those projects
are being pursued under new approval mechanisms that are still being perfected and that
are generating opposition, threats of legal action, and in Vermont new legislation (S. 260) to
give local communities more control over siting of energy facilities.
6 | THE NEW ENGL AND ENERGY L ANDSCAPE

• How to best integrate solar power, demand reduction, energy storage, and other
technologies into the grid physically and financially are still major questions policymakers in
all six states are addressing.
CONTEXT: THE COST OF ENERGY IN NEW ENGL AND
With no sources of gas, oil, or coal, and little opportunity for additional conventional large-scale
hydroelectric power in the region, New England pays markedly higher energy prices relative to the
rest of the United States because we are “at the end of the pipeline” for energy supply. This affects
the region’s economic competitiveness both for businesses choosing to locate or expand here and for
their employees and the energy bills they pay.
For many businesses, especially industrial and manufacturing companies, high energy bills are the
number-one challenge to succeeding, growing, and adding jobs in New England. Polar Beverages in
Worcester, Massachusetts, for example, also has plants in Scotia, New York, and Fitzgerald, Georgia,
where its electric and gas rates are roughly half as expensive as they are in Worcester. Owners of
the Madison Paper Industries mill in Maine announced they would close in May 2016 and lay off 214
workers, citing foreign competition but also the high cost of natural gas. The Madison plant had
shut down repeatedly in the winter of 2015 because the cost of gas made production unaffordable.
Expensive energy often ranks right up with expensive real estate as a top challenge CEOs cite to
doing business in New England.
According to January 2016 data from the U.S. Energy Information Administration, the six New England
states all rank in the top 10 of U.S. states for the retail price of electricity and of natural gas:
State Electric Price (kWh) Rank Among 50 States
CT 19.86¢ 2
ME 17.66¢ 8
MA 19.34¢ 4
NH 18.00¢ 6
RI 18.41¢ 5
VT 16.62¢ 9
Chart data from U.S. Energy Information Administration, January 2016, State Profile and Energy Estimates.
Numbers for Nearby/Competitor States:
NY 16.54¢ 10 NJ 15.45¢ 11
MD 14.03¢ 13 PA 13.87¢ 14
MN 11.99¢ 19 IL 11.42¢ 24
NC 10.44¢ 37 WA 9.07¢ 47
(eia.gov/state/rankings/#/series/31)
6 | THE NEW ENGL AND ENERGY L ANDSCAPE THE NEW ENGL AND ENERGY L ANDSCAPE | 7

State Gas Price (MCF) Rank Among 50 States
CT $10.32 13
ME $13.12 5
MA $11.93 9
NH $14.05 3
RI $12.73 6
VT $13.24 4
Chart data from U.S. Energy Information Administration, January 2016, State Profile and Energy Estimates.
Numbers for Nearby/Competitor States:
NY $10.31 14 MD $9.95 16
NC $8.75 24 MN $6.97 37
NJ $6.55 40 IL $5.82 49
(eia.gov/state/rankings/#/series/28)
At the same time, analysis by Susan F. Tierney of Analysis Group shows that, broadly speaking,
energy costs have become a less severe problem for New England than they were 15 years ago, a
change that coincides with a period in which the electric industry has been restructured. Across the
region, compared to the rest of the country, every New England state’s rank for gross state product
per dollar spent on electricity has improved significantly since 1997. At the same time, while the
average residential electric bill as a percentage of median income was above the U.S. average in 1996,
by 2015, every New England state was at or below the U.S. average—a way of saying that electric
affordability and the cost of electricity as an economic drag has improved in New England compared
to the U.S.
GROSS STATE PRODUCT PER DOLLAR SPENT ON ELECTRICITY
U.S. State 1997 Rank 2014 Rank
MA 11 7
CT 12 11
RI 23 16
NH 29 20
VT 43 34
ME 46 35
Source: The Analysis Group
8 | THE NEW ENGL AND ENERGY L ANDSCAPE

RESIDENTIAL ELECTRIC BILLS AS A PERCENT OF MEDIAN INCOME
1996 2015
U.S. State % Rank % Rank
CT 2.3% 25 2.6% 19
ME 2.2% 32 2.0% 39
MA 1.9% 43 2.3% 28
NH 2.3% 28 1.9% 46
RI 2.0% 42 2.3% 27
VT 2.2% 33 1.9% 47
U.S. avg 1.6% 2.6%
Source: The Analysis Group
And while it is just a one-year change, ISO New
England reported in late May that the average
wholesale price of electricity in 2015 fell to 4.1
cents per kilowatt-hour from 6.3 cents in 2014,
largely because of a 41 percent drop in the cost of
natural gas in 2015 (from $7.99 per million BTU’s in
2014 to $4.73 per million BTU’s in 2015). (Multiply
MMBTU by 1,000 to get millions of cubic feet.)
(Commonwealth Magazine, “Wholesale Electric
Prices Fell By Third in 2015”)
Looking out to 2024, ISO New England, which is
based in Holyoke, Massachusetts, and runs and
plans the six-state power grid and wholesale
regional electric markets, does not see any robust
increase in demand for electricity that would
put more upward pressure on prices. The ISO
sees energy efficiency and demand-reduction
measures growing much faster than overall
demand for electricity in the next decade. In its
2015 Regional System Plan, based on forecasts of
GDP growth, conservation, and other factors, the
ISO made these projections about the compound
annual growth rate in demand for power across
the region and in the six states:
Photo courtesy of National Grid.
8 | THE NEW ENGL AND ENERGY L ANDSCAPE THE NEW ENGL AND ENERGY L ANDSCAPE | 9

NEW ENGLAND, STATES’ ELECTRIC DEMAND 2015-2024
CAGR of Summer Peak Winter Peak
State Net Load Demand Growth Demand Growth
New England 1.0% 1.3 0.7
CT 1.0% 1.0 0.5
ME 0.8% 0.9 0.4
MA 1.2% 1.5 0.8
NH 1.1% 1.6 0.8
RI 0.7% 1.3 0.5
VT 0.7% 0.9 0.7
Source: ISO New England, 2015 Regional System Plan, page 34
SET TING THE AGENDA: NEW ENGL AND GOVERNORS’ 2013 STATEMENT
To a significant extent, the current energy conversation across New England was set up and
framed by a joint statement issued by all six New England governors in December 2013, laying out
challenges, opportunities, and goals. The statement read in part:
“ Securing the future of the New England economy and environment requires strategic
investments in our region’s energy resources and infrastructure. These investments will
provide affordable, clean, and reliable energy to power our homes and businesses; make
our region more competitive by reducing energy costs; attract more investment to the
region; and protect our quality of life and environment.’’
The governors called for:
• greater integration and utilization of renewable generation;
• development of new natural gas pipeline infrastructure;
• maximizing the use of existing transmission infrastructure; investment, where appropriate, in
new transmission infrastructure;
• and continuation of the inclusion of energy efficiency—and the addition of distributed
generation—in load forecasting and transmission planning.
And they noted: “As the region’s electric and natural gas systems have become increasingly
interdependent, ensuring that we are efficiently using existing resources and securing additional clean
energy supplies will be critical to New England’s economic future. To ensure a reliable, affordable and
diverse energy system, we need investments in additional energy efficiency, renewable generation,
10 | THE NEW ENGL AND ENERGY L ANDSCAPE

natural gas pipelines, and electric transmission.
These investments will also serve to balance
intermittent generation, reduce peak demand,
and displace some of the least efficient and most
polluting fossil fuel generation, enabling the
states to meet clean energy and greenhouse gas
reduction goals while improving the economic
competitiveness of our region. New England
ratepayers can benefit if the states collaborate to
advance our common goals.”
Everything the governors outlined in their 2013
statement and in follow-up statements through the
Coalition of Northeastern Governors has framed
the agenda and discussions now playing out in
Augusta, Boston, Concord, Hartford, Montpelier,
and Providence; in Washington, D.C., and before
the Federal Energy Regulatory Commission; and
in the planning processes overseen by ISO-New
England with all the stakeholders and advocacy
groups who participate in the ISO’s processes.
HISTORY: HOW NEW ENGL AND’S ENERGY MARKETS GOT HERE
Most New England states deregulated, or “restructured,” their electric markets in the 1990s with the
hope of using competitive forces and choice to lower costs and increase choice and innovation. At
that point, America had seen deregulation of the airline, telecommunications, railroad, trucking, and
oil and gas industries lower costs and spur new services and products. Electricity was, by overall
expenditure, one of the largest remaining markets in which prices and supplies were still set by
regulators and utility policymakers, not markets.
The main principle of electric restructuring was to get utilities out of being “vertically integrated”
energy companies that controlled retail energy, transmission, and power generation, and instead
transform them into “pipes and wires” companies delivering energy that customers bought from
independent suppliers who would compete to offer the lowest price. Simplistically, the goal
resembled what happened with the breakup of AT&T: Consumers kept a local monopoly regulated
company for their dial tone and local service, and were newly free to shop for the best priced “long
distance” service and other telecom products from multiple competing providers. From 1995 to 1998,
legislators in every New England state except Vermont voted to adopt a version of restructuring.
Utilities such as Boston Edison, Central Maine Power, Massachusetts Electric, Northeast Utilities,
and Public Service of New Hampshire were required to sell off their directly managed power plants
and their ownership stakes in power plants to competitive generating companies. “Stranded costs”
of paying off the debt on power plants that couldn’t be sold for anything close to what utilities had
paid to build them were passed along to consumers through “transition charges,” on the theory that
after a limited time, consumers would be paying enough less for electricity to realize net savings and
net benefits from restructuring. Gas utilities were envisioned to be restructured in the same way as
electric utilities in time, but after early turmoil with electric markets, the California power crisis, and
the Enron scandals, momentum flagged for bringing restructuring to New England’s consumer retail
natural gas supply.
Photo courtesy of National Grid.
10 | THE NEW ENGL AND ENERGY L ANDSCAPE THE NEW ENGL AND ENERGY L ANDSCAPE | 11
The new electric regime has brought customers a more complicated electric bill. While most
customers just see at the end of the month one total amount owed to Emera, Eversource, Green
Mountain Power, National Grid, Unitil or another utility, within that aggregate number they’re
paying for
• a delivery cost for electricity used, per kilowatt-hour of consumption.
• other fees for their share of the cost of New England’s transmission system, which is
apportioned among the six states according to their share of New England’s total demand
on the grid, and then by state to ratepayers.
• their “transition cost” share of paying off the “stranded costs” of pre-restructuring power
plants and electric supply contracts.
• fees for promoting renewable energy and energy efficiency.
• and the “supply charge” for the cost, per kilowatt-hour, of the energy they used.
While that last charge, the supply or energy cost, gets paid to your utility, in every state except
Vermont and some areas of New Hampshire, none of that power is generated by your utility. In
restructured markets, utilities shop on behalf of their customers for the best prices they can find from
power suppliers. Once the price has been vetted and approved by state regulators, they pass on
that cost directly to ratepayers, without taking a profit. Larger business, commercial, and industrial
customers—and a small minority of residential customers—can and do shop directly with competitive
suppliers for electricity and pay their utility only for delivering it to them, and have saved tens of
millions of dollars annually since restructuring. But even 15 years after competition and choice came
to the market, most New England residential and small-business customers are relying on their utility
to provide them what is called “basic service” or “provider of last resort” electricity. For smaller
retail customers, competitive suppliers have struggled to consistently beat utility prices and attract
significant numbers of customers.
Photo courtesy of Dominion Resources.
12 | THE NEW ENGL AND ENERGY L ANDSCAPE

Vermont opted not to pursue restructuring, as it is such a small market for power, with roughly half
the state’s demand met by imports from Hydro Quebec and, since the closing of Vermont Yankee,
much of the rest from widely distributed hydroelectric dams and imports from other states. New
Hampshire began restructuring in the early 2000s, but it has taken years to agree on terms for
utilities to divest all their generating assets. It was only on July 1, 2016, that the New Hampshire Public
Utilities Commission (NHPUC) finally approved a plan for Eversource to divest its last remaining
generation assets: the 439-megawatt coal-fired Merrimack Station in Bow; the 400-megawatt oil-
and gas-powered Newington Station in Portsmouth; the 150-megawatt Schiller Station in Portsmouth
that includes coal-, oil-, and wood-chip-powered units; and nine hydroelectric units totaling 69
megawatts of output. Approval of the divestiture was contested for years over questions including
how to reimburse Eversource for major air-pollution-control investments including a “mercury
scrubber” at Merrimack. The NHPUC deal allows Eversource to recoup $415 million over several years
for the Merrimack upgrades. The commission estimates Eversource customers will save $165 million
over five years, and millions more after that, if the plants are successfully sold to new owners by the
end of this year. Eversource owns the former Public Service of New Hampshire and Connecticut
Valley Electric, which serve about 70 percent of the state’s electric customers.
Unlike shopping for other products that are delivered to your address, electrons can’t be steered to a
specific location. So when customers shop for competitive electric supply, they are effectively paying
to have a supplier deliver into the New England power grid the same amount of electricity as those
customers take out of it at their home, business, school, hospital, or factory. Explaining this process
merits a look at how New England’s power grid works.
BACKGROUND ON THE NEW ENGL AND POWER GRID
While New England has dozens of investor-owned utilities, local municipal light departments, electric
cooperatives, and other “electric companies,” with the exception of a small part of northernmost
Maine, all these electric distribution entities are interconnected in one unified power grid. The grid
functions physically as a single pool or source of electricity that flows through utilities to customers in
all six states. ISO New England has among other responsibilities the job of overseeing the second-to-
second functioning of the power grid and ensuring supplies coming into the grid are always equal to
demand for electricity coming out of the grid.
The New England grid includes 350 utility-scale generation sources totaling 31,000 megawatts of
output capacity (providing a reliability cushion over the all-time peak demand of 28,130 megawatts
for the region set on August 2, 2006) connected by 8,600 miles of transmission lines to customers.
(One megawatt of generation capacity is enough to cover the electric needs of 750 to 1,000 average
New England homes at a time.) New England also has 13 transmission interconnections allowing us to
import, and less often export, power from and to New York, Quebec, and New Brunswick (9 to and
from New York, and two apiece to and from Quebec and New Brunswick). About 16 percent of the
electricity New England used in 2014 was imported from neighboring grids, according to ISO New
England, most of that hydropower from Quebec.
Apart from the physical numbers of assets and devices that make up the grid, the entire market for
power in New England comprises about 500 “market participants” who are represented at ISO New
England by the New England Power Pool (NEPOOL). This is a committee that represents everyone
who generates, buys, sells, transports, and uses wholesale—not retail—electric power, as well as
entities that implement “demand response” measures to reduce demand for power at peak times.
12 | THE NEW ENGL AND ENERGY L ANDSCAPE THE NEW ENGL AND ENERGY L ANDSCAPE | 13

Major Power Plants in New England
GAS
COAL
NUCLEAR
OIL
PUMPED HYDRO
WOOD
34
33
35
36
12 20
18
2
3
4
7
31
2729
26
25
23
24
28
30 32
22
15
21
1617
19
14
13
10
11
9 65
8
1

Source: U.S. Energy Information Administration Form 860, released October 21, 2015, with final data for 2014. Plant megawatt ratings are “summer capacity;” winter ratings may be higher. Megawatt totals for sites may include multiple units at a single generating complex.
State Plant Name Location Fuel Source Peak Summer MW
CT 1. Bridgeport Bridgeport gas 454 MW (3 units)
2. Bridgeport Bridgeport coal 400 MW (2 units)
3. Kleen Energy Middletown gas 622 MW (3 units)
4. Lake Road Killingly gas 757 MW (3 units)
5. Milford Milford gas 507 MW (2 units)
6. Millstone 2 Waterford nuclear 898 MW
7. Millstone 3 Waterford nuclear 1,225 MW
8. Montville Station Uncasville oil 497 MW (3 units)
9. New Haven Harbor New Haven oil 572 MW (4 units)
MA 10. ANP Bellingham Bellingham gas 472 MW (2 units)
11. ANP Blackstone Blackstone gas 473 MW (2 units)
12. Bear Swamp Rowe pumped hydro 600 MW (2 units)
13. Bellingham Cogen Bellingham gas 264 MW (3 units)
14. Brayton Point Somerset coal and oil 1,505 MW (4 units)
15. Canal Sandwich oil 1,113 MW (2 units)
16. Fore River Weymouth gas 726 MW (3 units)
17. Kendall Cambridge gas 215 MW (4 units)
18. Millennium Power Charlton gas 335 MW (2 units)
19. Mystic Everett gas and oil 1,996 MW (8 units)
20. Northfield Mountain Erving pumped hydro 1,146 MW (4 units)
21. Pilgrim Plymouth nuclear 678 MW
22. Stony Brook Ludlow oil 441 MW (9 units)
ME 23. Bucksport Hancock gas 274 MW (4 units)
24. Maine Independence Veazie gas 491 MW (3 units)
25. Rumford Power Oxford gas 254 MW (2 units)
26. Wyman Cumberland oil 811 MW (4 units)
NH 27. Essential Power Newington gas 523 MW (3 units)
28. Granite Ridge Londonderry gas 678 MW (3 units)
29. Merrimack Bow coal and oil 473 MW (4 units)
30. Newington Portsmouth oil 400 MW
31. Seabrook Seabrook nuclear 1,246 MW
32. Schiller Portsmouth coal, wood, oil 156 MW (4 units)
RI 33. Entergy RISE Johnston gas 538 MW
34. Manchester Street Providence gas 447 MW
35. Ocean State Burrillville gas 438 MW (2 units)
36. Tiverton Power Tiverton gas 250 MW
VT N/A—all small-scale and distributed hydro

HOW GAS HAS COME TO DOMINATE THE ELECTRIC GRID
Since the industry restructuring of the 1990s, natural gas has come to be the leading fuel for producing
electricity to fuel the grid because of its price and emissions characteristics, and because as a practical
matter no other source in the early 2000’s proved physically and politically feasible and acceptable
on a large scale. As restructuring took effect, many legacy power plants rapidly proved unaffordable
and unable to compete for customers in the new marketplace—especially smaller, older nuclear plants
and older coal- and oil-fired power plants with high and growing costs for reducing emissions of sulfur
dioxide and nitrogen oxides to meet ever-tighter pollution controls. At the same time, the improving
efficiency, economics, and emissions characteristics of gas-fired combined-cycle power plants in the
late 1990s and early 2000s made them much stronger competitors in the power market.
As a result, from 1995 to 2010, over 10,000 megawatts of new gas-fired generating capacity was
approved, funded, installed, and deployed across the New England power grid. The percentage of
electricity New England got from natural gas jumped from just 5% in 1990 and 15% in 2000 to 44% by
2014—almost exactly offsetting an equal drop in how much power the region got from older oil- and
coal-burning plants. Nuclear output as a share of regional electric demand, even after all the Yankee
closings, actually rose slightly, from 31% in 1990 to 34% in 2014, according to ISO data.
From a cost-to-consumers standpoint, even more important than how much of New England’s
total electricity comes from natural gas is how often New England’s electric costs are determined
by the price of natural gas. This requires an explanation of electric pricing in the New England
wholesale market.
Much of the electricity flowing through the grid at any time has been bought and paid for under
what are called bilateral contracts: Utilities and large end users buying months’ or years’ worth of
continuous electric supply at pre-negotiated prices from power-plant owners and energy marketers.
But at almost all times, the grid is also using “spot market” power whose price is determined at the
moment of use. For every day, generation owners will submit a price per megawatt-hour at which
they will agree to produce various amounts of energy from their power plants or generation supplies
during a specific hour of the day. Those prices are ranked from cheapest to most expensive in a “bid
stack.” As ISO-New England monitors and balances demand and supply, grid managers “dispatch”
plants to run in reverse order of cost, from cheapest to most expensive. The price demanded by the
very last output of production needed to meet the demand in a given hour becomes the “clearing
price” paid to everyone providing power to the spot market in that hour. A very simplified example: If
three plants bid to produce power for $30, $40, and $50 a megawatt-hour at 2 p.m. on Tuesday, and
all three plants’ output is needed to meet demand at 2 p.m. on Tuesday, all three plants will be paid
$50 an hour, because that was the “market clearing price.” Over the course of a year, clearing prices
in the spot market will have a significant impact on the prices that end users can negotiate in long-
term bilateral contracts for power.
As described later on, New England’s growing “demand response” programs, reinvigorated by
a favorable U.S. Supreme Court ruling in January 2016, counterbalance price spikes by paying
customers to use less power at times of peak demand. That lowers total demand, which lowers the
market clearing price for the entire spot market. The huge power of demand response comes from
the reality that a very small number of hours per year account for a disproportionate annual cost of
electricity. Just 1 percent of all hours of electric consumption in New England account for 8 percent
of the region’s total cost of electricity, and the top 10 percent of demand hours (typically summer hot
spells, winter afternoons, or periods when grid managers are coping with a supply failure) account for
40 percent of spending, according to Massachusetts Department of Energy Resources Data.
16 | THE NEW ENGL AND ENERGY L ANDSCAPE

The fact that such a small proportion of electric usage accounts so disproportionately for overall
annual electric costs for New England is explained by a quirk of electricity virtually unique among
all commodities: It can’t yet be stored in any meaningful quantities. So while most consumers’ prices
for energy are fixed for six months at a time, at the wholesale level, at periods of peak strain on the
grid, prices can soar to 10 or even 20 times the typical average price. Once efforts at maximizing
conservation and curbing demand have been reached, at periods of extreme demand and limited
supply, suppliers of electricity can require—and get—whatever price they propose to run the
generation needed. ISO New England caps the maximum price for a megawatt hour at $1,000. In a
crisis moment, the alternative to paying for $1,000 power is grid managers imposing Third-World-
style rolling blackouts to ration available supply, something generally considered unacceptable in
New England and the U.S. outside of extraordinary circumstances. In the example of the 2 p.m.
Tuesday power demand, owners of “peaking units” like jet-engine generators designed to be fired
up only a few times a year may demand the maximum $1,000 per megawatt hour to run if needed in
that hour. Or owners of a gas- or oil-fired plant running at 99 percent capacity may have submitted
an offer to crank it up to 100 or 102 percent of its rated capacity if they get paid $1,000 per
megawatt hour, to compensate for strain on the unit and the risk of breakdown. A small number of
hours of $1,000 power in a market where power is usually selling for $50 or $70 will heavily influence
the total annual cost of electricity for everyone. Generating companies argue that these price spikes
are not examples of price gouging, but rather of a properly functioning wholesale market sending
clear—if rare or even extraordinary—signals about when and where new generating capacity will be
needed to meet unusual levels of demand or extreme operating conditions.
Even in the competitive market, occasionally plants more expensive than the spot market clearing
price will be called on to operate—or “run out of merit”—to maintain reliable service in specific areas
or compensate for a transmission or technical problem. ISO New England has at times required
power plants whose owners wanted to close them down to keep operating under “reliability/must
run” orders paying them a premium price to stay in business, but these are much less commonly used
than they were in the early 2000’s.
Natural gas power plants, according to ISO New England, set the overall spot market price in New
England about 70 percent of the time, and thus dominate overall market price trends. A main
reason for this is that nuclear, coal, and hydroelectric plants generally run most efficiently when
they are producing power within a steady range for days, weeks, or even months at a time rather
than frequently cycling output up or down. Nuclear, coal, and hydro often will be bid into the market
at lower prices intended to ensure they get called to run consistently. They tend to be the plants
that are producing round-the-clock “baseload” power for hospitals, traffic lights, refrigerators, and
telecommunications networks that operate 24/7/365. Cycling output up and down is much easier,
safer, and cheaper for gas plants, so a gas plant tends overwhelmingly to be the last unit called to
meet the last increment of electric demand on the New England grid. Thus, most of the time the cost
of the natural gas used in the power plants that set New England’s market price is the single biggest
determinant of electric prices and, over time, electric rates. Price charts from ISO New England and
others show that wholesale electric rates in the region tend to move almost in lockstep with natural
gas prices, especially in the winter.
That tight link between gas and electricity in New England is one of the most important factors
driving the complex decisions and choices facing New England’s legislators, regulators, and
policymakers. And demand for gas is not slowing down. In its 2016 Annual Energy Outlook, the U.S.
Energy Information Administration predicted that New England’s consumption of natural gas will
continue to grow by an average of 0.2 percent annually from 2015 to 2040, even as the total use of
16 | THE NEW ENGL AND ENERGY L ANDSCAPE THE NEW ENGL AND ENERGY L ANDSCAPE | 17

energy in the region drops by 0.1 percent annually—reflecting a continued shift from oil and power-
plant coal to gas.
Demand for gas for power generation shows no signs of easing in New England. Besides plants
such as Pilgrim and Brayton Point actually scheduled to shut down, ISO-New England identifies in
its 2016 Regional Energy Outlook 11 plants it considers to be economically “at risk” of shutting down:
Yarmouth in Maine; Merrimack, Newington, and Schiller in New Hampshire (soon to be divested
by Eversource); West Springfield, Mystic, and Canal in Massachusetts; and Middletown, Montville,
New Haven, and Bridgeport 3 in Connecticut. The ISO’s 2015 Regional System Plan identifies 1,498
megawatts of generating capacity closing by mid-2017, along with 785 MW of capacity coming
online in 2016 and 1,022 in 2018. All the new units will be fueled by natural gas. Overall, in the ISO’s
current planning horizon, close to two-thirds of all pending proposals for power generation for
New England are gas-fired plants, with the balance large-scale wind and hydro. As of January 2016,
13,000 megawatts of proposed generation capacity was “in the queue” with the ISO to be approved
as eligible to interconnect to the grid. More than 60 percent of that, 8,200 megawatts, is gas-fired
generation, most of the rest, 4,200 megawatts, wind, according to the 2016 REO.
A total of 13,650 megawatts of generating capacity in
New England, 44 percent of the total, now runs on gas,
according to the ISO’s 2016 State of the Grid report. But
the ISO’s 2015-16 winter outlook identified “up to 4,220
megawatts of natural-gas-fired generation at risk of not
being able to get fuel when needed.” This is because
generators generally won’t or can’t economically
commit to “primary firm service” and take “interruptible
service” instead. In the workings of the competitive
wholesale market, they don’t know which days they will
definitely be called on by the ISO to run and produce
electricity and so can’t justify committing hundreds of
thousands or millions of dollars to contracting for gas
supply they may not wind up using. (The ISO, at the
same time, has reported problems in the past of not
being able to know ahead of time if a generator whose
bid has been taken to produce electricity will actually
get the gas they need to be able to deliver that power.
The ISO has been working in recent years to improve its
visibility into gas-supply reliability).
One of the major ways ISO-New England has tried to protect against a loss of gas supply has been,
since 2013, to pay gas-fired power plants to be “dual-fuel” capable, able to switch to running on
stored oil on short notice. Under its Winter Reliability Program, the ISO has been paying power plant
owners $35 million to $70 million a year to help cover the cost of having up to 10 days’ supply of oil
on hand—oil the plant owners do not know in advance whether they will need to use or not. The cost
of this subsidy is added to all ratepayers’ bills through a “tariff,” and was $34.7 million in the winter
of 2015-16. Currently about 30 percent of all gas-fired generation capacity in the region can switch
to oil if called to. ISO-New England plans to continue offering payments to plants for capability to
run on oil through the 2016-17 and 2017-18 winters. The main downside to this strategy is that plants
emit far more pollution burning oil than gas and then have to go offline for hours or days to clean
out the turbines to resume burning gas. In many cases, plants are restricted by state environmental
regulations or license conditions on how many hours they can run on oil per month or per year.
Photo courtesy of Eversource.
18 | THE NEW ENGL AND ENERGY L ANDSCAPE

THE UNPREDICTABLE INTERCONNECTEDNESS OF FUEL-SOURCE CHOICES
As described above, the ultimate overall cost of electricity in New England depends heavily on which
kind of fuel is establishing the “market clearing price” most of the time, how often it is a fuel source
other than natural gas, and how much prices spike during periods of intense demand. To an extent,
energy economists can predict what electric prices will be in the future, based on historic demand
trends, if they know the mix of power plants available, the cost of natural gas, how much “demand
response” may curb peak power demand at what price levels, and other factors that all go into where
supply and demand intersect, and at what price.
Policy choices and laws designed to introduce more hydro,
wind, or gas (at electric ratepayer expense) to help lower
electric costs all amount to decisions that put a thumb on a
side of a very complicated scale. They are choices driven by
environmental values and economic goals. But calculating
their impact on the ultimate prices that businesses,
institutions, and consumers will pay for electricity becomes
an even more complicated—and contentious—exercise.
Regardless of their perceived merit, policy choices add
distortions to what is otherwise, at least in theory, a classic
free market, and will create winners and losers, savings and
costs, and it’s important for policymakers to try to fully
enumerate those questions and quantify answers as much
as they can. Examples of questions some of the current
policy initiatives raise are:
• If Vermont Yankee and Pilgrim have or will shut down because they could no longer
economically compete in a natural-gas-driven market, what impact would adding still
more gas have on Seabrook and Millstone—both how often they run and their long-term
economic viability?
• What would it mean for New England’s likelihood of attaining emissions and climate change
goals to lose significantly more nuclear power, either from having units called to run less
often, or by their potentially being driven out of business—as five nuclear plants in the region
already have been or will be?
• What would be the impact of adding one or two very large power plants’ worth of imported
hydroelectric power on the overall price of power, need for more gas, and economic viability
of offshore wind?
• Conversely, what would be the impact of adding one or two or more very large power
plants’ worth of offshore wind power on the overall price of power, need for more gas, and
economic viability of imported hydroelectricity?
• How fair, or unfair, is it for existing generators and demand response providers who compete
in energy markets every day to get new competition from hydro and wind projects that can
lock in 20-year contracts?
• At the same time, how can a new hydro or wind power supply that may require $1 billion or
more in transmission upgrades fairly compete with gas or nuclear plants already connected
to the grid without some way to recoup the transmission cost over time?
Photo courtesy of Brightfields Development.
18 | THE NEW ENGL AND ENERGY L ANDSCAPE THE NEW ENGL AND ENERGY L ANDSCAPE | 19

A look at the analytical back-and-forth over just one project, the $1.6 billion Eversource-Hydro
Quebec Northern Pass project to bring increased supplies of Quebec hydropower into New England
through new transmission lines, illustrates much of this complexity. A September 2015 report by
The Analysis Group, conducted for the New England Power Generators Association, estimated that
New England consumers would pay $777 million a year above market prices for the power Northern
Pass would deliver, or some $20 billion over the 15- to 25-year life of a contract, largely because
of the added transmission cost. The report also argued that more long-term hydro imports would
“artificially suppress wholesale energy prices and undermine the financial viability of other, more
cost-effective generating assets (e.g., existing nuclear plants) that are otherwise important for a
low-carbon electricity supply.
A rebuttal report published April 25, 2016, by Power Advisory LLC for the Massachusetts Clean
Electricity Partnership, “Analysis of Benefits of Clean Electricity Imports to Massachusetts
Customers,” argued the importation of 18.9 tWh per year (18.9 billion kWh, or about 13 percent of
total 2020 forecast New England demand) of “clean power” from various Canadian sources would
save New England consumers $1.072 billion per year, or about 6 percent on average in New England
and 8 percent in Massachusetts. The underlying analysis (available at www.masscleanelectricity.org)
points to the myriad economic impacts any big change in power supply creates, including:
• $476 million in direct savings on wholesale electric costs
• $300 million a year in savings through downward pressure on demand for gas that lowers
its price by 5 percent at the wholesale level and thereby indirectly lowers electric costs;
• and another $344 million in annual savings by reducing the need for older, less efficient
plants to operate, which would reduce their value—and ultimate cost to electric ratepayers—
in the wholesale capacity market.
While every one of those numbers can be disputed based on applying different cost assumptions,
the key reality they underscore is that any new source of energy will have not just direct impacts on
the price of electricity—but also second and tertiary impacts through how that new source affects
the economics of other sources of electricity, and then a cascade of follow-on effects from there.
HOW NEW ENGL AND GETS NATURAL GAS
New England is often described as being at “the end of the energy pipeline” because it has no
native sources of oil or natural gas production. Currently, the region has incoming gas pipeline with a
capacity of 3.95 billion cubic feet per day, according to the Energy Information Administration. This
includes five pipelines from the west, north and northeast, plus a liquefied natural gas LNG station
close to Boston and two offshore LNG delivery points in Boston Harbor. (One of the delivery points in
Boston Harbor was idled in mid-2013 because of low demand.) LNG is a form of natural gas that has
been chilled to liquid, shrinking it to 1/600th its volume in its gaseous state. LNG is “vaporized” to be
injected back into gas pipes. The LNG facility at Canaport in New Brunswick is a key source of New
England supply as it feeds gas into the Maritimes & Northeast pipeline entering Maine, especially as
output from the Sable Island gas field dwindles.
Several of these pipeline systems are known by multiple names. The Alqonquin system is owned by
Spectra Energy. The Iroquois system is owned 50-50 by Dominion and TransCanada. The Tennessee
system is owned by Kinder Morgan.
20 | THE NEW ENGL AND ENERGY L ANDSCAPE

Photo courtesy of Dominion Resources.
20 | THE NEW ENGL AND ENERGY L ANDSCAPE THE NEW ENGL AND ENERGY L ANDSCAPE | 21
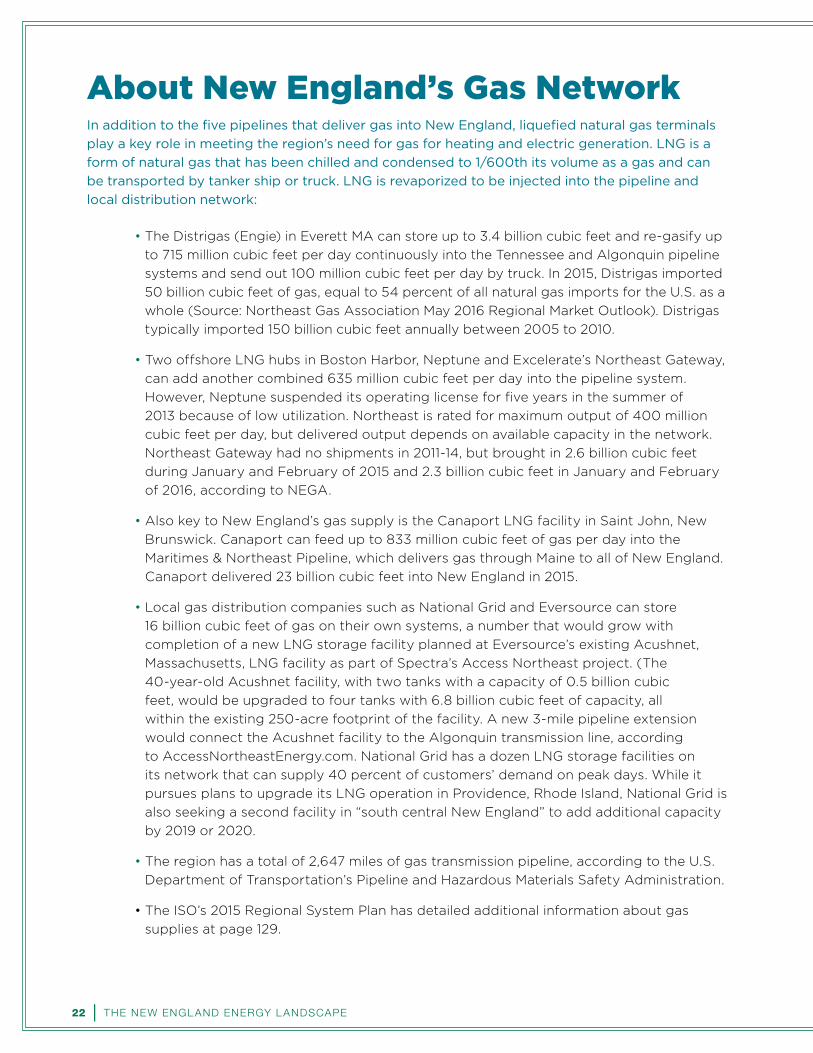
About New England’s Gas NetworkIn addition to the five pipelines that deliver gas into New England, liquefied natural gas terminals
play a key role in meeting the region’s need for gas for heating and electric generation. LNG is a
form of natural gas that has been chilled and condensed to 1/600th its volume as a gas and can
be transported by tanker ship or truck. LNG is revaporized to be injected into the pipeline and
local distribution network:
• The Distrigas (Engie) in Everett MA can store up to 3.4 billion cubic feet and re-gasify up
to 715 million cubic feet per day continuously into the Tennessee and Algonquin pipeline
systems and send out 100 million cubic feet per day by truck. In 2015, Distrigas imported
50 billion cubic feet of gas, equal to 54 percent of all natural gas imports for the U.S. as a
whole (Source: Northeast Gas Association May 2016 Regional Market Outlook). Distrigas
typically imported 150 billion cubic feet annually between 2005 to 2010.
• Two offshore LNG hubs in Boston Harbor, Neptune and Excelerate’s Northeast Gateway,
can add another combined 635 million cubic feet per day into the pipeline system.
However, Neptune suspended its operating license for five years in the summer of
2013 because of low utilization. Northeast is rated for maximum output of 400 million
cubic feet per day, but delivered output depends on available capacity in the network.
Northeast Gateway had no shipments in 2011-14, but brought in 2.6 billion cubic feet
during January and February of 2015 and 2.3 billion cubic feet in January and February
of 2016, according to NEGA.
• Also key to New England’s gas supply is the Canaport LNG facility in Saint John, New
Brunswick. Canaport can feed up to 833 million cubic feet of gas per day into the
Maritimes & Northeast Pipeline, which delivers gas through Maine to all of New England.
Canaport delivered 23 billion cubic feet into New England in 2015.
• Local gas distribution companies such as National Grid and Eversource can store
16 billion cubic feet of gas on their own systems, a number that would grow with
completion of a new LNG storage facility planned at Eversource’s existing Acushnet,
Massachusetts, LNG facility as part of Spectra’s Access Northeast project. (The
40-year-old Acushnet facility, with two tanks with a capacity of 0.5 billion cubic
feet, would be upgraded to four tanks with 6.8 billion cubic feet of capacity, all
within the existing 250-acre footprint of the facility. A new 3-mile pipeline extension
would connect the Acushnet facility to the Algonquin transmission line, according
to AccessNortheastEnergy.com. National Grid has a dozen LNG storage facilities on
its network that can supply 40 percent of customers’ demand on peak days. While it
pursues plans to upgrade its LNG operation in Providence, Rhode Island, National Grid is
also seeking a second facility in “south central New England” to add additional capacity
by 2019 or 2020.
• The region has a total of 2,647 miles of gas transmission pipeline, according to the U.S.
Department of Transportation’s Pipeline and Hazardous Materials Safety Administration.
• The ISO’s 2015 Regional System Plan has detailed additional information about gas
supplies at page 129.
22 | THE NEW ENGL AND ENERGY L ANDSCAPE

Pittsburg Interconnect
Westbrook Maritimes NE
Pleasant St
Dracut Beverly Salem Massachusetts
Mendon
Shelton
Brookfield
Baileyville Border M&R
Everett
Neptune LNG Deepwater Port
Northeast Gateway
Algonquin Gas Transmission Co.
Granite State Gas Transmission System
Iroquois Gas Transmission System
Maritimes & Northeast Pipeline LLC
Portland Natural Gas Transmission System
Tennessee Gas Pipeline Co.
Vermont Gas Systems Inc.
Interconnect Points LNG Facilities
Phillipsburg
GAS PIPELINES AND LNG
22 | THE NEW ENGL AND ENERGY L ANDSCAPE THE NEW ENGL AND ENERGY L ANDSCAPE | 23

GAS OUTLOOK: AMPLE SUPPLY, AMPLE DEMAND, CONSTRAINTS
The ISO New England 2015 Regional System Plan is built on a prediction that northeast regional gas
production, from Marcellus Shale fields in Pennsylvania, Ohio, and neighboring states, will rise from
3.92 trillion cubic feet in 2013 to 6.66 trillion cubic feet in 2024. The Northeast Gas Association says
the Marcellus Shale may hold 500 trillion cubic feet of gas in all. Production was 16 billion cubic feet
per day in 2015 and could grow in time to 25 billion, the NEGA says.
But, as the numbers on gas-fired electric generation above show, demand for gas has grown
robustly—not just for electric generation but for conventional heating purposes, as tens of thousands
of New England homeowners and businesses have converted to natural gas fuel since the 1990s.
According to U.S. Energy Information Administration/Northeast Gas Association data, total New
England gas consumption grew from 665 billion cubic feet in 2000 to 855 billion cubic feet in 2014.
“Legacy” gas usage for heating and industry grew from 466 billion cubic feet to 522 billion cubic feet.
Use of gas for producing electricity grew from 199 billion cubic feet to 333 billion cubic feet.
According to the Northeast Gas Association, the number of residential customers using natural gas—
mostly after switching over from home heating oil, and also construction of new residences in areas
served by gas—was 14.6% higher in 2014 than it was in 2000, and 29.7% higher in 2014 than in 1990.
Here are numbers of residential units heated by gas in each state by year, according to the Northeast
Gas Association:
In its May 2016 Regional Market Outlook, the Northeast Gas Association said New England has 2.6
million natural gas customers, including 2.3 million who use gas to heat their homes and for cooking
and heating, and 260,000 commercial and industrial customers. New England’s gas consumption
breaks down to: 39 percent for power generation, 25 percent for residential, 23 percent for
commercial, and 13 percent for industrial.
In some areas, this combination of increased demand for gas for conventional heating use and
increased demand for gas for electric generation has created supply shortages. Berkshire Gas has
since 2014 imposed a moratorium on new gas hookups in parts of Hampshire and Franklin Counties
(including communities such as Amherst, Hadley, Hatfield, Deerfield, Greenfield, Montaque, Whately,
HOMES HEATED BY GAS
1990 2000 2005 2014
CT 428,912 458,388 475,221 522,658
ME 12,000 17,111 18,633 27,047
MA 1,118,429 1,278,781 1,297,508 1,461,350
NH 65,310 82,813 94,473 99,146
RI 195,100 214,474 224,320 233,786
VT 18,300 28,532 33,015 39,917
New England 1,838,051 2,080,099 2,143,170 2,383,904
24 | THE NEW ENGL AND ENERGY L ANDSCAPE
and Sunderland) and said those moratoria would be lifted only in November 2018 and only if the
Kinder Morgan Northeast Direct project were completed. Columbia Gas of Massachusetts imposed
a hookup moratorium at the end of 2014 in Northampton and Easthampton, Massachusetts. National
Grid has a moratorium on new gas connections on the Lower Cape Cod in Massachusetts into 2018-
19, but says this is not because of inadequate supply but because of a pipeline constriction in the
mid-Cape it is fixing.
Plans for increased natural gas distribution in other parts of New England continue, but less
aggressively than in the early 2000s. In New Hampshire, Liberty Gas has recently petitioned to
expand service to Hanover, Lebanon, Pelham, and Windham but projects it will need additional gas
supply capacity “in the near future” to continue to grow. Vermont Gas has faced environmental
protests and disruptions as it builds its Addison Expansion Project to add gas service to Middlebury
College and the surrounding communities. Avangrid’s Connecticut Gas in August 2016 announced
plans to expand service to Bolton and Coventry in Tolland County, furthering its goal of converting
200,000 customers from heating oil to gas by 2023.
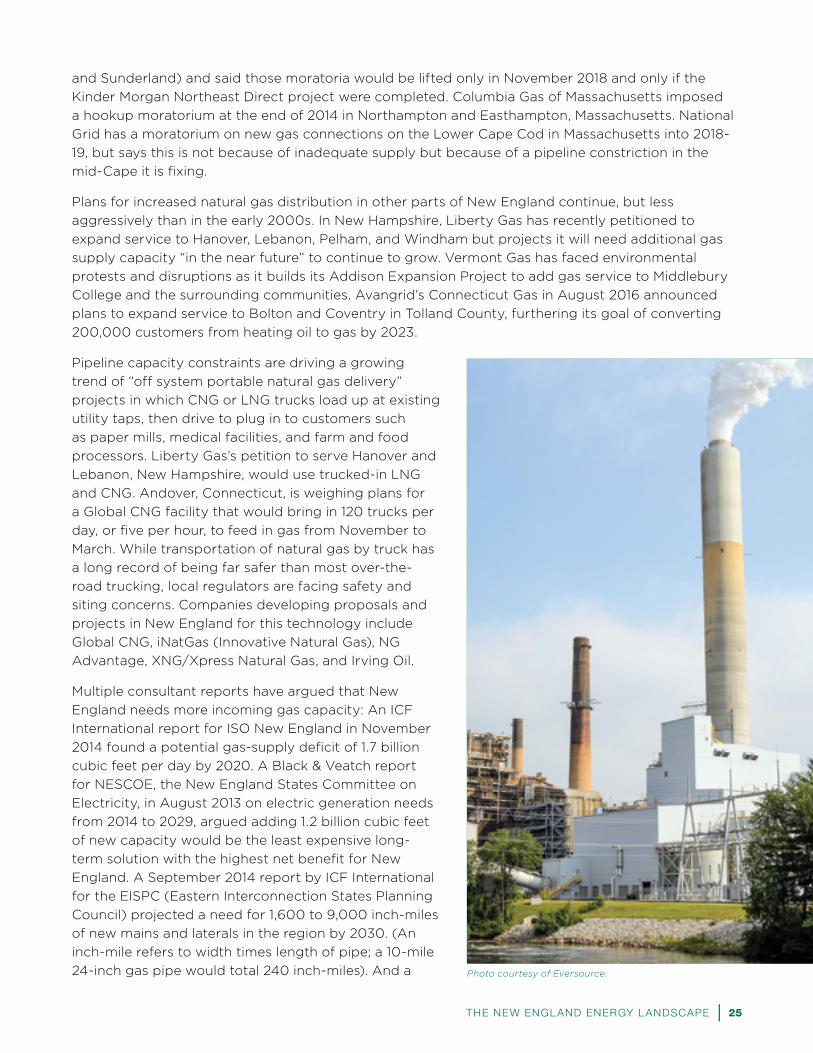
Pipeline capacity constraints are driving a growing
trend of “off system portable natural gas delivery”
projects in which CNG or LNG trucks load up at existing
utility taps, then drive to plug in to customers such
as paper mills, medical facilities, and farm and food
processors. Liberty Gas’s petition to serve Hanover and
Lebanon, New Hampshire, would use trucked-in LNG
and CNG. Andover, Connecticut, is weighing plans for
a Global CNG facility that would bring in 120 trucks per
day, or five per hour, to feed in gas from November to
March. While transportation of natural gas by truck has
a long record of being far safer than most over-the-
road trucking, local regulators are facing safety and
siting concerns. Companies developing proposals and
projects in New England for this technology include
Global CNG, iNatGas (Innovative Natural Gas), NG
Advantage, XNG/Xpress Natural Gas, and Irving Oil.
Multiple consultant reports have argued that New
England needs more incoming gas capacity: An ICF
International report for ISO New England in November
2014 found a potential gas-supply deficit of 1.7 billion
cubic feet per day by 2020. A Black & Veatch report
for NESCOE, the New England States Committee on
Electricity, in August 2013 on electric generation needs
from 2014 to 2029, argued adding 1.2 billion cubic feet
of new capacity would be the least expensive long-
term solution with the highest net benefit for New
England. A September 2014 report by ICF International
for the EISPC (Eastern Interconnection States Planning
Council) projected a need for 1,600 to 9,000 inch-miles
of new mains and laterals in the region by 2030. (An
inch-mile refers to width times length of pipe; a 10-mile
24-inch gas pipe would total 240 inch-miles). And a Photo courtesy of Eversource.
24 | THE NEW ENGL AND ENERGY L ANDSCAPE THE NEW ENGL AND ENERGY L ANDSCAPE | 25

January 2015 Synapse Energy report for the Massachusetts Department of Energy Resources stated
that Massachusetts alone needs 600 to 800 million cubic feet per day of additional gas capacity by
2020. Kinder Morgan’s Tennessee Gas said in a June 2015 filing with the Massachusetts Department
of Public Utilities in docket 15-37 that “demand for pipeline capacity exceeds the availability of
pipeline capacity on the Tennessee system nearly every day throughout the year.”
EXPANDING THE GAS NETWORK: PL ANS MOVING, PL ANS DROPPED
Many plans to expand the regional gas supply are moving forward, although Kinder Morgan announced
on April 20, 2016, it was suspending development of its $3.3 billion Northeast Energy Direct pipeline
to Dracut, Massachusetts. It officially withdrew the project from federal regulatory consideration on
May 23. Since the submission of the plan to FERC in November 2015, Kinder said, the project had faced
intense local opposition and had failed to attract enough customers to proceed into financing and
construction. The Northeast Direct project would have supplied up to 2.2 billion cubic feet per day of
gas capacity, or a roughly 36 percent increase in New England’s incoming pipeline capacity. NED’s
route went 188 miles from near Wright, New York, to Dracut, including 64 miles in Massachusetts, 91
percent of that co-located with electric transmission corridors, and 71 miles in New Hampshire, 87
percent adjacent to or overlapping a 345-kilovolt transmission line. Much of the non-utility-corridor new
routing of the line was to avoid wetlands and environmentally sensitive areas the existing transmission
corridors passed through. NED was planned to go into service in November 2018.
Kinder/Tennessee is, however, moving forward with a Connecticut gas expansion after winning a
lawsuit against the project in Berkshire Superior Court in Massachusetts. The judge ruled that under
Federal Gas Act, the company does not need a two-thirds vote of the Massachusetts Legislature
to construct a pipeline section through a state forest. The Tennessee Gas Connecticut Expansion
was aimed to be in service by November 2016 and involves constructing a 13.5-mile pipeline loop to
deliver 72 million additional cubic feet per day of gas into Connecticut.
Spectra/Algonquin has one project nearing completion and two others moving ahead in development.
Spectra’s Alqonquin Incremental Market (AIM) project is expected to come on line in November
2017 and add 340 million cubic feet per day of additional capacity, an 8.6 percent expansion of New
England’s pipeline gas supply and 7.6 percent addition to the current peak demand design day for the
gas system. This $1 billion project includes upgrading many sections of existing 26-inch pipe to 42-inch
diameter and upgrading the capacity of five compressor stations to increase gas throughput.
Secondly, Spectra Atlantic Bridge is a $750 million to $1 billion expansion of southwest-to-northeast
gas delivery with capacity of 132 million cubic feet per day. However, the mayor of Weymouth,
Massachusetts, in early May 2016 declared opposition to a planned $47 million compressor station,
and the city’s Conservation Commission refused to issue a needed permit. Local critics fear noise,
lights, explosions, and terrorism. Whether local opposition can preempt FERC’s power to approve
the project is unclear. Many environmentalists express concern that Atlantic Bridge is part of an
overall strategy to use pipeline capacity through New England to someday increase global exports of
fracked Marcellus gas through eastern Canada. Gas companies note that there are no export facilities
yet planned or proposed to serve such a market, and that global demand patterns overwhelmingly
favor Gulf of Mexico facilities exporting to Asian markets via the Panama Canal, not exports from
North America to a slow-growing Europe whose gas supplies come mainly from Russia.
Third, Spectra is working with Eversource, National Grid, and other companies on Access Northeast
Energy (ANE). ANE would add 900 million cubic feet per day of additional capacity and link to about
70 percent of New England’s fleet of gas power plants. Some 95 percent of Access Northeast’s
26 | THE NEW ENGL AND ENERGY L ANDSCAPE

project uses existing pipeline and utility corridors and infrastructure sites. Five new electric power
plants now under construction or in planning all connect to the Algonquin system that would get
more capacity: CPV Towantic in Oxford, Connecticut; Footprint Power in Salem, Massachusetts;
Exelon’s Medway Peaker Project in Medway, Massachusetts; LS Power’s new turbines in Wallingford,
Connecticut; and Invenergy’s proposed plant in Burrillville, Rhode Island. Besides the pipeline
upgrades, ANE would also include a new LNG storage facility at Eversource’s existing Acushnet,
Massachusetts, LNG complex. (The 40-year-old Acushnet facility, with two tanks with capacity of 0.5
billion cubic feet, would be upgraded to four tanks with 6.8 billion cubic feet of capacity, all within
the existing 250-acre footprint of the facility. A new 3-mile pipeline extension would connect the
Acushnet facility to the Algonquin transmission line.) (Source: AccessNortheastEnergy.com) However,
a principal funding mechanism for the ANE pipeline expansion has been thrown into uncertainty by a
Massachusetts court ruling, described at greater length below, overturning a state-approved plan to
charge electric utility customers for gas capacity expansion.
A regularly updated list of planned expansions can be found at www.northeastgas.org/pipeline_
expansion.php. ISO New England’s 2015 Regional System Plan figure 8.9 also outlines gas
transmission upgrades proposed to serve New England.
SHOULD ELECTRIC CUSTOMERS BE BILLED FOR GAS UPGRADES?
The Spectra Access Northeast Energy project is one of the leading examples of a type of project
envisioned by the New England governors’ December 2013 joint statement urging more regional
investment in gas infrastructure. Under the ANE plan, which has been thrown into uncertainty by an
August 17, 2016, ruling by the Massachusetts Supreme Judicial Court, electric customers of National
Grid and Eversource in Massachusetts were to be charged for 20-year gas supply contracts executed
through the utilities to help fund the pipeline project. Similar proposals are under consideration or
have been conditionally approved in every other New England state except Vermont.
The basic theory behind this arrangement is: New England’s cost of electricity, as described earlier,
depends heavily on the price of natural gas. More supply of gas coming into New England should
theoretically reduce the price of gas. A lower cost of gas should mean a lower cost of electricity.
Cheaper gas would mean cheaper electricity. So in broad terms, it is fair to electric customers who’d
benefit from lower prices to pay for increased gas capacity. Of course, determining just how much
this arrangement reduces electric rates turns on a long list of disputable assumptions and predictions
about future electric demand and supply and the price of gas and electricity from various sources.
In February 2015, at the direction of Governor Charlie Baker, the Massachusetts Department of
Energy Resources directed the state Department of Public Utilities to open a docket review on the
question of using electric tariffs to pay for gas supply capacity. In October 2015, the DPU approved
such a mechanism for electric utilities to pay for gas pipelines if they can be shown to have a “net
benefit” for electric customers. In November 2015, Massachusetts Attorney General Maura Healey’s
office released a report opposing the policy as creating more costs than benefits for consumers
financially and environmentally. In January 2016, Eversource and National Grid filed with the DPU for
approval of 20-year contracts for gas supply.
The Conservation Law Foundation (CLF) and Engie, owner of the LNG plant near Boston, sued to
oppose the DPU’s approval of the Spectra-Eversource-Grid contracts. Attorney General Healey’s
office, which normally would defend the Commonwealth in such a suit, filed a friend-of-the-court
brief supporting CLF and Engie, and the commonwealth retained special outside counsel to defend
the state.
26 | THE NEW ENGL AND ENERGY L ANDSCAPE THE NEW ENGL AND ENERGY L ANDSCAPE | 27
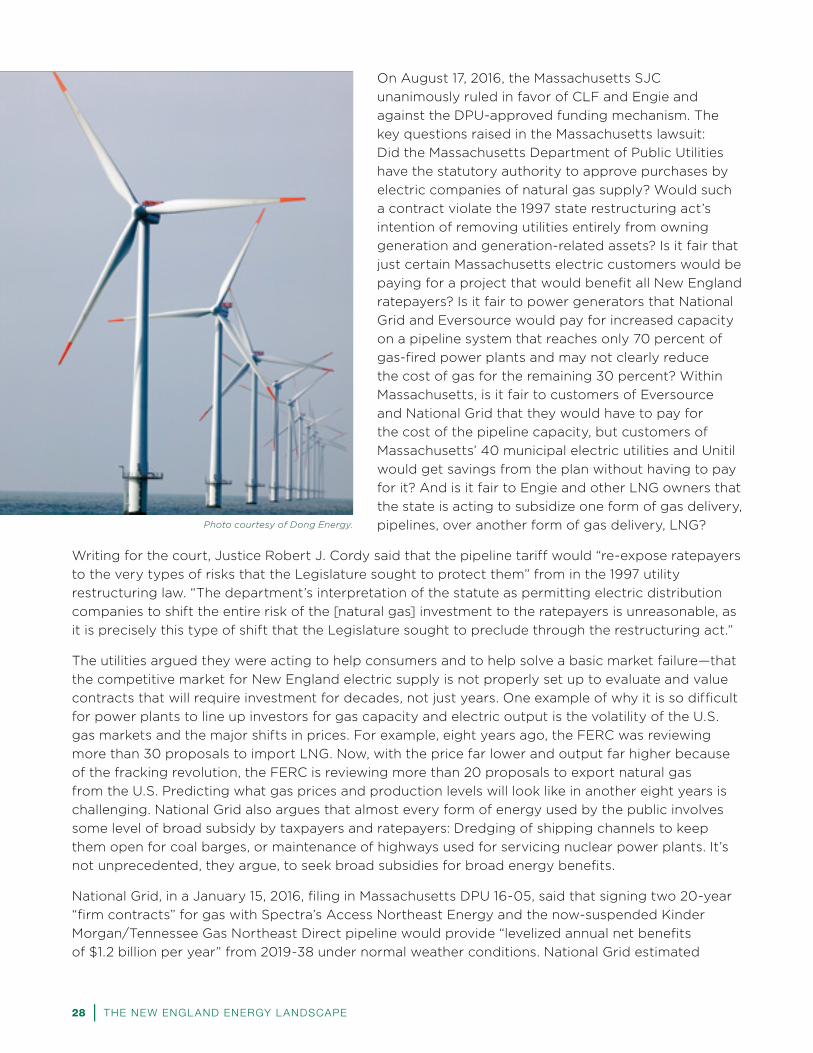
On August 17, 2016, the Massachusetts SJC
unanimously ruled in favor of CLF and Engie and
against the DPU-approved funding mechanism. The
key questions raised in the Massachusetts lawsuit:
Did the Massachusetts Department of Public Utilities
have the statutory authority to approve purchases by
electric companies of natural gas supply? Would such
a contract violate the 1997 state restructuring act’s
intention of removing utilities entirely from owning
generation and generation-related assets? Is it fair that
just certain Massachusetts electric customers would be
paying for a project that would benefit all New England
ratepayers? Is it fair to power generators that National
Grid and Eversource would pay for increased capacity
on a pipeline system that reaches only 70 percent of
gas-fired power plants and may not clearly reduce
the cost of gas for the remaining 30 percent? Within
Massachusetts, is it fair to customers of Eversource
and National Grid that they would have to pay for
the cost of the pipeline capacity, but customers of
Massachusetts’ 40 municipal electric utilities and Unitil
would get savings from the plan without having to pay
for it? And is it fair to Engie and other LNG owners that
the state is acting to subsidize one form of gas delivery,
pipelines, over another form of gas delivery, LNG?
Writing for the court, Justice Robert J. Cordy said that the pipeline tariff would “re-expose ratepayers
to the very types of risks that the Legislature sought to protect them” from in the 1997 utility
restructuring law. “The department’s interpretation of the statute as permitting electric distribution
companies to shift the entire risk of the [natural gas] investment to the ratepayers is unreasonable, as
it is precisely this type of shift that the Legislature sought to preclude through the restructuring act.”
The utilities argued they were acting to help consumers and to help solve a basic market failure—that
the competitive market for New England electric supply is not properly set up to evaluate and value
contracts that will require investment for decades, not just years. One example of why it is so difficult
for power plants to line up investors for gas capacity and electric output is the volatility of the U.S.
gas markets and the major shifts in prices. For example, eight years ago, the FERC was reviewing
more than 30 proposals to import LNG. Now, with the price far lower and output far higher because
of the fracking revolution, the FERC is reviewing more than 20 proposals to export natural gas
from the U.S. Predicting what gas prices and production levels will look like in another eight years is
challenging. National Grid also argues that almost every form of energy used by the public involves
some level of broad subsidy by taxpayers and ratepayers: Dredging of shipping channels to keep
them open for coal barges, or maintenance of highways used for servicing nuclear power plants. It’s
not unprecedented, they argue, to seek broad subsidies for broad energy benefits.
National Grid, in a January 15, 2016, filing in Massachusetts DPU 16-05, said that signing two 20-year
“firm contracts” for gas with Spectra’s Access Northeast Energy and the now-suspended Kinder
Morgan/Tennessee Gas Northeast Direct pipeline would provide “levelized annual net benefits
of $1.2 billion per year” from 2019-38 under normal weather conditions. National Grid estimated
Photo courtesy of Dong Energy.
28 | THE NEW ENGL AND ENERGY L ANDSCAPE

the net present value to ratepayers of the plan at $10.9 billion, with 46 percent of that flowing to
Massachusetts ratepayers and the other 54 percent to the rest of New England. With just ANE, New
England would get levelized annual net benefits of $1.1 billion per year. National Grid has been hoping
to get DPU approval to sign a pipeline contract by October 2016.
In a June 15, 2015, filing with the Massachusetts DPU in Docket # 15-37, Kinder Morgan’s Tennessee
Gas unit said based on CES methodology, adding 1.0 to 1.2 billion cubic feet of increased delivery
capacity would, after accounting for the cost to consumers of the upgrade, deliver a net annual cost
savings of $661 to $700 million. The Tennessee pipeline serves, on a net-generation basis, 37 percent
of New England’s existing installed gas-fired generation capacity.
However, a study conducted for Attorney General Healey’s office by The Analysis Group’s Paul
Hibbard and Craig Aubuchon and released on November 18, 2015, found that adding incremental
new gas capacity is not required to meet the state’s electric reliability needs. “Increasing natural gas
transportation capacity in New England would lower wholesale electricity costs by lowering natural
gas prices at times when the interstate pipeline system would otherwise face greater constraints,”
the authors confirmed. But, they concluded New England has “underutilized LNG storage and
vaporization capacity.” They also concluded that energy efficiency and demand-response measures
can meet the state’s power needs more cheaply and cleanly. In the “most stressed scenario” they
could envision, there was an electric reliability deficiency of 1,675 MW in 2024, growing to 2,480 MW
by 2029-30, in just 26 hours across nine days, because of a deficiency of 420 million cubic feet per
day of natural gas supply. The report assumes an increase in the number of gas-fired power plants
that can switch to running on fuel oil when gas supplies are strained.
The Attorney General’s report concluded that new pipeline capacity would save ratepayers $61
million annually, but at the cost of producing 80,000 more tons of carbon dioxide annually that
moves Massachusetts away from its Global Warming Solutions Act goals and requirements. Energy
efficiency and demand response measures, the Healey report argued, would save more than twice as
much, $146 million annually, and eliminate 1.86 million tons of carbon dioxide.
The SJC ruling raises the question of whether legislators could or will amend state law to allow
electric utilities to enter into gas capacity contracts. However, proposals to make Massachusetts
electric customers pay for gas pipeline capacity have generated major opposition from legislators.
On June 30, 2016, the state Senate voted 39-0 in favor of an energy bill amendment prohibiting any
such contracts, although this amendment was not included in the final House-Senate compromise
legislation signed by Governor Baker. More than 90 Massachusetts state representatives had also sent
the House speaker a letter opposing ratepayer support for more pipeline infrastructure as part of any
pending bill.
How much more LNG can be counted on to offset the need for pipeline gas is debatable. LNG is
increasingly a globally traded commodity, and after the 2011 Fukushima nuclear disaster in Japan,
many shipments of LNG destined for Distrigas near Boston got diverted mid-ocean to Japan because
the price for the fuel there soared. While shale gas from Pennsylvania delivered by pipeline can be
secured under contract for years, LNG delivered by ship is likely to be considerably more expensive
and subject to diversion to other parts of the world depending on market conditions.
From the standpoint of electric grid reliability, administrators at ISO-New England remain gravely
worried about a worst case scenario if New Englanders are left without heat and electricity during
a brutal winter cold snap. In this scenario, if the available gas transmission infrastructure can’t meet
demands for gas for heat and power, under federal law, gas utilities holding “firm” contracts for fuel
28 | THE NEW ENGL AND ENERGY L ANDSCAPE THE NEW ENGL AND ENERGY L ANDSCAPE | 29

would as a rule have priority over electric generators for the available fuel. What grid managers
focused on reliability have to plan to avoid is a scenario where there is not enough gas supply in
a given location for either heating or power generation needs, residential users are left with no
electricity and no heat, and people may freeze to death in the dark. Thus the intense focus by ISO
New England on ensuring there is enough slack in the system and redundancy—at a cost still to be
determined—to prevent the risk of a human catastrophe.
CT, ME, NH, RI ON ELECTRIC CUSTOMERS PAYING FOR GAS
Four of the five other New England states besides Massachusetts—Connecticut, Maine, New Hampshire,
and Rhode Island—are at some stage of considering or adopting plans like the now-overturned
Massachusetts proposal to have electric customers pay for the cost of increased gas capacity.
In New Hampshire, in September 2015, the state Public Utilities Commission staff concluded that
the commission “may hold that the NH electric distribution companies have authority to enter into
gas capacity contracts for the benefit of gas-fired generators.” On February 18, 2016, Eversource
filed with the state Public Utilities Commission to have customers of the former Public Service
of New Hampshire pay for 20-year contracts for gas supply, mirroring the contract proposed
in Massachusetts. Much like National Grid has estimated the plan will produce net savings for
Massachusetts customers, Eversource’s analysts estimate the plan will deliver $140 million to $270
million in annual net savings over 20 years to Granite State electric customers, figures that other
analysts have disputed.
In Maine, the Maine Energy Cost Reduction Act (MECRA), adopted in June 2013, authorized the state
to have ratepayers pay for up to 200 million cubic feet of new natural gas capacity, at a cost of no
more than $75 million annually. The process since then has been contentious: Consultants London
Economics International LLC in 2014 warned the costs would exceed the benefits, leading to a 2-1
vote by the Maine Public Utility Commission in November 2014 against continuing with the plan.
Maine Governor Paul LePage, however, has continued to advocate for more gas supply. On July 10,
2016, rejecting a negative recommendation by its staff, the PUC voted 3-0 in conditional favor of
pursuing electric-ratepayer-funded gas capacity. Commissioners stipulated that Maine would move
ahead on the plan only if other New England states also approved similar pipeline capacity contracts.
The proceedings are docketed as Maine PUC 2014-0071.
In Rhode Island, National Grid filed with the state Public Utilities Commission a “Request for Approval
of a Gas Capacity Contract and Cost Recovery” on June 30, 2016, that is similar to the Massachusetts
and New Hampshire mechanisms for having electric customers pay for a 20-year gas supply
contract. National Grid says the plan is “commercially reasonable and will provide net benefits at a
reasonable cost to National Grid’s customers in the form of improved electric reliability and lower
electric retail prices’’ and that it conforms to the Rhode Island Affordable Clean Energy Security
enacted in July 2014. The Rhode Island proposal also includes a mechanism for buying and releasing
LNG bought under the contract and for returning “a small fraction” of demonstrated savings to the
utility “to create an inducement for future innovative efforts by the Company that promise to yield
additional customer benefits.’’ More information about this plan may be found at http://www.ripuc.
org/eventsactions/docket/4627page.html.
In Connecticut, the Department of Energy and Environmental Protection is—as of this writing—now
working on completing an RFP to have electric distribution companies enter into agreements for gas
transportation capacity, under the 2015 Act Concerning Affordable and Reliable Energy finalized
DEEP March 17, 2015.
30 | THE NEW ENGL AND ENERGY L ANDSCAPE

ENVIRONMENTALIST OPPOSITION TO NATURAL GAS
Measures to support and increase use of natural gas face strong opposition from many
environmentalists who argue they make the region more dependent on a source of fuel whose
carbon-dioxide emissions will aggravate global climate change. While natural gas was once hailed as
a lower-emitting “bridge fuel”—bridging the transition period from dirtier coal and oil power plants
to the fully renewable energy sources that would replace gas plants as the intermediate generation
source—many critics of natural gas pipeline capacity expansion have become concerned these
moves will leave New England “stuck on the bridge.” Environmentalists fear the region becoming
more dependent for decades more on a fossil fuel for most of its electricity and heating. Additionally,
critics argue that much of the new gas supply poised to enter New England from the Marcellus shale
is produced in a way that is far more environmentally damaging than conventional Gulf of Mexico
natural gas production of the 1990s and 2000s, with fracking raising concerns about pollution of
water, earthquakes, and industrialization of bucolic rural areas. Many environmentalists also express
suspicions—rebutted by industry executives, as described above—that plans to expand southwest-to-
northeast gas capacity through New England are driven not only or mainly by New England capacity
issues, but by a long-term strategy to build more and bigger routes to export “fracked gas” globally
from the Marcellus through future coastal LNG terminals in New England and Eastern Canada.
At the same time, many energy experts note that at
least at some level, natural-gas-fired generators are
actually critical to making many forms of renewable
energy fully viable. Because wind can slow down and
the sun can be covered by clouds, output levels from
wind turbines and solar photovoltaic panels can swing
minute by minute. Until large-scale energy storage
becomes more widespread and affordable, gas-fired
power plants are seen by grid operators as the best
option for rapidly increasing and decreasing output to
supplement wind and solar as needed.
Another environmental concern about gas is that
methane is a highly potent greenhouse gas, trapping
far more heat in the atmosphere than equivalent
amounts of carbon dioxide. Per pound emitted,
according to the U.S. Environmental Protection
Agency, methane has 25 times as big an impact on
climate as carbon dioxide a 100-year period.
Some environmentalists argue states should force utilities to reduce or eliminate leaks of gas from their
existing systems before paying for more capacity. Massachusetts’ new August 2016 environmental law
includes several measures mandating increased leak repairs. But the total cost-benefit ratio of such
policies, especially given the expense of digging up and repairing gas lines in urban areas, is challenging
to calculate definitively. A 2015 study conducted for the Commonwealth of Massachusetts found that
0.6 to 1.1 percent of gas delivered into the state’s network of pipes was lost to emissions. Massachusetts
and Rhode Island have adopted legislation to encourage replacement of cast-iron and bare-steel gas
pipes, which are at particular risk of corroding and leaking. The average U.S. gas utility has a network
made up of 5 percent bare steel and cast-iron components. The comparable numbers here are 24
percent in Massachusetts and 35 percent in Rhode Island. (More data are available in the Northeast Gas
Association May 2016 Regional Outlook, page 22).
Photo courtesy of Unitil.
30 | THE NEW ENGL AND ENERGY L ANDSCAPE THE NEW ENGL AND ENERGY L ANDSCAPE | 31

In Massachusetts, National Grid has plans to
replace 463 miles of cast-iron pipe and 381 miles of
unprotected steel from its service territories between
2016 and 2020. The total environmental impact in
reduced methane emissions, 2,686.7 metric tonnes
of methane, the company says, is comparable to
eliminating 14,000 cars from the road or replacing
1.75 million incandescent light bulbs with compact
fluorescents. From 2010 to 2015 Grid spent $856
million to replace 740 miles of gas mains.
In Rhode Island, where National Grid has 260,000 customers served by 3,210 miles of gas mains
and 2,450 miles of service lines, National Grid says it has by repairs reduced the percentage of “leak-
prone mains” from 53 percent of the system in 2006 to 39 percent of the system in 2015, including
replacing 210 miles of leak-prone mains from 2011 to 2015. National Grid projects it will replace
another 365 miles of leak-prone mains, our of 1,237 total in 2015, by 2020.
HEATING OIL AS A CONTINUING, RELIABLE, GREENER FUEL SOURCE
For all the growth in use of natural gas, representatives of the heating oil industry in New England
note that they continue to supply more than 2 million homeowners with heating fuel in a completely
private-sector energy network that does not require government subsidies or intervention. New
low-sulfur requirements taking effect July 1, 2018, in all six New England states lower allowable sulfur
in heating oil by 97 percent from current levels. And with increased use of plant-based “biofuels”
blended into heating oil, taking into account the greenhouse gas effects of methane leaks, groups
such as the National Oilheat Research Alliance (NORA) and New England Fuel Institute note that
today’s heating oil can rival and exceed natural gas, measured over years, in greenhouse gas
improvements. Availability of fuel oil/heating oil as a backup at natural-gas-fired electric generating
stations has become a critical part of ISO New England’s winter grid reliability strategy. Heating oil
has been an energy mainstay for much of New England for decades, and with ongoing improvements
in its environmental and emissions characteristics, it will remain a key element in the discussion of the
most optimal overall blend of energy sources to ensure affordable, reliable, environmentally sound
electricity and heating for the region. Evaluating the extent to which new blends of fuel oil can rival
natural gas and renewables in overall environmental impact will be an important issue for regional
policymakers and regulators to pursue.
NEW ENGL AND’S ENERGY/ENVIRONMENTAL FRAMEWORK: RPS’S, RGGI, AND GLOBAL CLIMATE CHANGE L AWS
In all the debate over the cost and merits of promoting more natural gas or renewables, New England
legislators and policymakers are operating within an energy-and-environment framework primarily
defined by three major constructs:
1. Laws in all six states committing to specific reductions in emissions of carbon dioxide from
all activity, including power generation, by specific dates in the future, most commonly 2020
and 2050.
2. The Regional Greenhouse Gas Initiative (RGGI) under which power plants in the region pay
for the right to produce carbon dioxide, and those payments are reinvested into energy
efficiency, renewables, and other projects.
Photo courtesy of Dominion Resources.
32 | THE NEW ENGL AND ENERGY L ANDSCAPE

3. Renewable Portfolio Standards intended to help states reach the climate change laws
by requiring entities providing power to customers in each state to acquire minimum
percentages of their supply from sources defined as renewable under each state’s law.
(This may or may not include sales of “existing hydro” from Quebec, Connecticut River
dams and large pumped-storage facilities in northwestern Massachusetts, and other
sources, depending on the state’s legal definition.)
Laws for reducing emissions of greenhouse gases have emerged over several years in the six New
England states and have a long history of support. On August 28, 2001, in fact, governors of the
six states and premiers from five eastern Canadian provinces (New Brunswick, Newfoundland and
Labrador, Nova Scotia, Prince Edward Island, and Quebec) also adopted a Climate Change Action Plan
2001 committing the 11 jurisdictions to an overall 10 percent reduction in greenhouse gas emissions
from 1990 levels by 2020, and a “long-term goal” of reducing such emissions by 75 to 85 percent.
Here is a breakdown of the six states’ current commitments on greenhouse gas emissions:
State Applicable Law 2020 2050
CT Public Act 8-98 10% below 1990 80% below 2001
ME PL 237 10% below 1990 N/A
MA Global Warming
Solutions Act 2008 25% below 1990 80% below 1990
NH Climate Action Plan 20% below 1990 80% below 1990
RI Executive Climate Change
Coordinating Council* 10% below 1990 80% below 1990
VT Executive Order 07-05 2028 50% below 1990 75% below 1990
*RI adds intermediate 45% below 1990 by 2035 | Source: The Analysis Group, Healey report page 68
In Massachusetts, the discussion over what the 2008 Global Warming Solutions Act (GWSA) will
require of the energy sector took a major new turn with a May 16, 2016, unanimous ruling by the
Supreme Judicial Court in Kain et al. vs. Department of Environmental Protection. Throwing out
a Superior Court ruling, the SJC ruled that DEP regulations had not fulfilled the “unambiguous
language” of the 2008 GWSA requiring DEP to promulgate regulations “that address multiple sources
of categories of greenhouse gas emissions, impose a limit on emissions that may be released, limit
the aggregate emissions released from each group of regulated sources or categories of sources,
set emissions limits for each year, and set limits that decline on an annual basis” within the building,
heating, and transportation sectors. The SJC ruled that the regulations were to be promulgated
January 1, 2012, and to take effect January 1, 2013. DEP contended it had met the requirements of the
law by issuing policies and regulations for low-emissions vehicles, reduction of methane leaks from
gas utilities, and using RGGI carbon auction proceeds to support energy conservation and demand
reduction. Additionally, the SJC’s Kain ruling also raises questions about whether energy facilities
physically located outside the Commonwealth of Massachusetts—such as new Canadian hydropower
supplies that could come into the state under the energy legislation enacted in August 2016—can and
will count towards measuring the state’s energy emissions or not.
32 | THE NEW ENGL AND ENERGY L ANDSCAPE THE NEW ENGL AND ENERGY L ANDSCAPE | 33
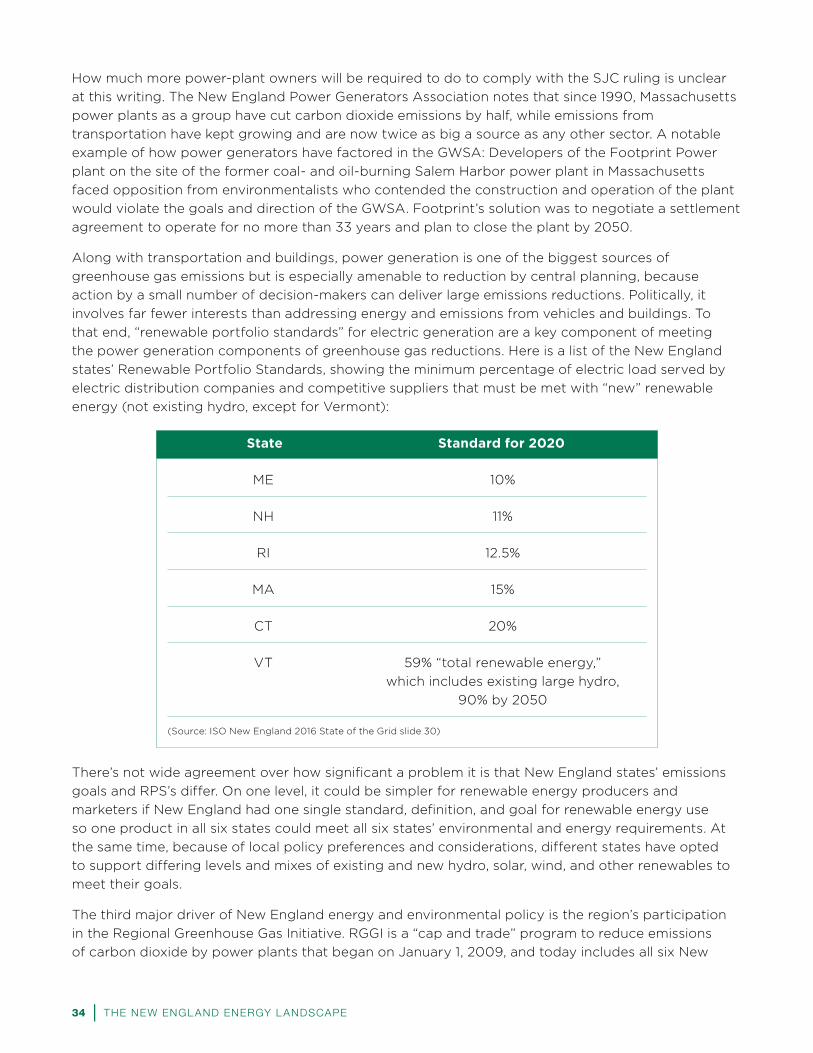
How much more power-plant owners will be required to do to comply with the SJC ruling is unclear
at this writing. The New England Power Generators Association notes that since 1990, Massachusetts
power plants as a group have cut carbon dioxide emissions by half, while emissions from
transportation have kept growing and are now twice as big a source as any other sector. A notable
example of how power generators have factored in the GWSA: Developers of the Footprint Power
plant on the site of the former coal- and oil-burning Salem Harbor power plant in Massachusetts
faced opposition from environmentalists who contended the construction and operation of the plant
would violate the goals and direction of the GWSA. Footprint’s solution was to negotiate a settlement
agreement to operate for no more than 33 years and plan to close the plant by 2050.
Along with transportation and buildings, power generation is one of the biggest sources of
greenhouse gas emissions but is especially amenable to reduction by central planning, because
action by a small number of decision-makers can deliver large emissions reductions. Politically, it
involves far fewer interests than addressing energy and emissions from vehicles and buildings. To
that end, “renewable portfolio standards” for electric generation are a key component of meeting
the power generation components of greenhouse gas reductions. Here is a list of the New England
states’ Renewable Portfolio Standards, showing the minimum percentage of electric load served by
electric distribution companies and competitive suppliers that must be met with “new” renewable
energy (not existing hydro, except for Vermont):
State Standard for 2020
ME 10%
NH 11%
RI 12.5%
MA 15%
CT 20%
VT 59% “total renewable energy,”
which includes existing large hydro,
90% by 2050
(Source: ISO New England 2016 State of the Grid slide 30)
There’s not wide agreement over how significant a problem it is that New England states’ emissions
goals and RPS’s differ. On one level, it could be simpler for renewable energy producers and
marketers if New England had one single standard, definition, and goal for renewable energy use
so one product in all six states could meet all six states’ environmental and energy requirements. At
the same time, because of local policy preferences and considerations, different states have opted
to support differing levels and mixes of existing and new hydro, solar, wind, and other renewables to
meet their goals.
The third major driver of New England energy and environmental policy is the region’s participation
in the Regional Greenhouse Gas Initiative. RGGI is a “cap and trade” program to reduce emissions
of carbon dioxide by power plants that began on January 1, 2009, and today includes all six New
34 | THE NEW ENGL AND ENERGY L ANDSCAPE

England states plus Delaware, Maryland, and New York. (New Jersey was an original member
but later withdrew.) Power plant owners bid every quarter for the right to emit carbon dioxide in
an auction that typically sets a price of around $2 to $5 per ton of carbon dioxide, under a total
cap. That cap was tightened by 45 percent in 2014, to a new cap region-wide of 91 million tons of
CO2. That decision came after it became clear the combination of improved carbon efficiency of
generation and the economic impacts of the 2008-10 Great Recession had driven the region’s carbon
output far below the old cap, so carbon emission allowances were likely to be of very low value and
jeopardize revenue and ongoing environmental impact from RGGI.
There’s wide agreement that the carbon caps under RGGI, and the prices for carbon emissions
they’ve yielded, are far too low in and of themselves to drive major climate-based turnover in the
power generating fleet, or to substantially value the non-carbon-emitting attributes of nuclear power
plants for the purposes of meeting states’ 2020 and 2050 emissions goals. RGGI has changed the
total wholesale price of power by just a few percentage points a year at most. Nevertheless, RGGI
has generally been considered successful as far as it goes, creating a framework and foundation for
ongoing efforts to “price carbon” more effectively to meet energy and environmental goals.
The RGGI auctions have produced more than $1 billion in revenue so far, distributed back to
participating states. New England has redirected RGGI revenues mostly to energy efficiency
programs, renewable energy development, direct assistance to billpayers, and greenhouse gas
abatement programs. (Rhode Island, for example, has used RGGI revenues to perform energy
upgrades on 67 non-profit and community-buildings. Maine used RGGI revenues to distribute 1.9
million high-efficiency light bulbs).
The six New England states have received the following amounts of RGGI revenue cumulatively
through the end of 2013:
State RGGI Revenue (millions)
CT $98.5
ME $41.5
MA $252.89
NH $62.2
RI $25.4
VT $11.7
(Source: RGGI.org, “Investment of RGGI Proceeds Through 2013,” April 2015)
Renewable portfolio standards and RGGI have significantly helped the six states in moving towards
their 2020 carbon goals. The region saw some backsliding in 2015, however, largely because of the
shutdown of the Vermont Yankee nuclear power plant in Vernon at the end of 2014, removing a
major source of non-carbon energy from the New England supply. Also, many dual-fuel gas/oil plants
burned more polluting oil in the brutal winter of 2015 to ensure adequate availability of natural gas for
heating, industry, and electricity generation.
34 | THE NEW ENGL AND ENERGY L ANDSCAPE THE NEW ENGL AND ENERGY L ANDSCAPE | 35

Besides carbon-dioxide emission reductions from
power plants of 26 percent between 1999 to 2014,
according to the ISO New England 2016 Regional
Energy Outlook, the region has achieved major
progress in reducing air pollution and smog as coal
and oil plants have been replaced. Over those years,
according to the ISO, emissions by power plants of
nitrogen oxides fell 66 percent and of sulfur dioxide
94 percent.
CONNECTICUT/MASSACHUSET TS/RHODE ISL AND CLEAN ENERGY RFP
Recognizing that they have common climate and
emissions goals and could get better offers and prices
by teaming up, Massachusetts, Connecticut, and Rhode
Island jointly issued a “Clean Energy RFP” in November
2015. This followed Massachusetts Governor Charlie
Baker’s filing in July 2015 of his initial version of the
recently enacted legislation to facilitate purchases of
long-term contracts for hydroelectric power, offshore
wind, and other renewables by Massachusetts utilities.
Baker asserted—although some utilities disagreed
with him—that Massachusetts law as then written
blocked utilities from being able to seek these kinds of
long-term contracts, and his legislation would finally
enable utilities to “test the market” for hydro and wind
power and introduce some actual market-based cost
estimates to the “green energy” debate.
Connecticut’s share of the RFP was authorized by the June 2015 enactment of “An Act Concerning
Affordable and Reliable Energy.” Final details are being worked out in Hartford. Rhode Island’s
participation in the RFP is under the aegis of the 2014 Rhode Island Affordable Clean Energy Security
Act. National Grid—which serves 99 percent of the state’s electric customers—is acting on the state’s
behalf as the agent negotiating clean power supplies for the state. Rhode Island’s state energy plan, “RI
Energy 2035,” published on October 8, 2015, committed the state to seeking a “secure, cost-effective,
and sustainable energy system” by 2035 through an “all-of-the-above clean energy framework.”
On January 28, 2016, the tri-state “New England Clean Energy Request for Proposals” drew more
than two dozen proposals for up to 1,490 megawatts of new hydroelectric power from Canada, 600
megawatts of hydro from New York, and 3,500 megawatts “nameplate capacity” of land-based
wind, and 750 megawatts of nameplate capacity from solar. (Actual megawatt output from wind and
solar needs to be discounted from the “nameplate capacity” rating by the hours the wind is blowing
at less than peak power production speeds or the sun is not shining.) Most of the wind power was
contingent on development of three new transmission lines from Maine and two new lines from New
York. More details on the bids responding to the RFP can be found at http://cleanenergyrfp.com/
bids . The three states had been planning to complete their “evaluation phase” July 26, 2016, before
moving ahead with bids, but that deadline has been extended indefinitely as this report goes to press.
Photo courtesy of Eversource.
36 | THE NEW ENGL AND ENERGY L ANDSCAPE

WIND POWER WITHIN NEW ENGL AND AND OFF THE COAST
One of the biggest developments in New England energy markets over the next 20 years could be
widespread development of large-scale wind-generated electricity off the region’s coasts, especially
with the new Massachusetts law directing utilities to pursue contracts for 1,600 megawatts of new
offshore wind generation.
New England had 850 megawatts of installed on-land wind capacity as of November 2015, with 4,100
megawatts in the interconnection queue, either under construction or in planning. (ISO New England
2015 Regional System Plan page 157) This includes 3,641 MW in Maine, 464 MW in Massachusetts, 91
MW in New Hampshire, and 47 MW in Vermont, according to the ISO. The remote location of many
of the best areas for on-land wind generation, such as along the ridge lines of remote mountainous
areas of northern New England, is driving the need for significant new capacity for electric
transmission that has generated outright opposition to tall power pylons cutting through remote
forested areas, or calls to have power lines put fully underground, which adds millions of dollars per
mile and new operational complexity.
For offshore wind along New England’s southern coast, planning and investment activity is currently
booming. Construction is underway now on Deepwater Wind’s five-turbine, 30-megawatt Block Island
Wind Farm off the coast of Rhode Island. It is scheduled to begin producing power later this year.
DONG Energy’s Bay State Wind project envisions more than 1,000 megawatts of capacity in ocean
tracts 130 feet to 160 feet deep located 15 nautical miles southwest of Martha’s Vineyard, with
“gigawatts” of capacity online by 2030. DONG (originally Danish Oil and Natural Gas) has built to
date 26 percent of all offshore wind capacity in the world, with 17 projects totaling 3,000 megawatts
in operation, 5 projects totaling 3,300 megawatts under construction, and 11 projects totaling more
than 5,000 megawatts under development. By 2020, DONG estimates, the cost of producing wind
power offshore will drop by 35 to 40 percent from 2012 levels. DONG also recently took over the
Ocean Wind project 10 miles off the coast of New Jersey and hopes to develop 1,000 megawatts of
capacity in waters 65 to 100 feet deep.
OffshoreMW, working in partnership with the Vineyard Power Cooperative, was named in January
2015 the successful bidder for a lease on a 160,000-acre zone about 14 miles south of Martha’s
Vineyard. It had not announced plans as this report went to press for how much wind power it plans
to install and when.
For years, talk of offshore wind in New England has been dominated by controversy and lawsuits
over the proposed Cape Wind project in Nantucket Sound. The newer offshore projects are
proceeding in a far different regulatory and political environment. In contrast to Cape Wind
identifying an area where it wanted to site turbines and public policy then moving to catch up, with
the offshore projects, the U.S. Interior Department and dozens of stakeholder groups worked for
years to identify areas with promising wind resources and ocean-floor topography, most invisible
from shore, and then subtract shipping lanes, whale migration routes, areas of concern for bird and
marine life, areas near aviation radar, and other sensitive zones from what was ultimately put out
to bid. The process overseen by the U.S. Department of Energy in the 2010s identified and put out
to public bid access to hundreds of square miles of deep water ocean tracts. In notable contrast to
Cape Wind, the “deep offshore” projects have the virtue of being impossible or nearly impossible for
people to see or perceive from land. (Massachusetts’ August 2016 energy law included a provision
locking Cape Wind out of the state’s offshore wind bidding by restricting eligibility to projects in
federally leased waters, on the Outer Continental Shelf, and at least 15 miles from inhabited areas).
36 | THE NEW ENGL AND ENERGY L ANDSCAPE THE NEW ENGL AND ENERGY L ANDSCAPE | 37

The trade association Offshore Wind: MA (OffshoreWindMA.com) estimates that the waters off
Massachusetts alone could support 8,000 megawatts of generating capacity. Studies show year-
round, wind blows hard enough during 9 days out of 10 in this zone to produce power. One potential
concern expressed by some developers, however, is how rapidly wind-turbine technology is changing
and improving, meaning that between the time a project first files for technical interconnection
approval with ISO New England and when it is ready to go to market, turbine technology may have
jumped to a new level of capacity and the original technical documentation and regulatory approval
will have become outdated. Additionally, some developers are now wondering whether U.S. Jones Act
requirements for using only American-built and -crewed ships in domestic waters could put a crimp on
availability of vessels to transport turbines, cabling, and construction workers and equipment.
RENEWABLE ENERGY PL ANS NEED NEW TRANSMISSION
While New England has potentially huge use for hydro and land-based and offshore wind power,
the success of many of these proposals will turn on construction and financing of new transmission
lines to get the power from where it’s most readily available to the Boston-Providence-Hartford-
Springfield-Worcester zone from which the vast majority of demand for electricity comes in New
England. (Page 33 of the ISO’s 2016 Regional Energy Outlook illustrates how far the best wind
generation capacity in New England is from the areas of highest demand for that power).
ISO New England has traditionally planned and recommended transmission projects to meet
identified needs for reliability upgrades. But in response to the bevy of proposals for remote new
hydro and wind power, and a new federal procedure called FERC Order 1000, the ISO has begun
accepting proposals for “non-reliability” projects, including ones designed to meet “policy goals”
such as more renewable power flowing into the grid. A total of 11 such proposals totaling over 7,000
megawatts of capacity were in the “interconnection queue” at the ISO as of January 2016, aimed
at bringing hydro and wind from Quebec, Northern Maine, New Brunswick, and Newfoundland and
Labrador to areas of concentrated demand in southern New England.
Name Sponsor Power Flow
Northern Pass Hydro Quebec and Eversource 1,090 MW Quebec to New Hampshire
Northeast Energy Link Emera and National Grid Maine to Massachusetts
Maine Green Line New England ITC Maine underwater to Massachusetts
Bay State Offshore Anbaric Deepwater wind farms off Martha’s Vineyard and Block Island to MA, RI
Northeast Energy Corridor Irving, Maine, New Brunswick NB to southern Maine
Muskrat Falls-Lower Churchill Nalcor Newfoundland and Labrador to Maine
New England Clean Power Link TDI New England Quebec to southern Vermont
Vermont Green Line VGL, Hydro Quebec, Invenergy 400 MW Plattsburg, N.Y. to New Haven, Vt. Via Lake Champlain
Maine Yankee site in Wiscasset, ISO Concept proposal Maine, to Boston area
Northern Maine into Maine ISO Concept proposal Green Line or other new lines
Downeast Maine to Boston area ISO Concept proposal
Source: ISO New England “State of the Grid 2016,” slide 35
38 | THE NEW ENGL AND ENERGY L ANDSCAPE

This list is updated every month, along with the
list of pending power plant proposals needing to
interconnect to the grid, at http://www.iso-ne.
com/system-planning/transmission-planning/
interconnection-request-queue. For developer
confidentiality, the ISO does not name sponsors or
specific projects, but they generally can be deduced
from the origin and termination points listed for the
proposed projects. Before 2015, far more projects were
listed in the interconnection queue, but in 2015, the ISO
raised fees for applying for interconnection and having
technical issues studied and identified by its experts
to about $250,000. This had the effect of eliminating
the most speculative transmission projects from the
list, leaving those with the most realistic chance of
obtaining funding in the planning queue.
The transmission proposal that has so far drawn the
most visibility and controversy is the Eversource/Hydro
Quebec (HQ) Northern Pass, a $1.6 billion, 192-mile line,
with 60 miles buried. New Hampshire legislators voted
in 2012 to ban the use of eminent domain by Northern
Pass to assemble rights-of-way for the line, although
Northern Pass leaders said they never planned to seize
land for the project and would pursue only paths with
support from landowners. Northern Pass unveiled a
revised route in June 2013 putting more of the route
along state and local roadways and reducing the
number of affected private landowners from 186 to 31.
In the spring of 2016 the New Hampshire Site Evaluation Committee delayed its deadline for deciding
on the project until September 30, 2017, to give opponents more time to respond to the project. It’s
unclear at this writing whether Eversource will still be able to meet its original goal of having the line
in service beginning in May 2019. More information about the status of Northern Pass may be found
at http://www.nhsec.nh.gov/projects/2015-06/2015-06.htm.
One aspect of the Northern Pass plan designed to reduce public controversy is its use of a relatively
new kind of funding mechanism called a “delivery commitment” rather than a traditional “power
purchase agreement.” Rather than signing on to commit to buying and paying for a specific amount
of electricity, under the Northern Pass process, ratepayers will pay for the cost of the transmission
upgrades in proportion to the extent hydro electric exporters meet their projections for selling power,
and at specific times. HQ and Eversource have also promised to sell guaranteed minimum levels of
power during peak winter and summer hours of demand, and at other hours when wholesale electric
prices are at their highest, in order to ensure Northern Pass would be a source of overall downward
pressure on New England electric prices. The delivery commitment model is designed to put the
financial risk of the project on project proponents, rather than ratepayers. Still, a study issued last
year by The Analysis Group, commissioned by the New England Power Generators Association,
warned that based on overall market prices and what Hydro Quebec would need to charge to make
the project economical factoring in the expense of new transmission, Northern Pass could add $777
Photo courtesy of Brightfields Development.
38 | THE NEW ENGL AND ENERGY L ANDSCAPE THE NEW ENGL AND ENERGY L ANDSCAPE | 39

million a year to New England ratepayers’ electric bills. Other studies by the Massachusetts Clean
Electricity Partnership reject that claim and assert projects like Northern Pass and other new supplies
would save New England electric customers money.
A total of $4.8 billion in transmission upgrade proposals, both for reliability and for delivering more
renewable energy, are pending before the ISO (2015 Regional System Plan, page 26), on top of $7.2
billion in transmission upgrades constructed and deployed between 2002 and 2015, a total of 634
individual projects. (RSP15 page 21) For reliability upgrades, ratepayers pay for the cost of these
transmission projects through a FERC-approved “tariff,” or fee.
Having so much new transmission capacity added to the New England grid has had an effect on
ratepayers’ bills: From 2008 to 2015, the average transmission charge added to a customer’s bill
nearly doubled, from 0.8 cents per kilowatt hour to 1.5 cents per kilowatt hour. But that investment
has paid off in major ways, too. Along the lines of the pipeline expansions some utilities and
governors are urging, installation of better transmission capacity has paid off for consumers: Total
transmission “congestion” costs – basically, consumers being forced to pay for more expensive power
produced closer to home because line connections weren’t big enough to bring in cheaper power
produced farther away—fell from $266.6 million in 2005 to $32 million in 2014. Over the course of
2014, consumers in Boston paid just 41 cents per megawatt-hour, or .041 cents per kilowatt-hour,
in “locational marginal price” premiums more than the average for the rest of New England electric
customers. This was a signal from the market that transmission upgrades have nearly eliminated
congestion around Boston. (RSP15 page 86)
FERC’s “Order 1000” that took effect May 18, 2015, required
changes in transmission planning and cost-allocation
procedures that had been used in New England since 2001.
They allow the ISO to seek bids for transmission projects to
meet forecast demand more than three years out, as well
as transmission projects “to meet public policy objectives”
such as increased use of offshore wind. How Order 1000 will
be implemented through ISO policies is still being worked
out. Transmission funding has also been the subject of
state-level consideration, such as Rhode Island legislators
evaluating legislation to socialize the cost of grid upgrades
for renewable energy projects across all ratepayers.
OPERATIONAL CHALLENGES OF RENEWABLES IN THE GRID —NOT ALL MEGAWAT TS ARE CREATED EQUAL
While state policies across the region are encouraging and requiring more use of renewable power,
especially wind and solar, ISO New England has had to spend millions of dollars on new technologies
and procedures to incorporate the variability of those energy sources into reliable operation of the grid.
In running a six-state power grid, ISO has relied on detailed historical knowledge about typical
overall power demands at every hour of every day, based on varying weather conditions, which
determine how intense demand will be for air conditioning and refrigeration. With a grid supplied
overwhelmingly by steady-running nuclear and coal plants supplemented by combined-cycle gas
turbine generation that can be easily dialed up and down minute by minute, matching supply to
forecast demand was readily manageable.
Photo courtesy of DONG Energy.
40 | THE NEW ENGL AND ENERGY L ANDSCAPE
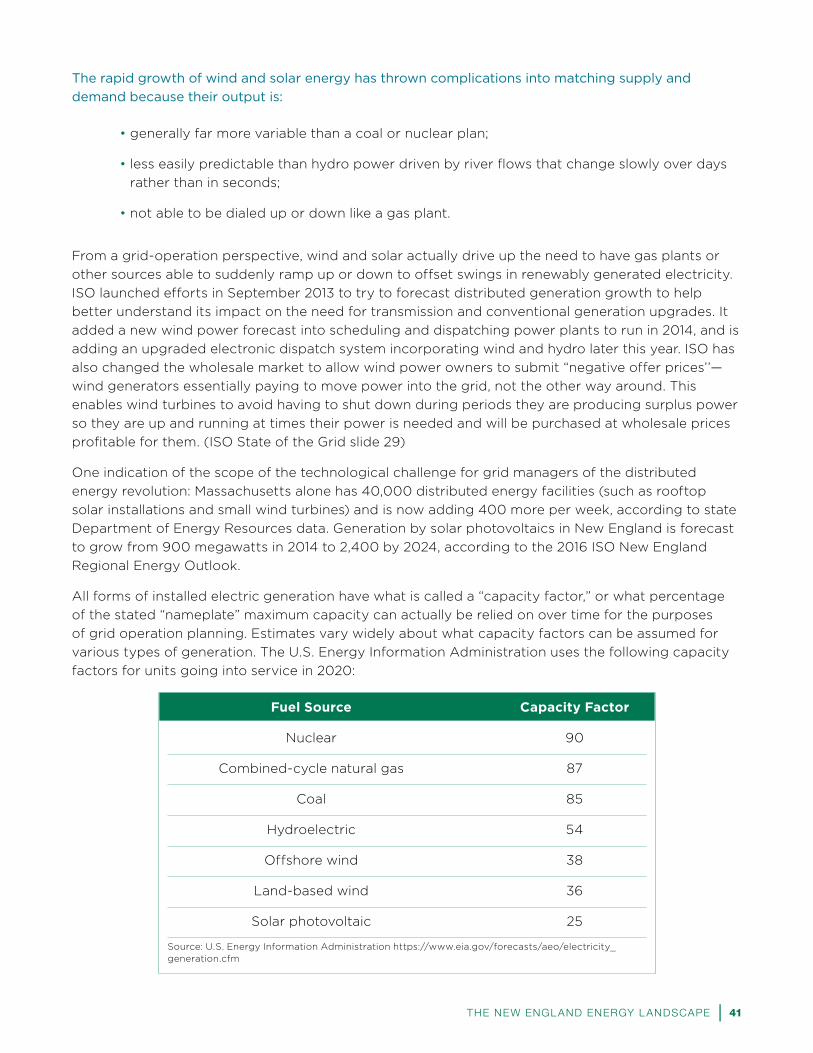
The rapid growth of wind and solar energy has thrown complications into matching supply and
demand because their output is:
• generally far more variable than a coal or nuclear plan;
• less easily predictable than hydro power driven by river flows that change slowly over days
rather than in seconds;
• not able to be dialed up or down like a gas plant.
From a grid-operation perspective, wind and solar actually drive up the need to have gas plants or
other sources able to suddenly ramp up or down to offset swings in renewably generated electricity.
ISO launched efforts in September 2013 to try to forecast distributed generation growth to help
better understand its impact on the need for transmission and conventional generation upgrades. It
added a new wind power forecast into scheduling and dispatching power plants to run in 2014, and is
adding an upgraded electronic dispatch system incorporating wind and hydro later this year. ISO has
also changed the wholesale market to allow wind power owners to submit “negative offer prices’’—
wind generators essentially paying to move power into the grid, not the other way around. This
enables wind turbines to avoid having to shut down during periods they are producing surplus power
so they are up and running at times their power is needed and will be purchased at wholesale prices
profitable for them. (ISO State of the Grid slide 29)
One indication of the scope of the technological challenge for grid managers of the distributed
energy revolution: Massachusetts alone has 40,000 distributed energy facilities (such as rooftop
solar installations and small wind turbines) and is now adding 400 more per week, according to state
Department of Energy Resources data. Generation by solar photovoltaics in New England is forecast
to grow from 900 megawatts in 2014 to 2,400 by 2024, according to the 2016 ISO New England
Regional Energy Outlook.
All forms of installed electric generation have what is called a “capacity factor,” or what percentage
of the stated “nameplate” maximum capacity can actually be relied on over time for the purposes
of grid operation planning. Estimates vary widely about what capacity factors can be assumed for
various types of generation. The U.S. Energy Information Administration uses the following capacity
factors for units going into service in 2020:
Fuel Source Capacity Factor
Nuclear 90
Combined-cycle natural gas 87
Coal 85
Hydroelectric 54
Offshore wind 38
Land-based wind 36
Solar photovoltaic 25
Source: U.S. Energy Information Administration https://www.eia.gov/forecasts/aeo/electricity_generation.cfm
40 | THE NEW ENGL AND ENERGY L ANDSCAPE THE NEW ENGL AND ENERGY L ANDSCAPE | 41
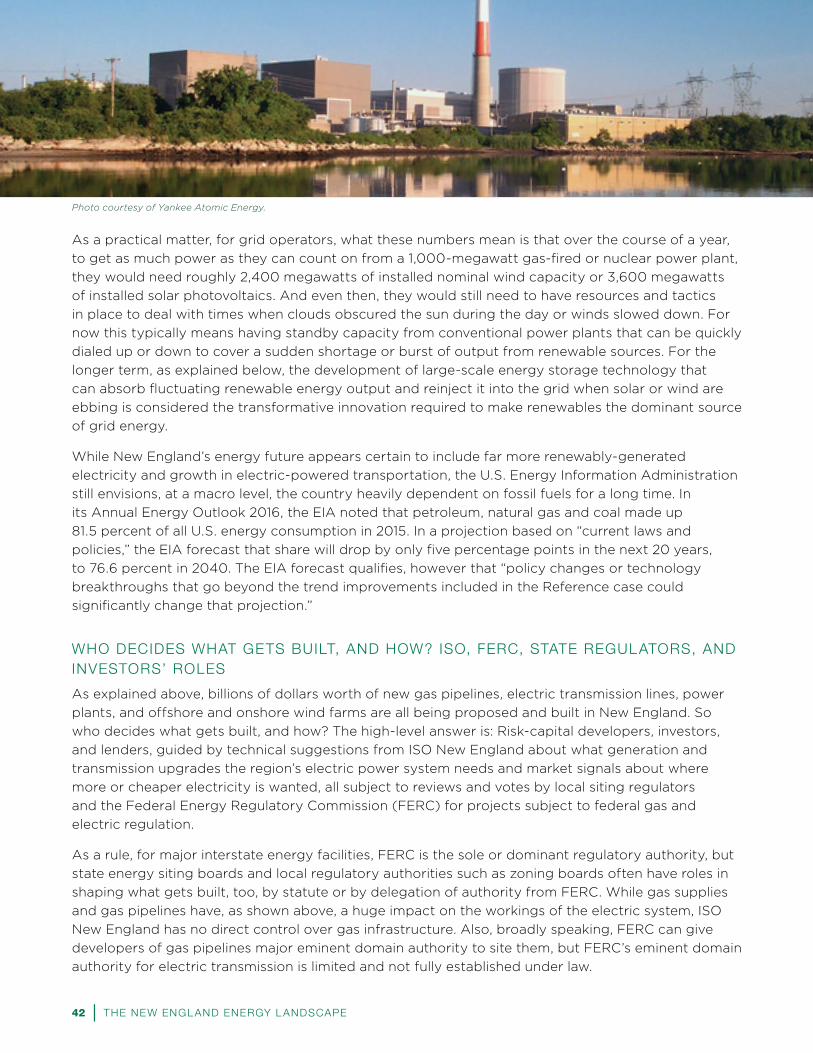
As a practical matter, for grid operators, what these numbers mean is that over the course of a year,
to get as much power as they can count on from a 1,000-megawatt gas-fired or nuclear power plant,
they would need roughly 2,400 megawatts of installed nominal wind capacity or 3,600 megawatts
of installed solar photovoltaics. And even then, they would still need to have resources and tactics
in place to deal with times when clouds obscured the sun during the day or winds slowed down. For
now this typically means having standby capacity from conventional power plants that can be quickly
dialed up or down to cover a sudden shortage or burst of output from renewable sources. For the
longer term, as explained below, the development of large-scale energy storage technology that
can absorb fluctuating renewable energy output and reinject it into the grid when solar or wind are
ebbing is considered the transformative innovation required to make renewables the dominant source
of grid energy.
While New England’s energy future appears certain to include far more renewably-generated
electricity and growth in electric-powered transportation, the U.S. Energy Information Administration
still envisions, at a macro level, the country heavily dependent on fossil fuels for a long time. In
its Annual Energy Outlook 2016, the EIA noted that petroleum, natural gas and coal made up
81.5 percent of all U.S. energy consumption in 2015. In a projection based on “current laws and
policies,” the EIA forecast that share will drop by only five percentage points in the next 20 years,
to 76.6 percent in 2040. The EIA forecast qualifies, however that “policy changes or technology
breakthroughs that go beyond the trend improvements included in the Reference case could
significantly change that projection.”
WHO DECIDES WHAT GETS BUILT, AND HOW? ISO, FERC, STATE REGUL ATORS, AND INVESTORS’ ROLES
As explained above, billions of dollars worth of new gas pipelines, electric transmission lines, power
plants, and offshore and onshore wind farms are all being proposed and built in New England. So
who decides what gets built, and how? The high-level answer is: Risk-capital developers, investors,
and lenders, guided by technical suggestions from ISO New England about what generation and
transmission upgrades the region’s electric power system needs and market signals about where
more or cheaper electricity is wanted, all subject to reviews and votes by local siting regulators
and the Federal Energy Regulatory Commission (FERC) for projects subject to federal gas and
electric regulation.
As a rule, for major interstate energy facilities, FERC is the sole or dominant regulatory authority, but
state energy siting boards and local regulatory authorities such as zoning boards often have roles in
shaping what gets built, too, by statute or by delegation of authority from FERC. While gas supplies
and gas pipelines have, as shown above, a huge impact on the workings of the electric system, ISO
New England has no direct control over gas infrastructure. Also, broadly speaking, FERC can give
developers of gas pipelines major eminent domain authority to site them, but FERC’s eminent domain
authority for electric transmission is limited and not fully established under law.
Photo courtesy of Yankee Atomic Energy.
42 | THE NEW ENGL AND ENERGY L ANDSCAPE

For ISO New England, besides its day-to-day responsibility operating the power grid and
administering wholesale markets, the third major responsibility is power-system planning. Every two
year, the ISO updates and publishes a Regional System Plan for the next 10 years. This document,
developed by ISO planning professionals working in a robust stakeholder-engagement process,
aims to forecast where electric demand is growing and identify weak links in the power grid that
need upgrading, both generation and transmission. The process takes into account an evaluation of
the likelihood of power plants shutting down in the future based on how often they are now getting
paid to operate in the competitive market. The process forecasts annual and peak New England
power demand for the next 10 years and what combination of generating capacity, transmission, and
“demand resources”—or the ability to get customers to curtail their power usage by agreed-upon
levels when the grid is facing peak demand—are needed to meet “defined system needs.” The most
recent plan, which totals 211 pages, was made public on November 5, 2015, and is available at http://
www.iso-ne.com/system-planning/system-plans-studies/rsp.
The Regional System Plan report is highly specific about where
grid managers see the need for new transmission lines or power
plants. It can serve as a road map for energy investors looking
to assess where to propose and finance new capacity. The 2015
Regional System plan, for example, projected a need for new
power generating capacity near the existing coal- and oil-fired
Brayton Point plant in Somerset, Massachusetts, that will be
shutting down on June 1, 2017, and in Tiverton and Portsmouth,
Rhode Island, and 100 megawatts of new capacity on Cape Cod,
which is likely to be met by NRG’s plans to repower the Canal
generating station in Sandwich, Massachusetts, with gas-fueled
generators. New generation in southeastern New England, the
ISO says, “would provide the greatest reliability benefit” for overall
regional needs.
Informed by the Regional System Plan, private-sector investors will
develop proposals to construct power plants in areas where they
are needed, will get “dispatched” to run enough to make them
economical, and can clear local regulatory and political approvals.
Projects also need to enter the ISO’s “interconnection queue”
and be evaluated by grid engineers to ensure that the plants can
be safely connected to the existing grid, and what kind of grid
modifications new plant owners may be required to pay for to
accommodate them.
The Regional System Plan is developed under the guidance of a Planning Advisory Committee
(PAC). “Any entity can designate a member to the PAC” by emailing the PAC secretary, the ISO
explains, and that includes not just energy-industry companies but governments, local communities,
energy customers, and regional associations such as the New England States Committee on
Electricity (NESCOE) and the New England Conference of Public Utilities Commissioners (NECPUC).
Some information reviewed in forming the Regional System Plan is “critical energy infrastructure
information” withheld from uncontrolled access because of national security and terrorism concerns.
Besides “reliability upgrades,” the ISO also allows energy companies to propose “elective transmission
upgrades”—essentially, privately owned toll roads to deliver power to a specific point on the grid from
where it is available. Under FERC Order 1000, the ISO is also developing a process for a third kind of
Photo courtesy of Eversource.
42 | THE NEW ENGL AND ENERGY L ANDSCAPE THE NEW ENGL AND ENERGY L ANDSCAPE | 43

transmission project: Projects that are designed “to meet public policy objectives” such as greater use
of renewable power, or projects to come into service beyond the 36-month timeframe of ISO’s usual
system-reliability forecasts.
A critical approval for power plants and transmission upgrades is completion of an “interconnection
study” by ISO engineers and approval of the project to enter the regional “interconnection queue.”
This is a technical analysis concluding that a power plant or transmission line can safely be attached
to the existing grid, and identifying which capacity or safety upgrades—sometimes running into
the millions of dollars—the project proponent may be required to pay for to ensure the grid would
function properly and could handle various contingencies and breakdowns once the new unit has
been added.
One of the last key steps in this process of going from proposal to approved reality is successful
participation in the ISO’s annual “Forward Capacity Auction” (FCA).This is one of the two main
wholesale markets administered by the ISO, the second being the hour-to-hour wholesale electricity
market described earlier. The Forward Capacity market was established a decade ago to establish a
value for keeping power plants available, regardless of how much power they wind up being called to
produce, so that short-term swings in the price of natural gas, oil, or coal, or other factors would not
drive permanently out of operation billions of dollars in long-term power generating capacity. (One
way to think of the energy and forward capacity markets is to think of a supermarket that makes a
certain amount of money for the volume of groceries it sells, but also can compete to get a monthly
payment just for maintaining a store, loading docks, refrigerators, freezers, and staff to be available
to sell groceries in the first place. The forward capacity market helps prevent, in this metaphor, a few
bad months of business from shutting down a supermarket forever).
Generators compete each year in a forward capacity auction that establishes a yearly price for them
to be paid, starting about 40 months from the date of the auction, for maintaining their plants as
available to be turned on to supply the grid. This price is ultimately added to the electric bills all
New England customers pay. ISO New England’s forward capacity markets also add a second kind
of incentive unique to brand-new plants to encourage construction of new generation: A voluntary
guaranteed minimum capacity price for up to seven years after a unit goes into service, providing a
guaranteed income stream to investors. (New plant builders can ask for a guaranteed price for up
to seven years but may also elect to begin competing in the annual forward capacity auction sooner
than that if they conclude they can get a better price than the seven-year guaranteed price.) The
ISO issues every January “expressions of interest” for new power generation capacity, and reviews
respondents’ submissions to evaluate how solid their plans and finances are. If they meet objective
ISO tests, the following February, 13 months later, they can compete in the forward capacity auction.
The FCA is a so-called descending-clock auction. The ISO identifies how much capacity it will need to
meet demand, plus a safety cushion, and solicits a first round of bidding per megawatt-year. This will
normally prompt bids for thousands of megawatts of capacity more than the needed level. Then the
ISO gradually lowers its offered price, inducing generators and suppliers of capacity who had been
holding out for a higher price to withdraw their offers, until finally there is a stack of bids equal to the
capacity the ISO identifies as needed. Every participant then gets paid that price, much like how in
the hourly wholesale market every active generator is paid the price offered by the last marginal unit
needed to operate to meet demand.
Energy efficiency programs and demand response can be bid into the capacity auction as if they
were power plants and get paid the same amount. In the case of demand response and efficiency,
they are helping ISO meet capacity needs by lowering demand as generators provide supply.
44 | THE NEW ENGL AND ENERGY L ANDSCAPE
Broadly speaking, most New England power plant owners now make about 30 to 40 percent of
their total revenue from capacity payments, and about 60 to 70 percent from production and sales
of electricity for the hourly wholesale market, according to the New England Power Generators
Association. The ISO also runs small, specialized auctions that pay generation units for special
characteristics like being available to maintain voltage and frequency in the grid and for “quick start”
capabilities to be fired up in 10 minutes or less in the case of a major power outage.
Once a power plant or merchant transmission line project has cleared the ISO interconnection review
and forward capacity auction and received state and local approvals, it still may not go forward if
investors believe the economics of the project have changed and it’s no longer a good investment,
or if the parent company’s balance sheet or financial condition has changed significantly since the
project was first proposed. However, there are significant financial penalties the ISO will levy on
participants in the capacity market who clear the auction but later withdraw from the market.
THE FEDERAL ENERGY REGUL ATORY COMMISSION AND STATES’ ROLES
As a rule, any big electric transmission proposal serving the interstate wholesale market or large
gas pipeline or gas facility will need to be approved by FERC. (What was originally the Federal
Power Commission created in 1920 became the FERC in 1977, with its authorities and powers most
significantly redrawn under the Energy Policy Act of 2005).
Under federal law, FERC regulates:
• the transmission and wholesale sale of electricity in interstate commerce, with power to
ensure that rates “are just, reasonable, and not unduly discriminatory or preferential.’’
• the transmission and sale of natural gas for interstate commerce and authority to set “just
and reasonable” rates.
• siting of interstate natural gas pipelines, LNG facilities, and gas storage.
• licensing and inspecting of 1,600 hydroelectric projects and all new hydro proposals.
• accounting and financial regulation for regulated energy companies.
• and ensuring the reliability of the high-voltage electric transmission system. (FERC has
authorized the North American Electric Reliability Council, known as NERC, to fulfill this
oversight responsibility and under the 2005 Energy Act in 2006 made NERC an “Electric
Reliability Organization” as mandated by the 2005 energy act, with authority to levy fines of
$1 million per violation per day on utilities and transmission companies. The Northeast Power
Coordinating Council, NPCC, is the regional affiliate of NERC through which local electric
transmission companies’ compliance with reliability standards is enforced.
FERC has wide-ranging and longstanding eminent domain authority to get natural gas pipelines
and facilities built, but only limited eminent domain rights for electric transmission. Under the 2005
Energy Act, FERC may consider and issue a permit for electric transmission projects, including the
right of eminent domain for right-of-way assembly, if a state has withheld approval for the project for
more than a year. How in practice this authority would be executed has not been established.
Frequently, deciding which facilities are subject to federal regulatory authority is complex. FERC has
a 7-part test, augmented by decades of administrative proceedings and case law, to identify what
44 | THE NEW ENGL AND ENERGY L ANDSCAPE THE NEW ENGL AND ENERGY L ANDSCAPE | 45

is a “transmission” line subject to federal regulation and what is a “distribution” line subject to state
utility commission regulation. Under the National Environmental Policy Act, FERC is also mandated
to consider “non-wire” alternatives to transmission lines such as added local generating capacity,
demand management, and energy storage technology.
On a big energy project subject to FERC regulation, FERC will typically still first look to and prefer to
have state siting boards and city and town zoning boards review and vote on issues such as the routes
of pipelines and power lines and locations of switchyards and pump stations. Project proponents can
almost always still override local opposition by going to FERC, but it adds long delays to the process,
and FERC will typically direct proponents to make or have attempted to make a good-faith effort to
win local approval before turning to federal preemption. FERC will also have the U.S. Army Corps of
Engineers review and rule on wetlands issues raised by electric and gas proposals, and the U.S. Fish and
Wildlife Service on whether proposals would illegally jeopardize habitat for endangered species. FERC
gets funding for its operating budget from assessments on the companies it regulates, not Congress.
The venue for appealing FERC’s decisions is filing suit in federal court.
FERC is the chief regulator of natural gas pipelines and associated
equipment, as well as LNG terminals, under the Natural Gas Act
of 1938. FERC’s standard for approving a gas line or facility is that
the applicant is “able and willing properly” to build and operate
the project and “construction...is or will be required by the present
or future public convenience and necessity.” Part of establishing
to FERC the necessity for the project is having signed contracts
from subscribers for the gas, either gas utilities or power plants or
industrial customers.
In its approval, FERC may attach “such reasonable terms and
conditions as the public convenience and necessity may require.”
The Natural Gas Act has been interpreted as conferring access
to rights of way by eminent domain for holders of certificates
of public necessity, through claims made through state and
federal court. For example, in the spring of 2016, a Berkshire
Superior Court judge in Massachusetts ruled that under the
Federal Gas Act, Kinder Morgan’s Tennessee Gas did not need the
Massachusetts Legislature to approve its gaining access to a state
forest to build part of its Connecticut Expansion 13.5-mile gas loop.
AccessNortheastEnergy.com describes the pipeline approval process as typically involving:
1. A pre-filing notification with FERC that an energy company or developer wants to propose a
new facility.
2. “Scoping” by the FERC to identify environmental and logistical issues and stakeholders to
reach out to.
3. A formal application to the FERC for a certificate.
4. FERC publishes a notice of the application.
5. Additional stakeholder engagement and discussion.
Photo courtesy of Eversource.
46 | THE NEW ENGL AND ENERGY L ANDSCAPE
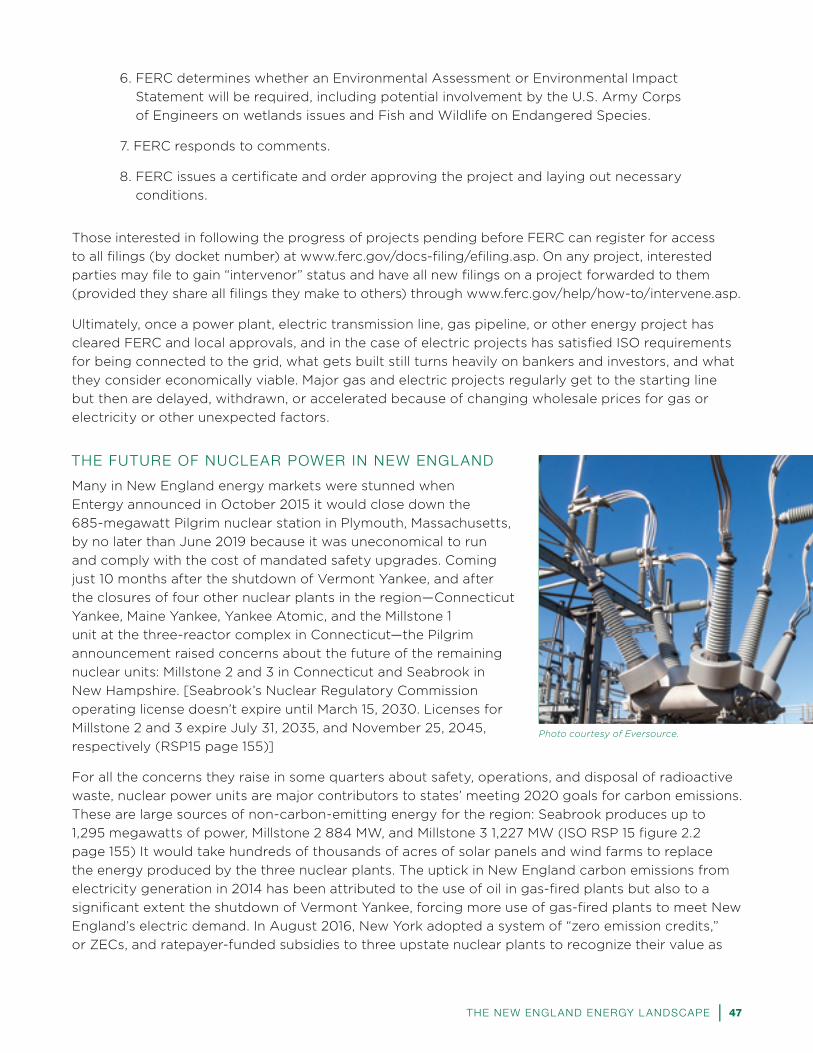
6. FERC determines whether an Environmental Assessment or Environmental Impact
Statement will be required, including potential involvement by the U.S. Army Corps
of Engineers on wetlands issues and Fish and Wildlife on Endangered Species.
7. FERC responds to comments.
8. FERC issues a certificate and order approving the project and laying out necessary
conditions.
Those interested in following the progress of projects pending before FERC can register for access
to all filings (by docket number) at www.ferc.gov/docs-filing/efiling.asp. On any project, interested
parties may file to gain “intervenor” status and have all new filings on a project forwarded to them
(provided they share all filings they make to others) through www.ferc.gov/help/how-to/intervene.asp.
Ultimately, once a power plant, electric transmission line, gas pipeline, or other energy project has
cleared FERC and local approvals, and in the case of electric projects has satisfied ISO requirements
for being connected to the grid, what gets built still turns heavily on bankers and investors, and what
they consider economically viable. Major gas and electric projects regularly get to the starting line
but then are delayed, withdrawn, or accelerated because of changing wholesale prices for gas or
electricity or other unexpected factors.
THE FUTURE OF NUCLEAR POWER IN NEW ENGL AND
Many in New England energy markets were stunned when
Entergy announced in October 2015 it would close down the
685-megawatt Pilgrim nuclear station in Plymouth, Massachusetts,
by no later than June 2019 because it was uneconomical to run
and comply with the cost of mandated safety upgrades. Coming
just 10 months after the shutdown of Vermont Yankee, and after
the closures of four other nuclear plants in the region—Connecticut
Yankee, Maine Yankee, Yankee Atomic, and the Millstone 1
unit at the three-reactor complex in Connecticut—the Pilgrim
announcement raised concerns about the future of the remaining
nuclear units: Millstone 2 and 3 in Connecticut and Seabrook in
New Hampshire. [Seabrook’s Nuclear Regulatory Commission
operating license doesn’t expire until March 15, 2030. Licenses for
Millstone 2 and 3 expire July 31, 2035, and November 25, 2045,
respectively (RSP15 page 155)]
For all the concerns they raise in some quarters about safety, operations, and disposal of radioactive
waste, nuclear power units are major contributors to states’ meeting 2020 goals for carbon emissions.
These are large sources of non-carbon-emitting energy for the region: Seabrook produces up to
1,295 megawatts of power, Millstone 2 884 MW, and Millstone 3 1,227 MW (ISO RSP 15 figure 2.2
page 155) It would take hundreds of thousands of acres of solar panels and wind farms to replace
the energy produced by the three nuclear plants. The uptick in New England carbon emissions from
electricity generation in 2014 has been attributed to the use of oil in gas-fired plants but also to a
significant extent the shutdown of Vermont Yankee, forcing more use of gas-fired plants to meet New
England’s electric demand. In August 2016, New York adopted a system of “zero emission credits,”
or ZECs, and ratepayer-funded subsidies to three upstate nuclear plants to recognize their value as
Photo courtesy of Eversource.
46 | THE NEW ENGL AND ENERGY L ANDSCAPE THE NEW ENGL AND ENERGY L ANDSCAPE | 47

producers of non-fossil-fuel electricity as the state pursues 40 percent reductions in emissions by
2030. Some participants in New England energy markets are advocating for consideration of ZECs or
other financial supports for nuclear power in this region.
Beyond issues of nuclear’s future in New England, the nuclear industry also continues to express
frustration with the lack of a long-promised national solution to the issue of radioactive waste.
Under the Nuclear Waste Policy Act, ratepayers paid tens of billions of dollars into a federal nuclear
waste fund but officials have blocked permanent nuclear waste facilities since the 1990s, including a
planned facility at Yucca Mountain in Nevada.
As a result, radioactive waste is stored locally at “independent spent fuel storage installations,’’
including at the region’s decommissioned reactor sites with 43 dry storage casks at Connecticut
Yankee in Haddam Neck; 64 casks at Maine Yankee in Wiscasset; and 16 casks at Yankee Atomic
in Rowe, Massachusetts. The single-asset utility companies that own these facilities have sued the
federal government for failing to remove the spent nuclear fuel and “Greater Than Class C” waste to
the promised permanent disposal site. These lawsuits have thus far yielded over $470 million in three
rounds of damages to offset the cost of continued waste storage at these sites (see www.3yankees.
com). It’s unclear whether Congress and the White House will agree on the permanent national
nuclear waste storage site called for by the 1982 Nuclear Waste Policy Act. Proposals are moving
forward for consolidated interim storage facilities in western Texas and New Mexico that could
become homes, perhaps by 2021, to waste now stored at the permanently shut-down plant sites
in New England. While the ongoing lawsuits against the federal government have recovered most,
but not all, of the costs to ratepayers for safely storing and monitoring dozens of concrete casks
with radioactive waste at the sites, electric customers are paying millions for delays and the cost of
litigation. It also amounts to taxpayers paying for a kind of safe long-term storage that is far more
expensive than larger-scale centralized storage on a national scale would be.
WHAT ARE “SOL AR NET METERING CAPS” AND WHY ARE THEY SUCH A HOT ISSUE IN SO MANY NEW ENGL AND STATES?
For all the environmental benefits, job creation, and consumer appeal of solar energy, solar also creates
operational and financial complexity for utilities. Sudden changes in cloud cover may lead to a burst of
surplus electricity suddenly pouring from a home back into the neighborhood power grid—or a sudden
burst in demand for power from the grid when the sun goes behind a thick cloud. Likewise, because
almost all utilities charge consumers for power delivery strictly according to how much they consume—
not a fixed monthly fee to be hooked up to the grid plus a variable fee for power used—people and
businesses whose solar installations produce more power than they use over the course of a year will
see their cost of being connected to the grid go to $0, or even make a net profit from the solar power
their panels generate, even though they continue to get power from the grid at night and on dark days
and enjoy the benefits of a backup grid connection in case of solar panel malfunctions.
For these reasons, electric regulators have approved what are called “net metering caps” to control
the number of solar installations, for the sake of limiting variable solar flows that complicate grid
operations and to maintain a base of non-solar-deploying ratepayers to equitably share the cost of
maintaining the electric grid and distribution lines.
“Net metering” is a technical term that effectively means: Feeding or selling electricity your solar
panels generated that you did not consume back into the power grid. One of the more controversial
issues with net metering has been where to set the financial credit that solar panel owners get for
the electricity they sell back to the grid. Should it be valued at the retail price for electricity, so that
48 | THE NEW ENGL AND ENERGY L ANDSCAPE

panel owners get a $1-for-$1 bill offset for the kilowatt hours they feed back into the grid? Or should
a discount be applied to the credit that panel owners get so those with big enough, properly situated
homes where solar arrays can work don’t get an unfair subsidy from the rest of the utility’s non-
solar consumers? How much should solar panel owners’ reimbursement for generated power be
discounted to account for the value of the grid service and backup connection they continue to have?
In recent years, every New England state has grappled with where to set a net-metering cap and
what to include under it. Massachusetts legislators have also exempted all residential-scale solar
installations from restrictions under net metering. Maine Governor Paul LePage vetoed a net metering
bill in late April 2016, saying it was an unfair subsidy by all ratepayers to affluent owners of large
homes who could afford to buy solar panels. Vermont in 2013 set a cap of 15 percent of peak electric
demand for solar net metering and has hit it. The Public Service Board is working on revising net
metering rules by January 2017. New Hampshire is well under its current statewide net metering cap,
but legislation has already been enacted this spring to increase it by 50 percent.
New England states had the following amounts of solar photovoltaic generating capacity installed as of
December 2015, according to the ISO New England Distributed Generation Forecast Working Group:
State “Nameplate” Solar PV Installed in MW
CT 158.73
ME 12.43
MA 855.30
NH 18.53
RI 21.51
VT 108.27
Under the Massachusetts Green Communities Act, Bay State utilities were given an exemption from
the 1997 restructuring law when it came to solar power generation. The state’s biggest utility, National
Grid, was authorized to own up to 35 megawatts of solar electric generation capacity—about 20
megawatts has been installed so far—in hopes of providing a subsidy to the development of the
market and because utilities would know the most feasible locations for incorporating potentially
highly variable solar-generated electricity into their distribution networks.
DEMAND RESPONSE/ENERGY EFFICIENCY
As explained above, because of the economics of electricity in periods of peak demand when grid
operators have to pay whatever providers are bidding in order to prevent rolling blackouts, about
1 percent of all hours in the year drive 8 percent of New England’s total electric costs, and the 10
percent of top-cost hours in the year account for fully 40 percent of the regional electric bill.
“Demand response” is a system for sharply lowering overall annual electric costs by giving financial
incentives to DR participants to consume less power in key designated hours. Currently, New England
is well ahead of the rest of the country in having the tools and agreements in place to use demand
48 | THE NEW ENGL AND ENERGY L ANDSCAPE THE NEW ENGL AND ENERGY L ANDSCAPE | 49

response to shave peak demand, which in turn can have big impacts on the overall annual cost of
electricity. During a summer heatwave when demand is spiking, ISO-New England can activate
measures to reduce more than 10 percent of peak-period demand, such as customers agreeing to
shut down industrial facilities and lighting and to raise temperatures inside refrigerators and set-
points for air conditioning. Demand response efforts are often implemented through companies like
EnerNOC of Boston that line up subscribers and manage the actual reduction of power usage at their
facilities. Implementation of demand response has also become very geographically targeted. ISO
New England now uses 19 “dispatch zones” within which it can order up DR measures. A January 25,
2016, ruling by the U.S. Supreme Court affirmed the Federal Energy Regulatory Commission’s power
to set payments to providers of demand response for the value of averted demand for electricity.
FERC is working towards a June 1, 2018, target date for updating protocols for implementing demand
response in wholesale energy markets.
Energy efficiency can also be bid into the ISO’s annual capacity auction and paid for as a form
of negative generation, relative to an historic baseload. Currently, the ISO system pays for 1,500
megawatts worth of energy efficiency that lowers the need for generation, and that number is
forecast to jump to 3,600 megawatts by 2024, according to the ISO’s 2016 Regional Energy Outlook.
Thanks in significant measure to RGGI proceeds paying for efficiency measures and measures by the
ISO to pay efficiency programs to save energy just as power plants are paid to make it, New England
states all ranked high in the American Council for an Energy Efficient Economy’s 2014 scorecard
ranking states on their energy efficiency efforts: Massachusetts 1, Vermont and Rhode Island tied for
3, Connecticut 6, Maine 16, and New Hampshire 22. New England states collectively spent $2.3 billion
on energy efficiency in 2009-12, according to ISO New England, and the ISO estimates they will
spend another $6.3 billion from 2017 to 2023.
Overall, while the ISO predicts demand for electricity will grow about 1 percent a year across the region
over the next decade, its forecast for energy efficiency and demand response growth is much faster:
Compound annual growth rate of energy efficiency and demand response to reduce peak summer
electric demand, 2015-24:
GROWTH OF ENERGY EFFICIENCY/DR
State Compound Annual Growth Rate
New England 8.7%
CT 6.4%
ME 5.9%
MA 10.7%
NH 7.0%
RI 9.5%
VT 6.0%
Source: ISO New England, 2015 Regional System Plan, page 36
50 | THE NEW ENGL AND ENERGY L ANDSCAPE

ENERGY STORAGE AND RENEWABLE ENERGY GROW TH
One key way to make highly variable wind and solar energy more
reliable and effective as a source of electricity will be through more
widespread use of “energy storage” devices that capture surplus
renewables when they are abundant to release electricity at night
or when the wind stops blowing.
On May 4, 2016, Green Mountain Power, which serves 265,000
customers in Vermont, announced it had become the first U.S.
utility to perform customer installations of Tesla Powerwall home
battery systems. The devices allow people who own solar panels
or wind turbines to use them to charge up the Powerwalls, then
draw power from the units for up to 4 to 6 hours to run their
homes or businesses when they have insufficient or no power from
their solar or wind units. The Powerwall also becomes a way to
keep lights and appliances on during power outages, or to lower
costs at peak summer demand hours by switching customers
from grid power to Powerwall power. Green Mountain offers plans
under which customers can lease the units for about $37.50 a
month with no up-front cost; buy them outright for $6,501; and as
a third option, buy them for $6,501 and get a monthly bill credit
of $31.76 if they are willing to let GMP use some of the power in
the device to feed other customers on the grid. (http://products.
greenmountainpower.com/product/tesla-powerwall/)
In Massachusetts, the Department of Energy Resources is completing a $10 million study of “energy
storage” technologies to reduce the cost of electricity at periods of peak demand. The department
has consulted with more than 300 technology companies, utilities, and other organizations. Some
of the technologies being evaluated in this study include: Pumped hydro, compressed air, energy
flywheel, batteries, molten salt, batteries, chilled water, ice, thermochemical, SMES superconductors,
and fuel cells. GTM research indicates that from 2016 to 2020, U.S. energy storage will grow by 500
percent to 1,662 megawatts of capacity. Why energy storage could have such a huge impact on the
grid goes back to the numbers that just 1 percent of all hours of electric consumption in New England
account for 8 percent of the region’s total cost of electricity, and the top 10 percent of demand hours
(typically summer hot spells, winter afternoons, or periods when grid managers are coping with a
supply failure) account for 40 percent of electric spending. The Massachusetts DOER study is drilling
down to look at 1,497 specific locations throughout the state’s power grid to determine where would
be the most advantageous and cost-effective places to add energy storage. (Source: Judith Judson
presentation to Restructuring Roundtable, May 18, 2016 in Boston)
Massachusetts’ August 2016 energy law also directs the Department of Energy Resources to
determine by the end of 2016 “whether to set appropriate targets for electric companies to procure
viable and cost-effective energy storage systems to be achieved by Jan. 1, 2020.” The department
would be required to set plans for Eversource, National Grid, and Unitil to buy and deploy energy
storage systems by July 2017.
Photo courtesy of Eversource.
50 | THE NEW ENGL AND ENERGY L ANDSCAPE THE NEW ENGL AND ENERGY L ANDSCAPE | 51

CONCLUSION
New England comprises six states with six energy policies, generally similar although not completely
aligned. But New England gets its electricity from one single electric grid and its gas from a highly
interconnected gas network. The natural gas network and market has become, in turn, deeply
interconnected to the electric grid operationally and to the wholesale electric market as well.
What New England voters and policymakers have made clear is that we want reliable, affordable, and
environmentally friendly energy supplies and networks for transmitting energy. The challenge is that in
the near term, it’s unlikely to impossible that New England will get all three. Trade-offs will have to be
made, and policymakers will have to understand what those trade-offs entail and the costs involved, in
dollars, in environmental impacts, and in our expectations of the reliability of our power supplies.
Until and unless utility-scale devices and systems for storing energy are widely affordable and
reliable, renewable sources like on- and off-shore wind and solar will need backup from gas-fired
power plants, nuclear power, and perhaps hydroelectric power. Because of the long distances
between where most New Englanders live, work, and use power and where wind and hydro power
are most abundant in the region and neighboring Canada, using more “green” power will require
expensive transmission lines most New Englanders have made clear they don’t want to see on their
landscapes—or underground and undersea transmission lines that are far more costly and challenging
to maintain than above-ground lines. Because of the combination of environmental and economic
forces that have left natural gas the default primary source of new power generation since the 1990s,
policymakers will have to evaluate conflicting forecasts to determine what level of additional gas
supply infrastructure is needed, and how much the risk can be eliminated that New England ever runs
short of gas for heat and power—at what price and at what cost-benefit ratio.
Additionally, as shown in the diagram on the right, every policy-driven decision to add some new
source of energy outside the workings of a purely free market will create winners, losers, savings,
and costs. Adding more large-scale hydro or wind will affect the economics of gas-fired generation
and nuclear power. Incentives for more energy conservation and demand response will change the
need for power, how it is generated, and how much it costs in the 10 percent of hours of the year that
account for 40 percent of all regional spending on electricity. The overall mix of gas, nuclear, wind,
and hydro used to meet New England’s power needs will affect how well the six states do meeting
their 2020, 2035, and 2050 emissions mandates.
New England has a much more complicated challenge in resolving its environmental and energy
issues than economic competitor areas such as California, New York and Texas, which are all single
states with single state power grid operators. Impacts in one part of those states may be more easily
sold, politically, as benefiting all residents of that same state with lower costs and more reliable, more
“green” power. But New England faces the challenge that the most affordable systems for delivering
more green power to the more urbanized states of Connecticut, Massachusetts, and Rhode Island
could most likely require more overhead lines that would be considered blight on the landscape in
Maine, New Hampshire, and Vermont. Burying transmission lines underground or offshore may be
politically expedient or necessary in northern New England, but that adds huge expense to electric
bills for all New Englanders. Another manifestation of the intra-regional challenge of locating desired
energy facilities and supplies came this spring when a gas pipeline that would have significantly
increased supplies to New Hampshire and Maine and reduce huge economic pressures on industrial
and manufacturing companies, Kinder Morgan’s Northeast Direct, got withdrawn in the face of
intense opposition in Massachusetts. At the same time, the Massachusetts Supreme Judicial Court’s
rejection of an electric-utility funding tariff for gas capacity expansion has thrown into question the
52 | THE NEW ENGL AND ENERGY L ANDSCAPE

Affordable Reliable
Green
12 3
This is the Energy Future We Want
Energy that is affordable
and reliable: gas, oil, coal,
nuclear. To make it “green”
as well would require billions
for carbon capture and
pollution reduction and
many environmentalists will
always oppose fossil fuels
and nuclear.
1To be reliable wind and solar
need billions for transmission
from where the resources
are to where demand is in
New England, smart grid
backup, standby gas and
nuclear capacity to offset
sudden drops in renewable
output, and utility-scale
storage.
2To be affordable we need
the cost of generation to
plunge further to offset the
transmission and reliability
premium and/or for the cost
of energy storage to follow
a Moore’s Law curve of
rapidly declining costs.
3
52 | THE NEW ENGL AND ENERGY L ANDSCAPE

economics of a pipeline upgrade Connecticut, Maine, New
Hampshire, and Rhode Island have all been counting on
and pursuing.
The New England Council believes it is important and
valuable for legislators and policymakers to seek a
holistic understanding of how each decision about our
energy future can affect all the others. Expanding a gas
pipeline or a hydroelectric transmission line will affect the
economics of nuclear power and offshore wind. What mix
of energy is economical to produce will, in turn, affect
whether states reach their greenhouse gas mandates and
environmental goals. Increasing use of local renewables
may reduce energy costs, emissions, and the need for gas
in the long term but add significant costs and complexity
to grid operations in the near term.
At hundreds of meetings every year involving thousands
of stakeholders, ISO-New England works to achieve
a regional power grid that is reliable, affordable, and
responsive to the environmental and energy policy goals
adopted by the six New England states. Policymakers
around New England would do well to keep asking
how the operations and governance of the ISO can continue to be perfected to meet the reliable-
affordable-green triple mandate for electricity, and how much states may have to agree on and
pursue ad-hoc initiatives such as the Connecticut-Massachusetts-Rhode Island joint RFP process for
new clean energy supply. Federal legislation may well prove needed—and meriting New Englanders’
support—to clarify and expand the role of the ISO as a “regional transmission organization” that can
also deliver on the region’s desired environmental and policy outcomes for energy.
We would also encourage leaders and policymakers in all six states to consider questions such as:
• How much could New England benefit from harmonizing renewable portfolio standards and
2050 greenhouse gas emissions laws while respecting local values and policy preferences?
• What would be the advantages to and challenges of expanding the existing Regional
Greenhouse Gas Initiative—further lowering allowable carbon emissions to attach a higher
value to reducing them—as a major or even primary strategy to help all six states meet their
2020 and 2050 carbon and climate goals?
• Should New England consider some form of non-carbon-emitting energy credits, as New
York and other jurisdictions are considering, or other measures to protect the ongoing
operation of the Seabrook and Millstone nuclear units to keep the region on track to meeting
its carbon-emission mandates and to maintain diversity and resiliency in our fuel supply?
• How can better interstate cooperation and incentives help ensure transmission projects
needed in some states to meet the green-energy needs of other states are acceptable and
approvable locally?
• How can the six New England states and energy stakeholders support and accelerate
Photo courtesy of Eversource.
54 | THE NEW ENGL AND ENERGY L ANDSCAPE

modernizing power grid technology and procedures to accommodate the rapid and desired
expansion of variable renewable energy sources?
• Amid all the conflicting reports, and the negative court ruling in Massachusetts, how much
more natural gas delivery infrastructure does New England need? How should it be paid for?
What changes in law or regulation could create stronger incentives for gas-fired power plant
owners to line up firm supplies in winter months? Will the current policy of paying plants to
store and burn oil as a backup fuel remain environmentally and economically acceptable?
• Recognizing that there may be no limit on how much we would have to pay to have a perfect
power system that never failed: How do we decide what is enough but not too much winter
energy reliability, at what acceptable price in cost and emissions impact, to ensure we keep
the lights on and heat flowing in the most dire cold snap? How much more could be done for
winter “demand response” to avoid a looming crisis, comparable to what’s been done to allow
New England to shave its summer peak electric demand by up to 10 percent if needed?
Back in 2001, The New England Council commissioned a study on energy issues by Polestar
Communications & Strategic Analysis. It included a key observation that is as true in 2016 as it was 15
years ago: “A more coordinated and integrated regional public policy voice on energy, environmental,
and economic policy is critical if the region is to maintain and enhance its competitive position.’’
New England is an excellent place to live, learn, and do business. We are also at the end of the
conventional energy pipeline, and so we pay much higher costs for electricity and natural gas than
the rest of the country. That cost premium has huge implications for jobs, growth, and our ongoing
economic competitiveness nationally and globally. New England also has enormous renewable
energy potential, including offshore wind, and a long history of policy and technology innovations
to meet big challenges like the one we now face of forging a regional energy supply that is reliable,
more affordable, and works to meet all six states’ climate objectives and mandates.
The New England Council looks forward to continuing to be an advocate for reliable, affordable, and
environmentally sound energy for our region. The council also remains strongly committed to serving
as a leader, convener, and supporter of the intra-regional discussions and negotiations—and the
national legislation and policies—that get to the best energy future possible for all New Englanders.
54 | THE NEW ENGL AND ENERGY L ANDSCAPE THE NEW ENGL AND ENERGY L ANDSCAPE | 55

UPCOMING DATES
2017
January Vermont adopts new solar net-metering cap
June 1 1,535 megawatt Brayton Point coal and oil/gas units to shut down
June 30 692-megawatt Footprint Power Salem Harbor (MA) generator scheduled to go in-service
September 30 New Hampshire Site Evaluation Committee deadline for ruling on Northern Pass electric transmission project
November Targeted in-service date for Spectra Algonquin Intermediate Market (AIM) gas pipeline expansion
2018
April FERC deadline for relicensing Connecticut River hydroelectric units
April-June 400-megawatt Medway (MA) peaker goes into service
June 1 Current planned date for FERC to complete integration of “demand response” initiatives into wholesale electric markets as a result of January 25, 2016, Supreme Court ruling
June 1 In-service date for Bridgeport Harbor 6 in Connecticut, 475 megawatts...90 MW Wallingford 6/7 in Connecticut
December 1 In-service date for 785 MW Towantic gas power plant in Connecticut
4Q “Initial in-service” target date for Spectra Access Northeast Energy pipeline upgrade as per SpectraEnergy.com
2019
May 31 685 MW Pilgrim nuclear power plant in Plymouth, Massachusetts, to cease operation
Mid-year Expected new gas units online in Sandwich MA, Burrillville RI, Bridgeport CT
June 1 Shiller 4/6 coal-fired power plant (NH), 97 megawatts total, projected to close
June 1 West Medway 1 and 3 (MA) oil units. 111 megawatts total, to close
2020
November 14 189 MW South Meadow (CT) power plant to close
2021
June 1 West Medway 2 (MA) 53-megawatt oil unit closes
Dates came from ISO New England and Massachusetts Attorney General reports.
56 | THE NEW ENGL AND ENERGY L ANDSCAPE56 | THE NEW ENGL AND ENERGY L ANDSCAPE

ACKNOWLEDGMENTS
In addition to the documents and websites quoted in this report, The New England Council would like
to thank representatives of the following organizations for making time for interviews and comments:
Anbaric Power
BAE Systems
Brightfields Development
Bowditch & Dewey
Coalition of Northeastern Governors
DONG Energy
Engie
Eversource
Freedom Energy Logistics
General Electric
Hydro Quebec
JFS Energy Advisors
Kinder Morgan
Liberty Utilities
Macfarlane Energy
MetroHartford Alliance
National Grid
New England Fuel Institute
New England Power Generators Association
NixonPeabody
Northeast Gas Association
Offshore Wind Massachusetts
Polar Beverages
PretiFlaherty
Prospect Hill Strategies
Providence Chamber of Commerce
Repsol
Spectra Energy
Sprague Energy
Velcro
VoxGlobal
WilmerHale
The Yankee Companies
To maintain its independence and impartiality as the regional wholesale electric market administrator,
ISO New England did not comment for this report, but its extensive www.iso-ne.com website, and in
particular its 2015 Regional System Plan and 2016 Regional Energy Outlook, were invaluable resources.
ABOUT THE AUTHOR
This report was researched and written on behalf of The New England Council by Peter J. Howe,
Senior Advisor at Denterlein Worldwide and former business reporter at The Boston Globe and
New England Cable News.
56 | THE NEW ENGL AND ENERGY L ANDSCAPE THE NEW ENGL AND ENERGY L ANDSCAPE | 57 56 | THE NEW ENGL AND ENERGY L ANDSCAPE

E-MAIL: [email protected] • WEB: www.newenglandcouncil.com
N E W E N G L A N D C O U N C I L O F F I C E S
WASHINGTON
331 Constitution Ave., NE
Washington, DC 20002
Phone: 202.547.0048
Fax: 202.547.9149
BOSTON
98 North Washington St., Suite 201
Boston, MA 02114
PHONE: 617.723.4009
FAX: 617.723.3943