Washington State Rail Plan Integrated Freight and Passenger Rail Plan 2013-2030
2016 Texas Rail Plan Update Appendix
May 2016


1-1
1.1 Introduction
This document was developed by the Texas Department of Transportation (TxDOT) to update
the 2010 State Rail Plan. This Plan is intended to express the state’s vision for rail and
identify opportunities for future improvement. The Plan was developed in conjunction with
the Texas Freight Mobility Plan (TFMP) and the Texas Transportation Plan (TTP) 2040.
The rail network in Texas is a critical component of a thriving economy, safely connecting
industries, ports, and people without congesting highways. This chapter outlines the
statewide planning context and describes how public-private collaboration can benefit the
predominantly private rail network. In addition, the chapter describes how rail supports
established goals and objectives for a multimodal transportation system. The chapter
summarizes recent achievements and future plans for the rail system.
1.2 Texas’ Goals for its Multimodal Transportation System
Texas’ vision and goals for its multimodal transportation system are outlined in a number of
recently published documents which are updated periodically. The plans and strategies
outlined in this Rail Plan expand upon the objectives included in documents such as the
Texas Freight Mobility Plan and TTP 2040.
1.2.1 Texas Transportation Plan 2040
The Texas Transportation Plan (TTP) 2040 was adopted by the Texas Transportation
Commission on February 26, 2015 to serve as TxDOT’s long-range, performance-based
transportation plan. The TTP addresses the statewide planning requirements under the
current federal surface transportation act – Moving Ahead for Progress in the 21st Century
(MAP-21), and Title 43, Texas Administrative Code, Chapter 16. The TTP outlines TxDOT’s
objectives to maintain a safe transportation system, address congestion, connect Texas
communities, and become a best-in-class state agency.
Texas’ adopted transportation goals and objectives are:
Safety:
Reduce fatalities and serious injuries
Improve safety of at-grade rail crossings
Eliminate conflicts between modes wherever possible
Increase bicycle and pedestrian safety through education, the design and construction
of new facilities, and improvements to existing facilities
Educate the public on the dangers of high-risk driving behaviors
Coordinate with enforcement to improve driver compliance with laws

1-2
Improve incident response times
Asset Management:
Maintain and preserve multimodal assets using cost-beneficial treatments
Achieve state of good repair for pavement assets, keeping pavements smooth and
pothole free
Achieve state of good repair for transit assets such that they are comfortable and
reliable
Identify and mitigate risks associated with asset failure
Identify existing and new funding sources and innovative financing techniques for all
modes of transportation
Build upon and regularly update the asset inventories for all transportation modes
Mobility and Reliability:
Reduce congestion and improve system efficiency and performance
Plan, design, and construct strategic capacity projects
Implement alternative strategies that reduce peak demand
Improve operations within existing right-of-way
Increase travel options and accessibility for all, especially elderly, disabled, and
disadvantaged populations
Increase freight and passenger travel time reliability
Increase the capacity and efficiency of the transportation system across travel modes
Multimodal Connectivity:
Provide transportation choices and improve system connectivity for all passenger and
freight modes
Provide and improve access to jobs, transportation choices, and services for all Texans
Provide safe and convenient travel choices for all Texans with a focus on the complete
trip
Support the efficient and coordinated movement of goods and services between freight
modes to facilitate statewide, national, and global commerce
Support multimodal and intermodal planning, project development, and investments
Improve connectivity between urban, suburban, and rural areas and between travel
modes

1-3
Stewardship:
Manage resources responsibly and be accountable and transparent in decision making
Identify sustainable funding sources and leverage resources wisely to maximize the
value of investments and minimize negative impacts
Develop and implement a project development process that recognizes quality-of-life
concerns for all system users and future generations of Texans
Link transportation planning with land use
Reduce project delivery delays
Coordinate project planning and delivery with all planning partners and stakeholders
Minimize impacts to natural, cultural, and historic resources and promote sustainability
in project design and delivery
Customer Service:
Understand and incorporate customer desires in decision processes and be open and
forthright in all agency communications
Collect and integrate feedback using innovative engagement techniques and technology
Promote and enable public participation in project planning and development
Improve accessibility of information through innovative, understandable, and relatable
communication techniques
Educate the public and stakeholders on transportation costs, funding availability, and
investment tradeoffs
Sustainable Funding:
Identify and sustain funding sources for all modes
Identify and document costs to meet the state’s future transportation needs
Consider all funding sources to fill the needs-to-revenues gap
Educate the public and stakeholders on the costs associated with constructing and
preserving the system
Evaluate the feasibility of innovative financing solutions
Improve predictive capabilities for revenue forecasting and long-term needs
assessments
Using the above goals and objectives as a guide, Texas has further identified key freight
transportation needs and issues, including rail, in its 2015 Texas Freight Mobility Plan.

1-4
1.2.2 Texas Freight Mobility Plan
Texas’ freight mobility goals, and their associated objectives related to rail, include:
Safety – Improve multimodal transportation safety:
Increase the resiliency and security of the state’s freight transportation system.
Asset Management – Maintain and preserve infrastructure using cost-beneficial treatment:
Achieve and maintain a state repair for all freight transportation modes
Utilize technology to provide for the resiliency and security of the state’s freight
transportation system.
Mobility and Reliability – Reduce congestion and improve system efficiency and
performance:
Utilize the most cost-effective methods to improve system capacity (including
technology and operations).
Partner with federal and Mexican officials to resolve border crossing challenges.
Multimodal Connectivity – Provide transportation choices and improve system connectivity
for all freight modes:
Increase Texas supply chain efficiencies by improving connectivity between modes.
Improve first/last mile connectivity between freight modes and major generators and
gateways.
Improve connectivity between rural and urban freight centers.
Improve highway and rail connectivity to major freight gateways and generators through
increased capacity improvements or additional rail connections.
Improve connectivity to Texas-Mexico border crossings through increased modal
options.
Stewardship – Manage resources responsibly and be accountable in decision-making:
Lead efforts to foster greater coordination among agencies responsible for freight
system investment.
Reduce project delivery delays.
Coordinate project planning and delivery with all planning partners and stakeholders.
Reduce adverse environmental and community impacts of the freight transportation
system.

1-5
Customer Service – Understand and incorporate citizen desires in decision-making
processes and be open and forthright in all agency communications:
Implement a performance-based prioritization process for freight system investments.
Develop and sustain partnerships with private-sector industries, communities, agencies
and other transportation stakeholders.
Increase freight expertise in TxDOT districts, across departments and among elected
officials.
Enhance workforce recruitment and retention in the transportation and logistics
industry.
Sustainable Funding – Identify and sustain funding sources for all modes. Identify and
sustain funding sources for all modes:
Identify potential public and private revenue sources to fund priority freight projects.
Identify and document the needed transportation investment costs to meet the state’s
future freight transportation needs.
Educate the public and stakeholders on the costs associated with constructing and
preserving the freight transportation system.
Improve predictive capabilities for revenue forecasting and long-term needs
assessments.
Economic Competitiveness – Improve the contribution of the Texas freight transportation
system to economic competitiveness, productivity and development:
Strengthen Texas’ position as a trade and logistics hub by improving and maintaining
Texas Freight Network infrastructure and connectivity to enhance trade routes and
increase the flow of goods.
Expand public-private partnerships to facilitate investments in freight projects that
enhance economic development and global competitiveness.
Identify critical freight infrastructure improvements necessary to support the capacity
requirements of future supply chain, logistics and consumer demands.
Conduct outreach activities and develop an educational campaign to increase
awareness of the importance of freight to the Texas economy.
Support strategic transportation investments to address the rapid increase in key
industries, such as energy, agriculture and automotive production.
Technology – Improve the safety and efficiency of freight transportation through the
development and utilization of innovative technological solutions:
1-6
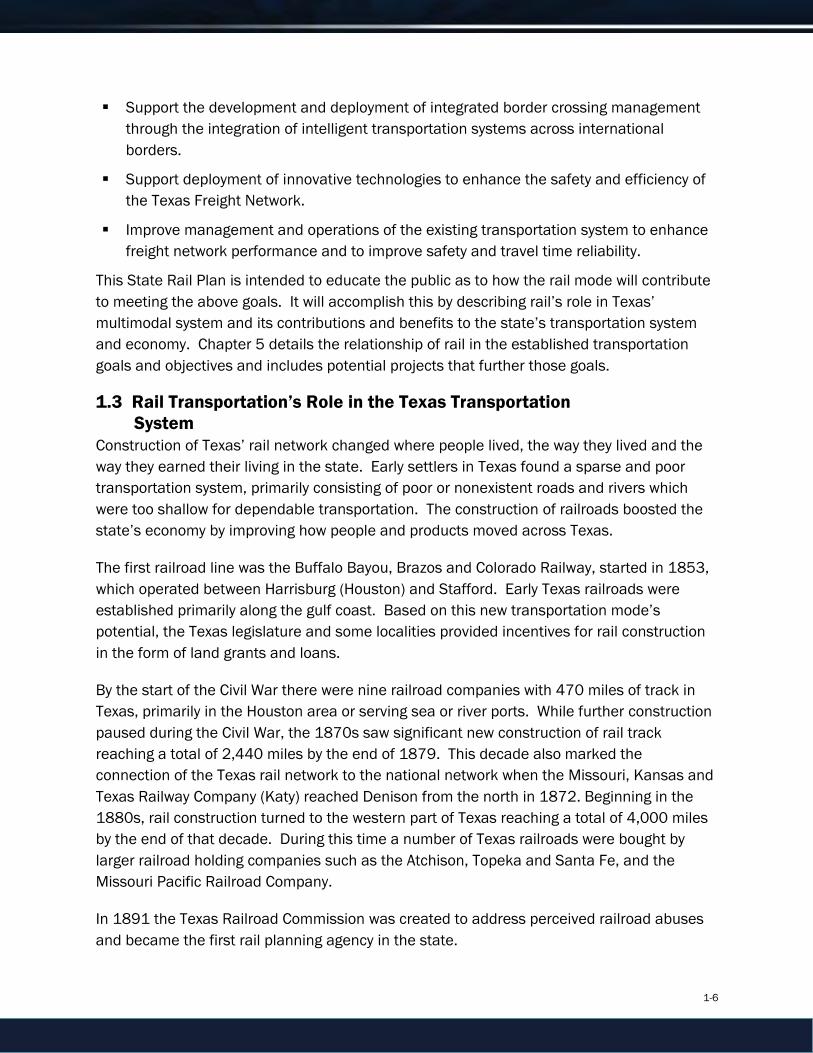
Support the development and deployment of integrated border crossing management
through the integration of intelligent transportation systems across international
borders.
Support deployment of innovative technologies to enhance the safety and efficiency of
the Texas Freight Network.
Improve management and operations of the existing transportation system to enhance
freight network performance and to improve safety and travel time reliability.
This State Rail Plan is intended to educate the public as to how the rail mode will contribute
to meeting the above goals. It will accomplish this by describing rail’s role in Texas’
multimodal system and its contributions and benefits to the state’s transportation system
and economy. Chapter 5 details the relationship of rail in the established transportation
goals and objectives and includes potential projects that further those goals.
1.3 Rail Transportation’s Role in the Texas Transportation
System
Construction of Texas’ rail network changed where people lived, the way they lived and the
way they earned their living in the state. Early settlers in Texas found a sparse and poor
transportation system, primarily consisting of poor or nonexistent roads and rivers which
were too shallow for dependable transportation. The construction of railroads boosted the
state’s economy by improving how people and products moved across Texas.
The first railroad line was the Buffalo Bayou, Brazos and Colorado Railway, started in 1853,
which operated between Harrisburg (Houston) and Stafford. Early Texas railroads were
established primarily along the gulf coast. Based on this new transportation mode’s
potential, the Texas legislature and some localities provided incentives for rail construction
in the form of land grants and loans.
By the start of the Civil War there were nine railroad companies with 470 miles of track in
Texas, primarily in the Houston area or serving sea or river ports. While further construction
paused during the Civil War, the 1870s saw significant new construction of rail track
reaching a total of 2,440 miles by the end of 1879. This decade also marked the
connection of the Texas rail network to the national network when the Missouri, Kansas and
Texas Railway Company (Katy) reached Denison from the north in 1872. Beginning in the
1880s, rail construction turned to the western part of Texas reaching a total of 4,000 miles
by the end of that decade. During this time a number of Texas railroads were bought by
larger railroad holding companies such as the Atchison, Topeka and Santa Fe, and the
Missouri Pacific Railroad Company.
In 1891 the Texas Railroad Commission was created to address perceived railroad abuses
and became the first rail planning agency in the state.
1-7
By 1911 more rail mileage was operated in Texas than in any other state. Rail mileage in
Texas ultimately reached its peak in 1932 at 17,078 miles. In the 1920s and 1930s
railroad consolidation continued. By the mid1930s the Southern Pacific, Missouri Pacific,
and Santa Fe controlled seventy percent of the states’ rail mileage.
The growth of railroads allowed commerce to move more efficiently and passengers to travel
faster and more inexpensively. More people moved into larger cities resulting in the
urbanization of Texas. However, with the advent of improved roadways and jet air travel
following World War II, the state’s rail network mileage began a steady decline which
ultimately led to the drastic reduction of rail passenger services. The increase in freight
competition from trucks and financial difficulties suffered by a number of railroads in the
1960s through the 1980s resulted in a new wave of consolidation which reduced the
number of Class I freight railroads operating in the state. The deregulation of the rail freight
industry through the Staggers Act, as well as the formation of the National Railroad
Passenger Corporation (Amtrak) in the 1980s stabilized both freight and passenger services
and led to the revitalized state of railroading we see today.
The rail system in Texas today plays a leading role among states nationally with regard to its
rail system, employees and retirees, and rail movements. According to the 2012
Association of American Railroad Statistics, Texas ranks first in the number of rail miles,
freight rail employment, freight rail wages, railroad retirement beneficiaries, railroad
retirement payments, and total rail tons terminated; second in total number of railroads;
third in total rail carloads carried, total rail tons originated, and total rail carloads
terminated; fourth in total rail carloads originated and total rail carloads originated; and fifth
in total rail tons carried.
Texas also ranks highly among all states for rail movements of many individual commodities.
For commodities originating by state, Texas ranks first for chemicals, stone, clay and glass
materials, and petroleum refining products; third for intermodal; fifth for waste and scrap;
sixth for pulp and paper; eighth for metallic ores; and ninth for primary metal products. For
commodities terminating in the state, Texas ranks first for chemicals, stone, clay and glass
materials, and petroleum refining products; second for coal, farm products, food products,
and lumber and wood; third for intermodal and primary metal products; sixth for pulp and
paper; and eighth for waste and scrap.
Today, Texas is served by three large and financially sound Class I railroads: the BNSF
Railway (BNSF); Kansas City Southern (KCS); and Union Pacific (UP) systems. Texas also
provides the majority of U.S. rail access points to Mexico, connecting this market to the Mid-
Atlantic, Northeast and Midwest regions of the country. Its port capabilities also position it
among the most important states with regard to freight intermodal transportation, the
fastest growing rail category. The combination of rail and trucking support a major

1-8
intermodal freight transportation system in the state with approximately 20 intermodal
transfer facilities. In addition, major intermodal logistics facilities have been developed in
Fort Worth and Port of San Antonio where the interchange of freight between air, rail and
truck modes have produced unique opportunities for logistics and distribution industries in
the state.
Although Texas’ intercity rail passenger services provide only a small portion of intercity
travel in the state, initiatives continue toward expanding conventional rail passenger
services, developing high speed rail corridors, and expanding commuter rail operations.
These efforts will especially focus on providing intercity and local travelers with connections
to other forms of passenger transportation (air, intercity bus, etc.), thus facilitating seamless
intercity and commuter trips.
Subsequent chapters of this Plan will provide details of Texas’ current and future rail freight
and passenger endeavors.
1.4 Institutional Structure of Texas’ State Rail Program
The Texas rail network is largely private. Investments are primarily market-driven and there
are no consistent public funding sources to improve the rail network. A number of public
entities collaborate with the private sector to carry out, administer, or assist in rail
operations planning in the state.
1.4.1 TxDOT
TxDOT was established as the Texas Highway Department in 1917 by the Texas Legislature.
TxDOT is currently a 12,000-person organization with responsibilities in all modes of
transportation. There are 25 district offices located throughout the state and four regional
offices that provide support services for the districts. TxDOT’s divisions and offices provide
additional support services to the districts and manage statewide processes like finance,
statewide planning, specialized design expertise, environmental coordination and rail
activities as defined below. TxDOT’s administrative offices provide unified direction across
the department to carry out policies set out by the Texas Transportation Commission and the
Texas Legislature.
1.4.2 TxDOT Rail Division
TxDOT’s Rail Division was established in December 2009 in response to a renewed and
growing interest in rail transportation for both the movement of people and goods. The Rail
Division is responsible for statewide rail planning. The Division implements rail-related
policies and administers state and federal funds when available. The Rail Division also
monitors potential rail line abandonments in Texas, as well as coordinates the state’s
involvement in and response to abandonment filings.

1-9
The Rail Division has specific responsibilities for the following rail functions in Texas:
Performing infrastructure and operational analysis of both state and privately owned rail
facilities to develop needs assessments as part of the project development process;
Planning and environmental analysis for potential intercity and high performance
passenger rail;
Monitoring potential rail line abandonments in Texas, as well as coordinating the state’s
involvement and response to abandonment filings;
Administering lease and operating agreements on state-owned facilities and managing
construction contracts for state or federally funded projects on those facilities, as well
as private facilities;
Implementing rail improvements by entering into public-private partnership agreements
to provide investments in freight rail relocation projects, rail facility improvements, rail
line consolidations, or new passenger rail developments;
Analyzing local, state, and national railroad/multimodal trends, policies, and legislation;
Performing research to develop more efficient use of Texas rail freight systems; and
Acting as the departmental liaison to railroad companies, intermodal interests, the
Federal Rail Administration (FRA), local governments, and the public with regards to rail
planning and project development in Texas.
The Department’s Traffic Operations Division also carries out the following rail-
related responsibilities:
Administering the state rail safety inspection program in conjunction with the FRA,
including accident and complaint investigations.
Providing the state safety oversight function as required by the FTA; and
Improving highway-rail grade crossings to reduce accidents.
1.4.3 TxDOT Districts
Exhibit 1-1 shows the geographical breakdown of TxDOT’s 25 districts. District staff, led by
the TxDOT District Engineer, are familiar with the unique demands and local needs in their
areas of responsibility. All 254 of the state's counties are assigned to one of the districts.
Districts are further subdivided into area engineer offices and maintenance offices. Through
this structure, TxDOT district offices offer local access to citizens who want to participate in
the transportation development process. The district's Public Information Offices serve as a
point of contact for citizens and the news media.

1-10
Exhibit 1-1: TxDOT Districts
Some issues pertaining to rail transportation may be analyzed at the TxDOT district level in
coordination with Metropolitan Planning Organizations (MPOs) (see below) based upon a
classification of the district as either a metropolitan district or a non-metropolitan district.
These larger metropolitan districts often have rail transit and intercity passenger rail issues
not shared by rural districts.
The primary functions of both TxDOT district personnel and local and regional government
agencies involved with rail planning are to monitor local rail transportation needs and, when
necessary, initiate rail development projects by either working directly with the railroad or
contacting Rail Division staff for assistance and/or guidance. Additionally, local and regional
governments serve as the “eyes and ears” for the implementation of improved safety
measures for their highway-rail grade crossings. Through their efforts, recommended
improvements to the local highway/railroad crossings can be executed to enhance the
quality of life in their area.

1-11
1.4.4 Texas Commuter Rail Operations
Currently, three commuter rail passenger services operate in Texas. These services are
distinguished from light rail systems in that they may operate over existing rail freight lines.
Regional or city authorities own, operate, and maintain commuter and light rail systems.
TxDOT has no funding role and regulatory oversight is limited to safety programs of some
commuter services.
The Dallas-Fort Worth region is served by the Trinity Railway Express (TRE), a 34-mile route
linking Dallas and Fort Worth and serving ten stations. The TRE is a joint service of Dallas
Area Rapid Transit (DART) and the Fort Worth Transportation Authority.
The Capital Metropolitan Transportation Authority’s MetroRail Red Line connects Austin to
its northern suburbs. The 32-mile line operates between downtown Austin and the city of
Leander and serves nine stations.
The Denton County Transportation Authority’s A-Train provides regional passenger rail
service between Denton and Carrollton. The 21-mile route serves five stations including the
terminal transfer station which allows connection to DART Green Line in Carrollton.
1.4.5 Metropolitan Planning Organizations
Metropolitan Planning Organizations (MPOs) are federally mandated and funded
transportation policy-making organizations comprised of local government and
transportation officials. The formation of an MPO is required for any urbanized area with a
population greater than 50,000.
MPOs are required to maintain and continually update a Long Range Transportation Plan
(LRTP) as well as a Transportation Improvement Program (TIP), which is a multi-year program
of transportation projects to be funded with federal and other transportation funding
sources. As MPO planning activities have evolved to address the movement of freight as
well as passengers, they have also included consideration of multimodal solutions, improved
intermodal connections, and more specific rail and rail-related project solutions. MPOs may
work cooperatively with area transportation stakeholders to understand and anticipate the
area’s travel needs and to develop supplemental urban regional freight and passenger
planning efforts that involve project initiatives to address rail capacity, service levels and
bottlenecks. Some rail projects identified in TxDOT Regional Freight Studies are included in
MPO transportation improvement plans.

1-12
There are 25 MPOs in Texas located in the following municipalities:
Abilene
Amarillo
Austin
Beaumont-Port
Arthur
Brownsville
Bryan-College Station
Corpus Christi
Dallas-Fort Worth
El Paso
Harlingen-San Benito
Hidalgo County
Houston-Galveston
Killeen-Temple
Laredo
Longview
Lubbock
Midland-Odessa
San Angelo
San Antonio-Bexar
County
Sherman-Denison
Texarkana
Tyler
Victoria
Waco
Wichita Falls

1-13
These MPO regions are outlined in Exhibit 1-2 below.
Exhibit 1-2: Texas Metropolitan Planning Organizations
Source: Association of Texas Metropolitan Planning Organizations
1.4.6 State and Local Economic Development Agencies
Texas has a number of state and local public or private economic development agencies which
recruit industries and businesses on the basis of their location, available labor force, room for
growth, and access to rail and other transportation assets.

1-14
The Texas Directory of Economic Development Organizations lists 94 entities around the state,
including economic development agencies and authorities, chambers of commerce, alliances,
development councils, corporations, and associations at the regional, county or local level of
government. Many of these agencies offer incentives such as tax exemptions and credits and other
means of assistance to attract business interests.
Although these agencies do not generally work directly with freight railroad operators, they do have
a vested interest in the level of rail services and rail assistance programs available to supplement
their incentives.
1.4.7 Rural Rail Transportation Districts
In 1981, in response to concerns over the loss of rural rail service, the Texas Legislature voted to
allow the formation of Rural Rail Transportation Districts (RRTDs). The only statutory funding
source available to RRTDs, other than receiving donations of cash and real property, is to issue
revenue bonds and the use of anticipation notes. This revenue assists RRTDs with preserving rail
infrastructure and promoting economic development. Counties can establish RRTDs to acquire
abandoned rail lines, construct new lines or rehabilitate existing lines. They can also develop rail to
serve industrial parks, intermodal facilities and transloading facilities. The June 2013 joint
TTI/TxDOT study noted 42 RRTDs, with only 13 active districts. These include:
Centex (Brown, Comanche, Erath, Hood and Johnson counties).
Ellis County.
Fannin County.
Galveston County.
La Entrada Al Pacifico (Ector and Midland counties).
North Texas (Archer and Wichita counties).
Northeast Texas (Collin, Franklin, Hopkins, Hunt and Titus counties).
Nueces County.
Pecos County.
Presidio County.
Rusk County.
San Patricio County.
Top of Texas (Hansford, Lipscomb and Ochiltree counties).
A number of RRTDs, including Calhoun County, Gregg County, Gulf Link (Brazoria and Fort Bend
counties), Liberty County, Matagorda County, McLennan County, Van Zandt County and Webb
County, are considered semi-active and have boards in place to reactivate for a viable opportunity.
The Texas A&M Transportation Institute (TTI)/TxDOT study noted that “measuring progress of

1-15
RRTDs toward outcomes related to their original motivation for forming is difficult based on the
limited information available regarding RRTD activities.” Changes in rail planning and activity
patterns in specific regions highlight the need for improved coordination on a statewide level.
Enhanced coordination strategies include identifying opportunities for interaction with other special
districts (e.g., RMAs and MPOs), private railroads (especially Class I railroads) and TxDOT. The
report concluded that TxDOT must determine its role for effectively coordinating the activities of
RRTDs and incorporating these activities into statewide rail planning efforts.
1.5 Texas’ Authority to Conduct Rail Planning and Investment
Although a consistent source of public funding is only available for at-grade improvements, the
Texas Transportation Code, Title 5, Chapter 91 and Title 7 Chapter 201 provide TxDOT with
authority to carry out rail planning, project development and financing for both rail freight and
passenger improvements in the state.
Chapter 91 authorizes TxDOT to plan and make policies for the location, construction,
maintenance, and operation of a rail facility or system in the state, as well as acquire, finance,
construct, maintain, and operate a passenger or freight rail facility or system. It also authorizes the
department to accept grants or loans from federal or state agencies, as well as public or private
entities.
Chapter 201 authorizes TxDOT to facilitate the development and interconnectivity of rail systems in
the state, and to coordinate activities regarding the planning, construction, operation, and
maintenance of a statewide passenger rail system. Under this authority, the department shall
coordinate with other entities involved with passenger rail systems, including governmental entities,
private entities, and nonprofit corporations. The department is also required to prepare and update
annually a long-term plan for a statewide passenger rail system. Information contained in the plan
must include:
A description of existing and proposed passenger rail systems;
Information regarding the status of passenger rail systems under construction;
An analysis of potential interconnectivity difficulties;
Ridership projections for proposed passenger rail projects; and
Ridership statistics for existing passenger rail systems.
1.6 Recent Investments/Initiatives in the Texas Rail System
The 2010 Texas Rail Plan focused its short-term (5 year) rail improvement financing plan on
intercity passenger rail corridors and freight rail improvements within Texas. The goals for
passenger improvements were to establish priority passenger rail corridors and to prepare Service
Development Plans (SDP) and Service Level NEPA evaluations for the priority corridors. The short-
term goals for the freight rail program were to eliminate freight rail bottlenecks on existing rail
corridors and enhance freight rail fluidity and public safety.

1-16
Although TxDOT does not have a funding program specifically dedicated to rail improvements
outside of its grade crossing improvement programs, it has successfully applied for and been
granted over $80 million from various federal discretionary programs. These funds were leveraged
with local agency funding and significant project contributions from private railroads to develop the
public-private partnerships necessary to finance major projects from the 2010 Texas Rail Plan. In
addition, TxDOT programmed and initiated a grade separation program of projects which totaled
over $150 million.
Selected examples of recent projects and their financing partnerships include:
Completion of the South Orient Railroad Improvements – through a funding partnership which
included federal budget appropriation funds and American Recovery and Reinvestment Act
(ARRA) funding, state legislative general revenue funds, local funding assistance from the City
of San Angelo and funding provided by the operating railroad, the Texas Pacifico
Transportation, a total of over $26 million has been invested in this state-owned railroad.
These capital improvements allowed increases in speed from 10 to 25 mph and has resulted
in a significant increase in carloadings on the line.
Tower 55 Multimodal Improvement Project – this project addressed a safety and congestion
situation at an at-grade rail intersection where five major freight and passenger rail routes
converged into two doubletrack mainlines crossing each other. Through a funding partnership,
which included a federal TIGER grant, funding from TxDOT and the City of Fort Worth, and
major contributions by BNSF Railway and Union Pacific Railroad, a total of over $101 million
was invested in a combination of at-grade infrastructure improvements, new signaling and
control systems, and the installation of additional main line trackage through the area. These
improvements will increase rail throughput, increase running speeds and enhance public
safety.
TRE Valley View Double Track Project – this project was advanced to improve existing
passenger rail service between Fort Worth and Dallas along the Trinity Railway Express (TRE)
corridor by adding 1.4 miles of double track, converting a turnout to a crossover, and
constructing a new bridge. Equal contributions from a federal High Speed Intercity Passenger
Rail (HSIPR) grant and funding provided by DART provided a total of $14.4 million to complete
the project. This project allows Amtrak service to move off the UP mainline onto the TRE
corridor, improving the movement of freight and facilitating more frequent and reliable
passenger rail service.
In addition to the above projects, Texas’ Class I railroads make significant capital investments
within the state annually. UP’s 2015 capital program plans for Texas called for $383 million for
infrastructure projects, while BNSF’s Texas program called for $223 million. KCS also makes
significant capital investments in the state annually.

1-17
1.7 A Summary of Freight and Passenger Rail Services in Texas
The rail system in Texas is comprised of more than 10,400 route miles. Including consideration of
trackage rights where multiple railroads may operate over the same segments of track, the state’s
railroads operate over 14,500 miles of rail line within the state. These rail lines carry over 8.8
million rail carloads annually. In addition to rail activities between Texas and other U.S. states,
Texas also receives over 750,000 rail cars across the Mexican border. In 2014, rail cars moved
20 percent of the total freight tonnage moved in the state.
A total of 46 short line railroads and three Class I’s operate within the state. The two largest
carriers, UP and Fort Worth-based BNSF, operate over almost 11,400 miles, or 78 percent of the
total miles. The Kansas City Southern (KCS), the third Class I railroad in the state, operates over
820 miles. Short line railroads, comprised of local railroads or switching/terminal railroads
comprise the remaining almost 2,300 miles of rail line operated in the state.
In addition to rail carload traffic, the state’s rail network moves more than 7.4 million tons of
intermodal rail freight. In total, Texas is home to approximately 20 intermodal rail facilities. Rail
freight also provides essential services at the Port of Houston.
A detailed description of the Texas rail freight and passenger network, individual railroads, and rail
facilities are provided in Chapter 2.
Intercity rail passenger service in Texas is provided by three Amtrak routes. The Texas Eagle and
Sunset Limited are part of Amtrak’s long-distance service network. The Texas Eagle operates daily
service between Chicago and San Antonio. At San Antonio, the service connects to the Sunset
Limited for continued service to Los Angeles. Twelve stations within Texas are served by this train.
The Sunset Limited provides tri-weekly service between New Orleans and Los Angeles. Seven
Texas stations are served by this train.
The Heartland Flyer is a daily passenger train that operates between Oklahoma City and Fort Worth.
The service is operated by Amtrak under contract to the states of Texas and Oklahoma. The
schedule is timed to allow transfers to the Texas Eagle in each direction.
Rail commuter operations also serve the Dallas-Fort Worth and Austin areas, and additional
commuter rail services are under consideration.
In recent years TxDOT has actively carried out planning route alternative studies, service
development plans, federal grant applications and related federal environmental requirements
toward expanding intercity rail passenger operations in the state and region.
TxDOT is in the process of advancing two potential High Speed Intercity Passenger corridors within
Texas through the environmental review and conceptual engineering processes. These corridors
are between Oklahoma City and South Texas, and between Dallas and Fort Worth. Investor-lead or
public-private partnerships would be needed to develop the corridors; the state facilitates

1-18
development but has no intention of providing subsidy for intercity passenger rail proposals. TxDOT
is also assisting the FRA in providing oversight of the Dallas to Houston High Speed Rail
Environmental Impact Statement (EIS) study being proposed by Texas Central Railway. The Texas
Central proposal is a privately funded project to develop high-speed passenger service between
Dallas and Houston. No state or federal funds are being utilized to conduct the study,
development, construction, or operation of the service.
TxDOT has conducted a feasibility study, developed a Service Level National Environmental Policy
Act (NEPA) document, and finalized a Service Development Plan for the Texas-Oklahoma Passenger
Rail Corridor. These efforts, funded through a federal HSIPR grant ($5.6 million), Texas General
Revenue funding ($1.4 million), the North Central Texas Council of Governments, the Oklahoma
and Texas Departments of Transportation, and the Federal Highway Administration (combined $5.6
million), has developed preferred service alternatives for passenger rail service along the 850-mile
corridor between Oklahoma City and South Texas.
Because the study was federally funded, a service level environmental impact statement (EIS) was
prepared to comply with the NEPA. The service-level EIS documents the impacts, benefits and
costs of each passenger alternative compared to the no-build alternative. These findings were
made available for public review and comment in January and February, 2014.
TxDOT is currently working with FRA to study a high-performance, intercity passenger rail service
between Dallas and Fort Worth. The 30-mile Dallas-Fort Worth Core Express Service project will
evaluate the potential for a high-speed rail connector, linking other proposed high-performance rail
projects in Texas.
A detailed description of all Texas’ proposed passenger and freight rail improvements and planning
efforts are provided in Chapters 3 and 4 respectively.

1-19
Chapter 1 - References Texas A&M Transportation Institute, Rural Rail Transportation Districts (RRTDs) Update, 2013.
Retrieved September 2014 from http://ftp.dot.state.tx.us/pub/txdot-info/rail/rural/rrtd-update.pdf
Texas A&M Transportation Institute, Texas Rural Rail Transportation Districts: Informational
Guidebook for Formation and Evaluation, 2001. Retrieved September 2014 from
http://d2dtl5nnlpfr0r.cloudfront.net/tti.tamu.edu/documents/4007-P1.pdf
2010 Texas Rail Plan, Appendix 7C

Chapter 2 Appendix
Table 1: Rail Movement by Commodity (All Directions), 2012
STCC2 Commodity Tons Units Amount Percent Amount Percent
01 Farm Prods. 31,620,961 8.0% 448,585 4.7% 08 Forest Prods. 2,080 0.0% 160 0.0% 09 Fresh Fish or Marine Prods. 44,720 0.0% 2,240 0.0% 10 Metallic Ores 1,659,743 0.4% 16,818 0.2% 11 Coal 71,586,266 18.2% 595,283 6.3% 13 Crude Petrol. or Natural Gas 5,357,052 1.4% 58,172 0.6% 14 Nonmetallic Minerals 43,311,887 11.0% 425,230 4.5% 19 Ordnance or Accessories 52,648 0.0% 1,376 0.0% 20 Food or Kindred Prods. 32,085,120 8.2% 571,506 6.0% 21 Tobacco Prods. 0 0.0% 0 0.0% 22 Textile Mill Prods. 114,640 0.0% 7,720 0.1% 23 Apparel or Related Prods. 1,631,960 0.4% 131,680 1.4% 24 Lumber or Wood Prods. 4,201,956 1.1% 58,900 0.6% 25 Furniture or Fixtures 573,320 0.1% 59,320 0.6% 26 Pulp, Paper or Allied Prods. 9,477,116 2.4% 223,124 2.4% 27 Printed Matter 229,520 0.1% 12,320 0.1% 28 Chemicals or Allied Prods. 68,555,034 17.4% 821,953 8.7% 29 Petroleum or Coal Prods. 17,774,620 4.5% 221,800 2.3% 30 Rubber or Misc Plastics 1,128,040 0.3% 82,040 0.9% 31 Leather or Leather Prods. 19,000 0.0% 1,800 0.0% 32 Clay, Concrete, Glass, or Stone 8,719,443 2.2% 102,285 1.1% 33 Primary Metal Prods. 12,847,958 3.3% 166,267 1.8% 34 Fabricated Metal Prods. 630,492 0.2% 47,272 0.5% 35 Machinery 612,108 0.2% 30,088 0.3% 36 Electrical Equipment 1,019,408 0.3% 81,788 0.9% 37 Transportation Equipment 14,800,371 3.8% 760,357 8.0% 38 Instrum., Photo Eq., Optical Eq. 69,400 0.0% 5,040 0.1% 39 Misc Manufacturing Prods. 438,920 0.1% 38,760 0.4% 40 Waste or Scrap Materials 5,636,548 1.4% 108,774 1.1% 41 Misc Freight Shipments 916,634 0.2% 105,449 1.1% 42 Shipping Containers 1,606,200 0.4% 345,280 3.6% 43 Mail or Contract Traffic 13,680 0.0% 1,240 0.0% 44 Freight Forwarder Traffic 2,394,120 0.6% 155,000 1.6% 45 Shipper Association Traffic 800 0.0% 40 0.0% 46 Misc Mixed Shipments 52,974,440 13.5% 3,692,560 39.0% 47 Small Packaged Shipments 811,720 0.2% 81,880 0.9% 48 Waste 246,128 0.1% 3,008 0.0% 49 Hazardous Materials 0 0.0% 0 0.0% 50 Secondary Traffic 0 0.0% 0 0.0% 60 Unclassified 0 0.0% 0 0.0%
Total 393,164,053 100.0% 9,465,115 100.0%
Source: prepared by CDM Smith, based on the STB Waybill Sample data for 2012
A-2

Table 2: Rail Movement by Commodity (All Directions), 2013
STCC2 Commodity Tons Units Amount Percent Amount Percent
01 Farm Prods. 31,572,744 7.8% 463,031 4.6% 08 Forest Prods. 160 0.0% 40 0.0% 09 Fresh Fish or Marine Prods. 62,600 0.0% 3,200 0.0% 10 Metallic Ores 1,816,055 0.5% 18,420 0.2% 11 Coal 66,924,457 16.6% 557,343 5.6% 13 Crude Petrol. or Natural Gas 6,729,120 1.7% 73,139 0.7% 14 Nonmetallic Minerals 50,222,612 12.5% 490,935 4.9% 19 Ordnance or Accessories 58,724 0.0% 1,848 0.0% 20 Food or Kindred Prods. 30,726,001 7.6% 590,866 5.9% 21 Tobacco Prods. 360 0.0% 120 0.0% 22 Textile Mill Prods. 118,560 0.0% 8,560 0.1% 23 Apparel or Related Prods. 1,914,760 0.5% 153,120 1.5% 24 Lumber or Wood Prods. 4,369,596 1.1% 60,384 0.6% 25 Furniture or Fixtures 604,800 0.1% 61,800 0.6% 26 Pulp, Paper or Allied Prods. 9,910,920 2.5% 242,120 2.4% 27 Printed Matter 280,560 0.1% 16,120 0.2% 28 Chemicals or Allied Prods. 71,447,200 17.7% 930,350 9.3% 29 Petroleum or Coal Prods. 18,785,757 4.7% 234,180 2.4% 30 Rubber or Misc Plastics 1,384,640 0.3% 98,640 1.0% 31 Leather or Leather Prods. 20,920 0.0% 1,640 0.0% 32 Clay, Concrete, Glass, or Stone 8,456,265 2.1% 104,640 1.1% 33 Primary Metal Prods. 12,759,836 3.2% 164,635 1.7% 34 Fabricated Metal Prods. 750,652 0.2% 51,884 0.5% 35 Machinery 551,460 0.1% 37,512 0.4% 36 Electrical Equipment 1,119,446 0.3% 91,522 0.9% 37 Transportation Equipment 15,228,924 3.8% 776,796 7.8% 38 Instrum., Photo Eq., Optical Eq. 73,880 0.0% 5,480 0.1% 39 Misc Manufacturing Prods. 510,640 0.1% 49,440 0.5% 40 Waste or Scrap Materials 5,437,084 1.3% 103,276 1.0% 41 Misc Freight Shipments 995,700 0.2% 114,595 1.2% 42 Shipping Containers 1,683,080 0.4% 375,600 3.8% 43 Mail or Contract Traffic 6,280 0.0% 400 0.0% 44 Freight Forwarder Traffic 1,202,880 0.3% 73,480 0.7% 45 Shipper Association Traffic 0 0.0% 0 0.0% 46 Misc Mixed Shipments 56,373,640 14.0% 3,915,080 39.3% 47 Small Packaged Shipments 909,280 0.2% 86,840 0.9% 48 Waste 241,516 0.1% 3,000 0.0% 49 Hazardous Materials 0 0.0% 0 0.0% 50 Secondary Traffic 0 0.0% 0 0.0% 60 Unclassified 0 0.0% 0 0.0%
Total 403,251,109 100.0% 9,960,036 100.0%
Source: prepared by CDM Smith, based on the STB Waybill Sample data for 2013
A-3

Table 3: Rail Outbound Movement by Commodity, 2013
STCC2 Commodity Tons Units Amount Percent Amount Percent
01 Farm Prods. 838,520 1.4% 17,348 1.0% 08 Forest Prods. 0 0.0% 0 0.0% 09 Fresh Fish or Marine Prods. 0 0.0% 0 0.0% 10 Metallic Ores 330,881 0.5% 3,353 0.2% 11 Coal 0 0.0% 0 0.0% 13 Crude Petrol. or Natural Gas 1,164,116 1.9% 13,657 0.8% 14 Nonmetallic Minerals 1,028,650 1.7% 11,026 0.6% 19 Ordnance or Accessories 3,600 0.0% 200 0.0% 20 Food or Kindred Prods. 3,020,436 5.0% 79,584 4.6% 21 Tobacco Prods. 0 0.0% 0 0.0% 22 Textile Mill Prods. 13,760 0.0% 1,320 0.1% 23 Apparel or Related Prods. 280,760 0.5% 21,920 1.3% 24 Lumber or Wood Prods. 284,080 0.5% 5,920 0.3% 25 Furniture or Fixtures 36,520 0.1% 4,600 0.3% 26 Pulp, Paper or Allied Prods. 1,851,640 3.1% 54,520 3.1% 27 Printed Matter 10,840 0.0% 640 0.0% 28 Chemicals or Allied Prods. 28,303,783 46.8% 346,883 19.9% 29 Petroleum or Coal Prods. 4,389,508 7.3% 56,484 3.2% 30 Rubber or Misc Plastics 268,720 0.4% 19,800 1.1% 31 Leather or Leather Prods. 2,920 0.0% 160 0.0% 32 Clay, Concrete, Glass, or Stone 790,104 1.3% 16,716 1.0% 33 Primary Metal Prods. 2,278,700 3.8% 26,996 1.5% 34 Fabricated Metal Prods. 122,564 0.2% 7,636 0.4% 35 Machinery 126,928 0.2% 10,528 0.6% 36 Electrical Equipment 246,242 0.4% 25,974 1.5% 37 Transportation Equipment 5,491,295 9.1% 290,942 16.7% 38 Instrum., Photo Eq., Optical Eq. 2,160 0.0% 200 0.0% 39 Misc Manufacturing Prods. 73,000 0.1% 5,760 0.3% 40 Waste or Scrap Materials 1,426,580 2.4% 24,348 1.4% 41 Misc Freight Shipments 299,136 0.5% 34,809 2.0% 42 Shipping Containers 1,031,560 1.7% 237,480 13.6% 43 Mail or Contract Traffic 0 0.0% 0 0.0% 44 Freight Forwarder Traffic 141,080 0.2% 8,840 0.5% 45 Shipper Association Traffic 0 0.0% 0 0.0% 46 Misc Mixed Shipments 6,491,520 10.7% 405,320 23.3% 47 Small Packaged Shipments 89,560 0.1% 9,920 0.6% 48 Waste 14,120 0.0% 160 0.0% 49 Hazardous Materials 0 0.0% 0 0.0% 50 Secondary Traffic 0 0.0% 0 0.0% 60 Unclassified 0 0.0% 0 0.0%
Total 60,453,283 100.0% 1,743,044 100.0%
Source: prepared by CDM Smith, based on the STB Waybill Sample data for 2013
A-4

Table 4: Rail Inbound Movement by Commodity, 2013
STCC2 Commodity Tons Units Amount Percent Amount Percent
01 Farm Prods. 17,312,780 9.6% 167,895 5.8% 08 Forest Prods. 160 0.0% 40 0.0% 09 Fresh Fish or Marine Prods. 34,200 0.0% 1,760 0.1% 10 Metallic Ores 1,308,274 0.7% 13,147 0.5% 11 Coal 58,629,073 32.4% 488,589 16.8% 13 Crude Petrol. or Natural Gas 2,518,349 1.4% 26,972 0.9% 14 Nonmetallic Minerals 25,882,958 14.3% 245,642 8.5% 19 Ordnance or Accessories 12,084 0.0% 232 0.0% 20 Food or Kindred Prods. 15,372,593 8.5% 201,590 6.9% 21 Tobacco Prods. 0 0.0% 0 0.0% 22 Textile Mill Prods. 10,960 0.0% 960 0.0% 23 Apparel or Related Prods. 427,480 0.2% 32,240 1.1% 24 Lumber or Wood Prods. 2,832,996 1.6% 31,404 1.1% 25 Furniture or Fixtures 89,120 0.0% 8,680 0.3% 26 Pulp, Paper or Allied Prods. 2,244,200 1.2% 50,200 1.7% 27 Printed Matter 43,400 0.0% 2,200 0.1% 28 Chemicals or Allied Prods. 19,606,745 10.8% 232,560 8.0% 29 Petroleum or Coal Prods. 6,476,620 3.6% 83,228 2.9% 30 Rubber or Misc Plastics 213,160 0.1% 15,000 0.5% 31 Leather or Leather Prods. 1,560 0.0% 80 0.0% 32 Clay, Concrete, Glass, or Stone 3,700,360 2.0% 40,940 1.4% 33 Primary Metal Prods. 6,161,208 3.4% 74,711 2.6% 34 Fabricated Metal Prods. 181,840 0.1% 12,196 0.4% 35 Machinery 98,800 0.1% 6,364 0.2% 36 Electrical Equipment 201,312 0.1% 13,276 0.5% 37 Transportation Equipment 4,828,840 2.7% 246,821 8.5% 38 Instrum., Photo Eq., Optical Eq. 17,600 0.0% 1,160 0.0% 39 Misc Manufacturing Prods. 82,960 0.0% 8,040 0.3% 40 Waste or Scrap Materials 1,316,240 0.7% 19,028 0.7% 41 Misc Freight Shipments 426,576 0.2% 53,320 1.8% 42 Shipping Containers 66,000 0.0% 13,320 0.5% 43 Mail or Contract Traffic 680 0.0% 40 0.0% 44 Freight Forwarder Traffic 118,880 0.1% 7,320 0.3% 45 Shipper Association Traffic 0 0.0% 0 0.0% 46 Misc Mixed Shipments 10,604,840 5.9% 791,160 27.3% 47 Small Packaged Shipments 116,120 0.1% 11,160 0.4% 48 Waste 119,276 0.1% 1,440 0.0% 49 Hazardous Materials 0 0.0% 0 0.0% 50 Secondary Traffic 0 0.0% 0 0.0% 60 Unclassified 0 0.0% 0 0.0%
Total 181,058,244 100.0% 2,902,715 100.0%
Source: prepared by CDM Smith, based on the STB Waybill Sample data for 2013
A-5

Table 5: Rail Intra by Movement Commodity, 2013
STCC2 Commodity Tons Units Amount Percent Amount Percent
01 Farm Prods. 1,642,972 3.3% 15,476 2.6% 08 Forest Prods. 0 0.0% 0 0.0% 09 Fresh Fish or Marine Prods. 0 0.0% 0 0.0% 10 Metallic Ores 95,432 0.2% 956 0.2% 11 Coal 0 0.0% 0 0.0% 13 Crude Petrol. or Natural Gas 1,664,215 3.3% 17,628 3.0% 14 Nonmetallic Minerals 20,771,818 41.7% 207,507 35.3% 19 Ordnance or Accessories 9,660 0.0% 148 0.0% 20 Food or Kindred Prods. 573,064 1.2% 8,344 1.4% 21 Tobacco Prods. 0 0.0% 0 0.0% 22 Textile Mill Prods. 0 0.0% 0 0.0% 23 Apparel or Related Prods. 0 0.0% 0 0.0% 24 Lumber or Wood Prods. 91,400 0.2% 1,000 0.2% 25 Furniture or Fixtures 0 0.0% 0 0.0% 26 Pulp, Paper or Allied Prods. 307,040 0.6% 4,440 0.8% 27 Printed Matter 0 0.0% 0 0.0% 28 Chemicals or Allied Prods. 12,066,878 24.2% 132,923 22.6% 29 Petroleum or Coal Prods. 5,830,473 11.7% 61,732 10.5% 30 Rubber or Misc Plastics 3,640 0.0% 80 0.0% 31 Leather or Leather Prods. 0 0.0% 0 0.0% 32 Clay, Concrete, Glass, or Stone 2,884,161 5.8% 28,444 4.8% 33 Primary Metal Prods. 880,856 1.8% 10,068 1.7% 34 Fabricated Metal Prods. 11,088 0.0% 132 0.0% 35 Machinery 4,000 0.0% 200 0.0% 36 Electrical Equipment 5,212 0.0% 112 0.0% 37 Transportation Equipment 1,564,421 3.1% 59,409 10.1% 38 Instrum., Photo Eq., Optical Eq. 0 0.0% 0 0.0% 39 Misc Manufacturing Prods. 0 0.0% 0 0.0% 40 Waste or Scrap Materials 1,169,216 2.3% 15,252 2.6% 41 Misc Freight Shipments 28,532 0.1% 1,378 0.2% 42 Shipping Containers 59,800 0.1% 14,360 2.4% 43 Mail or Contract Traffic 0 0.0% 0 0.0% 44 Freight Forwarder Traffic 0 0.0% 0 0.0% 45 Shipper Association Traffic 0 0.0% 0 0.0% 46 Misc Mixed Shipments 105,080 0.2% 6,920 1.2% 47 Small Packaged Shipments 0 0.0% 0 0.0% 48 Waste 61,600 0.1% 640 0.1% 49 Hazardous Materials 0 0.0% 0 0.0% 50 Secondary Traffic 0 0.0% 0 0.0% 60 Unclassified 0 0.0% 0 0.0%
Total 49,830,558 100.0% 587,149 100.0%
Source: prepared by CDM Smith, based on the STB Waybill Sample data for 2013
A-6

Table 6: Rail Through Movement by Commodity, 2013
STCC2 Commodity Tons Units Amount Percent Amount Percent
01 Farm Prods. 11,778,472 10.5% 262,312 5.5% 08 Forest Prods. 0 0.0% 0 0.0% 09 Fresh Fish or Marine Prods. 28,400 0.0% 1,440 0.0% 10 Metallic Ores 81,468 0.1% 964 0.0% 11 Coal 8,295,384 7.4% 68,754 1.5% 13 Crude Petrol. or Natural Gas 1,382,440 1.2% 14,882 0.3% 14 Nonmetallic Minerals 2,539,186 2.3% 26,760 0.6% 19 Ordnance or Accessories 33,380 0.0% 1,268 0.0% 20 Food or Kindred Prods. 11,759,908 10.5% 301,348 6.4% 21 Tobacco Prods. 360 0.0% 120 0.0% 22 Textile Mill Prods. 93,840 0.1% 6,280 0.1% 23 Apparel or Related Prods. 1,206,520 1.1% 98,960 2.1% 24 Lumber or Wood Prods. 1,161,120 1.0% 22,060 0.5% 25 Furniture or Fixtures 479,160 0.4% 48,520 1.0% 26 Pulp, Paper or Allied Prods. 5,508,040 4.9% 132,960 2.8% 27 Printed Matter 226,320 0.2% 13,280 0.3% 28 Chemicals or Allied Prods. 11,469,794 10.2% 217,984 4.6% 29 Petroleum or Coal Prods. 2,089,156 1.9% 32,736 0.7% 30 Rubber or Misc Plastics 899,120 0.8% 63,760 1.3% 31 Leather or Leather Prods. 16,440 0.0% 1,400 0.0% 32 Clay, Concrete, Glass, or Stone 1,081,640 1.0% 18,540 0.4% 33 Primary Metal Prods. 3,439,072 3.1% 52,860 1.1% 34 Fabricated Metal Prods. 435,160 0.4% 31,920 0.7% 35 Machinery 321,732 0.3% 20,420 0.4% 36 Electrical Equipment 666,680 0.6% 52,160 1.1% 37 Transportation Equipment 3,344,368 3.0% 179,624 3.8% 38 Instrum., Photo Eq., Optical Eq. 54,120 0.0% 4,120 0.1% 39 Misc Manufacturing Prods. 354,680 0.3% 35,640 0.8% 40 Waste or Scrap Materials 1,525,048 1.4% 44,648 0.9% 41 Misc Freight Shipments 241,456 0.2% 25,088 0.5% 42 Shipping Containers 525,720 0.5% 110,440 2.3% 43 Mail or Contract Traffic 5,600 0.0% 360 0.0% 44 Freight Forwarder Traffic 942,920 0.8% 57,320 1.2% 45 Shipper Association Traffic 0 0.0% 0 0.0% 46 Misc Mixed Shipments 39,172,200 35.0% 2,711,680 57.4% 47 Small Packaged Shipments 703,600 0.6% 65,760 1.4% 48 Waste 46,520 0.0% 760 0.0% 49 Hazardous Materials 0 0.0% 0 0.0% 50 Secondary Traffic 0 0.0% 0 0.0% 60 Unclassified 0 0.0% 0 0.0%
Total 111,909,024 100.0% 4,727,128 100.0%
Source: prepared by CDM Smith, based on the STB Waybill Sample data for 2013
A-7
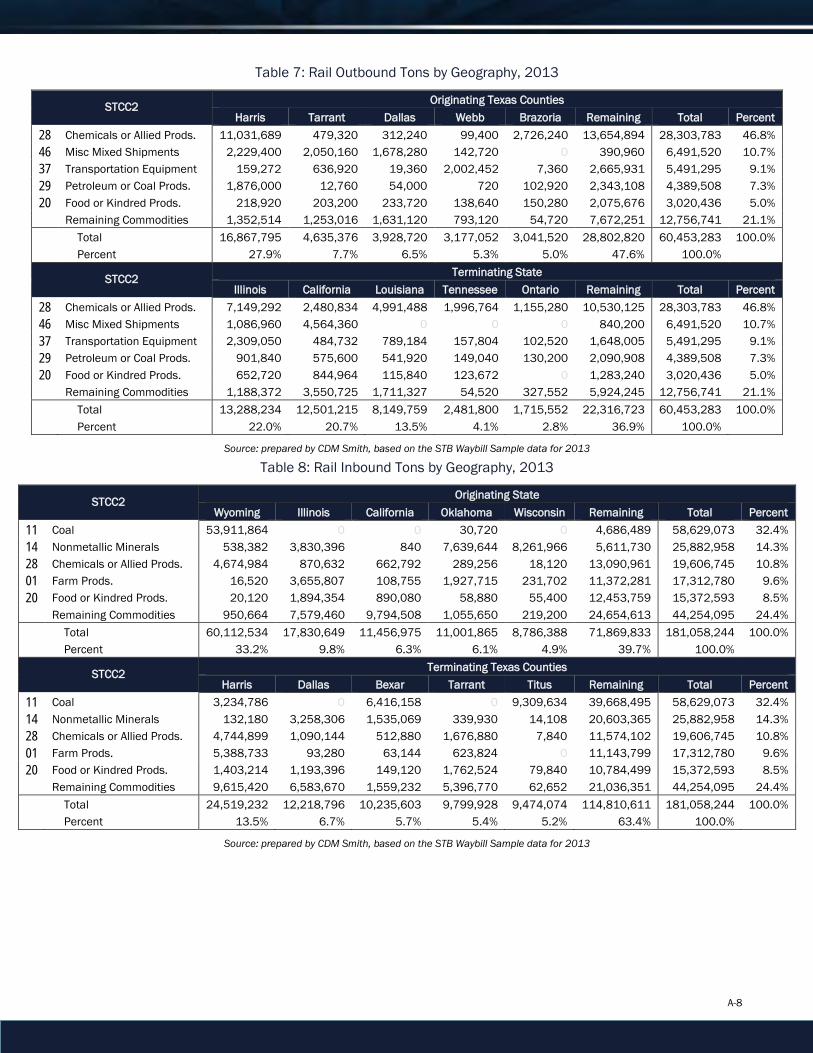
Table 7: Rail Outbound Tons by Geography, 2013
STCC2 Originating Texas Counties Harris Tarrant Dallas Webb Brazoria Remaining Total Percent
28 Chemicals or Allied Prods. 11,031,689 479,320 312,240 99,400 2,726,240 13,654,894 28,303,783 46.8% 46 Misc Mixed Shipments 2,229,400 2,050,160 1,678,280 142,720 0 390,960 6,491,520 10.7% 37 Transportation Equipment 159,272 636,920 19,360 2,002,452 7,360 2,665,931 5,491,295 9.1% 29 Petroleum or Coal Prods. 1,876,000 12,760 54,000 720 102,920 2,343,108 4,389,508 7.3% 20 Food or Kindred Prods. 218,920 203,200 233,720 138,640 150,280 2,075,676 3,020,436 5.0% Remaining Commodities 1,352,514 1,253,016 1,631,120 793,120 54,720 7,672,251 12,756,741 21.1% Total 16,867,795 4,635,376 3,928,720 3,177,052 3,041,520 28,802,820 60,453,283 100.0% Percent 27.9% 7.7% 6.5% 5.3% 5.0% 47.6% 100.0%
STCC2 Terminating State Illinois California Louisiana Tennessee Ontario Remaining Total Percent
28 Chemicals or Allied Prods. 7,149,292 2,480,834 4,991,488 1,996,764 1,155,280 10,530,125 28,303,783 46.8% 46 Misc Mixed Shipments 1,086,960 4,564,360 0 0 0 840,200 6,491,520 10.7% 37 Transportation Equipment 2,309,050 484,732 789,184 157,804 102,520 1,648,005 5,491,295 9.1% 29 Petroleum or Coal Prods. 901,840 575,600 541,920 149,040 130,200 2,090,908 4,389,508 7.3% 20 Food or Kindred Prods. 652,720 844,964 115,840 123,672 0 1,283,240 3,020,436 5.0% Remaining Commodities 1,188,372 3,550,725 1,711,327 54,520 327,552 5,924,245 12,756,741 21.1% Total 13,288,234 12,501,215 8,149,759 2,481,800 1,715,552 22,316,723 60,453,283 100.0% Percent 22.0% 20.7% 13.5% 4.1% 2.8% 36.9% 100.0%
Source: prepared by CDM Smith, based on the STB Waybill Sample data for 2013
Table 8: Rail Inbound Tons by Geography, 2013
STCC2 Originating State Wyoming Illinois California Oklahoma Wisconsin Remaining Total Percent
11 Coal 53,911,864 0 0 30,720 0 4,686,489 58,629,073 32.4% 14 Nonmetallic Minerals 538,382 3,830,396 840 7,639,644 8,261,966 5,611,730 25,882,958 14.3% 28 Chemicals or Allied Prods. 4,674,984 870,632 662,792 289,256 18,120 13,090,961 19,606,745 10.8% 01 Farm Prods. 16,520 3,655,807 108,755 1,927,715 231,702 11,372,281 17,312,780 9.6% 20 Food or Kindred Prods. 20,120 1,894,354 890,080 58,880 55,400 12,453,759 15,372,593 8.5% Remaining Commodities 950,664 7,579,460 9,794,508 1,055,650 219,200 24,654,613 44,254,095 24.4% Total 60,112,534 17,830,649 11,456,975 11,001,865 8,786,388 71,869,833 181,058,244 100.0% Percent 33.2% 9.8% 6.3% 6.1% 4.9% 39.7% 100.0%
STCC2 Terminating Texas Counties Harris Dallas Bexar Tarrant Titus Remaining Total Percent
11 Coal 3,234,786 0 6,416,158 0 9,309,634 39,668,495 58,629,073 32.4% 14 Nonmetallic Minerals 132,180 3,258,306 1,535,069 339,930 14,108 20,603,365 25,882,958 14.3% 28 Chemicals or Allied Prods. 4,744,899 1,090,144 512,880 1,676,880 7,840 11,574,102 19,606,745 10.8% 01 Farm Prods. 5,388,733 93,280 63,144 623,824 0 11,143,799 17,312,780 9.6% 20 Food or Kindred Prods. 1,403,214 1,193,396 149,120 1,762,524 79,840 10,784,499 15,372,593 8.5% Remaining Commodities 9,615,420 6,583,670 1,559,232 5,396,770 62,652 21,036,351 44,254,095 24.4% Total 24,519,232 12,218,796 10,235,603 9,799,928 9,474,074 114,810,611 181,058,244 100.0% Percent 13.5% 6.7% 5.7% 5.4% 5.2% 63.4% 100.0%
Source: prepared by CDM Smith, based on the STB Waybill Sample data for 2013
A-8

Table 9: Rail Tonnage Growth Rates by Commodity and Direction (2010-2040 CAGR) STCC2 Commodity Outbound Inbound Intra Through
01 Farm Products 3.9% 2.2% 2.0% 2.5% 08 Forest Products 2.2% 2.8% #N/A 4.3% 09 Fresh Fish or Marine Products #N/A 2.4% #N/A 2.6% 10 Metallic Ores 2.0% 2.3% 1.9% 3.3% 11 Coal #N/A -2.1% 1.1% -2.0% 13 Crude Petroleum or Natural Gas 3.6% 2.0% #N/A 2.0% 14 Nonmetallic Minerals 2.3% 2.4% 2.2% 2.5% 19 Ordnance or Accessories 1.1% 1.1% 1.1% 1.1% 20 Food or Kindred Products 1.5% 2.0% 2.2% 2.1% 21 Tobacco Products #N/A #N/A #N/A -5.6% 22 Textile Mill Products 0.6% 0.7% #N/A 0.2% 23 Apparel or Related Products 0.4% 1.8% #N/A 1.4% 24 Lumber or Wood Products 2.2% 2.4% 2.0% 2.9% 25 Furniture or Fixtures 4.0% 3.7% #N/A 3.7% 26 Pulp, Paper, or Allied Products 2.0% 2.0% 2.1% 2.3% 27 Printed Matter 0.9% 1.3% #N/A 1.5% 28 Chemicals or Allied Products 2.2% 2.2% 2.2% 2.6% 29 Petroleum or Coal Products 0.2% 0.2% -0.6% 0.8% 30 Rubber or Miscellaneous Plastics 4.3% 4.0% 4.5% 4.3% 31 Leather or Leather Products 3.2% #N/A #N/A 0.7% 32 Clay, Concrete, Glass, or Stone 3.1% 2.8% 2.3% 3.1% 33 Primary Metal Products 2.9% 2.1% 3.5% 2.9% 34 Fabricated Metal Products 3.3% 4.0% #N/A 3.7% 35 Machinery 5.0% 5.1% 5.2% 4.8% 36 Electrical Equipment 4.8% 4.8% 4.4% 5.4% 37 Transportation Equipment 4.6% 4.1% 4.9% 4.8%
38 Instrument, Photo, and Optical Equipment 4.4% 4.3% #N/A 9.7%
39 Miscellaneous Manufacturing Products 4.5% 4.0% #N/A 4.2% 40 Waste or Scrap Materials 5.2% 4.9% 5.1% 5.8% 41 Miscellaneous Freight Shipments 3.4% 4.1% 2.9% 3.5% 42 Shipping Containers 3.3% 3.4% 3.4% 3.3% 43 Mail or Contract Traffic -0.4% -0.4% #N/A -0.4% 44 Freight Forwarder Traffic 3.5% 3.5% #N/A 3.5% 45 Shipper Association Traffic #N/A 1.8% #N/A 1.8% 46 Miscellaneous Mixed Shipments 4.2% 4.9% 4.4% 4.3% 47 Small Packaged Shipments 3.4% 3.4% #N/A 3.4% 48 Waste 2.3% 2.4% 2.5% 3.7% 49 Hazardous Materials #N/A #N/A #N/A #N/A 50 Secondary Traffic #N/A #N/A #N/A #N/A 60 Unclassified #N/A #N/A #N/A #N/A
Total 2.8% 1.4% 2.2% 3.2%
Source: based on TRANSEARCH CAGR 2010-'40
A-9

Table 10: Rail Tonnage Forecast by Commodity and Direction, 2040 STCC2 Commodity Outbound Inbound Intra Through Total
01 Farm Prods. 4,572,493 45,894,227 3,093,500 28,060,911 81,621,131 08 Forest Prods. 25,183 903 0 30,647 56,733 09 Fresh Fish or Marine Prods. 0 20,815 0 43,584 64,399 10 Metallic Ores 493,117 1,437,846 178,580 271,820 2,381,363 11 Coal 0 36,292,834 2,498,127 5,102,545 43,893,506 13 Crude Petrol. or Natural Gas 616,056 36,558 0 143,188 795,803 14 Nonmetallic Minerals 3,394,389 29,960,088 31,950,597 9,303,530 74,608,605 19 Ordnance or Accessories 57,901 81,430 5,783 21,000 166,113 20 Food or Kindred Prods. 5,144,686 28,795,314 1,590,006 23,554,207 59,084,214 21 Tobacco Prods. 0 0 0 105 105 22 Textile Mill Prods. 10,201 17,927 0 117,552 145,679 23 Apparel or Related Prods. 216,794 447,732 0 1,321,942 1,986,468 24 Lumber or Wood Prods. 848,422 4,443,012 80,657 2,618,431 7,990,521 25 Furniture or Fixtures 88,886 180,835 0 1,377,079 1,646,800 26 Pulp, Paper or Allied Prods. 2,713,397 4,279,804 533,160 8,737,064 16,263,425 27 Printed Matter 8,485 43,779 0 238,871 291,135 28 Chemicals or Allied Prods. 51,478,134 33,237,115 23,090,419 19,785,084 127,590,753 29 Petroleum or Coal Prods. 4,603,571 5,853,925 3,618,094 2,619,509 16,695,100 30 Rubber or Misc Plastics 990,970 505,104 3,005 2,947,151 4,446,230 31 Leather or Leather Prods. 5,399 0 0 26,951 32,350 32 Clay, Concrete, Glass, or Stone 2,018,453 5,971,779 5,898,270 3,045,612 16,934,115 33 Primary Metal Prods. 4,137,270 9,925,759 2,209,282 6,163,525 22,435,835 34 Fabricated Metal Prods. 257,581 423,563 0 1,033,888 1,715,033 35 Machinery 550,903 292,200 9,927 803,344 1,656,375 36 Electrical Equipment 1,219,904 582,065 85,754 2,272,960 4,160,684 37 Transportation Equipment 15,113,218 13,002,874 4,359,604 10,876,856 43,352,551 38 Instrum., Photo Eq., Optical Eq. 39,348 58,727 0 1,274,385 1,372,460 39 Misc Manufacturing Prods. 170,441 191,143 0 1,204,631 1,566,215 40 Waste or Scrap Materials 5,767,299 5,411,438 5,945,474 8,418,875 25,543,085 41 Misc Freight Shipments 928,815 1,199,424 77,140 821,082 3,026,463 42 Shipping Containers 2,260,691 248,950 325,743 1,986,814 4,822,198 43 Mail or Contract Traffic 6,757 3,449 0 10,663 20,869 44 Freight Forwarder Traffic 545,855 504,421 0 4,371,683 5,421,958 45 Shipper Association Traffic 0 1,355 0 5,760 7,115 46 Misc Mixed Shipments 24,615,256 39,486,142 98,640 125,585,471 189,785,509 47 Small Packaged Shipments 185,351 296,186 0 1,543,854 2,025,391 48 Waste 58,944 202,805 73,867 379,274 714,891 49 Hazardous Materials 0 0 0 0 0 50 Secondary Traffic 0 0 0 0 0 60 Unclassified 0 0 0 0 0
Total 133,144,171 269,331,531 85,725,629 276,119,849 764,321,180
Source: based on TRANSEARCH 2010-'40
A-10