Printing - A GUIDE TO COACHING IN THE WORKPLACE - Seafish - Seafish
SEAFOOD PROCESSING INDUSTRY REPORT 2016
Seafood Processing Industry Report 2016
Authors
Struan Noble
Marta Moran Quintana
Hazel Curtis
Other Contributors
Steven Lawrence
Kirsten Milliken
Sebastien Metz
Arina Motova
Tsvetina Yordanova
Michaela Archer
Julia Brooks
Ivan Bartolo
Fiona Wright
Lee Cooper
Phillip Quirie
Erin Forrest
Sean Bright
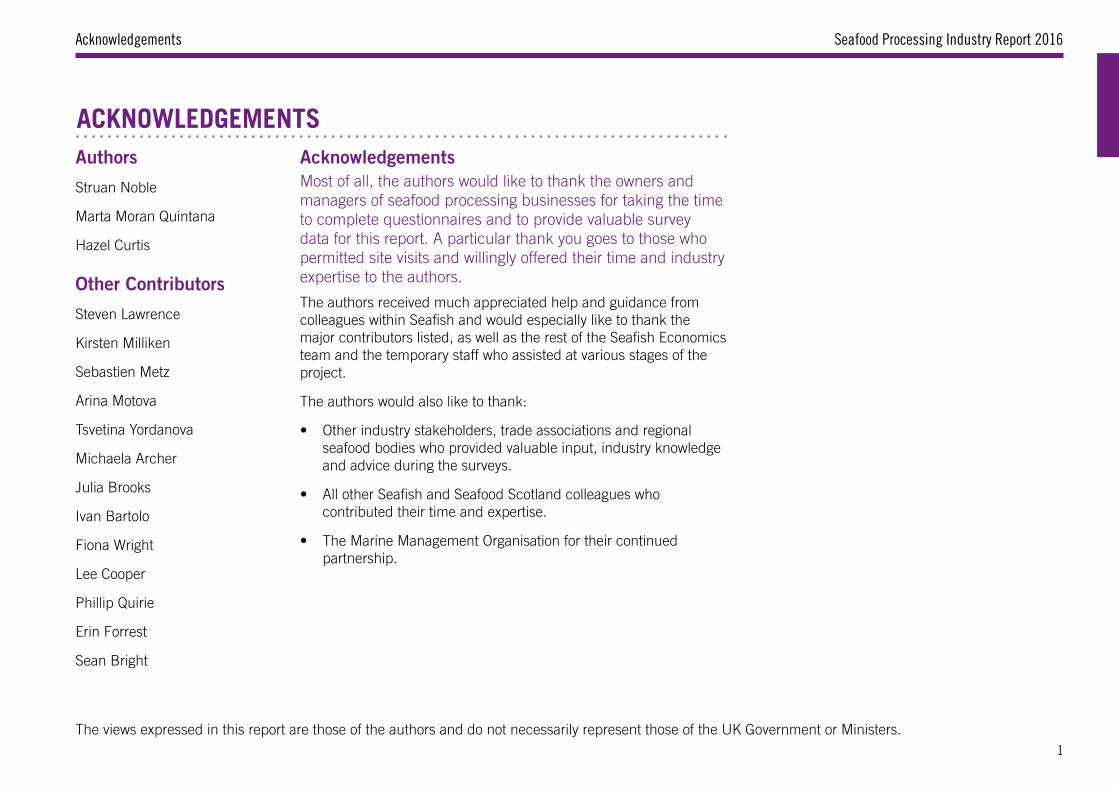
AcknowledgementsMost of all, the authors would like to thank the owners and managers of seafood processing businesses for taking the time to complete questionnaires and to provide valuable survey data for this report. A particular thank you goes to those who permitted site visits and willingly offered their time and industry expertise to the authors.
The authors received much appreciated help and guidance from colleagues within Seafish and would especially like to thank the major contributors listed, as well as the rest of the Seafish Economics team and the temporary staff who assisted at various stages of the project.
The authors would also like to thank:
• Other industry stakeholders, trade associations and regional seafood bodies who provided valuable input, industry knowledge and advice during the surveys.
• All other Seafish and Seafood Scotland colleagues who contributed their time and expertise.
• The Marine Management Organisation for their continued partnership.
ACKNOWLEDGEMENTS
The views expressed in this report are those of the authors and do not necessarily represent those of the UK Government or Ministers.
Acknowledgements
1
Seafood Processing Industry Report 2016
CONTENTS
Contents
Acknowledgements 1
Contents 2
Executive Summary 4
Introduction 8
2.1 Cost Structure: 28
2.1.1 Summary of industry cost structure 28
2.1.2 Summary of operating cost structure 28
2.2 Summary of Inputs into Production 29
2.3 Labour Input: 31
2.3.1 Wages and labour costs 31
2.3.2 Training and skills 32
2.4 Capital Input: 33
2.4.1 Fixed assets – tangible and intangible 33
2.4.2 Capital employed 33
2.5 Raw Material Supply Base: 34
2.5.1 Seafood Value Chain 34
2.5.2 Sea fish processing raw material supply base 35
1.1 Fish Processors: 10
1.1.1 Trends in number of sites and employment 10
1.1.2 Breakdown by site size 11
1.1.3 Processing type 12
1.1.4 Regional and home nation distribution 13
1.2 Salmon & Freshwater Fish Processors: 15
1.2.1 Trends in number of sites and employment 15
1.2.2 Breakdown by site size 15
1.2.3 Processing type 16
1.2.4 Regional and home nation distribution 16
1.3 Sea Fish Processors: 17
1.3.1 Trends in number of sites and employment 17
1.3.2 Breakdown by site size 18
1.3.3 Processing type 19
1.3.4 Sites and jobs by fish species category 20
1.3.5 Processing Industry Profile: the UK pelagic processing sector 22
1.3.6 Regional and home nation distribution 23
1.3.7 Labour force profile – employment type & seasonality 25
1.3.8 Overview of importers and exporters 26
Seafood Processing Industry Report 2016 1. Industry Structure & Employment 9 2. Sea Fish Processing:
Cost Structure & Inputs into Production 27
2
Seafood Processing Industry Report 2016Contents
Appendix 1: Regions of the UK for Reporting Purposes 59
Appendix 2: Definitions 60
Appendix 3: Sample for Financial Estimation 63
Appendix 4: Research Approach and Methods 67
A4.1 Scope of study 67
A4.2 Research stakeholders and objectives 67
A4.3 Research methods 68
Appendix 5: Census Survey Form (2016) 70
Appendix 6: Financial Survey Form (2014) 71
Appendix 7: Report Data 72
5.1 How can the industry be supported – comments from industry 57
4.1 Strengths, Weaknesses, Opportunities & Threats (SWOT) Analysis 44
4.2 Operating Environment 45
4.2.1 Raw material supplies 45
4.2.2 Customer base 48
4.2.3 Operating conditions: Financial climate 49
4.2.4 Operating conditions: Trade 50
4.2.5 Operating conditions: Regulation 52
4.2.6 Operating conditions: Changing international trade environment and political-economic climate 54
3.1 Summary of Output and Productivity 37
3.1.1 Summary: economic performance of the sea fish processing industry 37
3.1.2 Summary: key ratios 38
3.2 Industry Financial Output Trends 39
3.2.1 Output trends – turnover, operating profit and Gross Value Added 39
3.2.2 Regional distribution of turnover and Gross Value Added 39
3.3 Turnover and Gross Value Added per site by FTE band 41
3.3.1 Turnover and Gross Value Added per site by FTE band 41
3.3.2 Beyond Gross Value Added and Gross Domestic Product 41
3.4 Customer Base 42
3. Sea Fish Processing: Output and Productivity 37
4. Sea Fish Processing: Industry Business Environment 43 Appendices 595: Supporting the Industry 57
3
Seafood Processing Industry Report 2016
Fish Processing: Industry 2016 profile1 INDUSTRY SIZE AND STRUCTURE (section
1.1.1 and 1.1.2): There were 376 majority fish processing sites and 17,999 Full Time Equivalent (FTE) jobs. Sites with 1-25 FTE jobs made up 68% of all sites and 12% of total industry FTE jobs. Sites with over 100 FTE jobs made up 12% of all sites and provided 65% of total industry FTE jobs.
2 PROCESSING TYPE (section 1.1.3): 11,586 fish processing FTE jobs were at mixed processing sites, 4,383 FTE jobs were at secondary processing sites and 2,031 FTE jobs were at primary processing sites. Most larger processors were engaged in mixed processing, whereas most small processors (1-10 FTE jobs) were engaged in either primary or secondary processing.
3 HOME NATION DISTRIBUTION (section 1.1.4): Just over half of sites and FTE jobs are located in England. The average size of sites in Scotland (55 FTE jobs per site) is higher than the rest of the UK.
4 REGIONAL DISTRIBUTION (section 1.1.4):
Humberside, Grampian and ‘Other Scotland’ were the most important regions for fish processing as measured by the number of sites and FTE jobs. The largest average regional site size was in Humberside (81 FTE jobs per site), although all three regions had a higher than UK average site size.
5 SALMON & FRESHWATER PROCESSORS (section 1.2): A total of 4,445 FTE jobs were at 69 salmon & freshwater majority processing sites. The average salmon & freshwater site size was larger than that of the average total fish processing industry site size. 87% of all salmon & freshwater FTE jobs were at mixed processing sites. ‘Other Scotland’ (23 sites) and the ‘Highlands and Islands’ (15 sites) had the largest numbers of salmon & freshwater fish processing sites.
Fish Processing: Industry trends6 CHANGE IN INDUSTRY SIZE (section 1.1.1
and 1.1.2): The industry has consolidated with a 33% decrease in the total number of fish processing sites from 2008 to 2016. During the same period, FTE jobs per site increased by 32% to an average of 48 FTEs per site in 2016.
7 CHANGE IN PROCESSING TYPE (section 1.1.3): Between 2010 and 2016, the distribution of fish processing FTE jobs by processing type has remained steady.
8 CHANGE IN REGIONAL DISTRIBUTION (section 1.1.4): Between 2010 and 2016, the number of sites in the top three regions decreased, in Humberside and Grampian total FTE jobs increased. South West of England showed the strongest percentage growth in number of sites (10%), and South/Midlands the strongest percentage growth in number of FTE jobs.
9 CHANGE IN SALMON & FRESHWATER PROCESSORS (section 1.2): Between 2010 and 2016, the number of sites classified as salmon & freshwater majority processors increased. Some of this increase may be explained by processors switching focus to salmon & freshwater processing from previously processing other sea fish species. FTE jobs have varied between years with an overall decrease of just over 11.5% between 2010 and 2016.
EXECUTIVE SUMMARY – SEAFOOD PROCESSING INDUSTRY REPORT 2016
Executive Summary
4

Seafood Processing Industry Report 2016Executive Summary
10 INDUSTRY SIZE (section 1.1.1): There were 13,554 FTE jobs across 307 majority sea fish processing sites, representing three quarters (75%) of all fish processing FTE jobs and 82% of all fish processing sites.
11 INDUSTRY STRUCTURE (section 1.3.2): The sea fish industry structure was similar to overall fish processing. Over 60% of sea fish processing employment was concentrated at less than 10% of all sea fish processing sites.
12 PROCESSING TYPE (section 1.3.3): Mixed processors made up over half of sea fish sites (54%) and FTE jobs (57%). Primary processors represented 32% of sites and 12% of FTE jobs. 14% of total sites were secondary processors with 31% of FTE jobs.
13 SPECIES TYPE CATEGORY (section 1.3.4): Just over half (55%) of sites processed a mix of species types and 29% of sites processed shellfish only. Most sites processing mixed species types (76%) process both sea fish species and salmon & other freshwater species. The most common species type processed at mixed species type sites was demersal (95%).
14 REGIONAL & HOME NATION DISTRIBUTION
(section 1.3.6): The three regions with the highest proportions of sea fish processing FTE jobs were Humberside (36%), Grampian (25%) and South West England (10%). By home nation, Scotland accounted for 35% of sea fish processing FTE jobs, England 62%, Northern Ireland 3% and Wales less than 1%.
15 SEASONAL EMPLOYMENT (section 1.3.7): 47 sites (17% of all sites) employed an average of 14 seasonal staff for just under 17 weeks per year.
16 INDUSTRY COSTS (section 2.1 and 2.2): Total costs in 2014 amounted to £3 billion with the majority of this operating costs. Raw materials were 74% of operating costs, labour costs 13%, other operating costs 12% and energy costs 2% of total operating costs.
17 VALUE OF INDUSTRY (section 3.1): In 2014, total industry turnover was £3.13 billion, Gross Value Added (GVA) was £554 million, operating profit was £184 million (6% of turnover) and net profit was £113 million (4% of turnover).
18 KEY FINANCIAL RATIOS (section 3.1.2): In 2014, the average operating profit margin was 10% and average net profit margin was 8%. In terms of productivity, average turnover per FTE job was £233,283 and GVA per FTE job was £41,298. The industry had a current ratio of 1.13, (measure of financial health), which indicates that industry operations may be, to a degree, restricted by working capital problems.
Sea Fish Processing: Industry profile (2016) and financial position (2014)
5
Seafood Processing Industry Report 2016
The largest decrease in FTE jobs was in South
West England (23% decrease).
22 CHANGE IN INDUSTRY COSTS (section 2.1): Between 2010 and 2014, total industry costs increased in nominal terms by 1.5%, which in real terms (adjusted for inflation) would be a slight decrease. The structure of operating costs remained largely steady from 2010-2014.
23 CHANGE IN VALUE OF ASSETS (section 2.2): One notable change was the total value of balance sheet fixed assets, (such as equipment, premises and technology), which nearly doubled between 2010 and 2014.
24 CHANGE IN INDUSTRY VALUE (section 3.1 and 3.2): Industry turnover peaked in 2012 before nominally decreasing back to 2010 levels in 2014. GVA nominally decreased from £590 million in 2010 to £554 million in 2014, largely as a result of a decrease in operating profits (which varied over the period).
25 CHANGE IN KEY RATIOS (section 3.1.2): Profitability ratios decreased from 2010 to 2014. Productivity ratios varied, with turnover per FTE nominally increasing overall from 2010 to 2014 and GVA per FTE marginally decreasing. Between 2010 and 2014, estimated financial health ratios, current ratio and total debt to total assets, decreased.
Sea Fish Processing: Industry trends19 CHANGE IN INDUSTRY SIZE (section 1.3.1
and 1.3.2): The number of sea fish processing sites decreased by 37% since 2008 to 307 sites in 2016. The average number of FTE jobs per site increased by 41% over the same period to 44 per site in 2016. There are fewer sites with 1-10 FTEs and 11-25 FTEs, a decrease of over 40% in terms of both number of sites and FTE jobs between 2008 and 2016. FTE jobs at sites with over 100 FTEs increased by 11% over the same period. Between 2014 and 2016, employment rose marginally by 147 FTE jobs (1%).
20 CHANGE IN SPECIES TYPE CATEGORY (section 1.3.4): Between 2010 to 2016, the numbers of pelagic sites and shellfish sites have remained steady whereas, sites processing mixed and demersal species decreased by 22% and 38% respectively. FTE jobs at sites per species category showed a marked change from 2010 to 2016: FTE jobs at pelagic sites increased by 87% (associated with an increase in landings) and FTE jobs at shellfish sites rose by 57%. Demersal species category processing FTE jobs decreased by 44% and FTE jobs at mixed species type sites decreased by 19%
21 CHANGE IN REGIONAL DISTRIBUTION (section 1.3.6): Between 2014 and 2016, FTE jobs in Humberside increased by 17% and FTE jobs in Grampian increased by 7%.
Executive Summary
6
Seafood Processing Industry Report 2016Executive Summary
Helpful Harmful
Inte
rnal
Strengths:• High quality of all UK sourced and imported raw material.• Very good environmental status of the majority of UK supply chain fisheries.• Increasing vertical integration – both in terms of customers and the supply base.• Increase in freezing and storage capacity. Therefore, increasing ability of industry to adapt to changes in supply
and demand.• Increase in investment in physical capital resource.• Good relationships with clients and suppliers globally.• Consolidation of the sector translating to long-term economies of scale lowering the marginal cost of producing
an extra unit of product.• Investment or updating of physical capital, reducing the scale of labour requirement.
Weaknesses:• Remote geography of some plants limits access to resources or
market.• Low overall levels of vertical integration.• Cumbersome administration work (in particular for small processors
with regards to access to funding).• Narrow client and/or supplier base (in terms of sales) for some
processors.• Access and supply of skilled labour is low.• Processor interests not fully accounted for in fisheries management.
Ext
erna
l
Opportunities:• Growing demand for seafood products.• Large domestic seafood market.• Strong export markets.• Trade agreements increasing access to export markets and increasing supply of raw materials.• Increasing uptake of certifications for sustainable seafood.• Trend of converging regulatory requirements across nations, increasing access to raw materials in the long term.• De-valuing of the pound – strengthen UK export competitiveness and UK assets potentially more attractive for
foreign capital investors.• Stronger demand for sustainable seafood. This raises the profile of seafood being sustainable and raises barriers
to entry for competing industries outside the UK to access the domestic market. For example through the Responsible Fishing Scheme (RFS) or Risk Assessment for Sourcing Seafood (RASS).
• New trade environment may allow access to other sources of labour which current trade agreements do not allow for.
• New trade conditions may lower advantage of competitor countries with policies designed to support national industries (for example, the Faroe Islands and Norway).
• The increasing number of ‘metro stores’ increase the number of sales outlets for seafood. However, whilst they will sell limited ranges, they may be different products to those sold in main store hence increasing the overall range diversity for processors to deal, which could also be a threat (increasing production complexity).
Threats:• Uncertainty of the financial climate.• Declining supplies of UK raw material.• Increased uncertainty in raw material supply.• Labour supply – migration conditions for entry or stay in the UK,
and attractiveness of the UK as place to work (lower value of pound equates to lower relative wage for migrant workers).
• Increased price of raw materials.• Increased competition between processors.• Poor environmental reputation of some fisheries.• Uncertainty over UK trade status with EU and other trade partners.• New regulatory conditions and customs procedures may increase
non-tariff barriers.• Overcapacity in the sector.
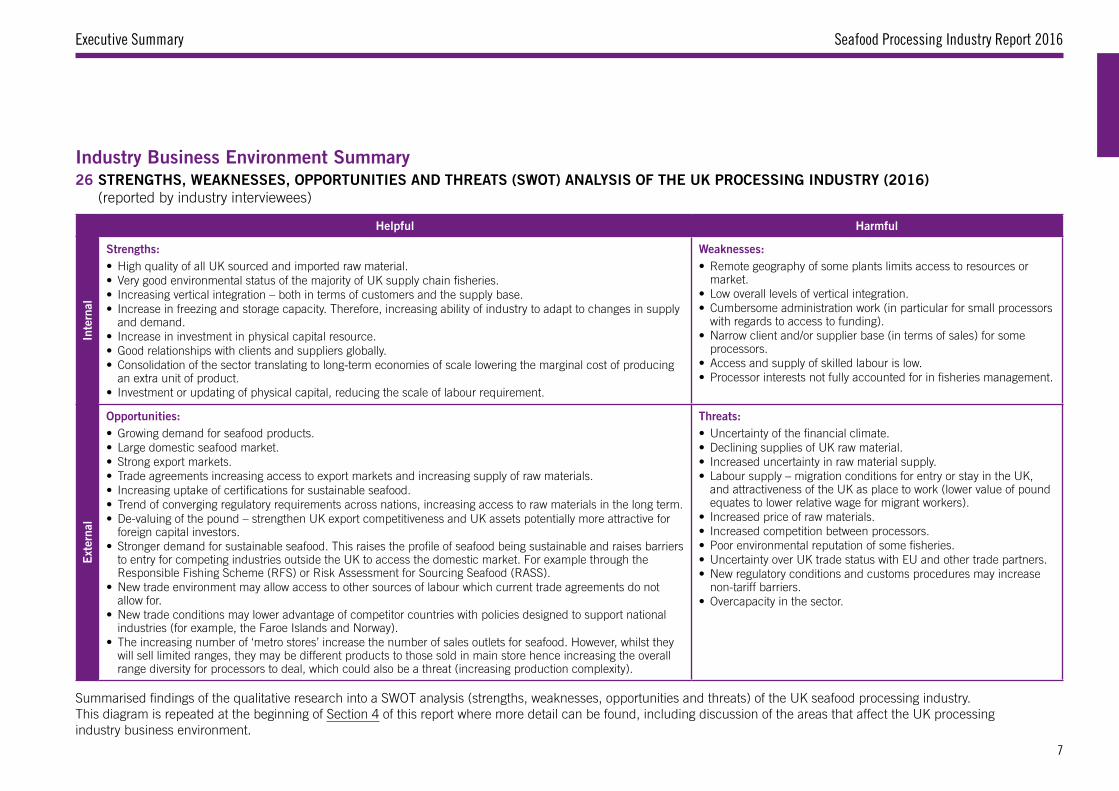
26 STRENGTHS, WEAKNESSES, OPPORTUNITIES AND THREATS (SWOT) ANALYSIS OF THE UK PROCESSING INDUSTRY (2016) (reported by industry interviewees)
Industry Business Environment Summary
Summarised findings of the qualitative research into a SWOT analysis (strengths, weaknesses, opportunities and threats) of the UK seafood processing industry. This diagram is repeated at the beginning of Section 4 of this report where more detail can be found, including discussion of the areas that affect the UK processing industry business environment.
7
Seafood Processing Industry Report 2016 Introduction
The fish processing sector is an important part of the seafood value chain. According to the European Commission 2016 Factsheet1, the UK fish processing sector is estimated to be the largest in Europe in terms of employment and turnover.
This report presents an overview and detailed analysis of the fish processing industry with particular emphasis on the sea fish processing sector. Primary research conducted by Seafish Economics included the 2016 census data, the 2014 financial survey data, and included qualitative interviews undertaken in 2016.
■ The 2016 census survey of the UK seafood processing industry was carried out by Seafish Economics between August and October 2016. This biennial survey achieves coverage (by interview or estimate) of every majority fish processor that we identify. Only majority processors (with at least 50% of turnover from fish processing) are included in the analysis2. This survey data provides key information on the structure of the processing industry including the number of processing units, employment levels, type of processing activities undertaken and the type of species being processed, amongst other features3.
■ The 2014 financial survey of the industry was carried out by Seafish Economics between February and March 2016. This survey collected annual financial information from a sample of businesses. The survey data collected are then supplemented with data from published financial accounts (covering at least six months of the relevant year) of fish processing businesses. The financial data are analysed to produce estimates for the whole industry4. Although we do have information about the size and nature of every company, nevertheless, our estimates of the total financial figures for the sector are only estimates (rather than direct observations).
■ Qualitative interviews were conducted between May and September 2016. These were semi-structured in-depth interviews (30 minutes to 1 hour in length) with business owners and managers, as well as other industry stakeholders (non-representative sample). The purpose of this research was to explore the factors and trends that have affected their business currently and over the last two years. The results from this research are illustrative of parts of the sector and are not necessarily representative of the views of the entire industry5.
Please be awareAll data collected to inform this report are treated with the strictest confidentiality and no individual sites or company records disclosed. Confidentiality checks have been made so that no individual businesses can be identified in this report.
Continuing and significant improvements in data collection, management, estimation methods and increasing the robustness of definitions mean that direct comparisons with data for earlier years may not always be possible, even where seemingly comparable figures have been previously published. However, general trends are believed to be reflective of actual business activity.
Throughout the report, percentages are rounded to the nearest whole number and therefore figures may not always sum to 100 due to rounding.
Data was gathered either before or shortly after the UK/EU referendum. A discussion of the changing trade relationship of the UK with other countries is presented in section 4.
Seafish is working with industry and stakeholders to gather their views on potential Brexit implications and has hosted a number of events on Brexit such as panel sessions and industry forums. To keep up with the work Seafish is doing on Brexit visit http://www.seafish.org/industry-support/brexit.
This publication is supplemented by data tables which can be downloaded from the following web link http://www.seafish.org/research-economics/industry-economics/processing-sector-statistics.
INTRODUCTION
1. https://ec.europa.eu/fisheries/sites/fisheries/files/docs/body/pcp_en.pdf2. This correctly implies that estimates of the size and financial contribution of the industry are conservative due to the exclusion of minority processors (where the activity is internalised along with complimentary activities within one business). Please see Appendix 4 for the reasoning behind our definitions.3. Please see Appendix 4 and 5 for detailed description of approach and Census form respectively.4. Please see Appendix 3 for response rates, Appendix 4 for details of the research methods used, Appendix 4 for estimation methods and Appendix 6 for a copy of the Financial Survey Form.5. The results are presented as ‘comments from industry’ in relevant sections throughout the report and in particular Section 4.
8
Seafood Processing Industry Report 2016
FISH PROCESSING: INDUSTRY STRUCTURE & EMPLOYMENT1
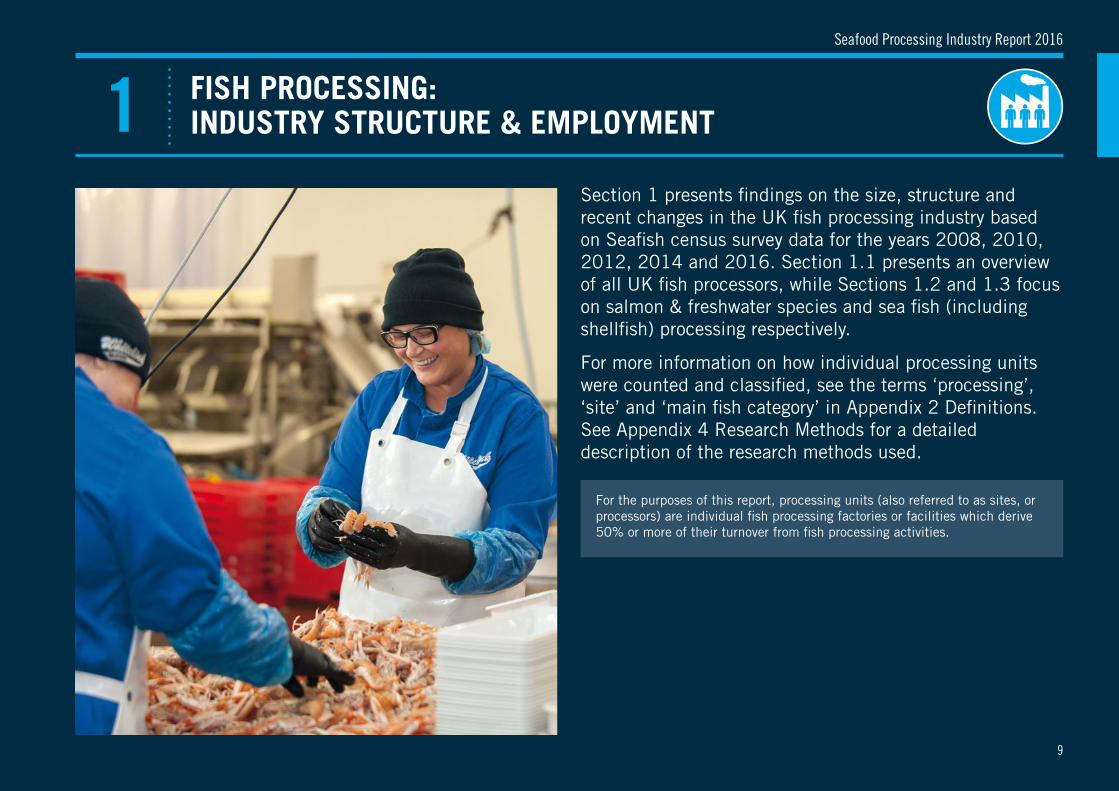
Section 1 presents findings on the size, structure and recent changes in the UK fish processing industry based on Seafish census survey data for the years 2008, 2010, 2012, 2014 and 2016. Section 1.1 presents an overview of all UK fish processors, while Sections 1.2 and 1.3 focus on salmon & freshwater species and sea fish (including shellfish) processing respectively.
For more information on how individual processing units were counted and classified, see the terms ‘processing’, ‘site’ and ‘main fish category’ in Appendix 2 Definitions. See Appendix 4 Research Methods for a detailed description of the research methods used.
For the purposes of this report, processing units (also referred to as sites, or processors) are individual fish processing factories or facilities which derive 50% or more of their turnover from fish processing activities.
9
1. Fish Processing: Industry Structure & Employment
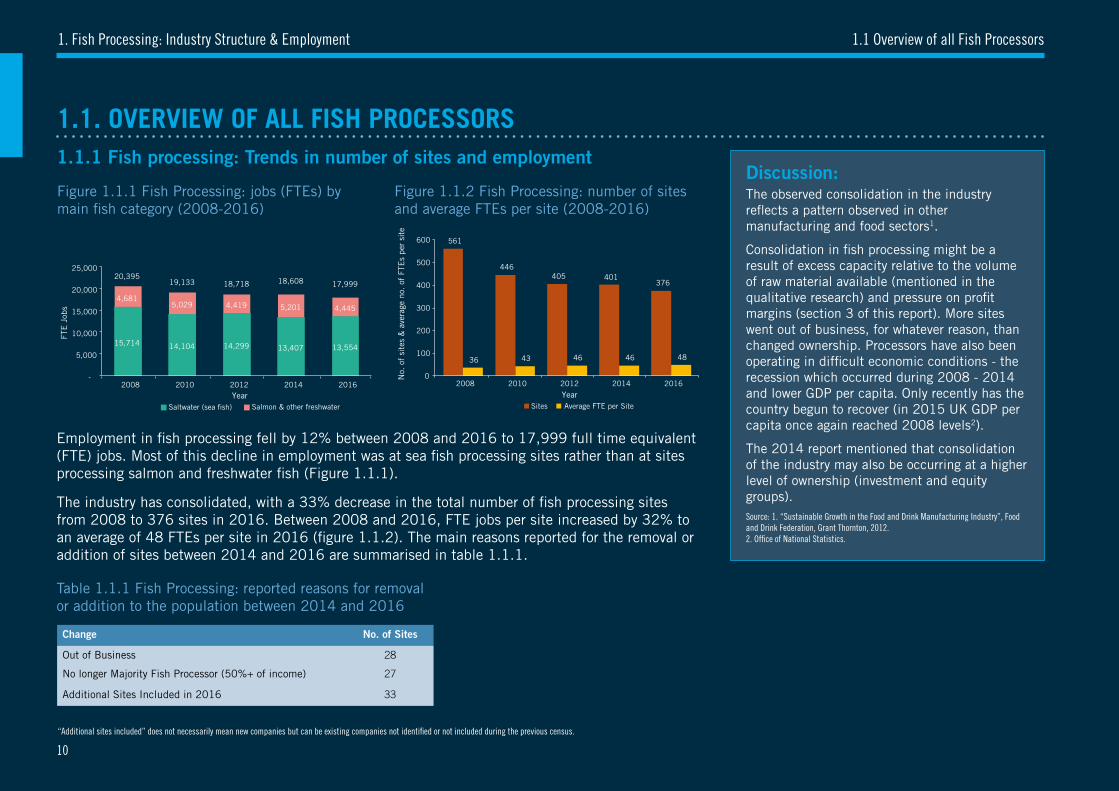
Table 1.1.1 Fish Processing: reported reasons for removal or addition to the population between 2014 and 2016
Figure 1.1.1 Fish Processing: jobs (FTEs) by main fish category (2008-2016)
Figure 1.1.2 Fish Processing: number of sites and average FTEs per site (2008-2016)
Discussion:The observed consolidation in the industry reflects a pattern observed in other manufacturing and food sectors1.
Consolidation in fish processing might be a result of excess capacity relative to the volume of raw material available (mentioned in the qualitative research) and pressure on profit margins (section 3 of this report). More sites went out of business, for whatever reason, than changed ownership. Processors have also been operating in difficult economic conditions - the recession which occurred during 2008 - 2014 and lower GDP per capita. Only recently has the country begun to recover (in 2015 UK GDP per capita once again reached 2008 levels2).
The 2014 report mentioned that consolidation of the industry may also be occurring at a higher level of ownership (investment and equity groups). Source: 1. “Sustainable Growth in the Food and Drink Manufacturing Industry”, Food and Drink Federation, Grant Thornton, 2012.2. Office of National Statistics.
1.1 Overview of all Fish Processors
1.1. OVERVIEW OF ALL FISH PROCESSORS1.1.1 Fish processing: Trends in number of sites and employment
Employment in fish processing fell by 12% between 2008 and 2016 to 17,999 full time equivalent (FTE) jobs. Most of this decline in employment was at sea fish processing sites rather than at sites processing salmon and freshwater fish (Figure 1.1.1).
The industry has consolidated, with a 33% decrease in the total number of fish processing sites from 2008 to 376 sites in 2016. Between 2008 and 2016, FTE jobs per site increased by 32% to an average of 48 FTEs per site in 2016 (figure 1.1.2). The main reasons reported for the removal or addition of sites between 2014 and 2016 are summarised in table 1.1.1.
“Additional sites included” does not necessarily mean new companies but can be existing companies not identified or not included during the previous census.
561
36
2008
446
43
2010
405
46
2012
401
46
2014
376
48
2016
15,714
4,681
20,395
2008
14,104
5,029
19,133
2010
14,299
4,419
18,718
2012
13,407
5,201
18,608
2014
13,554
4,445
17,999
2016
40%
17%
16%
11%
16%
Mixed
58%
26%
8%
5% 4%
Primary
57%
15%
8%
5%
15%
Secondary
-
5,000
10,000
15,000
20,000
25,000
FTE
Job
s
Year Saltwater (sea fish) Salmon & other freshwater
0
100
200
300
400
500
600
No.
of
site
s &
ave
rage
no.
of
FTE
s pe
r si
te
Year Sites Average FTE per Site
181
73
47
30
45 1-10
11-25
26-50
51-100
100+
FTE Bands
955 1,280
1,707
2,382
11,675
1-10
11-25
26-50
51-100
100+
FTE Bands
282
124
61 51
43
208
95
54 48 41
169
88
58 49
41
186
76
50 38
51
181
73
47
30 45
0
50
100
150
200
250
300
1-10 11-25 26-50 51-100 100+
No.
of S
ites
Sites by FTE Size Bands
2008
2010
2012
2014
2016
12,438 11,656
11,052
12,452 11,586
3,950
2,105 1,959 2,146 2,031
3,992 4,621 5,274
4,006 4,383
-
2,000
4,000
6,000
8,000
10,000
12,000
14,000
2008 2010 2012 2014 2016
Full
Tim
e Eq
uiva
lent
(FT
E) E
mpl
oyee
s
Year
Mixed Processors
Primary Processors
Secondary Processors
0%
10%
20%
30%
40%
50%
60%
70%
80%
90%
100%
% o
f Site
s
100+
51-100
26-50
11-25
1-10
FTE Bands
88
49
97
28
74
95
62 56
11
78
33
87
18
60
74
48 40
7
68
31
77
19
56
68
46
34
5
59
34
75
15
48
74
53
40
59
30
61
15
42
63
53
43
10
0
20
40
60
80
100
120
No
. of S
ites
Region
2008
2010
2012
2014
2016
3,9
35
1,8
52
4,6
17
553
2,1
54
3,7
19
1,7
66
1,6
87
108
3,7
08
1,5
07
1,33
9
4,5
03
4,26
5
339
3
61
2,1
07 2,49
9
4,1
06
3,72
2
1,6
66
862 1
,107
83
5
3
3,8
82
3,80
3
1,2
74
4,4
90
418
1,4
01
3,6
28
2,0
84
1,80
9
1,4
04
3,7
66
1,1
34
4,9
22
372
1,3
32
3,4
80
1,6
13
1,3
30
51
-
1,000
2,000
3,000
4,000
5,000
6,000
Grampian Highlandsand Islands
Humberside N. Ireland NorthEngland
OtherScotland
S W England South/Midlands
Wales
Grampian Highlandsand Islands
Humberside N. Ireland NorthEngland
OtherScotland
S W England South/Midlands
Wales
FTE
jobs
Region
2008
2010
2012
2014
2016
561
36
2008
446
43
2010
405
46
2012
401
46
2014
376
48
2016
15,714
4,681
20,395
2008
14,104
5,029
19,133
2010
14,299
4,419
18,718
2012
13,407
5,201
18,608
2014
13,554
4,445
17,999
2016
40%
17%
16%
11%
16%
Mixed
58%
26%
8%
5% 4%
Primary
57%
15%
8%
5%
15%
Secondary
-
5,000
10,000
15,000
20,000
25,000
FTE
Job
s
Year Saltwater (sea fish) Salmon & other freshwater
0
100
200
300
400
500
600
No.
of
site
s &
ave
rage
no.
of
FTE
s pe
r si
te Year
Sites Average FTE per Site
181
73
47
30
45 1-10
11-25
26-50
51-100
100+
FTE Bands
955 1,280
1,707
2,382
11,675
1-10
11-25
26-50
51-100
100+
FTE Bands
282
124
61 51
43
208
95
54 48 41
169
88
58 49
41
186
76
50 38
51
181
73
47
30 45
0
50
100
150
200
250
300
1-10 11-25 26-50 51-100 100+
No.
of S
ites
Sites by FTE Size Bands
2008
2010
2012
2014
2016
12,438 11,656
11,052
12,452 11,586
3,950
2,105 1,959 2,146 2,031
3,992 4,621 5,274
4,006 4,383
-
2,000
4,000
6,000
8,000
10,000
12,000
14,000
2008 2010 2012 2014 2016
Full
Tim
e Eq
uiva
lent
(FT
E) E
mpl
oyee
s
Year
Mixed Processors
Primary Processors
Secondary Processors
0%
10%
20%
30%
40%
50%
60%
70%
80%
90%
100%
% o
f Site
s
100+
51-100
26-50
11-25
1-10
FTE Bands
88
49
97
28
74
95
62 56
11
78
33
87
18
60
74
48 40
7
68
31
77
19
56
68
46
34
5
59
34
75
15
48
74
53
40
59
30
61
15
42
63
53
43
10
0
20
40
60
80
100
120
No
. of S
ites
Region
2008
2010
2012
2014
2016
3,9
35
1,8
52
4,6
17
553
2,1
54
3,7
19
1,7
66
1,6
87
108
3,7
08
1,5
07
1,33
9
4,5
03
4,26
5
339
3
61
2,1
07 2,49
9
4,1
06
3,72
2
1,6
66
862 1
,107
83
5
3
3,8
82
3,80
3
1,2
74
4,4
90
418
1,4
01
3,6
28
2,0
84
1,80
9
1,4
04
3,7
66
1,1
34
4,9
22
372
1,3
32
3,4
80
1,6
13
1,3
30
51
-
1,000
2,000
3,000
4,000
5,000
6,000
Grampian Highlandsand Islands
Humberside N. Ireland NorthEngland
OtherScotland
S W England South/Midlands
Wales
Grampian Highlandsand Islands
Humberside N. Ireland NorthEngland
OtherScotland
S W England South/Midlands
Wales
FTE
jobs
Region
2008
2010
2012
2014
2016
Change No. of Sites
Out of Business 28
No longer Majority Fish Processor (50%+ of income) 27
Additional Sites Included in 2016 33
10
Seafood Processing Industry Report 2016
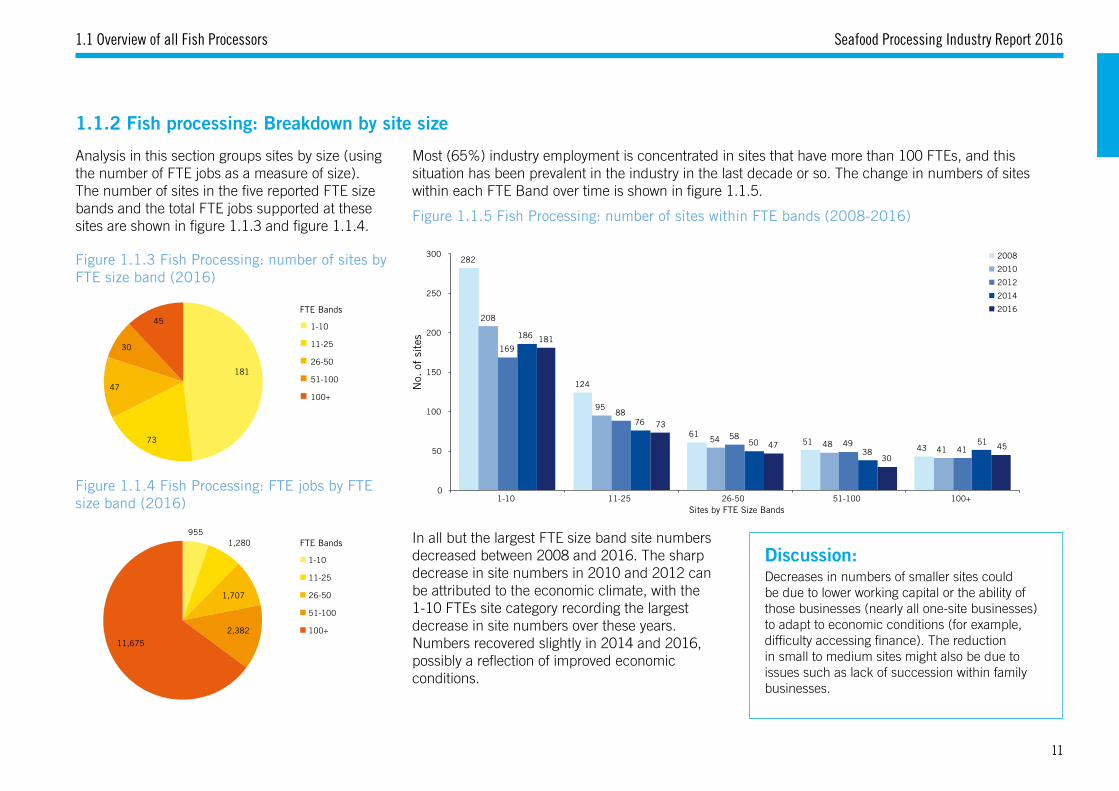
Figure 1.1.3 Fish Processing: number of sites by FTE size band (2016)
Figure 1.1.5 Fish Processing: number of sites within FTE bands (2008-2016)
Figure 1.1.4 Fish Processing: FTE jobs by FTE size band (2016)
Discussion:Decreases in numbers of smaller sites could be due to lower working capital or the ability of those businesses (nearly all one-site businesses) to adapt to economic conditions (for example, difficulty accessing finance). The reduction in small to medium sites might also be due to issues such as lack of succession within family businesses.
1.1 Overview of all Fish Processors
1.1.2 Fish processing: Breakdown by site size
Analysis in this section groups sites by size (using the number of FTE jobs as a measure of size). The number of sites in the five reported FTE size bands and the total FTE jobs supported at these sites are shown in figure 1.1.3 and figure 1.1.4.
Most (65%) industry employment is concentrated in sites that have more than 100 FTEs, and this situation has been prevalent in the industry in the last decade or so. The change in numbers of sites within each FTE Band over time is shown in figure 1.1.5.
In all but the largest FTE size band site numbers decreased between 2008 and 2016. The sharp decrease in site numbers in 2010 and 2012 can be attributed to the economic climate, with the 1-10 FTEs site category recording the largest decrease in site numbers over these years. Numbers recovered slightly in 2014 and 2016, possibly a reflection of improved economic conditions.
561
36
2008
446
43
2010
405
46
2012
401
46
2014
376
48
2016
15,714
4,681
20,395
2008
14,104
5,029
19,133
2010
14,299
4,419
18,718
2012
13,407
5,201
18,608
2014
13,554
4,445
17,999
2016
40%
17%
16%
11%
16%
Mixed
58%
26%
8%
5% 4%
Primary
57%
15%
8%
5%
15%
Secondary
-
5,000
10,000
15,000
20,000
25,000
FTE
Job
s
Year Saltwater (sea fish) Salmon & other freshwater
0
100
200
300
400
500
600
No.
of
site
s &
ave
rage
no.
of
FTE
s pe
r si
te
Year Sites Average FTE per Site
181
73
47
30
45 1-10
11-25
26-50
51-100
100+
FTE Bands
955 1,280
1,707
2,382
11,675
1-10
11-25
26-50
51-100
100+
FTE Bands
282
124
61 51
43
208
95
54 48 41
169
88
58 49
41
186
76
50 38
51
181
73
47
30 45
0
50
100
150
200
250
300
1-10 11-25 26-50 51-100 100+
No.
of S
ites
Sites by FTE Size Bands
2008
2010
2012
2014
2016
12,438 11,656
11,052
12,452 11,586
3,950
2,105 1,959 2,146 2,031
3,992 4,621 5,274
4,006 4,383
-
2,000
4,000
6,000
8,000
10,000
12,000
14,000
2008 2010 2012 2014 2016
Full
Tim
e Eq
uiva
lent
(FT
E) E
mpl
oyee
s
Year
Mixed Processors
Primary Processors
Secondary Processors
0%
10%
20%
30%
40%
50%
60%
70%
80%
90%
100%
% o
f Site
s
100+
51-100
26-50
11-25
1-10
FTE Bands
88
49
97
28
74
95
62 56
11
78
33
87
18
60
74
48 40
7
68
31
77
19
56
68
46
34
5
59
34
75
15
48
74
53
40
59
30
61
15
42
63
53
43
10
0
20
40
60
80
100
120
No
. of S
ites
Region
2008
2010
2012
2014
2016
3,9
35
1,8
52
4,6
17
553
2,1
54
3,7
19
1,7
66
1,6
87
108
3,7
08
1,5
07
1,33
9
4,5
03
4,26
5
339
3
61
2,1
07 2,49
9
4,1
06
3,72
2
1,6
66
862 1
,107
83
5
3
3,8
82
3,80
3
1,2
74
4,4
90
418
1,4
01
3,6
28
2,0
84
1,80
9
1,4
04
3,7
66
1,1
34
4,9
22
372
1,3
32
3,4
80
1,6
13
1,3
30
51
-
1,000
2,000
3,000
4,000
5,000
6,000
Grampian Highlandsand Islands
Humberside N. Ireland NorthEngland
OtherScotland
S W England South/Midlands
Wales
Grampian Highlandsand Islands
Humberside N. Ireland NorthEngland
OtherScotland
S W England South/Midlands
Wales
FTE
jobs
Region
2008
2010
2012
2014
2016
561
36
2008
446
43
2010
405
46
2012
401
46
2014
376
48
2016
15,714
4,681
20,395
2008
14,104
5,029
19,133
2010
14,299
4,419
18,718
2012
13,407
5,201
18,608
2014
13,554
4,445
17,999
2016
40%
17%
16%
11%
16%
Mixed
58%
26%
8%
5% 4%
Primary
57%
15%
8%
5%
15%
Secondary
-
5,000
10,000
15,000
20,000
25,000
FTE
Job
s
Year Saltwater (sea fish) Salmon & other freshwater
0
100
200
300
400
500
600
No.
of
site
s &
ave
rage
no.
of
FTE
s pe
r si
te
Year Sites Average FTE per Site
181
73
47
30
45 1-10
11-25
26-50
51-100
100+
FTE Bands
955 1,280
1,707
2,382
11,675
1-10
11-25
26-50
51-100
100+
FTE Bands
282
124
61 51
43
208
95
54 48 41
169
88
58 49
41
186
76
50 38
51
181
73
47
30 45
0
50
100
150
200
250
300
1-10 11-25 26-50 51-100 100+
No.
of S
ites
Sites by FTE Size Bands
2008
2010
2012
2014
2016
12,438 11,656
11,052
12,452 11,586
3,950
2,105 1,959 2,146 2,031
3,992 4,621 5,274
4,006 4,383
-
2,000
4,000
6,000
8,000
10,000
12,000
14,000
2008 2010 2012 2014 2016
Full
Tim
e Eq
uiva
lent
(FT
E) E
mpl
oyee
s
Year
Mixed Processors
Primary Processors
Secondary Processors
0%
10%
20%
30%
40%
50%
60%
70%
80%
90%
100%
% o
f Site
s
100+
51-100
26-50
11-25
1-10
FTE Bands
88
49
97
28
74
95
62 56
11
78
33
87
18
60
74
48 40
7
68
31
77
19
56
68
46
34
5
59
34
75
15
48
74
53
40
59
30
61
15
42
63
53
43
10
0
20
40
60
80
100
120
No
. of S
ites
Region
2008
2010
2012
2014
2016
3,9
35
1,8
52
4,6
17
553
2,1
54
3,7
19
1,7
66
1,6
87
108
3,7
08
1,5
07
1,33
9
4,5
03
4,26
5
339
3
61
2,1
07 2,49
9
4,1
06
3,72
2
1,6
66
862 1
,107
83
5
3
3,8
82
3,80
3
1,2
74
4,4
90
418
1,4
01
3,6
28
2,0
84
1,80
9
1,4
04
3,7
66
1,1
34
4,9
22
372
1,3
32
3,4
80
1,6
13
1,3
30
51
-
1,000
2,000
3,000
4,000
5,000
6,000
Grampian Highlandsand Islands
Humberside N. Ireland NorthEngland
OtherScotland
S W England South/Midlands
Wales
Grampian Highlandsand Islands
Humberside N. Ireland NorthEngland
OtherScotland
S W England South/Midlands
Wales
FTE
jobs
Region
2008
2010
2012
2014
2016
282
124
61 51
43
208
95
54 48 41
169
88
58 49
41
186
76
50 38
51
181
73
47
30 45
0
50
100
150
200
250
300
1-10 11-25 26-50 51-100 100+
No.
of
site
s
Sites by FTE Size Bands
2008
2010
2012
2014
2016
11
1. Fish Processing: Industry Structure & Employment
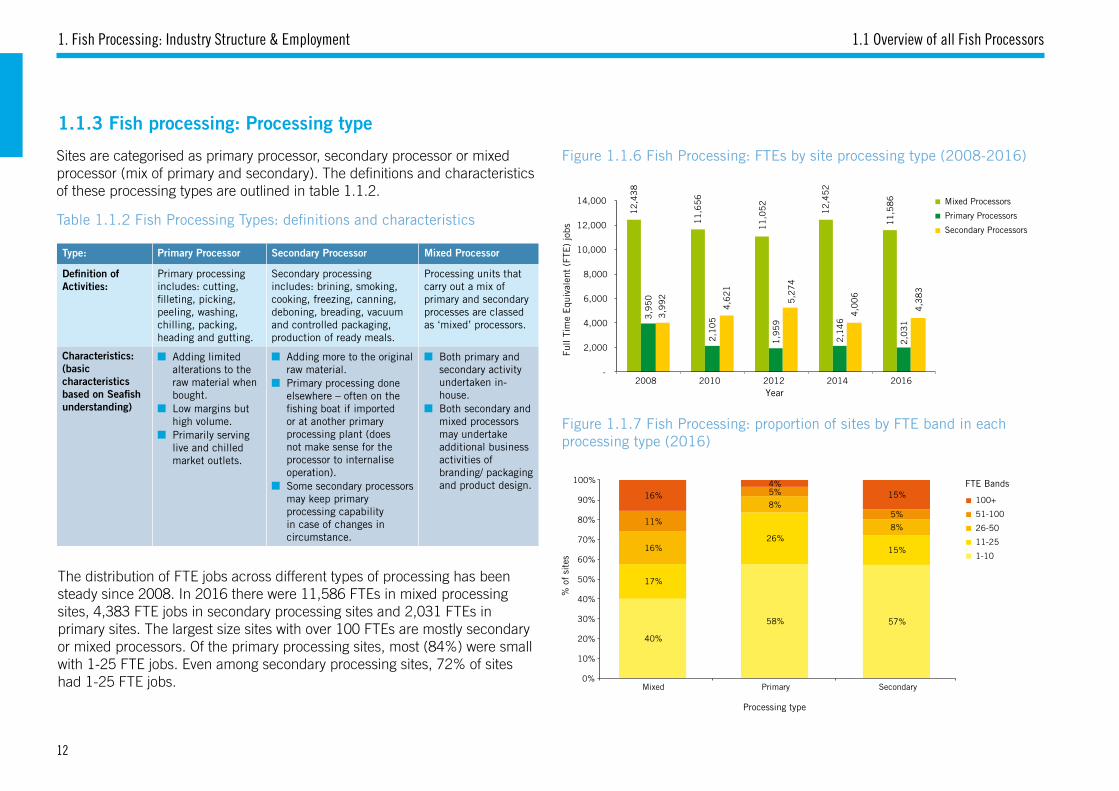
1.1.3 Fish processing: Processing type
Type: Primary Processor Secondary Processor Mixed Processor
Definition of Activities:
Primary processing includes: cutting, filleting, picking, peeling, washing, chilling, packing, heading and gutting.
Secondary processing includes: brining, smoking, cooking, freezing, canning, deboning, breading, vacuum and controlled packaging, production of ready meals.
Processing units that carry out a mix of primary and secondary processes are classed as ‘mixed’ processors.
Characteristics:(basic characteristics based on Seafish understanding)
■ Adding limited alterations to the raw material when bought.
■ Low margins but high volume.
■ Primarily serving live and chilled market outlets.
■ Adding more to the original raw material.
■ Primary processing done elsewhere – often on the fishing boat if imported or at another primary processing plant (does not make sense for the processor to internalise operation).
■ Some secondary processors may keep primary processing capability in case of changes in circumstance.
■ Both primary and secondary activity undertaken in-house.
■ Both secondary and mixed processors may undertake additional business activities of branding/ packaging and product design.
Table 1.1.2 Fish Processing Types: definitions and characteristics
Figure 1.1.6 Fish Processing: FTEs by site processing type (2008-2016)
Figure 1.1.7 Fish Processing: proportion of sites by FTE band in each processing type (2016)
Sites are categorised as primary processor, secondary processor or mixed processor (mix of primary and secondary). The definitions and characteristics of these processing types are outlined in table 1.1.2.
The distribution of FTE jobs across different types of processing has been steady since 2008. In 2016 there were 11,586 FTEs in mixed processing sites, 4,383 FTE jobs in secondary processing sites and 2,031 FTEs in primary sites. The largest size sites with over 100 FTEs are mostly secondary or mixed processors. Of the primary processing sites, most (84%) were small with 1-25 FTE jobs. Even among secondary processing sites, 72% of sites had 1-25 FTE jobs.
1.1 Overview of all Fish Processors
12
,43
8
11
,65
6
11
,05
2
12
,45
2
11
,58
6
3,9
50
2,1
05
1,9
59
2,1
46
2,0
31
3,9
92
4,6
21
5,2
74
4,0
06
4,3
83
-
2,000
4,000
6,000
8,000
10,000
12,000
14,000
2008 2010 2012 2014 2016
Full
Tim
e E
quiv
alen
t (F
TE)
jobs
Year
Mixed Processors
Primary Processors
Secondary Processors
40%
17%
16%
11%
16%
Mixed
58%
26%
8%
5% 4%
Primary
57%
15%
8%
5%
15%
Secondary 0%
10%
20%
30%
40%
50%
60%
70%
80%
90%
100%
% o
f si
tes
Processing type
100+
51-100
26-50
11-25
1-10
FTE Bands
12
Seafood Processing Industry Report 2016
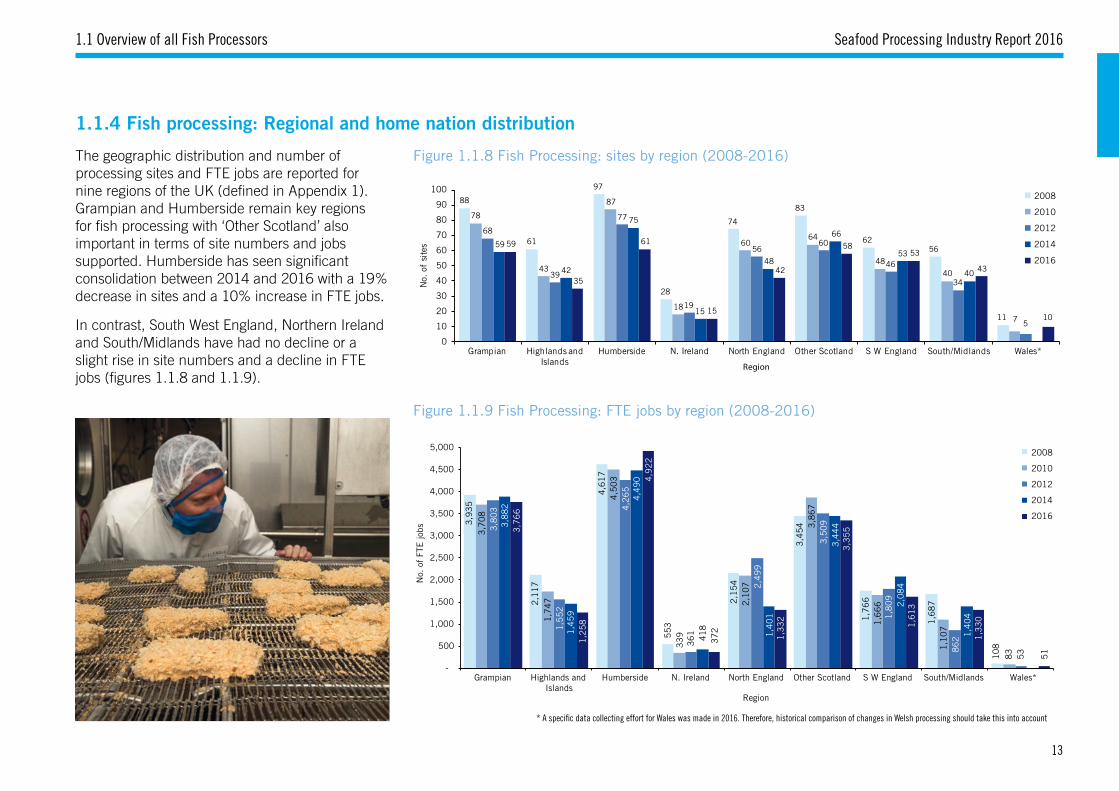
1.1.4 Fish processing: Regional and home nation distribution
Figure 1.1.8 Fish Processing: sites by region (2008-2016)
Figure 1.1.9 Fish Processing: FTE jobs by region (2008-2016)
The geographic distribution and number of processing sites and FTE jobs are reported for nine regions of the UK (defined in Appendix 1). Grampian and Humberside remain key regions for fish processing with ‘Other Scotland’ also important in terms of site numbers and jobs supported. Humberside has seen significant consolidation between 2014 and 2016 with a 19% decrease in sites and a 10% increase in FTE jobs.
In contrast, South West England, Northern Ireland and South/Midlands have had no decline or a slight rise in site numbers and a decline in FTE jobs (figures 1.1.8 and 1.1.9).
1.1 Overview of all Fish Processors
2008
2010
2012
2014
2016
88
61
97
28
74
83
6256
11
78
43
87
18
6064
48
40
7
68
39
77
19
5660
46
34
5
59
42
75
15
48
66
53
40
59
35
61
15
42
5853
43
10
0
10
20
30
40
50
60
70
80
90
100
Grampian Highlands and Islands
Humberside N. Ireland North England Other Scotland S W England South/Midlands Wales*
No.
of
site
s
Region
2008
2010
2012
2014
2016
3,9
35
2,1
17
4,6
17
553
2,1
54
3,4
54
1,7
66
1,6
87
108
3,7
08
1,7
47
4,5
03
339
2,1
07
3,8
67
1,6
66
1,1
07
83
3,8
03
1,5
52
4,2
65
361
2,4
99
3,5
09
1,8
09
862
53
3,8
82
1,4
59
4,4
90
418
1,4
01
3,4
44
2,0
84
1,4
04
3,7
66
1,2
58
4,9
22
372
1,3
32
3,3
55
1,6
13
1,3
30
51
-
500
1,000
1,500
2,000
2,500
3,000
3,500
4,000
4,500
5,000
Grampian Highlands and Islands
Humberside N. Ireland North England Other Scotland S W England South/Midlands Wales*
Region
No.
of
FTE
jobs
* A specific data collecting effort for Wales was made in 2016. Therefore, historical comparison of changes in Welsh processing should take this into account
13
1. Fish Processing: Industry Structure & Employment 1.1 Overview of all Fish Processors
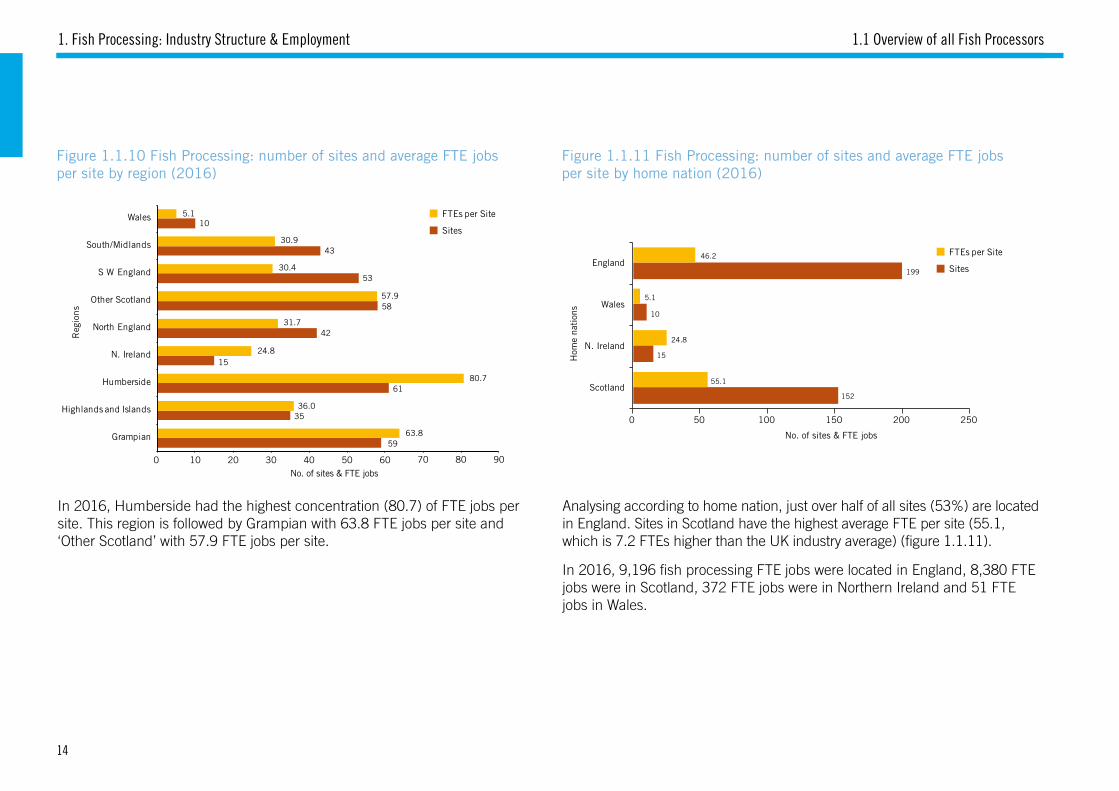
Figure 1.1.10 Fish Processing: number of sites and average FTE jobs per site by region (2016)
Figure 1.1.11 Fish Processing: number of sites and average FTE jobs per site by home nation (2016)
In 2016, Humberside had the highest concentration (80.7) of FTE jobs per site. This region is followed by Grampian with 63.8 FTE jobs per site and ‘Other Scotland’ with 57.9 FTE jobs per site.
Analysing according to home nation, just over half of all sites (53%) are located in England. Sites in Scotland have the highest average FTE per site (55.1, which is 7.2 FTEs higher than the UK industry average) (figure 1.1.11).
In 2016, 9,196 fish processing FTE jobs were located in England, 8,380 FTE jobs were in Scotland, 372 FTE jobs were in Northern Ireland and 51 FTE jobs in Wales.
Sites
FTEs per Site
59
35
61
15
42
58
53
43
10
63.8
36.0
80.7
24.8
31.7
57.9
30.4
30.9
5.1
0 10 20 30 40 50 60 70 80 90
Grampian
Highlands and Islands
Humberside
N. Ireland
North England
Other Scotland
S W England
South/Midlands
Wales
No. of sites & FTE jobs
Reg
ions
144
87
55
23
109
49
11
59
30
61
15
42
63
53
43
10
63.8
37.8
80.7
24.8
31.7
55.2
30.4
30.9
5.1
0 10 20 30 40 50 60 70 80 90
Grampian
Highlands and Islands
Humberside
N. Ireland
North England
Other Scotland
S W England
South/Midlands
Wales
No. of sites & FTE jobs
Reg
ions
152
15
10
199
55.1
24.8
5.1
46.2
0 50 100 150 200 250
Scotland
N. Ireland
Wales
England
No. of sites & FTE jobs
No.of FTE jobs
No.of FTE jobs
Hom
e na
tion
s
60 5763
69 69
78
88
70 75
64
0
20
40
60
80
100
2008 2010 2012 2014 2016
No.
of
site
s &
ave
rage
no.
of
FTE
s pe
r si
te
No.
of
site
s &
ave
rage
no.
of
FTE
s pe
r si
te
Year
Year
Em
ploy
men
t
Year
Year
Year
Year
0
10
20
30
40
50
60
70
80
2008 2010 2012 2014 2016
No.
of
Sit
es
No.
of
Sit
es
No.
of
Sit
es
No.
of
Sit
es
No.
of
Sit
esN
o. o
f S
ites
No.
of
Sit
es &
No.
of
Sta
ff
Year
4,022 4,0193,509
4,3133,866
387 404479
536374
258515
368
352
205
0
1,000
2,000
3,000
4,000
5,000
6,000
2008 2010 2012 2014 2016
FTE
Job
s
Year
501
389
342 332307
31 36 42 40 44
0
100
200
300
400
500
600
2008 2010 2012 2014 2016
Year
33 29 30 35 31
265
192
151159
151
10889
7665 6053 46 47 43 4342
33 3830
22
0
50
100
150
200
250
300
2008 2010 2012 2014 2016
Year
2,000 4,000 6,000 8,000 10,000 12,000 14,000 16,000
7,500 1,432 1,767 1,985 3,030 2008
7,660 992 1,432 1,705 2,315 2010
7,739 771 1,234 1,783 2,772 2012
7,722 797 1,130 1,501 2,258 2014
8,341 801 1,054 1,557 1,802 2016
No. of FTE jobs
No. of FTE jobs
100+
1-10
11-25
26-50
51-100
210227
64
186
122
48
175
107
43
186
97
48
166
99
42
0
0
0
50
100
150
200
250
Mixed Primary Secondary
Processor Type
2,000 4,000 6,000 8,000 10,000 12,000 14,000 16,000
8,417 3,563 3,734 2008
7,637 1,701 4,107 2010
7,543 1,480 4,906 2012
8,139 1,610 3,654 2014
7,719 1,657 4,178 2016 Mixed
Primary
Secondary
128
231
14
126
103
194
11
7892
154
11
8077
159
15
8164
151
13
79
0
50
100
150
200
250
Demersal Mixed Species Pelagic Shellfish
Sea Fish Species Category
- 2,000 4,000 6,000 8,000 10,000 12,000 14,000 16,000
1,950 9,392 870 3,494 2008
1,658 9,258 633 2,522 2010
1,445 9,207 822 2,5352012
875 7,237 1,412 3,8832014
928 7,491 1,184 3,9502016Demersal
Mixed Species
Pelagic
Shellfish
0
20
40
60
80
100
120
140
160
Demersal Pelagic Shellfish Saltwater Exotic
Salmon Trout Other Freshwater
Demersal
Pelagic
Shellfish
Saltwater Exotic
Salmon
Trout
Other Freshwater
81
39
92
26
69 6761
54
11
72
24
84
18
57
44 4438
7
63
22
72
17
50
40 42
30
5
55
22
72
15
4146 45
34
56
17
57
14
36 3844
35
10
0
10
20
30
40
50
60
70
80
90
100
Region
2008
2010
2012
2014
2016
2008
2010
2012
2014
2016
2008
2010
2012
2014
2016
0 2,000 4,000 6,000 8,000 10,000 12,000 14,000 16,000
3,088 686 4,452 529 1,867 1,691 1,677 1,612 2008
3,233 506 4,296 339 1,913 1,322 1,306 1,101 2010
3,667 474 4,115 336 2,226 1,120 1,522 782 2012
3,209 439 4,110 418 1,061 1,070 1,841 1,238 2014
3,439 446 4,817 371 1,008 888 1,410 1,123 2016
Grampian
Highlands and Islands
Humberside
N. Ireland
North England
Other Scotland
S W England
South/Midlands
Wales
532730
13,558
14,820
684668
13,616
14,968
889
958
12,559
14,406
644653
12,898
14,195
-
2,000
4,000
6,000
8,000
10,000
12,000
14,000
16,000
18,000
2010 2012 2014 2016
Full-Time
Seasonal
Part-Time
64
15.111.4
36.2
53
18.9
12.6
42.3
69
15.3 13.9
51.7
47
16.913.9
49.8
0
10
20
30
40
50
60
70
80
No. of sites employing seasonal
staff
Average seasonal staff weeks
Average seasonal staff
Average total employment
2010
2012
2014
2016
100+
1-10
11-25
26-50
51-100
FTE Bands
100+
1-10
11-25
26-50
51-100
FTE Bands
Mixed
Primary
Secondary
Sites
Average FTE per Site
Sites
Average FTE per Site
Sites
Sites
FTEs per Site
FTEs per Site
14
Seafood Processing Industry Report 2016
1.2 OVERVIEW OF SALMON & FRESHWATER FISH PROCESSORS
1.2 Overview of Salmon & Freshwater Fish Processors
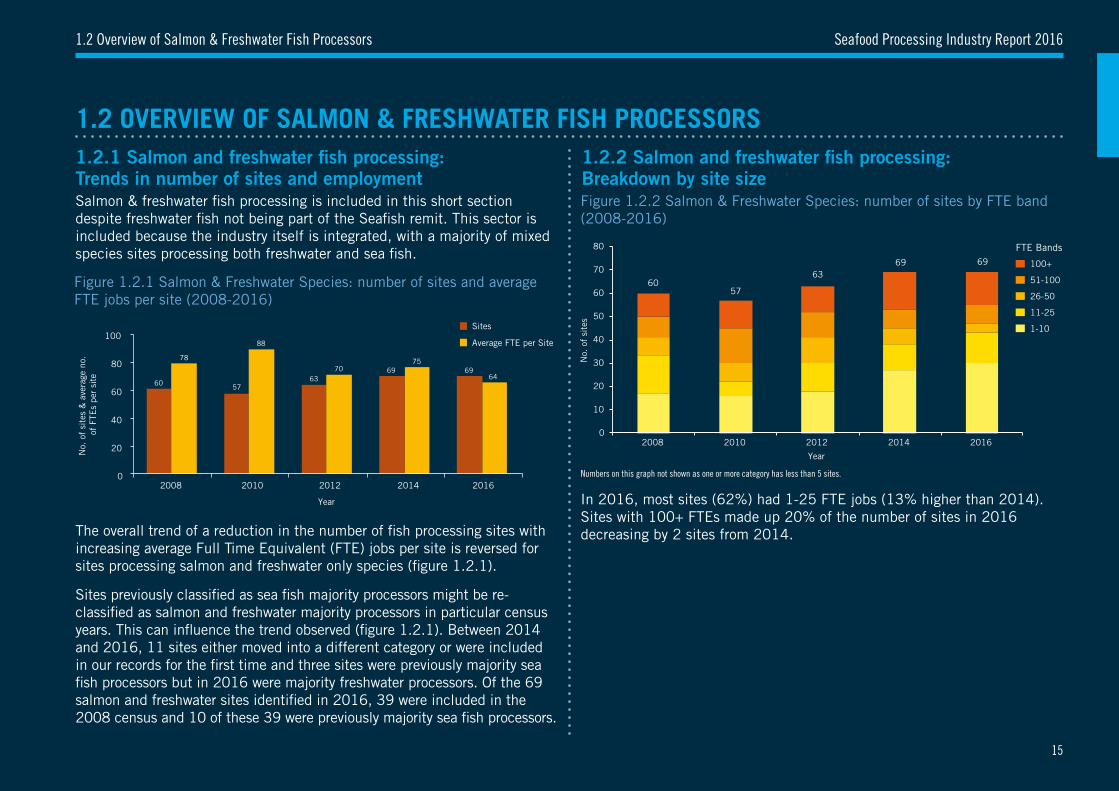
1.2.1 Salmon and freshwater fish processing: Trends in number of sites and employment
The overall trend of a reduction in the number of fish processing sites with increasing average Full Time Equivalent (FTE) jobs per site is reversed for sites processing salmon and freshwater only species (figure 1.2.1).
Sites previously classified as sea fish majority processors might be re-classified as salmon and freshwater majority processors in particular census years. This can influence the trend observed (figure 1.2.1). Between 2014 and 2016, 11 sites either moved into a different category or were included in our records for the first time and three sites were previously majority sea fish processors but in 2016 were majority freshwater processors. Of the 69 salmon and freshwater sites identified in 2016, 39 were included in the 2008 census and 10 of these 39 were previously majority sea fish processors.
In 2016, most sites (62%) had 1-25 FTE jobs (13% higher than 2014). Sites with 100+ FTEs made up 20% of the number of sites in 2016 decreasing by 2 sites from 2014.
Figure 1.2.1 Salmon & Freshwater Species: number of sites and average FTE jobs per site (2008-2016)
144
87
55
23
109
49
11
59
30
61
15
42
63
53
43
10
63.8
37.8
80.7
24.8
31.7
55.2
30.4
30.9
5.1
0 10 20 30 40 50 60 70 80 90
Grampian
Highlands and Islands
Humberside
N. Ireland
North England
Other Scotland
S W England
South/Midlands
Wales
No. of sites & FTE jobs
Reg
ions
152
15
10
199
55.1
24.8
5.1
46.2
0 50 100 150 200 250
Scotland
N. Ireland
Wales
England
No. of sites & FTE jobs
No.of FTE jobs
No.of FTE jobs
Hom
e na
tion
s
60 5763
69 69
78
88
70 75
64
0
20
40
60
80
100
2008 2010 2012 2014 2016
No.
of
site
s &
ave
rage
no.
of
FTE
s pe
r si
te
No.
of
site
s &
ave
rage
no.
of
FTE
s pe
r si
te
Year
Year
Em
ploy
men
t
Year
Year
Year
Year
0
10
20
30
40
50
60
70
80
2008 2010 2012 2014 2016
No.
of
Sit
es
No.
of
Sit
es
No.
of
Sit
es
No.
of
Sit
es
No.
of
Sit
esN
o. o
f S
ites
No.
of
Sit
es &
No.
of
Sta
ff
Year
4,022 4,0193,509
4,3133,866
387 404479
536374
258515
368
352
205
0
1,000
2,000
3,000
4,000
5,000
6,000
2008 2010 2012 2014 2016
FTE
Job
s
Year
501
389
342 332307
31 36 42 40 44
0
100
200
300
400
500
600
2008 2010 2012 2014 2016
Year
33 29 30 35 31
265
192
151159
151
10889
7665 6053 46 47 43 4342
33 3830
22
0
50
100
150
200
250
300
2008 2010 2012 2014 2016
Year
2,000 4,000 6,000 8,000 10,000 12,000 14,000 16,000
7,500 1,432 1,767 1,985 3,030 2008
7,660 992 1,432 1,705 2,315 2010
7,739 771 1,234 1,783 2,772 2012
7,722 797 1,130 1,501 2,258 2014
8,341 801 1,054 1,557 1,802 2016
No. of FTE jobs
No. of FTE jobs
100+
1-10
11-25
26-50
51-100
210227
64
186
122
48
175
107
43
186
97
48
166
99
42
0
0
0
50
100
150
200
250
Mixed Primary Secondary
Processor Type
2,000 4,000 6,000 8,000 10,000 12,000 14,000 16,000
8,417 3,563 3,734 2008
7,637 1,701 4,107 2010
7,543 1,480 4,906 2012
8,139 1,610 3,654 2014
7,719 1,657 4,178 2016 Mixed
Primary
Secondary
128
231
14
126
103
194
11
7892
154
11
8077
159
15
8164
151
13
79
0
50
100
150
200
250
Demersal Mixed Species Pelagic Shellfish
Sea Fish Species Category
- 2,000 4,000 6,000 8,000 10,000 12,000 14,000 16,000
1,950 9,392 870 3,494 2008
1,658 9,258 633 2,522 2010
1,445 9,207 822 2,5352012
875 7,237 1,412 3,8832014
928 7,491 1,184 3,9502016Demersal
Mixed Species
Pelagic
Shellfish
0
20
40
60
80
100
120
140
160
Demersal Pelagic Shellfish Saltwater Exotic
Salmon Trout Other Freshwater
Demersal
Pelagic
Shellfish
Saltwater Exotic
Salmon
Trout
Other Freshwater
81
39
92
26
69 6761
54
11
72
24
84
18
57
44 4438
7
63
22
72
17
50
40 42
30
5
55
22
72
15
4146 45
34
56
17
57
14
36 3844
35
10
0
10
20
30
40
50
60
70
80
90
100
Region
2008
2010
2012
2014
2016
2008
2010
2012
2014
2016
2008
2010
2012
2014
2016
0 2,000 4,000 6,000 8,000 10,000 12,000 14,000 16,000
3,088 686 4,452 529 1,867 1,691 1,677 1,612 2008
3,233 506 4,296 339 1,913 1,322 1,306 1,101 2010
3,667 474 4,115 336 2,226 1,120 1,522 782 2012
3,209 439 4,110 418 1,061 1,070 1,841 1,238 2014
3,439 446 4,817 371 1,008 888 1,410 1,123 2016
Grampian
Highlands and Islands
Humberside
N. Ireland
North England
Other Scotland
S W England
South/Midlands
Wales
532730
13,558
14,820
684668
13,616
14,968
889
958
12,559
14,406
644653
12,898
14,195
-
2,000
4,000
6,000
8,000
10,000
12,000
14,000
16,000
18,000
2010 2012 2014 2016
Full-Time
Seasonal
Part-Time
64
15.111.4
36.2
53
18.9
12.6
42.3
69
15.3 13.9
51.7
47
16.913.9
49.8
0
10
20
30
40
50
60
70
80
No. of sites employing seasonal
staff
Average seasonal staff weeks
Average seasonal staff
Average total employment
2010
2012
2014
2016
100+
1-10
11-25
26-50
51-100
FTE Bands
100+
1-10
11-25
26-50
51-100
FTE Bands
Mixed
Primary
Secondary
Sites
Average FTE per Site
Sites
Average FTE per Site
Sites
Sites
FTEs per Site
FTEs per Site
100+
1-10
11-25
26-50
51-100
FTE Bands
0
10
20
30
40
50
60
70
80
2008 2010 2012 2014 2016
No.
of
site
s
Year
5760
6369 69
Salmon & freshwater fish processing is included in this short section despite freshwater fish not being part of the Seafish remit. This sector is included because the industry itself is integrated, with a majority of mixed species sites processing both freshwater and sea fish.
Figure 1.2.2 Salmon & Freshwater Species: number of sites by FTE band (2008-2016)
1.2.2 Salmon and freshwater fish processing: Breakdown by site size
Numbers on this graph not shown as one or more category has less than 5 sites.
15
1. Fish Processing: Industry Structure & Employment
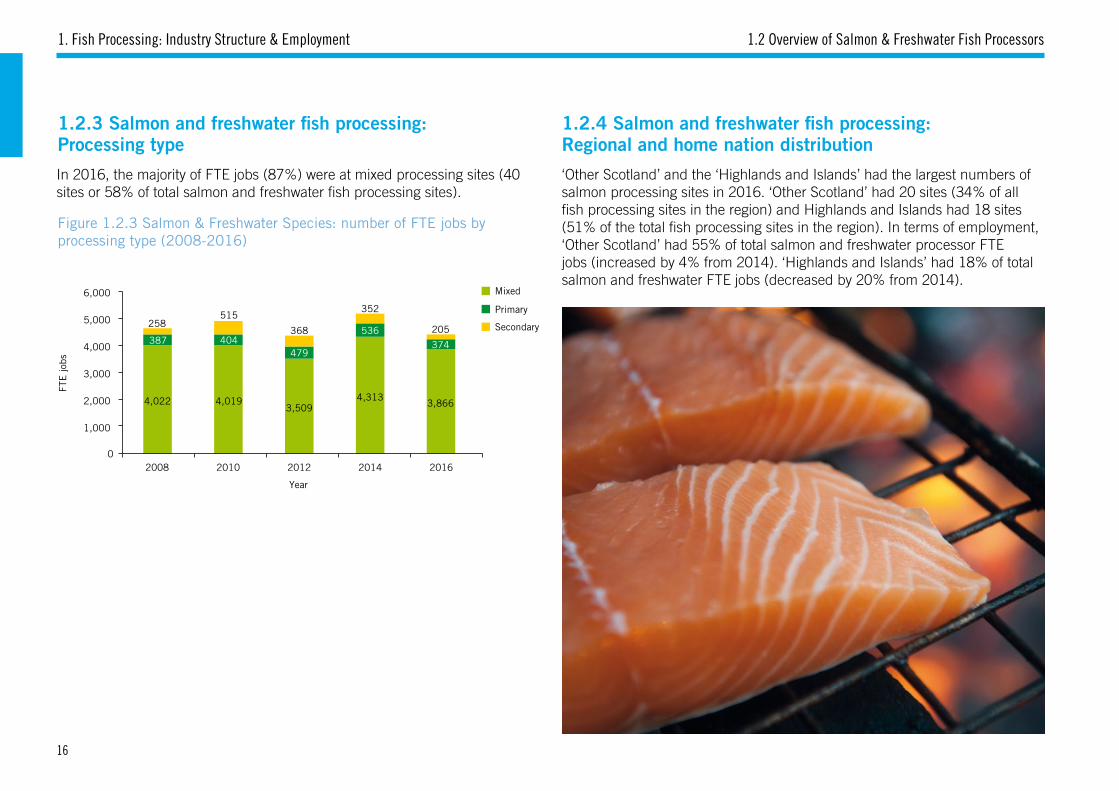
Figure 1.2.3 Salmon & Freshwater Species: number of FTE jobs by processing type (2008-2016)
1.2 Overview of Salmon & Freshwater Fish Processors
1.2.3 Salmon and freshwater fish processing: Processing type
1.2.4 Salmon and freshwater fish processing: Regional and home nation distribution
In 2016, the majority of FTE jobs (87%) were at mixed processing sites (40 sites or 58% of total salmon and freshwater fish processing sites).
4,022 4,0193,509
4,3133,866
387 404479
536374
258515
368
352
205
0
1,000
2,000
3,000
4,000
5,000
6,000
2008 2010 2012 2014 2016
FTE
jobs
Year
Mixed
Primary
Secondary
‘Other Scotland’ and the ‘Highlands and Islands’ had the largest numbers of salmon processing sites in 2016. ‘Other Scotland’ had 20 sites (34% of all fish processing sites in the region) and Highlands and Islands had 18 sites (51% of the total fish processing sites in the region). In terms of employment, ‘Other Scotland’ had 55% of total salmon and freshwater processor FTE jobs (increased by 4% from 2014). ‘Highlands and Islands’ had 18% of total salmon and freshwater FTE jobs (decreased by 20% from 2014).
16
Seafood Processing Industry Report 20161.3 Overview of Sea Fish Processors
No.
of
site
s &
ave
rage
no.
of
FTE
s pe
r si
te
501
389
342 332307
31 36 42 40 44
0
100
200
300
400
500
600
2008 2010 2012 2014 2016
Year
Sites
Average FTE per site
1.3 OVERVIEW OF SEA FISH PROCESSORS
Figure 1.3.1 Sea Fish Processing: number of sites & average FTE jobs per site (2008-2016)
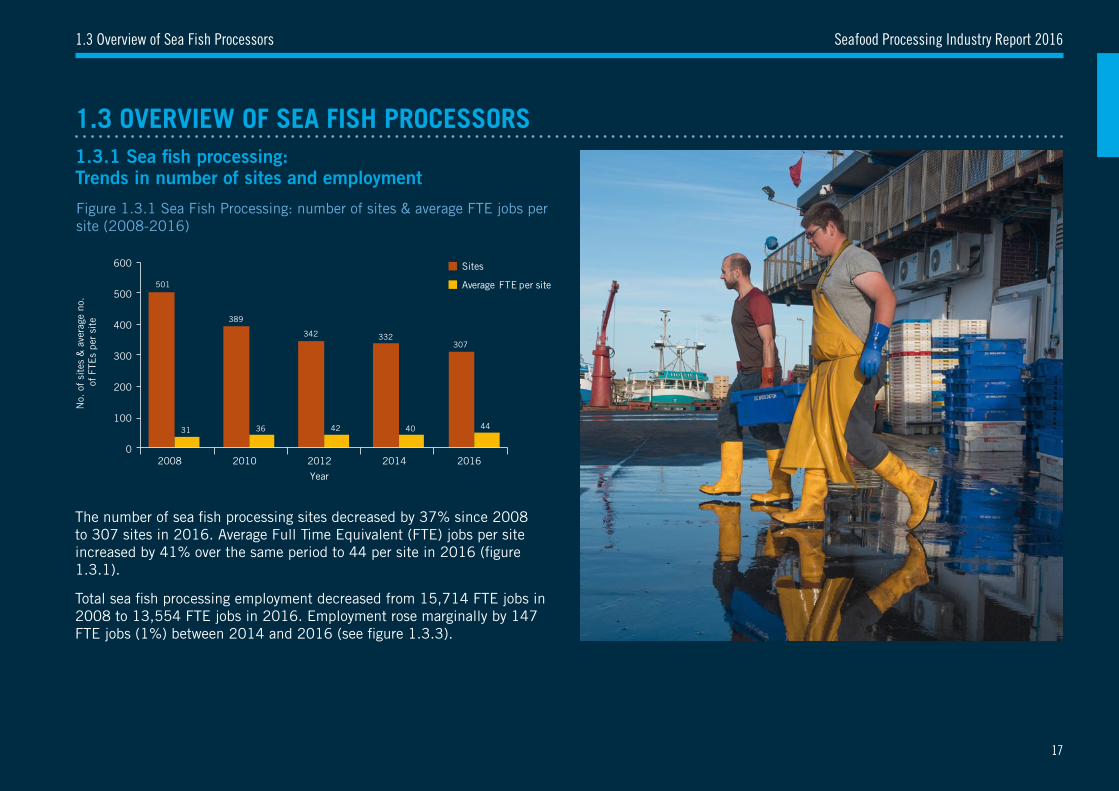
The number of sea fish processing sites decreased by 37% since 2008 to 307 sites in 2016. Average Full Time Equivalent (FTE) jobs per site increased by 41% over the same period to 44 per site in 2016 (figure 1.3.1).
Total sea fish processing employment decreased from 15,714 FTE jobs in 2008 to 13,554 FTE jobs in 2016. Employment rose marginally by 147 FTE jobs (1%) between 2014 and 2016 (see figure 1.3.3).
1.3.1 Sea fish processing: Trends in number of sites and employment
17
1. Fish Processing: Industry Structure & Employment 1.3 Overview of Sea Fish Processors
1.3.2 Sea fish processing: Breakdown by site size
Figure 1.3.2 Sea Fish Processing: number of sites by FTE band (2008-2016)
Figure 1.3.3 Sea Fish Processing: number of FTEs by FTE band (2008-2016)
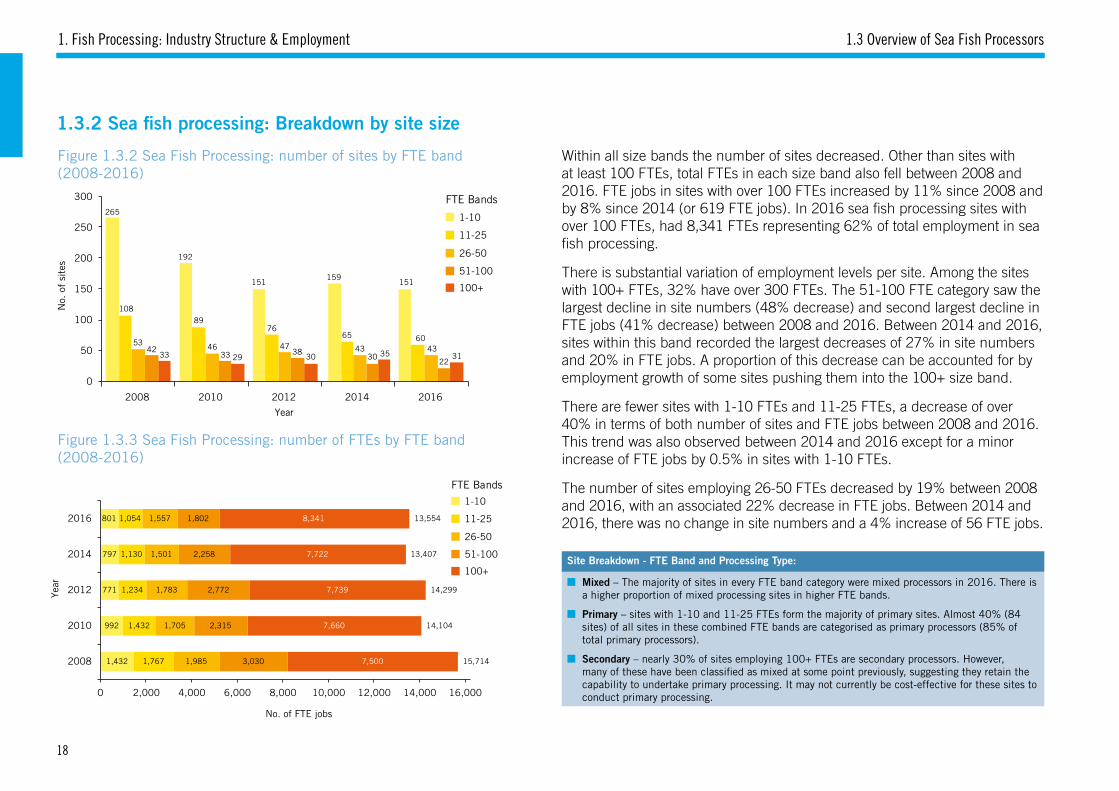
Within all size bands the number of sites decreased. Other than sites with at least 100 FTEs, total FTEs in each size band also fell between 2008 and 2016. FTE jobs in sites with over 100 FTEs increased by 11% since 2008 and by 8% since 2014 (or 619 FTE jobs). In 2016 sea fish processing sites with over 100 FTEs, had 8,341 FTEs representing 62% of total employment in sea fish processing.
There is substantial variation of employment levels per site. Among the sites with 100+ FTEs, 32% have over 300 FTEs. The 51-100 FTE category saw the largest decline in site numbers (48% decrease) and second largest decline in FTE jobs (41% decrease) between 2008 and 2016. Between 2014 and 2016, sites within this band recorded the largest decreases of 27% in site numbers and 20% in FTE jobs. A proportion of this decrease can be accounted for by employment growth of some sites pushing them into the 100+ size band.
There are fewer sites with 1-10 FTEs and 11-25 FTEs, a decrease of over 40% in terms of both number of sites and FTE jobs between 2008 and 2016. This trend was also observed between 2014 and 2016 except for a minor increase of FTE jobs by 0.5% in sites with 1-10 FTEs.
The number of sites employing 26-50 FTEs decreased by 19% between 2008 and 2016, with an associated 22% decrease in FTE jobs. Between 2014 and 2016, there was no change in site numbers and a 4% increase of 56 FTE jobs.
Site Breakdown - FTE Band and Processing Type:
■ Mixed – The majority of sites in every FTE band category were mixed processors in 2016. There is a higher proportion of mixed processing sites in higher FTE bands.
■ Primary – sites with 1-10 and 11-25 FTEs form the majority of primary sites. Almost 40% (84 sites) of all sites in these combined FTE bands are categorised as primary processors (85% of total primary processors).
■ Secondary – nearly 30% of sites employing 100+ FTEs are secondary processors. However, many of these have been classified as mixed at some point previously, suggesting they retain the capability to undertake primary processing. It may not currently be cost-effective for these sites to conduct primary processing.
No.
of
site
s
33 29 30 35 31
265
192
151159
151
10889
7665 6053 46 47 43 4342
33 3830
22
0
50
100
150
200
250
300
2008 2010 2012 2014 2016
Year
100+
1-10
11-25
26-50
51-100
FTE Bands
Year
2,000 4,000 6,000 8,000 10,000 12,000 14,000 16,000
7,500 1,432 1,767 1,985 3,030 2008
7,660 992 1,432 1,705 2,315 2010
7,739 771 1,234 1,783 2,772 2012
7,722 797 1,130 1,501 2,258 2014
8,341 801 1,054 1,557 1,802
15,714
14,104
14,299
13,407
13,5542016
No. of FTE jobs
100+
1-10
11-25
26-50
51-100
0
FTE Bands
18
Seafood Processing Industry Report 20161.3 Overview of Sea Fish Processors
1.3.3 Sea fish processing: Processing type
Figure 1.3.4 Sea Fish Processing: number of sites by processing type (2008-2016)
Figure 1.3.5 Sea Fish Processing: number of FTE jobs by processing type (2008-2016)
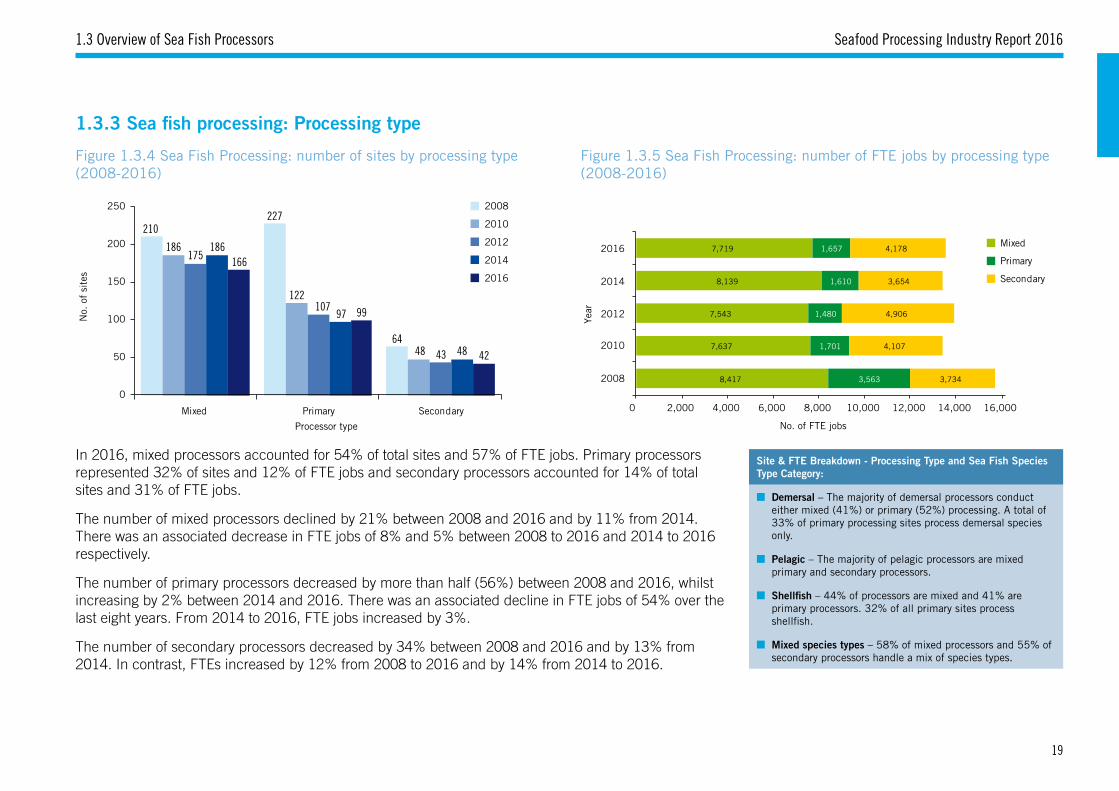
In 2016, mixed processors accounted for 54% of total sites and 57% of FTE jobs. Primary processors represented 32% of sites and 12% of FTE jobs and secondary processors accounted for 14% of total sites and 31% of FTE jobs.
The number of mixed processors declined by 21% between 2008 and 2016 and by 11% from 2014. There was an associated decrease in FTE jobs of 8% and 5% between 2008 to 2016 and 2014 to 2016 respectively.
The number of primary processors decreased by more than half (56%) between 2008 and 2016, whilst increasing by 2% between 2014 and 2016. There was an associated decline in FTE jobs of 54% over the last eight years. From 2014 to 2016, FTE jobs increased by 3%.
The number of secondary processors decreased by 34% between 2008 and 2016 and by 13% from 2014. In contrast, FTEs increased by 12% from 2008 to 2016 and by 14% from 2014 to 2016.
Site & FTE Breakdown - Processing Type and Sea Fish Species Type Category:
■ Demersal – The majority of demersal processors conduct either mixed (41%) or primary (52%) processing. A total of 33% of primary processing sites process demersal species only.
■ Pelagic – The majority of pelagic processors are mixed primary and secondary processors.
■ Shellfish – 44% of processors are mixed and 41% are primary processors. 32% of all primary sites process shellfish.
■ Mixed species types – 58% of mixed processors and 55% of secondary processors handle a mix of species types.
No.
of
site
s
210227
64
186
122
48
175
107
43
186
97
48
166
99
42
0
50
100
150
200
250
Mixed Primary Secondary
Processor type
2008
2010
2012
2014
2016
144
87
55
23
109
49
11
59
30
61
15
42
63
53
43
10
63.8
37.8
80.7
24.8
31.7
55.2
30.4
30.9
5.1
0 10 20 30 40 50 60 70 80 90
Grampian
Highlands and Islands
Humberside
N. Ireland
North England
Other Scotland
S W England
South/Midlands
Wales
No. of sites & FTE jobs
Reg
ions
152
15
10
199
55.1
24.8
5.1
46.2
0 50 100 150 200 250
Scotland
N. Ireland
Wales
England
No. of sites & FTE jobs
No.of FTE jobs
No.of FTE jobs
Hom
e na
tion
s
60 5763
69 69
78
88
70 75
64
0
20
40
60
80
100
2008 2010 2012 2014 2016
No.
of
site
s &
ave
rage
no.
of
FTE
s pe
r si
te
No.
of
site
s &
ave
rage
no.
of
FTE
s pe
r si
te
Year
Year
Em
ploy
men
t
Year
Year
Year
Year
0
10
20
30
40
50
60
70
80
2008 2010 2012 2014 2016
No.
of
Sit
es
No.
of
Sit
es
No.
of
Sit
es
No.
of
Sit
es
No.
of
Sit
esN
o. o
f S
ites
No.
of
Sit
es &
No.
of
Sta
ff
Year
4,022 4,0193,509
4,3133,866
387 404479
536374
258515
368
352
205
0
1,000
2,000
3,000
4,000
5,000
6,000
2008 2010 2012 2014 2016
FTE
Job
s
Year
501
389
342 332307
31 36 42 40 44
0
100
200
300
400
500
600
2008 2010 2012 2014 2016
Year
33 29 30 35 31
265
192
151159
151
10889
7665 6053 46 47 43 4342
33 3830
22
0
50
100
150
200
250
300
2008 2010 2012 2014 2016
Year
2,000 4,000 6,000 8,000 10,000 12,000 14,000 16,000
7,500 1,432 1,767 1,985 3,030 2008
7,660 992 1,432 1,705 2,315 2010
7,739 771 1,234 1,783 2,772 2012
7,722 797 1,130 1,501 2,258 2014
8,341 801 1,054 1,557 1,802 2016
No. of FTE jobs
No. of FTE jobs
100+
1-10
11-25
26-50
51-100
210227
64
186
122
48
175
107
43
186
97
48
166
99
42
0
0
0
50
100
150
200
250
Mixed Primary Secondary
Processor Type
2,000 4,000 6,000 8,000 10,000 12,000 14,000 16,000
8,417 3,563 3,734 2008
7,637 1,701 4,107 2010
7,543 1,480 4,906 2012
8,139 1,610 3,654 2014
7,719 1,657 4,178 2016 Mixed
Primary
Secondary
128
231
14
126
103
194
11
7892
154
11
8077
159
15
8164
151
13
79
0
50
100
150
200
250
Demersal Mixed Species Pelagic Shellfish
Sea Fish Species Category
- 2,000 4,000 6,000 8,000 10,000 12,000 14,000 16,000
1,950 9,392 870 3,494 2008
1,658 9,258 633 2,522 2010
1,445 9,207 822 2,5352012
875 7,237 1,412 3,8832014
928 7,491 1,184 3,9502016Demersal
Mixed Species
Pelagic
Shellfish
0
20
40
60
80
100
120
140
160
Demersal Pelagic Shellfish Saltwater Exotic
Salmon Trout Other Freshwater
Demersal
Pelagic
Shellfish
Saltwater Exotic
Salmon
Trout
Other Freshwater
81
39
92
26
69 6761
54
11
72
24
84
18
57
44 4438
7
63
22
72
17
50
40 42
30
5
55
22
72
15
4146 45
34
56
17
57
14
36 3844
35
10
0
10
20
30
40
50
60
70
80
90
100
Region
2008
2010
2012
2014
2016
2008
2010
2012
2014
2016
2008
2010
2012
2014
2016
0 2,000 4,000 6,000 8,000 10,000 12,000 14,000 16,000
3,088 686 4,452 529 1,867 1,691 1,677 1,612 2008
3,233 506 4,296 339 1,913 1,322 1,306 1,101 2010
3,667 474 4,115 336 2,226 1,120 1,522 782 2012
3,209 439 4,110 418 1,061 1,070 1,841 1,238 2014
3,439 446 4,817 371 1,008 888 1,410 1,123 2016
Grampian
Highlands and Islands
Humberside
N. Ireland
North England
Other Scotland
S W England
South/Midlands
Wales
532730
13,558
14,820
684668
13,616
14,968
889
958
12,559
14,406
644653
12,898
14,195
-
2,000
4,000
6,000
8,000
10,000
12,000
14,000
16,000
18,000
2010 2012 2014 2016
Full-Time
Seasonal
Part-Time
64
15.111.4
36.2
53
18.9
12.6
42.3
69
15.3 13.9
51.7
47
16.913.9
49.8
0
10
20
30
40
50
60
70
80
No. of sites employing seasonal
staff
Average seasonal staff weeks
Average seasonal staff
Average total employment
2010
2012
2014
2016
100+
1-10
11-25
26-50
51-100
FTE Bands
100+
1-10
11-25
26-50
51-100
FTE Bands
Mixed
Primary
Secondary
Sites
Average FTE per Site
Sites
Average FTE per Site
Sites
Sites
FTEs per Site
FTEs per Site
19
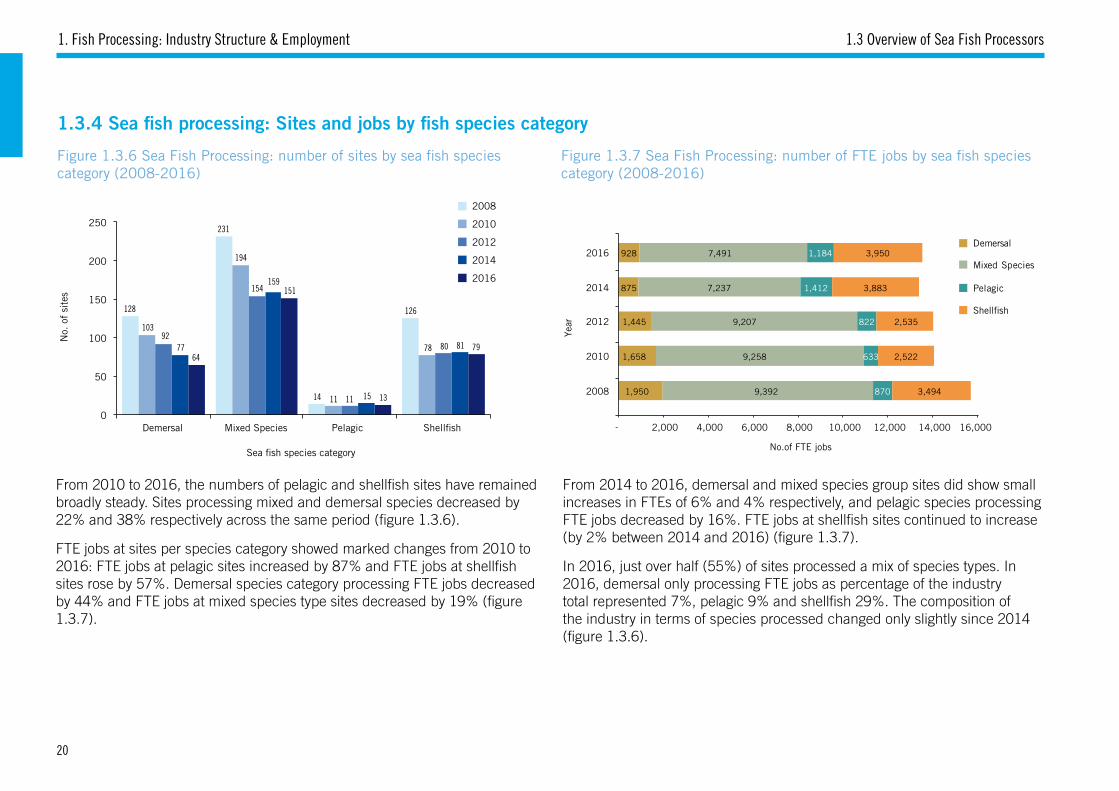
1. Fish Processing: Industry Structure & Employment
1.3.4 Sea fish processing: Sites and jobs by fish species category
Figure 1.3.6 Sea Fish Processing: number of sites by sea fish species category (2008-2016)
Figure 1.3.7 Sea Fish Processing: number of FTE jobs by sea fish species category (2008-2016)
1.3 Overview of Sea Fish Processors
From 2010 to 2016, the numbers of pelagic and shellfish sites have remained broadly steady. Sites processing mixed and demersal species decreased by 22% and 38% respectively across the same period (figure 1.3.6).
FTE jobs at sites per species category showed marked changes from 2010 to 2016: FTE jobs at pelagic sites increased by 87% and FTE jobs at shellfish sites rose by 57%. Demersal species category processing FTE jobs decreased by 44% and FTE jobs at mixed species type sites decreased by 19% (figure 1.3.7).
From 2014 to 2016, demersal and mixed species group sites did show small increases in FTEs of 6% and 4% respectively, and pelagic species processing FTE jobs decreased by 16%. FTE jobs at shellfish sites continued to increase (by 2% between 2014 and 2016) (figure 1.3.7).
In 2016, just over half (55%) of sites processed a mix of species types. In 2016, demersal only processing FTE jobs as percentage of the industry total represented 7%, pelagic 9% and shellfish 29%. The composition of the industry in terms of species processed changed only slightly since 2014 (figure 1.3.6).
No.
of
site
s
128
231
14
126
103
194
11
7892
154
11
8077
159
15
8164
151
13
79
0
50
100
150
200
250
Demersal Mixed Species Pelagic Shellfish
Sea fish species category
2008
2010
2012
2014
2016
144
87
55
23
109
49
11
59
30
61
15
42
63
53
43
10
63.8
37.8
80.7
24.8
31.7
55.2
30.4
30.9
5.1
0 10 20 30 40 50 60 70 80 90
Grampian
Highlands and Islands
Humberside
N. Ireland
North England
Other Scotland
S W England
South/Midlands
Wales
No. of sites & FTE jobs
Reg
ions
152
15
10
199
55.1
24.8
5.1
46.2
0 50 100 150 200 250
Scotland
N. Ireland
Wales
England
No. of sites & FTE jobs
No.of FTE jobs
No.of FTE jobs
Hom
e na
tion
s
60 5763
69 69
78
88
70 75
64
0
20
40
60
80
100
2008 2010 2012 2014 2016
No.
of
site
s &
ave
rage
no.
of
FTE
s pe
r si
te
No.
of
site
s &
ave
rage
no.
of
FTE
s pe
r si
te
Year
Year
Em
ploy
men
t
Year
Year
Year
Year
0
10
20
30
40
50
60
70
80
2008 2010 2012 2014 2016
No.
of
Sit
es
No.
of
Sit
es
No.
of
Sit
es
No.
of
Sit
es
No.
of
Sit
esN
o. o
f S
ites
No.
of
Sit
es &
No.
of
Sta
ff
Year
4,022 4,0193,509
4,3133,866
387 404479
536374
258515
368
352
205
0
1,000
2,000
3,000
4,000
5,000
6,000
2008 2010 2012 2014 2016
FTE
Job
s
Year
501
389
342 332307
31 36 42 40 44
0
100
200
300
400
500
600
2008 2010 2012 2014 2016
Year
33 29 30 35 31
265
192
151159
151
10889
7665 6053 46 47 43 4342
33 3830
22
0
50
100
150
200
250
300
2008 2010 2012 2014 2016
Year
2,000 4,000 6,000 8,000 10,000 12,000 14,000 16,000
7,500 1,432 1,767 1,985 3,030 2008
7,660 992 1,432 1,705 2,315 2010
7,739 771 1,234 1,783 2,772 2012
7,722 797 1,130 1,501 2,258 2014
8,341 801 1,054 1,557 1,802 2016
No. of FTE jobs
No. of FTE jobs
100+
1-10
11-25
26-50
51-100
210227
64
186
122
48
175
107
43
186
97
48
166
99
42
0
0
0
50
100
150
200
250
Mixed Primary Secondary
Processor Type
2,000 4,000 6,000 8,000 10,000 12,000 14,000 16,000
8,417 3,563 3,734 2008
7,637 1,701 4,107 2010
7,543 1,480 4,906 2012
8,139 1,610 3,654 2014
7,719 1,657 4,178 2016 Mixed
Primary
Secondary
128
231
14
126
103
194
11
7892
154
11
8077
159
15
8164
151
13
79
0
50
100
150
200
250
Demersal Mixed Species Pelagic Shellfish
Sea Fish Species Category
- 2,000 4,000 6,000 8,000 10,000 12,000 14,000 16,000
1,950 9,392 870 3,494 2008
1,658 9,258 633 2,522 2010
1,445 9,207 822 2,5352012
875 7,237 1,412 3,8832014
928 7,491 1,184 3,9502016Demersal
Mixed Species
Pelagic
Shellfish
0
20
40
60
80
100
120
140
160
Demersal Pelagic Shellfish Saltwater Exotic
Salmon Trout Other Freshwater
Demersal
Pelagic
Shellfish
Saltwater Exotic
Salmon
Trout
Other Freshwater
81
39
92
26
69 6761
54
11
72
24
84
18
57
44 4438
7
63
22
72
17
50
40 42
30
5
55
22
72
15
4146 45
34
56
17
57
14
36 3844
35
10
0
10
20
30
40
50
60
70
80
90
100
Region
2008
2010
2012
2014
2016
2008
2010
2012
2014
2016
2008
2010
2012
2014
2016
0 2,000 4,000 6,000 8,000 10,000 12,000 14,000 16,000
3,088 686 4,452 529 1,867 1,691 1,677 1,612 2008
3,233 506 4,296 339 1,913 1,322 1,306 1,101 2010
3,667 474 4,115 336 2,226 1,120 1,522 782 2012
3,209 439 4,110 418 1,061 1,070 1,841 1,238 2014
3,439 446 4,817 371 1,008 888 1,410 1,123 2016
Grampian
Highlands and Islands
Humberside
N. Ireland
North England
Other Scotland
S W England
South/Midlands
Wales
532730
13,558
14,820
684668
13,616
14,968
889
958
12,559
14,406
644653
12,898
14,195
-
2,000
4,000
6,000
8,000
10,000
12,000
14,000
16,000
18,000
2010 2012 2014 2016
Full-Time
Seasonal
Part-Time
64
15.111.4
36.2
53
18.9
12.6
42.3
69
15.3 13.9
51.7
47
16.913.9
49.8
0
10
20
30
40
50
60
70
80
No. of sites employing seasonal
staff
Average seasonal staff weeks
Average seasonal staff
Average total employment
2010
2012
2014
2016
100+
1-10
11-25
26-50
51-100
FTE Bands
100+
1-10
11-25
26-50
51-100
FTE Bands
Mixed
Primary
Secondary
Sites
Average FTE per Site
Sites
Average FTE per Site
Sites
Sites
FTEs per Site
FTEs per Site
20
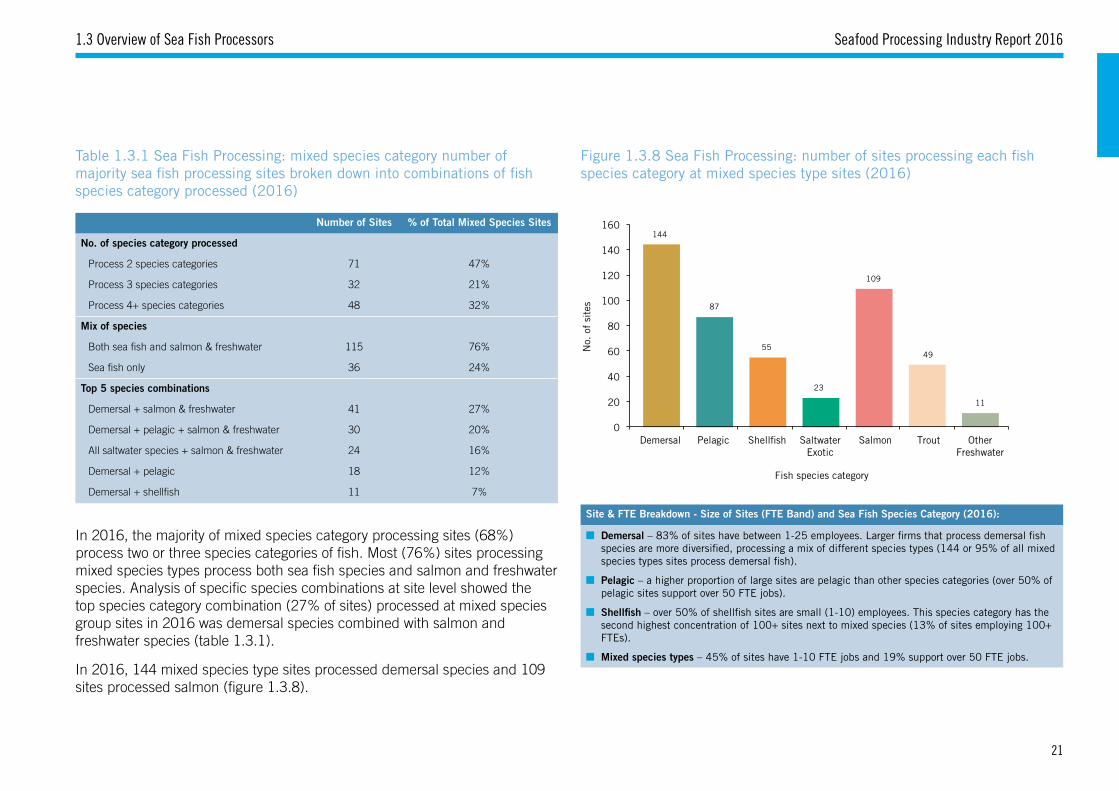
Seafood Processing Industry Report 20161.3 Overview of Sea Fish Processors
144
87
55
23
109
49
11
No.
of
site
s
Fish species category
0
20
40
60
80
100
120
140
160
Demersal Pelagic Shellfish Saltwater Exotic
Salmon Trout Other Freshwater
Figure 1.3.8 Sea Fish Processing: number of sites processing each fish species category at mixed species type sites (2016)
Table 1.3.1 Sea Fish Processing: mixed species category number of majority sea fish processing sites broken down into combinations of fish species category processed (2016)
In 2016, the majority of mixed species category processing sites (68%) process two or three species categories of fish. Most (76%) sites processing mixed species types process both sea fish species and salmon and freshwater species. Analysis of specific species combinations at site level showed the top species category combination (27% of sites) processed at mixed species group sites in 2016 was demersal species combined with salmon and freshwater species (table 1.3.1).
In 2016, 144 mixed species type sites processed demersal species and 109 sites processed salmon (figure 1.3.8).
Site & FTE Breakdown - Size of Sites (FTE Band) and Sea Fish Species Category (2016):
■ Demersal – 83% of sites have between 1-25 employees. Larger firms that process demersal fish species are more diversified, processing a mix of different species types (144 or 95% of all mixed species types sites process demersal fish).
■ Pelagic – a higher proportion of large sites are pelagic than other species categories (over 50% of pelagic sites support over 50 FTE jobs).
■ Shellfish – over 50% of shellfish sites are small (1-10) employees. This species category has the second highest concentration of 100+ sites next to mixed species (13% of sites employing 100+ FTEs).
■ Mixed species types – 45% of sites have 1-10 FTE jobs and 19% support over 50 FTE jobs.
Number of Sites % of Total Mixed Species Sites
No. of species category processed
Process 2 species categories 71 47%
Process 3 species categories 32 21%
Process 4+ species categories 48 32%
Mix of species
Both sea fish and salmon & freshwater 115 76%
Sea fish only 36 24%
Top 5 species combinations
Demersal + salmon & freshwater 41 27%
Demersal + pelagic + salmon & freshwater 30 20%
All saltwater species + salmon & freshwater 24 16%
Demersal + pelagic 18 12%
Demersal + shellfish 11 7%
21
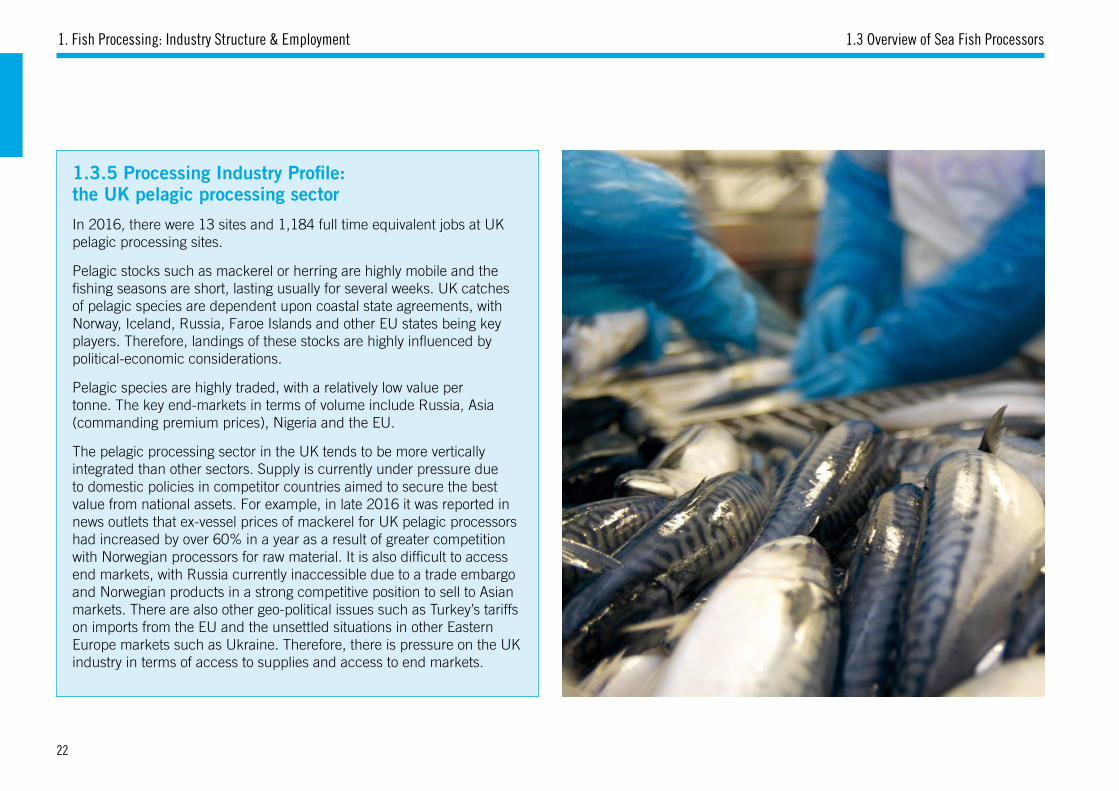
1. Fish Processing: Industry Structure & Employment 1.3 Overview of Sea Fish Processors
1.3.5 Processing Industry Profile: the UK pelagic processing sector
In 2016, there were 13 sites and 1,184 full time equivalent jobs at UK pelagic processing sites.
Pelagic stocks such as mackerel or herring are highly mobile and the fishing seasons are short, lasting usually for several weeks. UK catches of pelagic species are dependent upon coastal state agreements, with Norway, Iceland, Russia, Faroe Islands and other EU states being key players. Therefore, landings of these stocks are highly influenced by political-economic considerations.
Pelagic species are highly traded, with a relatively low value per tonne. The key end-markets in terms of volume include Russia, Asia (commanding premium prices), Nigeria and the EU.
The pelagic processing sector in the UK tends to be more vertically integrated than other sectors. Supply is currently under pressure due to domestic policies in competitor countries aimed to secure the best value from national assets. For example, in late 2016 it was reported in news outlets that ex-vessel prices of mackerel for UK pelagic processors had increased by over 60% in a year as a result of greater competition with Norwegian processors for raw material. It is also difficult to access end markets, with Russia currently inaccessible due to a trade embargo and Norwegian products in a strong competitive position to sell to Asian markets. There are also other geo-political issues such as Turkey’s tariffs on imports from the EU and the unsettled situations in other Eastern Europe markets such as Ukraine. Therefore, there is pressure on the UK industry in terms of access to supplies and access to end markets.
22
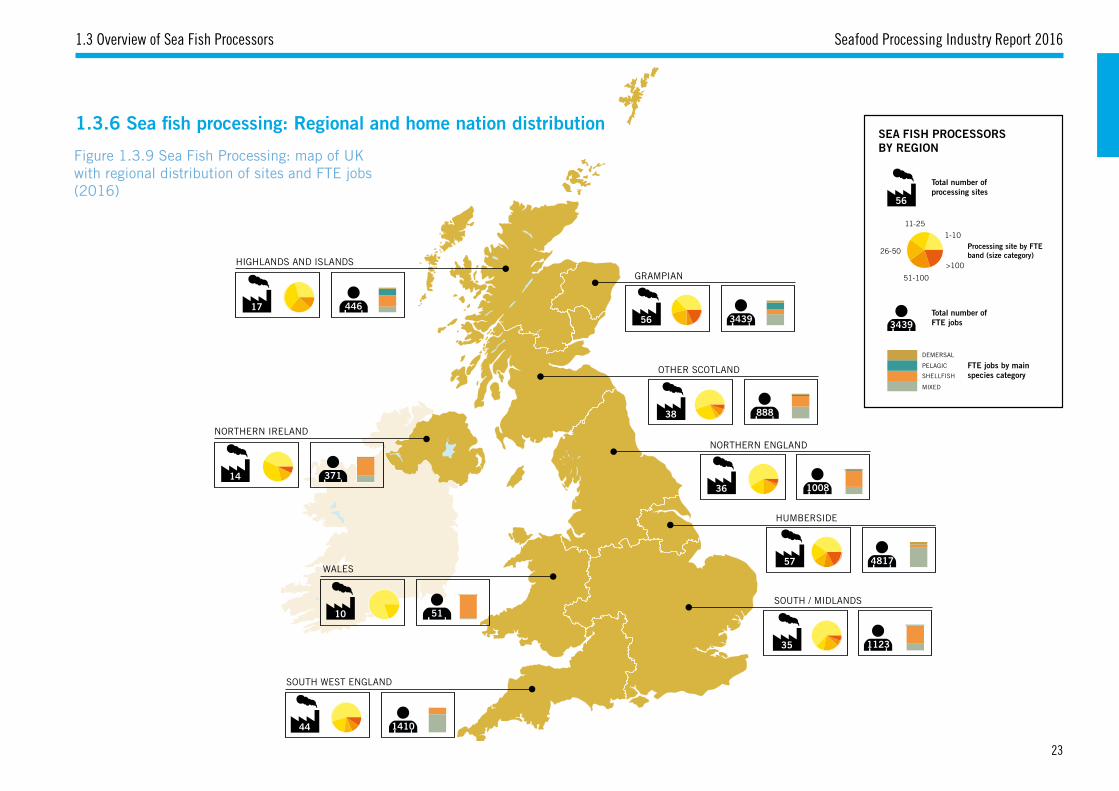
Seafood Processing Industry Report 2016
17
HIGHLANDS AND ISLANDS
446
14
NORTHERN IRELAND
371
10
WALES
51
SOUTH WEST ENGLAND
44 1410
GRAMPIAN
56 3439
OTHER SCOTLAND
38 888
NORTHERN ENGLAND
36 1008
HUMBERSIDE
57 4817
SOUTH / MIDLANDS
35 1123
SEA FISH PROCESSORS BY REGION
DEMERSAL
PELAGIC
SHELLFISH
MIXED
FTE jobs by main species category
Total number of processing sites
56
3439Total number of FTE jobs
Processing site by FTE band (size category)
1-10
11-25
26-50
51-100
>100
1.3.6 Sea fish processing: Regional and home nation distribution
Figure 1.3.9 Sea Fish Processing: map of UK with regional distribution of sites and FTE jobs (2016)
1.3 Overview of Sea Fish Processors
17
HIGHLANDS AND ISLANDS
446
14
NORTHERN IRELAND
371
10
WALES
51
SOUTH WEST ENGLAND
44 1410
GRAMPIAN
56 3439
OTHER SCOTLAND
38 888
NORTHERN ENGLAND
36 1008
HUMBERSIDE
57 4817
SOUTH / MIDLANDS
35 1123
SEA FISH PROCESSORS BY REGION
DEMERSAL
PELAGIC
SHELLFISH
MIXED
FTE jobs by main species category
Total number of processing sites
56
3439Total number of FTE jobs
Processing site by FTE band (size category)
1-10
11-25
26-50
51-100
>100
23
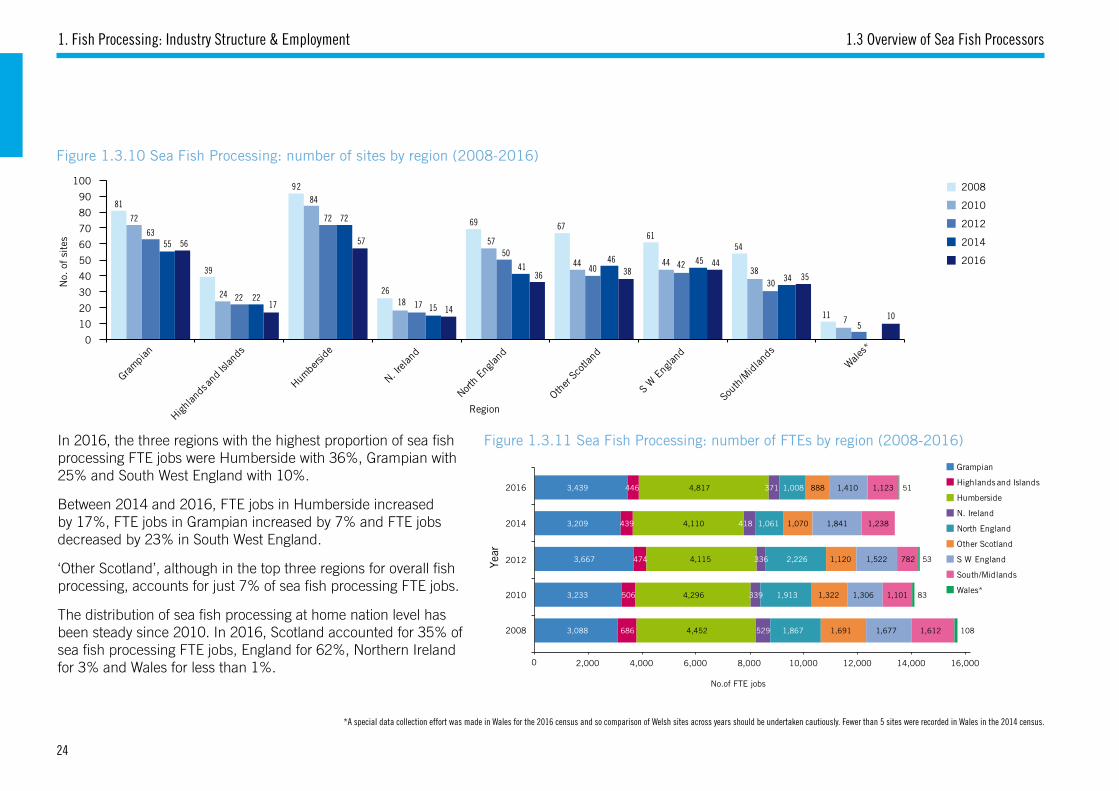
1. Fish Processing: Industry Structure & Employment 1.3 Overview of Sea Fish Processors
Figure 1.3.10 Sea Fish Processing: number of sites by region (2008-2016)
Figure 1.3.11 Sea Fish Processing: number of FTEs by region (2008-2016)
*A special data collection effort was made in Wales for the 2016 census and so comparison of Welsh sites across years should be undertaken cautiously. Fewer than 5 sites were recorded in Wales in the 2014 census.
In 2016, the three regions with the highest proportion of sea fish processing FTE jobs were Humberside with 36%, Grampian with 25% and South West England with 10%.
Between 2014 and 2016, FTE jobs in Humberside increased by 17%, FTE jobs in Grampian increased by 7% and FTE jobs decreased by 23% in South West England.
‘Other Scotland’, although in the top three regions for overall fish processing, accounts for just 7% of sea fish processing FTE jobs.
The distribution of sea fish processing at home nation level has been steady since 2010. In 2016, Scotland accounted for 35% of sea fish processing FTE jobs, England for 62%, Northern Ireland for 3% and Wales for less than 1%.
No.
of
site
s
81
39
92
26
69 6761
54
11
72
24
84
18
57
44 4438
7
63
22
72
17
50
40 42
30
5
55
22
72
15
4146 45
34
56
17
57
14
36 3844
35
10
0
10
20
30
40
50
60
70
80
90
100
Region
2008
2010
2012
2014
2016
No.of FTE jobs
Year
0 2,000 4,000 6,000 8,000 10,000 12,000 14,000 16,000
3,088 686 4,452 529 1,867 1,691 1,677 1,612 2008
3,233 506 4,296 339 1,913 1,322 1,306 1,101 2010
3,667 474 4,115 336 2,226 1,120 1,522 782 2012
3,209 439 4,110 418 1,061 1,070 1,841 1,238 2014
3,439 446 4,817 371 1,008 888 1,410 1,123
108
83
53
512016
Grampian
Highlands and Islands
Humberside
N. Ireland
North England
Other Scotland
S W England
South/Midlands
Wales*
24
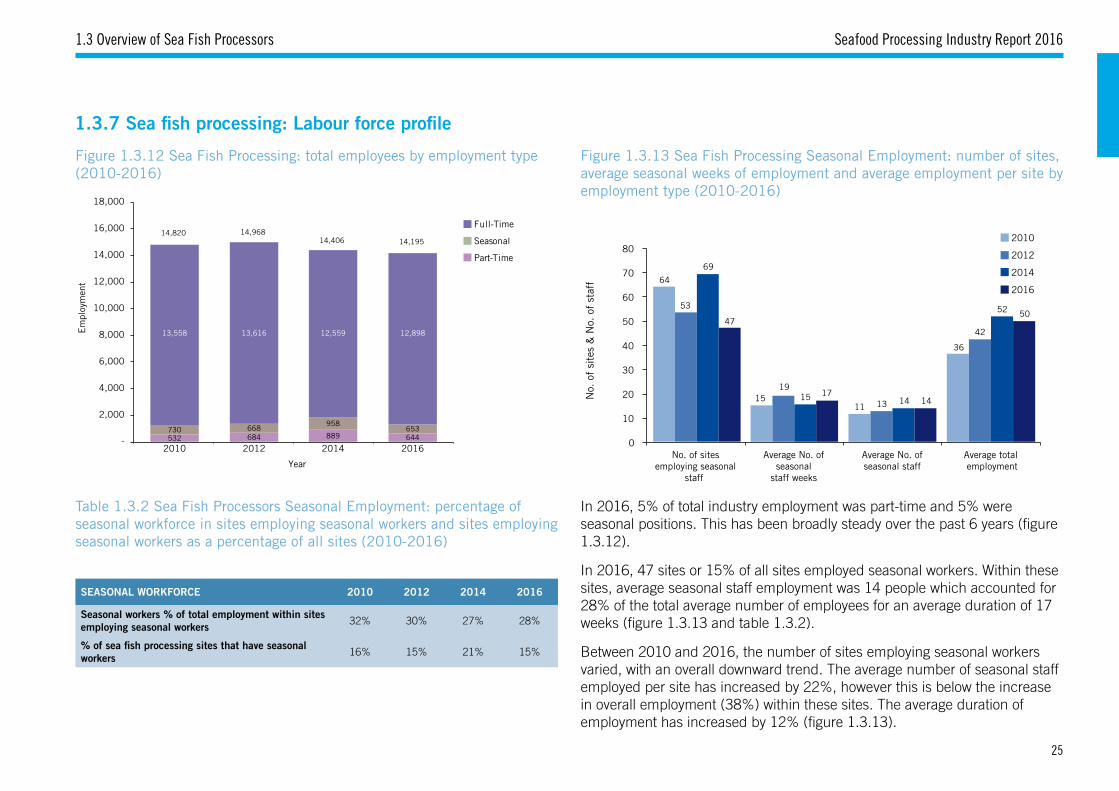
Seafood Processing Industry Report 2016
Figure 1.3.12 Sea Fish Processing: total employees by employment type (2010-2016)
Figure 1.3.13 Sea Fish Processing Seasonal Employment: number of sites, average seasonal weeks of employment and average employment per site by employment type (2010-2016)
Table 1.3.2 Sea Fish Processors Seasonal Employment: percentage of seasonal workforce in sites employing seasonal workers and sites employing seasonal workers as a percentage of all sites (2010-2016)
1.3.7 Sea fish processing: Labour force profile
In 2016, 5% of total industry employment was part-time and 5% were seasonal positions. This has been broadly steady over the past 6 years (figure 1.3.12).
In 2016, 47 sites or 15% of all sites employed seasonal workers. Within these sites, average seasonal staff employment was 14 people which accounted for 28% of the total average number of employees for an average duration of 17 weeks (figure 1.3.13 and table 1.3.2).
Between 2010 and 2016, the number of sites employing seasonal workers varied, with an overall downward trend. The average number of seasonal staff employed per site has increased by 22%, however this is below the increase in overall employment (38%) within these sites. The average duration of employment has increased by 12% (figure 1.3.13).
144
87
55
23
109
49
11
59
30
61
15
42
63
53
43
10
63.8
37.8
80.7
24.8
31.7
55.2
30.4
30.9
5.1
0 10 20 30 40 50 60 70 80 90
Grampian
Highlands and Islands
Humberside
N. Ireland
North England
Other Scotland
S W England
South/Midlands
Wales
No. of sites & FTE jobs
Reg
ions
152
15
10
199
55.1
24.8
5.1
46.2
0 50 100 150 200 250
Scotland
N. Ireland
Wales
England
No. of sites & FTE jobs
No.of FTE jobs
No.of FTE jobs
Hom
e na
tion
s
60 5763
69 69
78
88
70 75
64
0
20
40
60
80
100
2008 2010 2012 2014 2016
No.
of
site
s &
ave
rage
no.
of
FTE
s pe
r si
te
No.
of
site
s &
ave
rage
no.
of
FTE
s pe
r si
te
Year
Year
Em
ploy
men
t
Year
Year
Year
Year
0
10
20
30
40
50
60
70
80
2008 2010 2012 2014 2016
No.
of
Sit
es
No.
of
Sit
es
No.
of
Sit
es
No.
of
Sit
es
No.
of
Sit
esN
o. o
f S
ites
No.
of
Sit
es &
No.
of
Sta
ff
Year
4,022 4,0193,509
4,3133,866
387 404479
536374
258515
368
352
205
0
1,000
2,000
3,000
4,000
5,000
6,000
2008 2010 2012 2014 2016
FTE
Job
s
Year
501
389
342 332307
31 36 42 40 44
0
100
200
300
400
500
600
2008 2010 2012 2014 2016
Year
33 29 30 35 31
265
192
151159
151
10889
7665 6053 46 47 43 4342
33 3830
22
0
50
100
150
200
250
300
2008 2010 2012 2014 2016
Year
2,000 4,000 6,000 8,000 10,000 12,000 14,000 16,000
7,500 1,432 1,767 1,985 3,030 2008
7,660 992 1,432 1,705 2,315 2010
7,739 771 1,234 1,783 2,772 2012
7,722 797 1,130 1,501 2,258 2014
8,341 801 1,054 1,557 1,802 2016
No. of FTE jobs
No. of FTE jobs
100+
1-10
11-25
26-50
51-100
210227
64
186
122
48
175
107
43
186
97
48
166
99
42
0
0
0
50
100
150
200
250
Mixed Primary Secondary
Processor Type
2,000 4,000 6,000 8,000 10,000 12,000 14,000 16,000
8,417 3,563 3,734 2008
7,637 1,701 4,107 2010
7,543 1,480 4,906 2012
8,139 1,610 3,654 2014
7,719 1,657 4,178 2016 Mixed
Primary
Secondary
128
231
14
126
103
194
11
7892
154
11
8077
159
15
8164
151
13
79
0
50
100
150
200
250
Demersal Mixed Species Pelagic Shellfish
Sea Fish Species Category
- 2,000 4,000 6,000 8,000 10,000 12,000 14,000 16,000
1,950 9,392 870 3,494 2008
1,658 9,258 633 2,522 2010
1,445 9,207 822 2,5352012
875 7,237 1,412 3,8832014
928 7,491 1,184 3,9502016Demersal
Mixed Species
Pelagic
Shellfish
0
20
40
60
80
100
120
140
160
Demersal Pelagic Shellfish Saltwater Exotic
Salmon Trout Other Freshwater
Demersal
Pelagic
Shellfish
Saltwater Exotic
Salmon
Trout
Other Freshwater
81
39
92
26
69 6761
54
11
72
24
84
18
57
44 4438
7
63
22
72
17
50
40 42
30
5
55
22
72
15
4146 45
34
56
17
57
14
36 3844
35
10
0
10
20
30
40
50
60
70
80
90
100
Region
2008
2010
2012
2014
2016
2008
2010
2012
2014
2016
2008
2010
2012
2014
2016
0 2,000 4,000 6,000 8,000 10,000 12,000 14,000 16,000
3,088 686 4,452 529 1,867 1,691 1,677 1,612 2008
3,233 506 4,296 339 1,913 1,322 1,306 1,101 2010
3,667 474 4,115 336 2,226 1,120 1,522 782 2012
3,209 439 4,110 418 1,061 1,070 1,841 1,238 2014
3,439 446 4,817 371 1,008 888 1,410 1,123 2016
Grampian
Highlands and Islands
Humberside
N. Ireland
North England
Other Scotland
S W England
South/Midlands
Wales
532730
13,558
14,820
684668
13,616
14,968
889
958
12,559
14,406
644653
12,898
14,195
-
2,000
4,000
6,000
8,000
10,000
12,000
14,000
16,000
18,000
2010 2012 2014 2016
Full-Time
Seasonal
Part-Time
64
15.111.4
36.2
53
18.9
12.6
42.3
69
15.3 13.9
51.7
47
16.913.9
49.8
0
10
20
30
40
50
60
70
80
No. of sites employing seasonal
staff
Average seasonal staff weeks
Average seasonal staff
Average total employment
2010
2012
2014
2016
100+
1-10
11-25
26-50
51-100
FTE Bands
100+
1-10
11-25
26-50
51-100
FTE Bands
Mixed
Primary
Secondary
Sites
Average FTE per Site
Sites
Average FTE per Site
Sites
Sites
FTEs per Site
FTEs per Site
No.
of
site
s &
No.
of
staf
f 64
1511
36
53
19
13
42
69
15 14
5247
1714
50
0
10
20
30
40
50
60
70
80
No. of sites employing seasonal
staff
Average No. of seasonal
staff weeks
Average No. of seasonal staff
Average total employment
2010
2012
2014
2016
SEASONAL WORKFORCE 2010 2012 2014 2016
Seasonal workers % of total employment within sites employing seasonal workers 32% 30% 27% 28%
% of sea fish processing sites that have seasonal workers 16% 15% 21% 15%
1.3 Overview of Sea Fish Processors
25
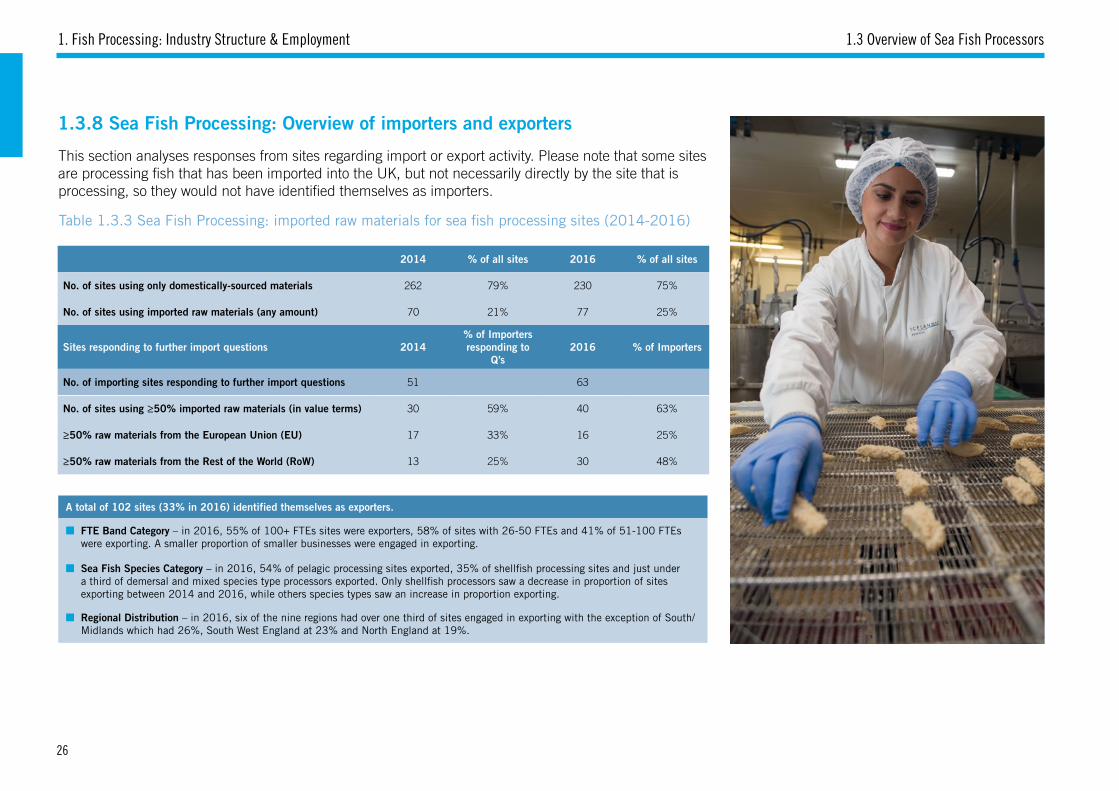
1. Fish Processing: Industry Structure & Employment
1.3.8 Sea Fish Processing: Overview of importers and exporters
This section analyses responses from sites regarding import or export activity. Please note that some sites are processing fish that has been imported into the UK, but not necessarily directly by the site that is processing, so they would not have identified themselves as importers.
A total of 102 sites (33% in 2016) identified themselves as exporters.
■ FTE Band Category – in 2016, 55% of 100+ FTEs sites were exporters, 58% of sites with 26-50 FTEs and 41% of 51-100 FTEs were exporting. A smaller proportion of smaller businesses were engaged in exporting.
■ Sea Fish Species Category – in 2016, 54% of pelagic processing sites exported, 35% of shellfish processing sites and just under a third of demersal and mixed species type processors exported. Only shellfish processors saw a decrease in proportion of sites exporting between 2014 and 2016, while others species types saw an increase in proportion exporting.
■ Regional Distribution – in 2016, six of the nine regions had over one third of sites engaged in exporting with the exception of South/Midlands which had 26%, South West England at 23% and North England at 19%.
2014 % of all sites 2016 % of all sites
No. of sites using only domestically-sourced materials 262 79% 230 75%
No. of sites using imported raw materials (any amount) 70 21% 77 25%
Sites responding to further import questions 2014% of Importers responding to
Q’s2016 % of Importers
No. of importing sites responding to further import questions 51 63
No. of sites using ≥50% imported raw materials (in value terms) 30 59% 40 63%
≥50% raw materials from the European Union (EU) 17 33% 16 25%
≥50% raw materials from the Rest of the World (RoW) 13 25% 30 48%
Table 1.3.3 Sea Fish Processing: imported raw materials for sea fish processing sites (2014-2016)
1.3 Overview of Sea Fish Processors
26
Seafood Processing Industry Report 2016
SEA FISH PROCESSING INDUSTRY: COST STRUCTURE AND INPUTS INTO PRODUCTION2
This section presents analysis of the cost structure of sea fish processing companies and the key inputs into production (labour, capital and raw materials).
Time series data are for the period 2010 to 2014, with 2014 being the most recent year for which financial data are available. Monetary values are not adjusted for inflation.
The financial estimates presented in this section and section 3 of this report are based on financial data gathered from a survey and annual accounts from a sample of sea fish processing companies (please see Appendix 3 for further details of the sample). The estimation technique underlying the analyses of all financial data presented in sections 2 and 3 consists of five steps. First, the sample is checked for obvious errors and, in clearly defined cases, missing financial variables or years are estimated for specific companies. Second, the sample is split into 4 FTE size bands or groups defined by employment (micro enterprise, small to medium enterprise, medium to large enterprise or large enterprise). Third, for each specific size band a per-FTE average at the company level is calculated (e.g. average raw material cost per FTE across all companies in the sample FTE band for that year). Fourth, this average rate is applied to companies not in the sample (by taking the average per-FTE ratio of sample companies in a specific size band and multiplying this by the number of FTEs for companies in the rest of the population of that band). This is done independently for each financial estimate. Fifth, company data are then allocated to the respective owned site(s) (for companies with multiple sites this is done according to each site’s proportion of the company total FTE jobs).
All processors in scope were invited to participate in the survey of financial data. The sample was supplemented by available published company accounts. The sample size is different for each variable due to incomplete data forms and limitations on our ability to accurately estimate missing variables (please see Appendix 3). A number of limitations of the financial estimation approach were identified and, where possible, addressed in this report or highlighted for action in future data collection exercises. For example, sample bias arising from self-selection and the fact that only accounts for larger companies are publicly available; in some company size bands, turnover has a weak relationship with number of FTE jobs; there is a different sample of companies for the basis of estimation for each year, changing the relationship between company financial data and census FTE jobs for each year; in some FTE bands there is a great deal of variation in which particular companies are included in the sample in each year (e.g. less than 50% of sample from the previous year is included again in the next year); survey forms not accurately completed. The financial data reported in section 2 and 3 relate to the full accounts of fish processing companies which may cover business activity other than fish processing undertaken by these companies. An additional factor is a change in the wording of definitions of the financial data survey forms, which may affect comparison of particular figures across different reference years.
Financial data were collected for companies with 53% of total industry FTEs in 2014. Our data collection process and methods for estimation are developing and improving over time and as a result there are some differences between the figures reported in this report and those reported in previous industry reports.
See Appendix 4. Research Methods for a more detailed description of the research methods used to build the dataset underlying the analysis presented in Sections 2 - 4.
27
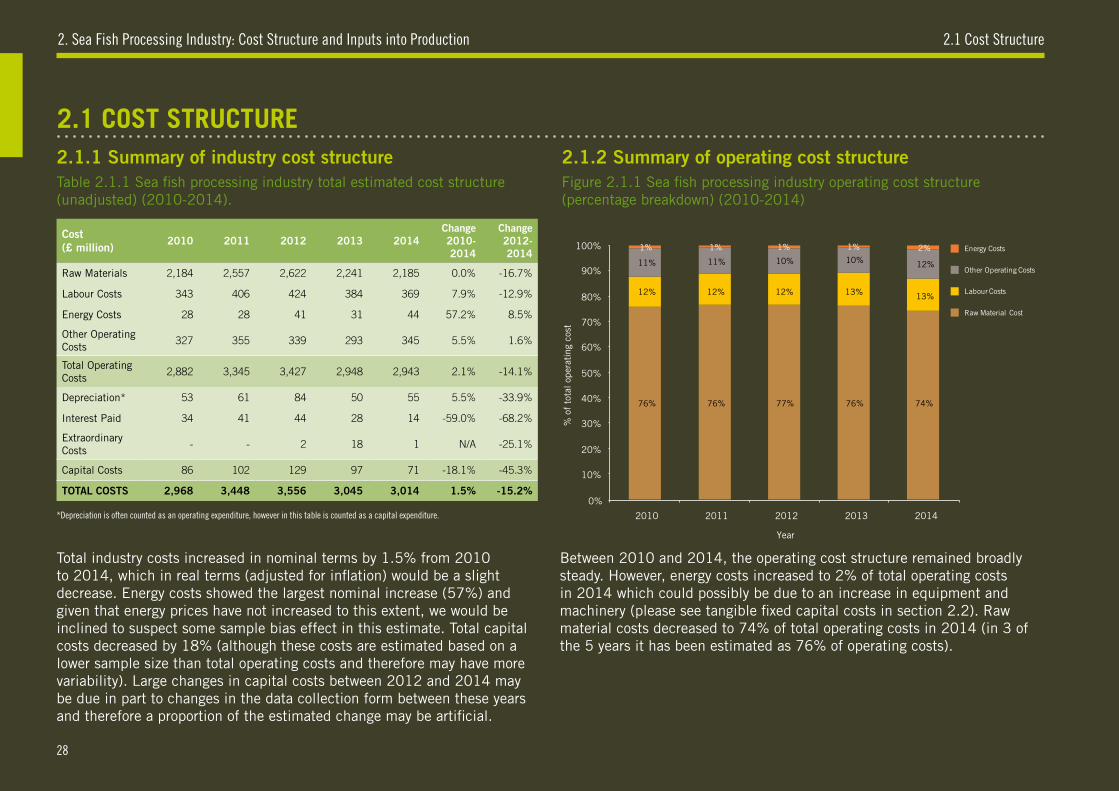
2. Sea Fish Processing Industry: Cost Structure and Inputs into Production
2.1 COST STRUCTURE
Table 2.1.1 Sea fish processing industry total estimated cost structure (unadjusted) (2010-2014).
Figure 2.1.1 Sea fish processing industry operating cost structure (percentage breakdown) (2010-2014)
2.1 Cost Structure
Total industry costs increased in nominal terms by 1.5% from 2010 to 2014, which in real terms (adjusted for inflation) would be a slight decrease. Energy costs showed the largest nominal increase (57%) and given that energy prices have not increased to this extent, we would be inclined to suspect some sample bias effect in this estimate. Total capital costs decreased by 18% (although these costs are estimated based on a lower sample size than total operating costs and therefore may have more variability). Large changes in capital costs between 2012 and 2014 may be due in part to changes in the data collection form between these years and therefore a proportion of the estimated change may be artificial.
Between 2010 and 2014, the operating cost structure remained broadly steady. However, energy costs increased to 2% of total operating costs in 2014 which could possibly be due to an increase in equipment and machinery (please see tangible fixed capital costs in section 2.2). Raw material costs decreased to 74% of total operating costs in 2014 (in 3 of the 5 years it has been estimated as 76% of operating costs).
Cost (£ million)
2010 2011 2012 2013 2014Change 2010-2014
Change 2012-2014
Raw Materials 2,184 2,557 2,622 2,241 2,185 0.0% -16.7%
Labour Costs 343 406 424 384 369 7.9% -12.9%
Energy Costs 28 28 41 31 44 57.2% 8.5%
Other Operating Costs
327 355 339 293 345 5.5% 1.6%
Total Operating Costs
2,882 3,345 3,427 2,948 2,943 2.1% -14.1%
Depreciation* 53 61 84 50 55 5.5% -33.9%
Interest Paid 34 41 44 28 14 -59.0% -68.2%
Extraordinary Costs
- - 2 18 1 N/A -25.1%
Capital Costs 86 102 129 97 71 -18.1% -45.3%
TOTAL COSTS 2,968 3,448 3,556 3,045 3,014 1.5% -15.2%
76% 76% 76% 74%77%
12% 12% 12% 13% 13%
1% 1% 1% 1% 2%
11% 11% 10% 10% 12%
100%
90%
80%
70%
60%
50%
40%
30%
20%
10%
0%
2010 2011 2012 2013 2014
% o
f to
tal o
pera
ting
cos
t
Year
Raw Material Cost
Labour Costs
Energy Costs
Other Operating Costs
*Depreciation is often counted as an operating expenditure, however in this table is counted as a capital expenditure.
2.1.1 Summary of industry cost structure 2.1.2 Summary of operating cost structure
28
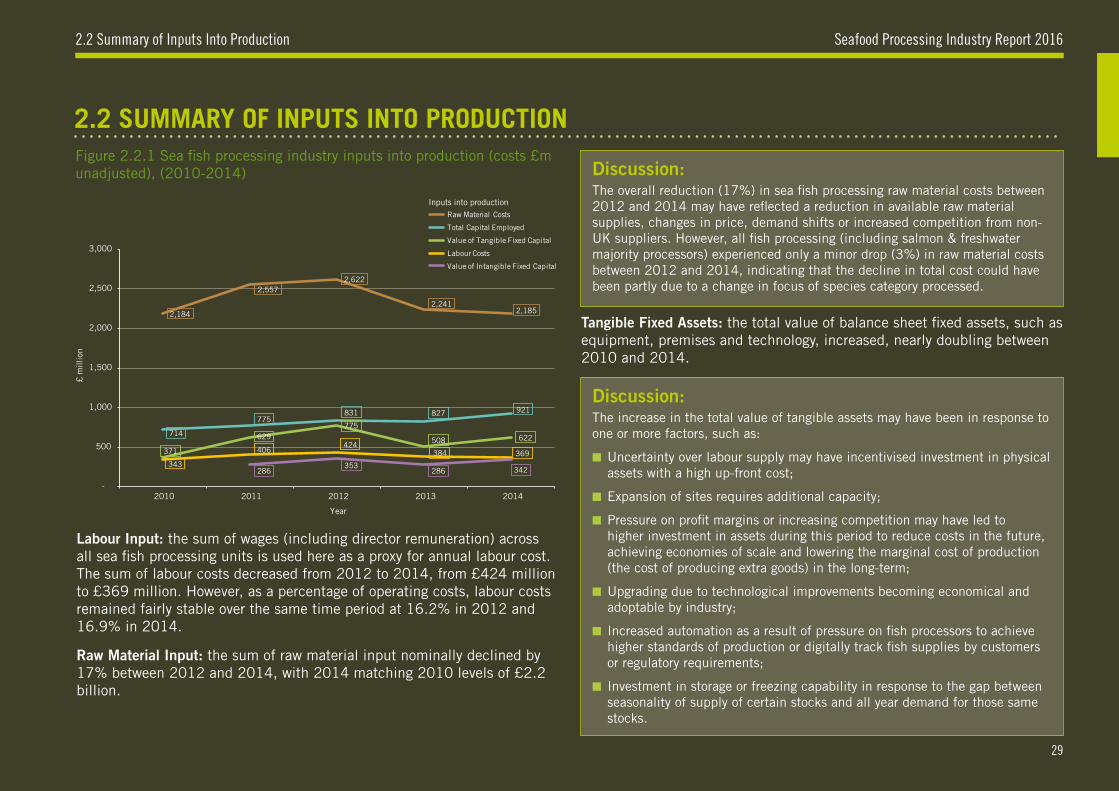
Seafood Processing Industry Report 20162.2 Summary of Inputs Into Production
2.2 SUMMARY OF INPUTS INTO PRODUCTION Figure 2.2.1 Sea fish processing industry inputs into production (costs £m unadjusted), (2010-2014)
Labour Input: the sum of wages (including director remuneration) across all sea fish processing units is used here as a proxy for annual labour cost. The sum of labour costs decreased from 2012 to 2014, from £424 million to £369 million. However, as a percentage of operating costs, labour costs remained fairly stable over the same time period at 16.2% in 2012 and 16.9% in 2014.
Raw Material Input: the sum of raw material input nominally declined by 17% between 2012 and 2014, with 2014 matching 2010 levels of £2.2 billion.
Tangible Fixed Assets: the total value of balance sheet fixed assets, such as equipment, premises and technology, increased, nearly doubling between 2010 and 2014.
Discussion:The overall reduction (17%) in sea fish processing raw material costs between 2012 and 2014 may have reflected a reduction in available raw material supplies, changes in price, demand shifts or increased competition from non-UK suppliers. However, all fish processing (including salmon & freshwater majority processors) experienced only a minor drop (3%) in raw material costs between 2012 and 2014, indicating that the decline in total cost could have been partly due to a change in focus of species category processed.
Discussion:The increase in the total value of tangible assets may have been in response to one or more factors, such as:
■ Uncertainty over labour supply may have incentivised investment in physical assets with a high up-front cost;
■ Expansion of sites requires additional capacity;
■ Pressure on profit margins or increasing competition may have led to higher investment in assets during this period to reduce costs in the future, achieving economies of scale and lowering the marginal cost of production (the cost of producing extra goods) in the long-term;
■ Upgrading due to technological improvements becoming economical and adoptable by industry;
■ Increased automation as a result of pressure on fish processors to achieve higher standards of production or digitally track fish supplies by customers or regulatory requirements;
■ Investment in storage or freezing capability in response to the gap between seasonality of supply of certain stocks and all year demand for those same stocks.
343
406 424
384 369
2,184
2,557 2,622
2,241 2,185
371
629 775
508 622
286 353
286 342
714
775 831 827 921
-
500
1,000
1,500
2,000
2,500
3,000
2010 2011 2012 2013 2014
£ m
illion
Year
Labour Costs
Raw Material Costs
Value of Tangible Fixed Capital
Value of Intangible Fixed Capital
Total Capital Employed
Inputs into production
29
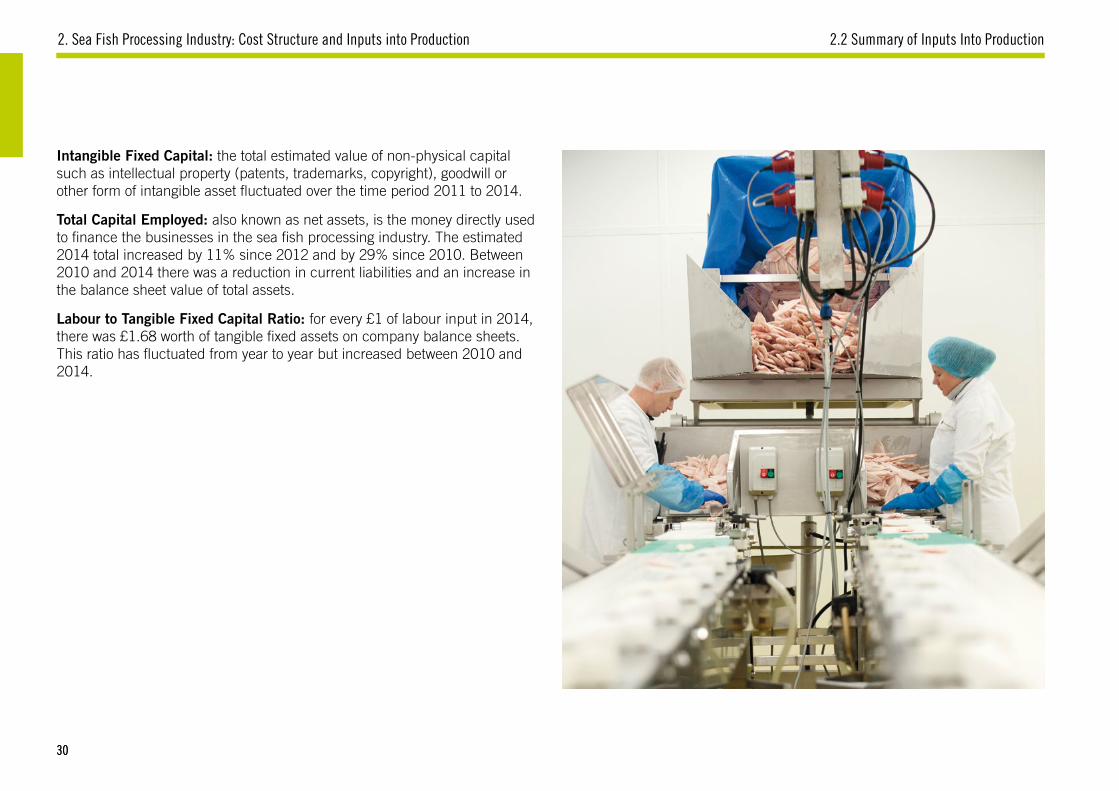
2. Sea Fish Processing Industry: Cost Structure and Inputs into Production
Intangible Fixed Capital: the total estimated value of non-physical capital such as intellectual property (patents, trademarks, copyright), goodwill or other form of intangible asset fluctuated over the time period 2011 to 2014.
Total Capital Employed: also known as net assets, is the money directly used to finance the businesses in the sea fish processing industry. The estimated 2014 total increased by 11% since 2012 and by 29% since 2010. Between 2010 and 2014 there was a reduction in current liabilities and an increase in the balance sheet value of total assets.
Labour to Tangible Fixed Capital Ratio: for every £1 of labour input in 2014, there was £1.68 worth of tangible fixed assets on company balance sheets. This ratio has fluctuated from year to year but increased between 2010 and 2014.
2.2 Summary of Inputs Into Production
3030
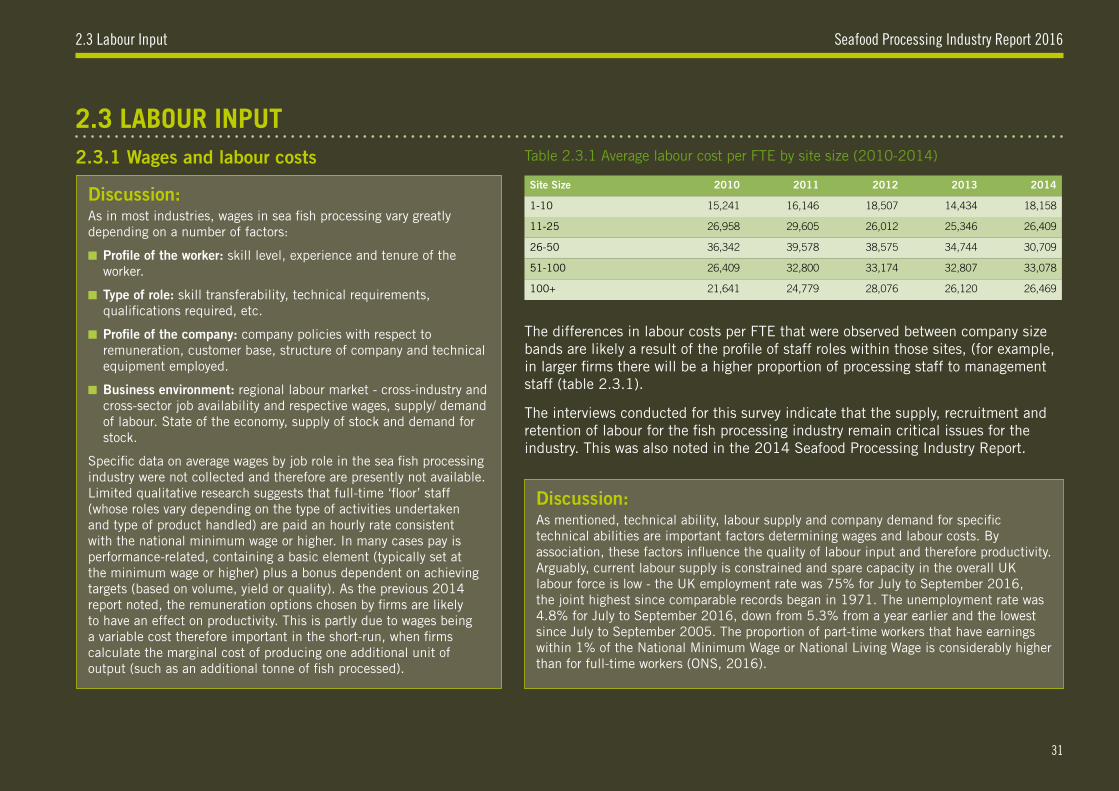
Seafood Processing Industry Report 2016
2.3 LABOUR INPUT Table 2.3.1 Average labour cost per FTE by site size (2010-2014)
2.3 Labour Input
2.3.1 Wages and labour costs
Discussion:As in most industries, wages in sea fish processing vary greatly depending on a number of factors:
■ Profile of the worker: skill level, experience and tenure of the worker.
■ Type of role: skill transferability, technical requirements, qualifications required, etc.
■ Profile of the company: company policies with respect to remuneration, customer base, structure of company and technical equipment employed.
■ Business environment: regional labour market - cross-industry and cross-sector job availability and respective wages, supply/ demand of labour. State of the economy, supply of stock and demand for stock.
Specific data on average wages by job role in the sea fish processing industry were not collected and therefore are presently not available. Limited qualitative research suggests that full-time ‘floor’ staff (whose roles vary depending on the type of activities undertaken and type of product handled) are paid an hourly rate consistent with the national minimum wage or higher. In many cases pay is performance-related, containing a basic element (typically set at the minimum wage or higher) plus a bonus dependent on achieving targets (based on volume, yield or quality). As the previous 2014 report noted, the remuneration options chosen by firms are likely to have an effect on productivity. This is partly due to wages being a variable cost therefore important in the short-run, when firms calculate the marginal cost of producing one additional unit of output (such as an additional tonne of fish processed).
Discussion:As mentioned, technical ability, labour supply and company demand for specific technical abilities are important factors determining wages and labour costs. By association, these factors influence the quality of labour input and therefore productivity. Arguably, current labour supply is constrained and spare capacity in the overall UK labour force is low - the UK employment rate was 75% for July to September 2016, the joint highest since comparable records began in 1971. The unemployment rate was 4.8% for July to September 2016, down from 5.3% from a year earlier and the lowest since July to September 2005. The proportion of part-time workers that have earnings within 1% of the National Minimum Wage or National Living Wage is considerably higher than for full-time workers (ONS, 2016).
The differences in labour costs per FTE that were observed between company size bands are likely a result of the profile of staff roles within those sites, (for example, in larger firms there will be a higher proportion of processing staff to management staff (table 2.3.1).
The interviews conducted for this survey indicate that the supply, recruitment and retention of labour for the fish processing industry remain critical issues for the industry. This was also noted in the 2014 Seafood Processing Industry Report.
Site Size 2010 2011 2012 2013 2014
1-10 15,241 16,146 18,507 14,434 18,158
11-25 26,958 29,605 26,012 25,346 26,409
26-50 36,342 39,578 38,575 34,744 30,709
51-100 26,409 32,800 33,174 32,807 33,078
100+ 21,641 24,779 28,076 26,120 26,469
Seafood Processing Industry Report 2016
31
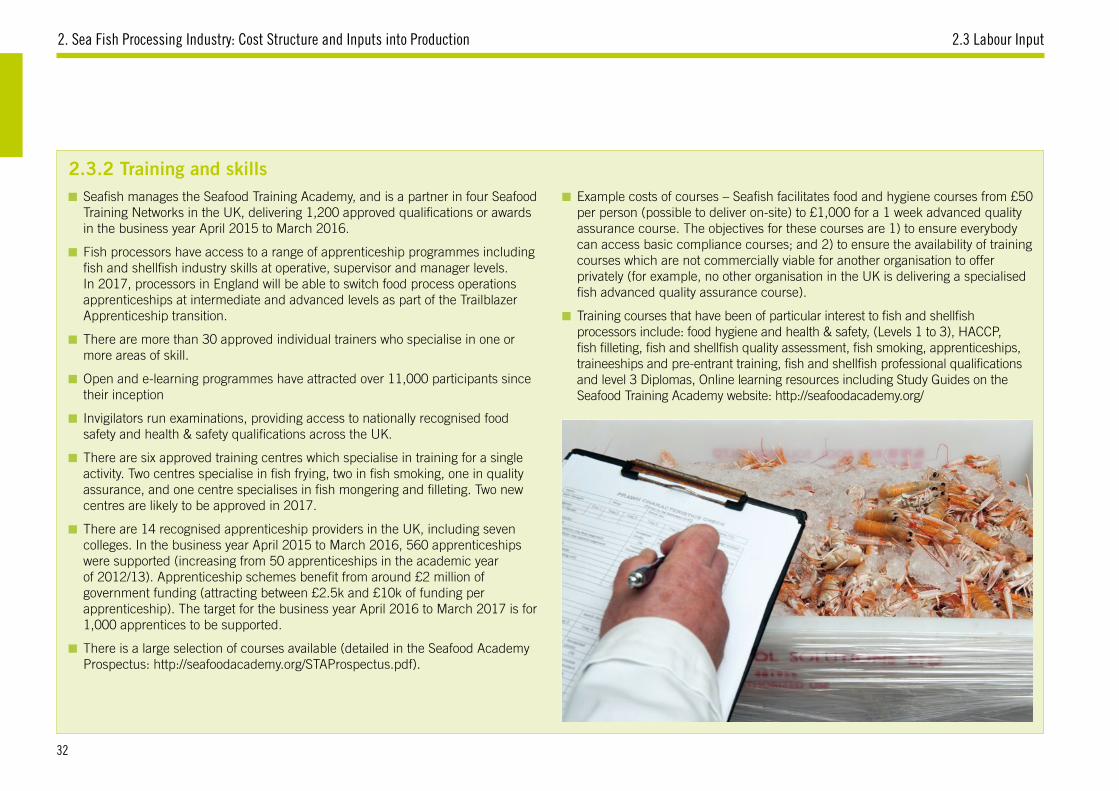
2. Sea Fish Processing Industry: Cost Structure and Inputs into Production 2.3 Labour Input
2.3.2 Training and skills■ Seafish manages the Seafood Training Academy, and is a partner in four Seafood
Training Networks in the UK, delivering 1,200 approved qualifications or awards in the business year April 2015 to March 2016.
■ Fish processors have access to a range of apprenticeship programmes including fish and shellfish industry skills at operative, supervisor and manager levels. In 2017, processors in England will be able to switch food process operations apprenticeships at intermediate and advanced levels as part of the Trailblazer Apprenticeship transition.
■ There are more than 30 approved individual trainers who specialise in one or more areas of skill.
■ Open and e-learning programmes have attracted over 11,000 participants since their inception
■ Invigilators run examinations, providing access to nationally recognised food safety and health & safety qualifications across the UK.
■ There are six approved training centres which specialise in training for a single activity. Two centres specialise in fish frying, two in fish smoking, one in quality assurance, and one centre specialises in fish mongering and filleting. Two new centres are likely to be approved in 2017.
■ There are 14 recognised apprenticeship providers in the UK, including seven colleges. In the business year April 2015 to March 2016, 560 apprenticeships were supported (increasing from 50 apprenticeships in the academic year of 2012/13). Apprenticeship schemes benefit from around £2 million of government funding (attracting between £2.5k and £10k of funding per apprenticeship). The target for the business year April 2016 to March 2017 is for 1,000 apprentices to be supported.
■ There is a large selection of courses available (detailed in the Seafood Academy Prospectus: http://seafoodacademy.org/STAProspectus.pdf).
■ Example costs of courses – Seafish facilitates food and hygiene courses from £50 per person (possible to deliver on-site) to £1,000 for a 1 week advanced quality assurance course. The objectives for these courses are 1) to ensure everybody can access basic compliance courses; and 2) to ensure the availability of training courses which are not commercially viable for another organisation to offer privately (for example, no other organisation in the UK is delivering a specialised fish advanced quality assurance course).
■ Training courses that have been of particular interest to fish and shellfish processors include: food hygiene and health & safety, (Levels 1 to 3), HACCP, fish filleting, fish and shellfish quality assessment, fish smoking, apprenticeships, traineeships and pre-entrant training, fish and shellfish professional qualifications and level 3 Diplomas, Online learning resources including Study Guides on the Seafood Training Academy website: http://seafoodacademy.org/
32
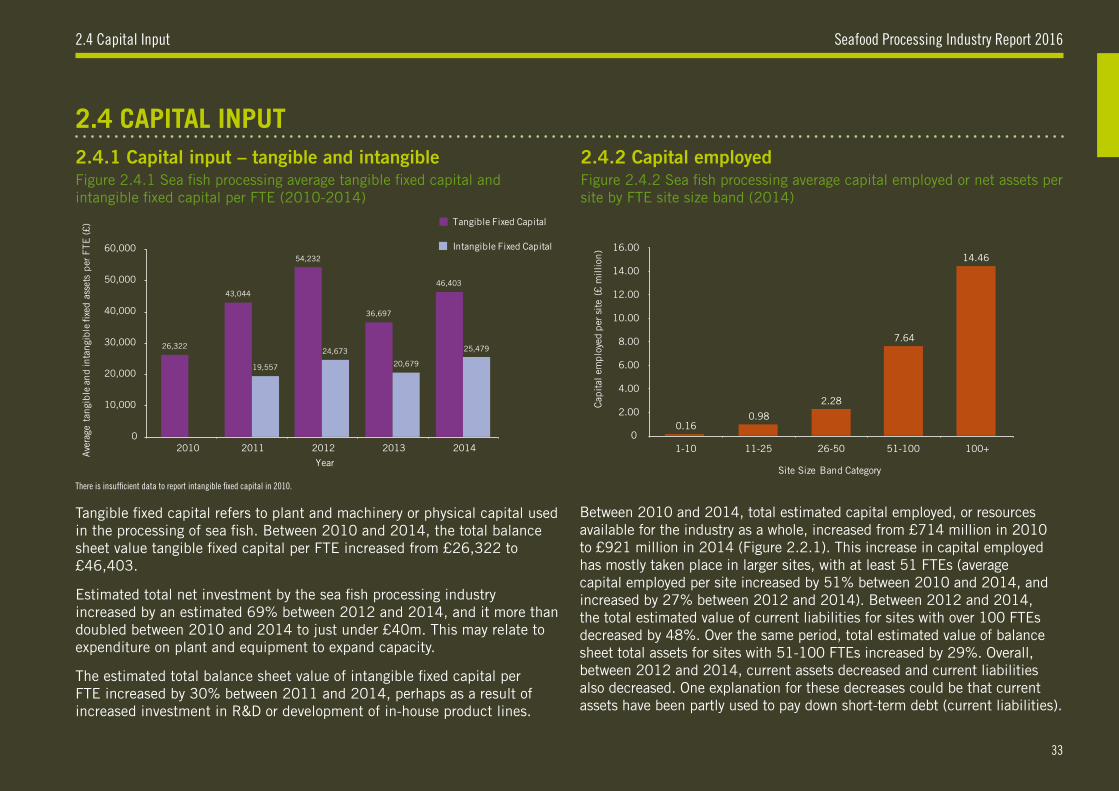
Seafood Processing Industry Report 20162.4 Capital Input
2.4 CAPITAL INPUT 2.4.1 Capital input – tangible and intangibleFigure 2.4.1 Sea fish processing average tangible fixed capital and intangible fixed capital per FTE (2010-2014)
There is insufficient data to report intangible fixed capital in 2010.
Tangible fixed capital refers to plant and machinery or physical capital used in the processing of sea fish. Between 2010 and 2014, the total balance sheet value tangible fixed capital per FTE increased from £26,322 to £46,403.
Estimated total net investment by the sea fish processing industry increased by an estimated 69% between 2012 and 2014, and it more than doubled between 2010 and 2014 to just under £40m. This may relate to expenditure on plant and equipment to expand capacity.
The estimated total balance sheet value of intangible fixed capital per FTE increased by 30% between 2011 and 2014, perhaps as a result of increased investment in R&D or development of in-house product lines.
Between 2010 and 2014, total estimated capital employed, or resources available for the industry as a whole, increased from £714 million in 2010 to £921 million in 2014 (Figure 2.2.1). This increase in capital employed has mostly taken place in larger sites, with at least 51 FTEs (average capital employed per site increased by 51% between 2010 and 2014, and increased by 27% between 2012 and 2014). Between 2012 and 2014, the total estimated value of current liabilities for sites with over 100 FTEs decreased by 48%. Over the same period, total estimated value of balance sheet total assets for sites with 51-100 FTEs increased by 29%. Overall, between 2012 and 2014, current assets decreased and current liabilities also decreased. One explanation for these decreases could be that current assets have been partly used to pay down short-term debt (current liabilities).
2.4.2 Capital employedFigure 2.4.2 Sea fish processing average capital employed or net assets per site by FTE site size band (2014)
26,322
43,044
54,232
36,697
46,403
19,557
24,673
20,679
25,479
10,000
0
20,000
30,000
40,000
50,000
60,000
2010 2011 2012 2013 2014
Ave
rage
tan
gible
and in
tangi
ble
fixe
d a
sset
s per
FTE (£)
Year
Tangible Fixed Capital
Intangible Fixed Capital
0.16 0.98
2.28
7.64
14.46
10.00
12.00
14.00
16.00
1-10 11-25 26-50 51-100 100+
Cap
ital
em
plo
yed p
er s
ite
(£ m
illion
)
Site Size Band Category
76% 76% 76% 74%77%
12% 12% 12% 13% 13%
1% 1% 1% 1% 2%
11% 11% 10% 10% 12%100%
90%
80%
70%
60%
50%
40%
30%
20%
10%
0%2010 2011 2012 2013 2014
% o
f to
tal
oper
atin
g co
st
Raw Material Cost
Labour Costs
Energy Costs
Other Operating Costs
343
2,184
371
714
406
2,557
629
286
775
424
2,622
775
353
831
384
2,241
508
286
827
369
2,185
622
342
921
500
0
1,000
1,500
2,000
2,500
3,000
Labour Costs Raw MaterialCosts
Value ofTangible
Fixed Capital
Value ofIntangible
Fixed Capital
Total CapitalEmployed
£ m
illion
Inputs into Production
2010
2011
2012
2013
2014
2.00
0
4.00
6.00
8.00
33
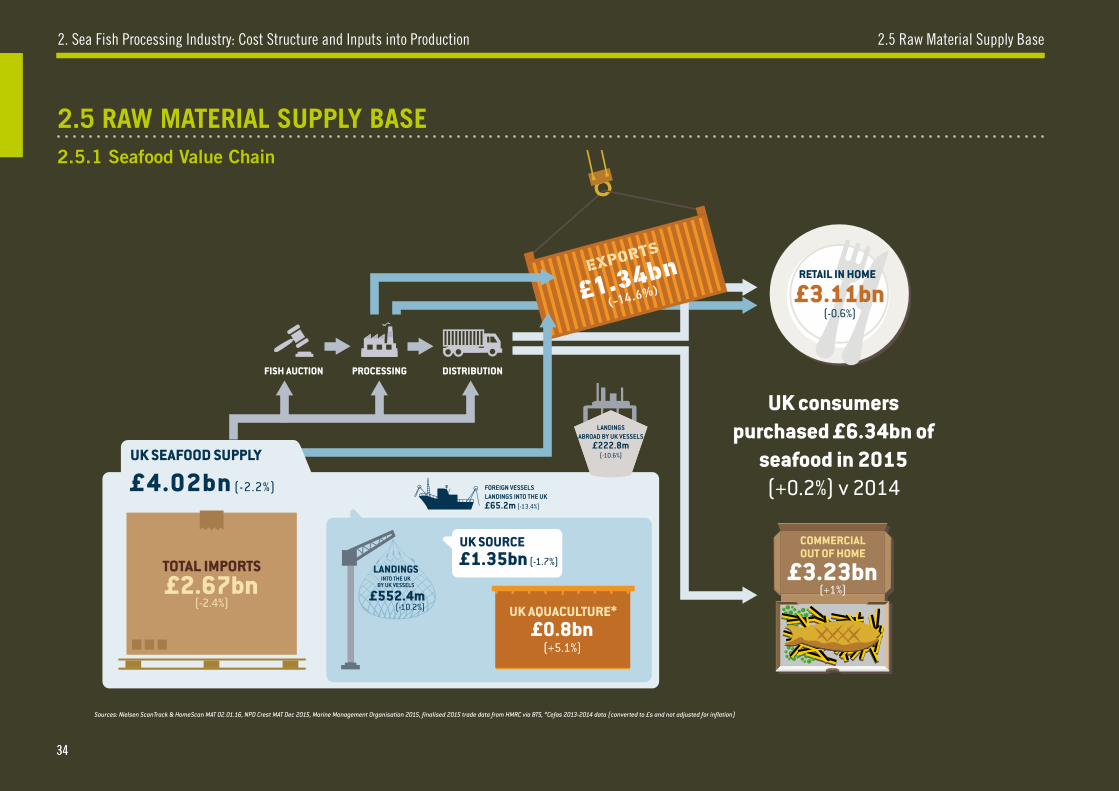
2. Sea Fish Processing Industry: Cost Structure and Inputs into Production 2.5 Raw Material Supply Base
2.5 RAW MATERIAL SUPPLY BASE 2.5.1 Seafood Value Chain
FISH AUCTION PROCESSING DISTRIBUTION
Sources: Nielsen ScanTrack & HomeScan MAT 02.01.16, NPD Crest MAT Dec 2015, Marine Management Organisation 2015, finalised 2015 trade data from HMRC via BTS, *Cefas 2013-2014 data (converted to £s and not adjusted for inflation)
UK consumers purchased £6.34bn of
seafood in 2015 (+0.2%) v 2014
COMMERCIAL OUT OF HOME
£3.23bn (+1%)
RETAIL IN HOME
£3.11bn(-0.6%)
FOREIGN VESSELSLANDINGS INTO THE UK£65.2m (-13.4%)
TOTAL IMPORTS£2.67bn
(-2.4%)
UK SEAFOOD SUPPLY
£4.02bn (-2.2%)
LANDINGS ABROAD BY UK VESSELS
£222.8m (-10.6%)
UK AQUACULTURE*£0.8bn
(+5.1%)
UK SOURCE£1.35bn (-1.7%)
LANDINGS
£552.4m(-10.2%)
INTO THE UK BY UK VESSELS
£1.34bn
(-14.6%)
3434
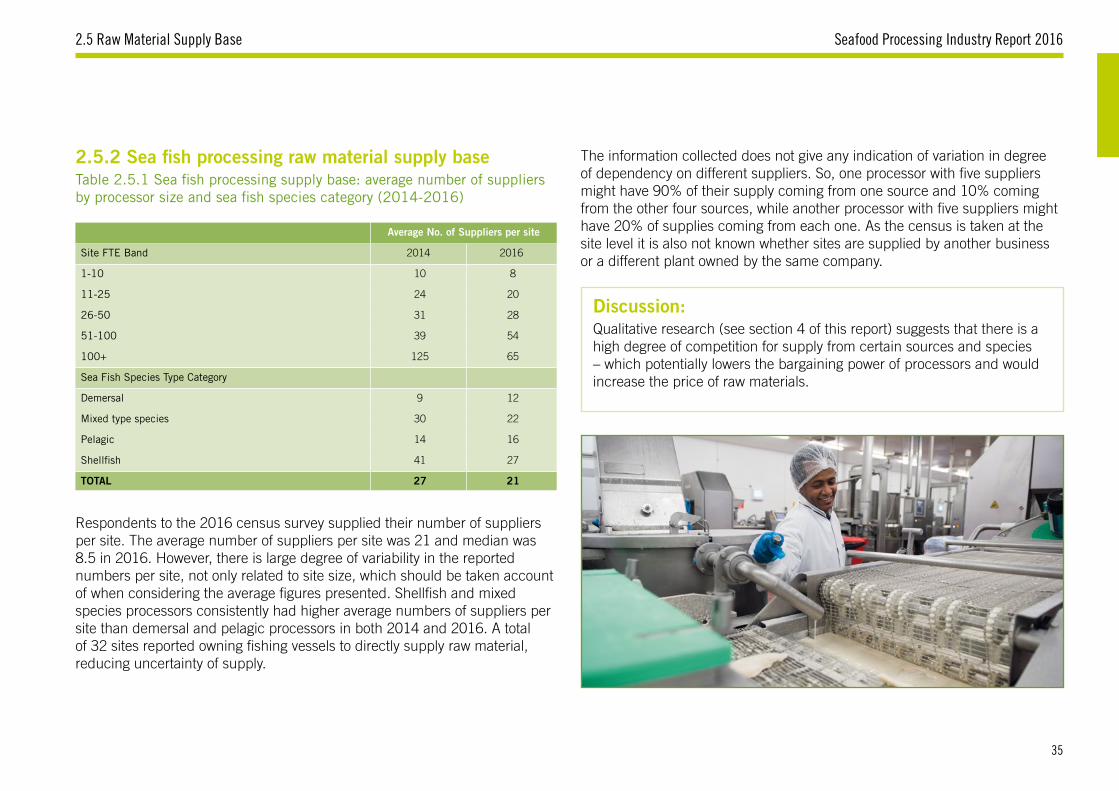
Seafood Processing Industry Report 20162.5 Raw Material Supply Base
2.5.2 Sea fish processing raw material supply baseTable 2.5.1 Sea fish processing supply base: average number of suppliers by processor size and sea fish species category (2014-2016)
Respondents to the 2016 census survey supplied their number of suppliers per site. The average number of suppliers per site was 21 and median was 8.5 in 2016. However, there is large degree of variability in the reported numbers per site, not only related to site size, which should be taken account of when considering the average figures presented. Shellfish and mixed species processors consistently had higher average numbers of suppliers per site than demersal and pelagic processors in both 2014 and 2016. A total of 32 sites reported owning fishing vessels to directly supply raw material, reducing uncertainty of supply.
Discussion:Qualitative research (see section 4 of this report) suggests that there is a high degree of competition for supply from certain sources and species – which potentially lowers the bargaining power of processors and would increase the price of raw materials.
Average No. of Suppliers per site
Site FTE Band 2014 2016
1-10 10 8
11-25 24 20
26-50 31 28
51-100 39 54
100+ 125 65
Sea Fish Species Type Category
Demersal 9 12
Mixed type species 30 22
Pelagic 14 16
Shellfish 41 27
TOTAL 27 21
The information collected does not give any indication of variation in degree of dependency on different suppliers. So, one processor with five suppliers might have 90% of their supply coming from one source and 10% coming from the other four sources, while another processor with five suppliers might have 20% of supplies coming from each one. As the census is taken at the site level it is also not known whether sites are supplied by another business or a different plant owned by the same company.
35
3. Sea Fish Processing Industry: Output and Productivity
36
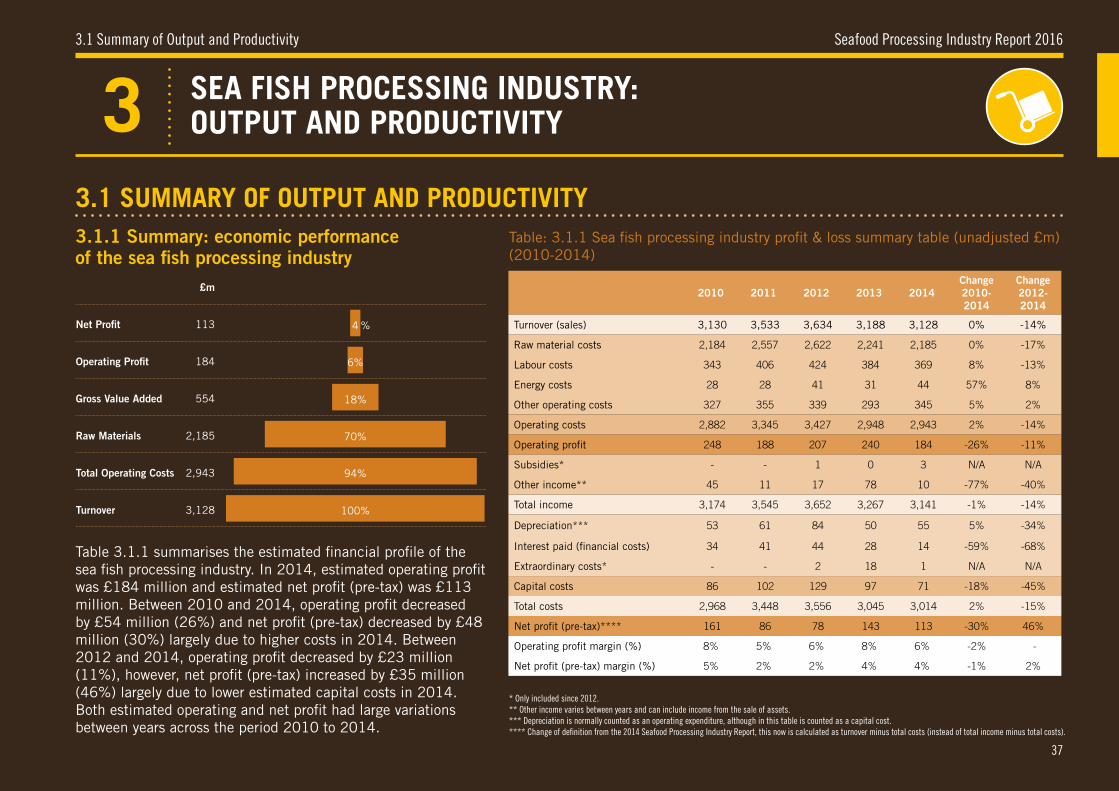
Seafood Processing Industry Report 2016
SEA FISH PROCESSING INDUSTRY: OUTPUT AND PRODUCTIVITY3
3.1 Summary of Output and Productivity
3.1.1 Summary: economic performance of the sea fish processing industry
3.1 SUMMARY OF OUTPUT AND PRODUCTIVITY
4 %
6%
18%
70%
94%
100%
2010 2011 2012 2013 2014Change 2010-2014
Change 2012-2014
Turnover (sales) 3,130 3,533 3,634 3,188 3,128 0% -14%
Raw material costs 2,184 2,557 2,622 2,241 2,185 0% -17%
Labour costs 343 406 424 384 369 8% -13%
Energy costs 28 28 41 31 44 57% 8%
Other operating costs 327 355 339 293 345 5% 2%
Operating costs 2,882 3,345 3,427 2,948 2,943 2% -14%
Operating profit 248 188 207 240 184 -26% -11%
Subsidies* - - 1 0 3 N/A N/A
Other income** 45 11 17 78 10 -77% -40%
Total income 3,174 3,545 3,652 3,267 3,141 -1% -14%
Depreciation*** 53 61 84 50 55 5% -34%
Interest paid (financial costs) 34 41 44 28 14 -59% -68%
Extraordinary costs* - - 2 18 1 N/A N/A
Capital costs 86 102 129 97 71 -18% -45%
Total costs 2,968 3,448 3,556 3,045 3,014 2% -15%
Net profit (pre-tax)**** 161 86 78 143 113 -30% 46%
Operating profit margin (%) 8% 5% 6% 8% 6% -2% -
Net profit (pre-tax) margin (%) 5% 2% 2% 4% 4% -1% 2%
* Only included since 2012.** Other income varies between years and can include income from the sale of assets.*** Depreciation is normally counted as an operating expenditure, although in this table is counted as a capital cost.**** Change of definition from the 2014 Seafood Processing Industry Report, this now is calculated as turnover minus total costs (instead of total income minus total costs).
Table 3.1.1 summarises the estimated financial profile of the sea fish processing industry. In 2014, estimated operating profit was £184 million and estimated net profit (pre-tax) was £113 million. Between 2010 and 2014, operating profit decreased by £54 million (26%) and net profit (pre-tax) decreased by £48 million (30%) largely due to higher costs in 2014. Between 2012 and 2014, operating profit decreased by £23 million (11%), however, net profit (pre-tax) increased by £35 million (46%) largely due to lower estimated capital costs in 2014. Both estimated operating and net profit had large variations between years across the period 2010 to 2014.
£m
Net Profit 113
Operating Profit 184
Gross Value Added 554
Raw Materials 2,185
Total Operating Costs 2,943
Turnover 3,128
Table: 3.1.1 Sea fish processing industry profit & loss summary table (unadjusted £m) (2010-2014)
37
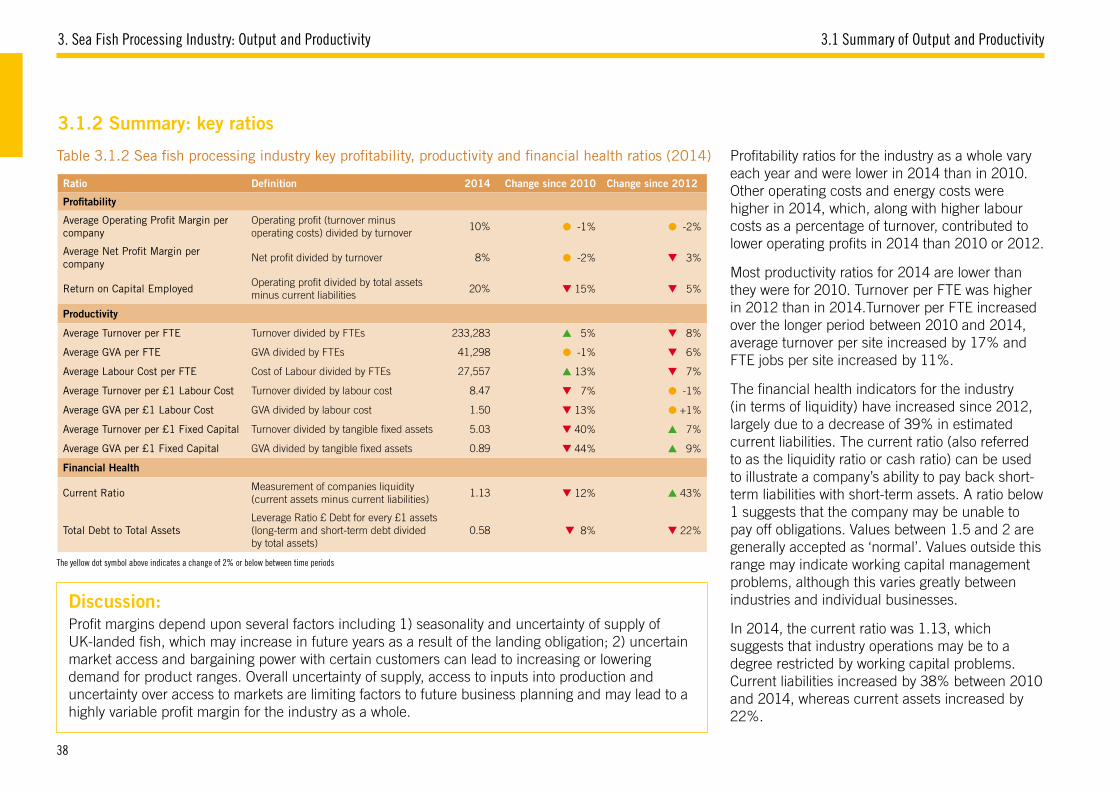
3. Sea Fish Processing Industry: Output and Productivity 3.1 Summary of Output and Productivity
Table 3.1.2 Sea fish processing industry key profitability, productivity and financial health ratios (2014)
Ratio Definition 2014 Change since 2010 Change since 2012
Profitability
Average Operating Profit Margin per company
Operating profit (turnover minus operating costs) divided by turnover
10% ● -1% ● -2%
Average Net Profit Margin per company
Net profit divided by turnover 8% ● -2% ▼ 3%
Return on Capital Employed Operating profit divided by total assets minus current liabilities
20% ▼ 15% ▼ 5%
Productivity
Average Turnover per FTE Turnover divided by FTEs 233,283 ▲ 5% ▼ 8%
Average GVA per FTE GVA divided by FTEs 41,298 ● -1% ▼ 6%
Average Labour Cost per FTE Cost of Labour divided by FTEs 27,557 ▲ 13% ▼ 7%
Average Turnover per £1 Labour Cost Turnover divided by labour cost 8.47 ▼ 7% ● -1%
Average GVA per £1 Labour Cost GVA divided by labour cost 1.50 ▼ 13% ● +1%
Average Turnover per £1 Fixed Capital Turnover divided by tangible fixed assets 5.03 ▼ 40% ▲ 7%
Average GVA per £1 Fixed Capital GVA divided by tangible fixed assets 0.89 ▼ 44% ▲ 9%
Financial Health
Current RatioMeasurement of companies liquidity (current assets minus current liabilities)
1.13 ▼ 12% ▲ 43%
Total Debt to Total AssetsLeverage Ratio £ Debt for every £1 assets (long-term and short-term debt divided by total assets)
0.58 ▼ 8% ▼ 22%
The yellow dot symbol above indicates a change of 2% or below between time periods
Profitability ratios for the industry as a whole vary each year and were lower in 2014 than in 2010. Other operating costs and energy costs were higher in 2014, which, along with higher labour costs as a percentage of turnover, contributed to lower operating profits in 2014 than 2010 or 2012.
Most productivity ratios for 2014 are lower than they were for 2010. Turnover per FTE was higher in 2012 than in 2014.Turnover per FTE increased over the longer period between 2010 and 2014, average turnover per site increased by 17% and FTE jobs per site increased by 11%.
The financial health indicators for the industry (in terms of liquidity) have increased since 2012, largely due to a decrease of 39% in estimated current liabilities. The current ratio (also referred to as the liquidity ratio or cash ratio) can be used to illustrate a company’s ability to pay back short-term liabilities with short-term assets. A ratio below 1 suggests that the company may be unable to pay off obligations. Values between 1.5 and 2 are generally accepted as ‘normal’. Values outside this range may indicate working capital management problems, although this varies greatly between industries and individual businesses.
In 2014, the current ratio was 1.13, which suggests that industry operations may be to a degree restricted by working capital problems. Current liabilities increased by 38% between 2010 and 2014, whereas current assets increased by 22%.
Discussion:Profit margins depend upon several factors including 1) seasonality and uncertainty of supply of UK-landed fish, which may increase in future years as a result of the landing obligation; 2) uncertain market access and bargaining power with certain customers can lead to increasing or lowering demand for product ranges. Overall uncertainty of supply, access to inputs into production and uncertainty over access to markets are limiting factors to future business planning and may lead to a highly variable profit margin for the industry as a whole.
3.1.2 Summary: key ratios
38
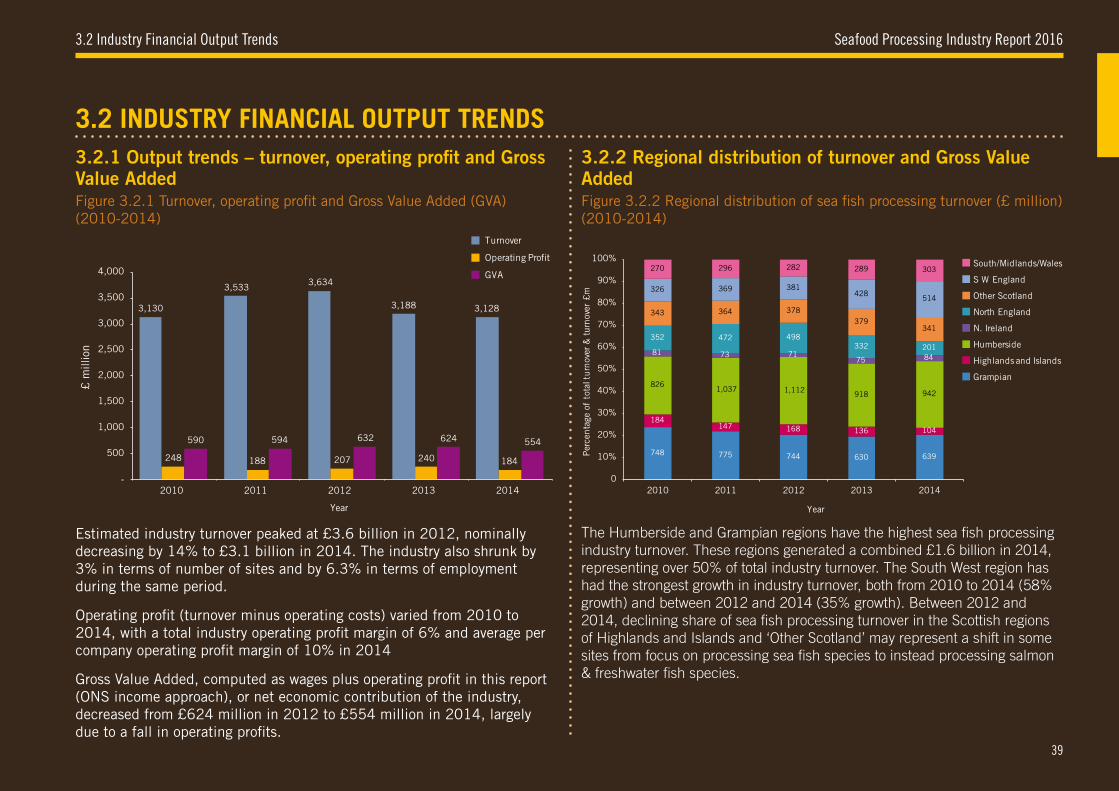
Seafood Processing Industry Report 2016
Figure 3.2.1 Turnover, operating profit and Gross Value Added (GVA) (2010-2014)
3.2 Industry Financial Output Trends
3.2.1 Output trends – turnover, operating profit and Gross Value Added
3.2 INDUSTRY FINANCIAL OUTPUT TRENDS
Estimated industry turnover peaked at £3.6 billion in 2012, nominally decreasing by 14% to £3.1 billion in 2014. The industry also shrunk by 3% in terms of number of sites and by 6.3% in terms of employment during the same period.
Operating profit (turnover minus operating costs) varied from 2010 to 2014, with a total industry operating profit margin of 6% and average per company operating profit margin of 10% in 2014
Gross Value Added, computed as wages plus operating profit in this report (ONS income approach), or net economic contribution of the industry, decreased from £624 million in 2012 to £554 million in 2014, largely due to a fall in operating profits.
3,130
3,533 3,634
3,188 3,128
248 188 207 240 184
590 594 632 624 554
-
500
1,000
1,500
2,000
2,500
3,000
3,500
4,000
2010 2011 2012 2013 2014
£ m
illio
n
Year
Turnover
Operating Profit
GVA
3.2.2 Regional distribution of turnover and Gross Value AddedFigure 3.2.2 Regional distribution of sea fish processing turnover (£ million) (2010-2014)
The Humberside and Grampian regions have the highest sea fish processing industry turnover. These regions generated a combined £1.6 billion in 2014, representing over 50% of total industry turnover. The South West region has had the strongest growth in industry turnover, both from 2010 to 2014 (58% growth) and between 2012 and 2014 (35% growth). Between 2012 and 2014, declining share of sea fish processing turnover in the Scottish regions of Highlands and Islands and ‘Other Scotland’ may represent a shift in some sites from focus on processing sea fish species to instead processing salmon & freshwater fish species.
748 775 744 630 639
184 147 168 136 104
826 1,037 1,112 918 942
81 73 71 75 84
352 472 498 332 201
343 364 378 379
341
326 369 381 428
514
270 296 282 289 303
2010 2011 2012 2013 2014
Year
Grampian
Highlands and Islands
Humberside
N. Ireland
North England
Other Scotland
S W England
South/Midlands/Wales100%
90%
80%
70%
60%
50%
40%
30%
20%
10%
0
Per
centa
ge o
f to
tal t
urn
over
& turn
over
£m
39
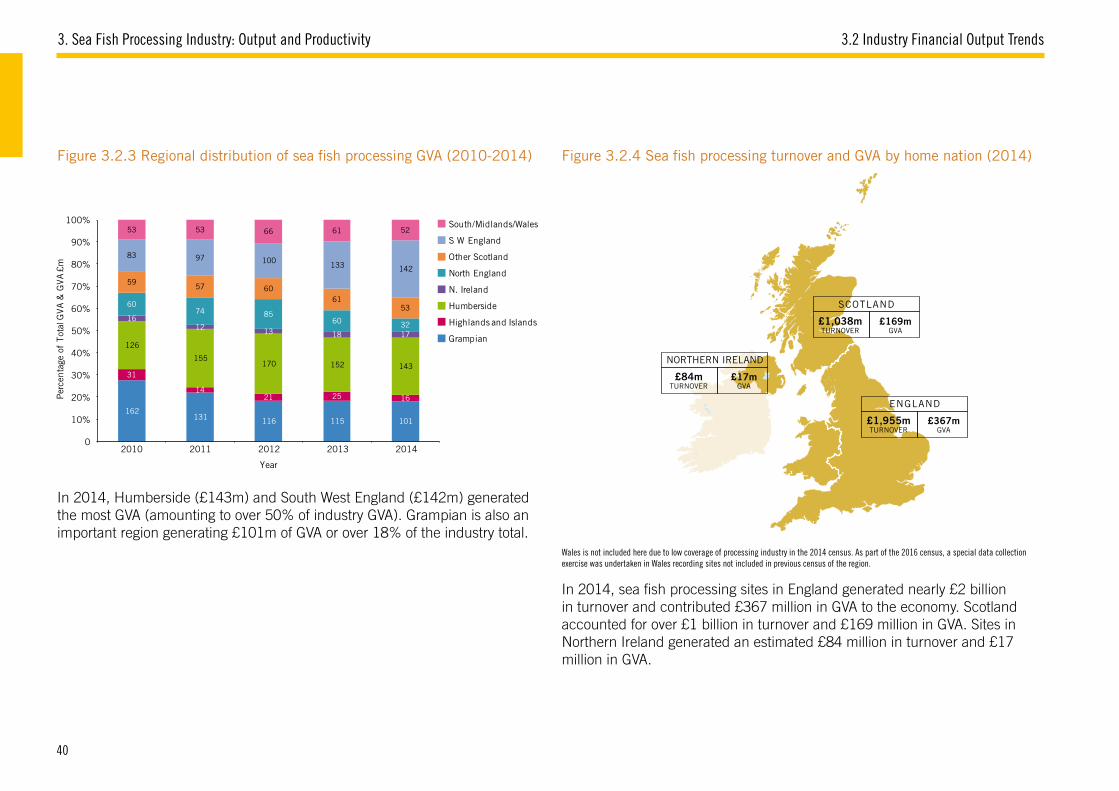
3. Sea Fish Processing Industry: Output and Productivity 3.2 Industry Financial Output Trends
Figure 3.2.3 Regional distribution of sea fish processing GVA (2010-2014) Figure 3.2.4 Sea fish processing turnover and GVA by home nation (2014)
In 2014, Humberside (£143m) and South West England (£142m) generated the most GVA (amounting to over 50% of industry GVA). Grampian is also an important region generating £101m of GVA or over 18% of the industry total.
3,130
3,5333,634
3,188 3,128
248 188 207 240 184
590 594 632 624 554
-
500
1,000
1,500
2,000
2,500
3,000
3,500
4,000
2010 2011 2012 2013 2014
£ m
illion
Year
Turnover
Operating Profit
GVA
748 775 744 630 639
184 147 168 136 104
826 1,037 1,112 918 942
81 73 71 75 84
352 472 498 332 201
343 364 378 379
341
326 369 381 428
514
270 296 282 289 303
2010 2011 2012 2013 2014
Per
centa
ge o
f Tot
al T
urn
over
& turn
over
£m
Year
162 131 116 115 101
31
14 21 25 16
126
155 170 152 143
16 12 13 18 17
60 74 85
60 32
59 57 60
61 53
83 97 100 133 142
53 53 66 61 52
2010 2011 2012 2013 2014
Per
centa
ge o
f Tot
al G
VA &
GVA £
m
Year
0 20 40 60 80 100 120 140 160
Retail Operations
Processors
Hospitality
Wholesaler
Retailers - Independent
Retailers - Supermarkets
No. of Sites
Typ
e of
Cust
omer
105
47
107
139
54
80
1-10
11-25
26-50
51-100
100+
100+
1-10
11-25
26-50
51-100
FTE Size Bands
24%
52%
3%8%
13%
Grampian
Highlands and Islands
Humberside
N. Ireland
North England
Other Scotland
S W England
South/Midlands/Wales
Grampian
Highlands and Islands
Humberside
N. Ireland
North England
Other Scotland
S W England
South/Midlands/Wales
100%
90%
80%
70%
60%
50%
40%
30%
20%
10%
0
100%
90%
80%
70%
60%
50%
40%
30%
20%
10%
0
1,955
1,083
84
367
169 17
-
200
400
600
800
1,000
1,200
1,400
1,600
1,800
2,000
England Scotland Northern Ireland
£m
Turnover GVA
SCOTLAND
TURNOVER GVA£1,038m £169m
NORTHERN IRELAND
TURNOVER GVA£84m £17m
ENGLAND
TURNOVER GVA£1,955m £367m
Wales is not included here due to low coverage of processing industry in the 2014 census. As part of the 2016 census, a special data collection exercise was undertaken in Wales recording sites not included in previous census of the region.
In 2014, sea fish processing sites in England generated nearly £2 billion in turnover and contributed £367 million in GVA to the economy. Scotland accounted for over £1 billion in turnover and £169 million in GVA. Sites in Northern Ireland generated an estimated £84 million in turnover and £17 million in GVA.
40
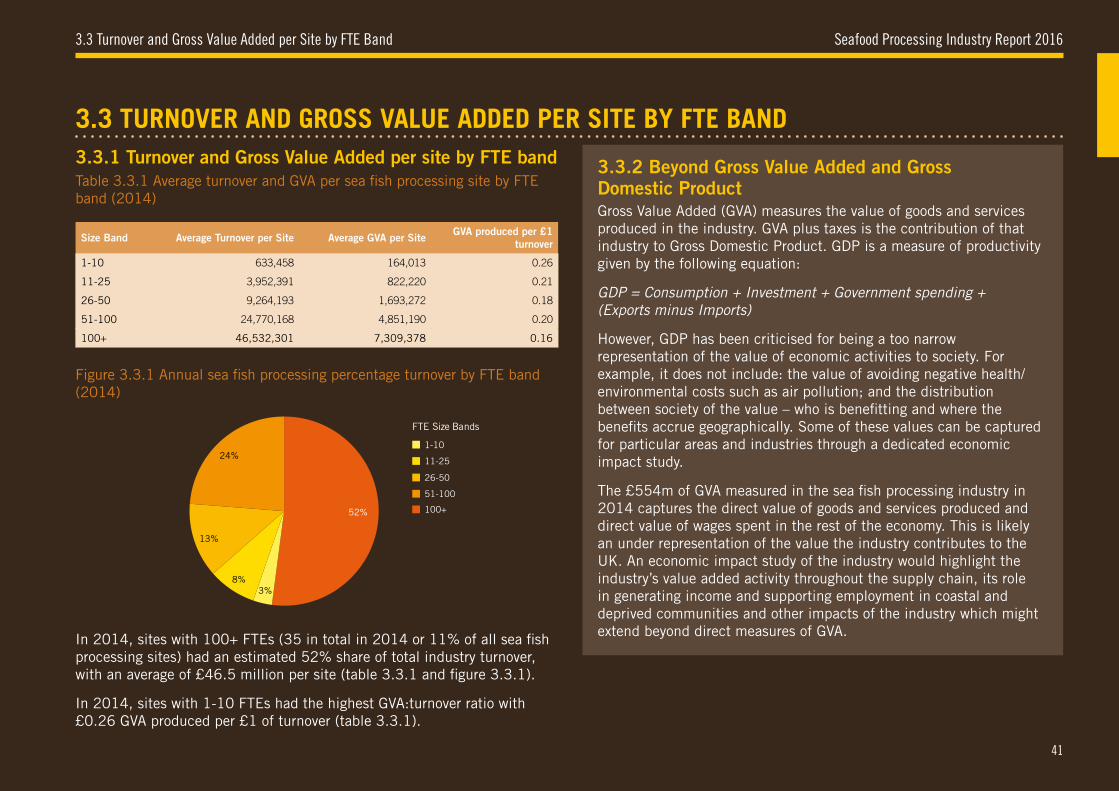
Seafood Processing Industry Report 2016
Table 3.3.1 Average turnover and GVA per sea fish processing site by FTE band (2014)
Figure 3.3.1 Annual sea fish processing percentage turnover by FTE band (2014)
3.3 Turnover and Gross Value Added per Site by FTE Band
In 2014, sites with 100+ FTEs (35 in total in 2014 or 11% of all sea fish processing sites) had an estimated 52% share of total industry turnover, with an average of £46.5 million per site (table 3.3.1 and figure 3.3.1).
In 2014, sites with 1-10 FTEs had the highest GVA:turnover ratio with £0.26 GVA produced per £1 of turnover (table 3.3.1).
Size Band Average Turnover per Site Average GVA per Site GVA produced per £1 turnover
1-10 633,458 164,013 0.26
11-25 3,952,391 822,220 0.21
26-50 9,264,193 1,693,272 0.18
51-100 24,770,168 4,851,190 0.20
100+ 46,532,301 7,309,378 0.16
3,130
3,5333,634
3,188 3,128
248 188 207 240 184
590 594 632 624 554
-
500
1,000
1,500
2,000
2,500
3,000
3,500
4,000
2010 2011 2012 2013 2014
£ m
illion
Year
Turnover
Operating Profit
GVA
748 775 744 630 639
184 147 168 136 104
826 1,037 1,112 918 942
81 73 71 75 84
352 472 498 332 201
343 364 378 379
341
326 369 381 428
514
270 296 282 289 303
2010 2011 2012 2013 2014
Per
centa
ge o
f Tot
al T
urn
over
& turn
over
£m
Year
162 131 116 115 101
31
14 21 25 16
126
155 170 152 143
16 12 13 18 17
60 74 85
60 32
59 57 60
61 53
83 97 100 133 142
53 53 66 61 52
2010 2011 2012 2013 2014
Per
centa
ge o
f Tot
al G
VA &
GVA £
m
Year
0 20 40 60 80 100 120 140 160
Retail Operations
Processors
Hospitality
Wholesaler
Retailers - Independent
Retailers - Supermarkets
No. of Sites
Typ
e of
Cust
omer
105
47
107
139
54
80
1-10
11-25
26-50
51-100
100+
100+
1-10
11-25
26-50
51-100
FTE Size Bands
24%
52%
3%8%
13%
Grampian
Highlands and Islands
Humberside
N. Ireland
North England
Other Scotland
S W England
South/Midlands/Wales
Grampian
Highlands and Islands
Humberside
N. Ireland
North England
Other Scotland
S W England
South/Midlands/Wales
100%
90%
80%
70%
60%
50%
40%
30%
20%
10%
0
100%
90%
80%
70%
60%
50%
40%
30%
20%
10%
0
1,955
1,083
84
367
169 17
-
200
400
600
800
1,000
1,200
1,400
1,600
1,800
2,000
England Scotland Northern Ireland
£m
Turnover GVA
3.3.1 Turnover and Gross Value Added per site by FTE band
41
3.3 TURNOVER AND GROSS VALUE ADDED PER SITE BY FTE BAND
3.3.2 Beyond Gross Value Added and Gross Domestic ProductGross Value Added (GVA) measures the value of goods and services produced in the industry. GVA plus taxes is the contribution of that industry to Gross Domestic Product. GDP is a measure of productivity given by the following equation:
GDP = Consumption + Investment + Government spending + (Exports minus Imports)
However, GDP has been criticised for being a too narrow representation of the value of economic activities to society. For example, it does not include: the value of avoiding negative health/ environmental costs such as air pollution; and the distribution between society of the value – who is benefitting and where the benefits accrue geographically. Some of these values can be captured for particular areas and industries through a dedicated economic impact study.
The £554m of GVA measured in the sea fish processing industry in 2014 captures the direct value of goods and services produced and direct value of wages spent in the rest of the economy. This is likely an under representation of the value the industry contributes to the UK. An economic impact study of the industry would highlight the industry’s value added activity throughout the supply chain, its role in generating income and supporting employment in coastal and deprived communities and other impacts of the industry which might extend beyond direct measures of GVA.
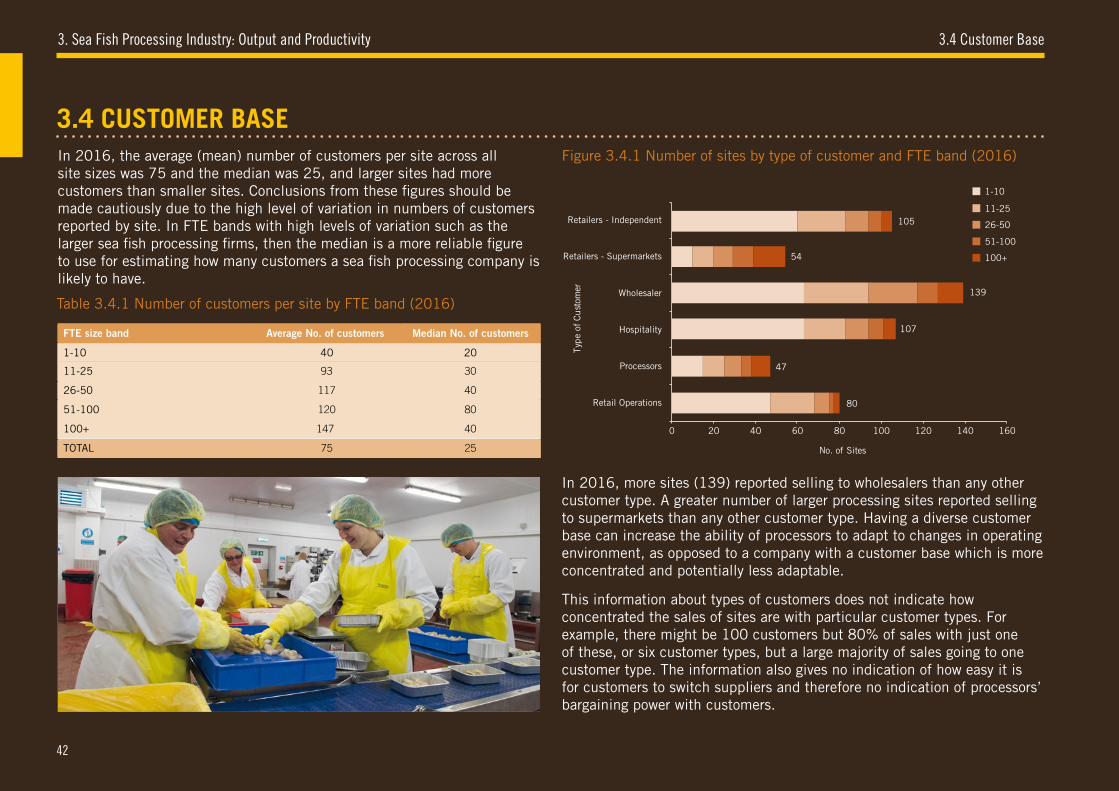
3. Sea Fish Processing Industry: Output and Productivity 3.4 Customer Base
In 2016, the average (mean) number of customers per site across all site sizes was 75 and the median was 25, and larger sites had more customers than smaller sites. Conclusions from these figures should be made cautiously due to the high level of variation in numbers of customers reported by site. In FTE bands with high levels of variation such as the larger sea fish processing firms, then the median is a more reliable figure to use for estimating how many customers a sea fish processing company is likely to have.
In 2016, more sites (139) reported selling to wholesalers than any other customer type. A greater number of larger processing sites reported selling to supermarkets than any other customer type. Having a diverse customer base can increase the ability of processors to adapt to changes in operating environment, as opposed to a company with a customer base which is more concentrated and potentially less adaptable.
This information about types of customers does not indicate how concentrated the sales of sites are with particular customer types. For example, there might be 100 customers but 80% of sales with just one of these, or six customer types, but a large majority of sales going to one customer type. The information also gives no indication of how easy it is for customers to switch suppliers and therefore no indication of processors’ bargaining power with customers.
FTE size band Average No. of customers Median No. of customers
1-10 40 20
11-25 93 30
26-50 117 40
51-100 120 80
100+ 147 40
TOTAL 75 25
3,130
3,5333,634
3,188 3,128
248 188 207 240 184
590 594 632 624 554
-
500
1,000
1,500
2,000
2,500
3,000
3,500
4,000
2010 2011 2012 2013 2014
£ m
illion
Year
Turnover
Operating Profit
GVA
748 775 744 630 639
184 147 168 136 104
826 1,037 1,112 918 942
81 73 71 75 84
352 472 498 332 201
343 364 378 379
341
326 369 381 428
514
270 296 282 289 303
2010 2011 2012 2013 2014
Per
centa
ge o
f Tot
al T
urn
over
& turn
over
£m
Year
162 131 116 115 101
31
14 21 25 16
126
155 170 152 143
16 12 13 18 17
60 74 85
60 32
59 57 60
61 53
83 97 100 133 142
53 53 66 61 52
2010 2011 2012 2013 2014
Per
centa
ge o
f Tot
al G
VA &
GVA £
m
Year
0 20 40 60 80 100 120 140 160
Retail Operations
Processors
Hospitality
Wholesaler
Retailers - Independent
Retailers - Supermarkets
No. of Sites
Typ
e of
Cust
omer
105
47
107
139
54
80
1-10
11-25
26-50
51-100
100+
100+
1-10
11-25
26-50
51-100
FTE Size Bands
24%
52%
3%8%
13%
Grampian
Highlands and Islands
Humberside
N. Ireland
North England
Other Scotland
S W England
South/Midlands/Wales
Grampian
Highlands and Islands
Humberside
N. Ireland
North England
Other Scotland
S W England
South/Midlands/Wales
100%
90%
80%
70%
60%
50%
40%
30%
20%
10%
0
100%
90%
80%
70%
60%
50%
40%
30%
20%
10%
0
1,955
1,083
84
367
169 17
-
200
400
600
800
1,000
1,200
1,400
1,600
1,800
2,000
England Scotland Northern Ireland
£m
Turnover GVA
42
Table 3.4.1 Number of customers per site by FTE band (2016)
Figure 3.4.1 Number of sites by type of customer and FTE band (2016)
3.4 CUSTOMER BASE
Seafood Processing Industry Report 2016
FISH PROCESSING: INDUSTRY BUSINESS ENVIRONMENT4
Overview
This section summarises the recent and current operating environment of the UK seafood processing industry and changes to that environment. The information presented in this section is based on three related research lines:
■ A thematic analysis of qualitative research conducted using semi-structured interviews with business owners, managers and other industry stakeholders.
■ Seafish work and research into the main areas of discussion; and
■ A brief review of case studies, news, and literature undertaken by the authors.
Seafish conducted a thematic analysis of ten qualitative interviews with industry representatives and four interviews with Seafish regional team members between May and September 2016. This sample should not be considered representative of the whole industry.
The majority of processors interviewed were exporters and a minority were importers. Interviews covered firms processing a mixed range of species. Most of the processors interviewed were large (100+ employees) but interviews were also undertaken with medium and small sized processors. Given this company size bias, the research findings represent bigger firms more than smaller firms.
The findings of the research were complemented, where appropriate and possible, with information gathered from secondary research. Sources of information included news reports and specialised industry magazines, seafood trade and consumption data, and primary data from our 2016 UK seafood processing industry census.
Appendix 4 Research Methods provides a detailed description of the methods used in the preparation of this section.
Through active horizon scanning, Seafish aims to support the UK seafood processing industry in identifying the potential longer term issues that can cause significant impacts to industry and in understanding the implications and options for action to address these issues. Seafish horizon scanning work involves regularly sweeping the seafood horizon and maintaining live risk maps for the seafood industry. Over 190 risk items were identified in 2015, and the work continues in 2017. Risk items are mapped as sets of ‘risk families’, in which specific risks are related to broader risks. These risks are ‘heat-mapped’ according to how likely they are to occur. From those risks showing a strong signal, industry operators and other stakeholders identify the priority risks: those that represent a high impact for industry from their perspective. Seafish has produced in depth reviews of the priority risks identified in 2015: product integrity, export trades, new NGO priorities, fish as food, climate change, food security and Brexit. The reviews can be found in http://www.seafish.org/industry-support/seafood-horizons.
Based on the information and methods described at the beginning of this section, some of the risks to fish processors are summarised along with other factors influencing the fish processing operating environment.
43
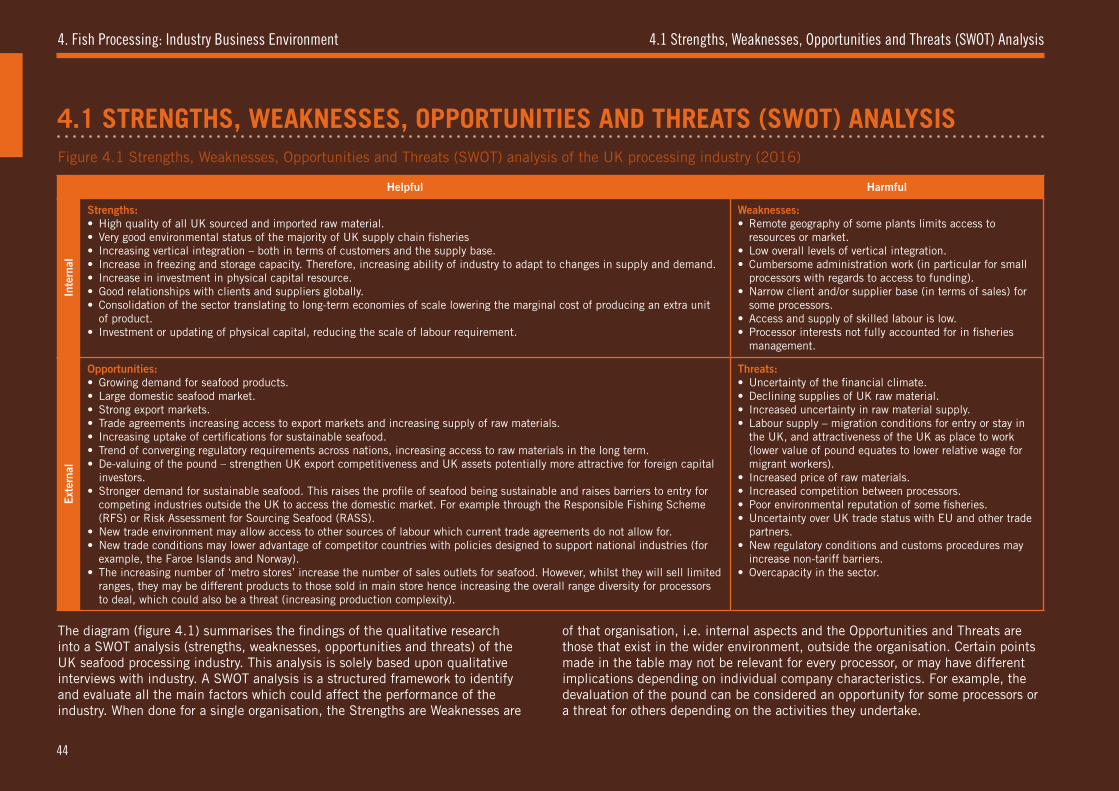
4. Fish Processing: Industry Business Environment
4.1 STRENGTHS, WEAKNESSES, OPPORTUNITIES AND THREATS (SWOT) ANALYSIS
4.1 Strengths, Weaknesses, Opportunities and Threats (SWOT) Analysis
Figure 4.1 Strengths, Weaknesses, Opportunities and Threats (SWOT) analysis of the UK processing industry (2016)
The diagram (figure 4.1) summarises the findings of the qualitative research into a SWOT analysis (strengths, weaknesses, opportunities and threats) of the UK seafood processing industry. This analysis is solely based upon qualitative interviews with industry. A SWOT analysis is a structured framework to identify and evaluate all the main factors which could affect the performance of the industry. When done for a single organisation, the Strengths are Weaknesses are
of that organisation, i.e. internal aspects and the Opportunities and Threats are those that exist in the wider environment, outside the organisation. Certain points made in the table may not be relevant for every processor, or may have different implications depending on individual company characteristics. For example, the devaluation of the pound can be considered an opportunity for some processors or a threat for others depending on the activities they undertake.
Helpful Harmful
Inte
rnal
Strengths:• High quality of all UK sourced and imported raw material.• Very good environmental status of the majority of UK supply chain fisheries• Increasing vertical integration – both in terms of customers and the supply base.• Increase in freezing and storage capacity. Therefore, increasing ability of industry to adapt to changes in supply and demand.• Increase in investment in physical capital resource.• Good relationships with clients and suppliers globally.• Consolidation of the sector translating to long-term economies of scale lowering the marginal cost of producing an extra unit
of product.• Investment or updating of physical capital, reducing the scale of labour requirement.
Weaknesses:• Remote geography of some plants limits access to
resources or market.• Low overall levels of vertical integration.• Cumbersome administration work (in particular for small
processors with regards to access to funding).• Narrow client and/or supplier base (in terms of sales) for
some processors.• Access and supply of skilled labour is low.• Processor interests not fully accounted for in fisheries
management.
Ext
erna
l
Opportunities:• Growing demand for seafood products.• Large domestic seafood market.• Strong export markets.• Trade agreements increasing access to export markets and increasing supply of raw materials.• Increasing uptake of certifications for sustainable seafood.• Trend of converging regulatory requirements across nations, increasing access to raw materials in the long term.• De-valuing of the pound – strengthen UK export competitiveness and UK assets potentially more attractive for foreign capital
investors.• Stronger demand for sustainable seafood. This raises the profile of seafood being sustainable and raises barriers to entry for
competing industries outside the UK to access the domestic market. For example through the Responsible Fishing Scheme (RFS) or Risk Assessment for Sourcing Seafood (RASS).
• New trade environment may allow access to other sources of labour which current trade agreements do not allow for.• New trade conditions may lower advantage of competitor countries with policies designed to support national industries (for
example, the Faroe Islands and Norway).• The increasing number of ‘metro stores’ increase the number of sales outlets for seafood. However, whilst they will sell limited
ranges, they may be different products to those sold in main store hence increasing the overall range diversity for processors to deal, which could also be a threat (increasing production complexity).
Threats:• Uncertainty of the financial climate.• Declining supplies of UK raw material.• Increased uncertainty in raw material supply.• Labour supply – migration conditions for entry or stay in
the UK, and attractiveness of the UK as place to work (lower value of pound equates to lower relative wage for migrant workers).
• Increased price of raw materials.• Increased competition between processors.• Poor environmental reputation of some fisheries.• Uncertainty over UK trade status with EU and other trade
partners.• New regulatory conditions and customs procedures may
increase non-tariff barriers.• Overcapacity in the sector.
44
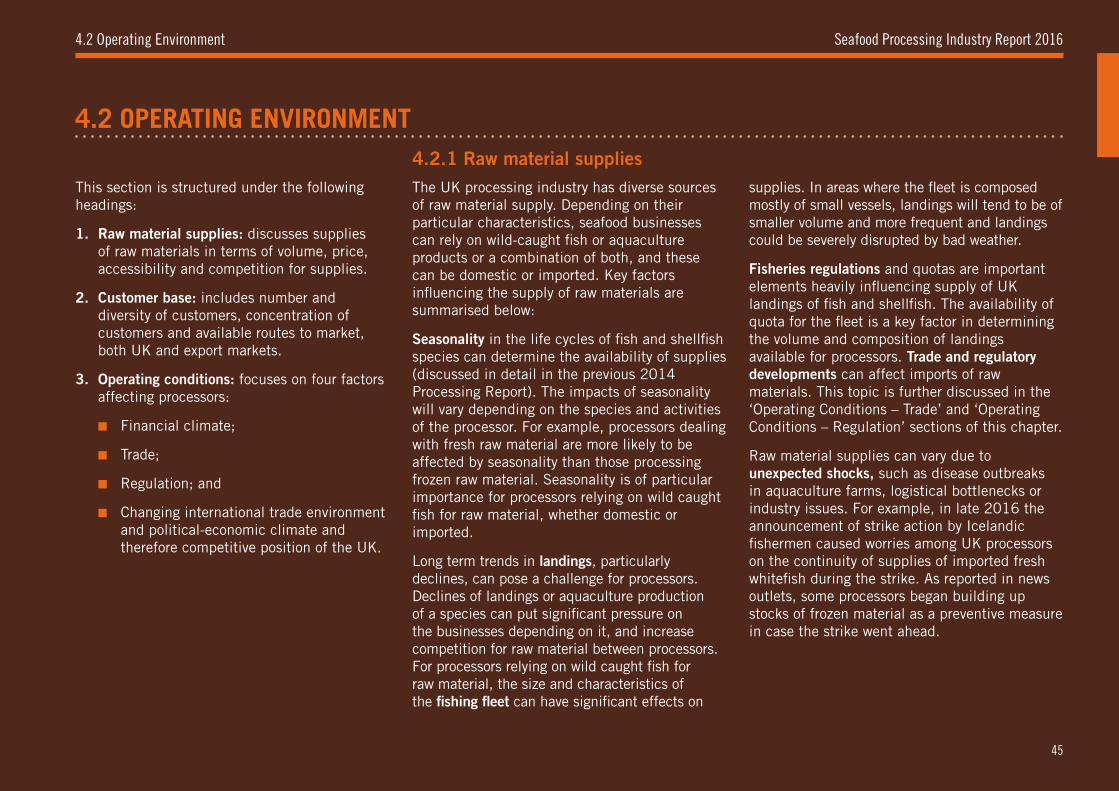
Seafood Processing Industry Report 2016
4.2 OPERATING ENVIRONMENT
4.2 Operating Environment
This section is structured under the following headings:
1. Raw material supplies: discusses supplies of raw materials in terms of volume, price, accessibility and competition for supplies.
2. Customer base: includes number and diversity of customers, concentration of customers and available routes to market, both UK and export markets.
3. Operating conditions: focuses on four factors affecting processors:
■ Financial climate;
■ Trade;
■ Regulation; and
■ Changing international trade environment and political-economic climate and therefore competitive position of the UK.
4.2.1 Raw material suppliesThe UK processing industry has diverse sources of raw material supply. Depending on their particular characteristics, seafood businesses can rely on wild-caught fish or aquaculture products or a combination of both, and these can be domestic or imported. Key factors influencing the supply of raw materials are summarised below:
Seasonality in the life cycles of fish and shellfish species can determine the availability of supplies (discussed in detail in the previous 2014 Processing Report). The impacts of seasonality will vary depending on the species and activities of the processor. For example, processors dealing with fresh raw material are more likely to be affected by seasonality than those processing frozen raw material. Seasonality is of particular importance for processors relying on wild caught fish for raw material, whether domestic or imported.
Long term trends in landings, particularly declines, can pose a challenge for processors. Declines of landings or aquaculture production of a species can put significant pressure on the businesses depending on it, and increase competition for raw material between processors. For processors relying on wild caught fish for raw material, the size and characteristics of the fishing fleet can have significant effects on
supplies. In areas where the fleet is composed mostly of small vessels, landings will tend to be of smaller volume and more frequent and landings could be severely disrupted by bad weather.
Fisheries regulations and quotas are important elements heavily influencing supply of UK landings of fish and shellfish. The availability of quota for the fleet is a key factor in determining the volume and composition of landings available for processors. Trade and regulatory developments can affect imports of raw materials. This topic is further discussed in the ‘Operating Conditions – Trade’ and ‘Operating Conditions – Regulation’ sections of this chapter.
Raw material supplies can vary due to unexpected shocks, such as disease outbreaks in aquaculture farms, logistical bottlenecks or industry issues. For example, in late 2016 the announcement of strike action by Icelandic fishermen caused worries among UK processors on the continuity of supplies of imported fresh whitefish during the strike. As reported in news outlets, some processors began building up stocks of frozen material as a preventive measure in case the strike went ahead.
45
4. Fish Processing: Industry Business Environment 4.2 Operating Environment
By-Products: The case for continuing research into utilisation
All seafood processing results in by-products which can add up to a substantial amount for every kilogramme of seafood processed.
Current information on the level and utilisation of by-products in the UK is limited. In 2013 SINTEF (the Scandinavian independent research organisation) analysed marine by-products in Norway. Available volumes of by-products as a proportion of species category were found to amount to 44% of demersal fish, 18% pelagic, 26% in aquaculture and 50% of crustaceans. This by-product material can be used in a variety of industries including human consumption, animal feed, clothing, production of oils, fish feed (an area of growing demand due to expansion of aquaculture), industrial uses and so on. In Norway, 100% of pelagic fish processed is utilised.
Several qualitative and quantitative studies on seafood by-products have been published in recent years seeking to assess if and how utilisation and value of these by-products could increase. The Nordic Institute conducted a study on ‘Maximum resource utilisation – Value-added fish by-products’ which concluded that the value of processing (waste) water, rest of raw materials and under-utilised species could be increased.
Arguably, there exists a large opportunity to maximise revenue through exploring more options for seafood by-products. Additional investment or support towards research of by-product utilisation may increase the value of such products, which could potentially lead to additional revenue generation for processors for every tonne of raw material purchased.
To attempt to mitigate variability of supply processors can: 1) invest in storage and freezing capacity; 2) be flexible in changing processing activities or species in response to supply; 3) attempt to increase diversity of supply sources; or 4) increase vertical integration to attempt
to secure greater amount or proportion of supply. However, the precautions listed above can be costly (for example, high up-front costs for changing the production line, processing capacity and integration) and difficult to achieve.
46
Seafood Processing Industry Report 20164.2 Operating Environment
Comments from industry Industry managers highlighted that the majority of raw material for the UK market is imported and that the UK is dependent on imported seafood to meet demand in most species type categories. Industry managers mentioned the high quality of UK and imported raw material as one of the strengths of the processing industry, in addition to having good relationships with suppliers globally. Processors use different strategies to counteract the impacts of seasonality on supplies, such as investing in storage and freezing, although in more remote areas this can be difficult due to lack of infrastructure; and having flexibility in the range of product on offer.
There was a general perception among processors of declining quantities of supplies and increasing prices for domestic raw material. In addition, processors reported increased competition between companies for raw materials. In this context there are different strategies processors can use to secure supplies, ranging from owning or supporting fishing boats to strengthening deals with vessel owners. Fluctuations in exchange rates can also affect the price of imported raw materials.
Total allowable catches, quotas and other fisheries regulations were highlighted as the main factors controlling supplies to processors relying on wild fisheries. For example, the price of herring had increased in late 2016 by nearly 40% compared to the same period in 2015 in part due to a lower UK quota that restricted supplies. There were concerns among industry on possible future impacts of the Landing Obligation on supplies. These concerns related both to potential impacts on landings and on the viability of the fishing businesses that supply processors. The Landing Obligation is discussed further in the section ‘Operating Conditions – Regulation’ of this chapter.
Ensuring the sustainability of fishing activities that provide raw material is a key concern for processors. A number of interviewees mentioned an increasing customer focus on the environmental record of seafood products. Seafish regional staff suggested that assisting the catching sector to improve their environmental profile, such as achieving MSC certification, can benefit processing businesses by ensuring a sustainably caught raw material supply and avoiding reputational damage. Carrying a symbol of sustainability can also help the final product compete in the retail market.
What Seafish is doingSeafish is committed to supporting responsible sourcing throughout the supply chain and promoting best environmental practice. Initiatives developed by Seafish to achieve this are the Responsible Fishing Scheme (RFS) for fishermen and the Risk Assessment for Sourcing Seafood (RASS) website for businesses which buy seafood. Seafish supports industry and stakeholder discussion forums on responsible sourcing. For more information, visit: http://www.seafish.org/responsible-sourcing
47
4. Fish Processing: Industry Business Environment 4.2 Operating Environment
Seafood processors sell to a wide variety of customers in the UK, such as retailers, wholesalers and foodservice businesses. Some processors also sell directly to retail customers by having a sales point in their own premises or by providing a delivery service. Section 3.4 ‘Customer base’ provides an overview of the customer base of UK seafood processors.
Depending on the customer base, a processor may have different contract arrangements in place. Contracts with big retail units guarantee business for a period of time but also normally result in a reduced customer base and a long period of fixed sales prices. Renegotiation of such contracts can impose a great pressure on processors if a significant share of their business depends on them.
Changes in retail markets, such as the increase in city metro stores, increases the number of sales outlets for seafood. However, these outlets stock a limited range of seafood, which may have implications in some cases for seasonal stock processing.
Several of the seafood processors interviewed export their products. According to the Seafish 2016 Census of the UK seafood processing industry, approximately a third of sea fish processors were exporters (33% of the total number of sites). This percentage has remained largely stable from 2014 to 2016.
4.2.2 Customer base
Comments from industry Most of the processors interviewed explained that demand for their products in the UK market has increased in recent years. Seafish Market Insight colleagues also pointed towards more interest in seafood by consumers which is allowing businesses to grow. This view is supported by Seafish market research, which shows that in 2015 and the first half of 2016 seafood consumption in the UK returned to growth (from pre-recession levels), particularly in the foodservice sector.
Processors also perceived that the market has become more competitive in recent years up to 2016 and there was increased demand for innovation in products. There was a general perception of increasing numbers of new and expanding businesses leading to yet further competition between companies. Media and news interviews with processing industry business managers have indicated that those managers anticipate the expansion of capacity and increased competition will drive further consolidation in the industry in the years to come.
Deals with large customers such as big retailers are often associated with periods of fixed prices, which can hinder a processor’s capability to react to developments in raw material prices or other issues. For example, in late 2016, it was reported that several well-established seafood product
brands were requesting retailers to increase the retail prices of their products to enable processors to cope with increasing raw material costs due to the lower value of the pound.
Interviewees generally reported strong export markets. EU and Asia were the main markets reported. Demand for seafood products in Asian markets was reported as growing, with several businesses exporting or looking to export to that region.
What Seafish is doingSeafish’s Market Insight team conducts market research to advise and inform all sectors of the seafood industry. Analyses include seafood sales, consumption, trade and key foodservice trends. This analysis is available via the Seafish website at http://www.seafish.org/research-economics/market-insight
Seafish works to facilitate growth in both the import and export seafood markets. Seafish helps promote the UK seafood industry in export markets, raising the profile of the range, diversity and quality of UK seafood. Seafish also provides export profiles for international exporters in the UK. For more information visit http://www.seafish.org/industry-support/international-trade/international-export-advice
48
Seafood Processing Industry Report 20164.2 Operating Environment
4.2.3 Operating conditions: Financial climate
UK Economy 2016 OverviewThe UK economy grew by 0.5% in the third quarter of 2016 (Office of National Statistics (ONS)). There has been upward pressure on prices, and higher prices of imported goods and oil (with an expectation after the OPEC talks in late 2016 that oil prices would rise). There will have been a delayed effect on prices from a decrease in the value of Sterling, (in October 2016 the value of Sterling was 20% lower than in October 2015 against a basket of currencies in the Exchange Rate Index) as businesses will have hedged against this through buying currency (dollars or Euros) in advance or pre-purchasing materials. The ONS reported early signs of the trade balance re-adjusting following the depreciation of sterling. Following the EU referendum, consumer spending and business investments have both broadly held up in the short-term. The UK interest rate was set to a new low in August 2016 reducing from 0.5% to 0.25% (The Bank of England).
UK Economy 2010-2014 Economic TrendsThe annual rate of inflation fell sharply between 2010 and 2014 from 3.7% in December 2010 to 0.5% in December 2014. Interest rates have also been historically low during this period kept steady at 0.5% throughout the period (rate set by the Bank of England in March 2009). Growth in GDP has been slow since the financial crisis of 2008, only hitting 3% in 2014. GDP growth per person
only reached above pre-recession growth in the second quarter of 2015, a full seven years after the initial downturn. The rate of unemployment was 5.7% of the labour force in the last quarter of 2014 moving towards pre-downturn levels (5.1% average between 2002 and 2007) and 2%-3% lower than the unemployment rate from the beginning of 2010 to the end of 2013 (ONS).
Between 2008 and 2014, UK real wage growth decreased by more than in most other countries in the Organisation for Economic Co-operation and Development (OECD Employment Outlook, 2016). UK real wages (change in earnings minus inflation) decreased consistently over most of the period between 2010 and 2014, and decreased by an average of 2.2% per annum from 2010 to 2013 (ONS, “An Examination of Falling Real Wages”, 2014). In the last quarter of 2014, growth in real wages was positive, (nominal wage growth was ahead of CPI inflation (median real wage growth only just ahead of inflation)), mainly because price inflation had decreased over the period rather than an increase in nominal wage growth (London School of Economics - http://blogs.lse.ac.uk/politicsandpolicy/real-wages-and-living-standards-the-latest-uk-evidence/).
Sea Fish Processing Industry Investment 2010-2014The 2014 sea fish processing industry reported investment increased by an estimated 69% from 2012 and more than doubled since 2010 to just
under £40m. Much of this increase may relate to expenditure on plant and equipment to expand capacity. There may also be a sample bias effect in this apparent increase.
Comments from industryAt the time interviews took place, most interviewees reported feeling confident about the current financial climate, however it should be acknowledged that since this time financial uncertainty has increased. This confidence varied according to industry characteristics, for example companies processing certain species such as demersal fish processors reported a more cautious outlook. Most interviewees aspired for their businesses to grow over the next 5 years. However, the changing international trade climate and uncertainty of the form it will take and implications for industry might have dampened these expectations. Many processors were investing in their activities or looking to do so in the near future. These investments can include a range of elements, such as new premises and/or equipment and research and development activities.
Companies reported easier access to funding than in recent time periods, although this is an element they believed could still improve. Companies use a variety of sources to finance investment including profits and external funding, e.g. borrowing, grants or funds such as EMFF for those companies that qualify. Seafish colleagues highlighted that funding remains an issue for small companies.
49
4. Fish Processing: Industry Business Environment
Imports are vitally important for the UK supply of raw material across different fish species categories. Most of the seafood consumed in the UK comes from overseas. The UK also exports significant amounts of seafood products every year. International trade is a significant, or the most important, part of business activities for many seafood processors.
The principle of free movement of goods within the EU means that food, including seafood, can be traded across member state borders with minimal restrictions. Free movement is possible because customs procedures as well as legislation covering food safety, food labelling and animal health are harmonised within the EU. However full harmonisation does not exist between member states and a small number of non-harmonised rules can act as technical barriers to trade.
One of the more obvious barriers to trade relates to national language. Most member states specify which language is permitted to be used on seafood labels and other mandatory information. Most member states allow labels to have multiple translations, but insist that the national language may not be less prominent than the translations. This means that a trader who has goods labelled in one particular language may not be able to market them in certain member states without adapting the labels.
4.2.4 Operating conditions: Trade
Some European legislation covering permitted levels of contaminants places barriers on the marketing of goods outside the country of production. For example, certain traditional smoked fish products produced in the UK with polycyclic aromatic hydrocarbon (PAH) levels in excess of EU-wide levels may be marketed in the UK, but not in other member states. Another trade barrier may be a national measure to protect food safety. For example, the Netherlands has a national measure requiring all mussels and oysters entering its territory to have a tetrodotoxin level below 20 μg/kg (micrograms per kilogramme). Restrictions on the movement of live animals to prevent the spread of animal diseases may constitute another barrier to trade.
Trade between EU countries and other nations is strictly regulated. Seafood imports must conform to European food quality and safety standards, while exports must comply with the regular EU-wide requirements and with any supplementary requirements the importing country may have. In 2016, approximately a third of sea fish processors were exporters. The EU was by far the main export destination reported by those processors who provided details of their export markets, followed by countries in Asia and North America.
Comments from industry Processors highlighted the importance of imports from third countries (non-EU countries, principally Norway, Iceland, USA, Russia and Canada). To illustrate the importance of imports from third countries processors gave the example of imports of some major whitefish species: for some of these processors non-EU imports were estimated to amount to 90% of total supply.
Most processors reported not having any particular concerns related to trade agreements or barriers. However, Seafish colleagues highlighted a number of topics that may pose issues or opportunities for the UK processing sector, as described below.
The 2014 Russian embargo on food imports from the EU, US and other Western countries is still an ongoing issue for the UK processing industry. There were direct impacts for companies that exported to Russia, particularly pelagic processors. In addition, the processing sector was indirectly affected as countries that used to export to Russia, such as Norway, started selling their product in European markets.
European regulations to combat illegal, unreported and unregulated (IUU) fishing require that imported seafood is accompanied by a catch certificate. This requirement has caused importers to examine their supply chain and take appropriate steps to ensure that the fish originates
4.2 Operating Environment
50
Seafood Processing Industry Report 2016
from a legitimate source. In 2016, seafood caught by vessels flagged to Cambodia was not allowed to enter the EU because of Cambodia’s lack of progress towards tackling IUU issues. Thailand, Taiwan and the Solomon Islands are currently among the countries on yellow cards, meaning that they must urgently address IUU fishing or risk facing restrictions on their ability to export to the EU.
Tariffs and trade agreements are an important influence on seafood trade to and from the UK. At present the UK benefits from free trade with other member states within the EU. UK importers also benefit from low or zero tariffs when trading with countries that have trade agreements with the EU or that are in a tariff preference regime, in particular the Generalised System of Preferences (GSP). For example, the European Economic Area agreement allows fish imports from Iceland and Norway on a preferential tariff. In the period 2016 to 2018, EU fish processors will be able to benefit from the latest round of autonomous tariff quotas (ATQs) on haddock, anchovies and prawns. In general, tariffs are higher for processed seafood than for unprocessed seafood. Over the last few years, the UK and other European member states have lost GSP preferences on goods from a number of countries, most importantly Thailand and China. The EU is reluctant to enter into a trade agreement with Thailand until the political situation has become more stable, while some raw material from China continues to be imported with favourable tariffs under ATQs.
European Union hygiene requirements dictate that seafood imports can only come from third countries that appear on official lists. Currently there are around 100 third countries from which fishery products can be imported (although, there are only 13 countries for bivalve molluscs). For aquaculture imports there are additional restrictions, mainly that exporting countries need to have a residue sampling plan approved by the European Commission. This restricts the number of third countries permitted to export aquaculture products to the EU to about 60% of the countries permitted to export fisheries products. Several countries, including China, Bangladesh and India, continue to have additional testing requirements placed on aquaculture exports in order to ensure that products reaching EU consumers comply with antibiotic residue requirements.
Over the last two years, the European Union has applied a number of trade agreements that resulted in lower tariffs on seafood from several states. These include the CARIFORUM states (The Forum of the Caribbean Group of African, Caribbean and Pacific (ACP) States), several Central and South American countries such as El Salvador, Costa Rica, Colombia and Peru; South Korea, Mauritius, the Seychelles and some African countries including The Republic of South Africa. Other trade agreements have been finalised in the last two years, but are not yet being applied. These include agreements with Canada (the Comprehensive Economic and Trade Agreement,
CETA), Vietnam, Ecuador and blocs of (Eastern, Western and Southern) African countries. These trade agreements are expected to have positive impacts on EU seafood trade as tariffs on imports will be reduced or eliminated; but a number of processors that rely on local produce were concerned that these agreements may harm their businesses by increasing competition from imported sources of seafood.
What Seafish is doingSeafish produces and maintains an up-to-date guide on applicable legislation to seafood imports into the UK. The guidance can be found in http://www.seafish.org/industry-support/legislation/import-and-export/import-guidance. Seafish’s website also provides information on legislation relating to seafood exports. Seafish produces regular newsletters and updates on any developments on seafood trade that can affect UK businesses.
4.2 Operating Environment
51
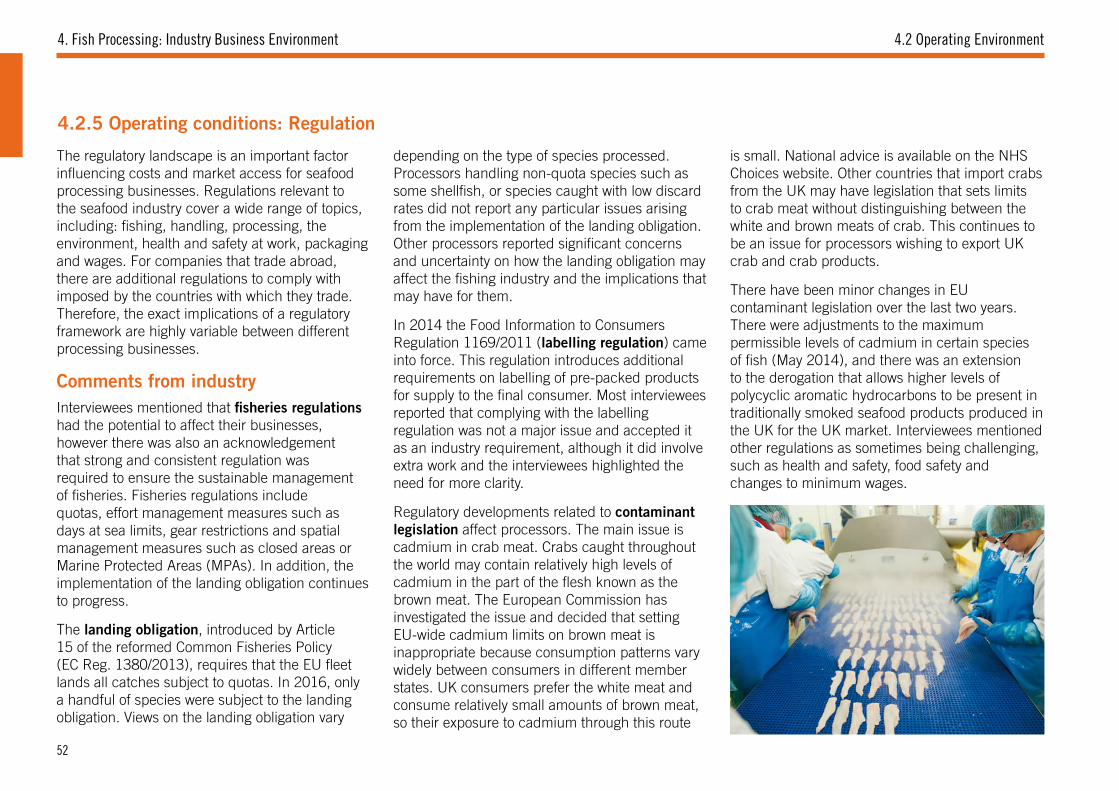
4. Fish Processing: Industry Business Environment 4.2 Operating Environment
The regulatory landscape is an important factor influencing costs and market access for seafood processing businesses. Regulations relevant to the seafood industry cover a wide range of topics, including: fishing, handling, processing, the environment, health and safety at work, packaging and wages. For companies that trade abroad, there are additional regulations to comply with imposed by the countries with which they trade. Therefore, the exact implications of a regulatory framework are highly variable between different processing businesses.
Comments from industryInterviewees mentioned that fisheries regulations had the potential to affect their businesses, however there was also an acknowledgement that strong and consistent regulation was required to ensure the sustainable management of fisheries. Fisheries regulations include quotas, effort management measures such as days at sea limits, gear restrictions and spatial management measures such as closed areas or Marine Protected Areas (MPAs). In addition, the implementation of the landing obligation continues to progress.
The landing obligation, introduced by Article 15 of the reformed Common Fisheries Policy (EC Reg. 1380/2013), requires that the EU fleet lands all catches subject to quotas. In 2016, only a handful of species were subject to the landing obligation. Views on the landing obligation vary
4.2.5 Operating conditions: Regulation
depending on the type of species processed. Processors handling non-quota species such as some shellfish, or species caught with low discard rates did not report any particular issues arising from the implementation of the landing obligation. Other processors reported significant concerns and uncertainty on how the landing obligation may affect the fishing industry and the implications that may have for them.
In 2014 the Food Information to Consumers Regulation 1169/2011 (labelling regulation) came into force. This regulation introduces additional requirements on labelling of pre-packed products for supply to the final consumer. Most interviewees reported that complying with the labelling regulation was not a major issue and accepted it as an industry requirement, although it did involve extra work and the interviewees highlighted the need for more clarity.
Regulatory developments related to contaminant legislation affect processors. The main issue is cadmium in crab meat. Crabs caught throughout the world may contain relatively high levels of cadmium in the part of the flesh known as the brown meat. The European Commission has investigated the issue and decided that setting EU-wide cadmium limits on brown meat is inappropriate because consumption patterns vary widely between consumers in different member states. UK consumers prefer the white meat and consume relatively small amounts of brown meat, so their exposure to cadmium through this route
is small. National advice is available on the NHS Choices website. Other countries that import crabs from the UK may have legislation that sets limits to crab meat without distinguishing between the white and brown meats of crab. This continues to be an issue for processors wishing to export UK crab and crab products.
There have been minor changes in EU contaminant legislation over the last two years. There were adjustments to the maximum permissible levels of cadmium in certain species of fish (May 2014), and there was an extension to the derogation that allows higher levels of polycyclic aromatic hydrocarbons to be present in traditionally smoked seafood products produced in the UK for the UK market. Interviewees mentioned other regulations as sometimes being challenging, such as health and safety, food safety and changes to minimum wages.
52
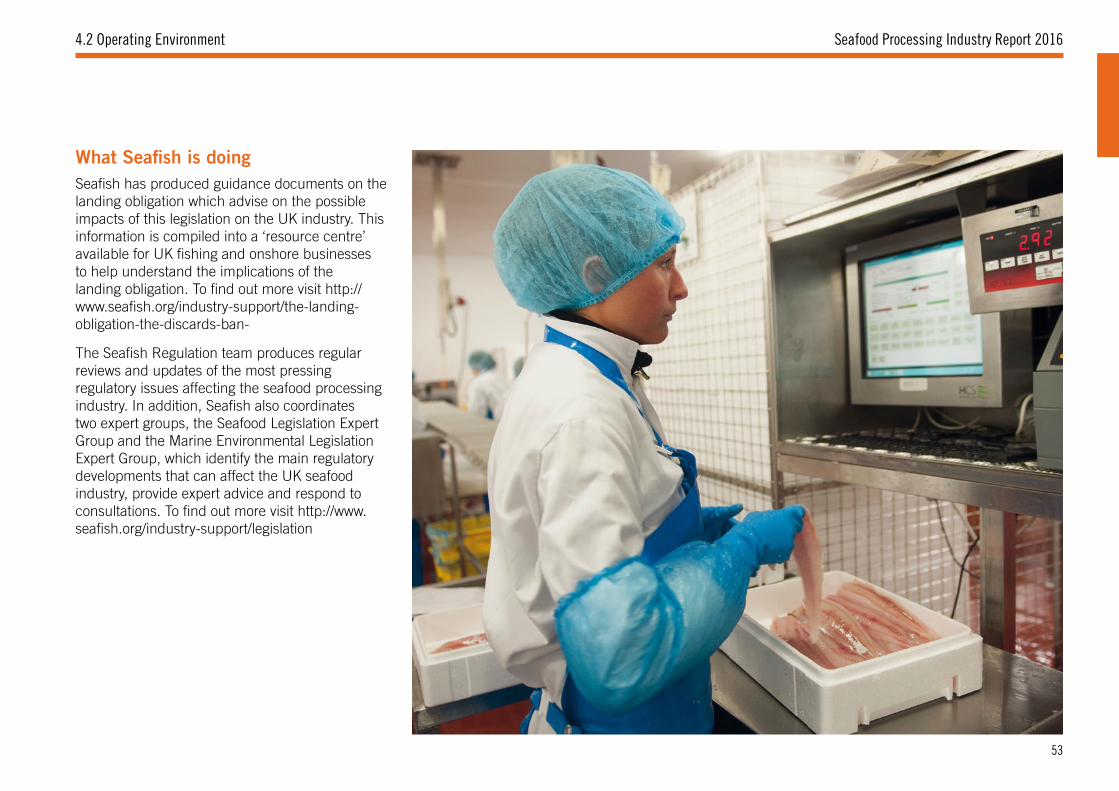
Seafood Processing Industry Report 20164.2 Operating Environment
What Seafish is doingSeafish has produced guidance documents on the landing obligation which advise on the possible impacts of this legislation on the UK industry. This information is compiled into a ‘resource centre’ available for UK fishing and onshore businesses to help understand the implications of the landing obligation. To find out more visit http://www.seafish.org/industry-support/the-landing-obligation-the-discards-ban-
The Seafish Regulation team produces regular reviews and updates of the most pressing regulatory issues affecting the seafood processing industry. In addition, Seafish also coordinates two expert groups, the Seafood Legislation Expert Group and the Marine Environmental Legislation Expert Group, which identify the main regulatory developments that can affect the UK seafood industry, provide expert advice and respond to consultations. To find out more visit http://www.seafish.org/industry-support/legislation
53
4. Fish Processing: Industry Business Environment
trade were at a level where the financial cost could be significantly reduced by currency fluctuations.
UK fisheries management came up during interviews as something that would have an effect on future raw material supplies. It is likely that there will be some kind of arrangement or agreement between the EU and the UK with regards to fisheries management, but its exact nature is as yet unknown.
The wider economic effects of these changes could change the way some processors operate, such as sourcing of supplies, or processing business models. For example, the drop in value of the pound makes exports more competitive but domestic food and imports more expensive. It also could lead to a rise in inflation rates and an increase in interest rates making the cost of borrowing money more expensive and holding money more lucrative. Several interviewees expressed their desire that industry should have an active role in UK-EU negotiations to ensure the views of the seafood sector are adequately represented.
The UK intends to leave the European Union (EU) following the results of the referendum on UK membership of the EU held on 23rd June 2016. The outcomes of negotiations for new international trade agreements will affect the seafood processing industry in many ways including access to raw material, access to foreign labour, access to markets and the competitiveness of the UK. However, since no agreements have yet been reached it is not yet possible to analyse the impacts and implications of potential changes. The variety and complexity of the UK seafood processing industry means the implications of the changing terms of trade with the EU and other states may vary substantially between companies. Uncertainty about future international trade opportunities is compounded by political uncertainty within the make-up of the UK and the EU itself.
Comments from industry The changing international trade situation came up repeatedly during interviews with businesses. Processors mentioned a few specific areas of concern which are discussed below.
One of the main points of discussion during interviews was the future status of EU or EEA and non-EEA foreign workers. The UK seafood processing industry relies heavily on EU and EEA workers and several interviewees mentioned being unsure of what arrangements the UK would
implement for existing EU staff. Being able to continue to recruit EU and EEA staff in the future was considered to be very important.
Several interviewees expressed concerns regarding what would replace current sources of European Union funding such as EMFF. Many processors use or have used the European Maritime and Fisheries Fund (EMFF) as a source of funding for investment projects. At the time of interviews they were unaware of what future grant systems would be implemented.
There was also uncertainty on the nature of future trade agreements, both with EU and third countries. The main markets for UK seafood products are EU countries, and there are trade agreements between the EU and third countries which currently allow access to those markets to UK processors. Several interviewees mentioned a lack of information regarding what new terms of trade would replace existing trade agreements as a significant source of uncertainty, hindering business planning.
Processors were concerned that there could be an increased risk of additional transactional friction arising from new trade arrangements if any kind of additional border checks are introduced between the UK and EU27. Whilst tariffs were an important issue, new non-tariff barriers may have a greater impact and cost to processors. Processors mentioned that current tariffs on fish
4.2.6 Operating conditions: Changing international trade environment and political-economic climate
4.2 Operating Environment
54
Seafood Processing Industry Report 2016
Country Profile: NorwayWhat Seafish is doingSeafish is working with industry and stakeholders to support the seafood sector in the transition out of the EU. Our staff members are working to highlight potential issues and opportunities in the wake of the referendum result in the fields of economics, regulation, trade, market insight and safety. Based on industry consultation responses and Seafish expertise, Seafish has produced a high-level overview of the interfaces of the UK seafood industry with the EU, and the areas where industry may be affected. The main identified interfaces of the UK seafood processing industry with the EU are access to marine resources, seafood markets and trade, seafood regulations and standards, seafood operations (access to labour) and public funds. The areas where the UK seafood processing industry may be affected by the by the outcome of the exit negotiations are the general UK business climate, fisheries policies, trade tariffs, regulation and non-tariff barriers, and access to labour and public funds.
In addition Seafish is working with industry and stakeholders to gather their views on potential Brexit implications and have hosted a number of events on Brexit such as panel sessions and industry forums. To keep up with the work Seafish is doing on Brexit visit http://www.seafish.org/industry-support/brexit
The exact implications of the UK leaving the EU and renegotiating terms of trade will depend on the outcome of negotiations between the UK, the EU and other sovereign states. It is not possible to say at this stage what the operating environment will be for the UK processing sector, but as a purely informative exercise, it is possible to investigate the main factors controlling the operating environment of non-EU processors in the EEA EFTA (European Economic Area – European Free Trade Association), in this case, Norwegian processors.
The regulatory burden for EEA-EFTA countries is less than that of an EU member state. For example, the agreement excludes the Common Agricultural Policy (CAP) and Common Fisheries Policy (CFP), so EFTA countries have the opportunity to protect their primary industries by adjusting policies to meet national priorities on fish-stock preservation and regional policy.
Countries that are part of the EEA-EFTA have restricted EU market access. In the Norwegian case, restricted access to the EU market has led to most of Norway’s fish-processing industry relocating within the EU to benefit from full market access. Market access is, at the time of this report, particularly restricted for secondary and mixed processed goods.
In 2012, SINTEF calculated that Norway accounts for approximately 10% of the total supply of raw materials for the EU fish processing sector1.
The same research highlighted other interdependencies between Norway and the EU such as a large number of Norwegian businesses owning processing plants in the EU. Further research2 indicates that in 2012 approximately 19% of Norwegian fish was processed in Norway and in 2009 the industry employed 9,781 workers (a 25% reduction over the previous 15 years). An estimated 34% of the workforce were foreign, with coastal processing plants dependent on foreign workers as indigenous workers could not be recruited. The majority of processing in Norway is primary and much of the fish is exported to be further processed where the cost of labour (a key factor of production) is much lower, such as China or Poland.
In 2014, a SINTEF analysis of the Norwegian processing sector concluded that Norwegian processors should seek to halve their reliance on labour as an input to production within ten years or there would be a serious risk to the ability of the industry to compete due to the high costs of the workforce.
Interventions such as the Norwegian Seafood Research Fund are seeking to help address this problem and other issues affecting fish processors through managing and directing industry research and development3.
Sources: 1. Northern Research Institute http://norut.no/en/news/many-foreigners-fishing-industry 2. “Employment in EU Fish Processing Industry based on Norwegian Seafood Export”, SINTEF, 2014]3. http://www.fhf.no/media/139372/fhf_handlingsplan_eng_2016_spreads_vol4.pdf
4.2 Operating Environment
55
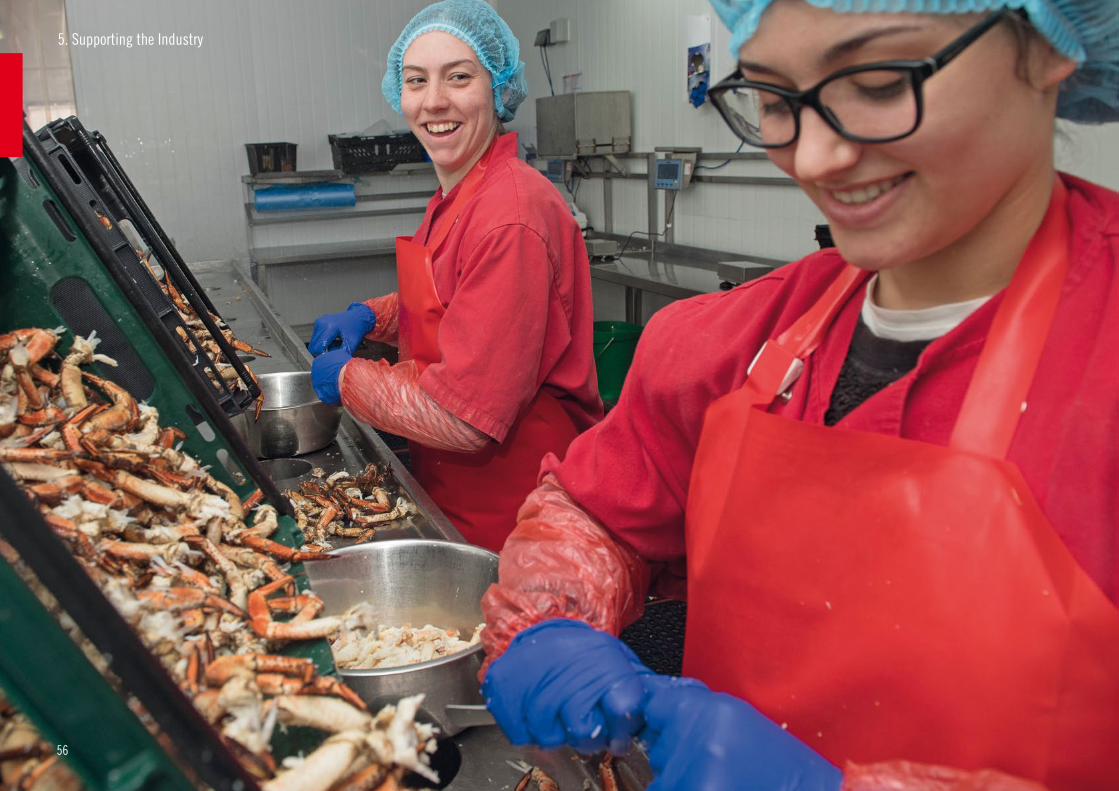
5. Supporting the Industry
56
Seafood Processing Industry Report 2016
SUPPORTING THE INDUSTRY5 During interviews, processing businesses owners and managers highlighted a number of areas where the sector could benefit from external support.
Promoting seafood is a key activity that can help the processing sector be more profitable. Industry interviewees believed that there could be benefits to the industry from educating UK consumers on the following topics which could generate higher willingness to pay for seafood:
■ The health benefits of seafood;
■ Encourage customers to try a wider variety of seafood and promoting the different species that can be found in UK;
■ Raise awareness about the seasonality of fresh seafood; and
■ Educate customers on the different origin, characteristics and pricing of seafood products, such as fresh and frozen, or UK and imported.
Interviewees also highlighted the need for promoting careers in the seafood industry to help attract workers in to the sector. These careers can be in the catching sector and seafood processing, but also in other areas less obviously linked to seafood such as food science, management or social media.
The need for a strong fishing industry to support processing companies was repeatedly mentioned. Processors highlighted the impact that fisheries regulations can have on processing businesses. Processors noted the need for better science to inform decision-making with regards to stocks and fisheries management and a strong representation of the catching sector at all stages of the regulatory process. Assistance and support in ensuring the sustainability of fishing activities, such as in achieving MSC accreditations, was also mentioned.
Processors reported, in some cases, difficulty accessing funding. While most interviewees reported an improvement in access to finance over the last few years, further guidance and support would be of benefit for businesses, particularly small companies.
5.1 HOW CAN THE INDUSTRY BE SUPPORTED – COMMENTS FROM INDUSTRY
5.1 How Can The Industry be Supported – Comments From Industry
57
5. Supporting the Industry
What Seafish is doingSeafish runs a series of marketing campaigns that aims to raise awareness of the great variety and many health benefits of seafood to consumers. The latest health campaign Fish 2 a week is focusing on making more people understand the importance of eating at least two portions of seafood a week. In addition to this health campaign, Seafish has also promoted the many benefits of omega-3.
Seafood Week is an annual consumer campaign held in October to encourage more people to eat more fish more often. The eight-day celebration of seafood concentrates on a different species each day and also aims to also introduce consumers to a more diverse range of seafood.
Seafish also runs a year-round digital campaign called Fish is the Dish which is geared towards families and provides advice on seasonality, species, cooking skills, and has a wide range of recipes, all aiming to make seafood more accessible and appealing to the general public. To find out more about this campaign visit http://www.fishisthedish.co.uk/.
58
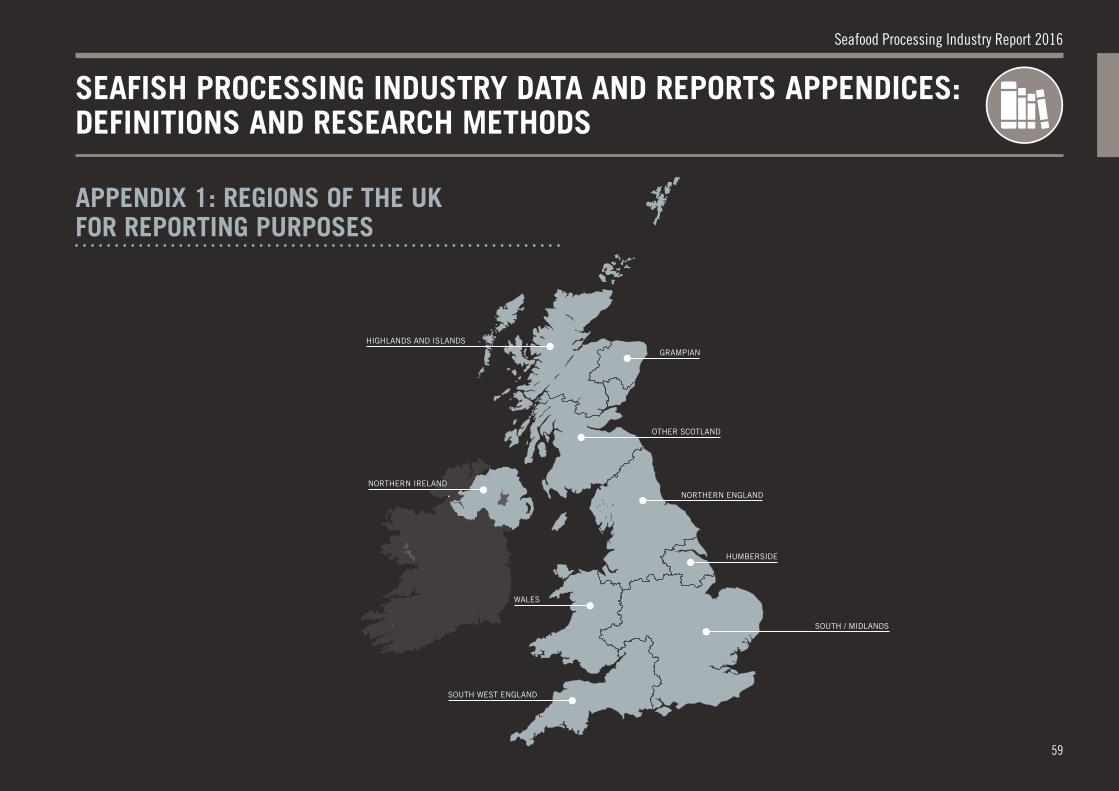
Seafood Processing Industry Report 2016
SEAFISH PROCESSING INDUSTRY DATA AND REPORTS APPENDICES: DEFINITIONS AND RESEARCH METHODS
APPENDIX 1: REGIONS OF THE UK FOR REPORTING PURPOSES
HIGHLANDS AND ISLANDS
NORTHERN IRELAND
WALES
SOUTH WEST ENGLAND
GRAMPIAN
OTHER SCOTLAND
NORTHERN ENGLAND
HUMBERSIDE
SOUTH / MIDLANDS
59
Seafish Processing Industry Data and Reports Appendices: Definitions and Research Methods Appendix 2: Definitions
APPENDIX 2: DEFINITIONS
60
The following definitions have been used throughout the most recent report and underlying research. For the most part, these are consistent with previous years. Any changes are driven by a continuous effort toward improving data quality, including accuracy and consistency over time. Where definitions were changed, the respective changes have been applied going back in time whenever possible.
All of the following definitions are used for the purpose of Seafish data collection as per the most recent surveys (in alphabetical order):
Capital costs – The sum of depreciation, financial costs (interest paid) and extraordinary costs.
Capital employed (or net assets, or total capital) – See total capital.
Category of processor – See main fish category.
Company – Organisation that owns at least one processing site, some companies own more than one. It is the lowest-level business entity (e.g. within a Group structure) for which separate accounts information is produced. It is the equivalent of ‘enterprise’ in the EU DCF.
Demersal (fish type category) – See fish type category.
EBIT – Earnings before interest and tax have been deducted.
Employment – Used interchangeably with number of FTE jobs throughout the report, apart from when specifically used in the context of total headcount employment. On-site administrative staff are included but not office staff at office-only sites. This is a consequence of viewing each processing plant as a separate unit and is consistent with previous surveys.
Exporting – Selling fish to buyers in countries outside of the United Kingdom.
Fish type category – The following categories have been designed to classify sea fish processors according to the type of species they handle:
• Demersal (Whitefish) – Cod, haddock, plaice, whiting, Pollack, saithe (coley), hake, monk/anglerfish, soles, lemons, megrim, witch, brill, turbot, halibut, dogfish, sharks, skates, rays, john dory, bass, ling, sea bream, marine eel, sea-water catfish, redfish and others.
• Shellfish – Nephrops (scampi, langoustine), scallops, crabs, oysters, cockles, mussels, winkles, lobster, crawfish, prawn (shrimp), squid, cuttle-fish and octopus, among others.
• Pelagic – Herring, mackerel, pilchard, sprat, whitebait, tuna and others.
• Saltwater Exotics – Snapper, barracuda, barramundi (giant sea perch), croakers, drums, emperor/emperor breams, groupers, jacks, parrotfish, pomfret, snappers and swordfish, among others.
• Salmon – All salmon species. Note that by definition saltwater processors cannot process salmon only; if a sea fish processor handles fish in this category, that processor’s fish type category is mixed.
• Trout – All trout species. Note that by definition saltwater processors cannot process trout only; if a sea fish processor handles fish in this category, that processor’s fish type category is mixed.
• Other freshwater fish – As a fish type category, this includes all non-saltwater species other than salmon and trout, e.g.: tilapia, pangasius (basa), carp, freshwater prawns, crayfish, freshwater catfish, perch, pike, zander, freshwater eel, and others. Note that by definition saltwater processors cannot process only such species; if a sea fish processor handles fish in this category, that processor’s fish type category is mixed. Also note the difference to other freshwater as a sub-category of the non-saltwater category of processor (see Main fish category).
• Mixed – For processors handling mixed species, i.e. from more than one of the above categories.
Fixed capital (or tangible fixed assets; property, plant, and equipment (PPE)) – The portion of total capital invested in fixed assets (such as land, buildings, vehicles, plant and equipment) that stay in the business for a relatively long period of time,
Seafood Processing Industry Report 2016Appendix 2: Definitions
61
or at the very least, for more than one accounting period.
Full-time equivalent (FTE) job – A standardised measure of employment, based on an employee working 37 hours per week, 52 weeks per year. Standard assumptions in accordance with the European Data Collection Framework guidelines are made for the purposes of calculating FTEs; in particular, the following formula is used: No. of FTEs = No. of full-time jobs + (21.1*No. of part-time jobs)/37 + (No. of seasonal jobs*No. of weeks seasonal staff work)/52
Gross Value Added (GVA) – Gross Value Added (GVA) is a measure of output, which is calculated here as operating profit plus labour costs.
Importing – Purchasing fish from companies based in countries outside the United Kingdom.
Labour costs – The sum of wages of staff (which include management salaries).
Main fish category (or just category) of processor – The high-level categorisation of processors according to the main type of fish species they handle into:
• Saltwater (sea fish) processors
• and Non-saltwater processors, which include the sub-categories:
• Salmon processors (see salmon in fish type category); and
• Other freshwater processors (includes trout and other freshwater fish, see fish type category).
Unlike the lower-level categorisation fish type category, there is no mixed category here. In order to allocate each site exclusively to a single main category, the income share derived from processing saltwater vs. non-saltwater / salmon is used. E.g. if a processor derives the majority of their processing income from processing saltwater fish, but they also process some salmon, that processor’s main fish category is saltwater (sea fish) processor and their fish type category is mixed. Or, if a processor handles mainly trout, their main fish category is non-saltwater and their sub-category is other freshwater.
Mixed (fish type category) – See fish type category.
Mixed (type of processor) – See processing type.
Net assets – See capital employed.
Net pre-tax profit – Turnover less total costs (post-interest, post-depreciation, pre-tax).
Operating costs – Includes all operating costs and is the sum of raw materials costs, labour costs, energy costs and other operating costs.
Operating income – Turnover (revenues, or sales).
Operating profit – Operating income less operating costs.
Other freshwater fish (fish type category) – All non-saltwater species other than salmon and trout. See Category (Main) and fish type category for more.
Pelagic (fish type category) – See fish type category.
Primary (type of processor) – See processing type.
Processing – Processing is materially changing the raw material product. This definition excludes seafood merchants that buy and sell seafood (see trading/ wholesaling), possibly including defrosting, repackaging and selling in smaller quantities, but not actually coating, cutting or altering the seafood. This also excludes fishmongers which cut and filet seafood solely for sale in their own premises (see Retailing). Service businesses, which provide a processing service to other companies without owning the seafood, are included as they materially change the seafood.
Processing type: Sea fish definition (differs slightly from definition applied under EU Hygiene Regulations).
• Primary – Primary processing includes: cutting, filleting, picking, peeling, washing, chilling, packing, heading and gutting.
• Secondary – Secondary processing includes: brining, smoking, cooking, freezing, canning, deboning, breading, vacuum and controlled packaging, production of ready meals.
Seafish Processing Industry Data and Reports Appendices: Definitions and Research Methods Appendix 2: Definitions
62
• Mixed – Processing units that carry out a mix of primary and secondary processes are classed as ‘mixed’ processors.
Processor – See site.
Raw material costs – Purchase of fish and other raw materials for production.
Retailing – Selling fish to members of the public.
Salmon (fish type category) – All salmon species. See category (Main) and fish type category.
Saltwater fish (or sea fish) – All saltwater (marine) species, including whitefish, pelagic fish, flatfish, saltwater shellfish and saltwater exotics. It excludes diadromous and freshwater species (such as salmon and trout).
Scope – The processors in scope of the research are majority processors only, i.e. those that derive 50% or more of their turnover from fish processing activities.
Sea fish (or saltwater fish) – All saltwater (marine) species, including whitefish, pelagic fish, flatfish, saltwater shellfish and saltwater exotics. It excludes diadromous and freshwater species (such as salmon and trout).
Secondary (type of processor) – See processing type.
Shellfish (fish type category) – See fish type category.
Site (processor, or unit) – Individual factory or facility for processing fish. The sites in scope of the research are majority processors, i.e. derive 50% or more of their turnover from fish processing activities. In our records a site is defined by the physical premises where processing activities are carried out. A company may operate more than one site and site ownership by companies can change over time. If a processor moves to a new physical address, the old site is no longer considered in existence and a new site is added to our records. A site may have a different postal address, e.g. in the case of a separate administrative office function.
Total capital (or net assets, or capital employed) – The money directly used to finance the business. It is calculated as follows: Capital employed = net assets = total assets (total fixed assets + total current assets) - total current liabilities (total shareholder funds + long term loans + any other long term liabilities). Equivalent to ‘total assets’ in the EU Data Collection Framework.
Total costs – The sum of operating and capital costs.
Total headcount (employment) – the non-weighted sum of all employees, regardless of
the type of employment or working hours (e.g. a seasonal worker, a part-time employee and a full-time employee are counted as 1 each).
Total income – Includes turnover (sales), subsidies and other income.
Trading/Wholesaling – Buying and selling fish (trade customers).
Trout (fish type category) – All trout species. See category (Main) and fish type category for more.
Turnover – Sales, or revenues, (£s) from business activity.
Unit – See site.
Whitefish (fish type category) – See fish type category.
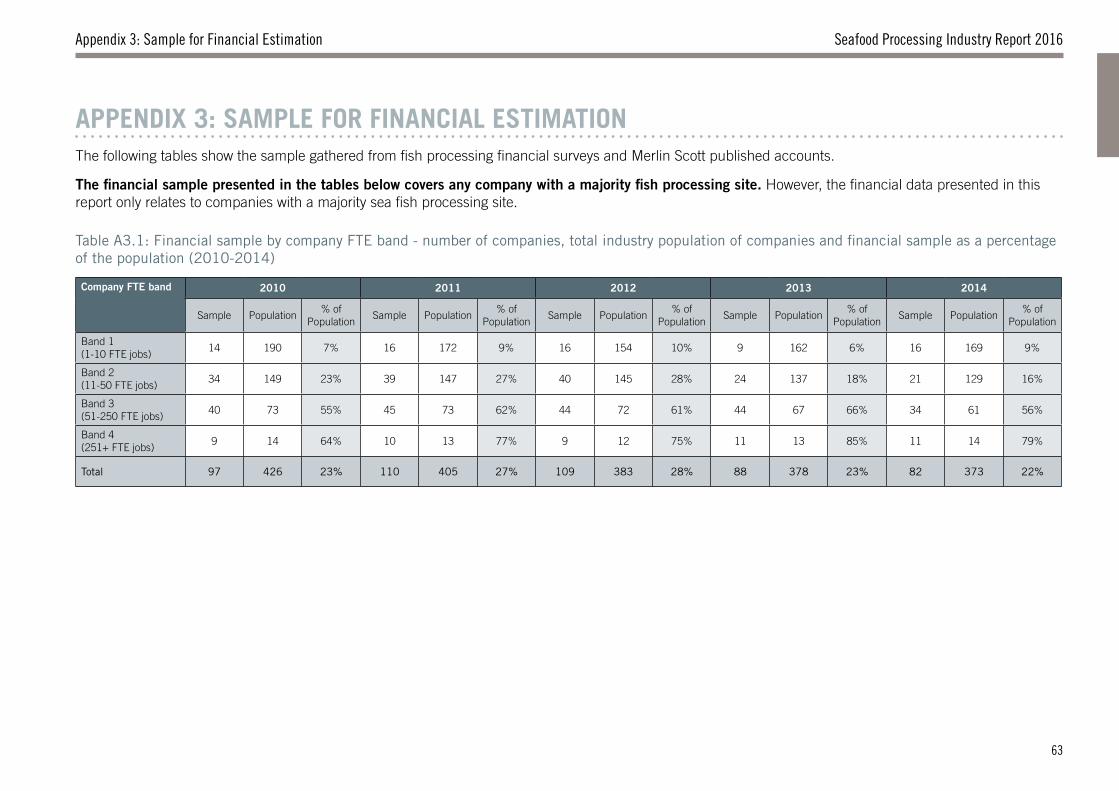
Seafood Processing Industry Report 2016Appendix 3: Sample for Financial Estimation
APPENDIX 3: SAMPLE FOR FINANCIAL ESTIMATIONThe following tables show the sample gathered from fish processing financial surveys and Merlin Scott published accounts.
The financial sample presented in the tables below covers any company with a majority fish processing site. However, the financial data presented in this report only relates to companies with a majority sea fish processing site.
Table A3.1: Financial sample by company FTE band - number of companies, total industry population of companies and financial sample as a percentage of the population (2010-2014)
Company FTE band 2010 2011 2012 2013 2014
Sample Population% of
PopulationSample Population
% of Population
Sample Population% of
PopulationSample Population
% of Population
Sample Population% of
Population
Band 1 (1-10 FTE jobs)
14 190 7% 16 172 9% 16 154 10% 9 162 6% 16 169 9%
Band 2 (11-50 FTE jobs)
34 149 23% 39 147 27% 40 145 28% 24 137 18% 21 129 16%
Band 3 (51-250 FTE jobs)
40 73 55% 45 73 62% 44 72 61% 44 67 66% 34 61 56%
Band 4 (251+ FTE jobs)
9 14 64% 10 13 77% 9 12 75% 11 13 85% 11 14 79%
Total 97 426 23% 110 405 27% 109 383 28% 88 378 23% 82 373 22%
63
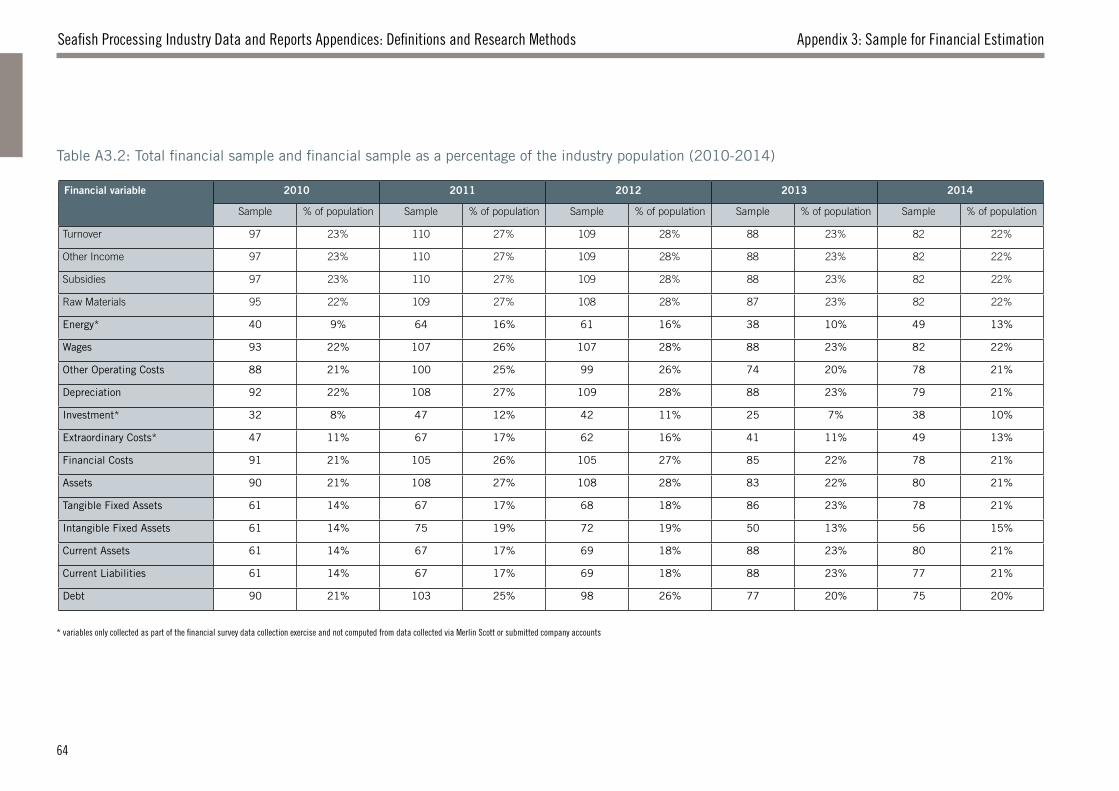
Seafish Processing Industry Data and Reports Appendices: Definitions and Research Methods Appendix 3: Sample for Financial Estimation
Table A3.2: Total financial sample and financial sample as a percentage of the industry population (2010-2014)
Financial variable 2010 2011 2012 2013 2014
Sample % of population Sample % of population Sample % of population Sample % of population Sample % of population
Turnover 97 23% 110 27% 109 28% 88 23% 82 22%
Other Income 97 23% 110 27% 109 28% 88 23% 82 22%
Subsidies 97 23% 110 27% 109 28% 88 23% 82 22%
Raw Materials 95 22% 109 27% 108 28% 87 23% 82 22%
Energy* 40 9% 64 16% 61 16% 38 10% 49 13%
Wages 93 22% 107 26% 107 28% 88 23% 82 22%
Other Operating Costs 88 21% 100 25% 99 26% 74 20% 78 21%
Depreciation 92 22% 108 27% 109 28% 88 23% 79 21%
Investment* 32 8% 47 12% 42 11% 25 7% 38 10%
Extraordinary Costs* 47 11% 67 17% 62 16% 41 11% 49 13%
Financial Costs 91 21% 105 26% 105 27% 85 22% 78 21%
Assets 90 21% 108 27% 108 28% 83 22% 80 21%
Tangible Fixed Assets 61 14% 67 17% 68 18% 86 23% 78 21%
Intangible Fixed Assets 61 14% 75 19% 72 19% 50 13% 56 15%
Current Assets 61 14% 67 17% 69 18% 88 23% 80 21%
Current Liabilities 61 14% 67 17% 69 18% 88 23% 77 21%
Debt 90 21% 103 25% 98 26% 77 20% 75 20%
* variables only collected as part of the financial survey data collection exercise and not computed from data collected via Merlin Scott or submitted company accounts
64
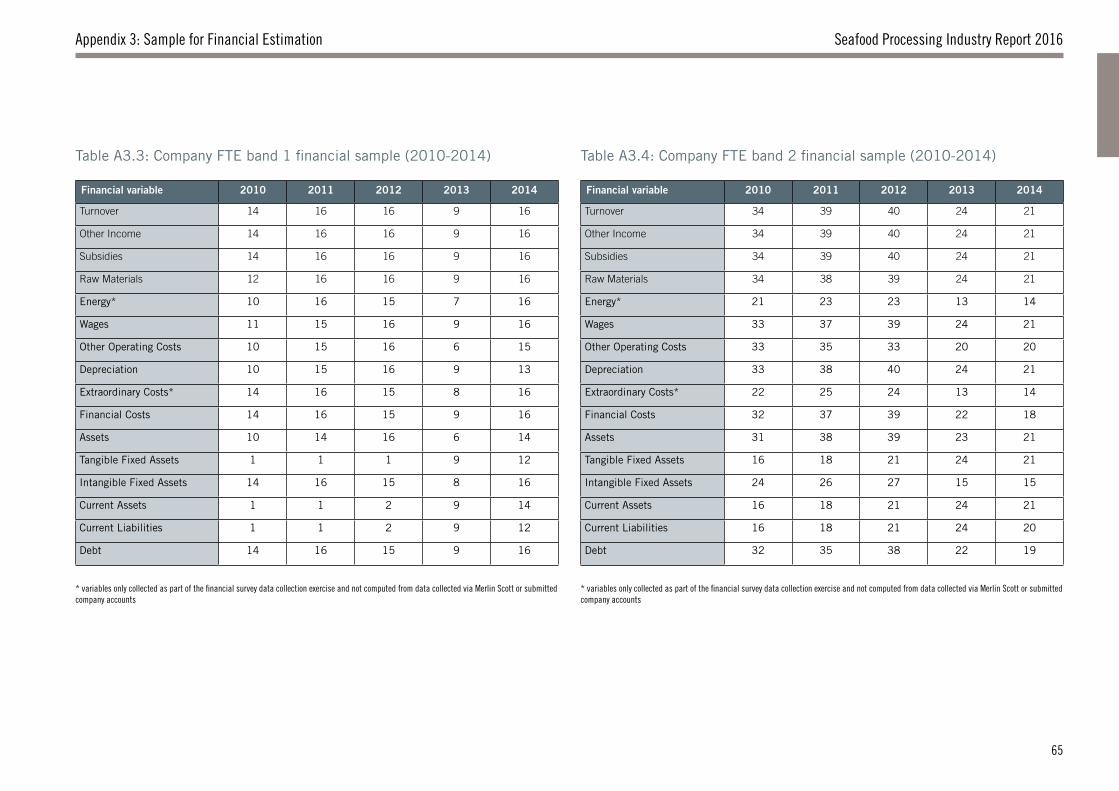
Seafood Processing Industry Report 2016Appendix 3: Sample for Financial Estimation
Table A3.3: Company FTE band 1 financial sample (2010-2014) Table A3.4: Company FTE band 2 financial sample (2010-2014)
Financial variable 2010 2011 2012 2013 2014
Turnover 14 16 16 9 16
Other Income 14 16 16 9 16
Subsidies 14 16 16 9 16
Raw Materials 12 16 16 9 16
Energy* 10 16 15 7 16
Wages 11 15 16 9 16
Other Operating Costs 10 15 16 6 15
Depreciation 10 15 16 9 13
Extraordinary Costs* 14 16 15 8 16
Financial Costs 14 16 15 9 16
Assets 10 14 16 6 14
Tangible Fixed Assets 1 1 1 9 12
Intangible Fixed Assets 14 16 15 8 16
Current Assets 1 1 2 9 14
Current Liabilities 1 1 2 9 12
Debt 14 16 15 9 16
Financial variable 2010 2011 2012 2013 2014
Turnover 34 39 40 24 21
Other Income 34 39 40 24 21
Subsidies 34 39 40 24 21
Raw Materials 34 38 39 24 21
Energy* 21 23 23 13 14
Wages 33 37 39 24 21
Other Operating Costs 33 35 33 20 20
Depreciation 33 38 40 24 21
Extraordinary Costs* 22 25 24 13 14
Financial Costs 32 37 39 22 18
Assets 31 38 39 23 21
Tangible Fixed Assets 16 18 21 24 21
Intangible Fixed Assets 24 26 27 15 15
Current Assets 16 18 21 24 21
Current Liabilities 16 18 21 24 20
Debt 32 35 38 22 19
* variables only collected as part of the financial survey data collection exercise and not computed from data collected via Merlin Scott or submitted company accounts
* variables only collected as part of the financial survey data collection exercise and not computed from data collected via Merlin Scott or submitted company accounts
65
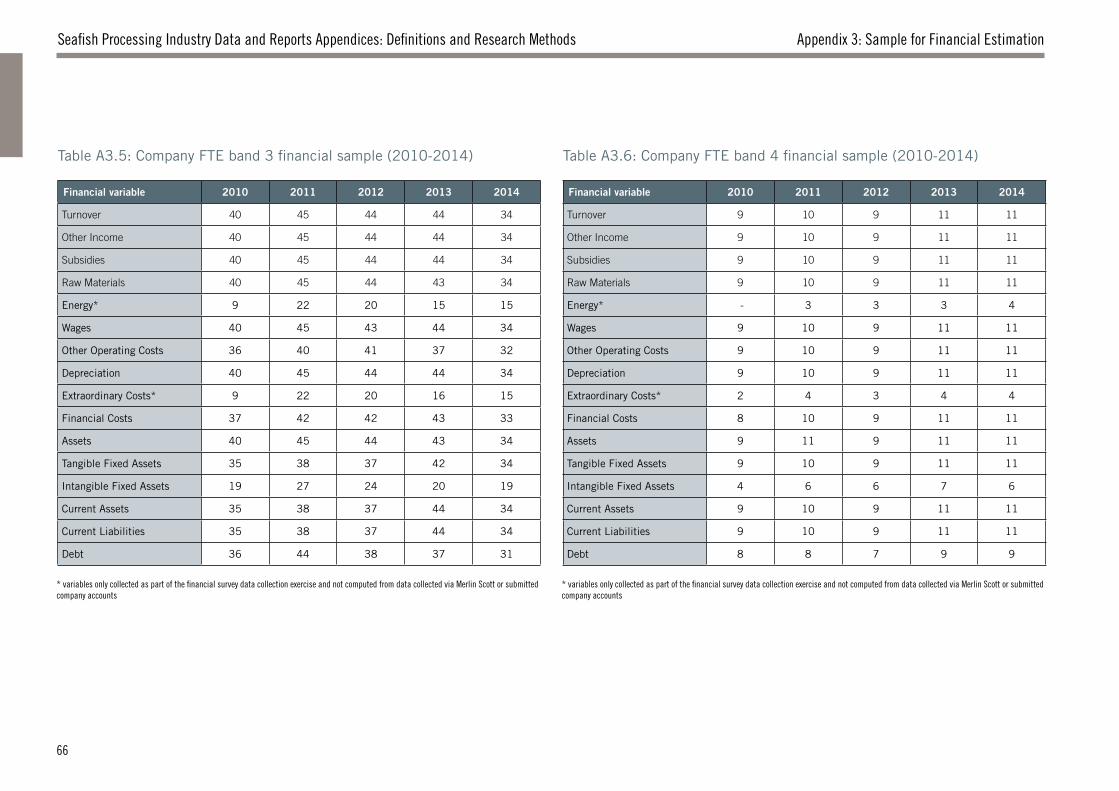
Seafish Processing Industry Data and Reports Appendices: Definitions and Research Methods Appendix 3: Sample for Financial Estimation
Table A3.5: Company FTE band 3 financial sample (2010-2014) Table A3.6: Company FTE band 4 financial sample (2010-2014)
Financial variable 2010 2011 2012 2013 2014
Turnover 40 45 44 44 34
Other Income 40 45 44 44 34
Subsidies 40 45 44 44 34
Raw Materials 40 45 44 43 34
Energy* 9 22 20 15 15
Wages 40 45 43 44 34
Other Operating Costs 36 40 41 37 32
Depreciation 40 45 44 44 34
Extraordinary Costs* 9 22 20 16 15
Financial Costs 37 42 42 43 33
Assets 40 45 44 43 34
Tangible Fixed Assets 35 38 37 42 34
Intangible Fixed Assets 19 27 24 20 19
Current Assets 35 38 37 44 34
Current Liabilities 35 38 37 44 34
Debt 36 44 38 37 31
Financial variable 2010 2011 2012 2013 2014
Turnover 9 10 9 11 11
Other Income 9 10 9 11 11
Subsidies 9 10 9 11 11
Raw Materials 9 10 9 11 11
Energy* - 3 3 3 4
Wages 9 10 9 11 11
Other Operating Costs 9 10 9 11 11
Depreciation 9 10 9 11 11
Extraordinary Costs* 2 4 3 4 4
Financial Costs 8 10 9 11 11
Assets 9 11 9 11 11
Tangible Fixed Assets 9 10 9 11 11
Intangible Fixed Assets 4 6 6 7 6
Current Assets 9 10 9 11 11
Current Liabilities 9 10 9 11 11
Debt 8 8 7 9 9
* variables only collected as part of the financial survey data collection exercise and not computed from data collected via Merlin Scott or submitted company accounts
* variables only collected as part of the financial survey data collection exercise and not computed from data collected via Merlin Scott or submitted company accounts
66
Seafood Processing Industry Report 2016Appendix 4: Research Approach and Methods
A4.1. Scope of studyThe scope of the surveys includes all fish processing businesses in the UK (not Channel Islands or Isle of Man) where 50% or more of turnover in the financial year is generated by sale of the products of fish processing. Sites which process fish as part of a complimentary or wider range of activities (where processing is less than 50% of turnover) such as; wholesalers, retailers, fishmongers, distributors, farmers, processors of a wider range of foodstuffs or other associated businesses, are not in the scope of this study.
As a result of limiting the scope of this study to only majority processors, there is a clear industrial definition being applied. Having a clear and strict definition:
• Limits the inclusion of businesses whereby turnover might be attributed to the processing industry but actually be based on complimentary, upstream or downstream activities. Arguably, setting a strict definition allows accurate measurement of inputs and outputs which directly stem from fish processing products and business activities.
• Is important as economic conditions vary across different types of business. The sources of competitive advantage, tradability of inputs and outputs, routes to market, relative importance of factors of production, market conditions, effects of policy and legislation and business models will be very different for the processor and, for example, the fishmonger.
• Important for stakeholders such as government to understand the implications of policy decisions, as; 1) meeting specific policy targets might require specific contributions from specific sectors; 2) the fish processing industry may request different levels and types of support (depending upon how the role of government is defined at any one time); 3) policies will have different implications for fish processing and different parts of the supply chain which should be considered on a case-by-case basis; and 4) to understand the potential spatial effects of decisions, such as employment at a local level.
A4.2. Research stakeholders and objectivesThe research stakeholders were defined as: the UK fish processing industry, UK Government, Marine Management Organisation, Marine Scotland, other public institutions in the UK and EU and researchers in the field.
The overall aim of this report and the supporting research was to present accurate up-to-date economic data and high-quality analyses and commentary to serve as an evidence base for business decisions, policy discussions, and further research, where appropriate.
Seafish Economics collect, estimate and produce data, including some of the data contained within this report, to enable the UK government to meet its obligations under the EU data collection framework EC Decision 2008/949 pertaining to fish processing enterprises.
APPENDIX 4: RESEARCH APPROACH AND METHODS
67
Seafish Processing Industry Data and Reports Appendices: Definitions and Research Methods
A4.3. Research methodsData Collection
The research involved a combination of primary and secondary research, involving both quantitative and qualitative data.
The two primary quantitative data collection tasks were undertaking the 2014 Seafish Financial Data Survey and the 2016 Seafish Census Survey. Financial data from published accounts were used to complement the financial survey. A further limited qualitative survey took place through one-to-one interviews with industry stakeholders.
2016 Census Survey – Building upon and reviewing the previous data collection exercises a list of possible seafood processing sites was compiled from several sources: the 2014 Census survey; the Seafish contact management system; Seafish levy database; and a list of food processing companies having a fish processing licence from the Food Standards Agency. A phone census of the entire UK seafood processing industry was then undertaken asking for confirmation of business contact details as well as details of their business activity (their core business activity, the type of fish processed, their importing and exporting activity, and the number and tenure of staff employed). No financial details were requested during the phone survey. The questionnaire is attached in Appendix 5. The resulting data were entered into the Seafish Economics Access database containing processing industry data in the same format for all years,
where possible. These data are collected and stored at the site (unit) level.
Operational data are also stored and collected as part of the Census Survey, e.g. whether the site has changed its name, address or company ownership, contact details, dates when contact was attempted, outcome of the contact, any other comments, etc. These data are used to update the site address (if moved); site name (if changed); company ownership of the site for the relevant year (if changed), etc. in the database. This operational information is also utilised as part of the change analysis, e.g. verifying whether the site has been contacted on enough attempts to conclude that it cannot be reached; or whether the researchers have noted that it is out of business, etc.
Any new sites identified in the 2016 census that may have existed, but were not identified, during previous census exercises are only included in the industry numbers for 2016 (despite existing in previous years). Future improvements in methods will aim to address this limitation.
2014 Financial Data Survey – Data were drawn from the Seafish Levy Database, the previous phone census conducted in 2014 and Companies House. Processing businesses were approached directly and invited to provide data by email, fax or post. The relevant questionnaire is attached in Appendix 6. The resulting data were entered into an Access database. This data was entered, collected and stored at the company level.
Published company accounts data are stored separately in Excel at the company level. The data were transformed using an appropriate VBA macro programme. Relevant company IDs were allocated in order to enable merging these data with the financial data from the Financial Data Survey (above).
Methods
In order to combine data at different levels (site vs. company) from different sources, a Stata programme routine was used. This routine utilises all the data mentioned above (Census and operational data from the Access database; Financial Survey data from the Access database; and published accounts data stored in Excel format) as well as postcode data for assigning a region to each site.
The Stata programme contains a number of data transformations, checks and adjustments needed to ensure as comprehensive a dataset as possible. Only data for sites and companies in scope were kept, i.e. majority processor sites and companies owning at least one majority processor site. Some partially completed survey returns meant that data for all variables for all participating sites or companies were not comprehensive. In certain cases, entire observations were dropped (e.g. if a site has missing employment data, which is crucial for headline figures and estimations), while in others, this was accepted (e.g. if a company has provided turnover data but no raw material
Appendix 4: Research Approach and Methods
68
Seafood Processing Industry Report 2016
cost data). In clearly defined cases missing financial variables or years are estimated for specific companies. Where both Financial Survey and published accounts data were available for particular variables, the officially published figures superseded survey data. The merging of Financial Survey and published accounts data was supplemented by extensive checks to ensure compatibility in terms of the variable definitions (for example, the Financial Survey variable ‘debt’ is equivalent to the sum of short-term and long-term debt from the published accounts).
Once the financial datasets were merged and definitions harmonised, each of the financial variables was estimated.
The sample was split into 4 FTE size bands or groups defined by employment (micro enterprise, small to medium enterprise, medium to large enterprise or large enterprise). For each specific size band a per-FTE average at the company level is calculated (e.g. average raw material cost per FTE across all companies in the sample FTE band for that year). The per-FTE average was applied to companies not in the sample (by taking the average per-FTE ratio of sample companies in a specific size band and multiplying this by the number of FTEs for companies in the rest of the population of that band). This was done independently for each financial variable estimated. Company data was then allocated to the respective owned site(s) (for companies with
multiple sites this was done according to each site’s proportion of the company total FTE jobs).
The resulting dataset contained all census and financial data from all sources, including financial estimates, at the site level. This approach was chosen, as it potentially enabled analysis of financial data by region, type of processing, fish type category and other site characteristics (not applicable to the company level).
Among the limitations of the approach are the relatively simplistic estimation of financials on per-FTE basis and equally the allocation of company-level financial data to sites in scope, purely based on fish processing FTEs identified as part of the census. Other limitations include: sample bias arising from self-selection and the fact that only accounts for larger companies are publicly available; in some company size bands, turnover has a weak relationship with number of FTE jobs; there is a different sample of companies for the basis of estimation for each year, changing the relationship between company financial data and census FTE jobs for each year; in some FTE bands there is a great deal of variation in which particular companies are included in the sample in each year (e.g. less than 50% of sample from the previous year is included again in the next year). The financial data reported in section 2 and 3 relate to the full accounts of fish processing companies which may cover business activity other than fish processing undertaken by these
companies. An additional factor is a change in the wording of definitions of the financial data survey forms, which may affect comparison of particular figures across different reference years.
Qualitative research – Qualitative research via interviews with business owners and managers, as well as other industry stakeholders, was carried out to inform the author of the current situation within the industry, with the results being used in the report for illustrative purposes only. The interviews were voluntary, in-depth, semi-structured and confidential in nature. The interviews were limited in number (14 in total) and involved different types of respondent (in terms of relationship with the industry), constituting a non-representative sample overall. The questionnaire forms varied slightly depending on the stakeholder’s position to comment on the industry (e.g. individual business managing director vs. Seafish regional staff member) and are available upon request. The results from this research are presented for illustrative purposes only and should not be interpreted as representative of the entire industry.
Appendix 4: Research Approach and Methods
69
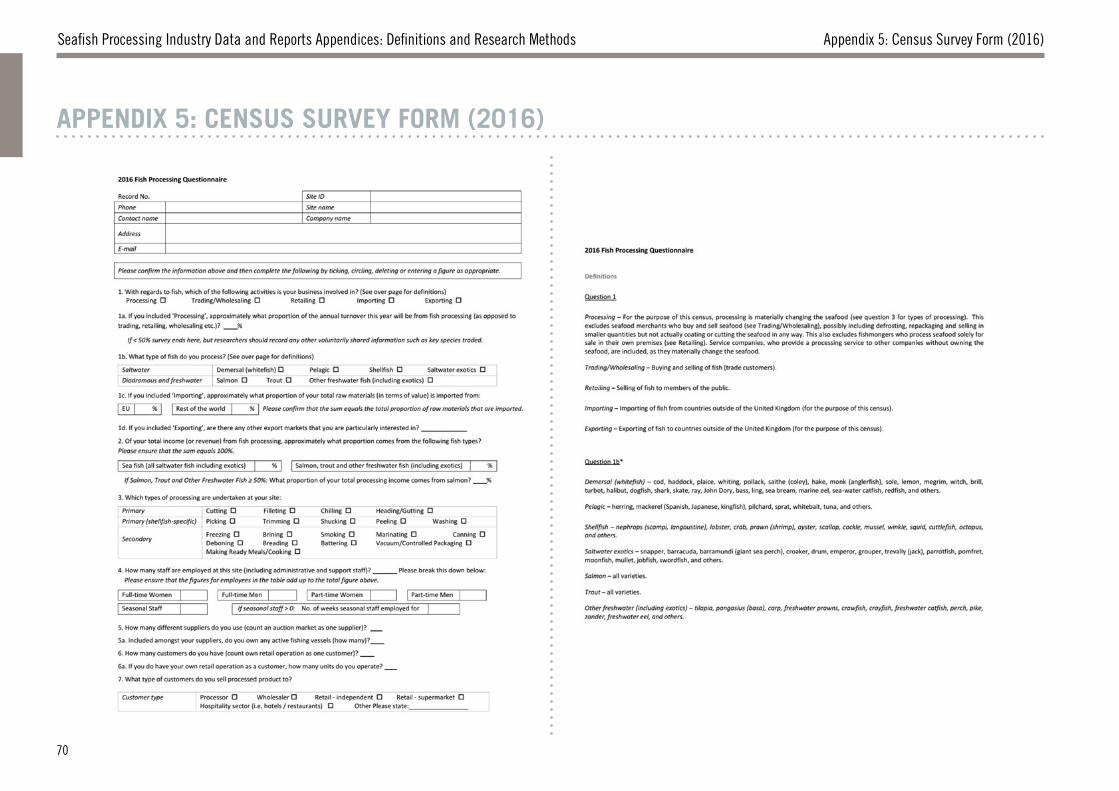
Seafish Processing Industry Data and Reports Appendices: Definitions and Research Methods
APPENDIX 5: CENSUS SURVEY FORM (2016)
Appendix 5: Census Survey Form (2016)
70
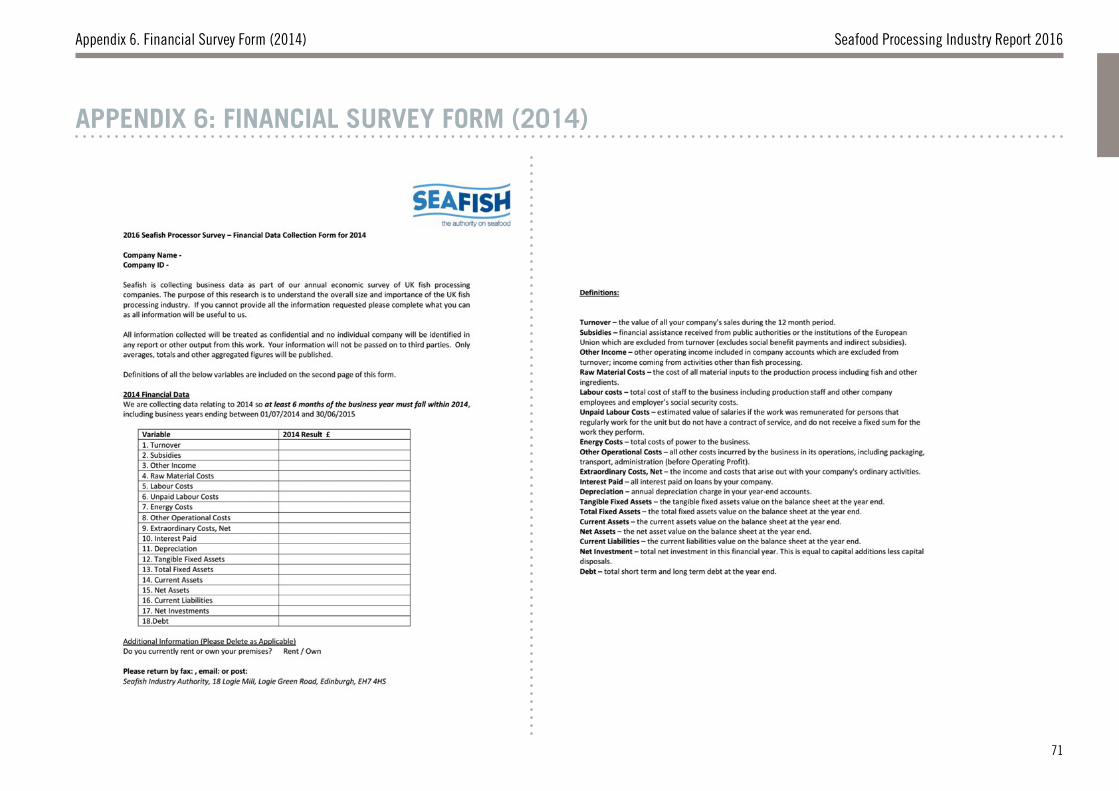
Seafood Processing Industry Report 2016Appendix 6. Financial Survey Form (2014)
APPENDIX 6: FINANCIAL SURVEY FORM (2014)
71
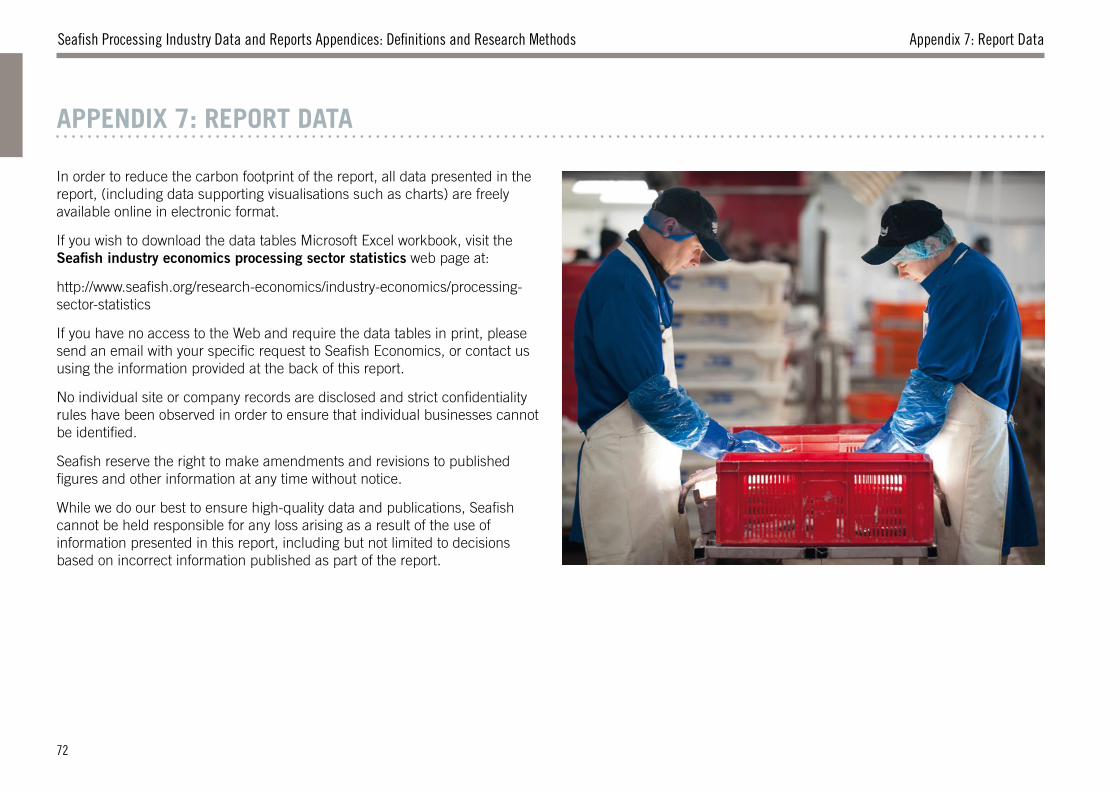
Seafish Processing Industry Data and Reports Appendices: Definitions and Research Methods
APPENDIX 7: REPORT DATA
Appendix 7: Report Data
In order to reduce the carbon footprint of the report, all data presented in the report, (including data supporting visualisations such as charts) are freely available online in electronic format.
If you wish to download the data tables Microsoft Excel workbook, visit the Seafish industry economics processing sector statistics web page at:
http://www.seafish.org/research-economics/industry-economics/processing-sector-statistics
If you have no access to the Web and require the data tables in print, please send an email with your specific request to Seafish Economics, or contact us using the information provided at the back of this report.
No individual site or company records are disclosed and strict confidentiality rules have been observed in order to ensure that individual businesses cannot be identified.
Seafish reserve the right to make amendments and revisions to published figures and other information at any time without notice.
While we do our best to ensure high-quality data and publications, Seafish cannot be held responsible for any loss arising as a result of the use of information presented in this report, including but not limited to decisions based on incorrect information published as part of the report.
72

Date: March 2017Seafish Report No: SR700ISBN No: 978-1-911073-06-02 © Copyright Seafish 2017Seafish Economics18 Logie MillLogie Green RoadEdinburghEH7 4HS
Contact us
We welcome and regularly request feedback on our work and encourage contributions from all stakeholders.
Contact us through the following channels:
Supporting a profitable, sustainable and socially responsible future for the seafood industry.
18 Logie Mill, Logie Green Road, Edinburgh, EH7 4HS
t: +44 (0)131 558 3331
f: +44 (0)131 558 1442
Origin Way, Europarc, Grimsby, N. E. Lincs, DN37 9TZ
t: +44 (0)1472 252 300
f: +44 (0)1472 268 792
w: www.seafish.org