2016 Rate Design Application FortisBC Energy Inc. … Rate Design Application FortisBC Energy Inc....
115
2016 Rate Design Application FortisBC Energy Inc. (FEI) Information Session #2 May 19, 2016
Transcript of 2016 Rate Design Application FortisBC Energy Inc. … Rate Design Application FortisBC Energy Inc....
2016 Rate Design Application FortisBC Energy Inc. (FEI)
Information Session #2
May 19, 2016
- 2 -
Purpose
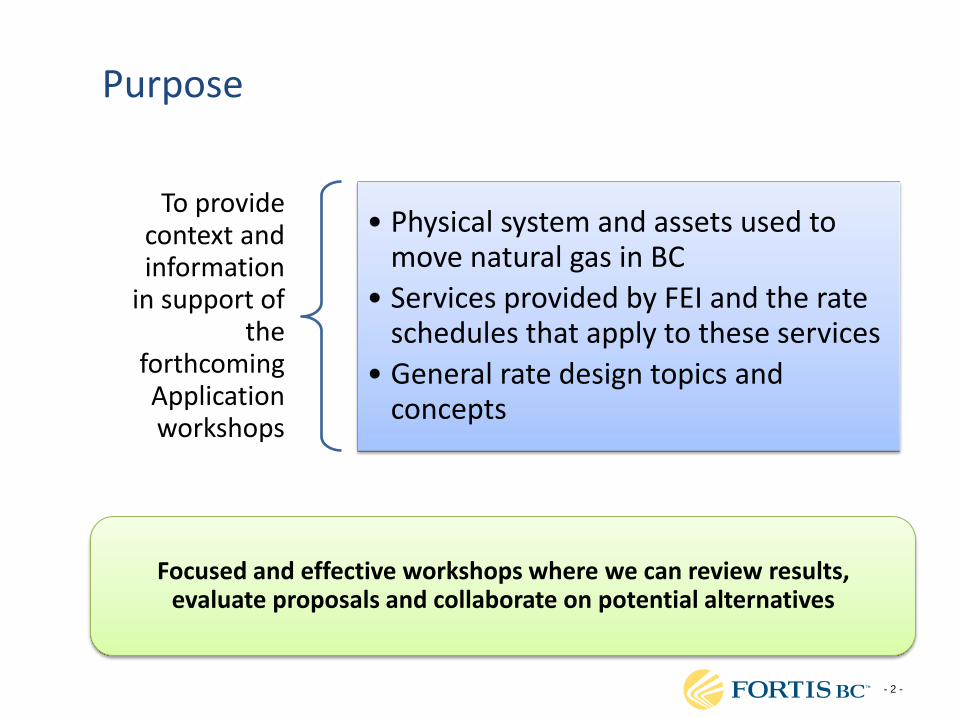
To provide context and information
in support of the
forthcoming Application workshops
• Physical system and assets used to move natural gas in BC
• Services provided by FEI and the rate schedules that apply to these services
• General rate design topics and concepts
Focused and effective workshops where we can review results, evaluate proposals and collaborate on potential alternatives
- 3 -
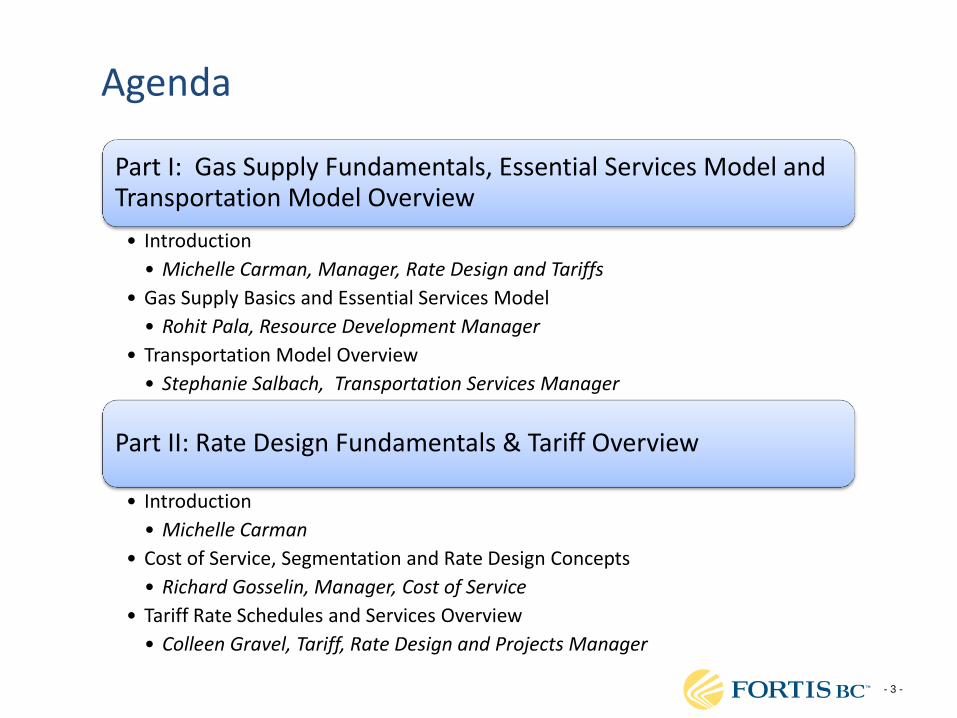
Part I: Gas Supply Fundamentals, Essential Services Model and Transportation Model Overview
• Introduction
• Michelle Carman, Manager, Rate Design and Tariffs
• Gas Supply Basics and Essential Services Model
• Rohit Pala, Resource Development Manager
• Transportation Model Overview
• Stephanie Salbach, Transportation Services Manager
Part II: Rate Design Fundamentals & Tariff Overview
• Introduction
• Michelle Carman
• Cost of Service, Segmentation and Rate Design Concepts
• Richard Gosselin, Manager, Cost of Service
• Tariff Rate Schedules and Services Overview
• Colleen Gravel, Tariff, Rate Design and Projects Manager
Agenda

- 4 -
INTRODUCTION Part I
- 5 -
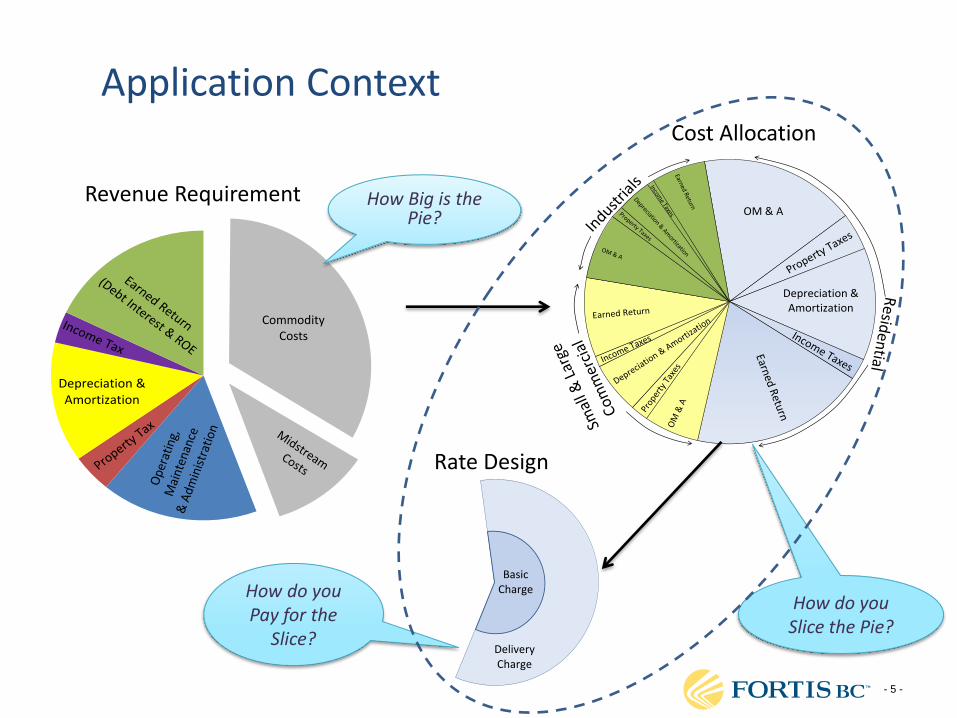
Application Context
Depreciation & Amortization
Commodity Costs
OM & A
Depreciation &Amortization
DeliveryCharge
Basic Charge
Revenue Requirement
Cost Allocation
Rate Design
How Big is the Pie?
How do you Slice the Pie?
How do you Pay for the
Slice?
- 6 -
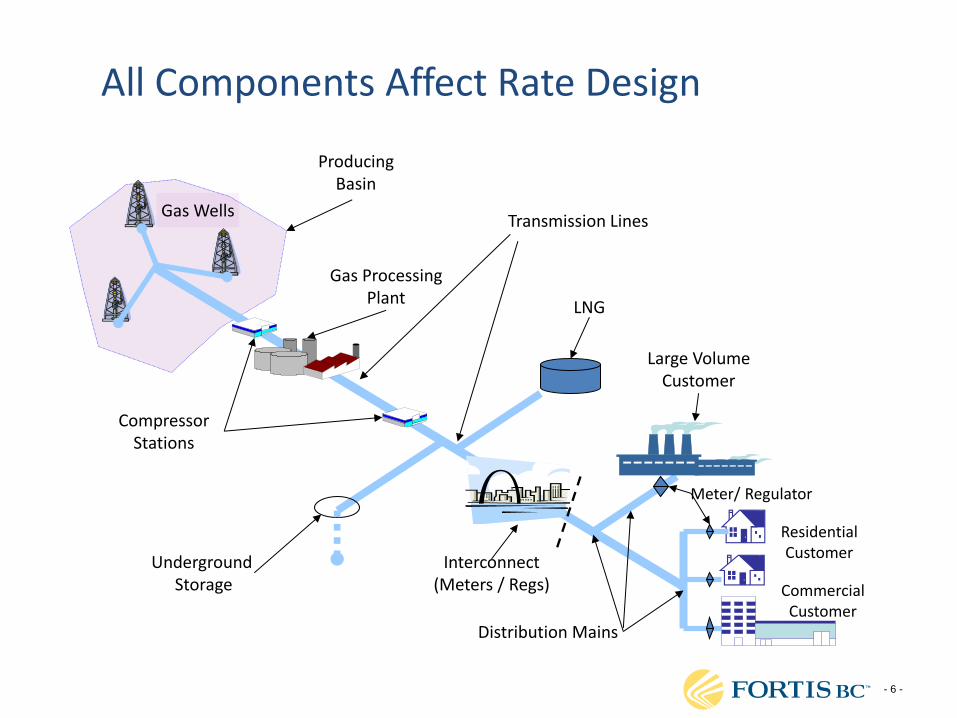
Gas Wells
Producing Basin
Compressor Stations
LNG
Interconnect (Meters / Regs)
Large Volume Customer
Gas Processing Plant
Distribution Mains
Meter/ Regulator
Underground Storage
Residential Customer
Commercial Customer
Transmission Lines
All Components Affect Rate Design
- 7 -
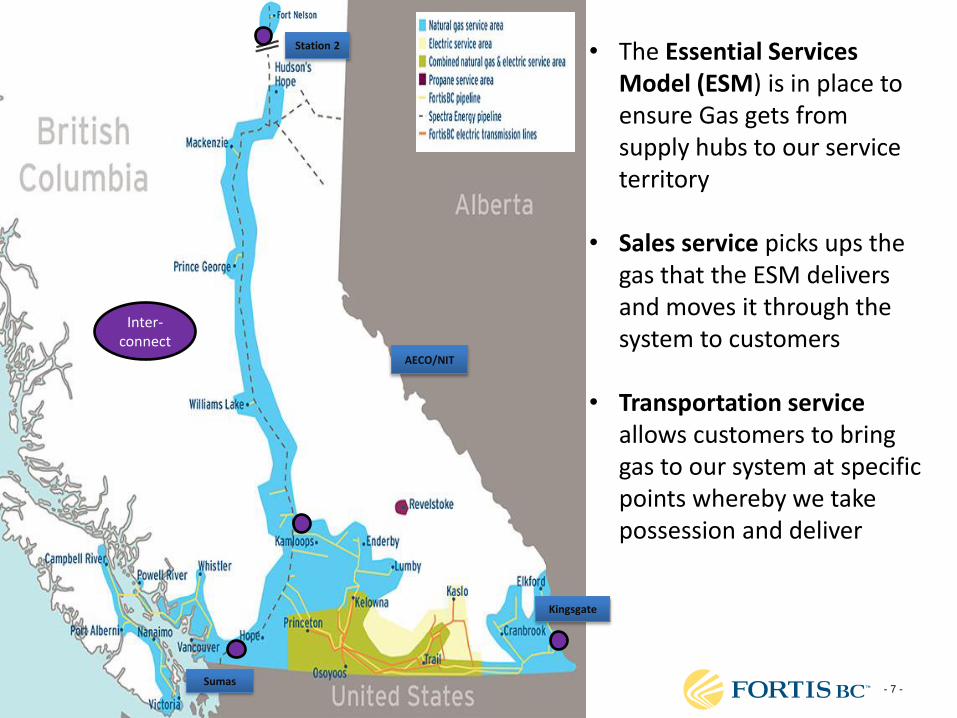
AECO/NIT
Kingsgate
Sumas
• The Essential Services Model (ESM) is in place to ensure Gas gets from supply hubs to our service territory
• Sales service picks ups the
gas that the ESM delivers and moves it through the system to customers
• Transportation service
allows customers to bring gas to our system at specific points whereby we take possession and deliver
Station 2
Inter-connect
- 8 -
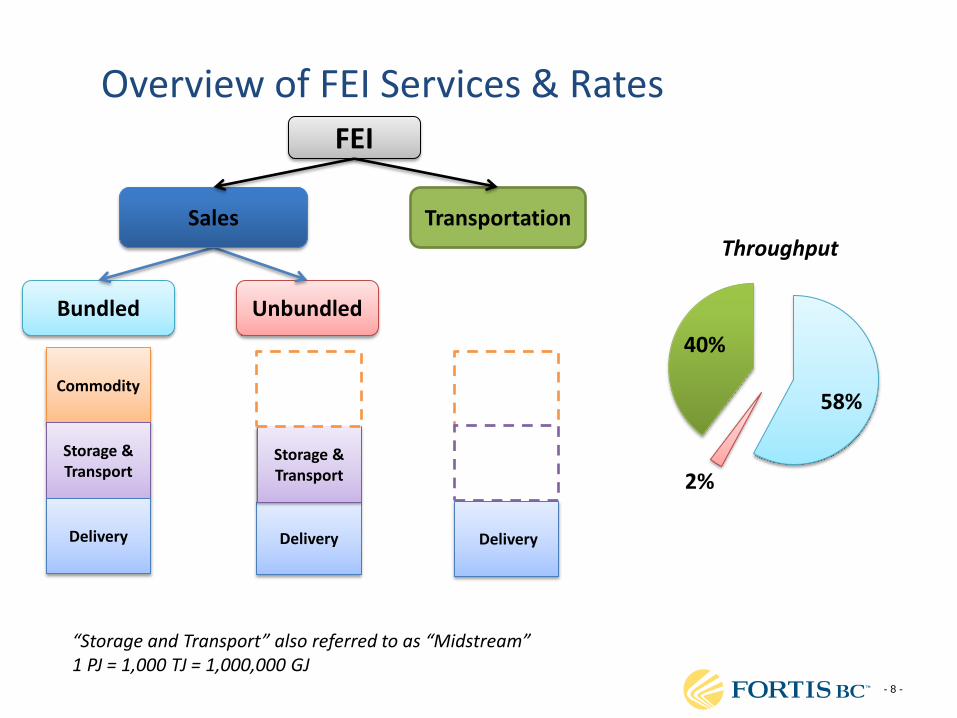
Overview of FEI Services & Rates
58%
2%
40%
Throughput
“Storage and Transport” also referred to as “Midstream” 1 PJ = 1,000 TJ = 1,000,000 GJ
FEI
Bundled Unbundled
Transportation Sales
Commodity
Storage & Transport
Delivery Delivery Delivery
Storage & Transport
- 9 -
GAS SUPPLY BASICS AND ESSENTIAL SERVICES MODEL
- 10 -
Overview
FEI Services & Bill Components
Commodity Unbundling & Essential Services Model
Overview of Region & FEI’s Resources
- 11 -
FEI SERVICES AND BILL
COMPONENTS
- 12 -
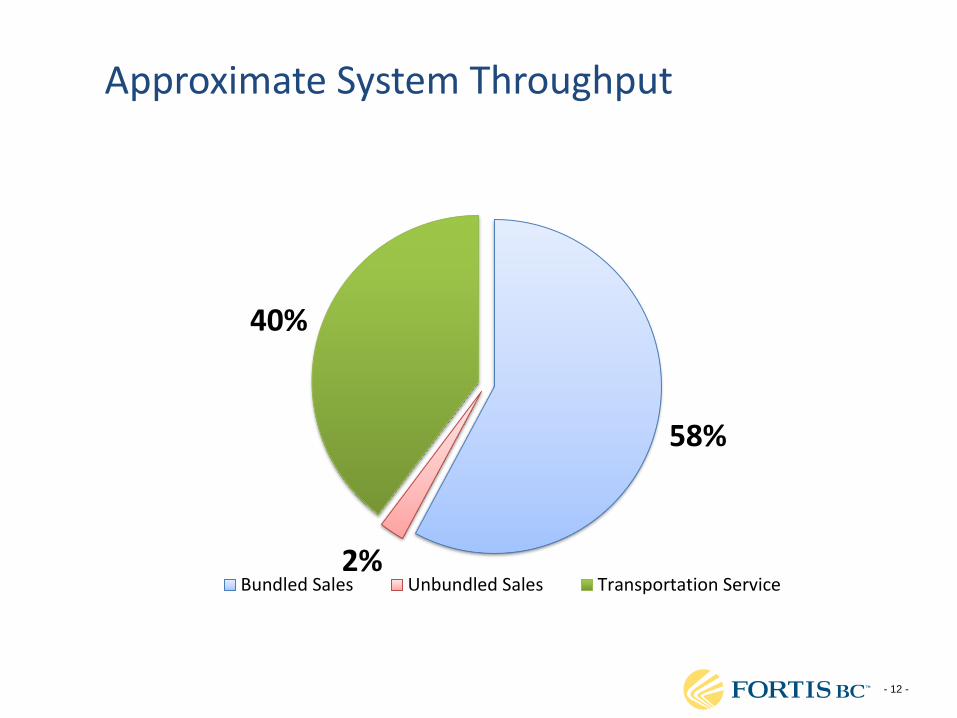
Approximate System Throughput
58%
2%
40%
Bundled Sales Unbundled Sales Transportation Service
- 13 -
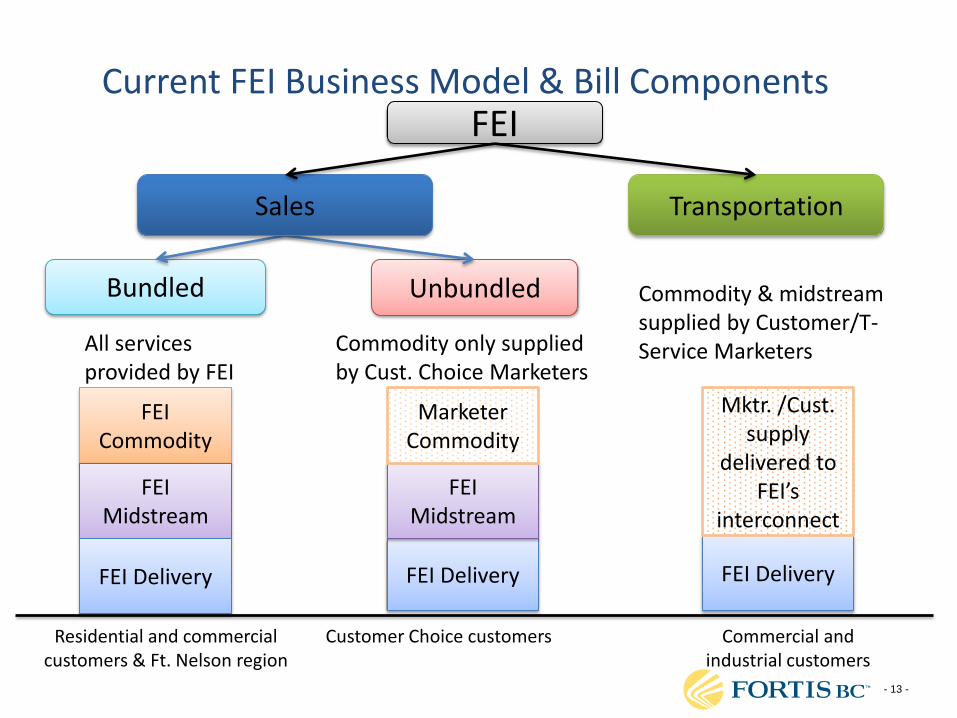
Current FEI Business Model & Bill Components FEI
Bundled Unbundled
Transportation Sales
FEI Commodity
FEI Midstream
FEI Delivery FEI Delivery FEI Delivery
Residential and commercial customers & Ft. Nelson region
Customer Choice customers Commercial and industrial customers
FEI Midstream
Commodity only supplied by Cust. Choice Marketers
All services provided by FEI
Mktr. /Cust. supply
delivered to FEI’s
interconnect
Commodity & midstream supplied by Customer/T-Service Marketers
Marketer Commodity
- 14 -
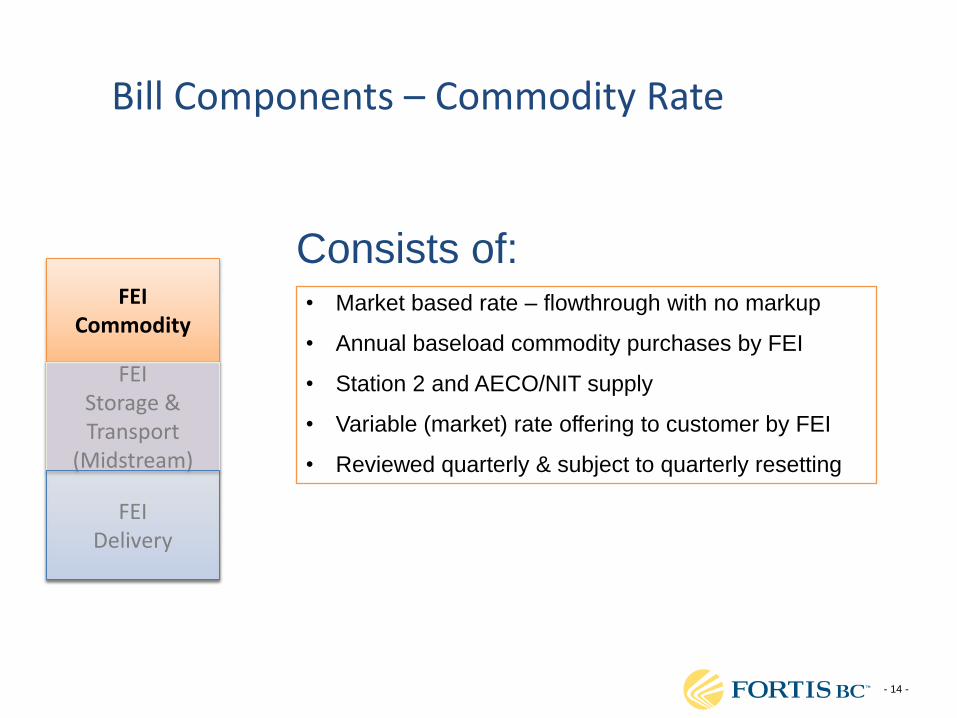
Bill Components – Commodity Rate
Consists of: • Market based rate – flowthrough with no markup
• Annual baseload commodity purchases by FEI
• Station 2 and AECO/NIT supply
• Variable (market) rate offering to customer by FEI
• Reviewed quarterly & subject to quarterly resetting
FEI Commodity
FEI Delivery
FEI Storage & Transport
(Midstream)

- 15 -
Bill Components – Storage & Transport (Midstream) Rate
Consists of:
• Market & Cost based rate – flowthrough with no markup
• Shaped winter gas supply & seasonal storage
• Upstream pipeline capacity on external pipeline systems
• Shorter duration market area and on-system LNG storage
• Load balancing functions for entire system
• Backstopping functions
• Reviewed quarterly but normally reset annually
FEI Commodity
FEI Delivery
FEI Storage & Transport
(Midstream)
- 16 -
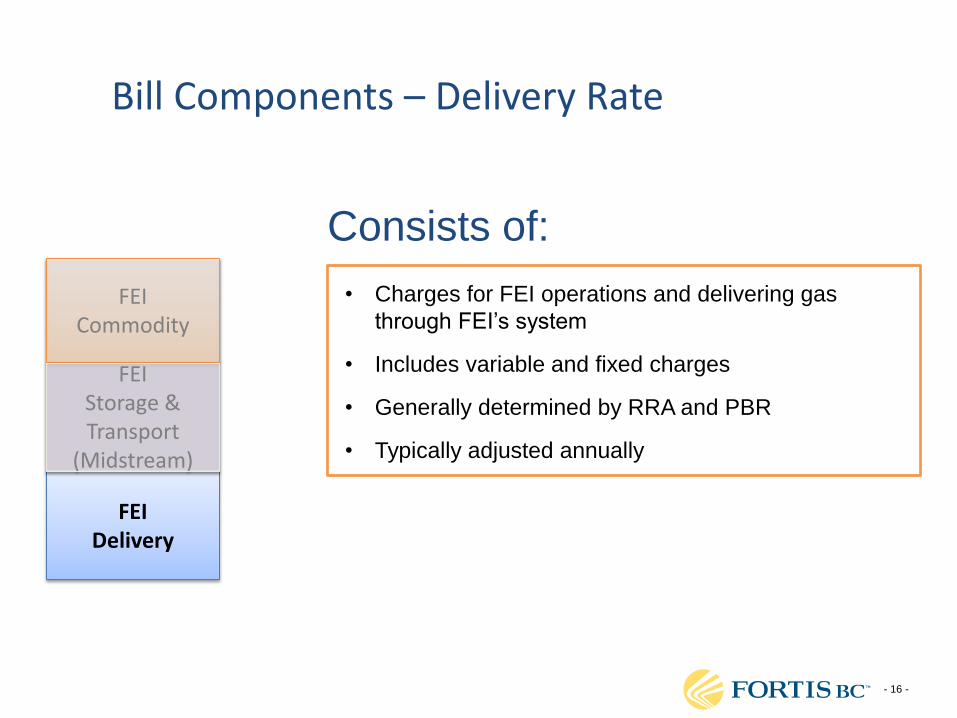
Bill Components – Delivery Rate
Consists of:
• Charges for FEI operations and delivering gas
through FEI’s system
• Includes variable and fixed charges
• Generally determined by RRA and PBR
• Typically adjusted annually
FEI Commodity
FEI Delivery
FEI Storage & Transport
(Midstream)
- 17 -
COMMODITY UNBUNDLING AND
ESSENTIAL SERVICES MODEL
Sales Service
- 18 -
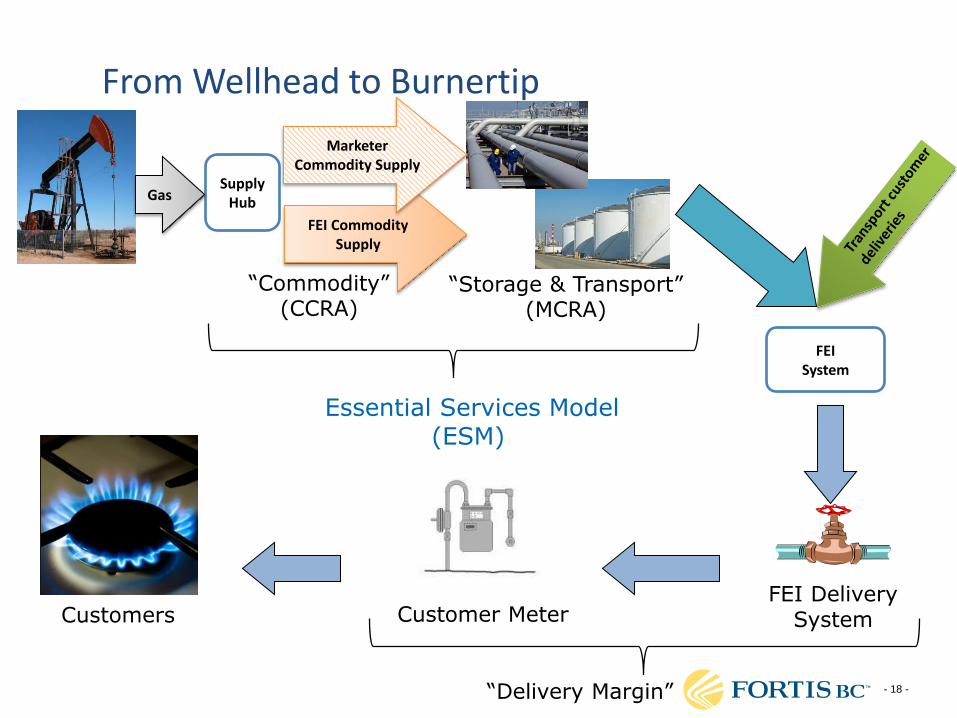
From Wellhead to Burnertip
Customers
“Delivery Margin”
“Commodity” (CCRA)
“Storage & Transport” (MCRA)
Essential Services Model (ESM)
Customer Meter FEI Delivery
System
FEI Commodity Supply
Supply Hub
FEI System
Gas
Marketer Commodity Supply
- 19 -
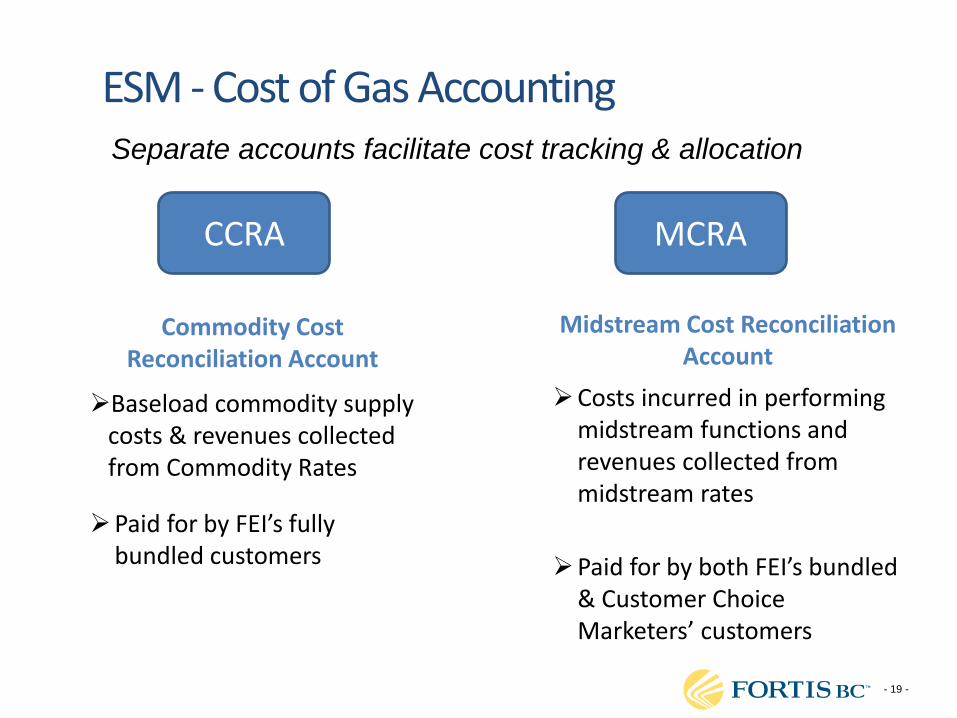
ESM - Cost of Gas Accounting Separate accounts facilitate cost tracking & allocation
Commodity Cost Reconciliation Account
Baseload commodity supply costs & revenues collected from Commodity Rates
Paid for by FEI’s fully bundled customers
Midstream Cost Reconciliation Account
Costs incurred in performing midstream functions and revenues collected from midstream rates
Paid for by both FEI’s bundled
& Customer Choice Marketers’ customers
CCRA MCRA
- 20 -
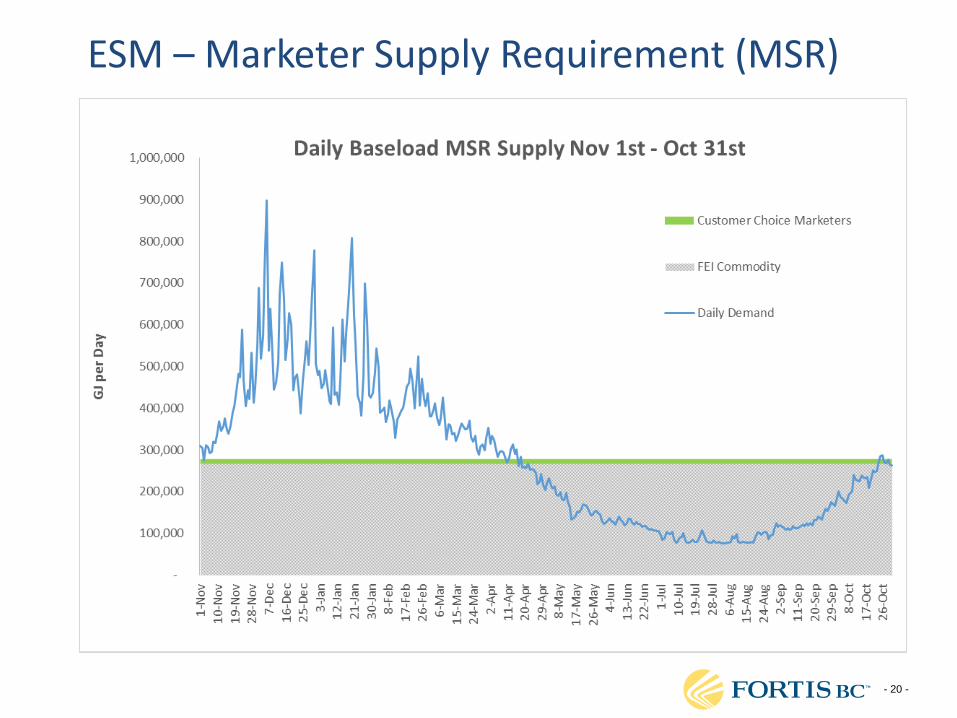
ESM – Marketer Supply Requirement (MSR)
- 21 -
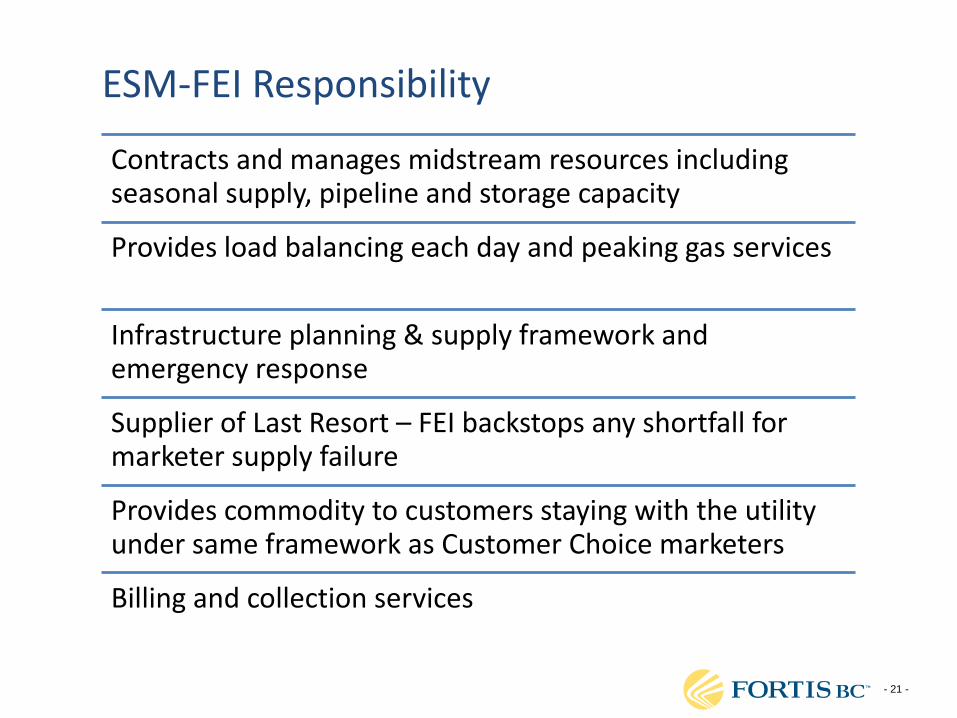
ESM-FEI Responsibility
Contracts and manages midstream resources including seasonal supply, pipeline and storage capacity
Provides load balancing each day and peaking gas services
Infrastructure planning & supply framework and emergency response
Supplier of Last Resort – FEI backstops any shortfall for marketer supply failure
Provides commodity to customers staying with the utility under same framework as Customer Choice marketers
Billing and collection services
- 22 -
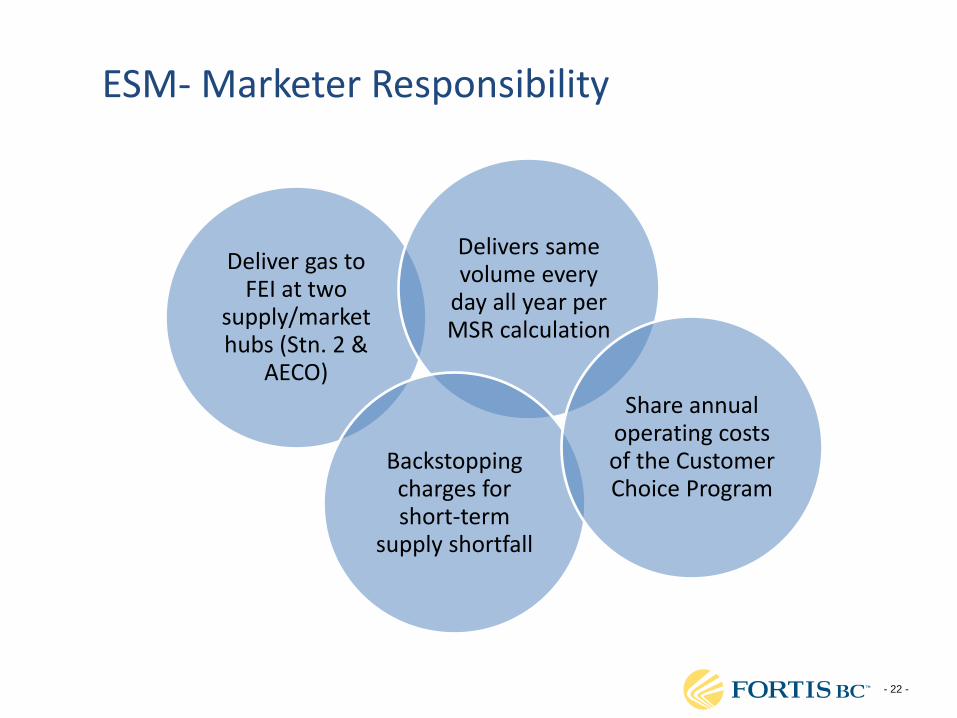
ESM- Marketer Responsibility
Deliver gas to FEI at two
supply/market hubs (Stn. 2 &
AECO)
Delivers same volume every
day all year per MSR calculation
Backstopping charges for short-term
supply shortfall
Share annual operating costs of the Customer Choice Program
- 23 -
FEI’S SYSTEM AND RESOURCES
Background & Overview of Regional Infrastructure
- 24 -
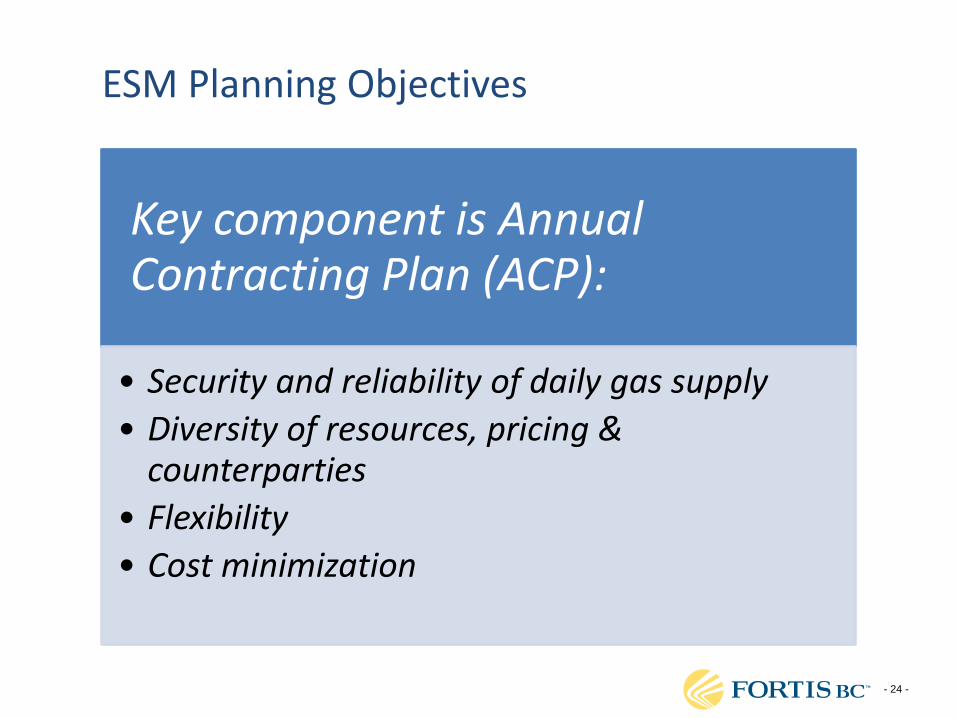
ESM Planning Objectives
Key component is Annual Contracting Plan (ACP):
• Security and reliability of daily gas supply
• Diversity of resources, pricing & counterparties
• Flexibility
• Cost minimization
- 25 -
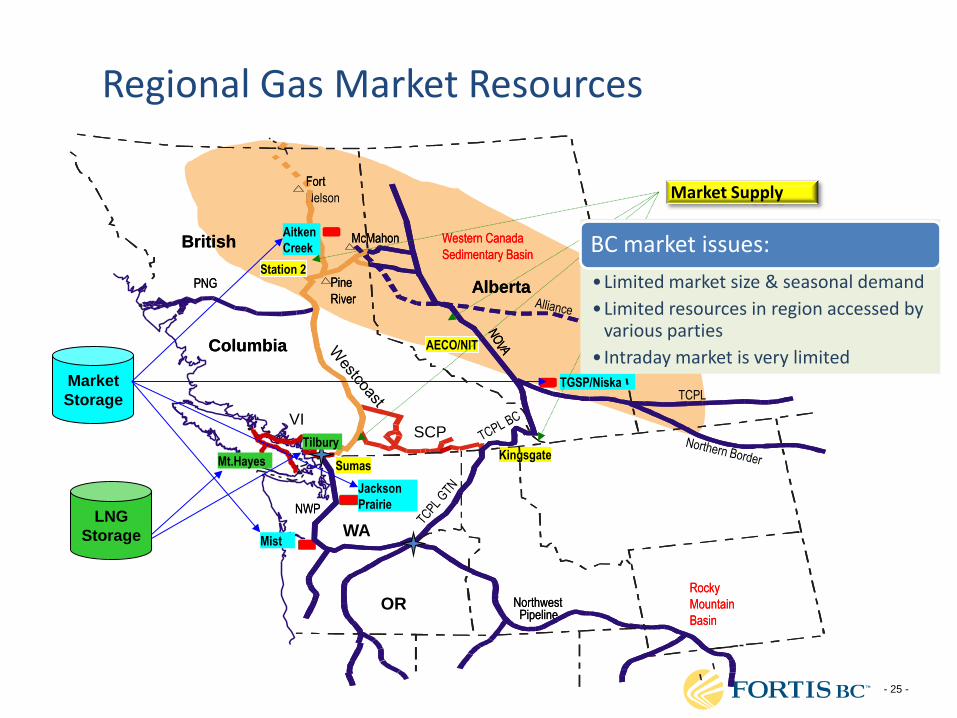
Regional Gas Market Resources
British
Alberta
Columbia
Fort
Nelson
TGSP/Niska
McMahon
Pine
River
TCPL
Northwest Pipeline
NWP
PNG
Rocky
Mountain
Basin
Western Canada
Sedimentary Basin British
Alberta
Columbia
Fort
Aitken
Creek
AECO/NIT
Jackson
Prairie
McMahon
Pine
River
Station 2
Northwest Pipeline
Kingsgate Sumas
NWP
PNG
Mist
Rocky
Mountain
Basin
Western Canada
Sedimentary Basin
SCP VI
WA
OR
Market Supply
Market
Storage
LNG
Storage
Mt.Hayes
Tilbury
BC market issues:
•Limited market size & seasonal demand
•Limited resources in region accessed by various parties
• Intraday market is very limited
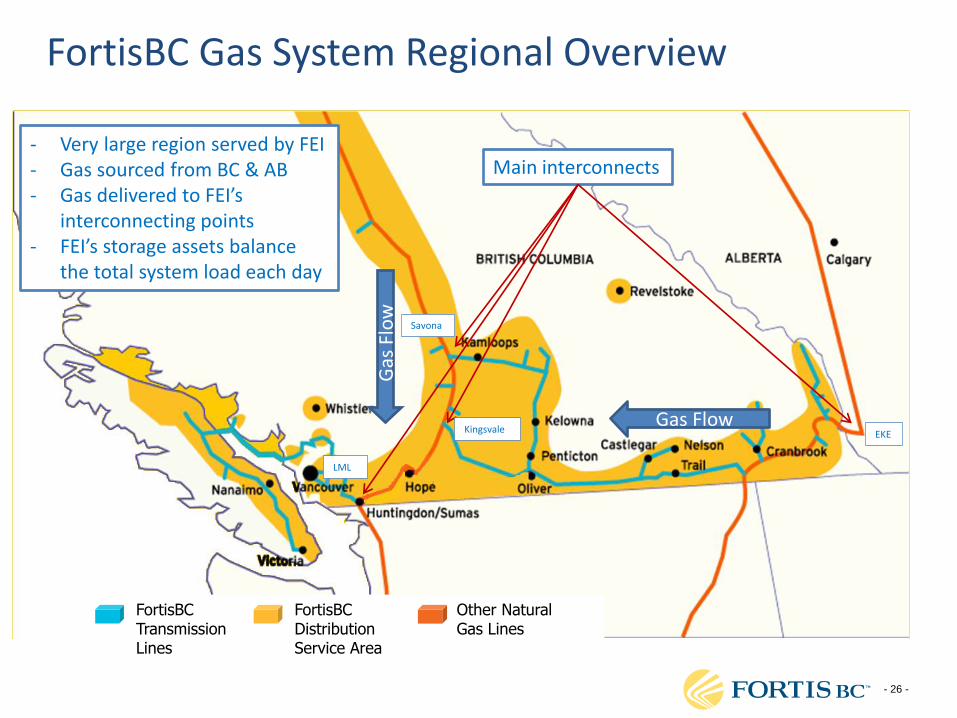
- 26 -
FortisBC Gas System Regional Overview
FortisBC Transmission Lines
FortisBC Distribution Service Area
Other Natural Gas Lines
Gas Flow
Gas
Flo
w
- Very large region served by FEI - Gas sourced from BC & AB - Gas delivered to FEI’s
interconnecting points - FEI’s storage assets balance
the total system load each day
Main interconnects
Savona
Kingsvale EKE
LML
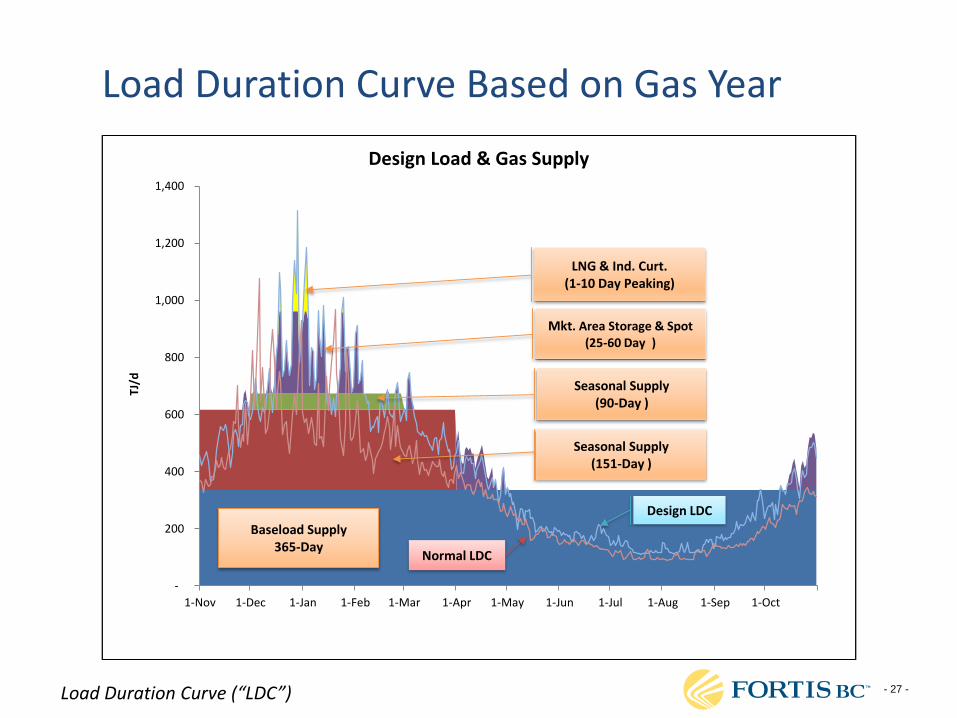
- 27 -
Load Duration Curve Based on Gas Year
-
200
400
600
800
1,000
1,200
1,400
1-Nov 1-Dec 1-Jan 1-Feb 1-Mar 1-Apr 1-May 1-Jun 1-Jul 1-Aug 1-Sep 1-Oct
TJ/d
Design Load & Gas Supply
Design LDC
Seasonal Supply(151-Day )
Seasonal Supply (90-Day )
Mkt. Area Storage & Spot(25-60 Day )
LNG & Ind. Curt.(1-10 Day Peaking)
Baseload Supply365-Day
Normal LDC
Load Duration Curve (“LDC”)
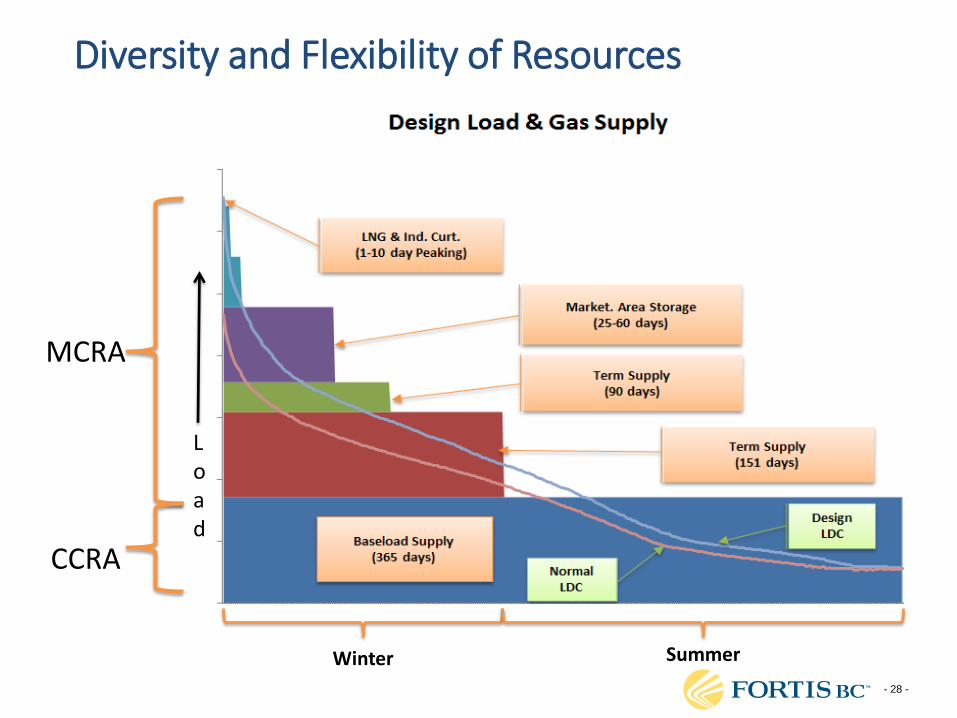
- 28 -
Diversity and Flexibility of Resources
MCRA
CCRA
Lo ad
Winter Summer
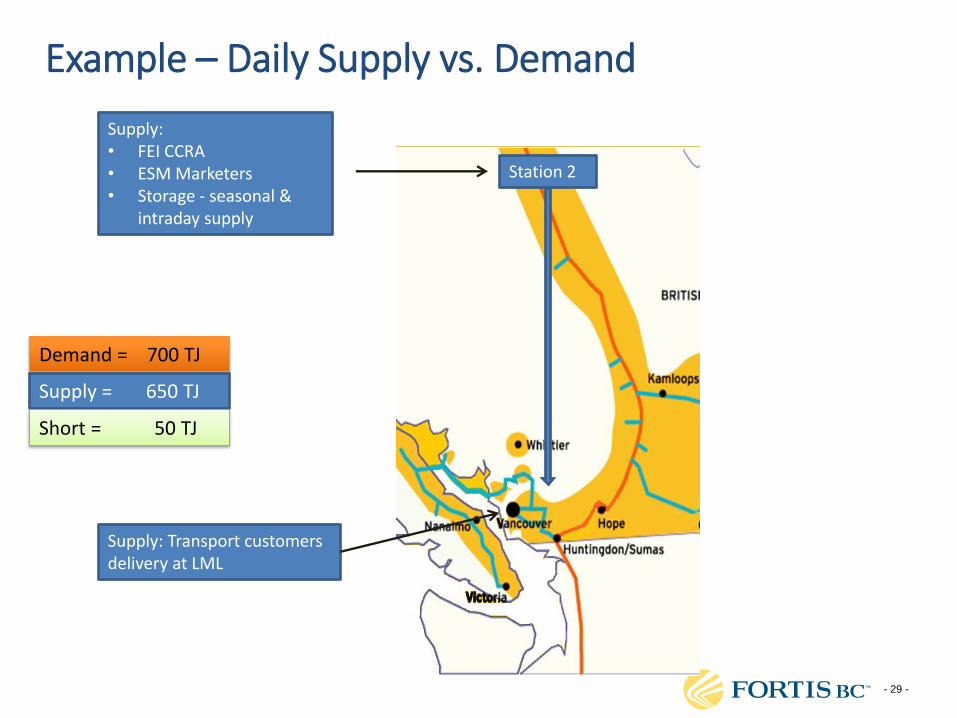
- 29 -
Example – Daily Supply vs. Demand
Station 2
Supply: • FEI CCRA • ESM Marketers • Storage - seasonal &
intraday supply
Supply: Transport customers delivery at LML
Demand = 700 TJ
Supply = 650 TJ
Short = 50 TJ
- 30 -
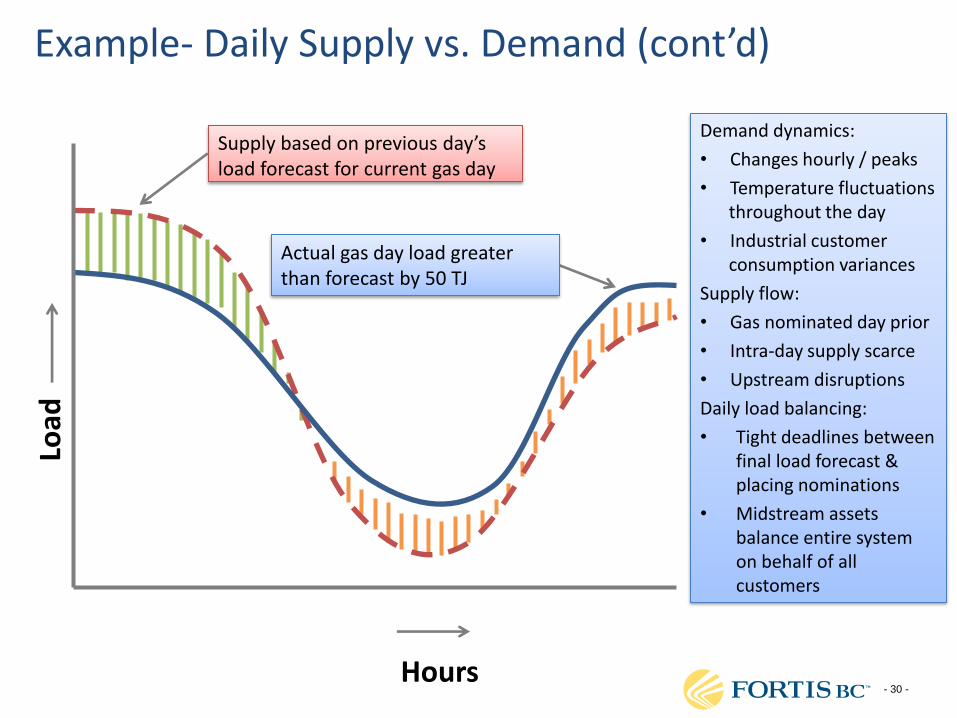
Load
Hours
Example- Daily Supply vs. Demand (cont’d)
Supply based on previous day’s load forecast for current gas day
Actual gas day load greater than forecast by 50 TJ
Demand dynamics:
• Changes hourly / peaks
• Temperature fluctuations throughout the day
• Industrial customer consumption variances
Supply flow:
• Gas nominated day prior
• Intra-day supply scarce
• Upstream disruptions
Daily load balancing:
• Tight deadlines between final load forecast & placing nominations
• Midstream assets balance entire system on behalf of all customers
- 31 -
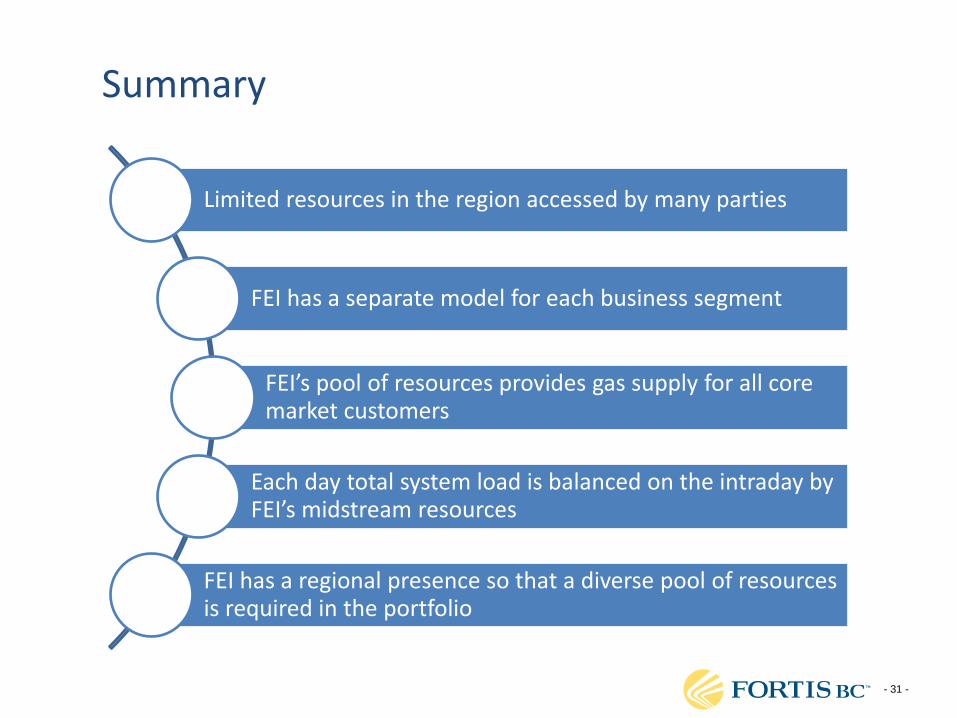
Summary
Limited resources in the region accessed by many parties
FEI has a separate model for each business segment
FEI’s pool of resources provides gas supply for all core market customers
Each day total system load is balanced on the intraday by FEI’s midstream resources
FEI has a regional presence so that a diverse pool of resources is required in the portfolio
- 32 -
TRANSPORTATION MODEL OVERVIEW
- 33 -
Overview
General Background
Key Components of the Transport Model
Administering the Tariff and Applicable Charges
Summary
- 34 -
GENERAL BACKGROUND

- 35 -
Highlights
• Designed to give larger customers “choice” in who they to procure their gas supply from
• Transportation service customers can make supply arrangements on their own behalf, or through Marketers participating in the transport model
• Natural gas supply is delivered to FEI at the interconnect and FEI transports and delivers it to the customer’s premise
• Transportation Rate Schedules set terms and conditions of service offering
- 36 -
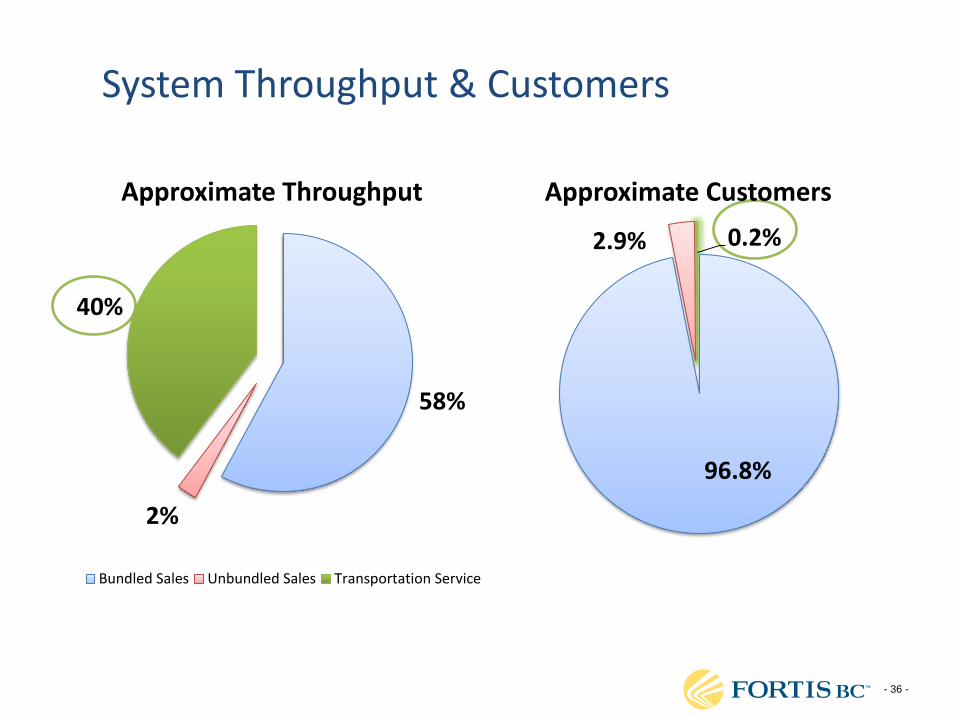
96.8%
2.9% 0.2%
Approximate Customers
System Throughput & Customers
58%
2%
40%
Approximate Throughput
Bundled Sales Unbundled Sales Transportation Service
- 37 -
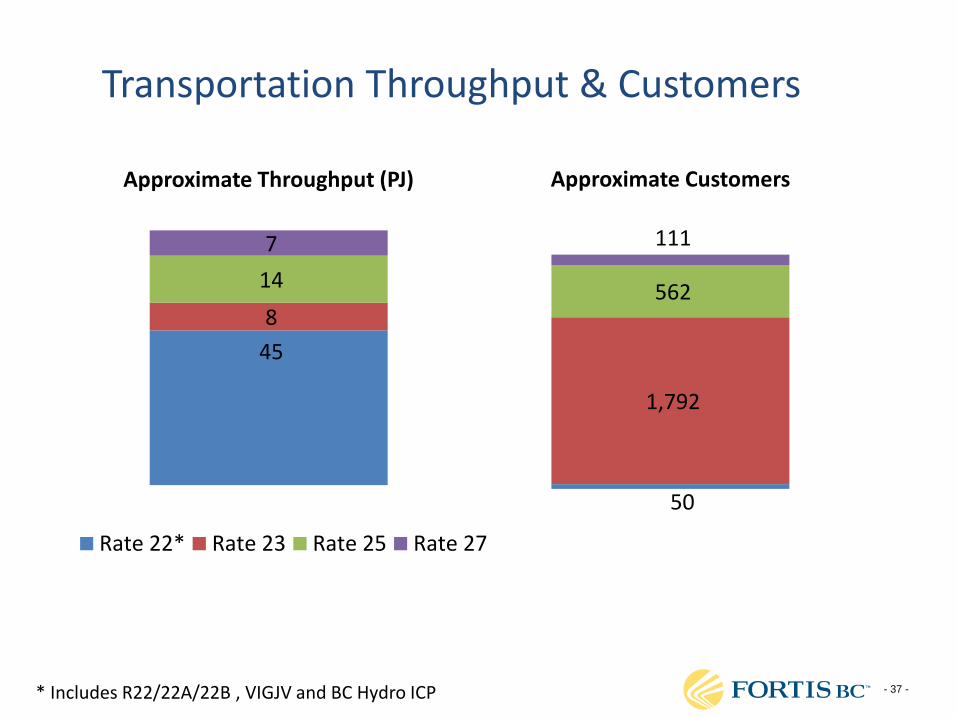
Transportation Throughput & Customers
* Includes R22/22A/22B , VIGJV and BC Hydro ICP
45
8
14
7
Approximate Throughput (PJ)
Rate 22* Rate 23 Rate 25 Rate 27
50
1,792
562
111
Approximate Customers
- 38 -
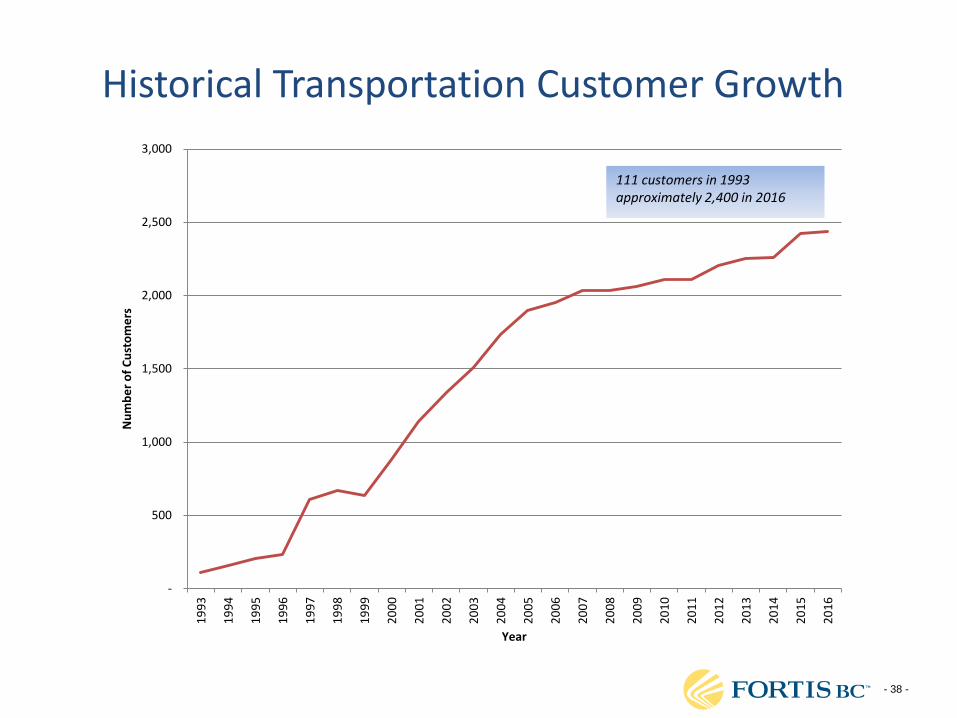
Historical Transportation Customer Growth
-
500
1,000
1,500
2,000
2,500
3,000
19
93
19
94
19
95
19
96
19
97
19
98
19
99
20
00
20
01
20
02
20
03
20
04
20
05
20
06
20
07
20
08
20
09
20
10
20
11
20
12
20
13
20
14
20
15
20
16
Nu
mb
er
of
Cu
sto
me
rs
Year
111 customers in 1993 approximately 2,400 in 2016
- 39 -
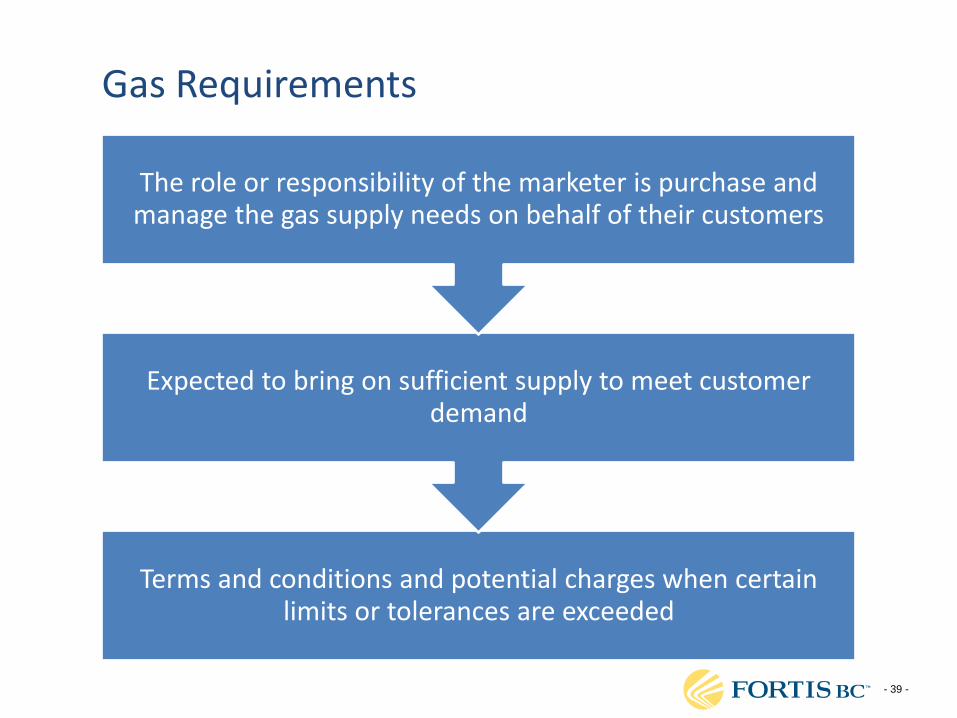
Gas Requirements
Terms and conditions and potential charges when certain limits or tolerances are exceeded
Expected to bring on sufficient supply to meet customer demand
The role or responsibility of the marketer is purchase and manage the gas supply needs on behalf of their customers
- 40 -
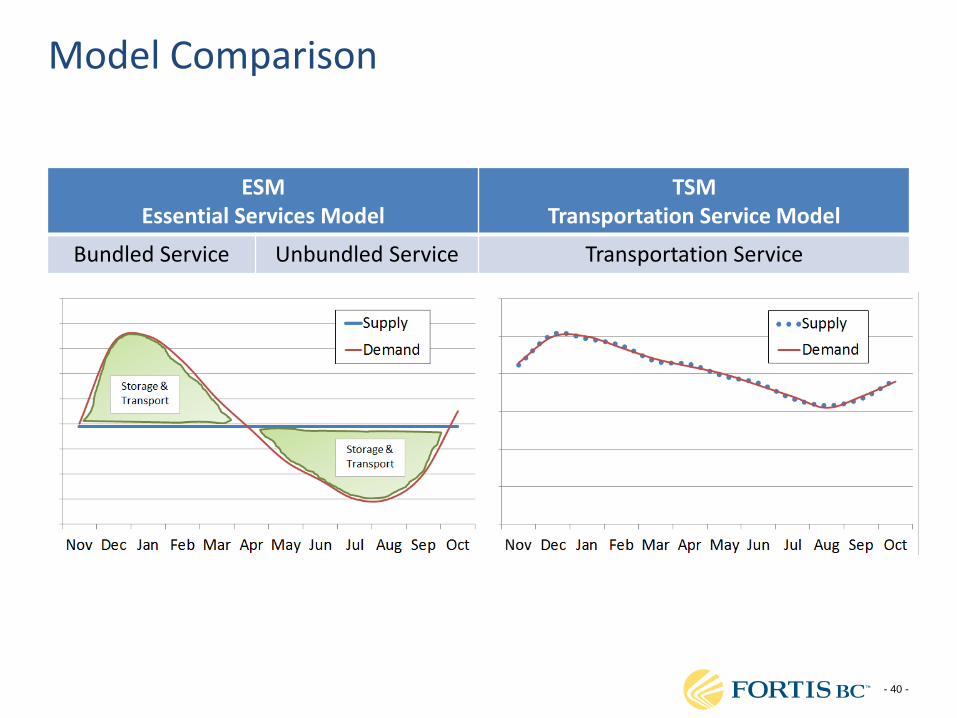
Model Comparison
ESM Essential Services Model
TSM Transportation Service Model
Bundled Service Unbundled Service Transportation Service
- 41 -
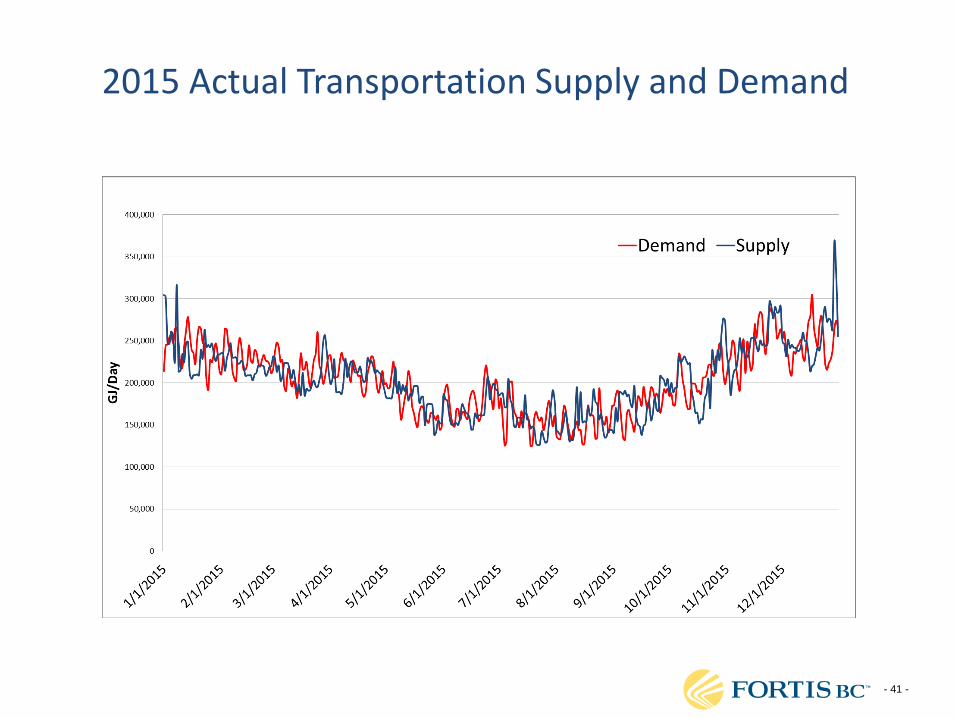
2015 Actual Transportation Supply and Demand
- 42 -
KEY COMPONENTS
- 43 -
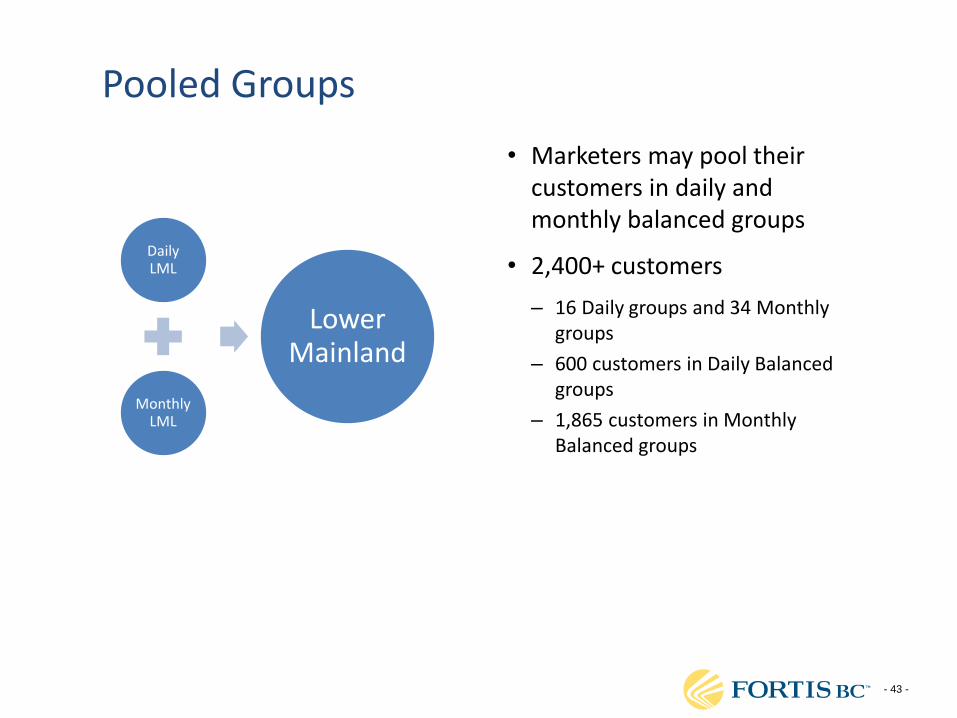
Pooled Groups
• Marketers may pool their customers in daily and monthly balanced groups
• 2,400+ customers
– 16 Daily groups and 34 Monthly groups
– 600 customers in Daily Balanced groups
– 1,865 customers in Monthly Balanced groups
Daily LML
Monthly LML
Lower Mainland
- 44 -
Transportation Service Balancing Requirements
- 45 -
Daily Balancing on FEI’s system
Demand Supply
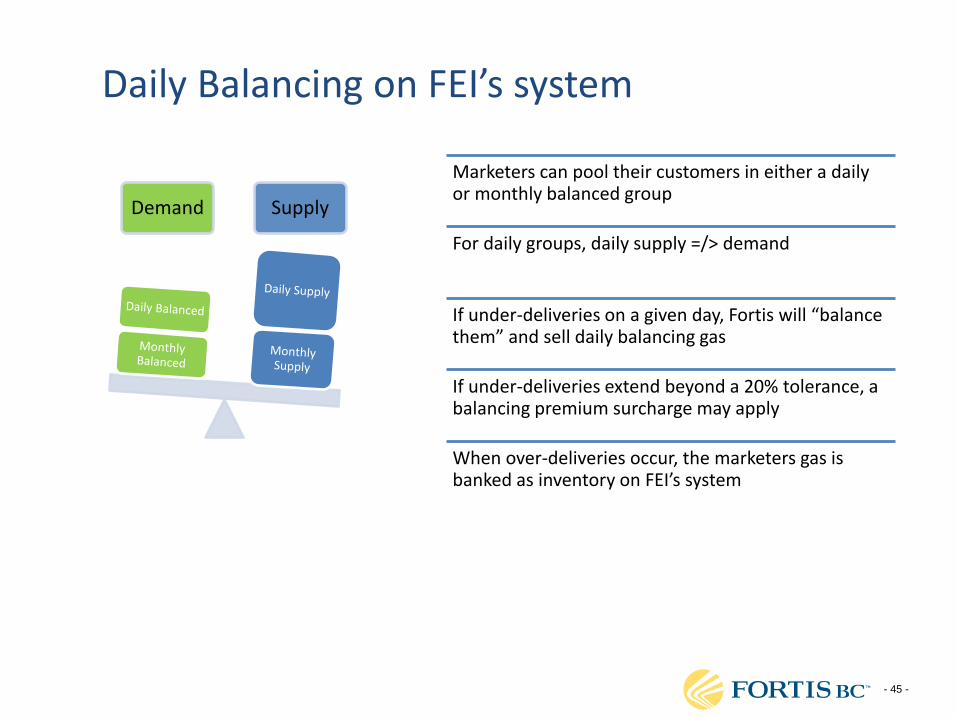
Marketers can pool their customers in either a daily or monthly balanced group
For daily groups, daily supply =/> demand
If under-deliveries on a given day, Fortis will “balance them” and sell daily balancing gas
If under-deliveries extend beyond a 20% tolerance, a balancing premium surcharge may apply
When over-deliveries occur, the marketers gas is banked as inventory on FEI’s system
- 46 -
Monthly Balancing on FEI’s system
Demand Supply
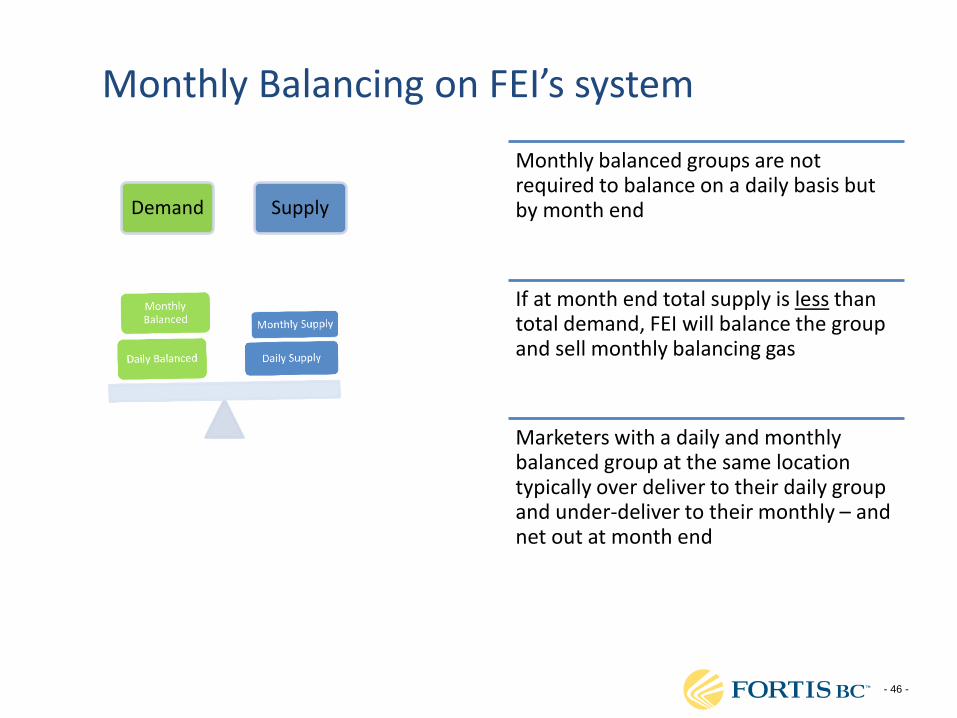
Monthly balanced groups are not required to balance on a daily basis but by month end
If at month end total supply is less than total demand, FEI will balance the group and sell monthly balancing gas
Marketers with a daily and monthly balanced group at the same location typically over deliver to their daily group and under-deliver to their monthly – and net out at month end
- 47 -
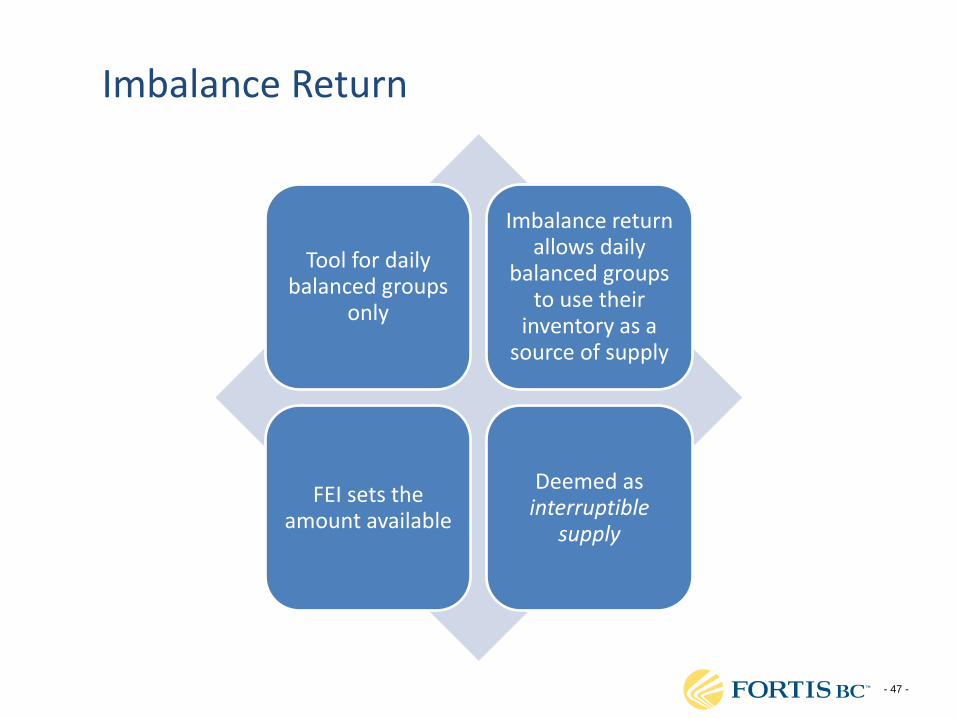
Imbalance Return
Tool for daily balanced groups
only
Imbalance return allows daily
balanced groups to use their
inventory as a source of supply
FEI sets the amount available
Deemed as interruptible
supply
- 48 -
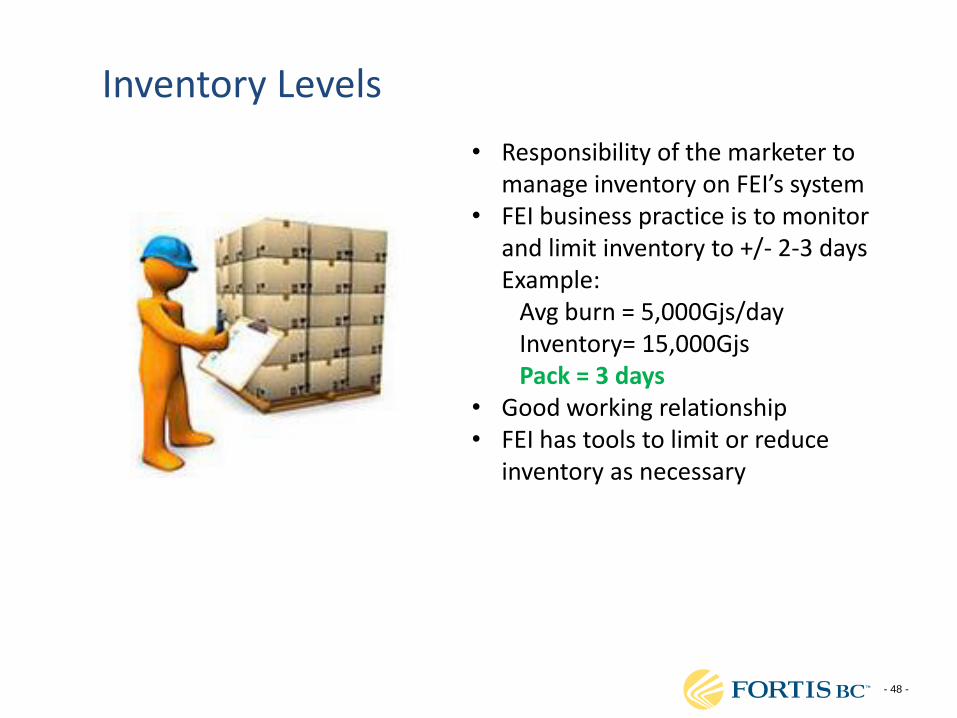
Inventory Levels
• Responsibility of the marketer to manage inventory on FEI’s system
• FEI business practice is to monitor and limit inventory to +/- 2-3 days Example:
Avg burn = 5,000Gjs/day Inventory= 15,000Gjs Pack = 3 days
• Good working relationship • FEI has tools to limit or reduce
inventory as necessary
- 49 -
ADMINISTERING THE TARIFF
- 50 -
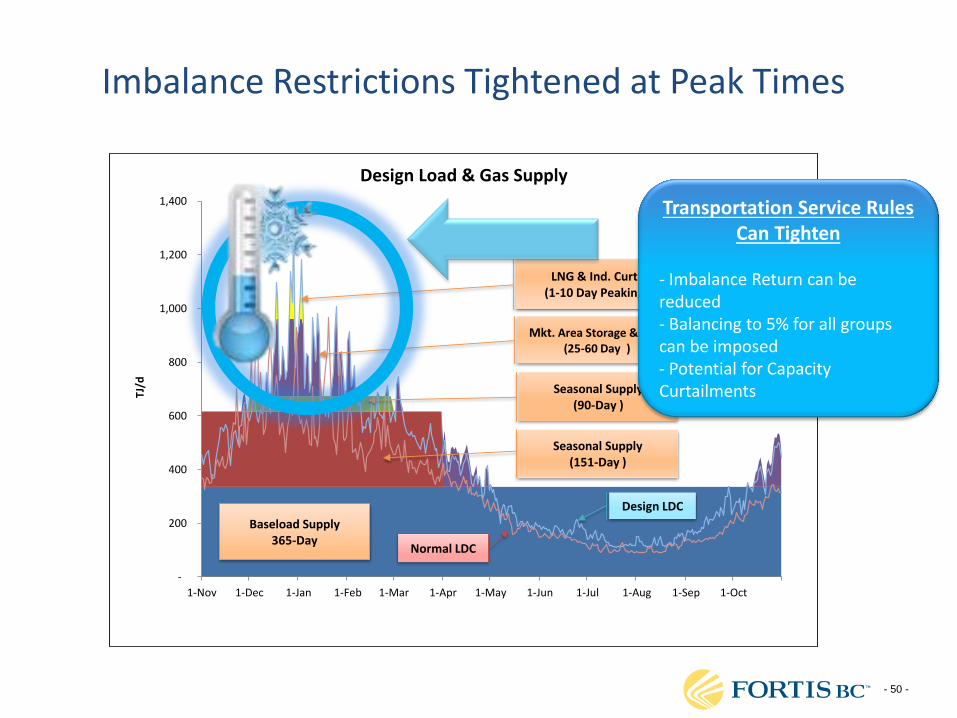
Imbalance Restrictions Tightened at Peak Times
-
200
400
600
800
1,000
1,200
1,400
1-Nov 1-Dec 1-Jan 1-Feb 1-Mar 1-Apr 1-May 1-Jun 1-Jul 1-Aug 1-Sep 1-Oct
TJ/d
Design Load & Gas Supply
Design LDC
Seasonal Supply(151-Day )
Seasonal Supply (90-Day )
Mkt. Area Storage & Spot(25-60 Day )
LNG & Ind. Curt.(1-10 Day Peaking)
Baseload Supply365-Day
Normal LDC
Transportation Service Rules Can Tighten
- Imbalance Return can be reduced - Balancing to 5% for all groups can be imposed - Potential for Capacity Curtailments
- 51 -
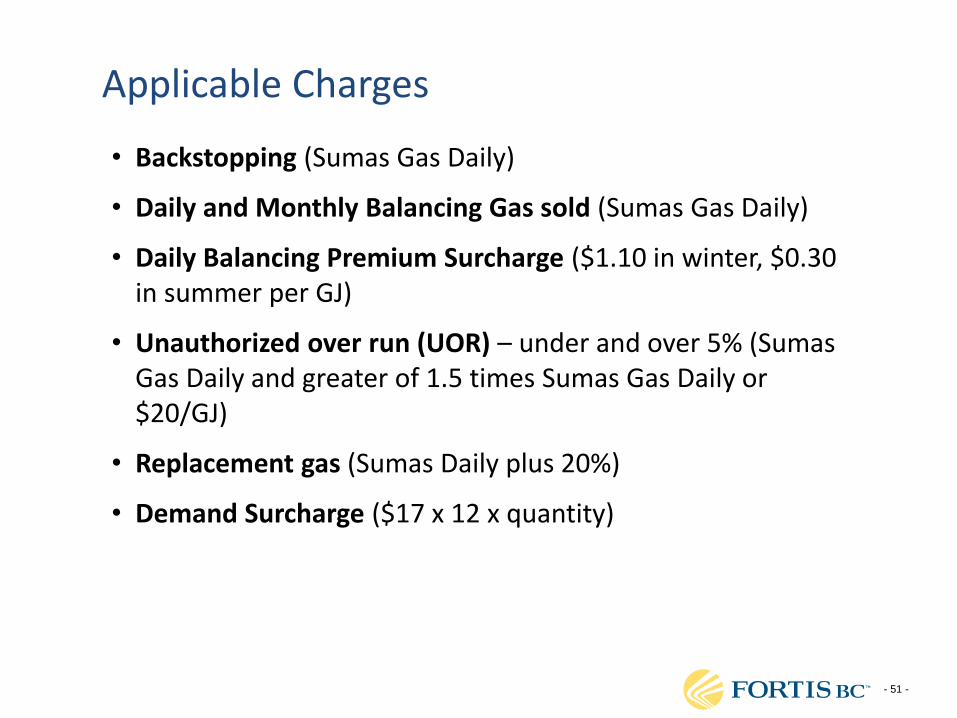
Applicable Charges
• Backstopping (Sumas Gas Daily)
• Daily and Monthly Balancing Gas sold (Sumas Gas Daily)
• Daily Balancing Premium Surcharge ($1.10 in winter, $0.30 in summer per GJ)
• Unauthorized over run (UOR) – under and over 5% (Sumas Gas Daily and greater of 1.5 times Sumas Gas Daily or $20/GJ)
• Replacement gas (Sumas Daily plus 20%)
• Demand Surcharge ($17 x 12 x quantity)
- 52 -
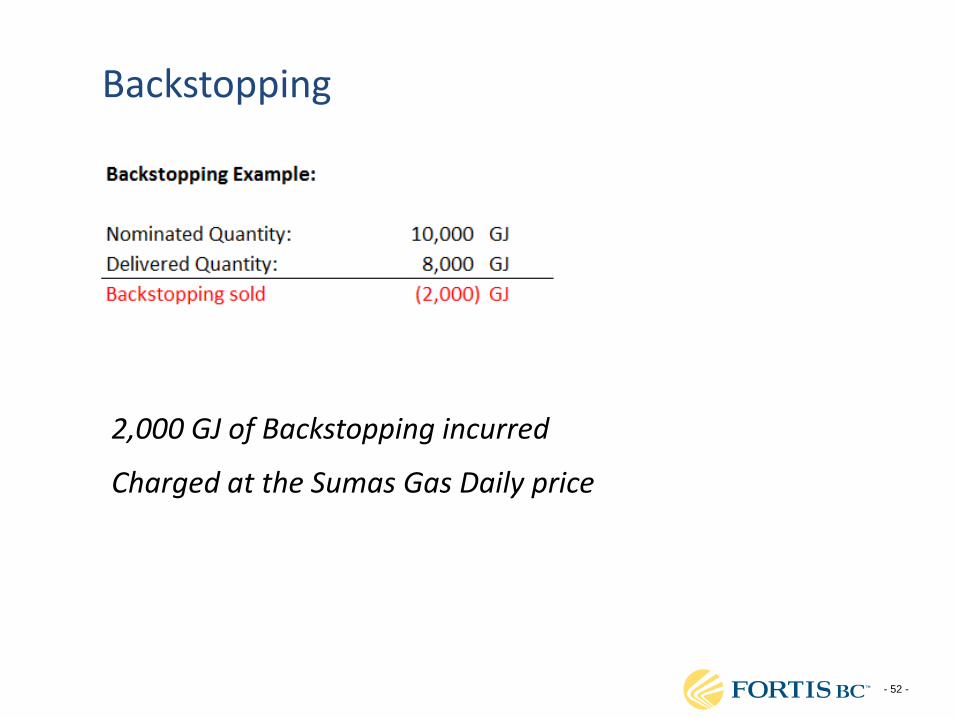
Backstopping
2,000 GJ of Backstopping incurred
Charged at the Sumas Gas Daily price

- 53 -
Daily Balancing Gas and Balancing Premium Surcharge
- 54 -
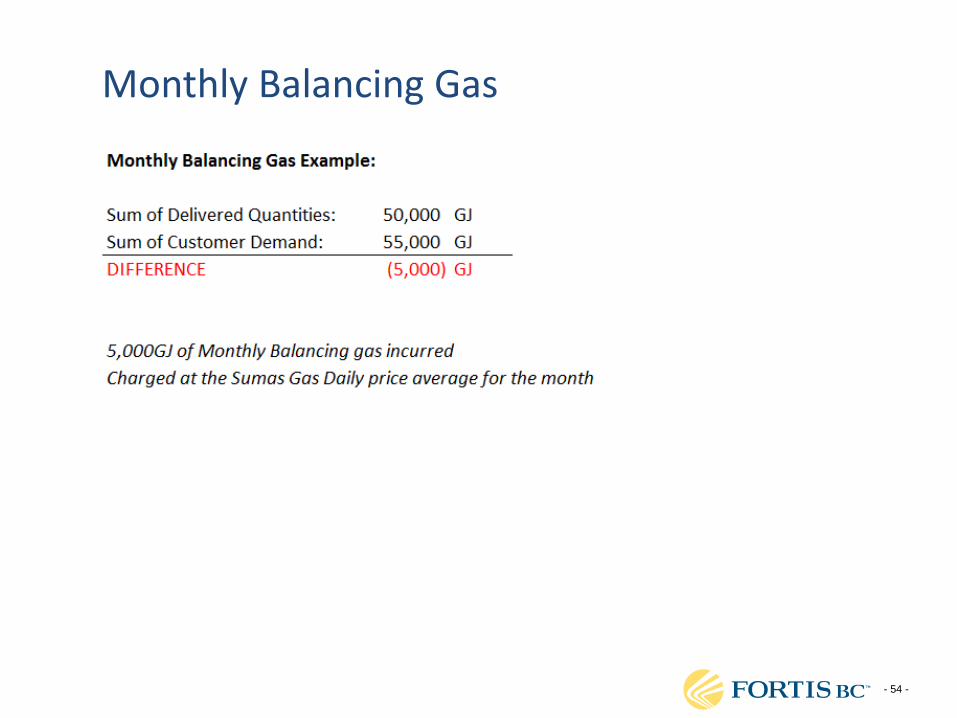
Monthly Balancing Gas
- 55 -
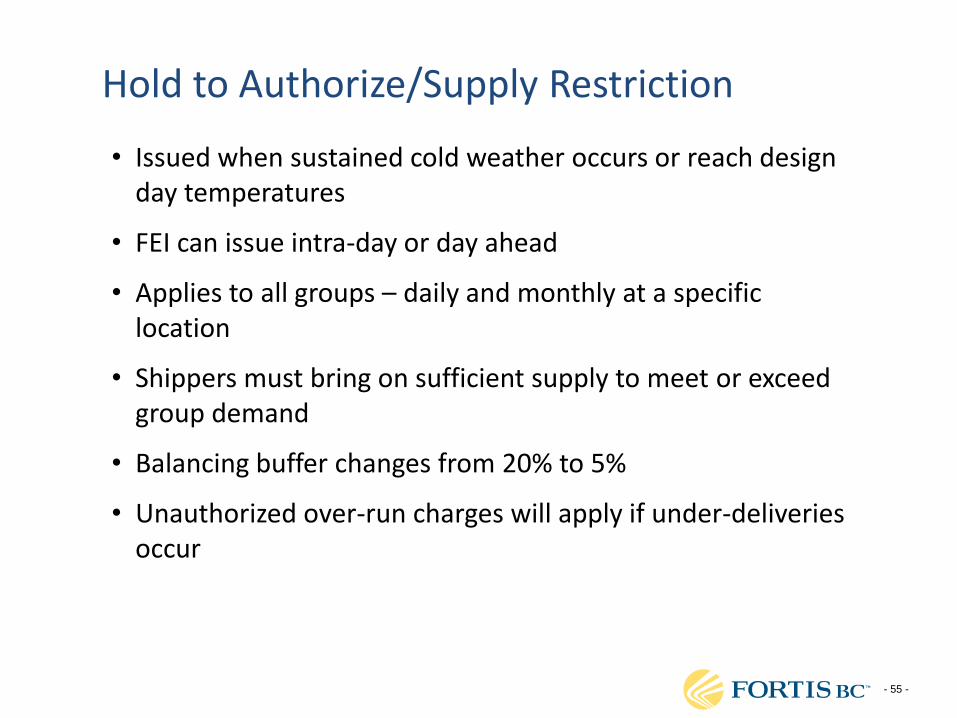
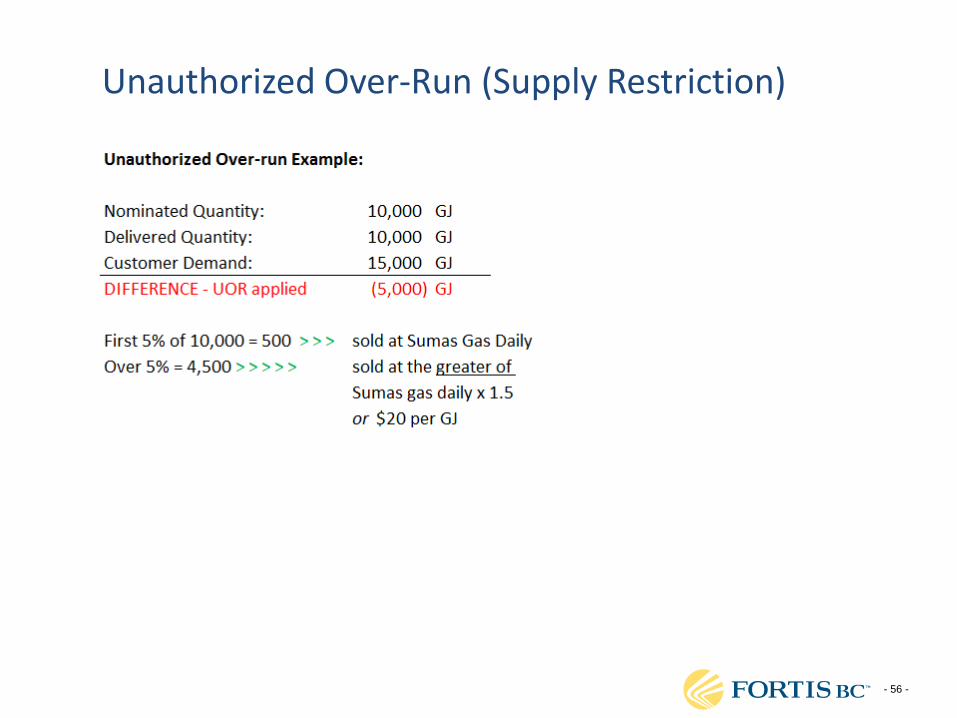
Hold to Authorize/Supply Restriction
• Issued when sustained cold weather occurs or reach design day temperatures
• FEI can issue intra-day or day ahead
• Applies to all groups – daily and monthly at a specific location
• Shippers must bring on sufficient supply to meet or exceed group demand
• Balancing buffer changes from 20% to 5%
• Unauthorized over-run charges will apply if under-deliveries occur
- 56 -
Unauthorized Over-Run (Supply Restriction)
- 57 -
Capacity Curtailment – Interruptible Customers
• Applies to specific Interruptible customers, typically either a Rate 22/22A/22B or 7/27 at a specific location on our system
• Does not apply to the marketer
• Decision to curtail or limit a specific customer(s) is determined by FEI’s Gas Control Department
• Customer may be required to reduce consumption or curtailed completely
• If customer takes in excess of the curtailed quantity, Unauthorized Over-Run (UOR) and potentially Demand Surcharges may apply
- 58 -
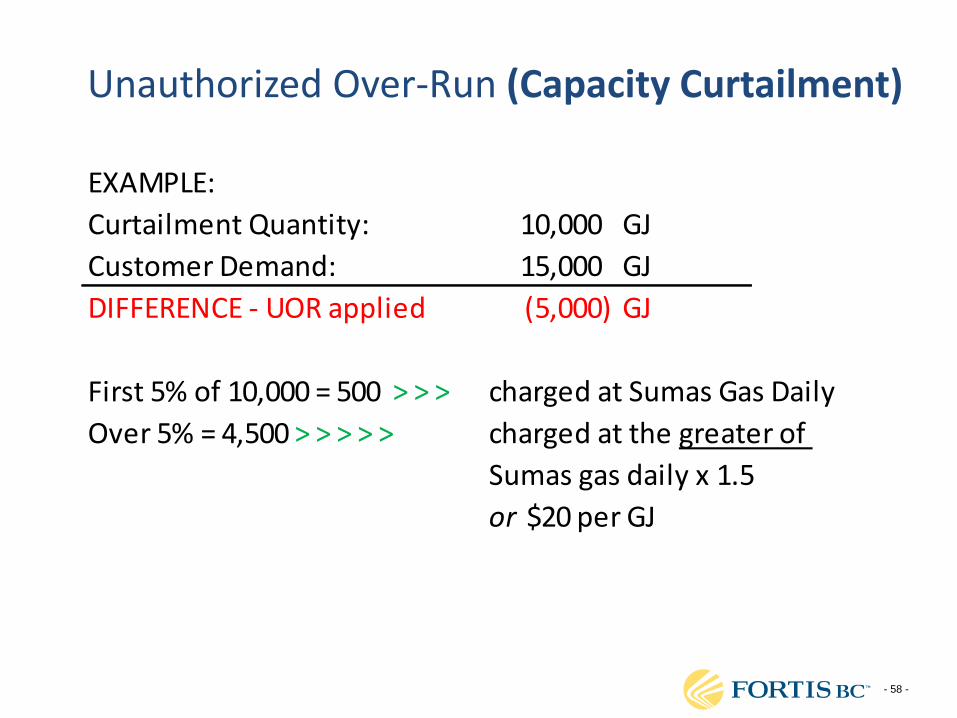
Unauthorized Over-Run (Capacity Curtailment)
EXAMPLE:
Curtailment Quantity: 10,000 GJ
Customer Demand: 15,000 GJ
DIFFERENCE - UOR applied (5,000) GJ
First 5% of 10,000 = 500 > > > charged at Sumas Gas Daily
Over 5% = 4,500 > > > > > charged at the greater of
Sumas gas daily x 1.5
or $20 per GJ
- 59 -
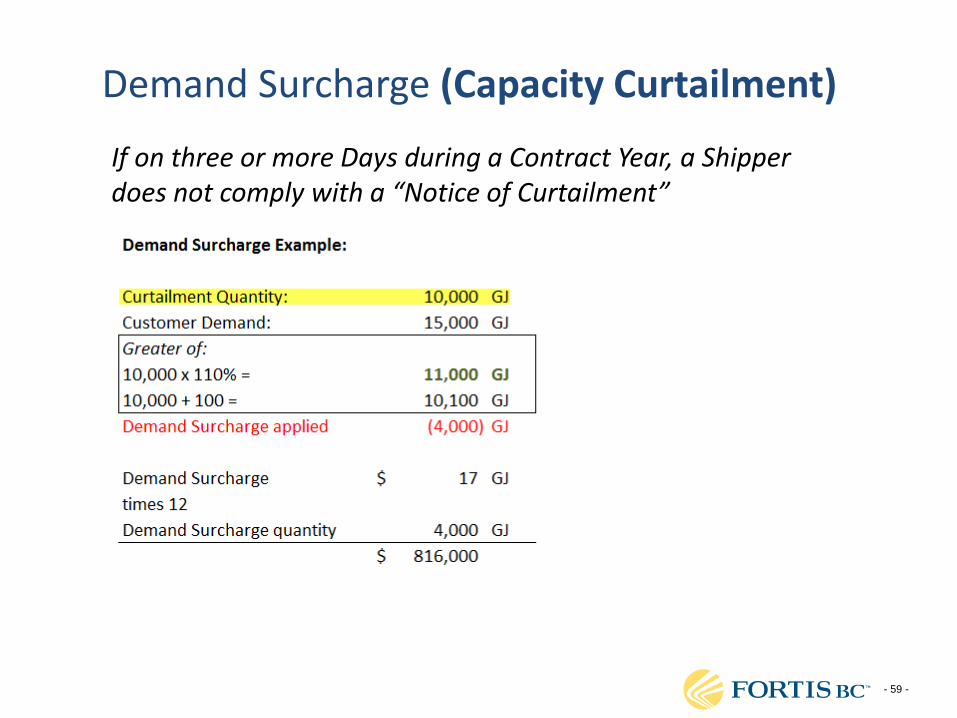
Demand Surcharge (Capacity Curtailment)
If on three or more Days during a Contract Year, a Shipper does not comply with a “Notice of Curtailment”
- 60 -
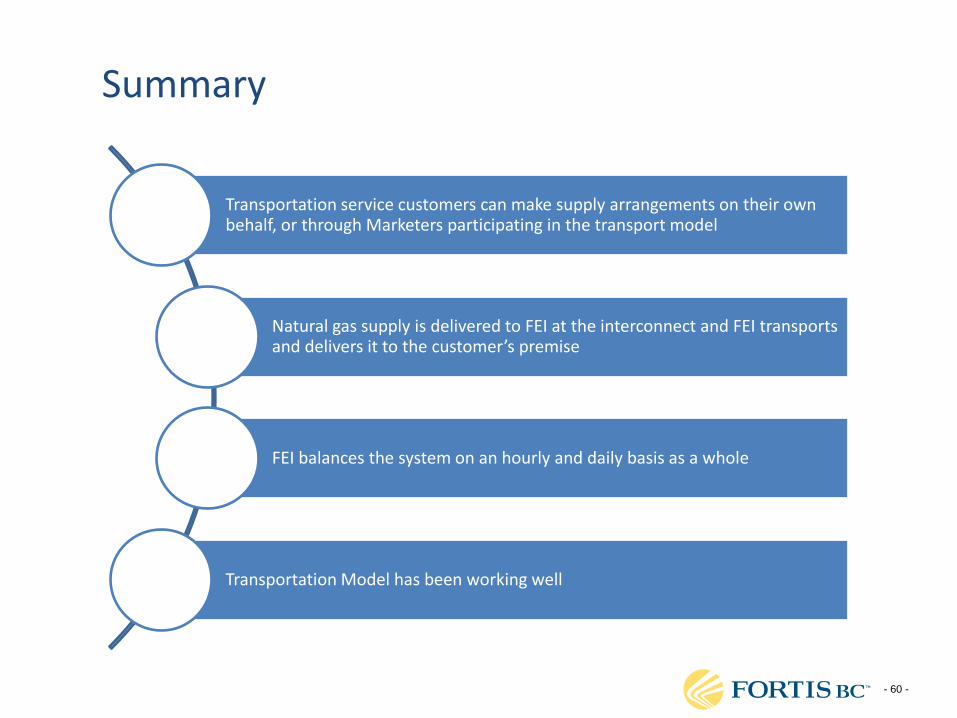
Summary
Transportation service customers can make supply arrangements on their own behalf, or through Marketers participating in the transport model
Natural gas supply is delivered to FEI at the interconnect and FEI transports and delivers it to the customer’s premise
FEI balances the system on an hourly and daily basis as a whole
Transportation Model has been working well
- 61 -
INTRODUCTION Part II
- 62 -
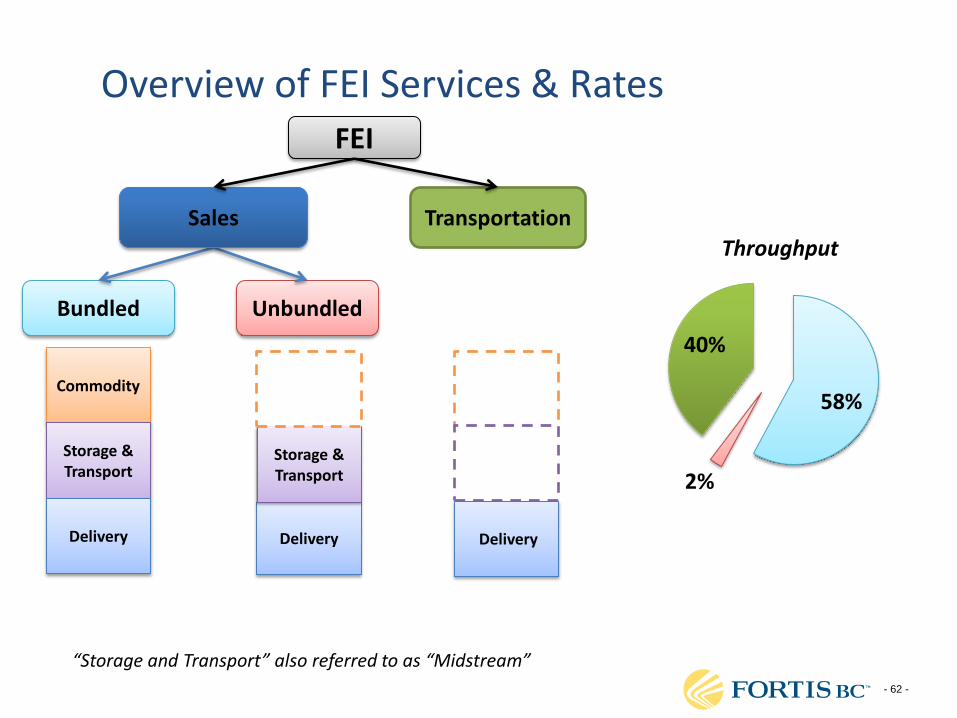
Overview of FEI Services & Rates
58%
2%
40%
Throughput
“Storage and Transport” also referred to as “Midstream”
FEI
Bundled Unbundled
Transportation Sales
Commodity
Storage & Transport
Delivery Delivery Delivery
Storage & Transport
- 63 -
COST OF SERVICE, SEGMENTATION & RATE DESIGN CONCEPTS
- 64 -
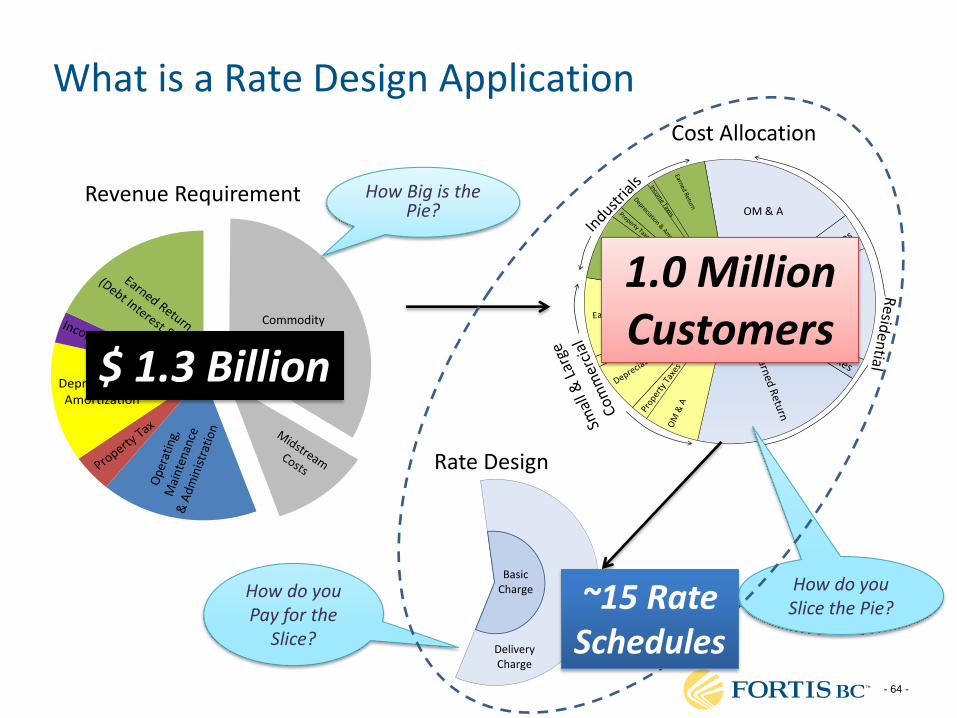
What is a Rate Design Application
Depreciation & Amortization
Commodity Costs
OM & A
Depreciation &Amortization
DeliveryCharge
Basic Charge
Revenue Requirement
Cost Allocation
Rate Design
How Big is the Pie?
How do you Slice the Pie?
How do you Pay for the
Slice?
$ 1.3 Billion
1.0 Million Customers
~15 Rate Schedules
- 65 -
How we split up our Revenue Requirement amongst our
customers
How we design our customers rates
- 66 -
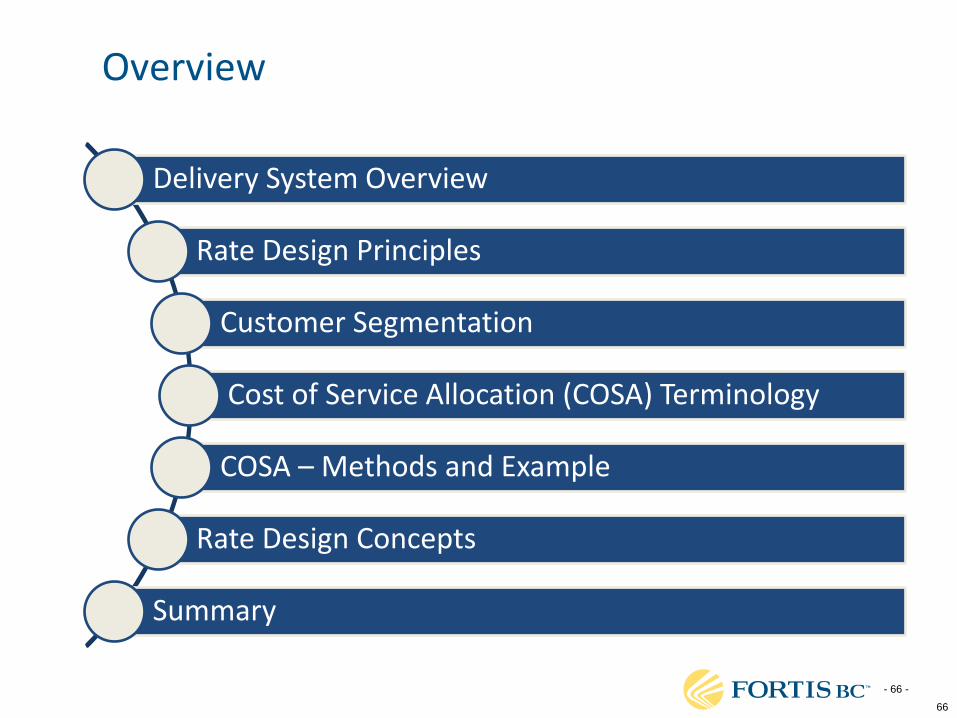
Overview
Delivery System Overview
Rate Design Principles
Customer Segmentation
Cost of Service Allocation (COSA) Terminology
COSA – Methods and Example
Rate Design Concepts
Summary
66
- 67 -
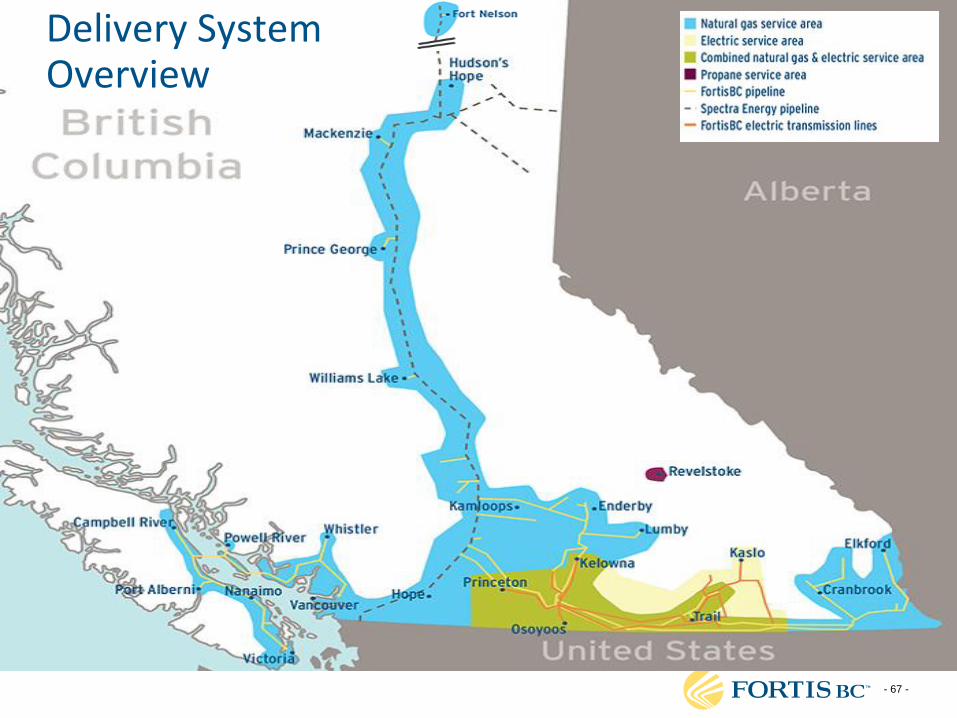
Delivery System Overview
- 68 -
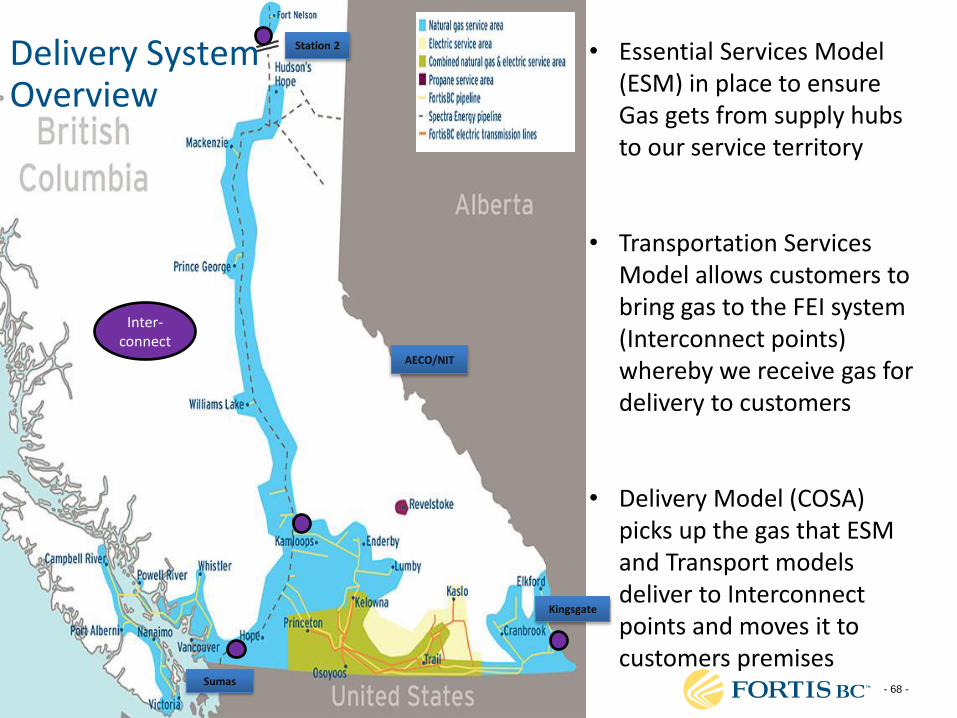
AECO/NIT
Kingsgate
Sumas
• Essential Services Model (ESM) in place to ensure Gas gets from supply hubs to our service territory
• Transportation Services Model allows customers to bring gas to the FEI system (Interconnect points) whereby we receive gas for delivery to customers
• Delivery Model (COSA) picks up the gas that ESM and Transport models deliver to Interconnect points and moves it to customers premises
Station 2
Inter-connect
Delivery System Overview
- 69 -
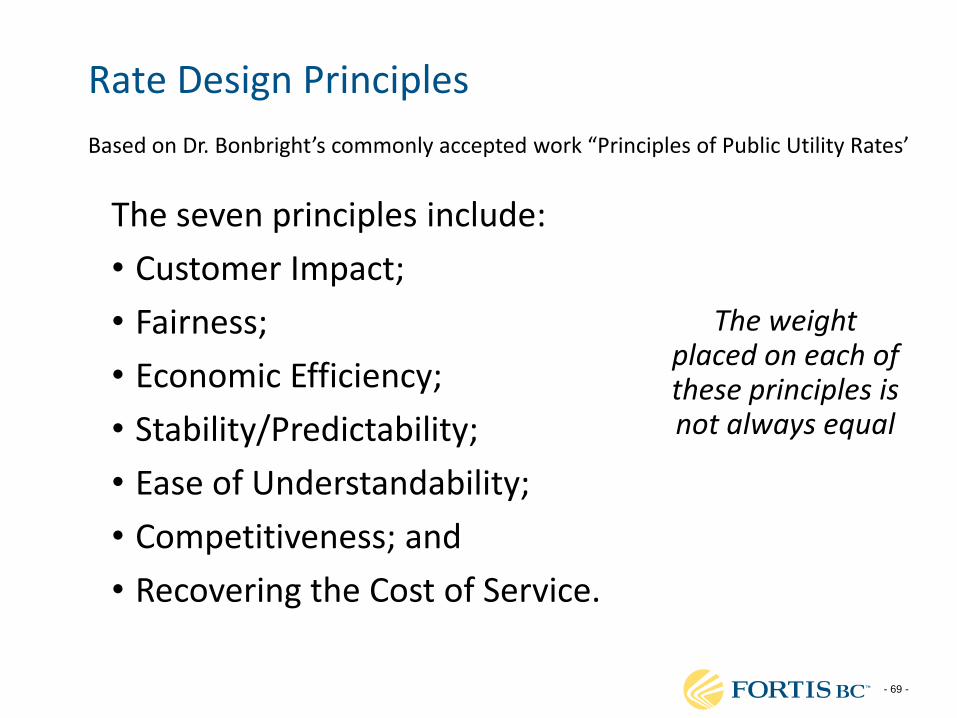
Rate Design Principles
Based on Dr. Bonbright’s commonly accepted work “Principles of Public Utility Rates’
The seven principles include:
• Customer Impact;
• Fairness;
• Economic Efficiency;
• Stability/Predictability;
• Ease of Understandability;
• Competitiveness; and
• Recovering the Cost of Service.
The weight placed on each of these principles is not always equal

- 70 -
Rate Design Steps
Customer Segmentation
Cost of Service Allocation
(Revenue Requirement Allocation)
Design of rates
In its simplest form, it is the determination of the most appropriate Rate to charge a Customer Group that
recovers the costs of serving them
- 71 -
Customer Group 4
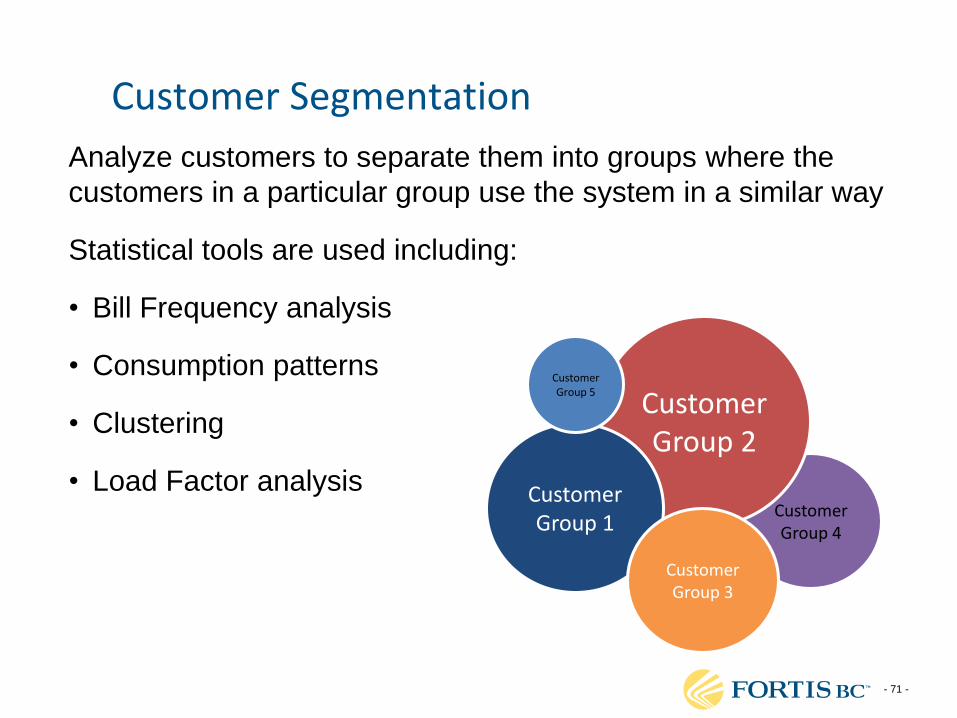
Customer Segmentation
Analyze customers to separate them into groups where the
customers in a particular group use the system in a similar way
Statistical tools are used including:
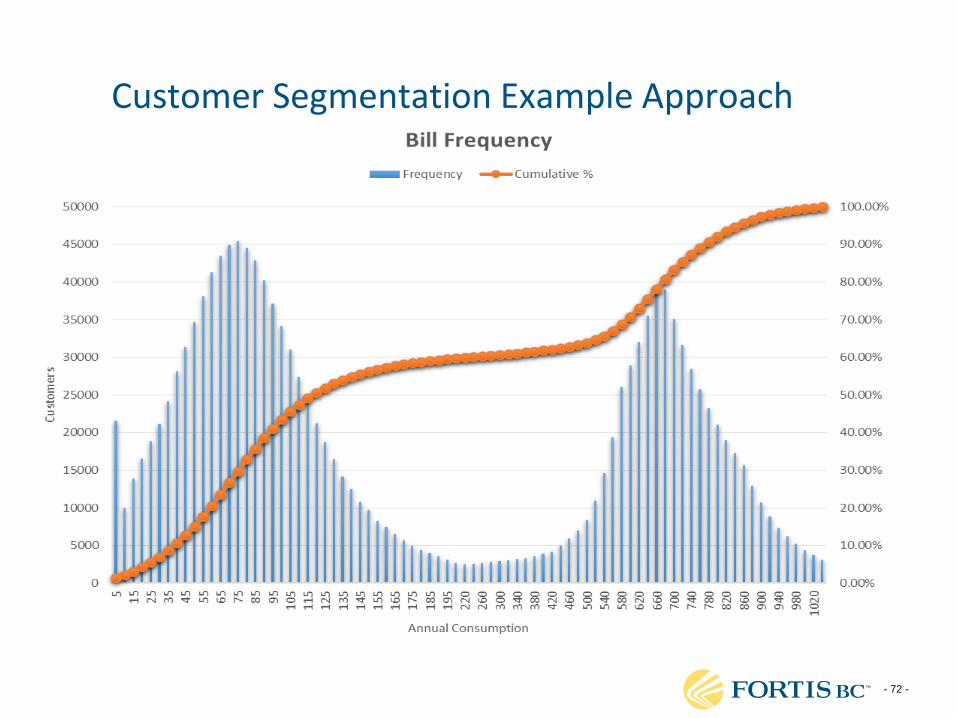
• Bill Frequency analysis
• Consumption patterns
• Clustering
• Load Factor analysis
Customer Group 2
Customer Group 1
Customer Group 3
Customer Group 5
- 72 -
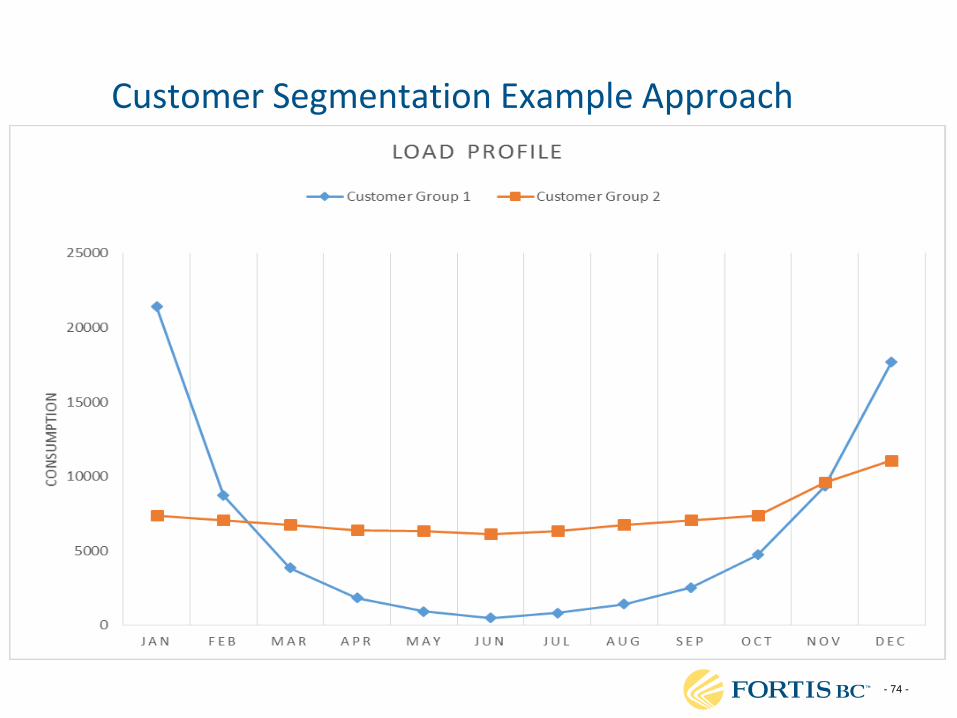
Customer Segmentation Example Approach

- 73 -
Customer Segmentation Example Approach
- 74 -
Customer Segmentation Example Approach
- 75 -
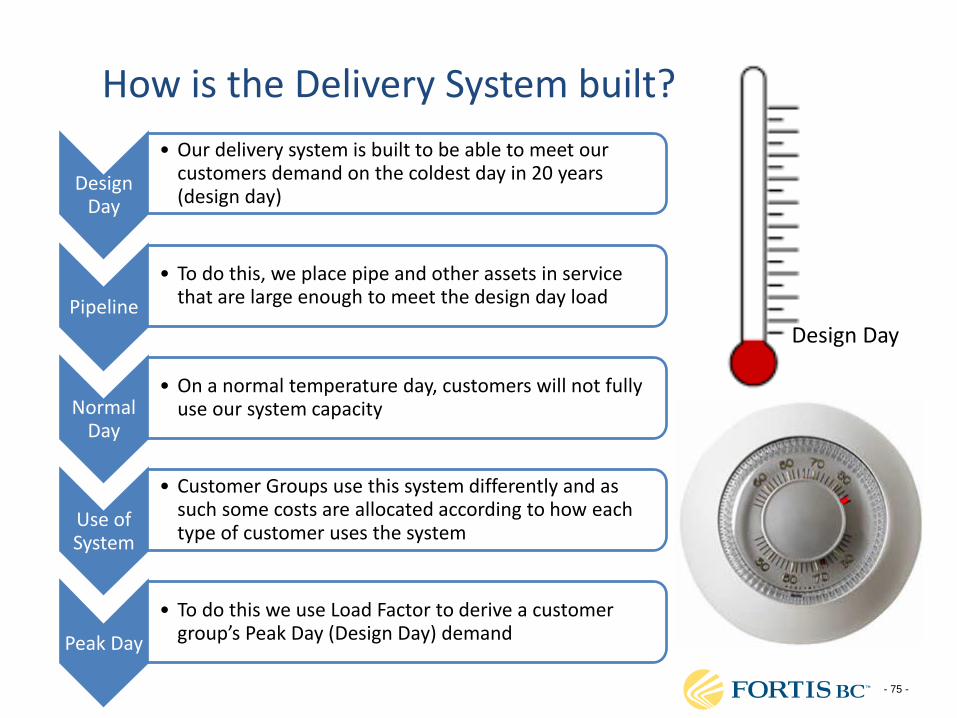
How is the Delivery System built?
Design Day
• Our delivery system is built to be able to meet our customers demand on the coldest day in 20 years (design day)
Pipeline
• To do this, we place pipe and other assets in service that are large enough to meet the design day load
Normal Day
• On a normal temperature day, customers will not fully use our system capacity
Use of System
• Customer Groups use this system differently and as such some costs are allocated according to how each type of customer uses the system
Peak Day
• To do this we use Load Factor to derive a customer group’s Peak Day (Design Day) demand
Design Day
- 76 -
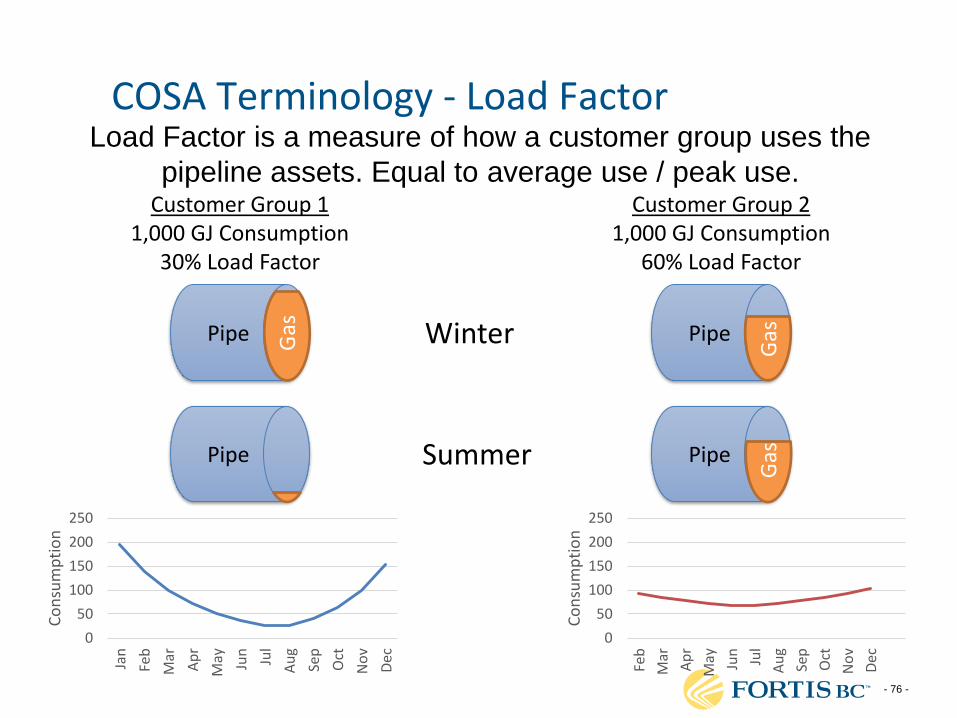
COSA Terminology - Load Factor Load Factor is a measure of how a customer group uses the
pipeline assets. Equal to average use / peak use.
Pipe Gas
Pipe Summer
0
50
100
150
200
250
Jan
Feb
Mar
Ap
r
May Jun
Jul
Au
g
Sep
Oct
No
v
Dec
Co
nsu
mp
tio
n
Winter
0
50
100
150
200
250
Feb
Mar
Ap
r
May Jun
Jul
Au
g
Sep
Oct
No
v
Dec
Co
nsu
mp
tio
n
Customer Group 1 1,000 GJ Consumption
30% Load Factor
Customer Group 2 1,000 GJ Consumption
60% Load Factor
Pipe
Gas
Pipe
Gas
- 77 -
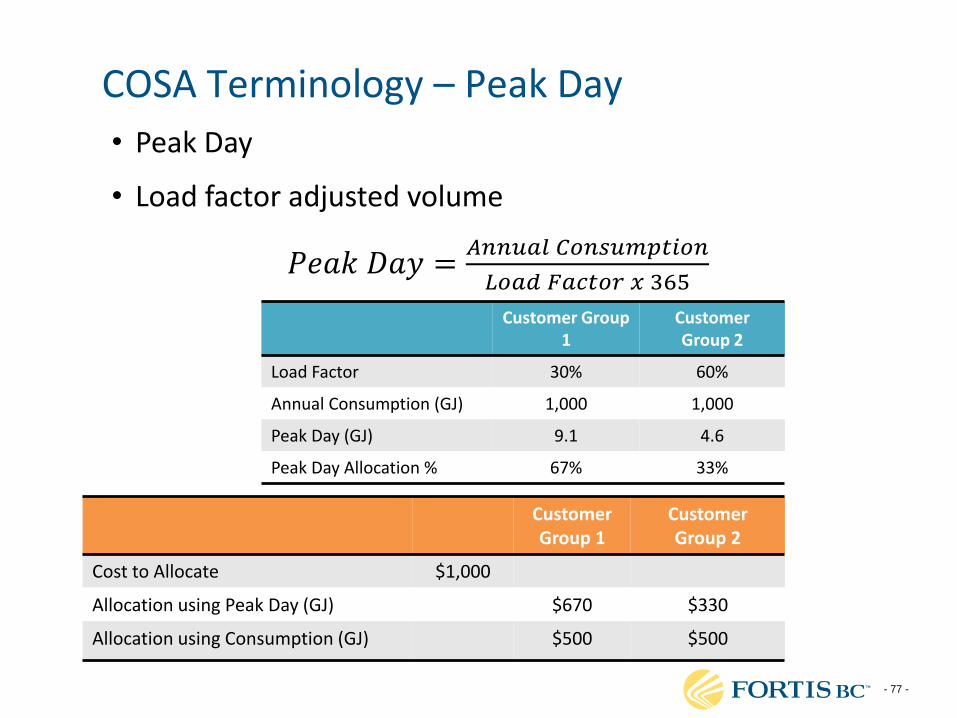
COSA Terminology – Peak Day
• Peak Day
• Load factor adjusted volume
𝑃𝑒𝑎𝑘 𝐷𝑎𝑦 =𝐴𝑛𝑛𝑢𝑎𝑙 𝐶𝑜𝑛𝑠𝑢𝑚𝑝𝑡𝑖𝑜𝑛
𝐿𝑜𝑎𝑑 𝐹𝑎𝑐𝑡𝑜𝑟 𝑥 365
Customer Group 1
Customer Group 2
Load Factor 30% 60%
Annual Consumption (GJ) 1,000 1,000
Peak Day (GJ) 9.1 4.6
Peak Day Allocation % 67% 33%
Customer Group 1
Customer Group 2
Cost to Allocate $1,000
Allocation using Peak Day (GJ) $670 $330
Allocation using Consumption (GJ) $500 $500
- 78 -
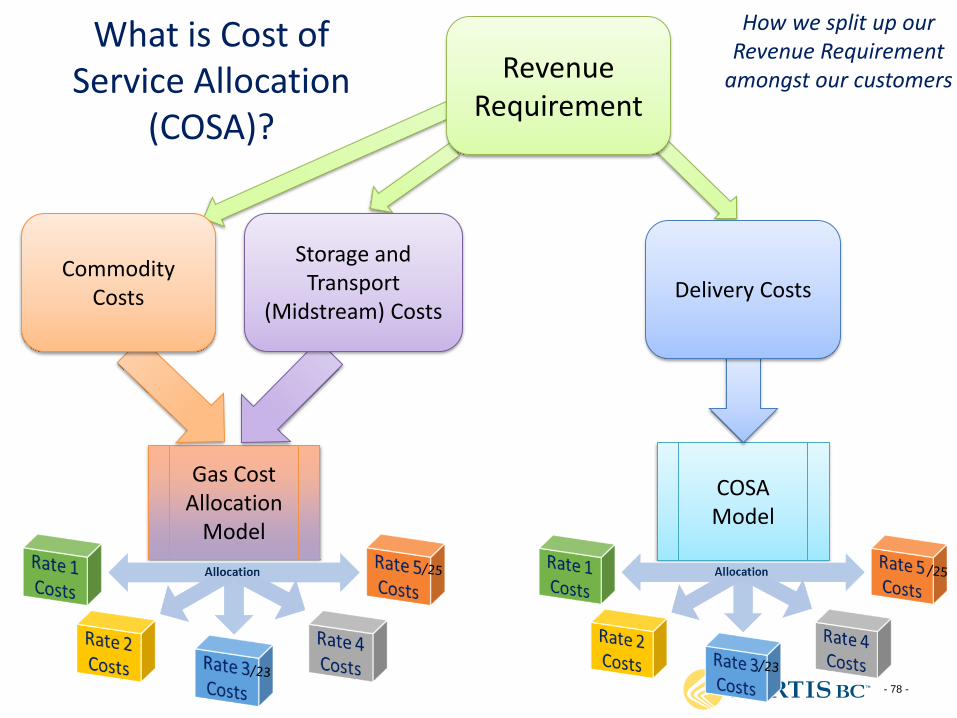
What is Cost of Service Allocation
(COSA)?
COSA Model
Gas Cost Allocation
Model
Revenue Requirement
Storage and Transport
(Midstream) Costs
Commodity Costs Delivery Costs
How we split up our Revenue Requirement
amongst our customers
- 79 -
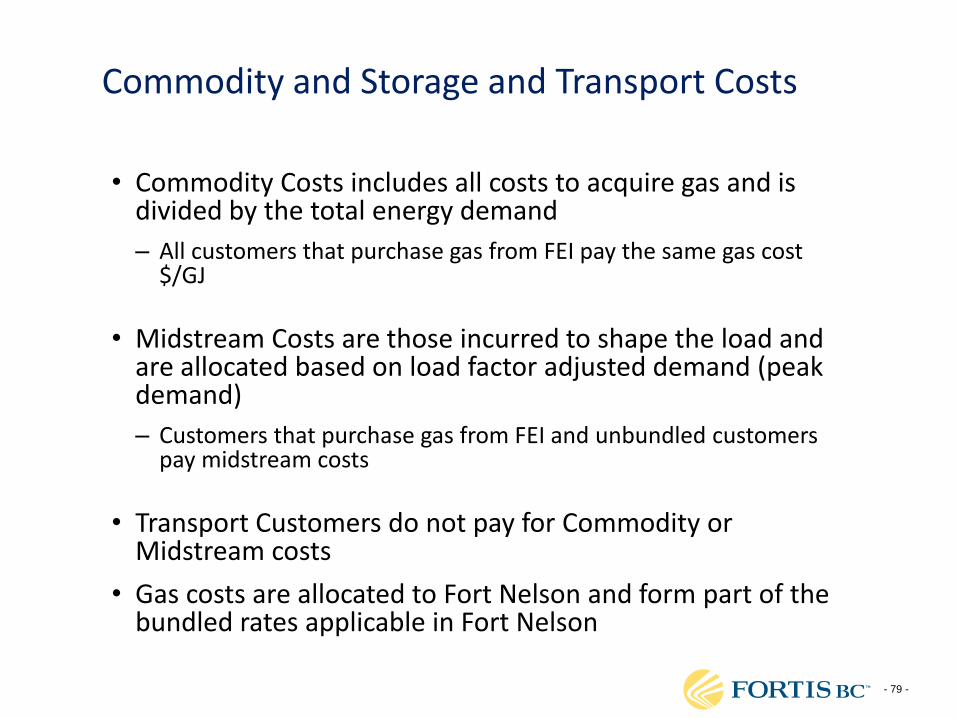
Commodity and Storage and Transport Costs
• Commodity Costs includes all costs to acquire gas and is divided by the total energy demand
– All customers that purchase gas from FEI pay the same gas cost $/GJ
• Midstream Costs are those incurred to shape the load and are allocated based on load factor adjusted demand (peak demand)
– Customers that purchase gas from FEI and unbundled customers pay midstream costs
• Transport Customers do not pay for Commodity or Midstream costs
• Gas costs are allocated to Fort Nelson and form part of the bundled rates applicable in Fort Nelson
- 80 -
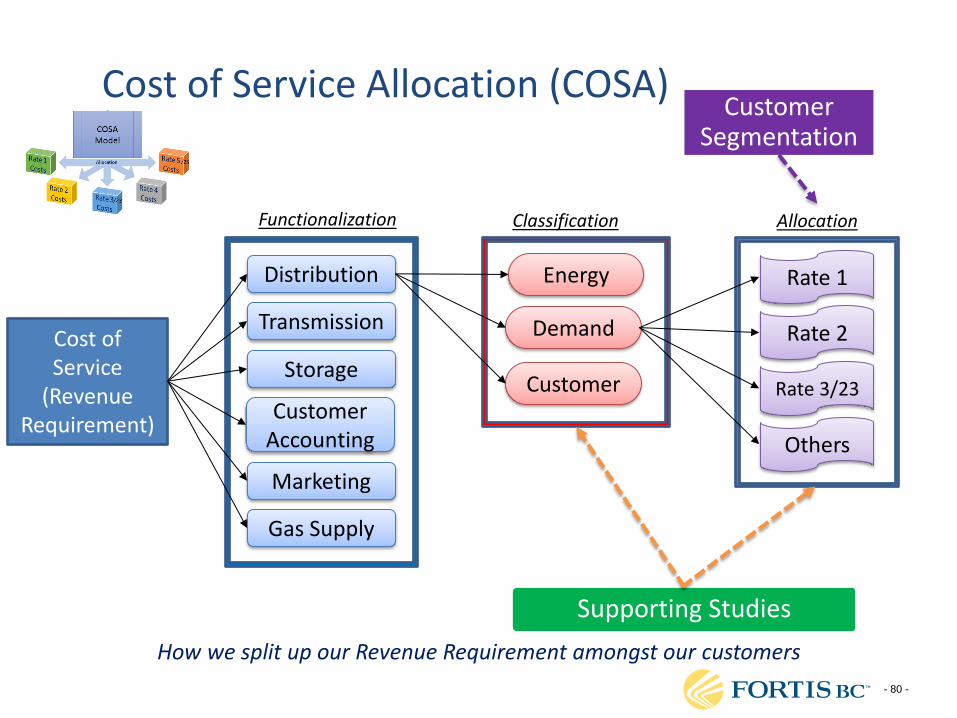
Functionalization Classification Allocation
Distribution Energy
Transmission
Storage
Customer Accounting
Marketing
Gas Supply
Demand
Customer
Rate 1
Rate 2
Rate 3/23
Others
Cost of Service
(Revenue Requirement)
Supporting Studies
Customer Segmentation
How we split up our Revenue Requirement amongst our customers
Cost of Service Allocation (COSA)
- 81 -
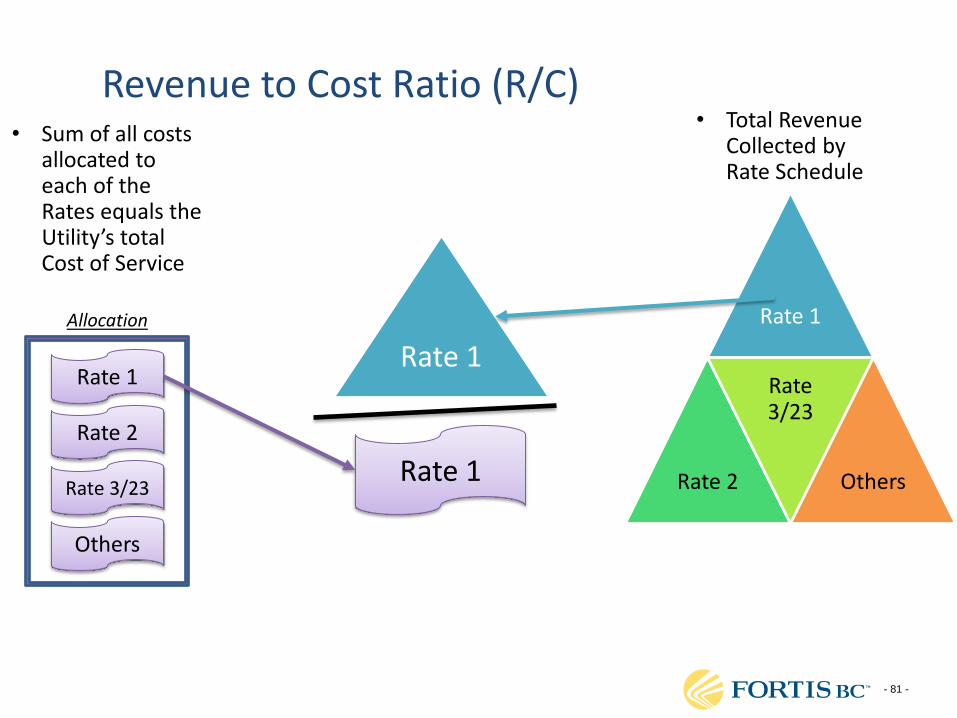
Allocation
Rate 1
Rate 2
Rate 3/23
Others
• Sum of all costs allocated to each of the Rates equals the Utility’s total Cost of Service
• Total Revenue Collected by Rate Schedule
Rate 1
Rate 2
Rate 3/23
Others
Rate 1
Rate 1
Revenue to Cost Ratio (R/C)
- 82 -
Rate 1
Rate 1
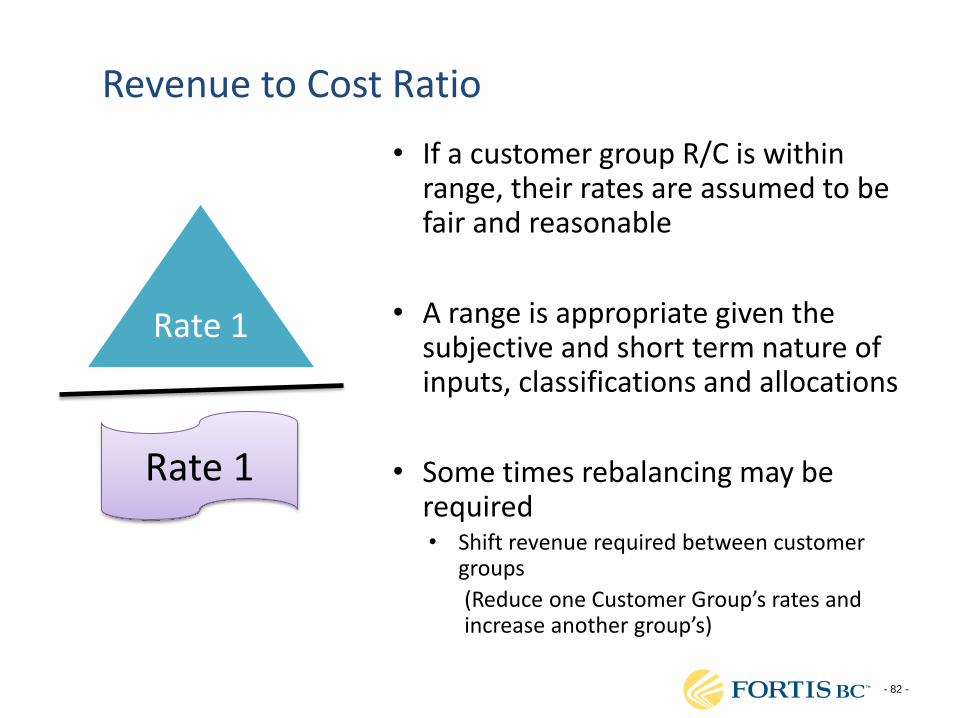
• If a customer group R/C is within range, their rates are assumed to be fair and reasonable
• A range is appropriate given the subjective and short term nature of inputs, classifications and allocations
• Some times rebalancing may be required • Shift revenue required between customer
groups
(Reduce one Customer Group’s rates and increase another group’s)
Revenue to Cost Ratio
- 83 -
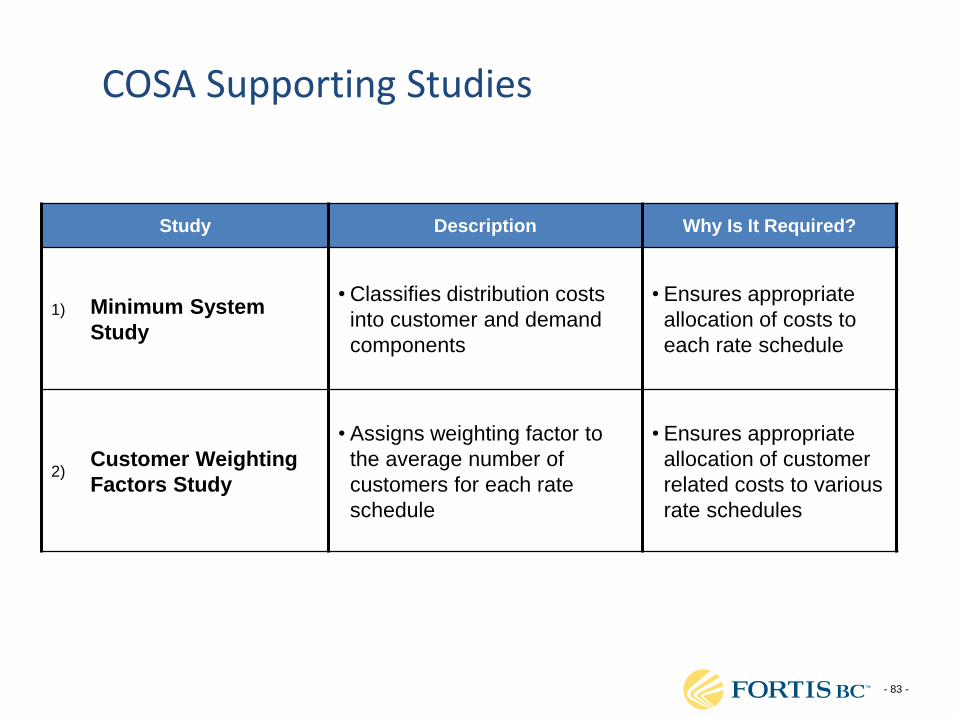
Study Description Why Is It Required?
1)
Minimum System
Study
• Classifies distribution costs
into customer and demand
components
• Ensures appropriate
allocation of costs to
each rate schedule
2) Customer Weighting
Factors Study
• Assigns weighting factor to
the average number of
customers for each rate
schedule
• Ensures appropriate
allocation of customer
related costs to various
rate schedules
COSA Supporting Studies
- 84 -
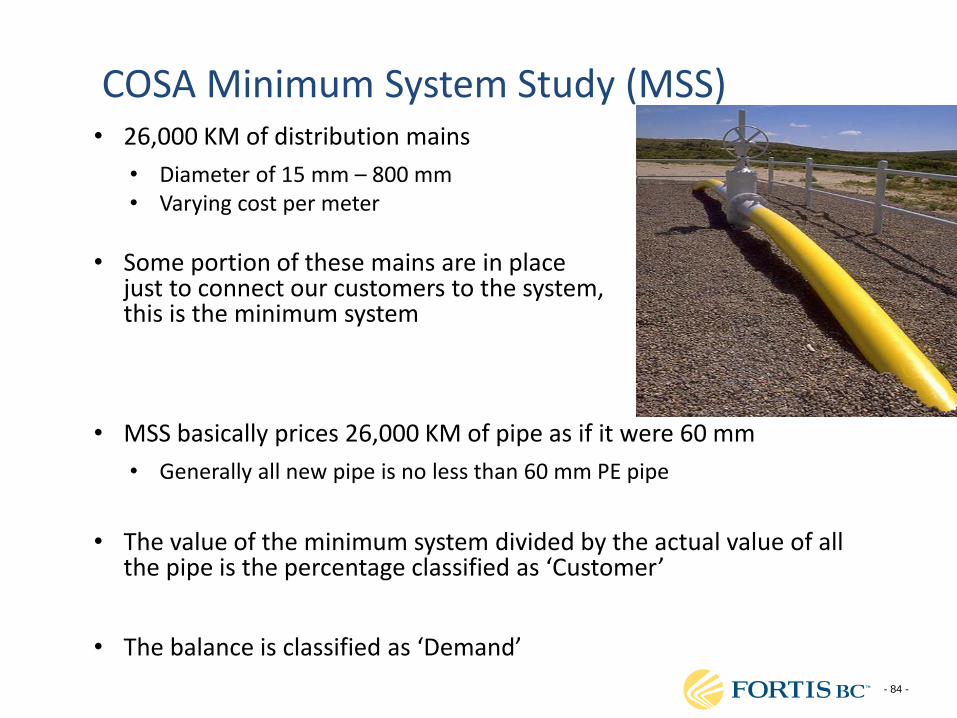
COSA Minimum System Study (MSS)
• 26,000 KM of distribution mains
• Diameter of 15 mm – 800 mm • Varying cost per meter
• Some portion of these mains are in place just to connect our customers to the system, this is the minimum system
• MSS basically prices 26,000 KM of pipe as if it were 60 mm
• Generally all new pipe is no less than 60 mm PE pipe
• The value of the minimum system divided by the actual value of all the pipe is the percentage classified as ‘Customer’
• The balance is classified as ‘Demand’

- 85 -
• Study differentiates the cost to connect small customers and large customers
• Calculated as a ratio to the cost to connect a residential customer
• Ratio used to scale upwards the average number of customers in a customer group
COSA Customer Weighting Factor

- 86 -
Assume a two cost system, with two functions and three customer groups
Distribution operations role is to connect customers and deliver gas through DP pipe. Transmission operations role is to ensure gas is brought to the distribution system through TP pipe at the right time, quantity and pressure.
Cost 1: Distribution Operating Costs $2,000 Cost 2: Transmission Operating Costs $4,000 Total $6,000
FUNCTION
Distribution Operations Transmission Operations
Distribution Operating Costs
$2,000
Transmission Operating Costs
$4,000
COSA- Example- Functionalization
- 87 -
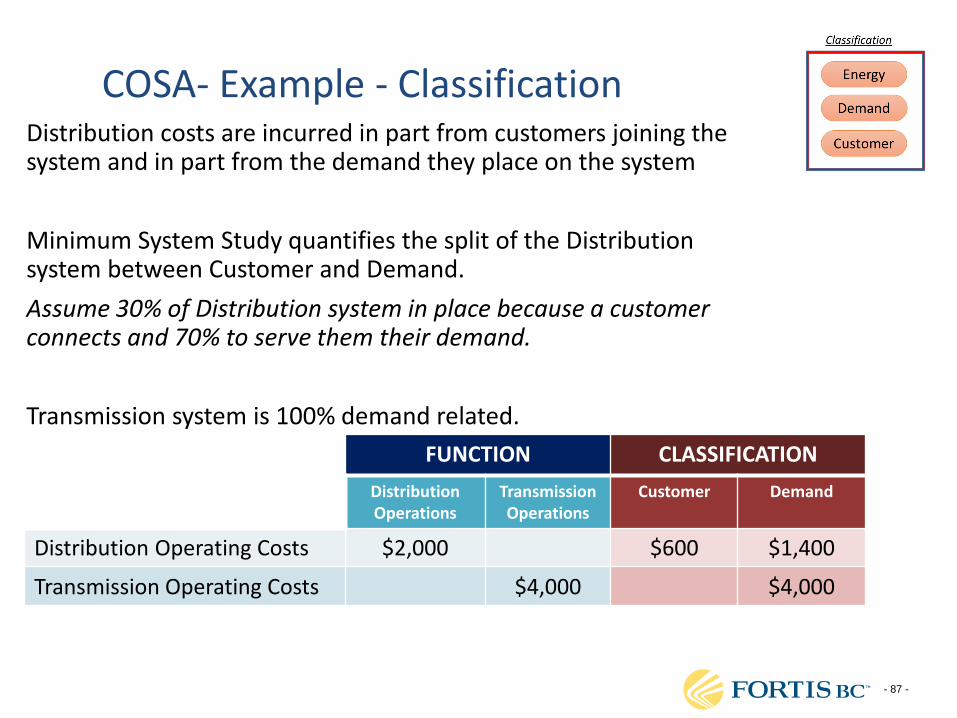
Distribution costs are incurred in part from customers joining the system and in part from the demand they place on the system
Minimum System Study quantifies the split of the Distribution system between Customer and Demand.
Assume 30% of Distribution system in place because a customer connects and 70% to serve them their demand.
Transmission system is 100% demand related.
FUNCTION CLASSIFICATION
Distribution Operations
Transmission Operations
Customer Demand
Distribution Operating Costs $2,000 $600 $1,400
Transmission Operating Costs $4,000 $4,000
COSA- Example - Classification
- 88 -
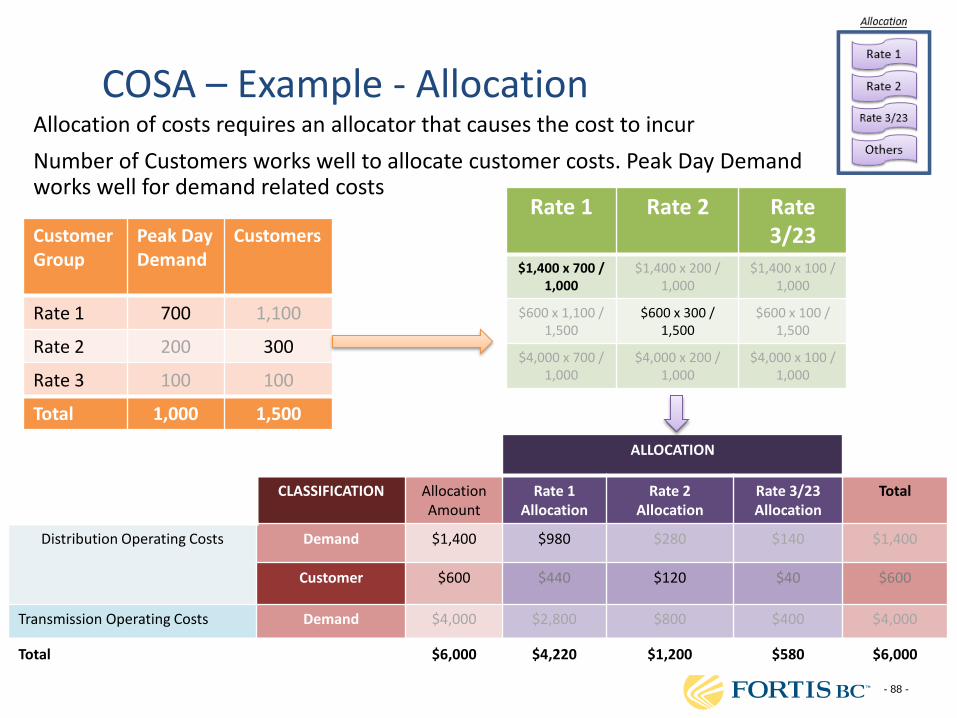
Allocation of costs requires an allocator that causes the cost to incur
Number of Customers works well to allocate customer costs. Peak Day Demand works well for demand related costs
ALLOCATION
CLASSIFICATION
Allocation Amount
Rate 1 Allocation
Rate 2 Allocation
Rate 3/23 Allocation
Total
Distribution Operating Costs Demand $1,400 $980 $280 $140 $1,400
Customer $600 $440 $120 $40 $600
Transmission Operating Costs Demand $4,000 $2,800 $800 $400 $4,000
Total $6,000 $4,220 $1,200 $580 $6,000
Customer Group
Peak Day Demand
Customers
Rate 1 700 1,100
Rate 2 200 300
Rate 3 100 100
Total 1,000 1,500
Rate 1 Rate 2 Rate 3/23
$1,400 x 700 / 1,000
$1,400 x 200 / 1,000
$1,400 x 100 / 1,000
$600 x 1,100 / 1,500
$600 x 300 / 1,500
$600 x 100 / 1,500
$4,000 x 700 / 1,000
$4,000 x 200 / 1,000
$4,000 x 100 / 1,000
COSA – Example - Allocation
- 89 -
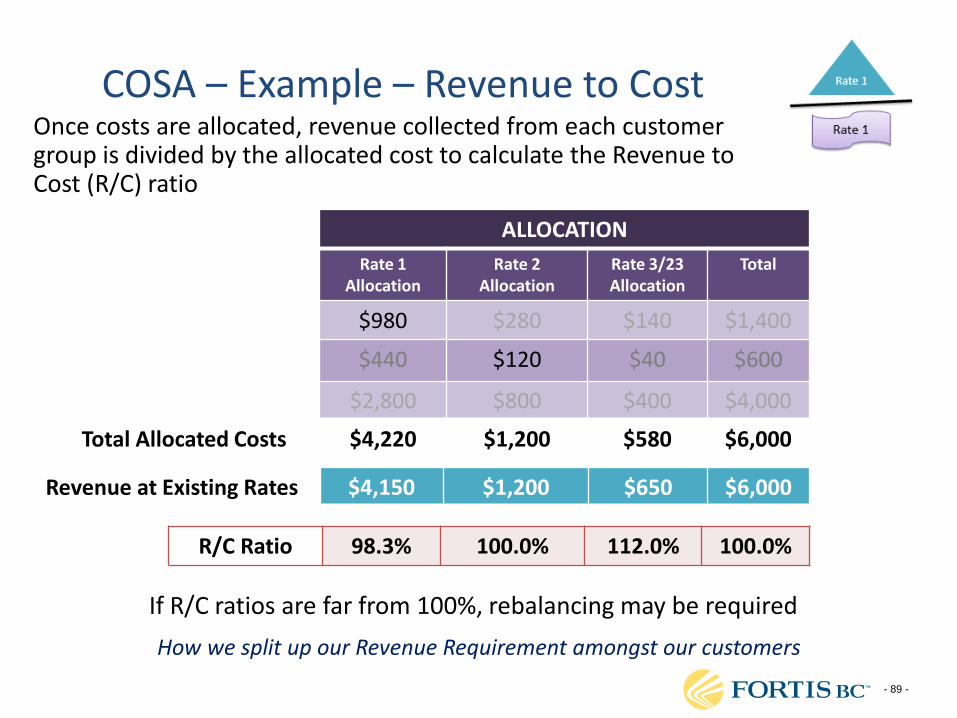
Once costs are allocated, revenue collected from each customer group is divided by the allocated cost to calculate the Revenue to Cost (R/C) ratio
ALLOCATION
Rate 1 Allocation
Rate 2 Allocation
Rate 3/23 Allocation
Total
$980 $280 $140 $1,400
$440 $120 $40 $600
$2,800 $800 $400 $4,000
Total Allocated Costs $4,220 $1,200 $580 $6,000
Revenue at Existing Rates $4,150 $1,200 $650 $6,000
R/C Ratio 98.3% 100.0% 112.0% 100.0%
If R/C ratios are far from 100%, rebalancing may be required
How we split up our Revenue Requirement amongst our customers
COSA – Example – Revenue to Cost
- 90 -
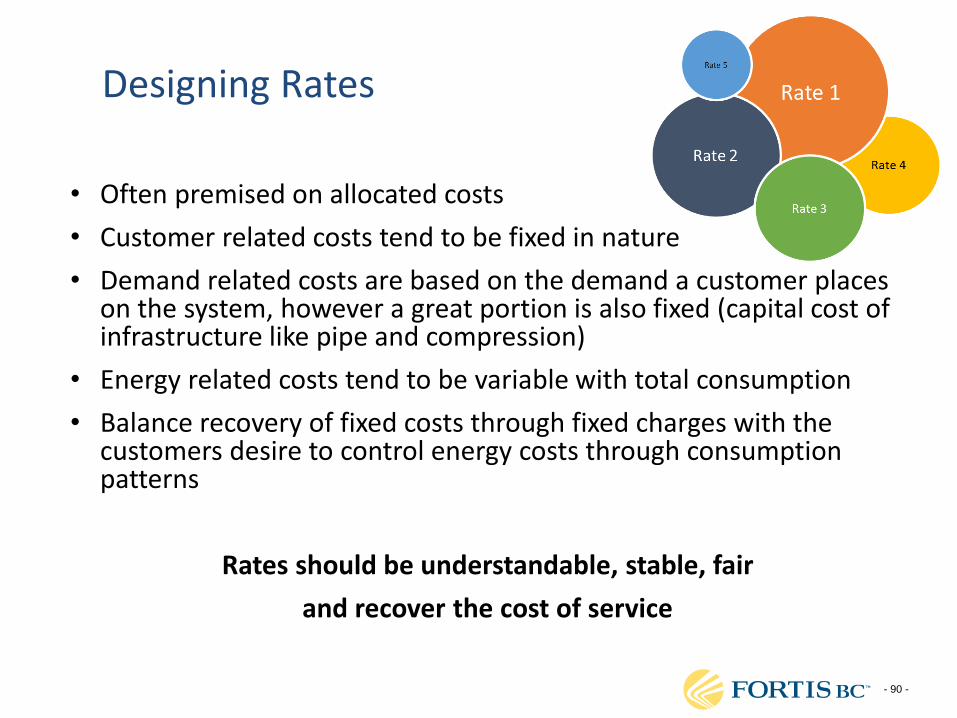
Designing Rates
• Often premised on allocated costs
• Customer related costs tend to be fixed in nature
• Demand related costs are based on the demand a customer places on the system, however a great portion is also fixed (capital cost of infrastructure like pipe and compression)
• Energy related costs tend to be variable with total consumption
• Balance recovery of fixed costs through fixed charges with the customers desire to control energy costs through consumption patterns
Rates should be understandable, stable, fair
and recover the cost of service
- 91 -
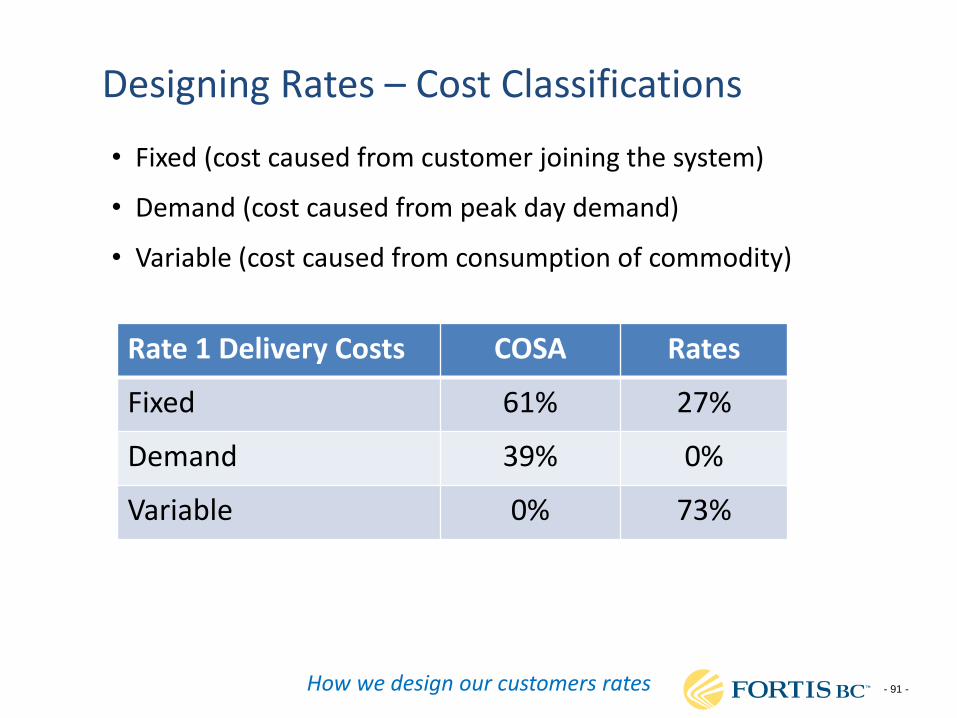
Designing Rates – Cost Classifications
• Fixed (cost caused from customer joining the system)
• Demand (cost caused from peak day demand)
• Variable (cost caused from consumption of commodity)
Rate 1 Delivery Costs COSA Rates
Fixed 61% 27%
Demand 39% 0%
Variable 0% 73%
How we design our customers rates
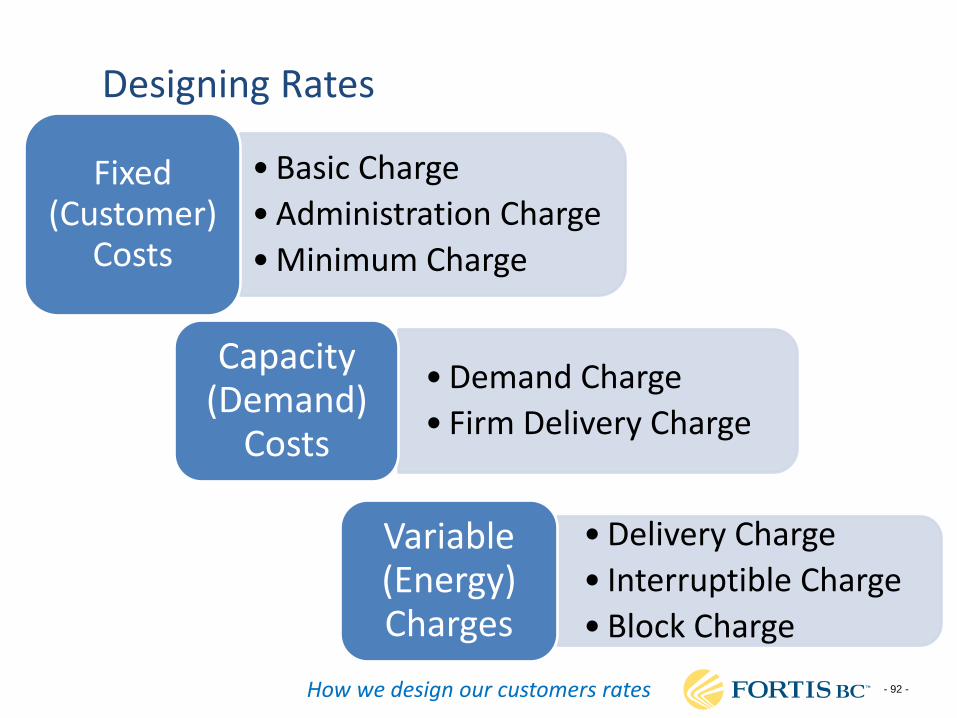
- 92 -
• Basic Charge
• Administration Charge
• Minimum Charge
Fixed (Customer)
Costs
• Demand Charge
• Firm Delivery Charge
Capacity (Demand)
Costs
• Delivery Charge
• Interruptible Charge
• Block Charge
Variable (Energy) Charges
Designing Rates
How we design our customers rates
- 93 -
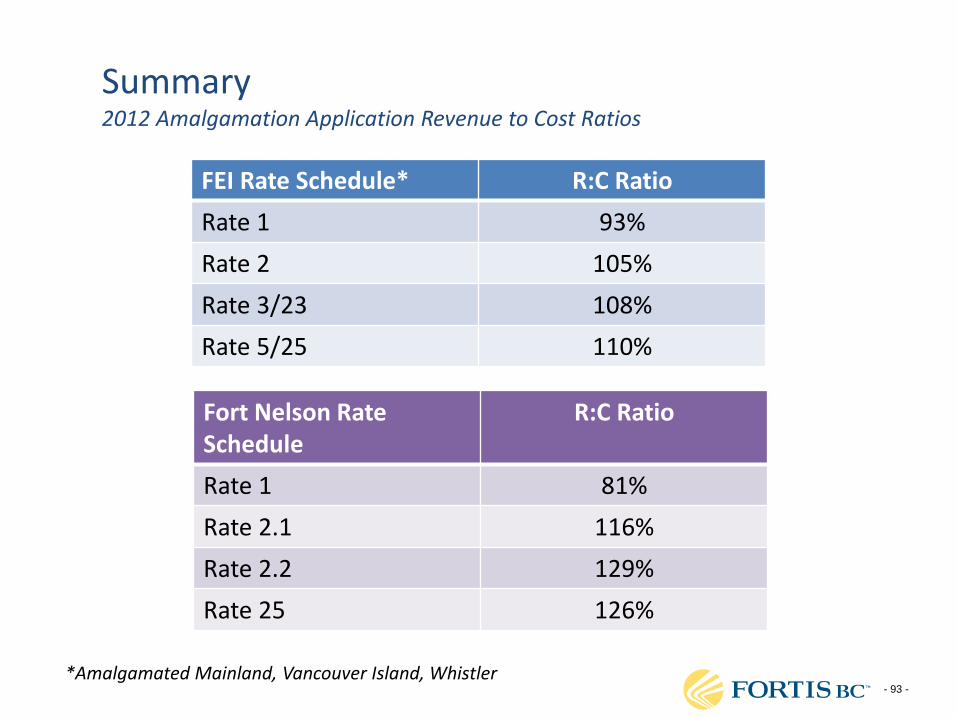
Summary 2012 Amalgamation Application Revenue to Cost Ratios
FEI Rate Schedule* R:C Ratio
Rate 1 93%
Rate 2 105%
Rate 3/23 108%
Rate 5/25 110%
Fort Nelson Rate Schedule
R:C Ratio
Rate 1 81%
Rate 2.1 116%
Rate 2.2 129%
Rate 25 126%
*Amalgamated Mainland, Vancouver Island, Whistler
- 94 -
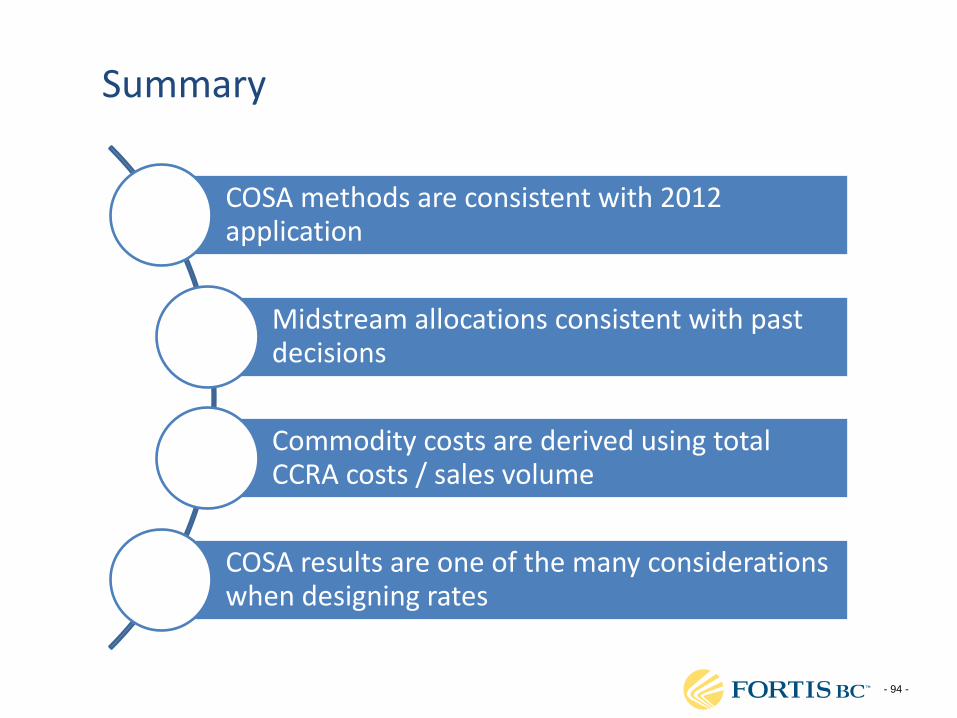
Summary
COSA methods are consistent with 2012 application
Midstream allocations consistent with past decisions
Commodity costs are derived using total CCRA costs / sales volume
COSA results are one of the many considerations when designing rates
- 95 -
TARIFF RATE SCHEDULES AND SERVICES OVERVIEW
- 96 -
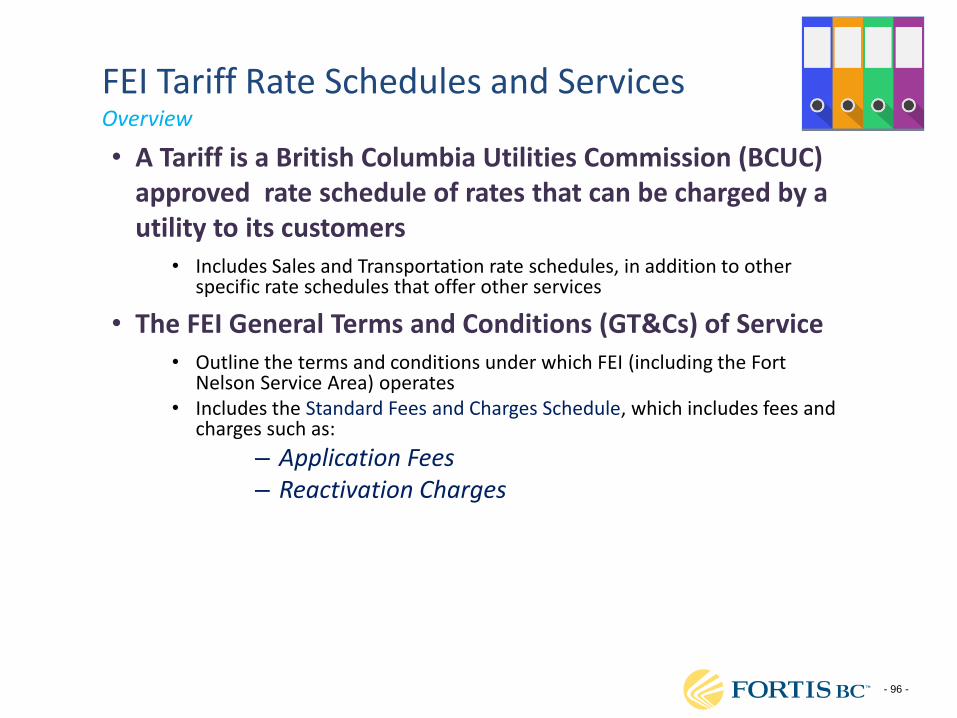
FEI Tariff Rate Schedules and Services Overview
• A Tariff is a British Columbia Utilities Commission (BCUC) approved rate schedule of rates that can be charged by a utility to its customers
• Includes Sales and Transportation rate schedules, in addition to other specific rate schedules that offer other services
• The FEI General Terms and Conditions (GT&Cs) of Service • Outline the terms and conditions under which FEI (including the Fort
Nelson Service Area) operates • Includes the Standard Fees and Charges Schedule, which includes fees and
charges such as:
– Application Fees – Reactivation Charges
- 97 -
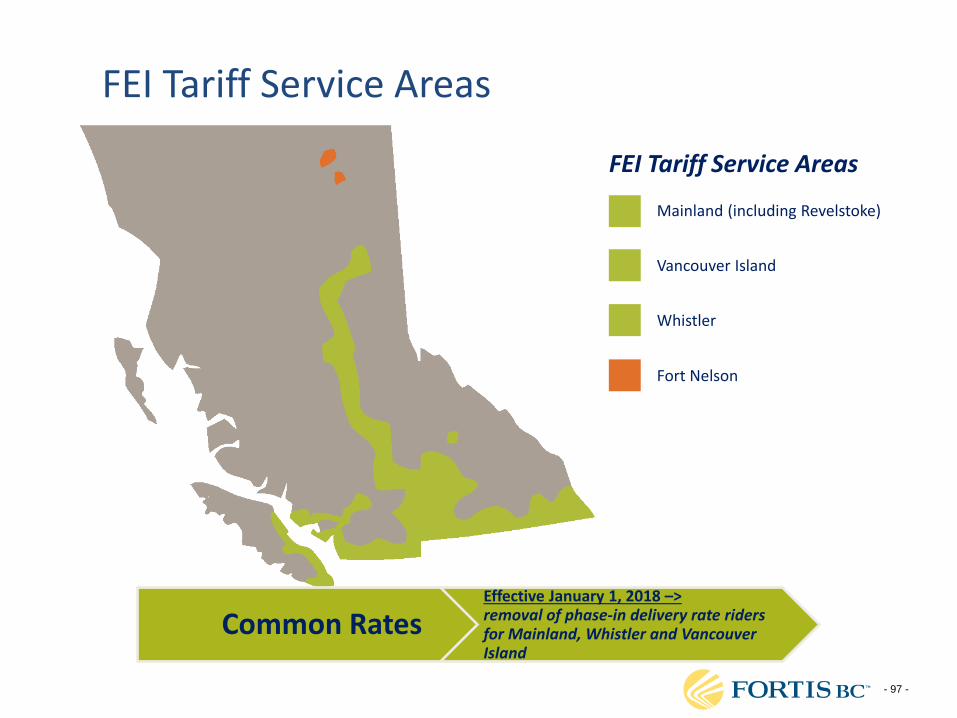
FEI Tariff Service Areas
FEI Tariff Service Areas
Mainland (including Revelstoke)
Fort Nelson
Whistler
Vancouver Island
Common Rates Effective January 1, 2018 –> removal of phase-in delivery rate riders for Mainland, Whistler and Vancouver Island

- 98 -
FEI Sales and Transportation Services FEI Tariff Rate Schedules 1 to 27
Customer Groups
Residential
Small Commercial (<2,000 GJ/Yr)
Large Commercial (>2,000 GJ/Yr)
Seasonal
General Firm
Natural Gas Vehicle
General Interruptible
Large Industrial
Bundled Service
Rate Schedules 1/1B*
Rate Schedules 2/2B*
Rate Schedules 3/3B*
Rate Schedule 4
Rate Schedules 5/5B*
Rate Schedules 6/6P
Rate Schedule 7
Not Applicable
Unbundled Service*
Rate Schedule 1U
Rate Schedule 2U
Rate Schedule 3U
Not Applicable
Not Applicable
Not Applicable
Not Applicable
Not Applicable
Transportation
Service
Not Applicable
Not Applicable
Rate Schedule 23
Not Applicable
Rate Schedule 25
Rate Schedule 26
Rate Schedule 27
Rate Schedules 22/22A/22B
*The Renewable Natural Gas (Biomethane Service) and Customer Choice (Unbundling Service) Programs are voluntary
- 99 -
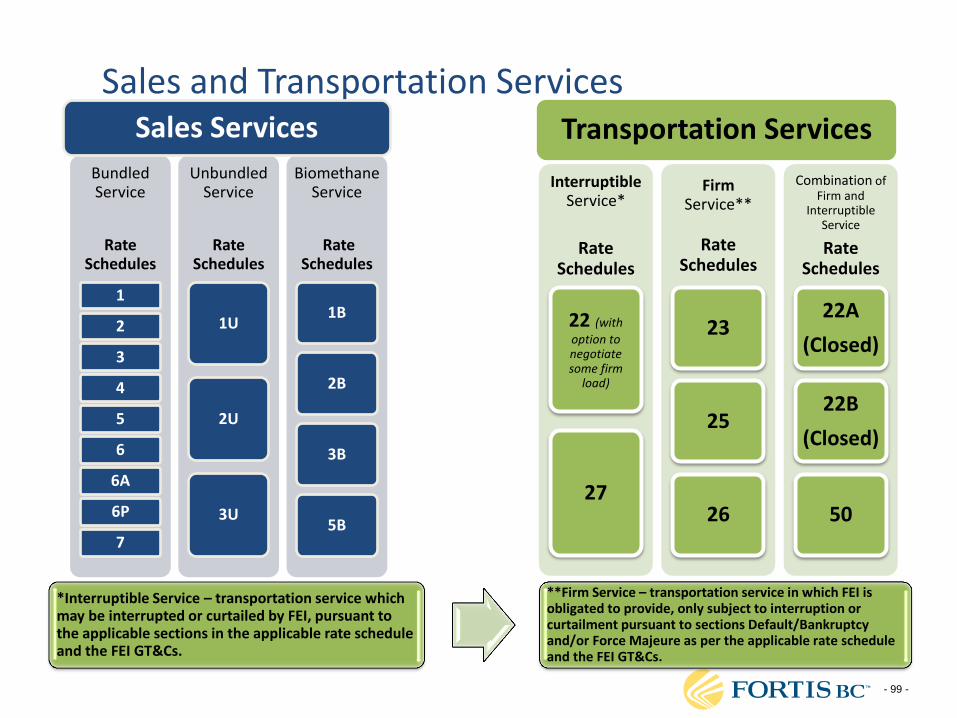
Sales and Transportation Services
Bundled Service
Rate Schedules
1
2
3
4
5
6
6A
6P
7
Unbundled Service
Rate Schedules
1U
2U
3U
Biomethane Service
Rate Schedules
1B
2B
3B
5B
Sales Services
Interruptible Service*
Rate
Schedules
22 (with
option to negotiate some firm
load)
27
Firm Service**
Rate Schedules
23
25
26
Combination of Firm and
Interruptible Service
Rate Schedules
22A
(Closed)
22B
(Closed)
50
Transportation Services
*Interruptible Service – transportation service which may be interrupted or curtailed by FEI, pursuant to the applicable sections in the applicable rate schedule and the FEI GT&Cs.
**Firm Service – transportation service in which FEI is obligated to provide, only subject to interruption or curtailment pursuant to sections Default/Bankruptcy and/or Force Majeure as per the applicable rate schedule and the FEI GT&Cs.
- 100 -
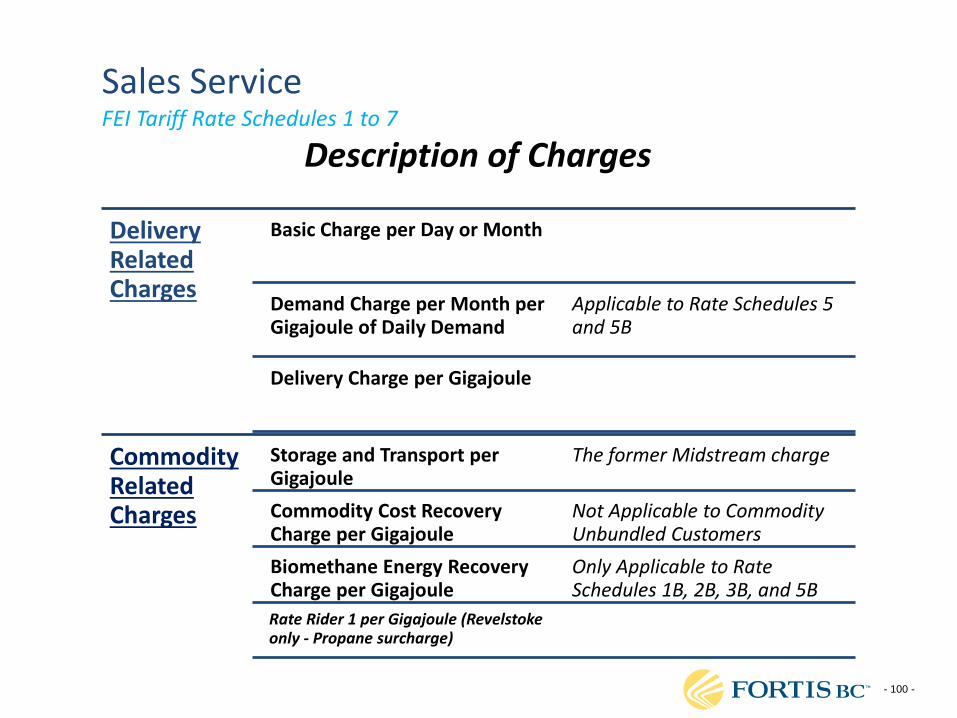
Sales Service FEI Tariff Rate Schedules 1 to 7
Delivery Related Charges
Basic Charge per Day or Month
Demand Charge per Month per Gigajoule of Daily Demand
Applicable to Rate Schedules 5 and 5B
Delivery Charge per Gigajoule
Commodity Related Charges
Storage and Transport per Gigajoule
The former Midstream charge
Commodity Cost Recovery Charge per Gigajoule
Not Applicable to Commodity Unbundled Customers
Biomethane Energy Recovery Charge per Gigajoule
Only Applicable to Rate Schedules 1B, 2B, 3B, and 5B
Rate Rider 1 per Gigajoule (Revelstoke only - Propane surcharge)
Description of Charges
- 101 -
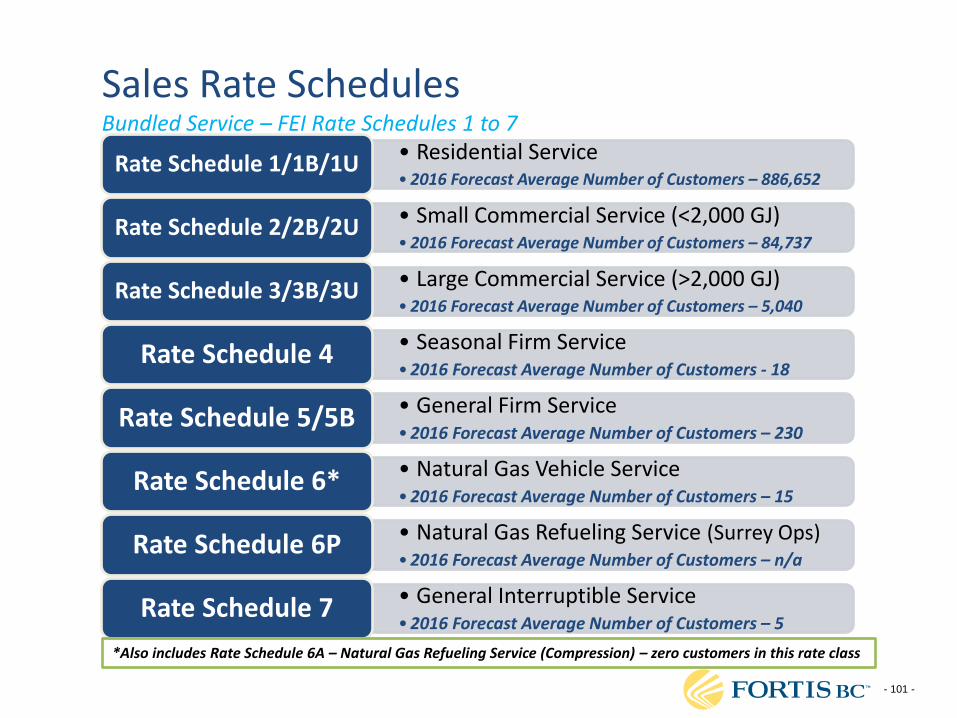
Sales Rate Schedules Bundled Service – FEI Rate Schedules 1 to 7
• Residential Service • 2016 Forecast Average Number of Customers – 886,652
Rate Schedule 1/1B/1U
• Small Commercial Service (<2,000 GJ) • 2016 Forecast Average Number of Customers – 84,737
Rate Schedule 2/2B/2U
• Large Commercial Service (>2,000 GJ) • 2016 Forecast Average Number of Customers – 5,040
Rate Schedule 3/3B/3U
• Seasonal Firm Service • 2016 Forecast Average Number of Customers - 18
Rate Schedule 4
• General Firm Service • 2016 Forecast Average Number of Customers – 230
Rate Schedule 5/5B
• Natural Gas Vehicle Service • 2016 Forecast Average Number of Customers – 15
Rate Schedule 6*
• Natural Gas Refueling Service (Surrey Ops) • 2016 Forecast Average Number of Customers – n/a
Rate Schedule 6P
• General Interruptible Service • 2016 Forecast Average Number of Customers – 5
Rate Schedule 7
*Also includes Rate Schedule 6A – Natural Gas Refueling Service (Compression) – zero customers in this rate class
- 102 -
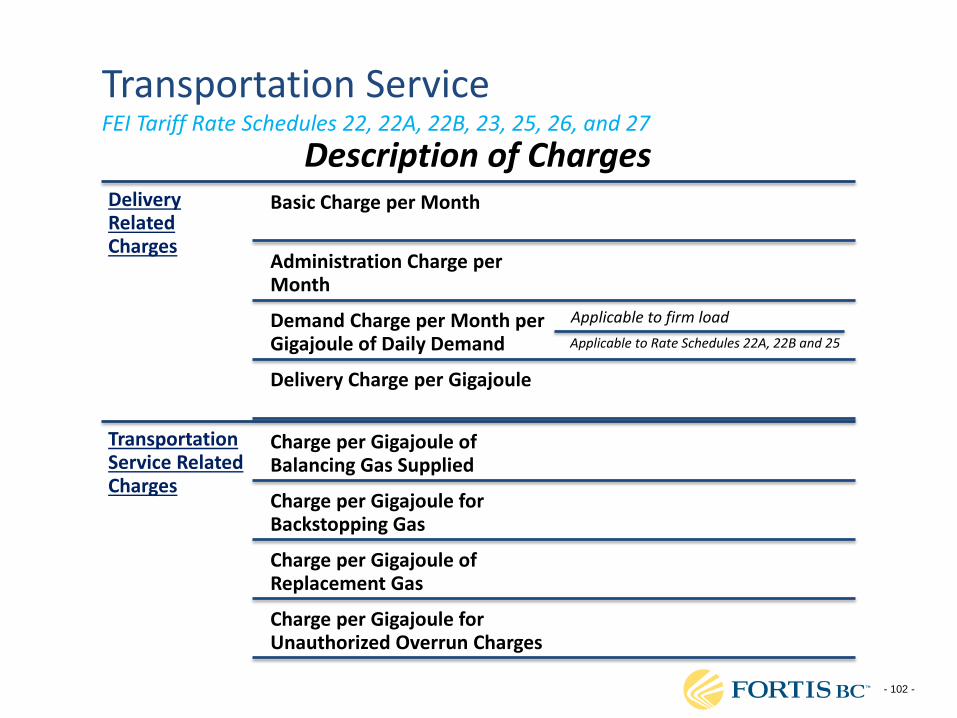
Transportation Service FEI Tariff Rate Schedules 22, 22A, 22B, 23, 25, 26, and 27
Delivery Related Charges
Basic Charge per Month
Administration Charge per Month
Demand Charge per Month per Gigajoule of Daily Demand
Applicable to firm load
Applicable to Rate Schedules 22A, 22B and 25
Delivery Charge per Gigajoule
Transportation Service Related Charges
Charge per Gigajoule of Balancing Gas Supplied
Charge per Gigajoule for Backstopping Gas
Charge per Gigajoule of Replacement Gas
Charge per Gigajoule for Unauthorized Overrun Charges
Description of Charges
- 103 -
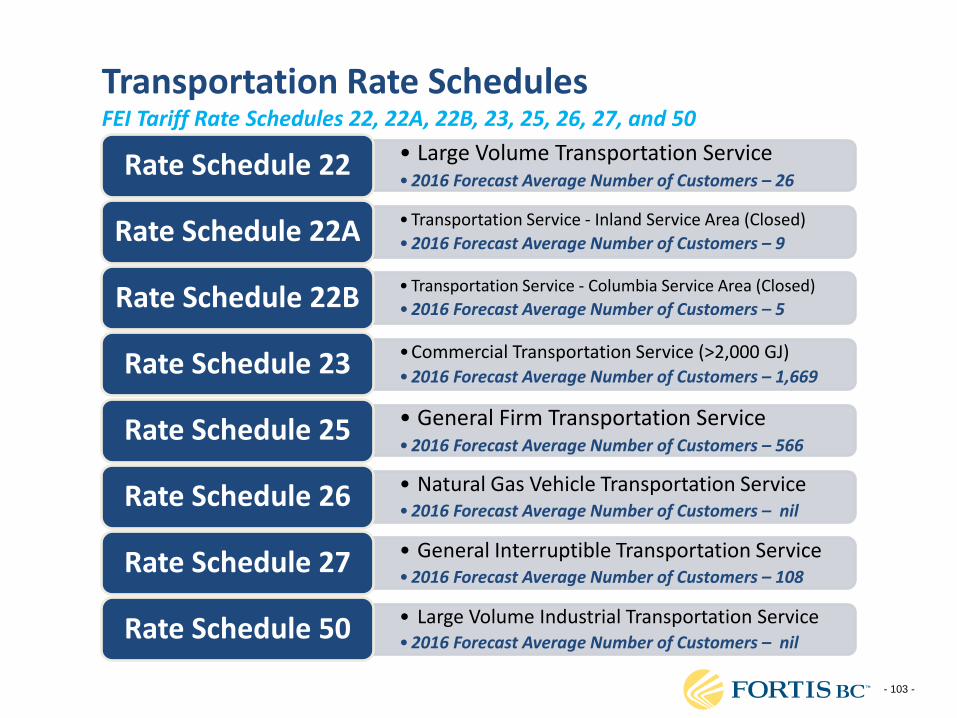
Transportation Rate Schedules FEI Tariff Rate Schedules 22, 22A, 22B, 23, 25, 26, 27, and 50
• Large Volume Transportation Service • 2016 Forecast Average Number of Customers – 26
Rate Schedule 22
• Transportation Service - Inland Service Area (Closed)
• 2016 Forecast Average Number of Customers – 9 Rate Schedule 22A
• Transportation Service - Columbia Service Area (Closed)
• 2016 Forecast Average Number of Customers – 5 Rate Schedule 22B
•Commercial Transportation Service (>2,000 GJ) • 2016 Forecast Average Number of Customers – 1,669 Rate Schedule 23
• General Firm Transportation Service • 2016 Forecast Average Number of Customers – 566
Rate Schedule 25
• Natural Gas Vehicle Transportation Service • 2016 Forecast Average Number of Customers – nil
Rate Schedule 26
• General Interruptible Transportation Service • 2016 Forecast Average Number of Customers – 108
Rate Schedule 27
• Large Volume Industrial Transportation Service • 2016 Forecast Average Number of Customers – nil
Rate Schedule 50
- 104 -
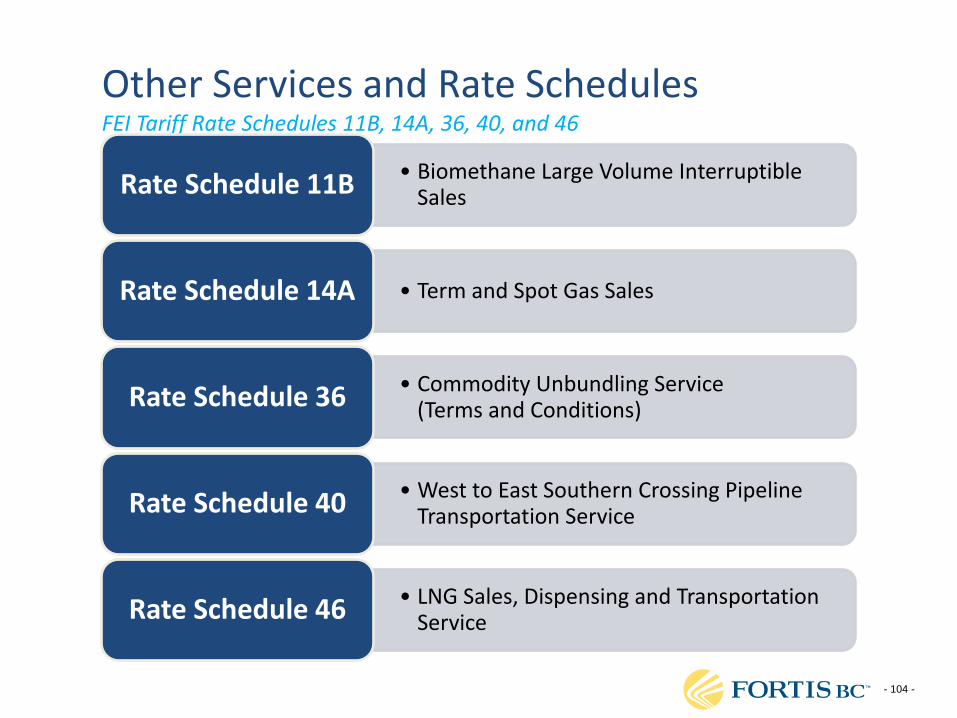
Other Services and Rate Schedules FEI Tariff Rate Schedules 11B, 14A, 36, 40, and 46
• Biomethane Large Volume Interruptible Sales Rate Schedule 11B
• Term and Spot Gas Sales Rate Schedule 14A
• Commodity Unbundling Service (Terms and Conditions) Rate Schedule 36
• West to East Southern Crossing Pipeline Transportation Service Rate Schedule 40
• LNG Sales, Dispensing and Transportation Service Rate Schedule 46
- 105 -
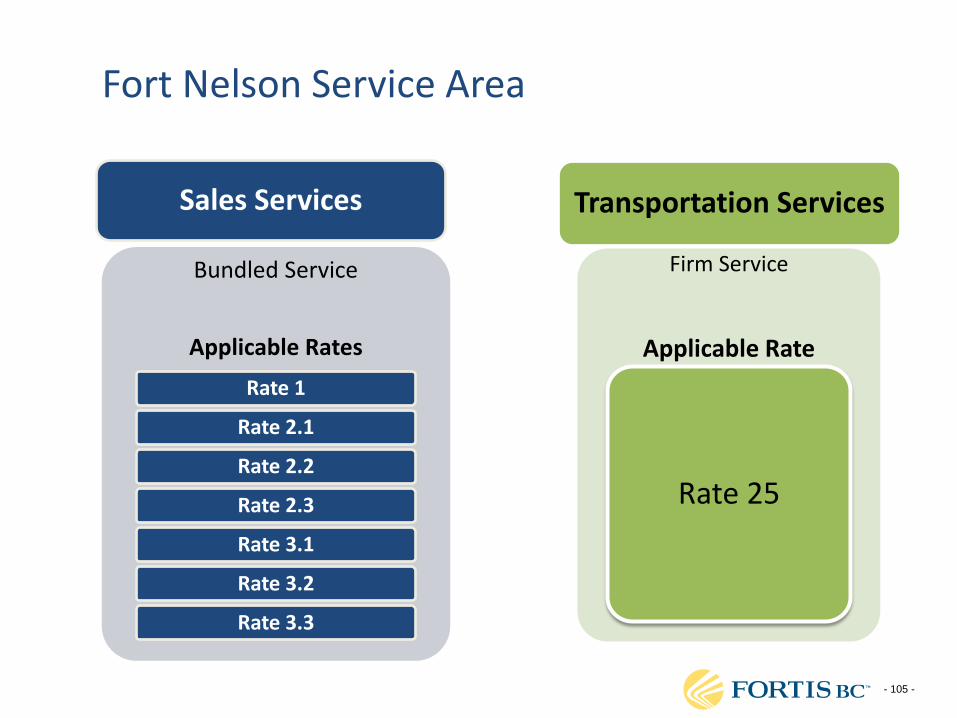
Fort Nelson Service Area
Bundled Service
Applicable Rates
Rate 1
Rate 2.1
Rate 2.2
Rate 2.3
Rate 3.1
Rate 3.2
Rate 3.3
Sales Services
Firm Service
Applicable Rate
Rate 25
Transportation Services
- 106 -
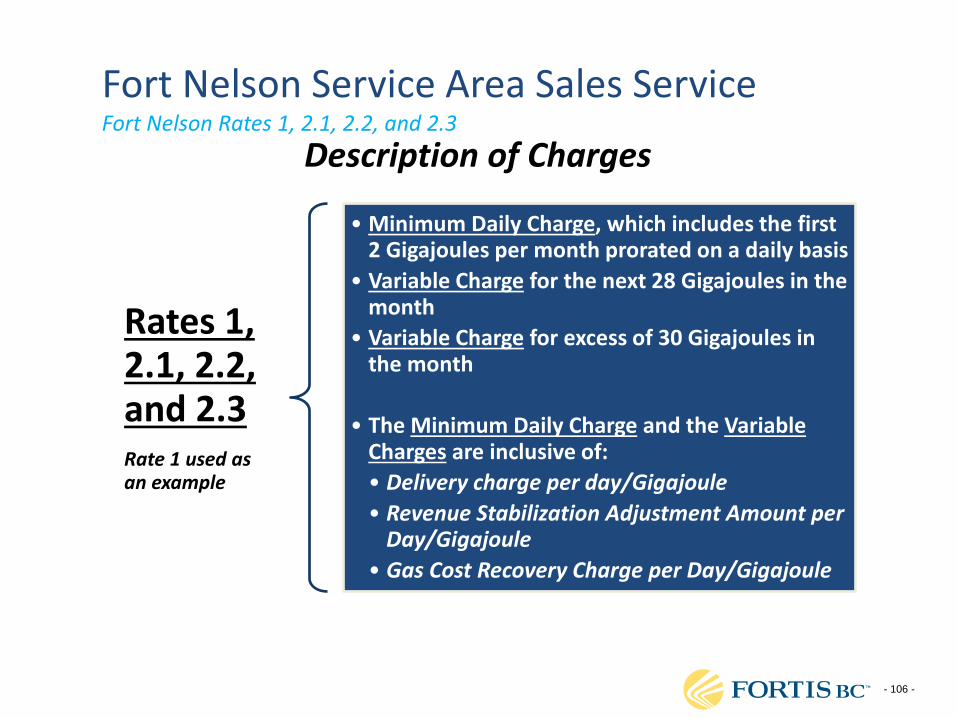
Fort Nelson Service Area Sales Service Fort Nelson Rates 1, 2.1, 2.2, and 2.3
Rates 1, 2.1, 2.2, and 2.3 Rate 1 used as an example
• Minimum Daily Charge, which includes the first 2 Gigajoules per month prorated on a daily basis
• Variable Charge for the next 28 Gigajoules in the month
• Variable Charge for excess of 30 Gigajoules in the month
• The Minimum Daily Charge and the Variable Charges are inclusive of:
• Delivery charge per day/Gigajoule
• Revenue Stabilization Adjustment Amount per Day/Gigajoule
• Gas Cost Recovery Charge per Day/Gigajoule
Description of Charges
- 107 -
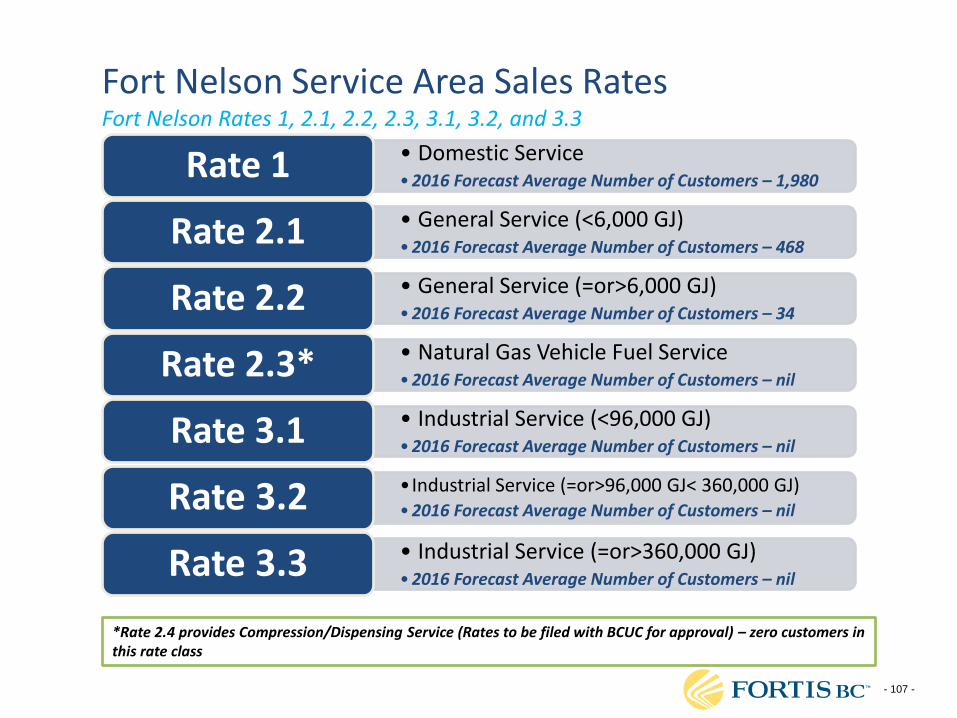
Fort Nelson Service Area Sales Rates Fort Nelson Rates 1, 2.1, 2.2, 2.3, 3.1, 3.2, and 3.3
• Domestic Service • 2016 Forecast Average Number of Customers – 1,980 Rate 1 • General Service (<6,000 GJ) • 2016 Forecast Average Number of Customers – 468 Rate 2.1 • General Service (=or>6,000 GJ) • 2016 Forecast Average Number of Customers – 34 Rate 2.2 • Natural Gas Vehicle Fuel Service • 2016 Forecast Average Number of Customers – nil Rate 2.3* • Industrial Service (<96,000 GJ) • 2016 Forecast Average Number of Customers – nil Rate 3.1 • Industrial Service (=or>96,000 GJ< 360,000 GJ) • 2016 Forecast Average Number of Customers – nil Rate 3.2 • Industrial Service (=or>360,000 GJ) • 2016 Forecast Average Number of Customers – nil Rate 3.3
*Rate 2.4 provides Compression/Dispensing Service (Rates to be filed with BCUC for approval) – zero customers in this rate class
- 108 -
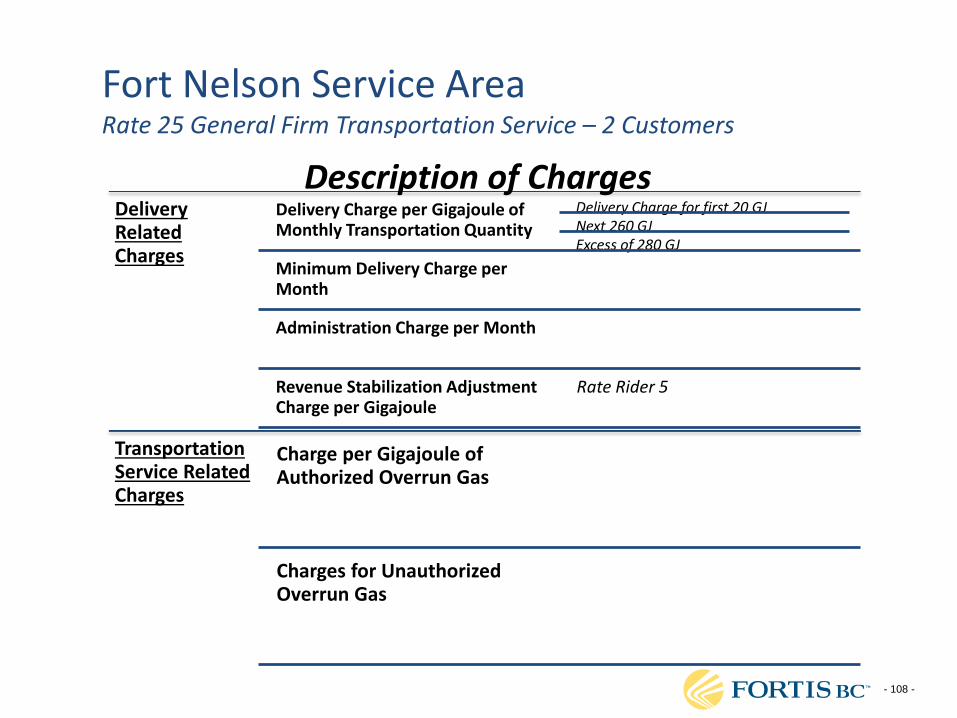
Fort Nelson Service Area Rate 25 General Firm Transportation Service – 2 Customers
Delivery Related Charges
Delivery Charge per Gigajoule of Monthly Transportation Quantity
Delivery Charge for first 20 GJ Next 260 GJ Excess of 280 GJ
Minimum Delivery Charge per Month
Administration Charge per Month
Revenue Stabilization Adjustment Charge per Gigajoule
Rate Rider 5
Transportation Service Related Charges
Charge per Gigajoule of Authorized Overrun Gas
Charges for Unauthorized Overrun Gas
Description of Charges
- 109 -
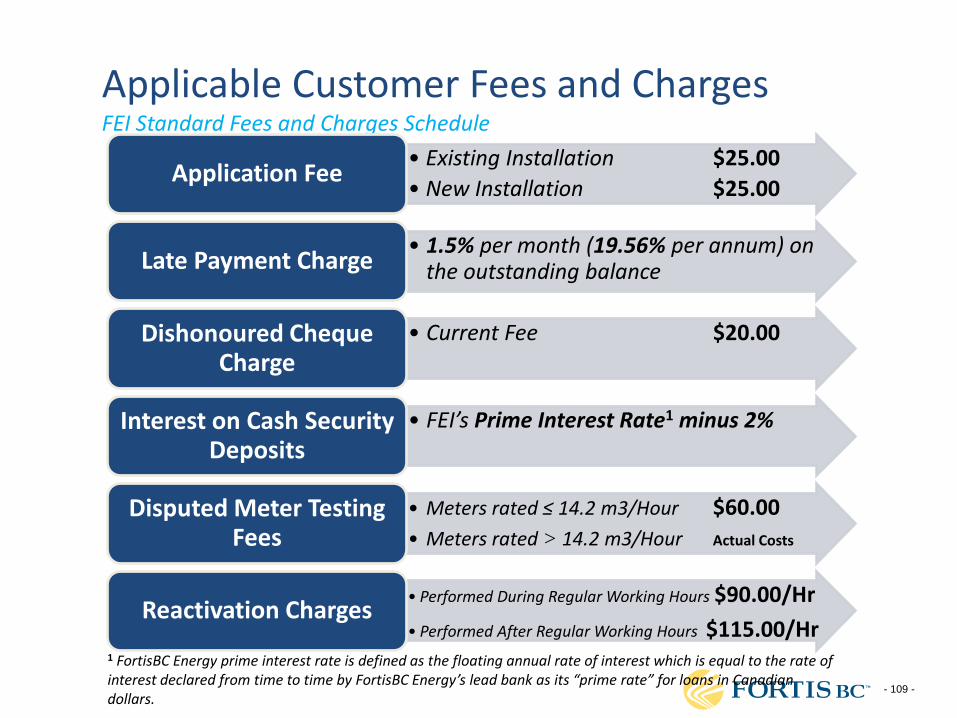
Applicable Customer Fees and Charges FEI Standard Fees and Charges Schedule
• Existing Installation $25.00
• New Installation $25.00 Application Fee
• 1.5% per month (19.56% per annum) on the outstanding balance Late Payment Charge
• Current Fee $20.00 Dishonoured Cheque Charge
• FEI’s Prime Interest Rate1 minus 2% Interest on Cash Security Deposits
• Meters rated ≤ 14.2 m3/Hour $60.00
• Meters rated > 14.2 m3/Hour Actual Costs
Disputed Meter Testing Fees
• Performed During Regular Working Hours $90.00/Hr
• Performed After Regular Working Hours $115.00/Hr
Reactivation Charges
1 FortisBC Energy prime interest rate is defined as the floating annual rate of interest which is equal to the rate of interest declared from time to time by FortisBC Energy’s lead bank as its “prime rate” for loans in Canadian dollars.
- 110 -
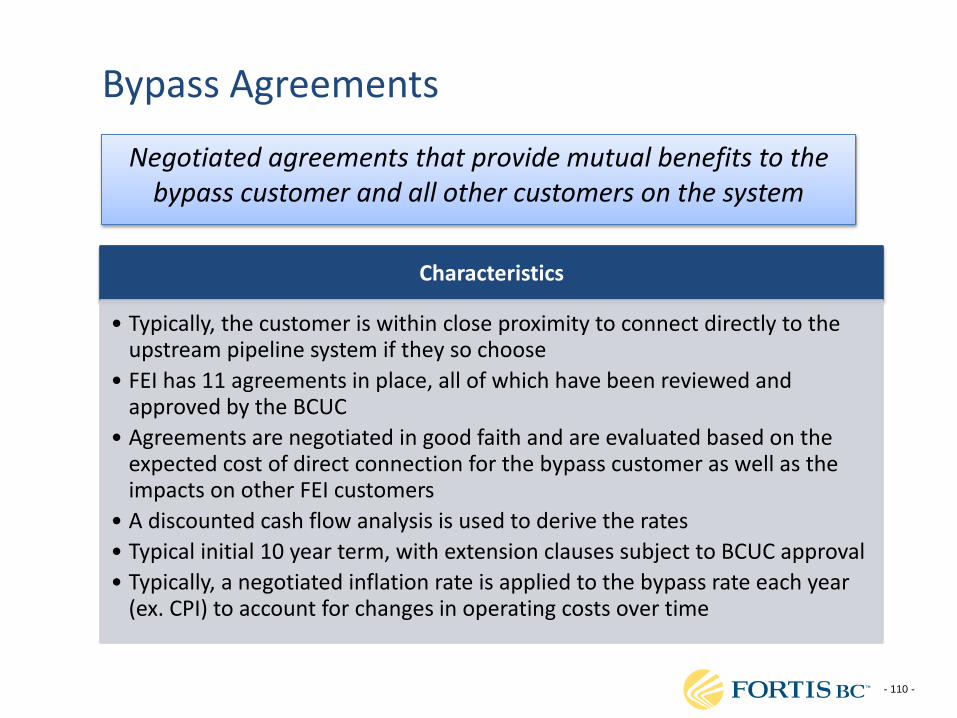
Bypass Agreements
Negotiated agreements that provide mutual benefits to the bypass customer and all other customers on the system
Characteristics
• Typically, the customer is within close proximity to connect directly to the upstream pipeline system if they so choose
• FEI has 11 agreements in place, all of which have been reviewed and approved by the BCUC
• Agreements are negotiated in good faith and are evaluated based on the expected cost of direct connection for the bypass customer as well as the impacts on other FEI customers
• A discounted cash flow analysis is used to derive the rates
• Typical initial 10 year term, with extension clauses subject to BCUC approval
• Typically, a negotiated inflation rate is applied to the bypass rate each year (ex. CPI) to account for changes in operating costs over time
- 111 -
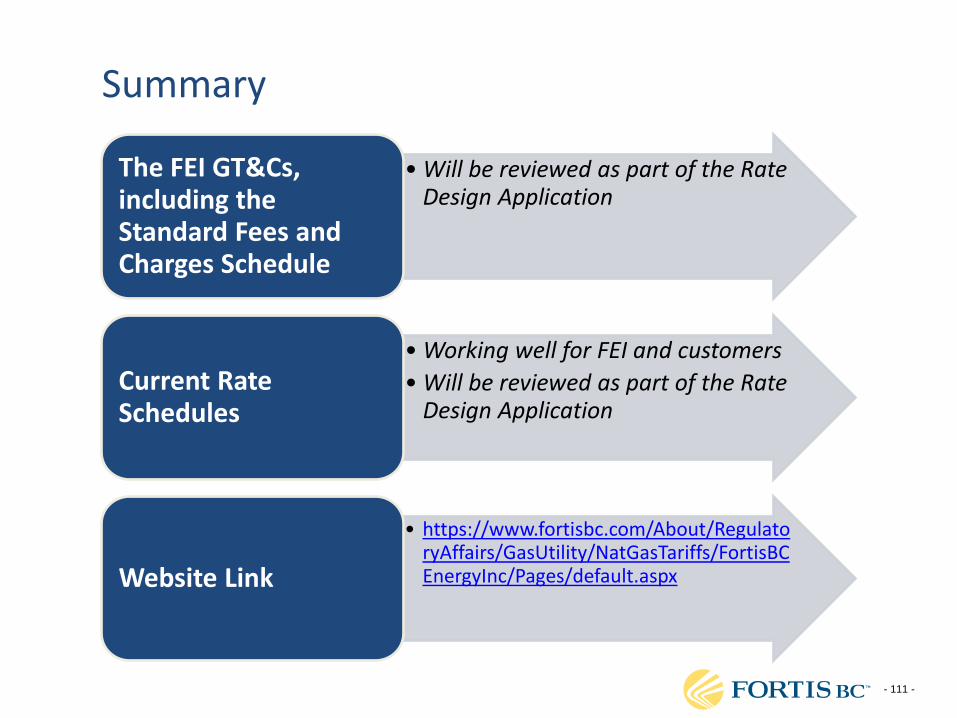
Summary
• Will be reviewed as part of the Rate Design Application
The FEI GT&Cs, including the Standard Fees and Charges Schedule
• Working well for FEI and customers
• Will be reviewed as part of the Rate Design Application
Current Rate Schedules
• https://www.fortisbc.com/About/RegulatoryAffairs/GasUtility/NatGasTariffs/FortisBCEnergyInc/Pages/default.aspx Website Link
- 112 -
CONCLUDING REMARKS
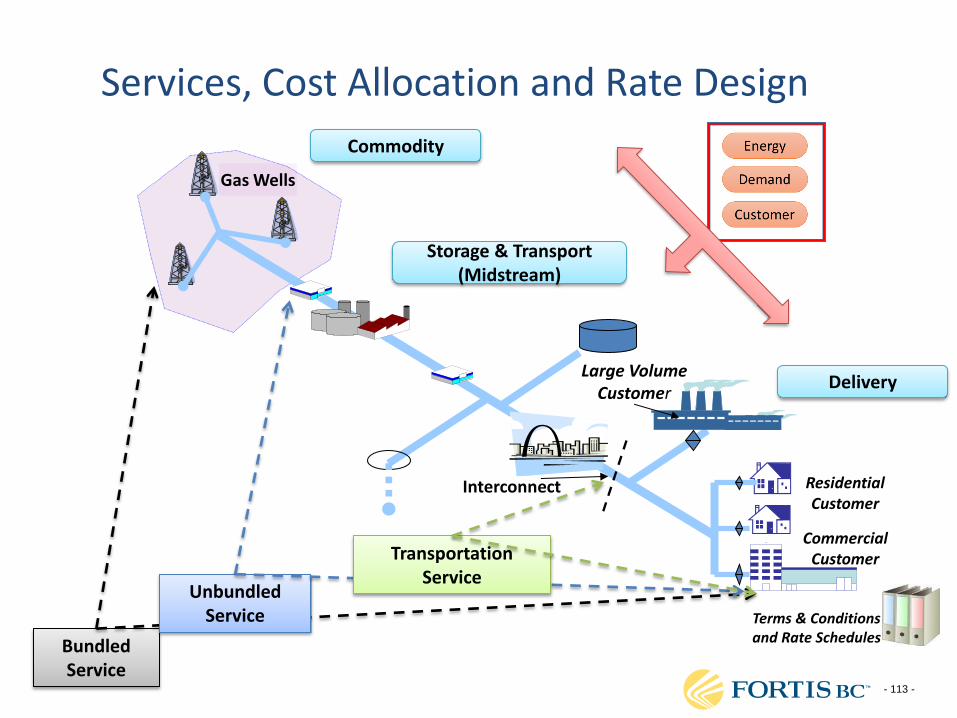
- 113 -
Gas Wells
Interconnect
Large Volume Customer
Residential Customer
Commercial Customer
Services, Cost Allocation and Rate Design
Commodity
Storage & Transport (Midstream)
Delivery
Bundled Service
Unbundled Service
Transportation Service
Terms & Conditions and Rate Schedules
- 114 -
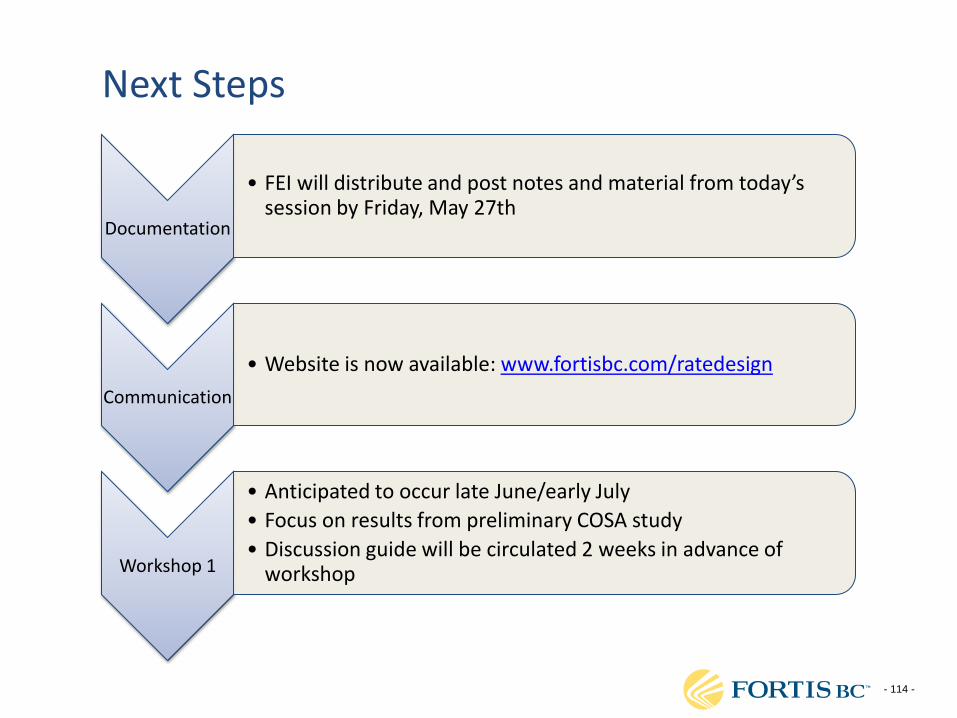
Next Steps
Documentation
• FEI will distribute and post notes and material from today’s session by Friday, May 27th
Communication
• Website is now available: www.fortisbc.com/ratedesign
Workshop 1
• Anticipated to occur late June/early July
• Focus on results from preliminary COSA study
• Discussion guide will be circulated 2 weeks in advance of workshop
- 115 -
Find FortisBC at:
Fortisbc.com
604-576-7000
For further information, please contact:
www.fortisbc.com/ratedesign